Embed Size (px)
Citation preview
DRAFT REMEDIAL INVESTIGATION
AND FEASIBILITY STUDY REPORT
FORMER REYNOLDS METALS REDUCTION PLANT – LONGVIEW,
WASHINGTON
On Behalf Of Northwest Alloys, Inc.
Millennium Bulk Terminals – Longview, LLC
Prepared by Anchor QEA, LLC
720 Olive Way, Suite 1900
Seattle, Washington 98101
March 2012
DRAFT REMEDIAL INVESTIGATION AND FEASIBILITY STUDY REPORT FORMER REYNOLDS METALS REDUCTION PLANT – LONGVIEW, WASHINGTON
Prepared for Washington State Department of Ecology
On Behalf Of Northwest Alloys, Inc.
Millennium Bulk Terminals – Longview, LLC
Prepared by Anchor QEA, LLC
720 Olive Way, Suite 1900
Seattle, Washington 98101
March 2012
RI/FS Report March 2012 Former Reynolds Metals Reduction Plant i 110730-02
TABLE OF CONTENTS 1 INTRODUCTION ................................................................................................................ 1
1.1 Study Area Description ....................................................................................................1
1.2 Report Organization.........................................................................................................2
2 SITE BACKGROUND .......................................................................................................... 4
2.1 Current Land Use .............................................................................................................4
2.2 Historical Site Operations ................................................................................................6
2.2.1 Former Reynolds Metals Reduction Plant ................................................................6
2.2.2 Chinook Ventures, Inc. ............................................................................................11
2.3 Previously Completed Decommissioning, Demolition, Removal, and Cleanup Actions ............................................................................................................................12
2.3.1 Facility Decommissioning and Material Removal Activities .................................12
2.3.1.1 Reynolds Decommissioning and Material Removal Activities .................... 12
2.3.1.2 Chinook Decommissioning Activities ........................................................... 12
2.3.2 Removal of Chinook Equipment and Materials .....................................................13
2.3.3 Scrap Yard Soil Cleanup ...........................................................................................14
2.3.4 Cable Plant Underground Storage Tank Cleanup ..................................................14
2.3.5 Warehouse Underground Storage Tank and Fuel Island Cleanup ........................16
2.3.6 Soil Removal from Former Cryolite Ditches ..........................................................16
2.3.7 Black Mud Pond – Closure, Maintenance, and Monitoring ..................................17
2.3.8 Diesel Aboveground Storage Tank ..........................................................................19
2.3.9 Miscellaneous Reported Spills and Completed Actions .........................................19
2.3.10 Sediment Quality Investigations in Dock and Berth Areas ...................................20
2.3.10.1 Sediment Sampling by Ecology (1990) .......................................................... 20
2.3.10.2 2010 Sediment Sampling ................................................................................ 21
2.4 Partially Completed Investigations and Cleanup Actions ...........................................22
2.4.1 White Mud Pond ......................................................................................................22
2.4.2 Black Mud Ponds (East) ...........................................................................................23
2.4.3 Former Spent Potliner Storage Area .......................................................................23
2.4.4 Area East of Former Cryolite Plant .........................................................................24
2.4.5 Floor Sweeps Landfill ...............................................................................................25
2.4.6 Black Mud Deposits (Southwest) .............................................................................26
Table of Contents
RI/FS Report March 2012 Former Reynolds Metals Reduction Plant ii 110730-02
2.4.7 Old Industrial Landfill .............................................................................................26
2.5 Areas Identified in 2011 for Supplemental Sampling ..................................................27
2.5.1 Soils in Field Southwest of Cable Plant (SSA-1) .....................................................27
2.5.2 Former Thin Stillage Application Areas (SSA-2) ....................................................27
2.5.3 Northwest Site Area Soils (SSA-3) ...........................................................................28
2.5.4 Flat Storage Area (SSA-4) .........................................................................................28
2.5.5 Casting Pit Fill Soils (SSA-5) ....................................................................................28
2.5.6 Heat Transfer Media Oil Area (SSA-6)....................................................................29
2.5.7 Debris Fill in Southeast Area of Site (SSA-7) ..........................................................29
2.6 Summary of Historical Review ......................................................................................29
3 REMEDIAL INVESTIGATION FIELD METHODS ........................................................... 30
3.1 Hydrogeologic Field Investigation ................................................................................31
3.1.1 Monitoring Well Installation ...................................................................................31
3.1.2 Monitoring Well Development ...............................................................................32
3.1.3 Measurement of Groundwater and Surface Water Elevations ..............................32
3.1.4 Slug Testing ...............................................................................................................33
3.2 Aerial Photograph Review ............................................................................................34
3.3 Chemical Testing ............................................................................................................34
3.3.1 Surface Water and Ditch Water Sampling ..............................................................35
3.3.2 Groundwater Sampling ............................................................................................36
3.3.3 Soil Sampling ............................................................................................................38
3.3.3.1 2006 to 2007 Soil Sampling Activities ........................................................... 38
3.3.3.2 2011 to 2012 Soil Sampling Activities ........................................................... 39
3.3.4 Lysimeter Installation and Sampling .......................................................................42
3.3.5 Geochemical Sampling .............................................................................................43
3.3.6 Dock Area Visual Survey .........................................................................................43
4 GEOLOGY, HYDROLOGY, AND HYDROGEOLOGY .................................................... 45
4.1 Regional Geology ...........................................................................................................45
4.2 Site Geology ....................................................................................................................45
4.3 Site Hydrology ................................................................................................................46
4.4 Site Hydrogeology ..........................................................................................................46
5 NATURE AND EXTENT OF CONTAMINATION ............................................................ 49
Table of Contents
RI/FS Report March 2012 Former Reynolds Metals Reduction Plant iii 110730-02
5.1 Screening Levels .............................................................................................................49
5.1.1 Groundwater .............................................................................................................49
5.1.2 Surface Water ...........................................................................................................50
5.1.3 Soil .............................................................................................................................50
5.2 Ditch and Surface Water Quality ..................................................................................51
5.3 Groundwater Quality .....................................................................................................52
5.3.1 West Groundwater Area ..........................................................................................53
5.3.1.1 Cyanide ........................................................................................................... 53
5.3.1.2 Fluoride ........................................................................................................... 54
5.3.1.3 PAHs................................................................................................................ 54
5.3.1.4 Metals (Dissolved) .......................................................................................... 55
5.3.1.5 Geochemical and Field Parameters ............................................................... 55
5.3.2 East Groundwater Area ............................................................................................55
5.3.2.1 Cyanide ........................................................................................................... 56
5.3.2.2 Fluoride ........................................................................................................... 57
5.3.2.3 Polycyclic Aromatic Hydrocarbon s ............................................................. 58
5.3.2.4 Geochemical and Field Parameters ............................................................... 58
5.4 Soil Quality .....................................................................................................................58
5.4.1 Rectifier Yards Soils .................................................................................................59
5.4.2 North Field Soils .......................................................................................................59
5.4.3 Floor Sweeps and Old Industrial Landfill Soils .......................................................59
5.4.4 SPLP Testing Results ................................................................................................59
5.4.5 Field Southwest of Cable Plant (SSA 1) ..................................................................60
5.4.6 Thin Stillage Application Areas (SSA 2) .................................................................60
5.4.7 Northwest Site Area Soils (SSA 3) ...........................................................................60
5.4.8 Flat Storage Area (SSA 4) .........................................................................................61
5.4.9 Casting Pit Soils (SSA 5) ...........................................................................................61
5.4.10 HTM Oil Area (SSA 6) .............................................................................................62
5.4.11 Southeastern Fill Area (SSA 7) .................................................................................63
5.5 Lysimeter Sampling Results ...........................................................................................64
5.6 Geochemical Test Boring Results ..................................................................................65
6 FATE AND TRANSPORT EVALUATION ........................................................................ 67
6.1 Processes Controlling Fluoride Leachability in Source Areas .....................................68
Table of Contents
RI/FS Report March 2012 Former Reynolds Metals Reduction Plant iv 110730-02
6.1.1 Black Mud Deposits ..................................................................................................69
6.1.2 White Mud Pond ......................................................................................................71
6.1.3 Area East of Former Cryolite Plant .........................................................................72
6.1.4 Former Spent Potliner Storage Area .......................................................................73
6.1.5 Summary of Factors Controlling Source-Area Leachability ..................................74
6.2 Geochemical Processes Occurring in Site Soils and Groundwater .............................74
6.2.1 Geochemical Test Area Conditions and Test Methods ..........................................75
6.2.2 Precipitation of Fluorite ...........................................................................................77
6.2.3 Precipitation of Fluorophosphate Minerals ............................................................80
6.2.4 Anion Exchange on Clays ........................................................................................82
6.2.5 Adsorption on Aluminum and Iron Oxides ............................................................84
6.2.6 Summary of Findings from East Groundwater Area Geochemical Testing ..........86
6.3 Geochemical Interactions at Ditch Water Boundaries ................................................87
6.4 Processes Occurring at River Boundary .......................................................................89
6.5 Fluoride Fate and Transport Summary .........................................................................91
7 CONCEPTUAL SITE MODEL ........................................................................................... 92
7.1 Nature and Extent of Contamination ............................................................................92
7.2 Fate and Transport Processes .........................................................................................93
7.3 Exposure Pathways and Receptors ................................................................................95
8 CLEANUP ACTION REQUIREMENTS ............................................................................ 96
8.1 Remedial Action Objectives ..........................................................................................96
8.2 Applicable Federal, State, and Local Laws ....................................................................96
8.2.1 Federal Requirements ..............................................................................................97
8.2.2 Washington State and Local Requirements ............................................................99
8.3 Cleanup Standards ........................................................................................................101
8.3.1 Methodology ...........................................................................................................101
8.3.2 Surface Water Cleanup Levels and Points of Compliance ...................................102
8.3.3 Groundwater Cleanup Levels and Conditional Point of Compliance .................103
8.3.4 Soil Cleanup Levels.................................................................................................106
8.3.4.1 Direct Soil Contact Pathway Exposure ....................................................... 106
8.3.4.2 Soil-to-Groundwater Pathway Exposure .................................................... 107
8.3.4.3 Soil-to-Air Pathway Exposure ..................................................................... 108
Table of Contents
RI/FS Report March 2012 Former Reynolds Metals Reduction Plant v 110730-02
8.3.4.4 Terrestrial Ecological Protection ................................................................. 109
8.3.4.5 Point of Compliance ..................................................................................... 110
9 SCREENING OF CLEANUP TECHNOLOGIES .............................................................. 111
9.1 Institutional Controls ...................................................................................................112
9.2 Natural Attenuation .....................................................................................................112
9.3 In Situ Containment .....................................................................................................113
9.4 In Situ Treatment .........................................................................................................114
9.4.1 In Situ Soil Treatment ............................................................................................115
9.4.2 In Situ Groundwater Treatment ............................................................................115
9.5 Removal and Ex Situ Treatment or Disposal ..............................................................116
9.5.1 Soil Removal Technologies ....................................................................................116
9.5.2 Soil Consolidation and Disposal ............................................................................117
9.5.3 Groundwater Pump and Treat Systems ................................................................118
10 DESCRIPTION OF CLEANUP ALTERNATIVES............................................................ 119
10.1 Alternative 1 .................................................................................................................120
10.2 Alternative 2 .................................................................................................................121
10.3 Alternative 3 .................................................................................................................122
10.4 Alternative 4 .................................................................................................................124
10.5 Alternative 5 .................................................................................................................125
10.6 Alternative 6 .................................................................................................................126
11 EVALUATION OF CLEANUP ALTERNATIVES ............................................................ 128
11.1 Minimum Requirements for Cleanup Actions ...........................................................128
11.1.1 Threshold Requirements ........................................................................................128
11.1.2 Other MTCA Requirements ..................................................................................129
11.2 Alternatives Evaluation ...............................................................................................130
11.2.1 Protectiveness .........................................................................................................130
11.2.2 Permanence ............................................................................................................132
11.2.3 Effectiveness Over the Long Term ........................................................................134
11.2.4 Management of Short-Term Risks.........................................................................136
11.2.5 Technical and Administrative Implementability .................................................137
11.2.6 Consideration of Public Concerns .........................................................................139
11.2.7 Cost ..........................................................................................................................139
Table of Contents
RI/FS Report March 2012 Former Reynolds Metals Reduction Plant vi 110730-02
11.2.8 Provision for a Reasonable Restoration Timeframe .............................................139
11.2.9 Summary .................................................................................................................140
12 PREFERRED REMEDIAL ALTERNATIVE ..................................................................... 142
13 REFERENCES .................................................................................................................. 144
List of Tables Table 2-1 Summary of Historical and Supplemental Investigations and Cleanup Actions Table 2-2 Materials Recycled, Reused, or Disposed Of Table 2-3 Confirmation TPH Results for Former UST Fuel Island Soils Table 5-1 Screening Levels Table 5-2 Surface Water and CDID Ditch Water Testing Results - 2011 Table 5-3 Surface Water and CDID Ditch Water Testing Results - 2006 Table 5-4 West Groundwater Area Cyanide and Fluoride Results Table 5-5 East Groundwater Area Cyanide and Fluoride Results Table 5-6 West Groundwater Area PAH Results Table 5-7 East Groundwater Area PAH Results Table 5-8 Groundwater Metals Results Table 5-9 West Groundwater Area Geochemical Results Table 5-10 East Groundwater Area Geochemical Results Table 5-11a Soil Sampling Data from the Rectifier Yard Table 5-11b Soil Sampling Data from North Field Soils Table 5-12 Soil Sampling Data from the Floor Sweeps Landfill and Old Industrial Landfill Table 5-13 Soil SPLP Testing Results Table 5-14 RI Soil Testing Results for SSA1 - Soils in Field Southwest of Cable Plant Table 5-15 RI Soil Testing Results for SSA2 - Former Thin Stillage Application Areas Table 5-16 Soil Sampling Data from the Northwest Site Area (SSA3) Table 5-17a Soil Sampling Data from the Flat Storage Area (SSA4) Table 5-17b Groundwater Sampling Data from the Flat Storage Area (SSA4) Table 5-18 Soil Sampling Data from the Casting Pit Soils (SSA5) Table 5-19a Soil Sampling Data from the HTM Oil Area (SSA6) Table 5-19b Groundwater Sampling Data from the HTM Oil Area (SSA6) Table 5-20a Soil Sampling Data from the Southeastern Fill Area (SSA7)
Table of Contents
RI/FS Report March 2012 Former Reynolds Metals Reduction Plant vii 110730-02
Table 5-20b Groundwater Sampling Data from the Southeastern Fill Area (SSA7) Table 5-21 Lysimeter Sampling Data Table 5-22 Soil Geochemical Testing Data Table 6-1 Summary of Lysimeter and SPLP Testing Data for Black Mud and White
Mud Deposits Table 10-1 Summary of Remedial Alternative Components Table 10-2 Summary of Feasibility Study Alternatives and Costs Table 11-1 Summary of Remedial Alternative Disproportionate Cost Analysis
List of Charts Chart 5-1 Decreases in Free Cyanide Concentrations in Cryolite Area
Groundwater Wells Chart 6-1 Scanning Electron Micrograph Showing Fluorite Crystals Formed In Situ Chart 6-2 Relationship Between Exchangeable Calcium and Sodium in Soil Chart 6-3 Relationship Between Calcium and Fluoride Concentrations and pH in East
Groundwater Area Wells Chart 6-4 Dissolved Phosphorus as a Function of pH in East Groundwater Area Wells Chart 6-5 Correlation of Exchangeable Fluoride with Exchangeable Sodium
Concentrations in Soil Chart 6-6 Variation of Exchangeable Fluoride with Total Fluoride Concentration in Soil Chart 6-7 Correlation of Soil Fluoride Concentrations with Extractable Aluminum Oxide
Content Chart 6-8 Summary of Geochemical Processes Identified within the East Groundwater
Area Chart 6-9 Modeled Dissolved Fluoride Concentrations During Subsurface Mixing of
Shallow (PZ-6) and Deep (G7D) Groundwater Chart 11-1 Summary of MTCA Disproportionate Cost Analysis
List of Figures Figure 1-1 Project Location Map Figure 1-2 Existing Site Features Map Figure 2-1 Historical Site Features Figure 2-2 Historical Cleanup Actions and Investigations
Table of Contents
RI/FS Report March 2012 Former Reynolds Metals Reduction Plant viii 110730-02
Figure 2-3 Historical Sediment Sampling Figure 3-1 RI Surface Water and Ditch Water Sampling Locations Figure 3-2 RI Groundwater Sampling Locations Figure 3-3 Soil and SPLP Sampling and Observation Locations Figure 3-4 Lysimeter and Geochemical Sampling Locations Figure 4-1 Local CDID Ditch System Figure 4-2 Geologic and Hydrogeologic Conceptual Section Figure 4-3 Groundwater Elevation Contour Map Figure 4-4 Hydraulic Conductivity Estimates Based on 2006 Slug Testing Figure 4-5 Water Elevations in the Columbia River and Adjacent Groundwater Wells Figure 5-1 Surface Water and Ditch Water Results – Fluoride Figure 5-2 Surface Water and Ditch Water Results – Free Cyanide Figure 5-3 2006 Groundwater Results – Free Cyanide Figure 5-4 2011 Groundwater Results – Free Cyanide Figure 5-5 2006 and 2011 Groundwater Results – Fluoride Figure 5-6 Soil and Groundwater Results – Flat Storage Area (SSA 4) Figure 5-7 Soil and Groundwater Results – HTM Oil Area (SSA 6) Figure 5-8 Soil Test Pit Observations – Southeastern Fill Area (SSA 7) Figure 6-1 Geochemical Test Area Conditions Figure 7-1 Conceptual Site Model – Plan View Figure 7-2 Conceptual Site Model – Section A-A' Figure 7-3 Conceptual Site Model – Section B-B' Figure 7-4 Conceptual Site Model – Section C-C' Figure 8-1 FS Site Units Figure 10-1 Alternative 2 Figure 10-2 Alternative 3 Figure 10-3 Alternative 4 Figure 10-4 Alternative 5 Figure 10-5 Alternative 6
Table of Contents
RI/FS Report March 2012 Former Reynolds Metals Reduction Plant ix 110730-02
List of Appendices Appendix A Historical Cleanup Action Reports and Investigation Supporting Information Appendix B Remedial Investigation Field Logs and Sampling Details Appendix C Data Quality Control and Validation (provided on CD) Appendix D Laboratory Analytical Reports (provided on CD) Appendix E EPH Model Appendix F Geochemical Data and Modeling Appendix G Cost Estimate
RI/FS Report March 2012 Former Reynolds Metals Reduction Plant x 110730-02
LIST OF ACRONYMS AND ABBREVIATIONS µg microgram AEC anion exchange capacity Alcoa Alcoa, Inc. Anchor Anchor Environmental, L.L.C. Anchor QEA Anchor QEA, LLC AO Agreed Order ARAR Applicable or Relevant and Appropriate Requirement AST aboveground storage tank bgs below ground surface BMP Black Mud Pond BPA Bonneville Power Administration CAP Cleanup Action Plan CDID Consolidated Diking and Improvement District CEC cation exchange capacity CFR Code of Federal Regulations CH2M Hill CH2M Hill, Inc. Chinook Chinook Ventures, Inc. COC chemical of concern cPAH carcinogenic polycyclic aromatic hydrocarbon CRD Columbia River Datum CSM conceptual site model CWA Clean Water Act cy cubic yards DCA disproportionate cost analysis DMMP Dredged Material Management Program DRO diesel-range organic DSI Development Services, Inc. EBC ratio environmental benefit per cost ratio Ecology Washington State Department of Ecology EIS Environmental Impact Statement EPA U.S. Environmental Protection Agency
List of Acronyms and Abbreviations
RI/FS Report March 2012 Former Reynolds Metals Reduction Plant xi 110730-02
EPH extractable petroleum hydrocarbon Facility 77 Outfall Sump/Pump Station FS Feasibility Study FSDS field sampling data sheets G&O Gibbs & Olsen GIS Geographic Information System GMA Growth Management Act GRO gasoline-range organic HCN hydrogen cyanide HTM heat transfer media I5 Interstate 5 Kd soil/water partitioning coefficient kg kilogram L liter MBTL Millennium Bulk Terminals – Longview, LLC MCL maximum contaminant level meq milli-equivalents MFG MFG, Inc. MFP monofluorophosphate mg milligram MTCA Model Toxics Control Act NAD North American Datum NAVD88 North American Vertical Datum of 1988 NGVD National Geodetic Vertical Datum NOAA National Oceanic and Atmospheric Administration Northwest Alloys Northwest Alloys, Inc., a subsidiary of Alcoa, Inc. NPDES National Pollutant Discharge Elimination System NWTPH-Dx Northwest Total Petroleum Hydrocarbons diesel-range (analytical method) NTR National Toxics Rule ORP oxidation reduction potential PAH polycyclic aromatic hydrocarbon PCB polychlorinated biphenyl pet-coke petroleum coke
List of Acronyms and Abbreviations
RI/FS Report March 2012 Former Reynolds Metals Reduction Plant xii 110730-02
PNE Pacific Northern Environmental POC point of compliance POTW Publicly-owned Treatment Works PRB permeable reactive barriers QA quality assurance QAPP Quality Assurance Protection Plan QC quality control RAO remedial action objective RCRA Resource Conservation and Recovery Act RCW Revised Code of Washington REL remediation level Reynolds Reynolds Metal Company RI Remedial Investigation SAP Sampling and Analysis Plan SEM scanning electron microscopy SEPA State Environmental Policy Act SPL spent potliner SPLP synthetic precipitation leaching procedure SSA supplemental sampling activity study area or site former Reynolds Metals Reduction Plant SU site unit SVOC semi-volatile organic compound TDS total dissolved solid TPH total petroleum hydrocarbon TPH-Dx total petroleum hydrocarbon – diesel range TPH-Gx total petroleum hydrocarbon – gasoline range TPH-Ro total petroleum hydrocarbon – residual oil range TSCA Toxic Substances Control Act TSDF treatment, storage, and disposal facility TSS total suspended solid UCF unit conversion factor USACE U.S. Army Corps of Engineers USC United States Code
List of Acronyms and Abbreviations
RI/FS Report March 2012 Former Reynolds Metals Reduction Plant xiii 110730-02
UST underground storage tank VOC volatile organic compound WAC Washington Administrative Code WAD weak acid dissociable WBZ water bearing zone WDNR Washington State Department of Natural Resources WDOH Washington Department of Health WWTP wastewater treatment plant XRD X-ray diffraction
RI/FS Report March 2012 Former Reynolds Metals Reduction Plant 1 110730-02
1 INTRODUCTION
This document presents the findings of a Remedial Investigation/Feasibility Study (RI/FS) at the former Reynolds Metals Reduction Plant (study area or site), located at 4029 Industrial Way in Longview, Washington. The location of the study area is shown in Figure 1-1. This work is being conducted consistent with the requirements of Agreed Order (AO) No. DE-8940, issued by the Washington State Department of Ecology (Ecology) to Northwest Alloys, Inc. (Northwest Alloys), a subsidiary of Alcoa, Inc. (Alcoa), and Millennium Bulk Terminals – Longview, LLC (MBTL), in February 2012. That AO supersedes a previous AO (No. DE-4263) issued by Ecology to Northwest Alloys and Chinook Ventures, Inc. (Chinook). The work described in this RI/FS incorporates investigation activities conducted pursuant to an RI Work Plan approved by Ecology in June 2007, as well as work defined in a Work Plan Addendum (Anchor QEA 2011b), as approved by Ecology in August 2011 and amended by two additional addenda in December 2011. Together, the activities described in this RI/FS define the nature and extent of contamination at the site and develop a conceptual site model (CSM). The FS then evaluates a range of cleanup alternatives consistent with Model Toxics Control Act (MTCA) requirements.
1.1 Study Area Description
The study area is located on the northern shore of the Columbia River in Cowlitz County, approximately 2.9 miles northwest of the center of Longview and 4.8 miles northwest of Interstate 5 (I5). The current land uses in the general vicinity of the site are mixed-use light industrial, heavy industrial, and commercial. Figure 1-2 presents the existing site features and shows the general orientation of the former facilities. The study area includes both the former smelter, as well as the former Cable Plant. Northwest Alloys also owns the adjacent parcel of undeveloped property on the north side of Industrial Way.
Introduction
RI/FS Report March 2012 Former Reynolds Metals Reduction Plant 2 110730-02
The former Cable Plant is located in the northwestern portion of the site. The central portion of the site includes most of the former smelter, including the main entrance, central unloading and storage silos, carbon plant, cast houses, and other structures. A facility known as the Cryolite Plant was formerly located in the eastern portion of the site, but it has been removed. These features and their history are described in more detail in Section 2. During the construction and operation of large-scale industrial facilities, such as the former smelter, a site-specific coordinate system was typically established based on a “plant north.” Plant north at the former smelter is approximately parallel to the orientation of Industrial Way and varies from true north by 50.30 degrees. For the review of historical documents, it should be noted that plant north is typically used for reference. For the purposes of this report, compass directions will refer to true north and the plant areas will be referred to as the West Groundwater Area and the East Groundwater Area.
1.2 Report Organization
This RI/FS report is organized as follows:
• Section 2—Site Background. This section presents historical investigation and cleanup actions, as well as facility decommissioning, demolition, and waste removal activities.
• Section 3— Remedial Investigation Field Methods. This section provides an overview of the RI activities conducted between 2006 and 2012, including deviations from the RI/FS Work Plan (Anchor 2007a) and Work Plan Addendum (Anchor QEA 2011b).
• Section 4—Geology and Hydrogeology. This section presents the site geologic and hydrogeologic characteristics.
• Section 5—Remedial Investigation Results. This section presents the screening levels for each site medium and presents the chemical and physical testing results for the RI activities conducted between 2006 and 2012.
• Section 6—Fate and Transport Evaluation. This section evaluates site-specific fate and transport processes that influence potential migration of site chemical of concern (COCs).
• Section 7—Summary of Conceptual Site Model. This section presents the CSM and provides a discussion of exposure pathways and receptors applicable to the site.
Introduction
RI/FS Report March 2012 Former Reynolds Metals Reduction Plant 3 110730-02
• Section 8—Cleanup Requirements. This section establishes remedial action objectives (RAOs), identifies potentially applicable federal and local regulations, and establishes cleanup standards.
• Section 9—Screening of Cleanup Technologies. This section identifies a range of remedial technologies potentially suitable for use in conducting the final cleanup of the site.
• Section 10—Description of Cleanup Alternatives. This section describes the six remedial alternatives developed to address the cleanup action requirements set forth in Section 8.
• Section 11—Evaluation of Remedial Alternatives. This section includes an evaluation of the remedial alternatives with respect to MTCA criteria and compares the benefits of the remedial alternatives.
• Section 12—Description of the Preferred Remedial Alternative. This section provides a final description of the preferred remedial alternatives and discusses how the preferred alternative meets MTCA requirements for cleanup actions.
• Section 13—References. Appendices to this RI/FS report include key historical reports, RI field sampling methodology, boring and monitoring logs, recent sampling data validation and laboratory reports not previously reported, and supporting fate and transport modeling information from this phase of the RI.
RI/FS Report March 2012 Former Reynolds Metals Reduction Plant 4 110730-02
2 SITE BACKGROUND
This section summarizes the current and historical land use at the site and presents environmental activities that have been conducted at the site, including facility decommissioning, removals, cleanup actions and environmental sampling. Section 3 presents the RI field methods performed to supplement the existing information developed during these previous activities and to support the development of an FS.
2.1 Current Land Use
Northwest Alloys owns the land at the site. In January 2011, MBTL purchased the site assets from Chinook Ventures, Inc. (Chinook), and entered into a ground lease with Northwest Alloys. MBTL operates a multi-product bulk terminal at the site. MBTL operates under an existing ground lease with Northwest Alloys. The ground lease includes an area of approximately 416 acres. The majority of the ground lease consists of land under the former smelter and Cable Plant facilities (see Figure 1-2). Portions of the Northwest Alloys-owned property located north of Industrial Way remain undeveloped and unused. The site is located in an industrial area of unincorporated Cowlitz County. The adjacent properties include the following:
• Eastern Property (Weyerhaeuser). A Weyerhaeuser wood/paper products facility is located immediately to the east (upstream) of the site.
• Western Property (Vacant). The property located to the west is vacant and has been purchased by the Port of Longview. MBTL also owns a portion of the land outside of the study area that is located between the Port of Longview property and the Columbia River. A drainage ditch operated by the Consolidated Diking and Improvement District (CDID) is located between the site and the vacant site to the west.
• Northern Properties (Various). The industrial site is bordered to the north by Highway 432/Industrial Way. The undeveloped portion of the Northwest Alloys-owned property extends north on the opposite side of Highway 432/Industrial Way to
Site Background
RI/FS Report March 2012 Former Reynolds Metals Reduction Plant 5 110730-02
the CDID ditch. Properties located farther to the north and northwest include privately-owned hillside acreage.
Several properties owned by others are located along the perimeter of the main Northwest Alloys-owned properties, as shown in Figure 2-1. Additional rights-of-way, easements, and restrictive covenants are located within the site. These areas are shown on Figure 2-1.
• Bonneville Power Administration- (BPA-) Owned Properties. The BPA owns two parcels of land located along Industrial Way that are surrounded on the southern, eastern, and western sides by the Northwest Alloys-owned property. These BPA-owned properties are shown on Figure 2-1.
• CDID Structures. CDID operates and maintains a system of levees and approximately 35 miles of drainage ditches within the Longview area. Throughout Longview, the CDID diking and drainage system includes structures located on CDID-owned properties, rights-of-way, easements, and privately-owned property. Permitted discharges from publicly and privately-owned properties occur throughout the ditch system and as result, the CDID is a secondary permittee on the Cowlitz County/Kelso/ Longview Municipal NDPES permit. A CDID levee extends along the shoreline of the Columbia River across the full river frontage of the site. That levee is located on Northwest Alloys-owned property, which is on land subject to a CDID right-of-way agreement. Additional CDID drainage ditches are located along Industrial Way on property not owned by Northwest Alloys. The drainage ditch located along the western edge of the site is located on Northwest Alloys-owned property, with the exception of the Reynolds Metal Company (Reynolds) pump station located next to the Columbia River. That pump station is on CDID-owned property. An additional CDID easement is located on Northwest Alloys-owned property in the northeastern portion of the site, but no CDID structures have been constructed in that area.
• Closed Black Mud Pond. A former waste impoundment is located in the western portion of the site on land owned by Northwest Alloys. Closure activities for that facility in the 1990s included the construction of a landfill cap, filing of restrictive covenants, and implementation of a long-term operation and monitoring plan.
Site Background
RI/FS Report March 2012 Former Reynolds Metals Reduction Plant 6 110730-02
The aquatic lands located within the Columbia River are owned by the State of Washington and are managed by the Washington State Department of Natural Resources (WDNR). Northwest Alloys currently leases a portion of the Columbia River aquatic lands from WDNR under Aquatics Lands Lease No. 20-B09222. Wastewaters and stormwater from the site are managed consistent with an existing National Pollutant Discharge Elimination System (NPDES) permit. That permit includes extensive monitoring requirements. Two outfalls are associated with the site discharge to the Columbia River (see Figure 2-1). These include outfall 001S, which services the sanitary sewer treatment plant and Outfall 002A, which is the major industrial outfall for the site. The site includes additional stormwater outfalls that discharge to the CDID ditch system. Current outfall locations are presented on Figure 1-2.
2.2 Historical Site Operations
Industrial use of the site began in approximately 1941, with the development of the former smelting operations by Reynolds. Industrial uses continued after closure of the aluminum smelter in 2001. Site operations transitioned to a multi-modal bulk materials handling facility by Chinook, which continued into 2011. MBTL assumed operations of the existing multi-modal bulk materials handling facility on January 11, 2011.
2.2.1 Former Reynolds Metals Reduction Plant
The site covers approximately 416 acres. The eastern portion of the site was originally developed in 1941 by Reynolds as an aluminum reduction plant, with aluminum smelting and casting operations. In 1967, operations expanded to include additional aluminum production capacity in what is known as the North Plant. Production facilities then included six potlines (three in the North Plant and three in the South Plant), a carbon plant, and two cast houses. Figure 2-1 is an historical aerial photograph presenting former smelting operation features. The smelting operations required an extensive dry materials handling system for raw materials. Alumina ore was received by rail or ocean-going vessel. Other raw materials were received by rail and truck, including calcined coke, coal tar pitch, anthracite coal,
Site Background
RI/FS Report March 2012 Former Reynolds Metals Reduction Plant 7 110730-02
cryolite (sodium aluminum fluoride), and aluminum fluoride. During site aluminum smelter operations, liquid coal tar pitch (pitch) was unloaded by rail and transferred into storage tanks. The storage tanks had distribution lines that connected the tanks and the carbon plant, where the pitch was used as a raw material for anode and cathode construction. The pitch tanks and unloading area is identified as Area 6 on Figure 2-1. Liquid pitch contains polycyclic aromatic hydrocarbons (PAHs), which are a potential COC. At some older facilities, anodes were manufactured using solid pencil pitch. Pencil pitch is typically stored in enclosed flat storage buildings. Front end loaders commonly transferred the pencil pitch from bulk storage into the material handling system for distribution. Extensive handling of this dry bulk product in this manner readily results in dusting and tracking loses deposited on surface soils. Reynolds used the Söderberg anode technology in Longview as opposed to the more commonly used pre-baked anode. A pre-bake anode also requires a baking furnace to bake and harden the anode. These furnaces are constructed of brick, which require frequent replacement and result in a significant waste stream that is not an issue with the Söderberg process. Both pre-baked anodes and Söderberg anodes are consumed during aluminum production, but pre-baked anodes must be replaced when the carbon is consumed, resulting in a waste stream that must be managed. Therefore, potential impacts associated with pencil pitch deposition and the waste furnace brick do not exist at the Reynolds facility. Alumina was reduced to molten aluminum in the potlines. This reduction process involved the use of a carbon cathode and Söderberg anode, both manufactured on site in the carbon plant area, identified as Area 7 on Figure 2-1. The molten aluminum was then transferred to the casting facility where it was cast into a variety of products, including t-bar (t-ingots), extrusion billets, and sheet ingots. Many of these products required the aluminum to be alloyed with different metals, including copper, manganese, and magnesium. Electricity is considered one of an aluminum smelter's raw materials. BPA owns two parcels of property on the northwestern side of the site. BPA fed power to the site through two Reynolds-owned rectifier yards: 1) the south rectifier yard, which began operations in 1941; and 2) the north rectifier yard, placed into operation in 1967. The rectifier yards contained large transformer/rectifiers and capacitors. These units fed electricity into the potlines. The
Site Background
RI/FS Report March 2012 Former Reynolds Metals Reduction Plant 8 110730-02
original mercury-arc rectifiers used for the south plant were replaced with solid state rectifiers during the 1980s. The north and south rectifier yards are identified on Figure 2-1 as Areas 3 and 9. In addition, there were a variety of miscellaneous transformers to support operations located around the site. Eight water production wells are located at the site. Production well numbers 1 to 4 were installed during construction of the South Plant potlines in the early 1940’s and well numbers 5 to 8 were installed during construction of the North Plant potlines in 1967. The deepest production well (No. 7) was drilled to a depth of 410 feet bgs. An additional production well was installed to service the Cable Plant in 1968. Monitoring of the water system was performed by Reynolds consistent with Washington Department of Health (WDOH) requirements. Elevated levels of naturally-occurring iron, manganese and arsenic were detected periodically, consistent with regional data for this portion of Cowlitz County, but no site-associated contaminants were detected above applicable water quality requirements. Currently the site drinking water is obtained from the City of Longview, using a newly-installed water supply connection. A domestic wastewater treatment system (sanitary treatment plant) was constructed in the 1940s and underwent updates in the 1960s. This facility is still in use today and is shown as Area 18 on Figure 2-1. The treatment system discharges are regulated under the site NPDES permit. The former smelter had a complete maintenance department to support the operations. These activities were largely performed in the maintenance central plant buildings. The maintenance department utilized land to the west of the western potlines as a scrap yard, located on Figure 2-1 as Area 17. Various materials were placed in this area for reuse or off-site recycling. The site also has two historical on-site landfills: 1) the old industrial landfill, located on the southwest side of the property (Area 1; see Figure 2-1); and 2) the floor sweeps landfill, located on the southeast side of the property (Area 15; see Figure 2-1). The floor sweeps landfill was used for the dry materials swept from the floors in the potlines. These materials included alumina, bath, cryolite, and aluminum fluoride. The floor sweeps landfill was not
Site Background
RI/FS Report March 2012 Former Reynolds Metals Reduction Plant 9 110730-02
used by the plant personnel after the mid-1970s; during this time, the old industrial landfill (Area 1; see Figure 2-1) began operation. Primarily, inert wastes were placed in the old industrial landfill, including scrap calcined petroleum coke, ore, cryolite, aluminum fluoride, bath, brick, concrete, and miscellaneous maintenance activity debris. Standard practices were not to place liquids in the landfill. In the early 1980s, the use of the landfill was prior to the issuance of the U.S. Environmental Protection Agency (EPA) minimum function standards for landfills. Use of the landfill ceased prior to the landfill becoming regulated. Although not currently in use, these landfills still contain sources of fluoride from the potroom scrap electrolyte dry materials. In 1953, Reynolds completed construction of a cryolite recovery plant (Area 10; see Figure 2-1) and began operation at the facility. The cryolite recovery plant reclaimed electrolyte that was absorbed into the spent carbonaceous pot lining and also fluoride compounds from the wet air emission control system solids (underflow solids). The potlines used a wet air emission control system (wet electrostatic precipitators) to scrub fluoride and PAH emissions from the aluminum smelting process. The wastewater treatment facilities used for the air emission control systems are identified as Area 4 (thickener tanks/clarifiers; two locations) on Figure 2-1. The spent potliner feedstock came from the site and other northwest aluminum reduction plants. The spent potliner was stored outdoors on the southwestern side of the plant, identified as Area 12 on Figure 2-1. Cryolite recovery involved a multiple-step physical and chemical process. The spent potliner was crushed, ground, and blended with underflow solids. This material was slurried with caustic sodium hydroxide solution, which leached fluoride compounds out of the solid materials. Lime was processed at the site to form caustic sodium hydroxide solution, and white mud was generated during this process. White mud was initially placed in the White Mud Pond, Area 13 on Figure 2-1. Beginning in the 1970s, the white mud was no longer segregated but was mixed with the black mud and placed in black mud ponds. The slurry was pumped to a thickener where the solids were separated from the liquor; these solids were named black mud. Cryolite was then precipitated from the clarified liquor using carbon dioxide; the precipitated cryolite slurry was pumped to a filter to separate the solids from the liquid, and the filter cake was dried in a rotary kiln and multi-hearth “herreschoff” furnace. The dried cryolite was re-used in the plant and sold to other facilities for reuse.
Site Background
RI/FS Report March 2012 Former Reynolds Metals Reduction Plant 10 110730-02
This operation continued until May 1990, after which time, spent potliner was shipped off site to permitted treatment, storage, and disposal facilities. The black mud material was placed in a constructed pond just to the east of the Cryolite Plant (Area 11; see Figure 2-1). Additional black mud ponds were constructed along the eastern edge of the property (Area 14; see Figure 2-1). The eastern black mud ponds were excavated at least once and the materials were placed on the southwestern side of the property near the on-site industrial landfill (Area 2 [two locations]; see Figure 2-1). In 1972, these eastern black mud ponds were replaced with a large pond located on the western side of the property. Black mud was pumped as a slurry by pipeline to the 33-acre black mud pond; this pond was closed in 1991, with the construction of a landfill cap, the filing of restrictive covenants, and implementation of a long-term operation and monitoring plan. The Industrial Wastewater Treatment Plant (WWTP; Facility 71) and the Retention Basin and Filter Plant (Facility 73) were added in 1988 and 1994, respectively (see Figure 1-2). These systems treat industrial wastewater from the air emissions equipment and commingled stormwater and process water discharges. The former Reynolds Cable Plant occupies the northwestern corner of the site and was operated as its own business entity. The Cable Plant was constructed in the late 1960s. It produced electrical cable products, including aluminum wire, rods, and insulated (polyethylene and polyvinyl) low and medium voltage cable. The plant received molten aluminum from the smelter and processed it in three furnaces, a continuous ingot caster, a rolling mill, and wire drawers. Ancillary structures associated with the Cable Plant included office buildings, parking, and an on-site domestic WWTP. The Cable Plant’s domestic WWTP was idled and domestic wastewater was pumped to the smelter’s domestic WWTP for collection and treatment. Although Reynolds owned the smelter and the Cable Plant, the facilities were managed by different entities within the company and generally functioned independently. The Cable Plant assets were sold to BICC Cable Corporation in 1992. Production at the Cable Plant ended in 1992, and since that time, the facility has been inactive and sometimes used for storage.
Site Background
RI/FS Report March 2012 Former Reynolds Metals Reduction Plant 11 110730-02
In 2000, Alcoa, Inc., purchased Reynolds as a wholly owned subsidiary. As a result of this transaction, Reynolds sold the smelter to Longview Aluminum in 2001. Longview Aluminum immediately closed the smelter, and the facility has not produced aluminum since that date. Longview Aluminum declared bankruptcy in 2003, and Development Services, Inc. (DSI), took over operations for the bankruptcy court as trustee of the estate.
2.2.2 Chinook Ventures, Inc.
In December 2004, Chinook purchased the Longview assets from the bankruptcy trustee and entered into a long-term ground lease with Reynolds, which continued to retain ownership of the land. In September 2005, ownership of the land was transferred to Northwest Alloys. Chinook was the sole operator of the facility from 2004 to 2011. Chinook operated the property as a private port for the import, handling, and export of dry bulk materials, such as alumina, coal, green petroleum coke (pet-coke), alumina, cement, fly ash, slag, and other materials and leased portions of the property to other parties for industrial activities. During its occupancy, Chinook also decommissioned several on-site facilities associated with aluminum manufacturing operations and recycled materials from decommissioned smelters located within the region. These activities include the removal and disposal of alumina, electrolyte bath, coal, and carbon products (fresh and recycled) used to manufacture aluminum anodes. In addition to aluminum manufacturing products, Chinook handled a variety of other products for various customers. These products were generally handled in new equipment/facilities developed by Chinook. Products handled by Chinook included cement products (including cement and fly ash), coal storage, pet-coke, lignin, scrap metal, and thin stillage (an agricultural byproduct of corn-based ethanol manufacturing). Chinook initiated development of handling facilities for liquid caustic soda (sodium hydroxide), but these facilities were not completed and the product was reportedly not handled on site. On January 11, 2011, Chinook sold its Longview assets to MBTL.
Site Background
RI/FS Report March 2012 Former Reynolds Metals Reduction Plant 12 110730-02
2.3 Previously Completed Decommissioning, Demolition, Removal, and Cleanup Actions
This section presents a summary of completed actions performed at the site, including decommissioning, demolition, residual waste removal, and environmental investigation and cleanup actions. Documentation of these actions was obtained from a variety of sources such as agency files, facility files, facility personnel interviews, and historical aerial photographs. Table 2-1 and Figure 2-2 present a summary of the completed actions and investigations performed at the site; supporting information is included in Appendix A.
2.3.1 Facility Decommissioning and Material Removal Activities
Extensive facility decommissioning and demolition activities have been conducted at the site since closure of the smelter in 2001. Prior to the sale of the facility assets, Reynolds performed initial demolition and residual waste removal. During the period from 2004 through January 2011, Chinook conducted demolition, cleanup, and recycling activities in several areas of the facility. The following presents a summary of completed facility decommissioning and material removal activities conducted in accordance with agency coordination or as part of lease agreements. A detailed description of these activities is provided in the report Demolition and Cleanup Accomplishments at the Former Reynolds Longview Reduction Plant (Northwest Alloys 2011a). A summary of the materials recycled, removed, or disposed of by Reynolds, Chinook, and MBTL as of June 2011 is provided in Table 2-2.
2.3.1.1 Reynolds Decommissioning and Material Removal Activities
The following demolition and cleanup activities were performed by Reynolds or the bankruptcy trustee prior to the sale of the facility assets to Chinook:
• Cryolite Recovery Plant Demolition • Potroom Transformer Removal
2.3.1.2 Chinook Decommissioning Activities
During the period from 2004 through January 2011, Chinook conducted decommissioning, cleanup, and recycling activities in several areas of the facility, including the following:
Site Background
RI/FS Report March 2012 Former Reynolds Metals Reduction Plant 13 110730-02
• North and South Plant Potrooms • Cast Houses • Maintenance Buildings • Carbon Plant • Fume Control System • Wastewater Management Facilities • Pot Digging Building • Pot Relining Building and Pin and Channel Building • Compressor Rooms and Central Unloading Towers • Cable Plant • Scrap Yard • Oil Recycling
2.3.2 Removal of Chinook Equipment and Materials
Following the sale of the Chinook assets in 2011, MBTL took ownership of the facility assets in January 2011. Since then, remaining Chinook equipment, materials and wastes have continued to be removed from the site. MBTL leased to Chinook approximately 2 to 3 acres for temporary storage of some remaining Chinook equipment that was not removed following the asset acquisition. Chinook equipment was relocated to the leased site by May 2011 (Northwest Alloys 2011a). This lease expired in August 2011, and Chinook equipment was no longer present on the site after August 2011. As Chinook’s equipment was cleared from the plant, MBTL proceeded to clear debris and waste materials from areas formerly operated by Chinook. Initial activities included clearing and disposal of scrap wood, metal, and other debris. Equipment and debris were removed from the plant parking lots, and the main courtyards were swept and cleaned by MBTL. MBTL cleared and disposed of the following materials (approximate quantities):
• 63 tons of clean-up debris • 60 tons of wood waste • 15 tons of pitch contaminated debris • 5 tons of underflow solids
Site Background
RI/FS Report March 2012 Former Reynolds Metals Reduction Plant 14 110730-02
• 1,801,512 gallons of thin stillage (corn milk) • 775,000 gallons of stormwater runoff was removed from the flat storage area
2.3.3 Scrap Yard Soil Cleanup
The Scrap Yard, located west of the former North Plant potlines (see Figure 2-2), was an area historically used for the handling of various materials for reuse or off-site recycling (Anchor 2007a). In July 2000, as part of field investigations conducted by MFG, Inc. (MFG), for the Limited Phase II Environmental Site Assessment, four surface soil samples (SS-3 through SS-6) were collected within the Scrap Yard area. Samples were analyzed for Resource Conservation and Recovery Act (RCRA) metals, polychlorinated biphenyl (PCBs), and PAHs. Arsenic and PCBs were consistently below MTCA Method A soil cleanup levels for unrestricted land uses (20 and 1 milligram per kilogram [mg/kg], respectively). PAHs were detected in the four soil samples; detected concentrations of benzo(a)pyrene exceeded Method A soil cleanup levels for unrestricted land uses, with concentration ranging from 11 to 47 mg/kg (MFG 2000). In 2005, Chinook initiated a voluntary cleanup of the Scrap Yard area based on soil sample results collected during the MFG Phase II investigation. Chinook sampled an additional ten locations within the north and south scrap yard as a part of a focused FS and identified soils that exceeded the MTCA Industrial Use cleanup levels for PAHs (Anchor 2007b; Northwest Alloys 2011a). Other constituents were characterized but none exceeded MTCA Industrial Use cleanup levels (Northwest Alloys 2011a). Chinook removed approximately 200 cubic yards of impacted soil from the Scrap Yard and disposed of the soils off site. Chinook performed confirmation sampling after the removal of the contaminated soil and found PAH concentrations were less than the MTCA Industrial Use cleanup levels (Anchor 2007b).
2.3.4 Cable Plant Underground Storage Tank Cleanup
The cable plant was constructed in 1967, began operation in 1968, and underwent expansion (to approximately 27 acres) in 1978 (see Figure 2-2). Prior to construction, the plant site was a vacant part of the Reynolds property (Pacific Northern Geoscience (PNG) 1994).
Site Background
RI/FS Report March 2012 Former Reynolds Metals Reduction Plant 15 110730-02
In November 1991, Reynolds conducted the decommissioning and removal of a 1,000‐gallon gasoline underground storage tank (UST) in the southeastern corner of the Cable Plant (see Figure 2-2; Pacific Northern Environmental [PNE] 1991). The UST was installed in 1974 by Reynolds to fuel company vehicles and equipment. When the tank was removed, a small (approximately 0.0625-inch) hole was found in the tank, and the surrounding soil and groundwater appeared to be impacted with gasoline. Notification of the leaking gasoline was made to Ecology, and Reynolds initiated an independent cleanup of the area (Anchor 2003). Soil and groundwater samples collected from the initial excavation detected gasoline-range total petroleum hydrocarbons (TPH-Gx) in soils and groundwater above MTCA cleanup levels (PNE 1991). In 1992, additional soil and groundwater sampling was conducted at the site (PNE 1992). Later, five groundwater monitoring wells were installed at the site by PNE. ; soil and groundwater samples were collected from each location to determine the extent of soil and groundwater contamination in the vicinity of the former tank location (PNE 1993). In 1993, Reynolds initiated a focused RI/FS (PNG 1994). As part of the focused RI/FS, groundwater samples were collected from six existing and three new monitoring wells within and downgradient of the former tank excavation area (PNG 1994). Soil contaminated with total petroleum hydrocarbon (TPH) was excavated and removed from the site in 1994. Confirmation testing results of remaining soils showed that cleanup levels had been achieved (PNG 1994). EMCON, Inc. (EMCON) was commissioned by Reynolds to monitor groundwater quality near the former UST. Quarterly monitoring results were presented in the 1995 Annual Groundwater Monitoring Report (EMCON 1996). TPH-Gx was not detected in groundwater samples from former UST area wells during 1995 quarterly sampling (EMCON 1996). Groundwater monitoring continued until 1997. Final remediation was documented in the report titled Voluntary Cleanup Report – Underground Gasoline Tank – Former Reynolds Longview Cable Plant, submitted to Ecology on January 9, 2003 (Anchor 2003). Acknowledgement and a No Further Action determination was received from Lisa Pearson, Project Engineer, Toxics Cleanup Program in a letter dated February 19, 2003 (Anchor 2003).
Site Background
RI/FS Report March 2012 Former Reynolds Metals Reduction Plant 16 110730-02
2.3.5 Warehouse Underground Storage Tank and Fuel Island Cleanup
A 10,000-gallon UST, located in the approximate center of the property between the north and south plants (see Figure 2-2), was decommissioned in May 2004. The decommissioning of the UST was conducted by the bankruptcy trustee and documented in the Underground Storage Tank Decommissioning and Assessment Report, submitted to Ecology in June 2004 (Evren Northwest 2004). The tank was located under concrete pavement, approximately 25 feet south of the former refueling island (“Former UST Fuel Island;” see Figure 2-2). The tank’s contents were rendered inert and pumped from the tank, and the tank was then cleaned and removed from the ground. Product lines and dispensers were removed, and groundwater and soil sampling was performed (Evren Northwest 2004). A confirmation groundwater sample (PW-2) was collected using a temporary well point (Evren Northwest 2004). Gasoline and PAH constituents were not detected in that sample, and benzene concentrations were 2 micrograms per liter (µg/L) below Method A and B groundwater cleanup levels (Evren Northwest 2004). Sample results detected no gasoline-range organics (GRO) in soil adjacent to the tank, fuel lines, or dispensers. However, elevated diesel-range organic (DRO) concentrations were detected under the middle dispenser between 2 and 9 feet below ground surface. DRO were detected to a depth of 9 feet bgs (Evren Northwest 2004). The petroleum contaminated soil in the fuel island area was removed in October 2007 by Chinook. The 2007 excavation of this area measured approximately 24 feet wide by 42 feet long by 10 feet deep (Northwest Alloys 2011a). Soils excavated from the former UST fuel island were moved to the site of the former cryolite recovery plant and Facility 71 areas and bio-remediated to below MTCA Method A cleanup levels. With Ecology’s approval, the bio-remediated soil was used for fill in former equipment concrete pits in the former Cable Plant warehouse floor (Northwest Alloys 2011a).
2.3.6 Soil Removal from Former Cryolite Ditches
The former cryolite ditches are located in the southeast corner of the site, adjacent to the former Cryolite Plant (see Figure 2-2). It is thought that the ditches historically managed stormwater runoff from the area around the Cryolite Plant. Ditch waters continue to be collected in the cryolite ditches and treated in the on-site WWTP.
Site Background
RI/FS Report March 2012 Former Reynolds Metals Reduction Plant 17 110730-02
In 2002, MFG collected six ditch sediment samples from the three on-site ditches near the former cryolite recovery plant (see Figure 2-2). Samples were analyzed for total and weak acid dissociable (WAD) cyanide, fluoride, and PAHs. Sample results detected levels of total cyanide, WAD cyanide, and fluoride ranging from 3 to 213 mg/kg, 4.3 to 35.5 mg/kg, and 832 to 5,730 mg/kg, respectively. PAHs were detected in each sample collected, with total PAHs ranging from 100 to 22,000 mg/kg (MFG 2003). In October 2008, Chinook initiated a cleanup of the three cryolite ditches. Cleanup activities included pumping water out of the ditches and removing the impacted soils along the ditch bottoms and sidewalls. Ditch soils were removed to approximately 5 to 6 feet below the groundwater table. Approximately 2,663 tons of material was removed from the ditches. Following characterization as non-hazardous, soils were disposed of in an off-site Subtitle D landfill (Northwest Alloys 2011a). Following ditch cleanup activities, four confirmation soil samples were collected from the bottom of each ditch and analyzed for PAHs. Total cPAH concentrations were below Method A industrial soil cleanup levels.
2.3.7 Black Mud Pond – Closure, Maintenance, and Monitoring
In 1972, a 33-acre black mud surface impoundment, or the Black Mud Pond (BMP), was constructed in the northwestern corner of the site (see Figure 2-2). After opening the BMP, black mud generated by the cryolite recovery plant was pumped as slurry to the clay-lined BMP via pipeline for disposal. The black mud slurry was about 15 to 30 percent solids by weight with a pH of 10 to 12, consisting of mostly carbon and alumina (Reynolds and CH2M Hill 1991). During operation of the black mud pond, the following small cleanup events were performed and documented:
• July 1984. Release of black mud to soils near the North Plant thickeners at the Outfall Sump/Pump Station (Facility 77); 210 cubic yards of soil were removed and transferred to the BMP (Reynolds 1984a)
• June 1986. Release of black mud from the black mud booster pump; just under 10 tons of black mud and soil were removed and transferred to the BMP (Reynolds 1986a)
Site Background
RI/FS Report March 2012 Former Reynolds Metals Reduction Plant 18 110730-02
• September 1986. Release of black mud at the booster pump; approximately 90 tons of black mud and soil were removed and placed in the BMP (Reynolds 1986b)
• August 1988. Release of black mud at the booster pump; approximately 25 tons of black mud and soil were removed and placed in the BMP (Reynolds 1988)
As part of the BMP operations, a groundwater and surface water monitoring program was initiated. That program has included quarterly monitoring since 1985 (Reynolds 1992). Monitoring has continued quarterly in compliance with the BMP Closure and Post-Closure Plan (Reynolds and CH2M Hill 1991) and the post-closure groundwater and surface water monitoring requirements of the Operation and Maintenance Manual for the BMP (Reynolds 1992). In 1992, the BMP was closed with the construction of a cover consistent with the Ecology-approved BMP Closure/Post-Closure Plan (Reynolds and CH2M Hill 1991). The closure system included an engineered cap consisting of a multi-layer, low permeability cover, and drainage conveyance (Reynolds 1992). Quarterly groundwater and surface water monitoring has been performed at the site as part of the BMP compliance monitoring program. Results of quarterly groundwater monitoring for the years 1984 to 2011 are kept on file at the site in accordance with the Ecology-approved BMP Closure/Post-Closure Plan. The monitoring program includes nine groundwater monitoring wells (“RL-series”) and two surface water sampling locations in the CDID Ditch No. 14 located on Northwest Alloys-owned property. Samples are analyzed for pH, specific conductance, chloride, fluoride, sulfate, and total and free cyanide. Groundwater monitoring data has shown decreasing trends in fluoride and alkalinity in many BMP monitoring wells since completion of the closure activities. During 2011, cover repair and maintenance activities were performed at the BMP. The repair action was performed consistent with an engineering plan developed by Gibbs & Olsen, Inc. (G&O) and approved by Ecology in July 2011 to address drainage issues with a portion of the cover (Attachment A; Anchor QEA 2011f). Other work included the development of an updated maintenance plan to address invasive blackberries and weeds on the cap cover (Anchor QEA 2011f). Maintenance and inspection activities outlined in the plan include routine mowing of the cap in accordance with the schedule and recommendations outlined in the G&O engineering plan and compliance with inspection
Site Background
RI/FS Report March 2012 Former Reynolds Metals Reduction Plant 19 110730-02
requirements established by the 1992 Operation and Maintenance Manual prepared by Reynolds for the closed BMP (Reynolds 1992).
2.3.8 Diesel Aboveground Storage Tank
In April 1991, petroleum impacted soil was discovered in the vicinity of a 200,000-gallon diesel aboveground storage tank (AST) located between the alumina silos and the Carbon Plant (see Figure 2-2). Subsequent soil sampling confirmed diesel levels in the soil exceeding MTCA Method A cleanup levels for unrestricted use of 2,000 mg/kg. Two groundwater samples were also collected, and no constituents were detected above MTCA Method A Cleanup Levels (Reynolds 1991). Later in 1991, Reynolds initiated an independent cleanup of diesel impacted soils in this area. Approximately 480 cubic yards of petroleum impacted soil was excavated and placed at an on-site location for bioremediation (Reynolds 1991). Impacted soil extending beneath the AST was not removed due to concerns that the structural integrity of the storage tank would be compromised. Accordingly, a notation was made in the Reynolds property deed stating that diesel impacted soils exist directly under the tank and will be remediated upon removal of the tank (Reynolds 1991).
2.3.9 Miscellaneous Reported Spills and Completed Actions
A number of other release events were reviewed as part of the RI/FS planning. A synopsis of these reported release events is provided as follows:
• Scrubbing Liquor Spill (1978). On August 4, 1978, a release of scrubbing liquor was reported at the site. The spill was speculated to be caused by a power outage causing a failure in the scrubbing liquor return system (Ecology 1978). The system, in turn, overflowed to a drainage ditch. Subsequent sampling of water in the ditch was conducted; however, fluoride was not detected in samples collected.
• Diesel Oil Spill from Ore Ship (1980). On January 31, 1980, approximately 4,000 gallons of diesel oil spilled to the Columbia River in the docking area located at the Reynolds site (Ecology 1980). The spill was caused when an oil barge refueling an ore ship overfilled the fuel tank, spilling diesel oil out of the ore ship air vents into the Columbia River. An oil spill cleanup company was contracted to clean up the spill;
Site Background
RI/FS Report March 2012 Former Reynolds Metals Reduction Plant 20 110730-02
however, according to the U.S. Coast Guard, a sufficient oil concentration required to carry out cleanup efforts was not located. The ore ship was issued a penalty for the spill (Ecology 1980).
• Polyalkylene Glycol Spill at Pump House (1988). On December 12, 1988, an estimated amount (estimated to range between 300 to 600 gallons) of polyalkylene glycol, a water soluble non-hazardous material, was spilled to the ground in the pitch pump house at the Reynolds site (Ecology 1988). The spill was the result of a crack in a welded connection in the piping leading to a pressure gauge. The released material drained through a storm drain in the floor of the pitch pump house.
• Drum Soil Cleanup (1984). In July of 1984, a release from a drum was noted near Shed No. 1 near the North Plant at the Reynolds site (Reynolds 1984b). The remaining liquid in the container was removed and placed into secure drums. PCBs were detected in soil sampling, and associated impacted soils were removed in October 1984, July 1985, and August 1985 (Reynolds 1986c). The total quantity of soil removed initially included seventy-seven 55-gallon drums of soil, with follow-up excavations generating 105 cubic yards of soil. Final confirmation samples confirmed that trichlorobenzene and PCB concentrations were below 1 mg/kg (Ecology 1986). On February 20, 1986, Ecology approved the work as complete based on review of Reynolds’ summary report and laboratory results (Ecology 1986).
2.3.10 Sediment Quality Investigations in Dock and Berth Areas
Investigations of sediment quality at the facility were conducted in 1990 and again in 2010. Neither study identified concentrations of constituents exceeding applicable screening levels.
2.3.10.1 Sediment Sampling by Ecology (1990)
In February 1990, sediment sampling was conducted as part of field investigations conducted by Ecology for a Class II National Pollutant Discharge Elimination System (NPDES) Inspection at the Reynolds site (Ecology 1991). Sediment sample locations included three stations near Outfall 002A in the Columbia River. Outfall 002A serves as the primary discharge for treated industrial wastewater used in the plant (see Figure 2-3; Ecology 1991). The three sediment samples were identified as Upstream, Diffuser, and Downstream (see
Site Background
RI/FS Report March 2012 Former Reynolds Metals Reduction Plant 21 110730-02
Figure 2-3). Chemical testing included priority pollutants (fluoride, cyanide, volatile organic compounds [VOCs], PAHs, pesticides, and PCBs; Ecology 1991). No sediment impacts were detected near the Outfall 002A discharge. Fluoride concentrations ranged from 23.5 mg/kg (downstream) to 114 mg/kg (upstream). Dissolved fluoride measured at the three stations was non-detect (fewer than 3.8 milligrams per liter [mg/L]). Total and WAD cyanides were non-detect for the samples (fewer than 0.1 mg/kg). Metals concentrations were low in the samples. VOCs except for acetone and methylene chloride were non-detect; both detected compounds were also detected in the laboratory blanks and were therefore considered a lab or field error. PCBs and pesticides were non-detect for the three sediment samples. Bioassays using Hyallela azteca and Microtox found no indication of toxicity in the sediment samples (Ecology 1991).
2.3.10.2 2010 Sediment Sampling
In 2010, Ecology issued Administrative Order No. 7392, requiring Chinook to investigate surface and subsurface sediments in the vicinity of the existing dock and berthing areas (see Figures 2-2 and 2-3). The order was issued in response to a release of pet-coke at the site in February 2010 (Anchor QEA 2010a). The results of this study are presented in the DMMP Suitability Determination (Chinook 2010). As part of the sediment investigation in 2010, Anchor QEA collected 7 surface sediment grab samples at a depth interval of 0 to 10 centimeters below the mudline at the locations shown on Figure 2-3 (SG01 to SG07). Sample SG-REF2 was used as a reference. These sediment samples were analyzed for conventional parameters, metals, and PAHs (Anchor QEA 2010b). Subsurface sediment samples were also collected within the shoaled berth area at the “high” density defined by the Dredged Material Management Program (DMMP) agencies, which include WDNR, Ecology, EPA, and USACE (Chinook 2010). Subsurface sediment samples (locations are shown on Figure 2-3) were analyzed for conventional parameters, metals, PAHs, semi-volatile organic compounds (SVOCs), PCBs, and pesticides (Chinook 2010; Anchor QEA 2010b).
Site Background
RI/FS Report March 2012 Former Reynolds Metals Reduction Plant 22 110730-02
During the sampling event, surface and subsurface sediment samples were also visually screened for pet-coke, alumina, and cement (Anchor QEA 2010b). Some pet-coke was noted at trace levels in some of the surface grab samples, typically making up fewer than 0.03 percent of the total sample (Anchor QEA 2010b). None of the surface or subsurface test results exceeded screening levels approved by the DMMP (Chinook 2010). Following review of the sampling report, the DMMP issued a suitability determination approving the sediments in the berth area for management by open-water disposal. The DMMP also approved the use of a “moderate” sampling density for any future dredge material characterization work at the site.
2.4 Partially Completed Investigations and Cleanup Actions
This section presents a summary of the site areas where investigation or cleanup actions have historically been performed, and where further evaluations are being conducted as part of the current RI/FS. This section focuses only on historical investigations and/or cleanup actions. Table 2-1 and Figure 2-2 presents a summary of these areas and provides a description of existing information associated with historical investigations or partial cleanup actions. Supporting information is included in Appendix A.
2.4.1 White Mud Pond
The White Mud Pond is an approximately 8-acre area in the east area of the plant (see Figure 2-2). White mud is the residual product generated when caustic soda is produced from lime. White mud was generated during the cryolite recovery process and was deposited in white mud ponds between the early 1960s to 1972, when the pond was closed (Northwest Alloys 2011b). The White Mud Pond was subsequently covered with 2 feet of dredge sand and naturally vegetated (Anchor 2007b). In 2000, as part of field investigations conducted by MFG for the Phase II Environmental Site Assessment, two surface water samples (SW-2 and SW-3) were collected in the vicinity of the White Mud Pond within an adjacent on-site drainage ditch (MFG 2000). Water samples were analyzed for fluoride; total cyanide; oil and grease; total dissolved solids; total suspended solids; RCRA metals plus antimony, nickel and aluminum; and PAHs. SW-2 was
Site Background
RI/FS Report March 2012 Former Reynolds Metals Reduction Plant 23 110730-02
collected from the ditch east of the No. 004 pump station, and SW-3 was collected from the ditch north of the White Mud Pond. Fluoride and total cyanide were detected at concentrations ranging from 28.8 to 170 mg/L and 1.9 to 3.1 mg/L, respectively; no PAHs were detected (MFG 2000).
2.4.2 Black Mud Ponds (East)
Two black mud ponds, approximately 12 acres in size are located along the eastern edge of the property, received black mud between the early 1960s and 1972 (see Figure 2-2). These two ponds were filled and subsequently excavated at least once during their operation. The excavated material was placed in the southwestern corner of the property (see Section 2.4.7). In 1988, the ponds were covered with approximately 2-feet of dredge sand and naturally vegetated (Anchor 2007a; Northwest Alloys 2011b). In 2002, MFG collected a ditch sediment sample from the ditch west of the black mud ponds (SD6; MFG 2003). The ditch sediment had concentrations of 3 mg/kg for total cyanide, fewer than 0.40 mg/kg (non-detect) for WAD cyanide, 927 mg/kg for fluoride, and 0.1 percent for total PAHs (MFG 2003).
2.4.3 Former Spent Potliner Storage Area
The cryolite recovery plant was completed in 1953, and spent potliner (SPL) was a valuable feedstock material for the cryolite recovery process. SPL was temporarily stockpiled outside in piles prior to on-site recycling. The former SPL storage area was located just south of the former Cryolite Plant, as shown in Figure 2-2. In 1982, Ecology adopted updated regulations and subsequently issued a 1983 AO (DE 83-293) requiring the removal of all SPL stored on-site within 5.5 years, to cover the storage pile in the interim, and conduct groundwater monitoring of SPL area wells (Ecology 1983). To comply with Ecology requests, Reynolds covered the SPL pile and installed six groundwater monitoring wells in the SPL area (R1S, R1D, R2 [background], R3, R4S, and R4D) in October 1982 to monitor groundwater. Subsequent groundwater monitoring indicated that groundwater beneath and downgradient of the SPL storage pile was impacted by SPL constituents. In February 1985, free cyanide concentrations at the above wells
Site Background
RI/FS Report March 2012 Former Reynolds Metals Reduction Plant 24 110730-02
ranged from non-detect (fewer than 0.005 mg/L) to 0.62 mg/L; fluoride concentrations ranged from 0.41 to 1,050 mg/L (Ecology 1985). The operation of the cryolite recovery plant was discontinued in 1990 (Northwest Alloys 2011b). Following removal of the SPL pile, underlying soils were excavated down to the water table and disposed of in an off-site permitted TSDF (Northwest Alloys 2011b). After excavation, the area was partially backfilled with dredged sand. In 2002, MFG conducted soil and groundwater testing in the area. No SPL was observed in this area (MFG 2003). Total cyanide and fluoride ranged from 1.9 to 5.2 mg/kg and 195 to 597 mg/kg, respectively, which was well below those levels typical of SPL. Total PAHs ranged from 8.3 to 17.5 mg/kg (MFG 2003). Elevated concentrations of WAD cyanide, total cyanide, and fluoride were detected in the wells and around the former SPL storage area wells. Concentrations ranged from 0.03 to 158 mg/L for WAD cyanide, 0.02 to 502 mg/L for total cyanide, and 0.08 to 2,960 mg/L for fluoride (MFG 2003).
2.4.4 Area East of Former Cryolite Plant
When the cryolite recovery plant began operation in 1953, residual materials generated from the cryolite recovery process were managed in the area east of the plant (Figure 2-2). Black mud and associated materials managed in this area remain in place; previous investigations have detected elevated concentrations of fluoride, cyanide, and PAHs in soil and groundwater in this area. Soil and groundwater quality were investigated by MFG in 2000 and 2002. During the 2000 investigation, four soil samples (CP-1 to CP-4) were collected. Samples were analyzed for fluoride, total cyanide, and PAHs (MFG 2000). Analytical results for soil indicated no exceedances of recommended cleanup levels (MFG 2000). Detected fluoride concentrations ranged from 36.6 mg/kg to 298 mg/kg. Cyanide was detected at one soil sample at a concentration of 2.6 mg/kg. PAHs were detected in two soil samples. In these samples, benzo(a)pyrene was non-detect (fewer than 330 µg/kg; MFG 2000).
Site Background
RI/FS Report March 2012 Former Reynolds Metals Reduction Plant 25 110730-02
In 2002, MFG completed a subsequent investigation including 14 direct push borings and four piezometers (PZ-1 to PZ-4) to assess soil and groundwater quality. Results from the investigation confirmed the presence of impacted materials in soil and groundwater. Waste material was encountered in each of the soil borings; waste material ranged from 0.25 to 6 feet in thickness, with an average thickness of 3.1 feet (MFG 2003). Fluoride concentrations in soil ranged from 65.1 to 1,720 mg/kg; total cyanide concentrations ranged from 0.2 to 524 mg/kg; and WAD cyanide concentrations ranged from 0.3 to 397 mg/kg (MFG 2003). Total PAH concentrations in soil ranged from 1.1 to 4,546 mg/kg (MFG 2003). Concentrations of WAD cyanide, total cyanide, and fluoride were also detected in most of the groundwater samples; concentrations ranged from 0.006 to 106 mg/L for WAD cyanide, 0.007 to 89.5 mg/L for total cyanide, and 0.4 to 1,200 mg/L for fluoride (MFG 2003).
2.4.5 Floor Sweeps Landfill
The floor sweeps landfill area occupies approximately 3 acres in the southeast corner of the site (see Figure 2-2). Floor sweepings of alumina ore from the pot rooms were historically disposed in this area. The landfill thickness varies up to 21 feet. The floor sweeps landfill is currently covered with a limited volume of dredged sand and vegetation. Soil and groundwater quality in this area was investigated by MFG in 2000 and 2002. In July 2000, MFG collected a composite soil sample (FS-1) from the center of the former floor sweeps landfill. The sample was a composite of soil collected at 3, 7, and 10 feet bgs and was analyzed for fluoride, total cyanide, RCRA metals plus antimony and nickel, TPH-DRO, PAHs, and percent moisture. Fluoride and total cyanide concentrations were 1,380 mg/kg and 6.4 mg/kg, respectively (MFG 2000). TPH and benzo(a)pyrene (cPAH) were detected at concentrations of 1.6 and 13 mg/kg, respectively (MFG 2000). Soil borings placed in 2002 (DP-1 to DP-4) confirmed the presence of total cyanide, WAD cyanide, fluoride, and total PAHs, with maximum concentrations of 20.5 mg/kg, 4.3 mg/kg, 906 mg/kg and 1,773 mg/kg, respectively (MFG 2003). Groundwater sampled from the soil boring in the center of the former landfill (DP1) had total cyanide, WAD cyanide, and fluoride concentrations of 9 mg/L, 0.1 mg/L, and 336 mg/L, respectively (MFG 2003). PAHs
Site Background
RI/FS Report March 2012 Former Reynolds Metals Reduction Plant 26 110730-02
were also detected, with a benzo(a)pyrene concentration of 0.5 mg/L. Dissolved metals (arsenic, chromium, copper, and nickel) were non-detect (MFG 2003).
2.4.6 Black Mud Deposits (Southwest)
Historical records indicate as early as 1969, black mud had been deposited in the vicinity of the Old Industrial Landfill (see Figure 2-2). Some of the black mud deposits were from excavation and placement of black mud from the eastern black mud ponds. In 1988, this area was subsequently covered with dredge disposal sand and naturally vegetated (Northwest Alloys 2011b).
2.4.7 Old Industrial Landfill
The Old Industrial Landfill is located in the southwest corner of the site (see Figure 2-2) and is situated within the black mud deposits, as described in Section 2.4.6. The fill is approximately 20 feet deep. Use of this landfill was discontinued in 1985. The fill material includes concrete, metal debris, and a variety of plant wastes, including solids from a venturi scrubber system at the carbon plant. In 1985, as part of field investigations conducted by Sweet, Edwards and Associates, Inc., for the Reynolds Solid Waste Site Soil and Groundwater Investigation, three borings were advanced through the Old Industrial Landfill where 11 composite samples from the landfill and three composite samples from the underlying alluvial sand were collected and analyzed for PAHs using EPA Method 610 (Sweet, Edwards, and Associates, Inc. 1986). PAHs were detected in the solid wastes samples collected and in two alluvial sand samples collected. Four additional boreholes were advanced in the vicinity of the Old Industrial Landfill where soil samples were collected from each and also analyzed for PAHs. PAH concentrations were detected in one of the four borings (Sweet, Edwards and Associates, Inc. 1986). During the same 1985 field investigations, groundwater samples were also collected from four newly installed monitoring wells (RLSW-1 through RLSW-4) located in the vicinity of the Old Industrial Landfill; samples were also analyzed for PAHs using EPA Method 610 (Sweet, Edwards and Associates, Inc. 1986). No PAHs were detected in groundwater samples collected.
Site Background
RI/FS Report March 2012 Former Reynolds Metals Reduction Plant 27 110730-02
In July 2000, as part of field investigations conducted by MFG for the Limited Phase II Environmental Site Assessment, groundwater monitoring wells RLSW-1 through RLSW-4 were sampled and analyzed for dissolved RCRA metals plus antimony and nickel, fluoride, total cyanide and ammonia. Ammonia, fluoride, and total cyanide were detected in each sample collected (MFG 2000). In 2002, additional groundwater samples were collected at the site from the same locations sampled in July 2000 (MFG 2003). Maximum detected concentrations for total cyanide, WAD cyanide, and fluoride include 0.92 mg/L, 0.1 mg/L, and 103 mg/L, respectively (MFG 2003).
2.5 Areas Identified in 2011 for Supplemental Sampling
During 2011, several areas were identified by Ecology for further investigation as part of the RI/FS. These areas were discussed in detail in the RI Work Plan Addendum (Anchor QEA 2011b). The issues to be investigated included updating surface water and groundwater data for the site and collection of specific testing data in each of the localized areas described subsequently. These areas are identified based on the supplemental sampling activity (SSA) numbers defined in the RI Work Plan Addendum.
2.5.1 Soils in Field Southwest of Cable Plant (SSA-1)
Ecology requested that sampling be performed in a portion of the field located southwest of the Cable Plant (see Figure 2-2) based on concerns that a small quantity of fill materials potentially containing elevated fluoride or cyanide may have been re-graded in that area during Chinook’s facility operations (Anchor QEA 2011b). Geotechnical investigations have been performed in this area and did not indicate the presence of waste fill material. In order to further investigate potential impacts to soils in the field located southwest of the Cable Plant, test pits were included as part of RI activities in this study area (Anchor QEA 2011b).
2.5.2 Former Thin Stillage Application Areas (SSA-2)
One of the products handled by Chinook at the site was thin stillage. Thin stillage can contain elevated levels of nutrients including nitrogen, nitrate, nitrite, phosphate and potassium. Some thin stillage was land-applied by CVI in the area located east of the Closed BMP. Ecology requested that sampling be conducted in the former thin stillage application
Site Background
RI/FS Report March 2012 Former Reynolds Metals Reduction Plant 28 110730-02
areas (see Figure 2-2) to determine if any accumulations of thin stillage remain at a level that could potentially impact site conditions (Anchor QEA 2011b).
2.5.3 Northwest Site Area Soils (SSA-3)
During previous groundwater sampling conducted immediately northwest of the closed BMP, elevated concentrations of fluoride have been noted in shallow groundwater. Previous evaluations indicated that these concentrations are not impacting water quality in the CDID ditch. Additional soil investigations were planned in this area to verify that no wastes or impacted soils are present in this site area.
2.5.4 Flat Storage Area (SSA-4)
Chinook developed a flat-storage area for handling pet-coke and coal in the central portion of the site (see Figure 2-2). Ecology requested that soil sampling be conducted in the Flat Storage Area to determine if contaminants associated with the pet-coke product stored in the area may have leached into surrounding soils (Anchor QEA 2011b). Historical laboratory analyses of the pet-coke stored at the site detected elevated concentrations of PAHs (Ecology 2009). Soil and groundwater sampling in the vicinity of the Flat Storage Area was included as part of RI activities in 2011 and 2012.
2.5.5 Casting Pit Fill Soils (SSA-5)
Chinook decommissioned and filled two casting pits located within one of the two Cast Houses (see Figure 2-2) and finished the fill by capping the pits with concrete (Anchor QEA 2011b). The casting pits are concrete-lined structures approximately 20 to 30 feet bgs that were formerly used in the direct chill casting of molten aluminum (Anchor QEA 2011b). Ecology requested that soil sampling be performed within the two filled casting pits to ensure no materials exceeding proposed site cleanup levels were disposed of in the pits during fill activity. As requested by Ecology, soil samples were collected from the casting pits as part of RI activities in 2011 (Anchor QEA 2011b).
Site Background
RI/FS Report March 2012 Former Reynolds Metals Reduction Plant 29 110730-02
2.5.6 Heat Transfer Media Oil Area (SSA-6)
During Chinook operations at the site, a release of heat transfer media (HTM) oil from the tank heating system was discovered within the containment area between the two easternmost pitch storage tanks (see Figure 2-2). HTM Oil is a product similar to mineral oil. Partial removal of contaminated soil was performed by Chinook in the vicinity of the HTM Oil Area. In 2010, Chinook collected soil samples as part of soil removal activities, and results from the samples collected detected maximum concentrations of diesel-range TPH (TPH-Dx) and residual oil-range TPH (TPH-Ro) of 25,000 mg/kg and 5,100 mg/kg, respectively (Anchor QEA 2011b). The most recent sampling conducted in this area is speculated to have occurred in October and December 2010, subsequent to additional excavation activities. Soil sample results from samples collected during this event detected remaining TPH-Dx and TPH-Ro concentrations ranging from 13.4 to 557 mg/kg and 26.7 to 580 mg/kg, respectively (Anchor QEA 2011b). Additional soil and groundwater sampling was conducted during the 2011 RI activities to document current conditions in this area.
2.5.7 Debris Fill in Southeast Area of Site (SSA-7)
An area of fill containing apparent construction debris was identified in the southeastern portion of the site (see Figure 2-2). The debris fill in this area was identified by Chinook during on-site soil excavation and grading activities (Anchor QEA 2011b). Test pits were included in the 2011 and 2012 RI activities in the area to further delineate the lateral and vertical extent and composition of the fill material.
2.6 Summary of Historical Review
As part of the RI/FS, further evaluations were conducted in each of the areas described in Sections 2.4 and 2.5. The methods used for those evaluations are described in Section 3.
RI/FS Report March 2012 Former Reynolds Metals Reduction Plant 30 110730-02
3 REMEDIAL INVESTIGATION FIELD METHODS
This section describes the methods used for completion of the RI investigations, as approved by Ecology. The RI methods were developed to supplement previously available investigation data and to define the nature and extent of contamination within the site. Prior to developing the RI Work Plan (Anchor QEA 2007a), a summary of existing investigations was compiled as the ALCOA Longview Facility Data Report (Anchor 2006). That report included tabular and graphical summaries of existing analytical data, geologic and hydrogeologic information, and available site geochemical data. An RI Work Plan (Anchor 2007a) was subsequently reviewed and approved by Ecology. That work plan included soil, groundwater, and surface water investigations to document environmental conditions at the site. The investigation included extensive testing for COCs known to be present at the site from historical operations and as verified by previous testing. These COCs included fluoride, cyanide, PAH compounds and petroleum (certain site areas). However, the RI work also included testing for other compounds such as PCBs, solvents, pesticides and heavy metals, and testing for site geochemical parameters that are useful in assessing contaminant fate and transport. After completion of initial RI activities, an RI Work Plan Addendum (Anchor QEA 2011b) was completed in 2011 and approved by Ecology. That document defined additional investigations to be performed under Ecology direction. Two additional Work Plan supplements were also approved by Ecology to address installation and sampling of three new monitoring wells and completion of geochemical testing (Anchor QEA 2011c, 2011d). This section describes the testing performed as part of the RI investigations conducted under the above-described work plans. The investigation work is summarized by investigation type as follows:
• Section 3.1—Hydrogeologic Field Investigations, including use of existing and newly installed monitoring wells and piezometers and measurement of groundwater gradients and hydraulic conductivities
Remedial Investigation Field Methods
RI/FS Report March 2012 Former Reynolds Metals Reduction Plant 31 110730-02
• Section 3.2—Aerial Photograph Review to provide information to Ecology for use in identifying locations for environmental testing
• Section 3.3— Chemical Testing, including testing of surface and ditch waters, groundwater, soil, soil porewater collected from lysimeters, and geochemical testing of soils
3.1 Hydrogeologic Field Investigation
This section describes hydrogeologic field investigation activities. These field activities include monitoring well installation, monitoring well development, measurement of groundwater and surface water elevations, and slug testing. Unless noted, all hydrogeologic field investigation activities were completed in accordance with the RI Work Plan (Anchor 2007a) and RI Work Plan Addendum (Anchor QEA 2011b). A discussion of the evaluation of the analytical data collected during these field activities is presented in Section 5. Data collection included geochemical and chemical testing. It should be noted that this section focuses on hydrogeologic field investigation activities directed by Anchor Environmental, L.L.C. (Anchor), in 2006 and Anchor QEA, LLC (Anchor QEA), in 2011 and 2012. Previous investigation activities were completed by Sweet, Edwards and Associates, Inc., Reynolds, CH2M Hill, Inc. (CH2M Hill), and MFG. Copies of previous investigation reports prepared by these companies were submitted to Ecology in August 2006 and were summarized as part of the Alcoa Longview Facility Data Report (Anchor 2006). Section 2 includes a synopsis of these previous investigations.
3.1.1 Monitoring Well Installation
To supplement existing monitoring wells installed at the site, an additional 13 groundwater monitoring wells were installed at the site in September 2006. Four pairs of wells were installed in the East Groundwater Area (G1-S/G1-D, G2-S/G2-D, G3-S/G3-D, and G4-S/G4-D) and two pairs of monitoring wells were installed in the West Groundwater Area (G5-S/G5-D and G6-S/G6-D). In addition, a single deeper monitoring well (G7-D) was installed in the West Groundwater Area adjacent to an existing shallow piezometer (PZ-7). These well locations are illustrated on Figure 3-2.
Remedial Investigation Field Methods
RI/FS Report March 2012 Former Reynolds Metals Reduction Plant 32 110730-02
Three shallow groundwater monitoring wells were installed during January and February 2012 to evaluate groundwater quality in areas where soil impacts were identified. These wells were installed in the Flat Storage Area (SSA4-MW-01), the HTM-Oil Area (SSA6-MW-01), and in the Southeastern Fill Area (SSA7-MW-01). These well locations are also shown on Figure 3-2. All of the monitoring wells were installed by Cascade Drilling, Inc., of Portland, Oregon, using a hollow stem auger drilling rig. Materials encountered during drilling were logged under the direction of an Anchor QEA geologist, and Anchor QEA personnel supervised the construction of the monitoring wells. Copies of the boring logs and well construction details for all site monitoring wells are included in Appendix B-1, and a summary of well construction data are included in Appendix B-1. All newly installed monitoring wells were surveyed after installation relative to the North American Vertical Datum of 1988 (NAVD88) and Washington State Plane South North American Datum (NAD) 83 horizontal datum. All existing monitoring wells were re-surveyed in 2006 relative to these datum.
3.1.2 Monitoring Well Development
After construction of the monitoring wells and prior to collection of groundwater elevation data and groundwater samples, new monitoring wells were developed to optimize hydraulic communication between the screened intervals and the surrounding formations. Well development was completed with the use of a surge block and pump. During development, field parameters were monitored to evaluate the adequacy of development. Well development logs for new (2006 through 2012) and existing wells requiring redevelopment prior to groundwater sampling and slug testing are included in Appendix B-1.
3.1.3 Measurement of Groundwater and Surface Water Elevations
Depths to water were measured at all site monitoring wells and piezometers during the months of September and October in 2006 and July and October in 2011 (see Appendix B-1) using an electric water level sounder. Groundwater elevations at monitoring wells were
Remedial Investigation Field Methods
RI/FS Report March 2012 Former Reynolds Metals Reduction Plant 33 110730-02
calculated by subtracting the measured depth to water from surveyed measuring point elevations relative to NAVD88. In 2006, surface water and ditch water elevations were monitored by electronic pressure transducers deployed at the following locations: the CDID ditch next to the Reynolds pump station, the CDID ditch approximately 200 feet downstream of the Industrial Way pump station, and the Columbia River at the site’s dock facility. A review of the 2006 surface water elevation data collected from the transducer deployed in the Columbia River indicated the magnitude of the tidal fluctuations was much lower than anticipated. Discussions with field personnel indicate they were unable to safely secure the transducer to a dock piling, the result being the transducer moved upstream and downstream with tidal fluctuations. Accordingly, Columbia River surface water elevation data collected from the site dock were substituted with surface water elevation data collected by the National Oceanic and Atmospheric Administration (NOAA) at the Longview Bridge. All surface water elevation data are presented relative to NAVD88.
3.1.4 Slug Testing
In order to characterize the hydraulic conductivity of the soils encountered at the site, slug tests were completed at ten site monitoring wells on October 23 through 25, 2006. The following monitoring wells were tested: G1D, G2D, G3D, G4D, G5D, G6D, G7D, R1D, RL-3D, and RL-4D. Slug testing was performed consistent with EPA Slug Test Standard Operating Procedure 2046, Revision 0.0, dated December 3, 1994, and the RI Work Plan (Anchor 2007a). It should be noted that prior to performing the slug tests, monitoring wells were developed or redeveloped in order to maximize the hydraulic communication between the well and the surrounding formation. Slug tests were conducted at each well location by adding and removing a “slug” of known volume from each well and measuring the response of the water table as it returned to pre-test static conditions. Introduction and removal of the slug resulted in an approximate water level change of 3 feet at most of the wells. Both a falling head (inserting a slug) and a rising head (removing a slug) test were performed on ten monitoring wells. A rising head test was not performed at monitoring wells G4D, G7D, and RL-3D due to the relatively long recovery time noted in the falling head test. A detailed
Remedial Investigation Field Methods
RI/FS Report March 2012 Former Reynolds Metals Reduction Plant 34 110730-02
memorandum describing the data collection methods, evaluation methods, and field data sheets, is presented in Appendix B-2.
3.2 Aerial Photograph Review
An aerial photograph collection of the portion of the entire Northwest Alloys owned property, including the portion located north of Industrial Way, was assembled and reviewed in accordance with the requirements of the AO, as described in the RI Work Plan (Anchor 2007a). The review was conducted to assist Ecology in identifying areas of site disturbance or use that could have been associated with the management or release of wastes or contaminated materials. Twenty-eight aerial photographs were compiled and reviewed. These photographs are included in Appendix B-3, except for the two Cowlitz County Geographic Information System (GIS) prints. The property under review includes land owned by Northwest Alloys immediately north of Industrial Way. The property is primarily vacant land, although the building previously occupied by the Reynolds Credit Union is located in the southeast corner of the property, and an old softball field is also located on the property. No industrial activities were visible in the aerial photographs. Earth moving activity occurred on the property during the construction of the North Plant Potlines and during the construction of the baseball fields. Borrow piles were created and actively used during these times. One area of interest was noted in the northeast corner of the property in the June 29, 1974, and September 29, 1980, photographs. Ecology required collection of soil samples in this area, from the surface and at depth. The comments on the reviewed aerial photos are included in Appendix B-3. The results of the soil sampling are presented in Section 5.
3.3 Chemical Testing
RI chemical testing activities were conducted at the site between 2006 and 2012. Unless noted, all field sampling activities were performed in accordance with the Ecology-approved RI Work Plan (Anchor 2007a) and RI Work Plan Addenda (Anchor QEA 2011b, 2011c, 2011d). Initial testing was performed between 2006 and 2007, consistent with the RI Work Plan (Anchor 2007a). Supplemental testing was performed during 2011 and 2012, consistent
Remedial Investigation Field Methods
RI/FS Report March 2012 Former Reynolds Metals Reduction Plant 35 110730-02
with the Work Plan Addenda (Anchor QEA 2011b, 2011c, 2011d). Both time periods included testing of surface water and ditch water, groundwater, soils, and soil porewater collected from lysimeters. Both rounds of investigation also included testing of site geochemical parameters to support contaminant fate and transport evaluations. In 2006 and 2007, analytes for groundwater and surface water monitoring locations included broad testing for fluoride and cyanide. Monitoring wells in selected locations were also sampled for PAHs, which are known to be present at the site but are infrequently detected in groundwater. Selected wells were also tested for other priority pollutants. Soils were sampled for both site COCs and additional priority pollutants where historical aerial photographs showed land disturbance, in the former north and south rectifier yards, and at the floor sweeps and old industrial landfills. Lysimeter installation locations in the floor sweeps landfill and former SPL storage area were sampled for fluoride and cyanide. In 2011 and 2012, additional sampling was completed at Ecology’s request to address remaining data gaps. Supplemental study activities (SSAs) were described in the Work Plan Addendum (Anchor QEA 2011b) and included comprehensive groundwater, surface water and ditch water monitoring, installation of three new groundwater monitoring wells, soil sampling in seven site areas, a diver survey of the dock area, and an evaluation of material partitioning and geochemistry in support of updated fate and transport modeling. The following sections summarize the RI data collection activities. Unless noted, sampling was performed consistent with the Ecology-approved Sampling and Analysis Plan (SAP; Anchor 2007a) and SAP Addendum (Attachment A, Anchor QEA 2011b). RI sampling information is included in Appendix B-4.
3.3.1 Surface Water and Ditch Water Sampling
During both 2006 and 2011 RI activities, water samples were collected from the following three areas:
Remedial Investigation Field Methods
RI/FS Report March 2012 Former Reynolds Metals Reduction Plant 36 110730-02
• Columbia River water collected from the dock (W5) • CDID ditch system water collected in various locations throughout the site (W2, W3,
and W4) • Background CDID ditch system water located outside of the site boundaries (W1, W6,
and W7). The Columbia River water samples were collected 2 feet below the water surface. The other samples (those collected from the CDID ditches) were collected both at corresponding elevations 2 feet below the water surface (2006) and at approximately 0.5 feet above the bottom of the ditch bottoms (2011). Surface water and CDID ditch water sampling locations are shown on Figure 3-1. In 2011, sampling was conducted in parallel with the July and October groundwater monitoring event described in the Section 3.3.2. Field measurements included temperature, pH, sulfide, dissolved oxygen, ferrous iron, oxidation reduction potential (ORP), and conductivity. Laboratory analyses included total dissolved solids (TDS), total suspended solids (TSS), alkalinity, fluoride, total chloride, total phosphorous, cyanide (free, WAD, and total), sulfate, and dissolved metals, including aluminum, calcium, iron, magnesium, manganese, potassium, silicon, and sodium. In 2011, the only deviation from the SAP Addendum was an adjustment to the analytical sampling parameters from the October 2011 sampling event; in October, surface and ditch water samples were tested for dissolved fluoride and cyanide and field filtered at the time of collection. A summary of surface water analytical testing methods is presented in Appendix B-4.
3.3.2 Groundwater Sampling
In 2006, the site-wide monitoring well network was sampled for fluoride, cyanide, and conventional analytes, including field parameters (e.g., pH and dissolved oxygen), per the RI Work Plan (Anchor 2007a). Monitoring well locations are shown on Figure 3-2. Two samples were collected for priority pollutants adjacent and downgradient of the old industrial landfill (RLSW2) and the floor sweeps landfill (G2S). Both of these wells are screened in the shallow groundwater screen interval to evaluate potential impacts of fill material in these areas. In 2007, eight monitoring wells were sampled for PAHs: G1S, G2S,
Remedial Investigation Field Methods
RI/FS Report March 2012 Former Reynolds Metals Reduction Plant 37 110730-02
G6S, PZ1, PZ3, PZ4, PZ5, and RLSW2. These wells were selected for PAH sampling due to their proximity to waste residuals known to contain PAHs. During 2011 and 2012, supplemental groundwater sampling was conducted as part of the SSA 9 data collection activity, as described in the Work Plan Addendum (Anchor QEA 2011b). Groundwater monitoring activities in 2011 was performed for the site-wide monitoring well network including the five well series G, PZ, R, RL, and RLSW (see Figure 3-2). Groundwater samples associated with this investigation were collected from all 13 “G series” monitoring wells, all seven “PZ series” piezometers, all six “R series” wells, all 13 “RL series” wells, and all four “RLSW series” wells, as shown on Figure 3-2. 2011 sampling occurred during two events—a July collection event and an October collection event—to document potential seasonal variations. Groundwater monitoring wells were sampled in 2011 to assess potential changes in constituent levels since 2006 and 2007 groundwater sampling events associated with the 2007 RI (Anchor 2007b). Three new groundwater monitoring wells were installed and sampled in 2012 in response to Ecology comments; these wells include SSA4-MW-01, SSA6-MW-1, and SSA7-MW-01, and are shown on Figure 3-2. Groundwater parameters for all 2011 and 2012 samples are included in Appendix B-4. In 2011, all groundwater monitoring wells were sampled in accordance with the procedures and methods approved in the 2007 RI Work Plan (Anchor 2007a) and as described in the SAP Addendum (Attachment A, Anchor QEA 2011b). Water elevations were measured in each well at the time of sampling. Field measurements included temperature, pH, sulfide, dissolved oxygen, ferrous iron, ORP, and conductivity. Laboratory analyses included TDS, TSS, alkalinity, fluoride, total chloride, total phosphorous, cyanide (free, WAD, and total), sulfate, and dissolved metals, including aluminum, calcium, iron, magnesium, manganese, potassium, silicon, and sodium. In addition, several wells were tested for PAHs (e.g., PZ-1 to PZ-5; G6-S and G6-D; to R series wells; and RL-4S). All sampled wells and analytical parameters are summarized in Appendix B-4. Groundwater field sampling data sheets (FSDS) are included in Appendix B-1.
Remedial Investigation Field Methods
RI/FS Report March 2012 Former Reynolds Metals Reduction Plant 38 110730-02
3.3.3 Soil Sampling
Except for the deviations outlined subsequently, all soil sampling activities were performed in accordance with the 2007 RI Work Plan (Anchor 2007a) and the Work Plan Addendum (Anchor QEA 2011b). Soil boring and test pit logs are included in Appendix B-1.
3.3.3.1 2006 to 2007 Soil Sampling Activities
In 2006, soil sampling was conducted in the northern field area of the site, immediately north of Industrial Way (see Figure 3-3). The soil sampling location was determined by Ecology after review of historical aerial photographs showing soil disturbance in this area. Sample station S1, as identified on Figure 3-3, is located in the area of the soil disturbance; one sample was collected from the surface (0 to 0.5 feet bgs), and another sample was collected at depth (1.5 to 2.0 feet bgs). Soil sampling was also conducted in 2006 in the north and south rectifier yards (see Figure 3-3). Samples were located in the rectifier yards near the large transformer/rectifiers that supplied energy to the potlines. Sample analytes for the south rectifier yard included PCBs, TPH, and mercury. Samples were collected from depths of 0 to 0.5 feet bgs . The 2006 soil sampling included two additional samples collected from soils beneath the floor sweeps (S-2) and old industrial landfills (S-3); both samples were analyzed for priority pollutants (see Appendix B-4). These samples were collected in undisturbed soils located immediately beneath the landfill materials. These locations were tested after excavation of small landfill sections. Samples were collected 0 to 0.5 feet below the exposed soil surface. Three additional soil samples from the floor sweeps and former SPL storage area (synthetic precipitation leaching procedure [SPLP] 1, 2, and 3) and one sample of black mud (SPLP 4) were collected during February 2007 in order to perform an initial evaluation of material leaching potential. These soil samples were co-located approximate to the 2006 lysimeter locations, as noted on Figure 3-3. The black mud sample was collected from material in the Black Mud Pond. Samples were analyzed for fluoride and cyanide, both as solids and after SPLP extraction, which simulates the material leaching potential by precipitation. Refer to Section 3.3.4 for a discussion of lysimeter testing of soil porewater.
Remedial Investigation Field Methods
RI/FS Report March 2012 Former Reynolds Metals Reduction Plant 39 110730-02
3.3.3.2 2011 to 2012 Soil Sampling Activities
Soil sampling performed in 2011 and 2012 was performed in each SSA, as outlined in the Work Plan Addendum (Anchor QEA 2011b). A detailed description of each SSA is provided in Section 2.4 (Sections 2.4.10 to 2.4.16). A summary of 2011 and 2012 RI sampling activities is presented in Table 2-1.
Field Southwest of Cable Plant (SSA 1) Soil sampling was performed in the field southwest of the former Cable Plant (SSA 1) to investigate the potential presence of contaminated soils. Soils in this area were investigated to determine if any of the black-former smelter wastes containing fluoride and cyanide were present in this area. Other potential COCs for SSA1 include PAHs and total petroleum hydrocarbons (diesel range and heavy oils). Eight test pits were excavated in this area. Dark colored soils were identified in only two of the test pits. These dark-colored soils were sampled and analyzed for fluoride, cyanide, TPH, and PAHs. Figure 3-3 presents the test pit locations associated with SSA 1. No deviations from the procedures described in the Work Plan Addendum were required during field activities.
Thin Stillage Application Areas (SSA 2) Surficial soil sampling was performed in the former thin stillage application areas (SSA 2) to investigate potential nutrient impacts to soil. Hand shovels were used to excavate shallow test plots within locations where thin stillage was applied. Grab samples of shallow soils (0 to 6 inches in depth) from within the test plots were analyzed for nutrient compounds typically associated with thin stillage (total nitrogen, nitrate, nitrite, ammonia, total and available phosphate, and potassium). Four test plots were excavated along two transects (see Figure 3-3). Reference samples were also obtained from two shallow test plots located away from areas of thin stillage application, specifically southwest of SSA 2, between the CDID levee and the Columbia River (see Figure 3-3). Reference samples were analyzed for the same constituents as the samples from the thin stillage application areas. No deviations from the procedures described in the Work Plan Addendum were required during field activities.
Northwest Site Area Soils (SSA 3)
Remedial Investigation Field Methods
RI/FS Report March 2012 Former Reynolds Metals Reduction Plant 40 110730-02
Soil sampling was performed in the northwestern site area (SSA 3; see Figure 3-3) to investigate the potential presence of black mud constituents (fluoride and cyanide) in soil. Shallow soils were sampled using test pits excavated along four sampling transects. Figure 3-3 presents the test pit locations associated with SSA 3. Each of the eight test pits were excavated to a depth between 4 and 7 feet bgs. No deviations from the procedures described in the Work Plan Addendum were required during field activities.
Flat Storage Area (SSA 4) Soil sampling was conducted in SSA 4 to determine if contaminants associated with pet-coke products stored in this area may have leached into underlying soils. Soil sampling is summarized in Appendix B-4 and included areas adjacent to the storage pad where stormwater runoff may have accumulated during Chinook operations. Sampling was performed at 11 locations using direct-push boring within each of the nine quadrants that cover the entire storage pad area and in two adjacent areas (see Figure 3-3). Soil samples from beneath the storage pad were collected at 1-foot intervals to a maximum sampling depth of 5 feet bgs or the observed depth to groundwater, whichever was encountered first. The first two sample intervals from each location were analyzed for PAHs (as an indicator of pet-coke). Deeper soil samples (2- to 3- and 3- to 4-foot intervals) from location AQ-SSA4-05 were also analyzed due to elevated concentrations of PAHs in shallow soil intervals. Prior to sampling, stored product was removed from the sample locations, and the composition and integrity of the pad was visually assessed. Sampling included coring or cutting of the pad to expose underlying soils for access.
Casting Pit Soils (SSA 5) Casting pits are located within the former Cast Houses (refer to SSA 5 on Figure 3-3). These pits are concrete-lined structures, approximately 20 to 30 feet bgs, that were formerly used in direct chill casting of molten aluminum. Two of these casting pits were recently decommissioned by the previous tenant by filling with sandy on-site soils and capping with concrete. Ecology requested that soil sampling be performed within the two filled casting pits to evaluate if materials disposed of in the pits by the previous tenant were present. Casting pit soils were sampled using direct push borings to assess the nature of the fill material. Three borings were placed in each of the two casting pit areas, as shown in
Remedial Investigation Field Methods
RI/FS Report March 2012 Former Reynolds Metals Reduction Plant 41 110730-02
Figure 3-3. A total of six borings were advanced to a depth between 36.5 and 38 feet bgs. Soil samples were collected at depth intervals of 8 to 10 and 14 to 16 feet bgs, except for location AQ-SSA5-05, which the shallower sample was collected at depth interval of 5 to 7 feet bgs. All samples were analyzed for PAHs and fluoride (see Appendix B-4). No deviations from the procedures described in the Work Plan Addendum were required during field activities.
HTM Oil Area (SSA 6) Soil sampling was conducted within the HTM Oil Area (SSA 6) to complete previous soil characterization activities and to verify that this study area has been adequately remediated. Soil sampling was performed using limited access, direct push borings at 11 locations within the containment area—four locations between the pitch storage tanks, three locations south of the tanks, one location west of the tanks, and three additional locations north of the tanks. Appendix B-4 presents a summary of the sampling and testing details and Figure 3-3 presents the soil sampling locations. Soils from each boring were continuously sampled and field screened using visual inspection techniques and sheen testing. A total of 27 soil samples were analyzed for Northwest Total Petroleum Hydrocarbons – Diesel Range (NWTPH-Dx), with silica gel cleanup to assess petroleum concentrations. A minimum of two soil samples were collected from each boring; additional samples were collected when potentially impacted soil intervals were observed. Based on the NWTPH-Dx results, three soil sample intervals were analyzed for extractable petroleum hydrocarbons (EPH) to provide petroleum fractionation data for assessing a site-specific TPH cleanup level.
Southeastern Fill Area (SSA 7) Test pits were completed in the Southeastern Fill Area (SSA 7) to evaluate the lateral extent and composition of fill containing apparent construction debris previously identified in the southeastern portion of the site. A total of 10 test pits were excavated to a minimum depth of 7 feet bgs or to the base of the apparent fill material, where observed. Figure 3-3 presents the SSA 7 test pit locations. Three test pits (AQ-SSA7-04, -05, and -06) were relocated to the east because the planned locations were located within wooded areas inaccessible to the test pitting equipment. To the extent practical, test pits were backfilled to original conditions after sampling, with the soils replaced in the order in which they were excavated.
Remedial Investigation Field Methods
RI/FS Report March 2012 Former Reynolds Metals Reduction Plant 42 110730-02
3.3.4 Lysimeter Installation and Sampling
Lysimeters were used during 2006 and 2012 to assess fluoride partitioning to determine site-specific soil/water partitioning coefficients (Kd) in both the West and East Groundwater Areas. Lysimeters were installed in target material deposits. In 2006, lysimeters were installed in the former SPL storage area and floor sweeps landfill. The installation details and boring logs for these three lysimeters are included in Appendix B-5. As part of the 2012 RI activities, eight new ceramic suction (Soil Moisture Equipment Corp) lysimeters were installed and sampled in the closed white mud pond and black mud ponds in the East Groundwater Area, the area east of the former cryolite recovery plant, and the former black mud deposits located in the West Groundwater Area (see Figure 3-4). Each lysimeter was installed using a 2.25-inch-diameter hand auger, and the ceramic cup was placed at least 6 inches below the target material deposits (e.g., black mud or white mud), approximately at the water table. At the depth that each lysimeter was installed, one soil sample was collected and composited from the auger cuttings; these soil samples were analyzed for total fluoride. Following installation, all lysimeter borings were backfilled in order by: 1) a silica slurry (surrounding the ceramic cup); 2) “native” excavated soils; 3) bentonite pellets (approximately a 1-foot-diameter seal); and 4) top soil. During the week after installation, and 24 hours before sampling events, lysimeters were completely purged of water, and field parameters including volume, conductivity, and pre- and post-vacuum pressures were measured to ensure that lysimeters were functioning properly and that representative porewater was sampled in each lysimeter. The installation and development log sheets for these eight lysimeters are included in Appendix B-5. In January 2012, a total of 16 water samples were collected from the eight new lysimeters. Samples were collected during two discrete sampling events, spanning a period of 35 days after the lysimeters were installed. The first round of lysimeter sampling occurred on January 4; these water samples were analyzed for conventional parameters, dissolved metals, and dissolved fluoride. The second round of lysimeter sampling was performed on January 25 to confirm the first round fluoride results. These water samples were analyzed
Remedial Investigation Field Methods
RI/FS Report March 2012 Former Reynolds Metals Reduction Plant 43 110730-02
for total and dissolved fluoride. The soil and water results from these sampling events are used to calculate a site-specific average Kd value for each of the material deposits.
3.3.5 Geochemical Sampling
During 2007 RI/FS activities, geochemical testing, and modeling were performed to evaluate the fate and transport of fluoride in site groundwater. As shown in Figure 3-4, supplemental testing was performed in the East Groundwater Area during December 2011 and January 2012 to expand the geochemical data set. Geochemical work in 2011 and 2012 included installation and testing of soil mineralogy in four borings collected east of the former Cryolite Recovery Plant (see Figure 3-4); the geochemical sampling details are included in Appendix B-5. Geochemical soil borings were advanced into the saturated zone along a southwest-northeast trending transect (see Figure 3-4). At each location, soil samples were collected using direct-push boring sampling methods. Direct-push sampling was performed consistent with methods defined in the Work Plan Addendum (Anchor QEA 2011b).
3.3.6 Dock Area Visual Survey
As described in Section 2.3.9, sediment testing was performed in the vicinity of the dock during 2010 in response to Ecology Administrative Order No. 7392. That Order was issued to investigate conditions following a release of pet-coke within the Columbia River. Sampling and analysis of sediments adjacent to and downstream from the dock was completed in 2010, as described in Section 2.3.9, consistent with a SAP (Anchor QEA 2010a) approved by the DMMP agencies (i.e., Ecology, WDNR, USACE, and EPA), and no chemical contamination was identified in either surface or subsurface sediments (Anchor QEA 2010b; Chinook 2010). Ecology requested that a follow-up visual assessment be performed in the vicinity of the dock to supplement a previous survey conducted in 2010 by others. This survey was performed by Northwest Underwater Construction, LLC, during 2011. A map with completed survey transects and observations is included in Appendix B-6. Some thin deposits (0.25 to 1 inch in thickness) of hardened cement-like material were noted along
Remedial Investigation Field Methods
RI/FS Report March 2012 Former Reynolds Metals Reduction Plant 44 110730-02
portions of some of the transects. No pet-coke was observed during the supplemental dock area survey.
RI/FS Report March 2012 Former Reynolds Metals Reduction Plant 45 110730-02
4 GEOLOGY, HYDROLOGY, AND HYDROGEOLOGY
4.1 Regional Geology
The site lies within the Longview-Kelso basin, a topographic and structural depression formed by the Cascadia subduction zone (Evarts et al. 2009). The Longview-Kelso basin is composed primarily of Tertiary age bedrock overlain by Quaternary age unconsolidated alluvium. Bedrock units include volcanic rocks of the Grays River formation and thinly interbedded sandstone, siltstone, and shale layers of the Cowlitz Formation (Phipps 1987; Walsh 1987). The overlying alluvium includes thick sequences of the catastrophic Missoula flood deposits (coarse-grained sand and gravel) overlain by channel and floodplain deposits (silt, fine-grained sand, and clay) of the Columbia and Cowlitz Rivers (Swanson et al. 1993; Evarts et al. 2009).
4.2 Site Geology
In the Longview area along the Columbia River, the upper portion of the alluvium consists of fine-grained sand, silt, and clay overlying a much deeper sequence of coarser-grained gravels and cobbles. Many of the production wells located on-site and on nearby industrial properties (including those of the City of Longview Mint Farm Well Field or Mint Farm) are completed within these coarse-grained gravel deposits. Several of the deepest production wells in the region also penetrate bedrock. Analysis of shallow and deep boring logs from on-site supply wells and Mint Farm wells indicates that the upper alluvium locally consists of interbedded silt and fine grained sand layers, with minor fractions of silty sand, sandy silt, and clay interbeds. The upper alluvium is approximately 200 to 300 feet thick along the Columbia River shoreline, thinning to 130 to 190 feet in the area northeast of the site. The lower alluvium locally consists of coarse-grained sand and gravel deposits, which range in thickness from 100 to 350 feet in the vicinity of the site and the Mint Farm. Figure 4-2 presents a schematic cross-section illustrating the geology of the site and vicinity.
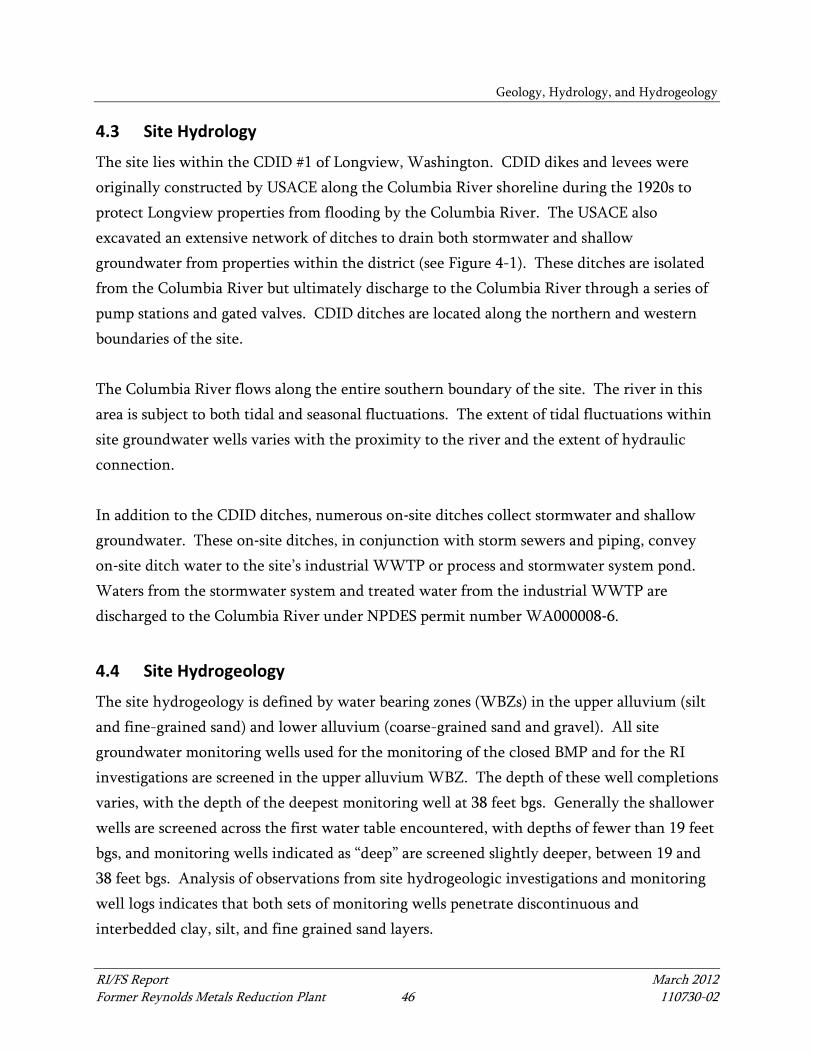
Geology, Hydrology, and Hydrogeology
RI/FS Report March 2012 Former Reynolds Metals Reduction Plant 46 110730-02
4.3 Site Hydrology
The site lies within the CDID #1 of Longview, Washington. CDID dikes and levees were originally constructed by USACE along the Columbia River shoreline during the 1920s to protect Longview properties from flooding by the Columbia River. The USACE also excavated an extensive network of ditches to drain both stormwater and shallow groundwater from properties within the district (see Figure 4-1). These ditches are isolated from the Columbia River but ultimately discharge to the Columbia River through a series of pump stations and gated valves. CDID ditches are located along the northern and western boundaries of the site. The Columbia River flows along the entire southern boundary of the site. The river in this area is subject to both tidal and seasonal fluctuations. The extent of tidal fluctuations within site groundwater wells varies with the proximity to the river and the extent of hydraulic connection. In addition to the CDID ditches, numerous on‐site ditches collect stormwater and shallow groundwater. These on‐site ditches, in conjunction with storm sewers and piping, convey on‐site ditch water to the site’s industrial WWTP or process and stormwater system pond. Waters from the stormwater system and treated water from the industrial WWTP are discharged to the Columbia River under NPDES permit number WA000008‐6.
4.4 Site Hydrogeology
The site hydrogeology is defined by water bearing zones (WBZs) in the upper alluvium (silt and fine-grained sand) and lower alluvium (coarse-grained sand and gravel). All site groundwater monitoring wells used for the monitoring of the closed BMP and for the RI investigations are screened in the upper alluvium WBZ. The depth of these well completions varies, with the depth of the deepest monitoring well at 38 feet bgs. Generally the shallower wells are screened across the first water table encountered, with depths of fewer than 19 feet bgs, and monitoring wells indicated as “deep” are screened slightly deeper, between 19 and 38 feet bgs. Analysis of observations from site hydrogeologic investigations and monitoring well logs indicates that both sets of monitoring wells penetrate discontinuous and interbedded clay, silt, and fine grained sand layers.
Geology, Hydrology, and Hydrogeology
RI/FS Report March 2012 Former Reynolds Metals Reduction Plant 47 110730-02
In contrast to the site monitoring wells, all on-site groundwater supply wells and those located or planned on nearby properties (including the Mint Farm) are screened in the coarse-grained sand and gravels of the deeper, lower alluvium WBZ. The deepest on-site water supply well extends 100 feet bgs. The upper alluvium WBZ and the lower alluvium WBZ are shown on Figure 4-2. Note that site wells identified as “shallow” and “deep” are located within the upper alluvium WBZ on this figure. Groundwater flow in the upper alluvium WBZ is influenced primarily by the Columbia River and the regional CDID ditch system and also by the regular pumping of on-site ditches. Precipitation recharge and seasonal fluctuations are also noted in the upper alluvium WBZ. Tidal influences of the Columbia River were evaluated by Sweet, Edwards and Associates, Inc., in 1986; the findings indicated influences to site groundwater mainly in areas immediately adjacent to the river. The elevation of the water in the CDID ditches is generally maintained by pumping between 1.0 and 1.5 feet above sea level (National Geodetic Vertical Datum [NGVD] 29 datum). Based on water measurement elevations from October 2011, groundwater typically flows north and east, away from the Columbia River and toward the CDID ditches. The only exception is riverward of the CDID levee, where groundwater gradients can be south and west towards the Columbia River (see Figure 4-3) depending on river stage. Perched groundwater has also been observed at locations on the riverward side of the CDID levee. Analysis of groundwater elevations from 2006 and from October 2011 at shallow/deeper well pairs indicates an upward flow gradient at most site well pairs. This upward gradient is consistent with the influences of pumping in the CDID ditches and other on-site ditches. Analysis of seasonal changes in groundwater elevations suggest that vertical gradients fluctuate throughout the year, with downward vertical gradients in the winter and spring, due to groundwater recharge from precipitation, and upward vertical gradients in the summer and fall, due to lower groundwater elevations and the influence of pumping in the ditches. On average, groundwater elevations are higher in the East Groundwater Area than in the West Groundwater Area (see Figure 4-3).
Geology, Hydrology, and Hydrogeology
RI/FS Report March 2012 Former Reynolds Metals Reduction Plant 48 110730-02
Downward vertical gradients are noted at some shallow/deeper well pairs within the site, principally those that are located outside of the CDID levee and near the Columbia River. These locations may be outside of the hydraulic influences of the CDID ditch system. Some of the wells at the site exhibit unusually high groundwater elevations. These conditions have been noted at wells G6-S and RLSW-4, which are located along the CDID levee near the Columbia River. The water elevations in these wells also have not correlated well with river stage in comparison to deeper-screened wells in these areas (see Figure 4-4). The observations from these wells suggest that groundwater in this area may be perched on low-permeability silt and clay layers, as noted in the boring logs for these wells.
RI/FS Report March 2012 Former Reynolds Metals Reduction Plant 49 110730-02
5 NATURE AND EXTENT OF CONTAMINATION
This section describes the results of surface water, groundwater, soil, and lysimeter sampling performed in support of the RI/FS. RI investigation methods are summarized in Section 3 and were performed consistent with the Ecology-approved RI Work Plan (Anchor 2007a) and Work Plan Addendum (Anchor QEA 2011b) and as described in the SAP (Anchor 2007a) and SAP Addendum (Attachment A, Anchor QEA 2011b). Subsequent Work Plan Addenda were also approved by Ecology to install new monitoring wells and perform geochemical testing (Anchor QEA 2011c, 2011d). All data presented in this report have been compiled, reviewed, and validated in accordance with the quality assurance/quality control (QA/QC) parameters described in the Quality Assurance Protection Plan (QAPP; Anchor 2007b) and QAPP Addendum (Attachment B, Anchor QEA 2011b). Data validation packages are included in Appendix C. Laboratory analytical reports are included in Appendix D.
5.1 Screening Levels
This section presents the various criteria selected to screen RI data and identify potential COCs at the site. Federal and state laws were reviewed to determine the Applicable or Relevant and Appropriate Requirements (ARARs) for this RI data comparison. These ARARs contain promulgated criteria that are used in evaluating the potential for affects to human health or the environment and are evaluated based on their applicability to existing site conditions and potential exposure pathways. Site media with potential exposure pathways to human health or ecological receptors include soil, groundwater, and surface water. The following presents screening levels for each media (groundwater, surface water, and soil) based on the review of ARARs and potential site-specific exposure pathways. Where applicable, a hierarchical approach was used to select screening levels for each medium, based first on relevance and second on criteria availability.
5.1.1 Groundwater
Site groundwater exposure pathways are defined by protection of the highest beneficial use. Groundwater screening levels are presented in Table 5-1; based on the highest beneficial use
Nature and Extent of Contamination
RI/FS Report March 2012 Former Reynolds Metals Reduction Plant 50 110730-02
of site groundwater as drinking water, the following hierarchy was used to determine groundwater screening levels:
• MTCA Method A Groundwater Cleanup Levels (WAC 173-340-720). These levels consider risks associated with ingestion of drinking water.
• State Drinking Water MCLs (WAC 246-290-310). These levels assume drinking water as the highest beneficial use of groundwater and are typically more stringent than the national drinking water standards.
5.1.2 Surface Water
Site groundwater generally flows into to the CDID stormwater drainage ditches. These ditches periodically discharge into the Columbia River, which is designated for water supply uses. Surface water screening levels presented in Table 5-1 were assembled based on the Method A procedure for establishing cleanup levels. Accordingly, these values presented represent the most stringent of the available criteria from the following ARARs:
• State Surface Water Quality Standards (WAC 173-201A). These standards are based on freshwater, chronic exposure for the protection of aquatic life.
• National Recommended Water Quality Criteria (Clean Water Act [CWA] § 304[a]). This is EPA’s national recommended water quality criteria for the protection of aquatic life (freshwater, chronic).
• The National Toxics Rule (40 Code of Federal Regulations [CFR] 131). This provides chemical-specific, numeric criteria for priority toxic pollutants protective of human health and aquatic life.
• State Drinking Water MCLs (WAC 246-290). This is used when surface water criteria were not available for specific chemicals; these levels assume drinking water as the highest beneficial use.
5.1.3 Soil
For soil, the applicable exposure pathways include direct contact and soil to groundwater leaching of contaminants. MTCA Method A Industrial Use cleanup levels were referenced as initial screening criteria. These values can be conservative because they consider risks associated with contaminant migration from soil to groundwater, in addition to direct
Nature and Extent of Contamination
RI/FS Report March 2012 Former Reynolds Metals Reduction Plant 51 110730-02
contact and ingestion. When Method A cleanup levels were not available, Method C values were derived appropriately for carcinogenic and non-carcinogenic contaminants under an industrial land use scenario. Soil screening levels are presented in Table 5-1; based on site use (e.g., industrial use) and the applicable exposure pathways, soil results are screened using the following hierarchy of soil ARARs:
• MTCA Method A Industrial Soil Cleanup Levels (WAC 173-340-745). These levels are based on industrial land use with a reasonable maximum exposure scenario of an adult industrial worker; MTCA Method A levels consider protection of groundwater for drinking water use in addition to direct contact and ingestion.
• MTCA Method C Industrial Soil Cleanup Levels (WAC 173-340-745). These levels are based on a direct-contact exposure scenario and are derived for both carcinogenic and non-carcinogenic contaminants under an industrial land-use scenario.
• Background (Ecology 1994). When numeric cleanup levels are not available for constituents evaluated in groundwater, background concentrations were used as screening values.
5.2 Ditch and Surface Water Quality
Water samples were collected from the same locations in the Columbia River and in the CDID ditches during both the 2006 and 2011 RI activities (see Figure 3-1). These water samples were collected in three areas: 1) Columbia River water collected from the dock (W5); 2) CDID ditch system water collected in various locations throughout the site (W2, W3, and W4); and 3) background ditch water located in the CDID ditches but outside of the site boundaries (W1, W6, and W7). The Columbia River water sample was collected 2 feet below the water surface; the other samples (those collected from the CDID ditches) were collected at approximately 0.5 feet above the mudline. Surface water sampling results are presented for both the 2011 and 2006 RI activities in Tables 5-2 and 5-3, respectively. Ditch and surface water sampling was in accordance with the procedures and methods approved in the RI Work Plan (Anchor 2007b) and as described in the SAP Addendum (Attachment A, Anchor QEA 2011b). The only deviation from the SAP addendum was an adjustment to the analytical sampling parameters from the October 2011 sampling event. In October 2011, after consultation with Ecology, surface water samples were tested for
Nature and Extent of Contamination
RI/FS Report March 2012 Former Reynolds Metals Reduction Plant 52 110730-02
dissolved fluoride and cyanide (total, WAD, and free) and field filtered at the time of collection. A summary of surface water collection is presented in Table B-5. Ditch and surface water data presented in this report have been compiled, reviewed, and validated in accordance with the QA/QC parameters described in the RI Work Plans. Ditch and surface water free cyanide results are presented on Figure 5-1. Cyanide data from the July 2011 sampling event were analyzed on a total, non-filtered basis. Free cyanide concentrations from this event were not detected above 0.005 mg/L and are, therefore, all below the surface water screening level (state surface water quality standards) for free cyanide of 0.0052 mg/L. Surface water samples from October 2011 were analyzed for dissolved cyanide concentrations. Results from the October 2011 event were non-detect with the exception of two samples—W2 (0.0055 mg/L) and W6 (0.004 mg/L). The total cyanide and WAD cyanide concentrations in the W2 sample were both reported as non-detect values below 0.005 mg/L; this indicates a possible false positive in the free cyanide value reported. An acceptable method precision for sample concentrations greater than five times the reporting limit is 20 percent relative difference; the detected concentrations in samples W2 and W6 are within two times the reporting limit and are, therefore, more susceptible to analytical variability. Ditch and surface water fluoride results are presented on Figure 5-2. As for cyanide, the July 2011 and 2006 samples were analyzed on a total, non-filtered basis, while the October 2011 samples were analyzed for dissolved fluoride concentrations. All ditch and surface water samples collected in 2011 and 2006 were either non-detect or detected at concentrations below the surface water screening level of 4 mg/L. The maximum dissolved fluoride concentration in October 2011 was 2.31 mg/L (W4), and the minimum was 0.133 mg/L (W5). No exceedances of screening levels were noted for any other compounds tested in ditch water or surface water.
5.3 Groundwater Quality
Groundwater samples were collected in a series of sampling events. The primary sampling events occurred in September and October of 2006 and July and October of 2011. Sample
Nature and Extent of Contamination
RI/FS Report March 2012 Former Reynolds Metals Reduction Plant 53 110730-02
locations are presented on Figure 3-2 and include the site monitoring well network. Groundwater data are presented by well location into West Groundwater and East Groundwater Areas. Groundwater sampling results are presented in Tables 5-4 to 5-10. A summary of groundwater sample collection and testing is presented in Appendix B-4. Groundwater sampling conducted as part of the SSA 9 (2011) data collection activities was performed consistent with the 2006 RI groundwater monitoring activities and included five well series: G, PZ, R, RL, and RLSW (see Figure 3-2). Groundwater samples associated with this investigation were collected from all 13 “G series” monitoring wells, all seven “PZ series” piezometers, all six “R series” wells, all 13 “RL series” wells, and all four “RLSW series” wells, as shown on Figure 3-2. Three additional new monitoring wells were also installed and sampled in 2011 in SSA 4, 6, and 7. These results are described in the associated soil sampling section because these data are relevant to localized soil and groundwater issues evaluated consistent with Ecology requirements.
5.3.1 West Groundwater Area
In the West Groundwater Area, a total of 20 monitoring wells were sampled during both 2011 and 2006 RI activities. Groundwater samples collected for dissolved analyses were field filtered during collection. Figure 3-2 presents the monitoring well locations and Tables 5-4, 5-6, 5-8, and 5-9 present the groundwater sampling results for West Groundwater Plant monitoring wells for cyanide and fluoride, PAHs, metals, and geochemical parameters, respectively. Groundwater results were evaluated using the screening levels outlined in Section 5.1.
5.3.1.1 Cyanide
The July 2011 and 2006 cyanide testing was analyzed on a total, non-filtered basis, while the October 2011 groundwater samples were analyzed for both dissolved and total cyanide concentrations. During both the 2011 and 2006 RI sampling, no West Groundwater Area groundwater samples exceeded the MCL (0.2 mg/L) for free cyanide (see Table 5-4). Free cyanide results are presented for both 2011 and 2006 sampling events on Figures 5-3 and 5-4, respectively. In October 2011, all West Groundwater Area groundwater results were non-
Nature and Extent of Contamination
RI/FS Report March 2012 Former Reynolds Metals Reduction Plant 54 110730-02
detect (i.e., fewer than 0.005 mg/L) for dissolved free cyanide. In July 2011, detected concentrations of free cyanide ranged from 0.0021 mg/L (G5-S) to 0.0044 mg/L (RL-4S). The 2011 concentrations were less than those measured during 2006. In 2006, the maximum total free cyanide concentration was 0.0396 mg/L (RL-2S) a total free cyanide concentration of 0.0322 mg/L at well RL-2S. That 2006 concentration was well below the drinking water MCL. WAD and total cyanide were also evaluated for 2011 and 2006 groundwater samples (see Table 5-4). WAD and total cyanide results provide cyanide speciation information; however, cyanide screening levels are not applicable to WAD and total cyanide concentrations. The maximum dissolved WAD cyanide concentration was 0.0492 mg/L (RL-2S; October 2011), and the maximum dissolved total cyanide concentration was 7.02 mg/L (PZ-6; October 2011).
5.3.1.2 Fluoride
Groundwater samples from 11 of the 20 West Groundwater Area monitoring wells exceeded the MCL (4.0 mg/L) for both total and dissolved fluoride based on the 2006 and 2011 monitoring events (see Table 5-4). Fluoride results are presented on Figure 5-5 for both the 2011 and 2006 RI sampling events. In 2011, detected total fluoride concentrations ranged from 0.159 mg/L (G5-S) to 102 mg/L (RLSW-4). Dissolved fluoride concentrations ranged from 0.166 mg/L (G5-S) to 96.8 mg/L (RLSW-4). In comparison to 2006 data, slight decreases in total fluoride concentrations were observed in several West Groundwater Area wells, including G5-D, G5-S, G6-S, G7-D, RL-1S, RL-2D, RL-2S, RL-3S, PZ-6, PZ-7, RLSW-1, and RLSW-3.
5.3.1.3 PAHs
Groundwater samples were analyzed for PAHs from four West Groundwater Area monitoring wells (G6-S, G6-D, RL-4S, and RLSW-2) between the 2011 and 2006 RI activities. PAH results are presented in Table 5-6. All cPAH groundwater results were well below the cPAH screening level of 0.1 µg/L. The maximum cPAH concentration was 0.0145 μg/L at monitoring well G6-D.
Nature and Extent of Contamination
RI/FS Report March 2012 Former Reynolds Metals Reduction Plant 55 110730-02
5.3.1.4 Metals (Dissolved)
Dissolved metals were analyzed at the “RL” series monitoring wells in the West Groundwater Area. Results are presented in Table 5-8. Arsenic concentrations ranged from 0.889 µg/L (RL-1S) to 19.5 µg/L (RL-2S). Arsenic concentrations were detected above the MTCA Method A groundwater cleanup level of 5 µg/L; however, these concentrations are consistent with documented regional arsenic background concentrations. Concentrations of arsenic in regional Cowlitz county supply wells are available from the Washington Department of Health. Available data for the period 2001 to 2011 range up to approximately 55 µg/L, with a median value of approximately 10 µg/L and a 90 percentile value of 42 µg/L. Chromium, copper, and nickel concentrations were all below the MTCA Method A and B groundwater cleanup levels.
5.3.1.5 Geochemical and Field Parameters
Conventional parameters were measured in the field at the time of groundwater sampling and analyzed for use in groundwater modeling and evaluating site-specific fate and transport processes. Conventional testing performed in 2011 is presented in Table 5-9 and include water quality parameters and select dissolved metals (e.g., iron and magnesium). Sulfate and chloride both have secondary MCL criteria and have been previously detected at the site. Groundwater results for both sulfate and chloride were well below the secondary MCL values of 250 mg/L and 230 mg/L, respectively. The maximum sulfate concentration was 164 mg/L (RL-2S), and the maximum chloride concentration was 66.1 mg/L (G6-D). Groundwater pH values were measured in the field for all West Groundwater Area groundwater samples at the time of collection. In 2011, pH values typically ranged from 6 to 8. Shallow groundwater wells PZ-6 and RL-2S had consistently higher pH values than other West Groundwater Area wells, which ranged from 9.6 to 9.8 for both July and October 2011 sampling events (see Table 5-9).
5.3.2 East Groundwater Area
In the East Groundwater Area, 19 groundwater wells were sampled during both 2011 and 2006 RI activities. Groundwater samples collected for dissolved analyses were field filtered during collection. Figure 3-2 presents the monitoring well locations, and Tables 5-5, 5-7,
Nature and Extent of Contamination
RI/FS Report March 2012 Former Reynolds Metals Reduction Plant 56 110730-02
and 5-10 present the groundwater sampling results for East Groundwater Area monitoring wells for cyanide and fluoride, PAHs, and geochemical parameters, respectively. Groundwater results were evaluated using the screening levels outlined in Section 5.1.
5.3.2.1 Cyanide
The July 2011 and 2006 cyanide testing was analyzed on a total, non-filtered basis, while the October 2011 groundwater samples were analyzed for both dissolved (filtered) and total (unfiltered) cyanide concentrations. During the 2011 RI sampling, no East Groundwater Area groundwater samples exceeded the MCL (0.2 mg/L) for free cyanide (see Table 5-5). In previous testing during 2006, one location (PZ-5) had a free cyanide concentration above the MCL at a concentration of 0.211 mg/L. Free cyanide results are presented for both 2011 and 2006 sampling events on Figures 5-3 and 5-4, respectively. In October 2011, all East Groundwater Area groundwater results were also below the surface water screening level (0.0052 mg/L) for dissolved free cyanide, with the exception of PZ-5 (0.0085 mg/L). In comparison to 2006 groundwater results, 2011 East Groundwater Area monitoring wells show decreases in free cyanide concentrations, with no exceedances of the groundwater MCL of 0.2 mg/L during 2011 (see Chart 5-1). The highest 2011 free cyanide concentration in the East Groundwater Area was detected at a concentration of 0.0124 mg/L at PZ-5 (analyzed on a total basis) during the October groundwater sampling event.
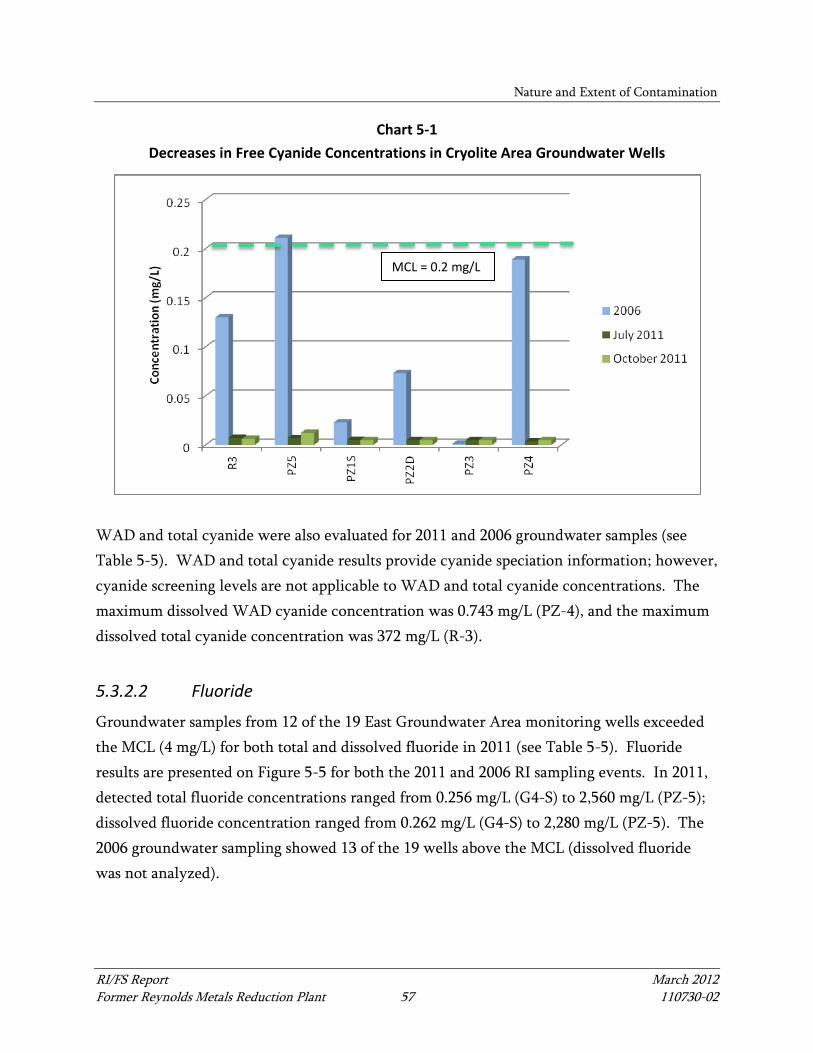
Nature and Extent of Contamination
RI/FS Report March 2012 Former Reynolds Metals Reduction Plant 57 110730-02
Chart 5-1 Decreases in Free Cyanide Concentrations in Cryolite Area Groundwater Wells
WAD and total cyanide were also evaluated for 2011 and 2006 groundwater samples (see Table 5-5). WAD and total cyanide results provide cyanide speciation information; however, cyanide screening levels are not applicable to WAD and total cyanide concentrations. The maximum dissolved WAD cyanide concentration was 0.743 mg/L (PZ-4), and the maximum dissolved total cyanide concentration was 372 mg/L (R-3).
5.3.2.2 Fluoride
Groundwater samples from 12 of the 19 East Groundwater Area monitoring wells exceeded the MCL (4 mg/L) for both total and dissolved fluoride in 2011 (see Table 5-5). Fluoride results are presented on Figure 5-5 for both the 2011 and 2006 RI sampling events. In 2011, detected total fluoride concentrations ranged from 0.256 mg/L (G4-S) to 2,560 mg/L (PZ-5); dissolved fluoride concentration ranged from 0.262 mg/L (G4-S) to 2,280 mg/L (PZ-5). The 2006 groundwater sampling showed 13 of the 19 wells above the MCL (dissolved fluoride was not analyzed).
MCL = 0.2 mg/L
Nature and Extent of Contamination
RI/FS Report March 2012 Former Reynolds Metals Reduction Plant 58 110730-02
The most elevated fluoride concentrations in site groundwater are located east of the former Cryolite Plant. The elevated fluoride concentrations in groundwater of this area correlates with the presence of deposits of fluoride-containing soils, historical discharges of alkaline fluoride-containing waters to on-site ditches in this area, and areas of alkaline groundwater with groundwater pH in excess of 10 in some areas. Factors affecting fluoride mobility in this area were evaluated in detail as part of site geochemical evaluations (see Section 6.2).
5.3.2.3 Polycyclic Aromatic Hydrocarbon s
Groundwater samples were analyzed for PAHs from 13 East Groundwater Area monitoring wells, as presented in Table 5-7 between the 2011 and 2006 RI activities. PAH results are presented in Table 5-7. All cPAH groundwater results were below the cPAH screening level of 0.1 µg/L, with the exception of one of three samples analyzed form PZ-1 (0.15 µg/l; July 2011) and three of three samples analyzed form PZ-4 (0.16 µg/L). Well PZ-4 is located within an area known to contain elevated fluoride and PAH concentrations, and cPAH concentrations in excess have been noted during previous testing.
5.3.2.4 Geochemical and Field Parameters
Conventional parameters were measured in the field at the time of groundwater sampling and analyzed for use in groundwater modeling and evaluating site-specific fate and transport processes. Conventional testing performed in 2011 is presented in Table 5-10 and include water quality parameters (sulfate, chloride, and geochemical parameters) and selected dissolved metals (e.g., iron and magnesium). Groundwater pH values were measured in the field for all East Groundwater Area groundwater samples at the time of collection. In 2011, pH values typically ranged from 6 to 8. Locations east of the former Cryolite Plant had consistently higher pH values, which ranged from 9.36 to 10.51 for both July and October 2011 sampling events (see Table 5-10).
5.4 Soil Quality
RI soil sampling was performed in target areas identified from previous investigations and cleanup actions and based on review of historical aerial photographs and former Reynolds personnel interviews. Based on soil sampling results, three new monitoring wells were
Nature and Extent of Contamination
RI/FS Report March 2012 Former Reynolds Metals Reduction Plant 59 110730-02
installed to assess the soil-to-groundwater pathway in localized areas. Summary information related to RI soil sampling is provided in Appendix B-4.
5.4.1 Rectifier Yards Soils
Soils from the former rectifier yards were sampled in September 2006 to investigate for potential PCB and mercury impacts. A total of six soil samples (RY1 to RY6) were collected. Three samples were collected in each yard (North and South Rectifier Yards; see Figure 3-3). Soils from the rectifier yards had pH values that ranged from 6.4 to 8. PCB concentrations in all soil samples were well below soil screening levels.
5.4.2 North Field Soils
A potential disturbance in north field soils (north of Industrial Way) was identified during a review of historical aerial photos. Soils in this area were sampled in 2006 to investigate for potential impacts by plant waste materials. Soil samples were collected from the 0.5- to 1-foot bgs and 1.5- to 2-foot bgs depth intervals at sampling location S1 (see Figure 3-3). Both soil samples were analyzed for fluoride, cyanide, and PAHs. Testing results were below screening levels.
5.4.3 Floor Sweeps and Old Industrial Landfill Soils
Soils beneath the former floor sweeps landfill and old industrial landfills were investigated in 2006 to evaluate underlying the landfill wastes. Soil sample locations are shown on Figure 3-3, and Table 5-12 presents the analytical results for these soil samples. Results from samples S2 (floor sweeps landfill) and S3 (old industrial landfill) were well below screening levels for cyanide, fluoride, the 13 priority pollutant metals, PCBs, cPAHs, and VOCs. Soil samples were non-detect for pesticides.
5.4.4 SPLP Testing Results
Four soil samples were collected in February 2007 and submitted for SPLP testing in order to estimate the long-term leaching potential of fluoride and cyanide from former materials deposits. Three samples were collected from the former SPL storage area and floor sweeps landfill area (SPLP 1, 2, and 3). The fourth was collected from the Black Mud Pond located
Nature and Extent of Contamination
RI/FS Report March 2012 Former Reynolds Metals Reduction Plant 60 110730-02
on the eastern portion of the site (SPLP 4). Figure 3-3 presents the SPLP sampling locations. Testing results are presented in Table 5-13. Subsequent lysimeter installation and sampling (see Section 5.5) was performed to provide a more robust estimate of material leaching potential.
5.4.5 Field Southwest of Cable Plant (SSA 1)
Eight test pits were excavated in the area southwest of the Cable Plant, as shown in Figure 3-3 to investigate potential occurrence of smelter wastes in fill soils. Consistent with the Work Plan Addendum (Anchor QEA 2011a) the soils were inspected for the occurrence of dark colored soils that might be indicative of plant wastes such as black mud or underflow solids. Dark soils were noted in two of the eight test pits (AQ-SSA1-03 and AQ-SSA1-06), but the appearance of the soils was inconsistent with plant wastes. Samples of the dark colored soils were tested for fluoride, cyanide, and PAH compounds. Results of testing are presented in Table 5-14. Concentrations of cyanide, fluoride, and PAHs were well below soil screening levels and indicated that the soils did not contain former smelter wastes.
5.4.6 Thin Stillage Application Areas (SSA 2)
Soil samples were collected from areas known to have received land application of thin stillage. Samples of soil were also collected from two reference areas located outside of the CDID levee in areas that did not receive thin stillage applications. Nutrient concentrations measured in each test pit and reference sample are reported in Table 5-15. The range of nutrient concentrations (nitrogen, phosphorous, organic carbon, and potassium) measured in the test samples was not significantly different than the range measured in the reference area samples.
5.4.7 Northwest Site Area Soils (SSA 3)
Test pits were conducted in the northwest site area to verify that no plant wastes were located in this area. Visual observations showed no indications of black mud. Grab samples were collected from each test pit representing the 2- to 3-foot bgs soil interval and submitted for chemical analysis. Results are presented in Table 5-16. The submitted samples were
Nature and Extent of Contamination
RI/FS Report March 2012 Former Reynolds Metals Reduction Plant 61 110730-02
analyzed for fluoride and cyanide (total and WAD), which are the constituents observed in nearby shallow groundwater monitoring wells. A summary of the SSA 3 test pit sampling and observations is included in Appendix B-4, and analytical results are presented in Table 5-16. Testing results showed total cyanide detections in two of the eight test pits (AQ-SSA3-03 and AQ-SSA3-04), with a concentration of 0.37 and 8.8 mg/kg. WAD cyanide was detected in one test pit (AQ-SSA3-04) at a concentration of 0.52 mg/kg. Fluoride was detected in all test pits with concentrations ranging from 301 to 864 mg/kg. These concentrations are well below those typical of smelter wastes such as black mud, which typically contain fluoride concentrations in excess of 1 percent (10,000 mg/kg).
5.4.8 Flat Storage Area (SSA 4)
Soil samples were collected from each of 11 sampling locations within the flat storage area. Soil analytical results are presented in Table 5-17a, and a summary of the flat storage area soil and groundwater results is presented on Figure 5-6. The first two soil sample intervals from each location were analyzed for PAHs, as an indicator of pet-coke contamination. No exceedances of soil screening levels were noted in any soil samples except at location AQ-SSA4-05. At that location, two additional soil samples were collected from below the first two sample intervals (2- to 3- and 3- to 4-foot bgs). The total cPAH concentrations in the deepest sample (4.5 µg/kg; 3 to 4 feet bgs) is below the soil screening level. One downgradient existing well (RL-4S) and one downgradient new well (SSA4-MW-01) were both sampled to evaluate the presence of PAHs in groundwater. Analytical testing results are presented in Table 5-17b. Groundwater sampling was conducted in both the July and October 2011 events for well RL-4S. Groundwater sampling of well SSA4-MW-01 was conducted after well installation. None of the groundwater samples exceeded the groundwater screening levels for cPAH concentrations.
5.4.9 Casting Pit Soils (SSA 5)
Six soil borings were completed within the casting pits to evaluate the potential presence of impacted fill materials in pit backfill. Observations showed no indications of disposed material or impacted fill. Soil testing results are presented in Table 5-18 and are consistent
Nature and Extent of Contamination
RI/FS Report March 2012 Former Reynolds Metals Reduction Plant 62 110730-02
with observations at the time of investigation. None of the analytes measured in the soil samples exceeded soils screening levels. Soil fluoride concentrations ranged between 163 and 298 mg/kg, well below the concentrations typical of smelter plant wastes or byproducts.
5.4.10 HTM Oil Area (SSA 6)
A total of 27 soil samples were analyzed for NWTPH-Dx, with silica gel cleanup to assess petroleum concentrations in the HTM oil cleanup area. As described in Section 2, the HTM Oil is a heat transfer medium similar to mineral oil. This area was subject to a previous cleanup action initiated by Chinook. Soil sample testing results are presented in Table 5-19a and include both NWTPH-Dx and EPH results. A summary of the soil and groundwater testing results in the HTM Oil Area is presented on Figure 5-7. Sampling and analysis included a minimum of two soil samples collected from each boring; additional samples were collected when potentially impacted soil intervals were observed. Three locations indicated TPH concentrations exceeding the preliminary soil TPH screening level (2,000 mg/kg), with concentrations ranging from 2,220 mg/kg to 6,580 mg/kg. Based on the NWTPH-Dx results, three soil sample intervals were analyzed for EPH to provide information for developing site-specific TPH cleanup levels for the HTM-oil release. Results of EPH testing were used along with Ecology’s TPH Workbook to develop a site-specific cleanup level (see Appendix E). Results indicated that the TPH concentrations tested were below levels anticipated to pose a direct contact risk or to pose a risk to groundwater quality. A site-specific soil cleanup level of 12,050 mg/kg was developed based on protection of direct contact for unrestricted land use and for protection of groundwater quality (Appendix E). Ecology required that a new groundwater monitoring well, SSA6-MW-01 be installed in January 2011 to verify the lack of petroleum impacts to groundwater. Groundwater testing results are presented in Table 5-19b and shown on Figure 5-7. No exceedances of groundwater screening levels were noted in the sampling data from this well. Diesel range hydrocarbons were detected at 0.08 mg/L, and motor oil range hydrocarbons were detected
Nature and Extent of Contamination
RI/FS Report March 2012 Former Reynolds Metals Reduction Plant 63 110730-02
at 0.15 mg/L, well below the applicable groundwater cleanup levels. EPH was also tested for this groundwater sample, but EPH concentrations were below method detection limits.
5.4.11 Southeastern Fill Area (SSA 7)
Test pits were excavated in ten locations within SSA-7 to assess the potential presence of former smelter plant wastes or other impacted materials. Construction debris with potentially impacted fill materials was observed in five of the ten test pits within the southeastern fill area. The test pit locations and the approximate extent of the impacted fill material is presented on Figure 5-8. The following fill material composition and associated test pits was observed:
• No impacted fill observed. The fill consists of native sand or silt with no construction or plant process waste (AQ-SSA7-01, -02, -08, -09, and -10).
• Construction debris. The fill consists of general construction debris, including concrete or bricks (AQ-SSA7-03).
• Plant process waste. The fill consists of plant process waste, including apparent carbon anodes and other process materials, as observed by former Reynolds staff (AQ-SSA7-04, -05, -06, and -07).
Soil sampling and testing was performed in the ten test pits within SSA 7, as summarized in Appendix B-4. Soil sampling targeted observed non-native material, with additional soil samples collected above and below the apparent fill interval. Analytical testing consisted of PAHs, PCBs, fluoride, sulfate, and total cyanide. Analytical results are presented in Table 5-20a. Test pits in which only native soils were observed were located closer to the river and in the western portion of SSA 7. Soil sampling was performed for the 3- to 4-foot interval for each of these test pits, which was a consistent depth interval where impacted fill material was observed in other test pits. Analytical results are consistent with field observations and indicate non-native fill material is not present in these areas. One test pit (AQ-SSA7-03) had observations of construction debris fill with no observed plant process materials. Construction debris was observed to a depth of approximately 8 to
Nature and Extent of Contamination
RI/FS Report March 2012 Former Reynolds Metals Reduction Plant 64 110730-02
9 feet bgs. In that test pit, cPAHs were detected at a concentration of 7,200 μg/kg. Total PCBs were detected at a concentration of 2.21 mg/kg. Total cyanide and fluoride were detected at concentrations of 4.19 mg/kg and 1,650 mg/kg, respectively. Plant process materials were observed in four test pits (AQ-SSA7-04, -05, -06, and -07), located to the west of the dredged material storage area. Figure 5-8 presents the approximate area of fill containing process materials, which is located generally to the east of the river access road, perpendicular to the dike. This fill was observed to a depth of between approximately 4 and 10 feet bgs and varied depending on the location of the test pit in relation to the dike slope toward the river. Analytical results of the observed fill material indicated a maximum cPAH concentration of 12,000 μg/kg. Fluoride concentrations ranged from 1,140 to 31,700 mg/kg, and total cyanide concentrations ranged from 1.7 to 24.4 mg/kg. The maximum total PCBs concentration was detected at 0.86 mg/kg. A new groundwater monitoring well, SSA7-MW-01, was installed in between the test pits where impacted fill was observed and the Columbia River. This well was used to investigate groundwater quality along the potential migration pathway between the fill area and the river area (see Figure 5-8). Groundwater results indicated a fluoride concentration of 8.4 mg/L, just above the screening level of 4.0 mg/L. Other constituents were either not detected or were well below applicable screening levels. Neither free cyanide nor PCBs were detected.
5.5 Lysimeter Sampling Results
Lysimeters were installed in target material deposits (see Figure 3-4) to evaluate concentrations of fluoride partitioning between soils and porewater. Target materials included the former SPL storage area, floor sweeps landfill, White Mud Pond, and black mud deposits in both the East Groundwater Area and West Groundwater Area. Soil samples were collected within the target material during lysimeter installation. Porewater samples were subsequently collected. Lysimeter soil and porewater analytical results are presented in Table 5-21.
Nature and Extent of Contamination
RI/FS Report March 2012 Former Reynolds Metals Reduction Plant 65 110730-02
In October 2006, three lysimeters (LYS1-LYS3) were installed and sampled in the former floor sweeps landfill and former SPL storage areas. These lysimeters were installed between 0.5 to 1 foot bgs and were sampled for soil from the auger cuttings and for water during three events in October 2006. Lysimeter soil samples were analyzed for cyanide (total and WAD) and fluoride. Porewater samples from the lysimeters were also analyzed for cyanide (free, WAD, and total) and fluoride. In December 2011, eight additional lysimeters (GC-LY-01 through -08) were installed in the following areas: the East Groundwater Area Black Mud Ponds (GC-LY-03 and -04), White Mud Pond (GC-LY-01 and -02), area east of the former Cryolite Plant (GC-LY-05 and -06), and the black mud deposits (GC-LY-07 and 08; see Figure 3-4). Porewater was sampled from the lysimeters during two events in January 2012; soil was sampled from the auger cuttings during installation. Soil samples were collected from the target materials in contact with the ceramic cup of each lysimeter. These lysimeters were installed at depths between 1.4 to 4.6 feet bgs, depending on the depth of the target material. Soil and porewater testing for target material deposits and are presented in Table 5-21. Fluoride results from soil samples ranged from 2,740 mg/kg (GC-LY-06) to 65,000 mg/kg (GC-LY-01). The implications of the lysimeter data are discussed further in Section 6.2.
5.6 Geochemical Test Boring Results
Four test borings were placed at the locations east of the former Cryolite Plant, as shown in Figure 3-4. These borings were used to collect soil test samples for geochemical testing. Soil samples from the borings were initially tested for fluoride, TOC, pH, and total solids. The data from these analyses are shown in Table 5-22.
Nature and Extent of Contamination
RI/FS Report March 2012 Former Reynolds Metals Reduction Plant 66 110730-02
Results confirmed the presence of soils containing elevated fluoride concentrations in the upper (fewer than 7.5 feet bgs) soil samples from the first three borings (GC-SB-01, GC-SB-02, GC-SB-03) borings. The concentrations of fluoride in the shallow soil samples from these borings ranged up to 5.4 percent. Below 7.5 feet bgs, the fluoride concentrations decreased rapidly with depth. Fluoride concentrations in the northernmost boring (GC-SB-04) were very low, ranging from 0.0163 to 0.0321 percent. Subsamples from the geochemical test borings were used for evaluation of soil geochemical properties. That work is described separately in Section 6.2 and in Appendix F.
RI/FS Report March 2012 Former Reynolds Metals Reduction Plant 67 110730-02
6 FATE AND TRANSPORT EVALUATION
This section summarizes assessment activities performed as part of the RI to characterize the fate and transport properties of fluoride in site soils and groundwater. These assessment activities use data from field and laboratory testing, and integrated geochemical and hydrogeologic modeling. As discussed in Section 5, fluoride is the primary COC for groundwater at both the West and East Groundwater Areas. The factors affecting the transport and attenuation of fluoride in groundwater at the site were developed, based on a synthesis of geochemical, hydrogeological, and other data. The fate and transport work included detailed evaluations of natural processes occurring along potential contaminant migration pathways, including each of the following:
• Geochemical factors limiting the leaching of fluoride from source area soils (areas of elevated fluoride concentrations) to groundwater (see Section 6.1)
• Natural geochemical and hydrogeologic processes affecting the fate of fluoride in saturated soils and groundwater downgradient of source area soils (see Section 6.2)
• Geochemical and other interactions occurring at the point of exchange between groundwater and ditch water (see Section 6.3), and between groundwater and surface water in the Columbia River (see Section 6.4)
Most of the data used in the fate and transport evaluations is presented in Sections 4 and 5. Site hydrogeologic information was presented in Section 4, including groundwater gradients, surface water and ditch water elevations, and aquifer properties. Section 5 presented the chemical testing data for fluoride and for selected geochemical properties measured in site soils. Also presented in Section 5 are soil porewater data collected from lysimeters, groundwater data, and data from ditch water and surface water. Additional data collected specifically to inform the fate and transport analyses are presented in Appendix F. Mineralogical testing data presented in that appendix provides information used to assess fluoride attenuation capacity within site subsurface soils. The data were collected within the East Groundwater Area and included measurement of total fluoride and total organic carbon concentration in site soils, identification of mineral phases by powder X-ray diffraction (XRD) and high-resolution scanning electron microscopy (SEM),
Fate and Transport Evaluation
RI/FS Report March 2012 Former Reynolds Metals Reduction Plant 68 110730-02
quantification of iron, aluminum, and manganese oxides by selective extraction and determination of cation exchange capacity (CEC) and anion exchange capacity (AEC). These data are summarized in Appendix F.
6.1 Processes Controlling Fluoride Leachability in Source Areas
Most fluoride concentrations within site soils are low, well below MTCA direct-contact screening levels for unrestricted and industrial land use. However, there are several areas within the site where soils contain elevated concentrations of fluoride (typically at fluoride concentrations between 1 and 6 percent) from former smelter operations and where closure or remediation work has not been completed. Identified areas containing source-area soils with elevated fluoride levels and that were included in the geochemical testing program included the following:
• Black mud deposits located in southwest and eastern portion of the site • White mud deposit located in the northeast portion of the site • Area east of the former Cryolite Recovery Plant
Other potential source areas investigated as part of the RI included the floor sweeps landfill, the southeastern debris fill area, and the former SPL storage area. Previous soil testing data from floor sweeps landfill indicated fluoride concentrations were less than 0.2 percent in these soils. Testing in the southeastern debris fill area included analysis of soil and groundwater concentrations, but geochemical testing has not been performed for these soils. Testing data collected in the former SPL storage area have shown that previous actions successfully removed source area soils from that third area. None of the borings conducted in the former SPL area identified plant wastes or soils containing elevated (i.e., percent levels) fluoride concentrations. For the black mud deposits, white mud deposits, and the area east of the former cryolite plant, testing was performed to evaluate the factors controlling the leaching of fluoride from remaining source area soils. Leaching can occur when the soils contact either precipitation (i.e., rainwater) or groundwater. Rates of leaching are controlled by the properties of the soil, including a number of chemical reactions occurring between fluoride and other naturally occurring groundwater and soil components (such as calcium, phosphate, and iron).
Fate and Transport Evaluation
RI/FS Report March 2012 Former Reynolds Metals Reduction Plant 69 110730-02
These soil properties and the associated chemical reactions tend to restrict fluoride mobility by limiting dissolved fluoride concentrations. Solubility controls on fluoride leachability were evaluated through the following: 1) direct measurement of porewater concentrations; 2) a review of the material composition; and 3) chemical speciation modeling performed using the porewater geochemical data. Some testing using lysimeters and SPLP testing was also performed in the former SPL storage area, though that testing was more limited. The following sections (Section 6.1.1 through 6.1.4) describe the findings of the source-area soil leachability testing.
6.1.1 Black Mud Deposits
Black mud was generated during the operation of the on-site cryolite recovery process. Historical analyses of black mud indicate that it typically includes the following principal constituents (chemical composition and constituent concentrations can vary):
• Calcium carbonate (approximately 48 percent) • Alumina (16 percent) • Carbon (12 percent) • Fluoride compounds (up to 8 percent) of which calcium fluoride (fluorite) is a
significant proportion (3 percent) • Sodium (3 percent) • Iron (0.7 percent) • Sulfate (0.3 percent)
During the site RI, dissolved fluoride concentrations were measured directly in porewater samples collected from lysimeters placed within on-site black mud deposits. Two of these lysimeters were installed in the black mud ponds in the East Groundwater Area (GC-LY-04 and GC-LY-05), and two were installed in the black mud deposits in the southwest portion of the site (GC-LY-07 and GC-LY-08). Soil fluoride concentrations in these black mud materials ranged from 2 to 6 percent. The dissolved fluoride concentrations in the soil porewater as measured in the lysimeters were relatively low, ranging from 47.8 to 80 mg/L.
Fate and Transport Evaluation
RI/FS Report March 2012 Former Reynolds Metals Reduction Plant 70 110730-02
Geochemical speciation modeling results indicate that the black mud porewaters are consistently under saturated with respect to relatively soluble fluoride species such as sodium fluoride (NaF) and cryolite (Na3AlF6) but are slightly supersaturated or close to equilibrium with respect to fluorite (CaF2). This indicates that any residual soluble fluorides originally present in black mud (e.g., cryolite) would tend to dissolve into the porewater within these deposits but that dissolved fluoride concentrations are controlled by the precipitation of fluorite once its solubility is reached, according to the following reaction:
Dissolved calcium concentrations in the black mud lysimeters range from 2.4 to 40.7 mg/L. The calcium needed for precipitation of fluoride is provided by dissolution of the abundant calcium carbonate (calcite) present in the black mud, according to the following reaction:
Speciation modeling results show that the black mud porewaters are generally moderately under saturated with respect to calcite, indicating conditions are favorable to its dissolution, thereby providing a continuous supply of dissolved calcium to porewater, as it is simultaneously removed by precipitation of fluorite. Based on the calcium carbonate content of the black mud, the amount of calcite available far exceeds what would be required to sequester all the fluoride present in the black mud as fluorite. SPLP leach testing was conducted in 2007 on a shallow sample (SPLP4) collected from the Black Mud Pond in the East Groundwater Area. While the total fluoride concentration was 29,500 mg/kg, the leachate concentration was 18.0 mg/L. Total fluoride concentrations in soil samples co-located with lysimeters in the black mud deposits range from 16,000 to 61,800 mg/kg. Kd for fluoride calculated according to the following equation, where Cs is the soil concentration (mg/kg) and Cw is the dissolved concentration (mg/L):
Fate and Transport Evaluation
RI/FS Report March 2012 Former Reynolds Metals Reduction Plant 71 110730-02
Soil Kd estimates do not represent the complexities of the factors affecting fluoride leachability. However, they do provide a quantitative estimate of the effectiveness of fluoride solubility in limiting leaching. As shown in Table 6-1, the calculated Kds for the black mud samples ranged from 204 to 1,093 liters per kilogram (L/kg) for the lysimeters and 1,639 for the SPLP test sample, with an overall average of 880 L/kg for the lysimeter and SPLP data combined. These values are reasonable given the calcium-mediated limitations on fluorite solubility and the excess of calcium present in the materials.
6.1.2 White Mud Pond
White mud was also produced during the cryolite recovery process, specifically from the production of sodium hydroxide (for use in the recovery process) from limestone. The typical composition of white mud includes the following principal constituents:
• Calcium carbonate (approximately 82 percent) • Calcium fluoride (up to 9 percent) • Sodium (2 percent)
Dissolved fluoride concentrations in white mud pond porewater samples were measured directly from two lysimeters installed within the white mud at locations GC-LY-01 and GC-LY-02. The measured fluoride concentrations in the collected porewater ranged from 88.5 to 94 mg/L. Geochemical speciation modeling results for white mud porewater indicate that porewater in the white mud is close to equilibrium with respect to both fluorite and calcite. Dissolved fluoride concentrations in the white mud porewater are controlled by the solubility of fluorite. This is similar to the conditions present in the Black Mud Ponds. The slightly higher fluoride concentrations relative to black mud porewaters are explained by the lower dissolved calcium concentrations (1.1 to 1.5 mg/L). The lower calcium concentrations in white mud porewater are due to the lower solubility of calcite at the higher pH of the white mud (pH 9.8 to 11.1) relative to black mud (pH 7.4 to 8.7).
Fate and Transport Evaluation
RI/FS Report March 2012 Former Reynolds Metals Reduction Plant 72 110730-02
Dissolved fluoride concentrations in equilibrium with fluorite are related to calcium concentrations through the solubility product of fluorite (the square brackets in the following equation denote the activity of dissolved species):
As shown in Table 6-1, the average measured Kd value for the white mud is 682, with a range of 636 to 728 L/kg. These Kd values are similar to those for the black mud, as expected due to the similarity of the processes controlling fluoride transport.
6.1.3 Area East of Former Cryolite Plant
The area located east of the former cryolite plant is more complex than the black mud or white mud deposits. Soils in this area contain deposits of black mud. The area has also been impacted by alkaline discharges to nearby ditches and surface soil. Multiple types of testing have been performed in this area in order to understand factors controlling fluoride leachability from soils and also to understand how soil and groundwater properties affect the potential mobility of fluoride in site soils and groundwater. Dissolved fluoride concentrations in soil porewater samples were measured directly from two lysimeters placed in this area. These were installed at locations GC-LY-05 and GC-LY-06. The measured fluoride concentrations ranged from 73 to 187 mg/L. Soil fluoride concentrations measured in the paired samples collected from the lysimeter installations were 0.27 and 0.64 percent, respectively. However, soil samples collected from other soil borings (GSB-01 and GSB-02) placed in the immediate vicinity as part of geochemical evaluations indicated fluoride soil concentrations in areas close enough to affect soil porewater quality ranged between 0.12 and 4.6 percent. Both this increased variability of soil composition and the presence of elevated groundwater fluoride and alkalinity in this makes the analysis of leaching properties more complex for these materials. Section 6.2 provides a more complete discussion of the factors affecting fluoride mobility in the area east of the former Cryolite Plant.
Fate and Transport Evaluation
RI/FS Report March 2012 Former Reynolds Metals Reduction Plant 73 110730-02
6.1.4 Former Spent Potliner Storage Area
As part of the first round (2006) of RI testing, lysimeter and SPLP testing work was conducted within the former SPL storage area. That testing was conducted in parallel with soil bulk fluoride concentration testing to verify that SPL had been removed from this area successfully and to assess potential fluoride transport properties in this area. This former SPL storage area was formerly used for stockpiling of SPL used in cryolite plant operations. The SPL was formerly stored in on-site stockpiles prior to processing. The composition of SPL typically consists primarily of carbon (13 to 69 percent), with sodium (8.6 to 22 percent), aluminum (7 to 22 percent), fluoride (7 to 22 percent), and lesser amounts of other constituents such as silicon, calcium, and iron (Spiegel and Pelis 1990). As described in Section 2.4, the SPL stockpile was removed in the 1990s, consistent with Ecology requirements after the shutdown of the cryolite plant. Testing performed in the former stockpile area at the time of removal and during subsequent soil investigations has shown that the SPL was successfully removed. However, shallow groundwater in this area remains impacted by elevated fluoride levels associated with the East Groundwater Area. The fluoride concentrations remaining in soils of this area are below MTCA direct contact cleanup levels for unrestricted land use. Measured total fluoride concentrations in soil have ranged up to 0.13 percent, well below the typical fluoride concentrations in the SPL materials (typically 7 to 22 percent), which were previously removed. As shown in Table 5-21, the average dissolved fluoride concentrations in porewater samples collected from two lysimeters at the former SPL storage area (installed and sampled three times in 2006; LYS1 and LYS2) were 34.6 and 59.5 mg/L, respectively. Total fluoride concentrations in co-located soil samples collected during lysimeter installation were 523 and 1,310 mg/kg, respectively. These lysimeters were located in an area of very shallow groundwater, and porewater samples collected from these lysimeters may have included contributions from area groundwater. Dissolved calcium concentrations were not measured in the porewater samples, but the dissolved fluoride at LYS2 is consistent with values measured in porewater at other areas where aqueous fluoride concentrations have been shown to be controlled by calcium-
Fate and Transport Evaluation
RI/FS Report March 2012 Former Reynolds Metals Reduction Plant 74 110730-02
mediated fluorite solubility. The lower dissolved fluoride concentration at LYS1 correlates with lower soil fluoride than at LYS2 and may suggests that fluoride leaching from low fluoride soils may be partly controlled by adsorption-desorption reactions on soil components. SPLP testing was also conducted on one shallow soil sample (SPLP3) collected from the former SPL Storage Area (see Table 5-13). That soil sample had a very low total fluoride concentration of 784 mg/kg. Results of SPLP of that soil sample resulted in a leachate concentration of 9.1 mg/L. A preliminary soil-water partitioning coefficient calculated for this result is 86 L/kg. This value is significantly lower than in the black mud and white mud deposits, reflecting the different mechanisms controlling partitioning and leaching from soils with lower total fluoride concentrations.
6.1.5 Summary of Factors Controlling Source-Area Leachability
The leachability of fluoride from materials with high fluoride content such as black mud and white mud present in source areas is primarily limited by fluorite (calcium fluoride) solubility, which regulates dissolved fluoride concentrations. This process relies on a source of calcium, which is present in these materials as calcium carbonate. The quantities of calcium carbonate in black mud and white mud exceed the fluoride concentrations indicating the possibility of sequestering essentially all of the fluoride as fluorite in these materials. Adsorption-desorption reactions also appear to be operating but only appear to be a controlling factor for leaching from soils with relatively low total fluoride concentrations where fluorite solubility may not be exceeded in porewater. Expressed as a Kd, the average Kd for black mud and white mud is 823 L/kg (see Table 6-1).
6.2 Geochemical Processes Occurring in Site Soils and Groundwater
A detailed analysis of site geochemical processes was performed within a test area established in a portion of the East Groundwater Area (see Figure 6-1). This test area was selected for detailed evaluation based on the following considerations:
• This area includes shallow deposits of soil containing elevated fluoride concentrations, so both desorption and transport processes can be evaluated in this area.
Fate and Transport Evaluation
RI/FS Report March 2012 Former Reynolds Metals Reduction Plant 75 110730-02
• The highest fluoride concentrations in groundwater are located in this area, and extensive groundwater data exist both within and downgradient of the area.
• Groundwater gradients are well defined in this area and are understood both vertically and horizontally.
• Groundwater fluoride concentrations attenuate rapidly with distance along the groundwater transport pathway, providing an opportunity to assess geochemical properties across a range of fluoride concentrations.
• Extensive groundwater testing data are available, including characterization of geochemical parameters.
Within the test area, extensive information for soils and groundwater were combined to evaluate the different processes occurring that impact both fluoride leaching/mobility, as well as its potential transport attenuation through groundwater and aquifer solids. After a summary of background conditions within the test area, the different geochemical processes identified are described separately for ease of discussion in Sections 6.2.2 through 6.2.5. Refer to Section 6.1.3 for a discussion of leaching test data applicable to this area:
• Section 6.2.1: Geochemical Test Area Conditions and Test Methods • Section 6.2.2: Precipitation of Fluorite • Section 6.2.3: Precipitation of Fluorophosphate Minerals • Section 6.2.4: Anion Exchange on Clays • Section 6.2.5: Adsorption on Aluminum and Iron Oxides
6.2.1 Geochemical Test Area Conditions and Test Methods
Figure 6-1 provides the location of the geochemical test area. Shallow groundwater quality in the area is the result of both the presence of fluoride-containing soils (generally present 1 to 7.5 feet bgs) and also of historical fluoride and alkalinity releases in aqueous phase during historical cryolite plant operations. Test area groundwater contains elevated concentrations of both dissolved fluoride and sodium. The groundwater pH in a portion of the test area is more alkaline (pH ranges from less than 9 to over 10) than surrounding groundwater. The groundwater gradients in the test area are well defined, and shallow groundwater flows in a northeasterly direction away from the Columbia River and toward the CDID ditch
Fate and Transport Evaluation
RI/FS Report March 2012 Former Reynolds Metals Reduction Plant 76 110730-02
located north of the site (see Figure 4-3). Vertical groundwater gradients in this area are generally upward. As discussed in Section 4, groundwater elevation data collected at the site show that in both the West and East Groundwater Areas, groundwater in the upper alluvium WBZ north of the CDID levee dike flows to the north, northwest, and/or northeast and ultimately discharges into the CDID ditch system (see Figure 4-3). In the vicinity of the CDID and on-site ditches, the upper alluvium WBZ is characterized by upward gradients, due to influences of the ditch system. Groundwater elevations in both the shallow and deeper wells completed in the upper alluvium WBZ are higher than surface water elevations in the nearby ditches, indicating upper alluvium groundwater ultimately discharges to the CDID ditch system. Away from the Columbia River and CDID ditches, vertical hydraulic gradients across the site tend to be weak, consistent with predominantly horizontal groundwater flow. The major mineralogy of natural alluvial soils at the site consists of quartz, plagioclase (calcium-rich) feldspar, alkali (sodium or potassium) feldspar, and smectite clay (montmorillonite). Calcium and magnesium are the predominant exchangeable cations in native montmorillonite. Iron, aluminum, and manganese oxides are also ubiquitously present in varying amounts and likely form surface coatings on the other mineral particles. Geochemical testing included installation of four soil borings that were advanced to 20 feet bgs along a south-north transect following the northerly groundwater flow direction. The transect provides for assessment of soil and groundwater geochemical processes occurring along the primary migration pathway, north toward the CDID ditch. As shown in Figure 6-1, the borings extended from the cryolite ditches near PZ-1 to a location downgradient of PZ-4 (GC-SB-01 to GC-SB-04; see Figure 3-4). No fluoride migration has been noted past location PZ-4 during RI groundwater sampling. At each of the four test borings, soil samples were collected at 2.5 foot depth intervals to a total depth of 20 feet. Selected samples were analyzed for mineralogical and geochemical characteristics to identify the forms of fluoride present and quantify soil constituents that are available to react with it and limit its mobility in groundwater. Fluoride leaching data presented in Section 6.1 and groundwater data presented in Section 5 were also used as part of the geochemical evaluations described subsequently and in Appendix F.
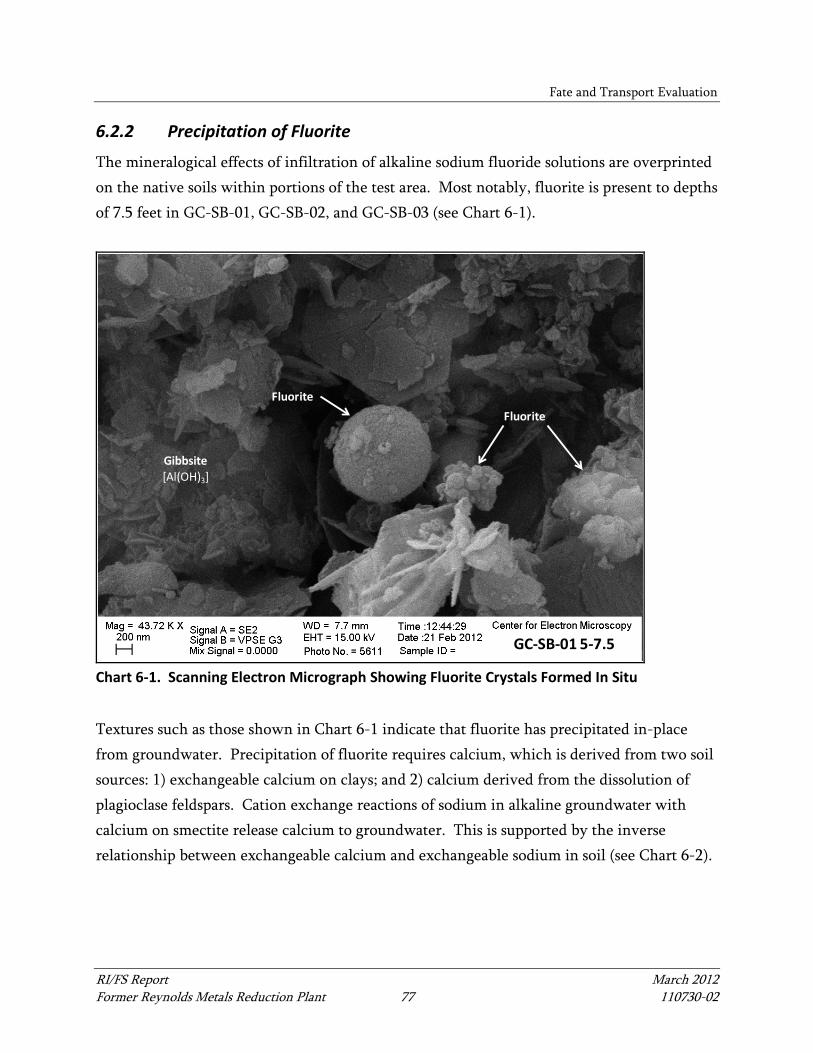
Fate and Transport Evaluation
RI/FS Report March 2012 Former Reynolds Metals Reduction Plant 77 110730-02
6.2.2 Precipitation of Fluorite
The mineralogical effects of infiltration of alkaline sodium fluoride solutions are overprinted on the native soils within portions of the test area. Most notably, fluorite is present to depths of 7.5 feet in GC-SB-01, GC-SB-02, and GC-SB-03 (see Chart 6-1).
FluoriteFluorite
Gibbsite[Al(OH)3]
GC-SB-01 5-7.5
Chart 6-1. Scanning Electron Micrograph Showing Fluorite Crystals Formed In Situ
Textures such as those shown in Chart 6-1 indicate that fluorite has precipitated in-place from groundwater. Precipitation of fluorite requires calcium, which is derived from two soil sources: 1) exchangeable calcium on clays; and 2) calcium derived from the dissolution of plagioclase feldspars. Cation exchange reactions of sodium in alkaline groundwater with calcium on smectite release calcium to groundwater. This is supported by the inverse relationship between exchangeable calcium and exchangeable sodium in soil (see Chart 6-2).
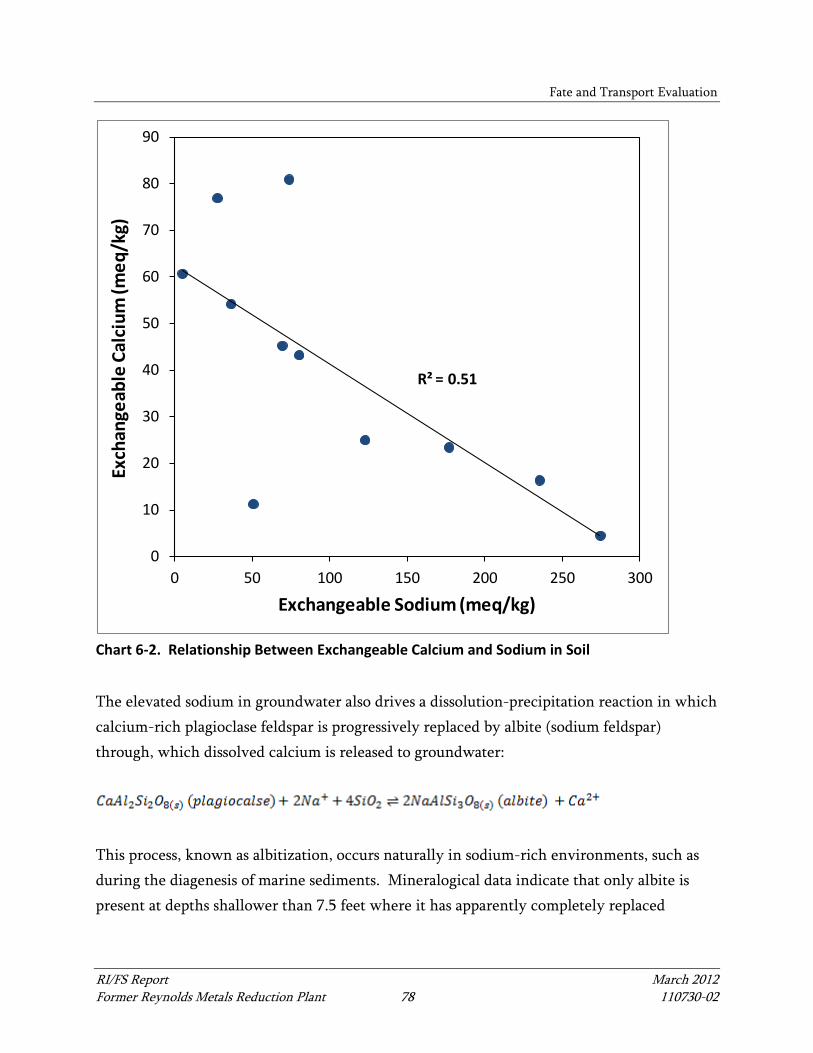
Fate and Transport Evaluation
RI/FS Report March 2012 Former Reynolds Metals Reduction Plant 78 110730-02
R² = 0.51
0
10
20
30
40
50
60
70
80
90
0 50 100 150 200 250 300
Exch
ange
able
Cal
cium
(meq
/kg)
Exchangeable Sodium (meq/kg)
Chart 6-2. Relationship Between Exchangeable Calcium and Sodium in Soil
The elevated sodium in groundwater also drives a dissolution-precipitation reaction in which calcium-rich plagioclase feldspar is progressively replaced by albite (sodium feldspar) through, which dissolved calcium is released to groundwater:
This process, known as albitization, occurs naturally in sodium-rich environments, such as during the diagenesis of marine sediments. Mineralogical data indicate that only albite is present at depths shallower than 7.5 feet where it has apparently completely replaced
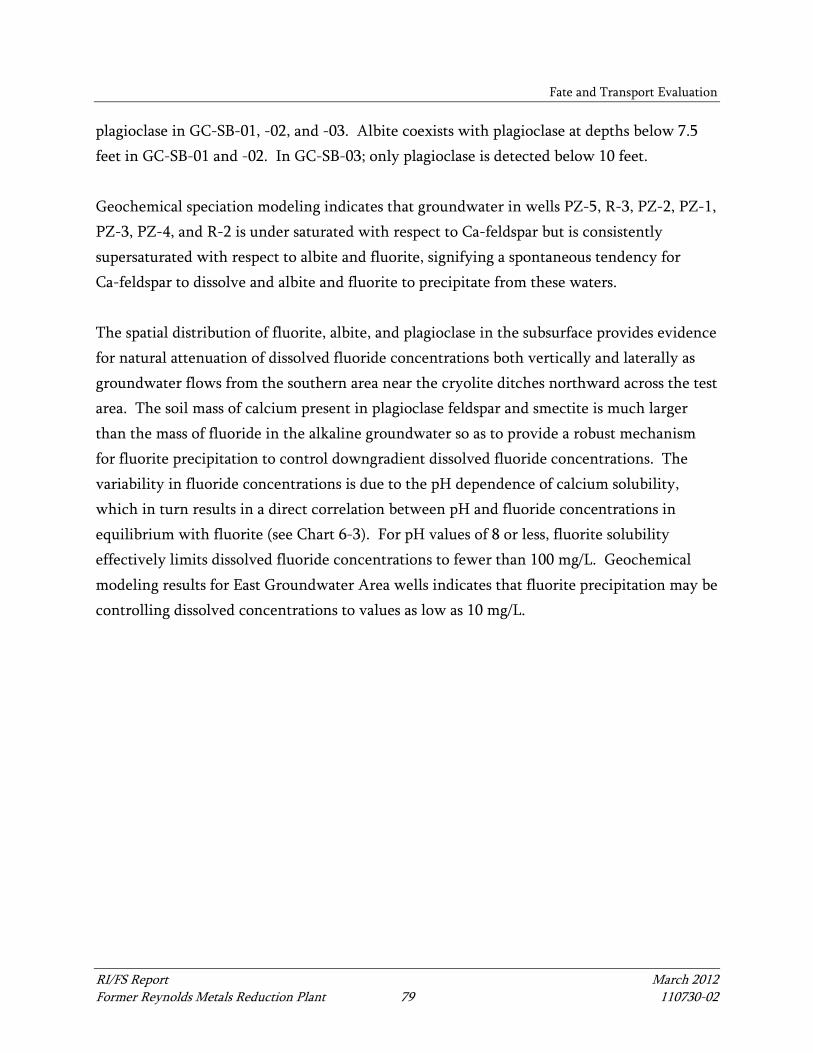
Fate and Transport Evaluation
RI/FS Report March 2012 Former Reynolds Metals Reduction Plant 79 110730-02
plagioclase in GC-SB-01, -02, and -03. Albite coexists with plagioclase at depths below 7.5 feet in GC-SB-01 and -02. In GC-SB-03; only plagioclase is detected below 10 feet. Geochemical speciation modeling indicates that groundwater in wells PZ-5, R-3, PZ-2, PZ-1, PZ-3, PZ-4, and R-2 is under saturated with respect to Ca-feldspar but is consistently supersaturated with respect to albite and fluorite, signifying a spontaneous tendency for Ca-feldspar to dissolve and albite and fluorite to precipitate from these waters. The spatial distribution of fluorite, albite, and plagioclase in the subsurface provides evidence for natural attenuation of dissolved fluoride concentrations both vertically and laterally as groundwater flows from the southern area near the cryolite ditches northward across the test area. The soil mass of calcium present in plagioclase feldspar and smectite is much larger than the mass of fluoride in the alkaline groundwater so as to provide a robust mechanism for fluorite precipitation to control downgradient dissolved fluoride concentrations. The variability in fluoride concentrations is due to the pH dependence of calcium solubility, which in turn results in a direct correlation between pH and fluoride concentrations in equilibrium with fluorite (see Chart 6-3). For pH values of 8 or less, fluorite solubility effectively limits dissolved fluoride concentrations to fewer than 100 mg/L. Geochemical modeling results for East Groundwater Area wells indicates that fluorite precipitation may be controlling dissolved concentrations to values as low as 10 mg/L.
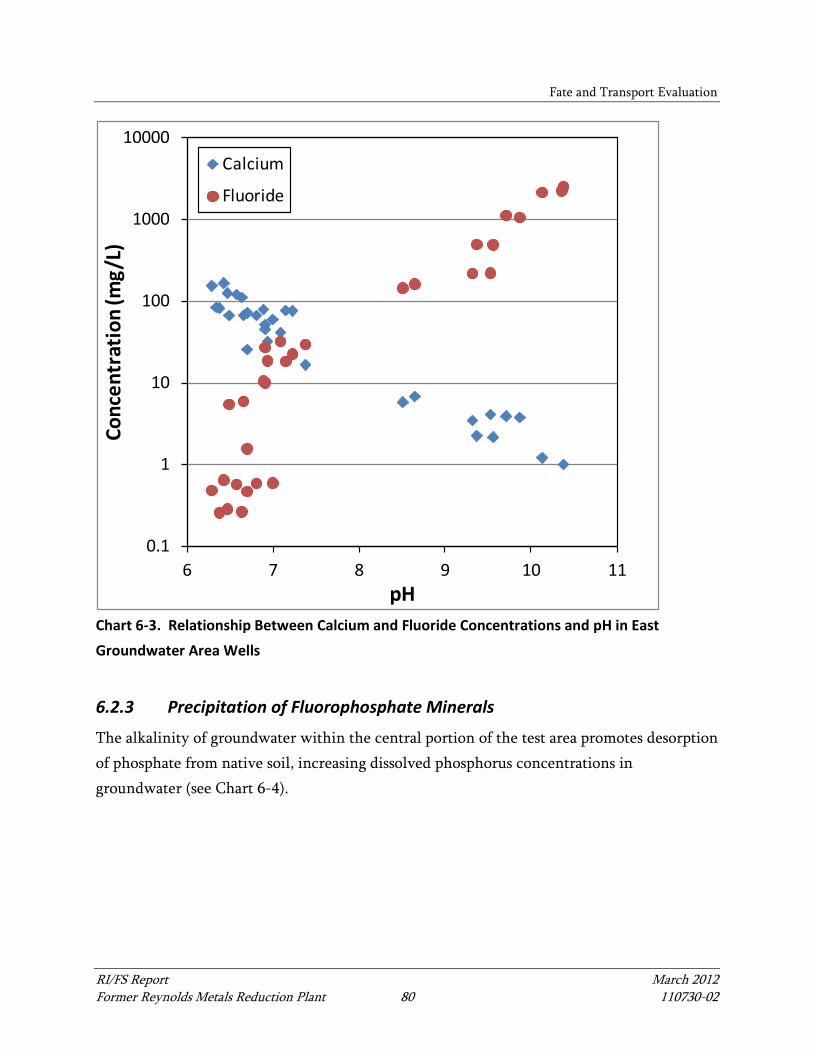
Fate and Transport Evaluation
RI/FS Report March 2012 Former Reynolds Metals Reduction Plant 80 110730-02
0.1
1
10
100
1000
10000
6 7 8 9 10 11
Conc
entr
atio
n (m
g/L)
pH
Calcium
Fluoride
Chart 6-3. Relationship Between Calcium and Fluoride Concentrations and pH in East Groundwater Area Wells
6.2.3 Precipitation of Fluorophosphate Minerals
The alkalinity of groundwater within the central portion of the test area promotes desorption of phosphate from native soil, increasing dissolved phosphorus concentrations in groundwater (see Chart 6-4).
Fate and Transport Evaluation
RI/FS Report March 2012 Former Reynolds Metals Reduction Plant 81 110730-02
0
5
10
15
20
25
30
35
40
6 7 8 9 10 11
Phos
phor
us (m
g/L)
pH Chart 6-4. Dissolved Phosphorus as a Function of pH in East Groundwater Area Wells
Geochemical speciation modeling results show that groundwater in wells PZ-5, R-3, PZ-2, PZ-1, PZ-3, PZ-4, and R-2 is supersaturated with respect to several fluoride-containing phosphate solid phases including fluorapatite, carbonate fluorapatite, and monofluorophosphate (MFP) apatite and indicating the possibility for fluoride removal from groundwater by the following reactions:
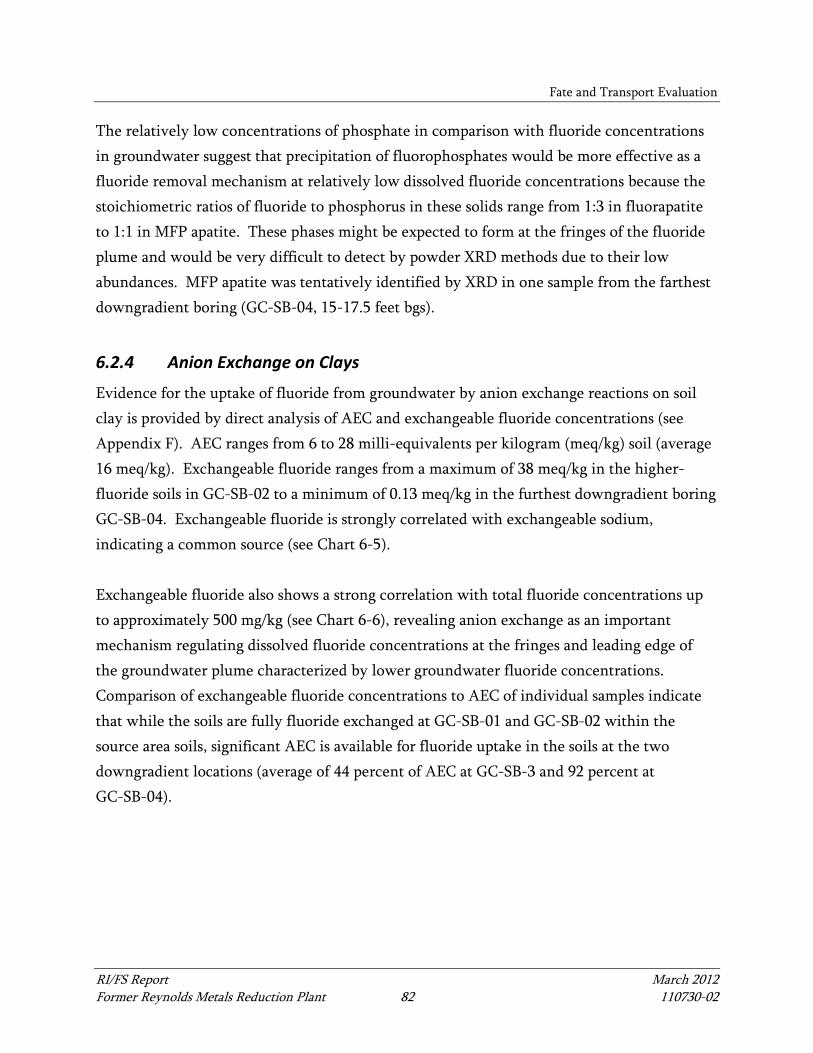
Fate and Transport Evaluation
RI/FS Report March 2012 Former Reynolds Metals Reduction Plant 82 110730-02
The relatively low concentrations of phosphate in comparison with fluoride concentrations in groundwater suggest that precipitation of fluorophosphates would be more effective as a fluoride removal mechanism at relatively low dissolved fluoride concentrations because the stoichiometric ratios of fluoride to phosphorus in these solids range from 1:3 in fluorapatite to 1:1 in MFP apatite. These phases might be expected to form at the fringes of the fluoride plume and would be very difficult to detect by powder XRD methods due to their low abundances. MFP apatite was tentatively identified by XRD in one sample from the farthest downgradient boring (GC-SB-04, 15-17.5 feet bgs).
6.2.4 Anion Exchange on Clays
Evidence for the uptake of fluoride from groundwater by anion exchange reactions on soil clay is provided by direct analysis of AEC and exchangeable fluoride concentrations (see Appendix F). AEC ranges from 6 to 28 milli-equivalents per kilogram (meq/kg) soil (average 16 meq/kg). Exchangeable fluoride ranges from a maximum of 38 meq/kg in the higher-fluoride soils in GC-SB-02 to a minimum of 0.13 meq/kg in the furthest downgradient boring GC-SB-04. Exchangeable fluoride is strongly correlated with exchangeable sodium, indicating a common source (see Chart 6-5). Exchangeable fluoride also shows a strong correlation with total fluoride concentrations up to approximately 500 mg/kg (see Chart 6-6), revealing anion exchange as an important mechanism regulating dissolved fluoride concentrations at the fringes and leading edge of the groundwater plume characterized by lower groundwater fluoride concentrations. Comparison of exchangeable fluoride concentrations to AEC of individual samples indicate that while the soils are fully fluoride exchanged at GC-SB-01 and GC-SB-02 within the source area soils, significant AEC is available for fluoride uptake in the soils at the two downgradient locations (average of 44 percent of AEC at GC-SB-3 and 92 percent at GC-SB-04).
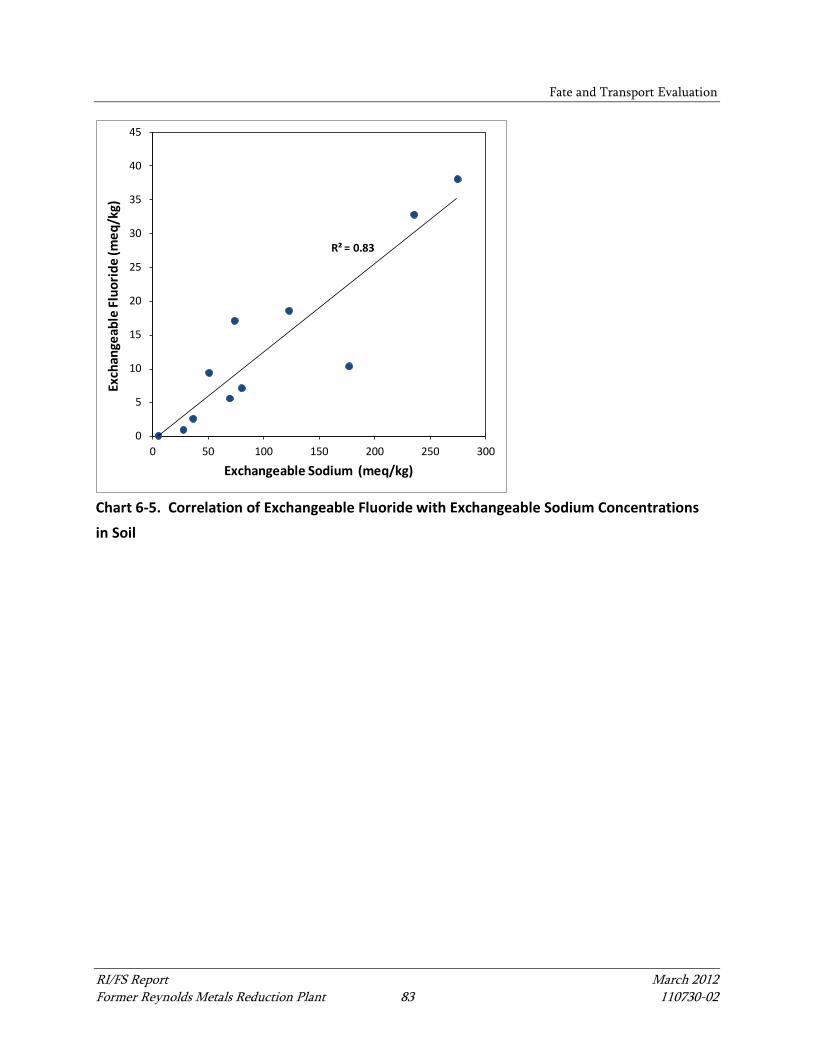
Fate and Transport Evaluation
RI/FS Report March 2012 Former Reynolds Metals Reduction Plant 83 110730-02
R² = 0.83
0
5
10
15
20
25
30
35
40
45
0 50 100 150 200 250 300
Exch
ange
able
Fluo
ride
(meq
/kg)
Exchangeable Sodium (meq/kg)
Chart 6-5. Correlation of Exchangeable Fluoride with Exchangeable Sodium Concentrations in Soil
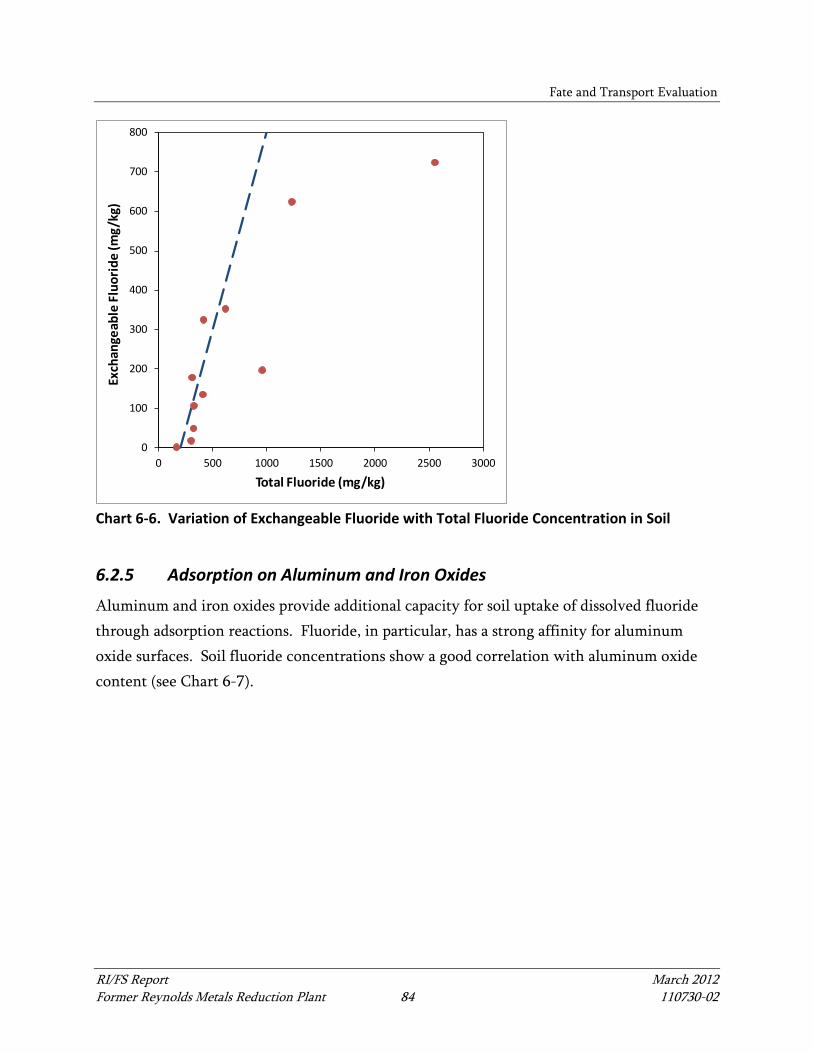
Fate and Transport Evaluation
RI/FS Report March 2012 Former Reynolds Metals Reduction Plant 84 110730-02
0
100
200
300
400
500
600
700
800
0 500 1000 1500 2000 2500 3000
Exch
ange
able
Flu
orid
e (m
g/kg
)
Total Fluoride (mg/kg)
Chart 6-6. Variation of Exchangeable Fluoride with Total Fluoride Concentration in Soil
6.2.5 Adsorption on Aluminum and Iron Oxides
Aluminum and iron oxides provide additional capacity for soil uptake of dissolved fluoride through adsorption reactions. Fluoride, in particular, has a strong affinity for aluminum oxide surfaces. Soil fluoride concentrations show a good correlation with aluminum oxide content (see Chart 6-7).
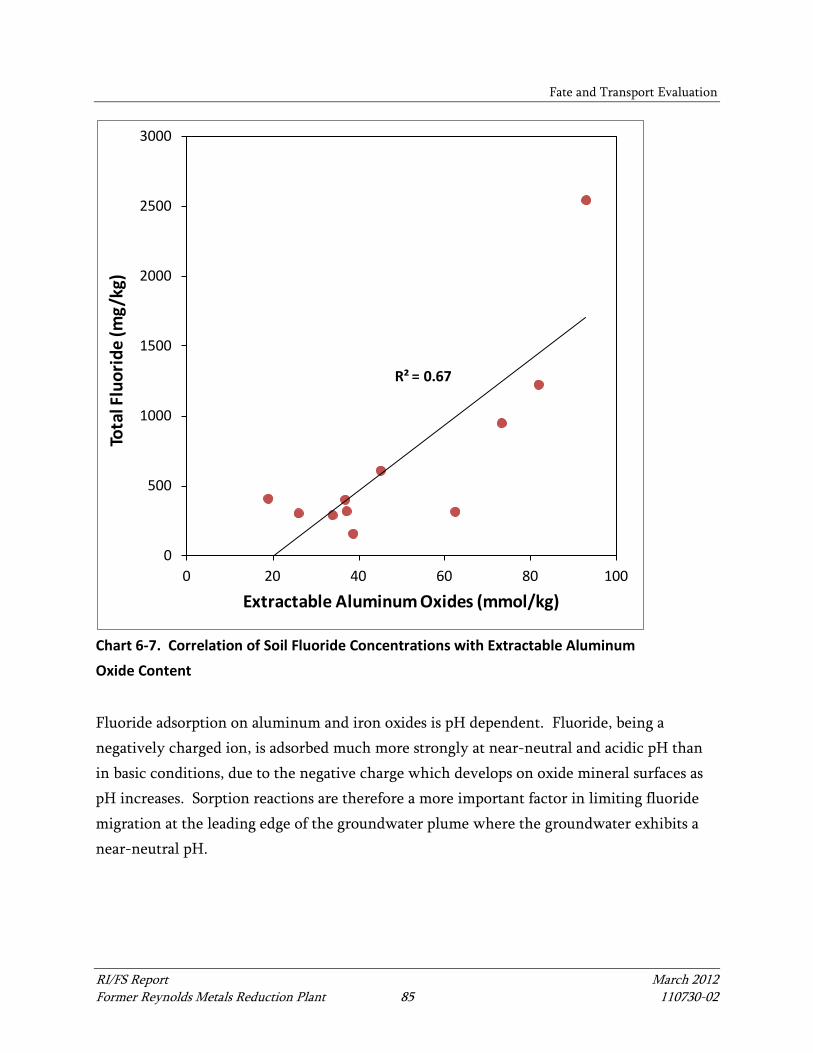
Fate and Transport Evaluation
RI/FS Report March 2012 Former Reynolds Metals Reduction Plant 85 110730-02
R² = 0.67
0
500
1000
1500
2000
2500
3000
0 20 40 60 80 100
Tota
l Flu
orid
e (m
g/kg
)
Extractable Aluminum Oxides (mmol/kg)
Chart 6-7. Correlation of Soil Fluoride Concentrations with Extractable Aluminum Oxide Content
Fluoride adsorption on aluminum and iron oxides is pH dependent. Fluoride, being a negatively charged ion, is adsorbed much more strongly at near-neutral and acidic pH than in basic conditions, due to the negative charge which develops on oxide mineral surfaces as pH increases. Sorption reactions are therefore a more important factor in limiting fluoride migration at the leading edge of the groundwater plume where the groundwater exhibits a near-neutral pH.
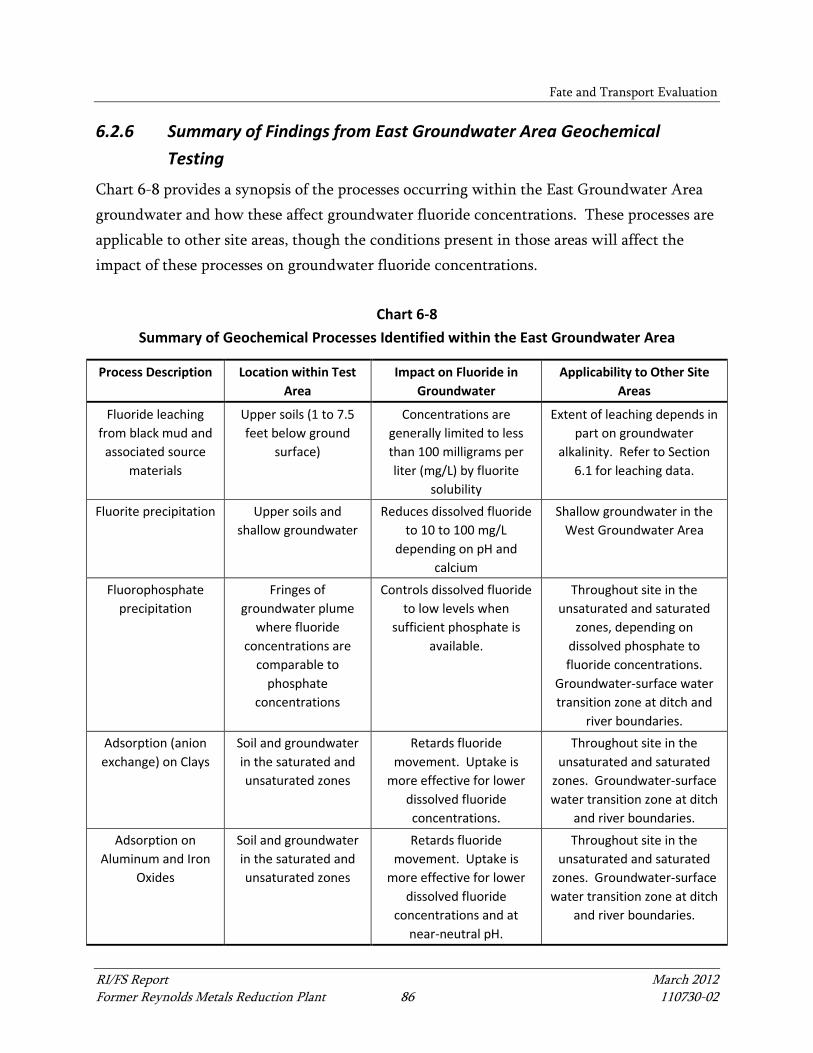
Fate and Transport Evaluation
RI/FS Report March 2012 Former Reynolds Metals Reduction Plant 86 110730-02
6.2.6 Summary of Findings from East Groundwater Area Geochemical Testing
Chart 6-8 provides a synopsis of the processes occurring within the East Groundwater Area groundwater and how these affect groundwater fluoride concentrations. These processes are applicable to other site areas, though the conditions present in those areas will affect the impact of these processes on groundwater fluoride concentrations.
Chart 6-8 Summary of Geochemical Processes Identified within the East Groundwater Area
Process Description Location within Test Area
Impact on Fluoride in Groundwater
Applicability to Other Site Areas
Fluoride leaching from black mud and
associated source materials
Upper soils (1 to 7.5 feet below ground
surface)
Concentrations are generally limited to less than 100 milligrams per liter (mg/L) by fluorite
solubility
Extent of leaching depends in part on groundwater
alkalinity. Refer to Section 6.1 for leaching data.
Fluorite precipitation Upper soils and shallow groundwater
Reduces dissolved fluoride to 10 to 100 mg/L
depending on pH and calcium
Shallow groundwater in the West Groundwater Area
Fluorophosphate precipitation
Fringes of groundwater plume
where fluoride concentrations are
comparable to phosphate
concentrations
Controls dissolved fluoride to low levels when
sufficient phosphate is available.
Throughout site in the unsaturated and saturated
zones, depending on dissolved phosphate to fluoride concentrations.
Groundwater-surface water transition zone at ditch and
river boundaries. Adsorption (anion exchange) on Clays
Soil and groundwater in the saturated and unsaturated zones
Retards fluoride movement. Uptake is
more effective for lower dissolved fluoride concentrations.
Throughout site in the unsaturated and saturated
zones. Groundwater-surface water transition zone at ditch
and river boundaries. Adsorption on
Aluminum and Iron Oxides
Soil and groundwater in the saturated and unsaturated zones
Retards fluoride movement. Uptake is
more effective for lower dissolved fluoride
concentrations and at near-neutral pH.
Throughout site in the unsaturated and saturated
zones. Groundwater-surface water transition zone at ditch
and river boundaries.
Fate and Transport Evaluation
RI/FS Report March 2012 Former Reynolds Metals Reduction Plant 87 110730-02
6.3 Geochemical Interactions at Ditch Water Boundaries
This section discusses processes occurring at the site that limit fluoride concentrations discharging to surface water in the numerous ditches in and surrounding the site. As discussed in Section 4.3 and shown on Figure 4-3, shallow groundwater in the shallow alluvium WBZ beneath the site generally flows away from the Columbia River towards the discharges to CDID ditches. The only exception is riverward of the CDID levee where flow can be towards the river. Fate and transport processes in areas near the Columbia River shoreline are discussed in more detail in Section 6.4. Sampling results for surface water, including the CDID ditches, presented in Section 5.2 and Figure 5-2 show that dissolved fluoride concentrations are either non-detect or below the surface water screening level of 4 mg/L. Groundwater near the CDID ditches is characterized by upward vertical hydraulic gradients, indicating both shallow and deeper groundwater in the upper alluvium WBZ discharge to the CDID ditches surrounding the site. Shallow monitoring wells in the upper alluvium WBZ located adjacent to the ditches show a range of concentrations, depending on location, from fewer than 1 mg/L to a maximum of 84.5 mg/L at PZ-6. In contrast, deeper monitoring wells in the upper alluvium WBZ wells show much lower fluoride concentrations, generally fewer than or up to 1 mg/L, with only one exception (RL-2D). Mixing of shallow groundwater with deeper low-fluoride groundwater within the upper alluvium WBZ in the vicinity of ditches can partly explain the empirical observation of very low fluoride detections in ditch water. Based on the understanding of geochemical processes affecting fluoride fate and transport at the site, as documented in Section 6.2, lines of evidence indicating the potential role of specific geochemical processes in attenuating fluoride concentrations discharging to the ditch system were evaluated. Geochemical modeling was conducted to evaluate potential reactions affecting fluoride during the subsurface mixing of deep and shallow groundwater as flow paths converge near ditches. Geochemical mixing models were developed for selected shallow-deep groundwater sample pairs, including PZ-7 and G7D, and PZ-6 and G7D, using the geochemical modeling software PHREEQC (Parkhurst and Appelo 1999). Briefly, the shallow and deep end-members were mixed over a range of proportions from 0 to 100 percent, and minerals such as
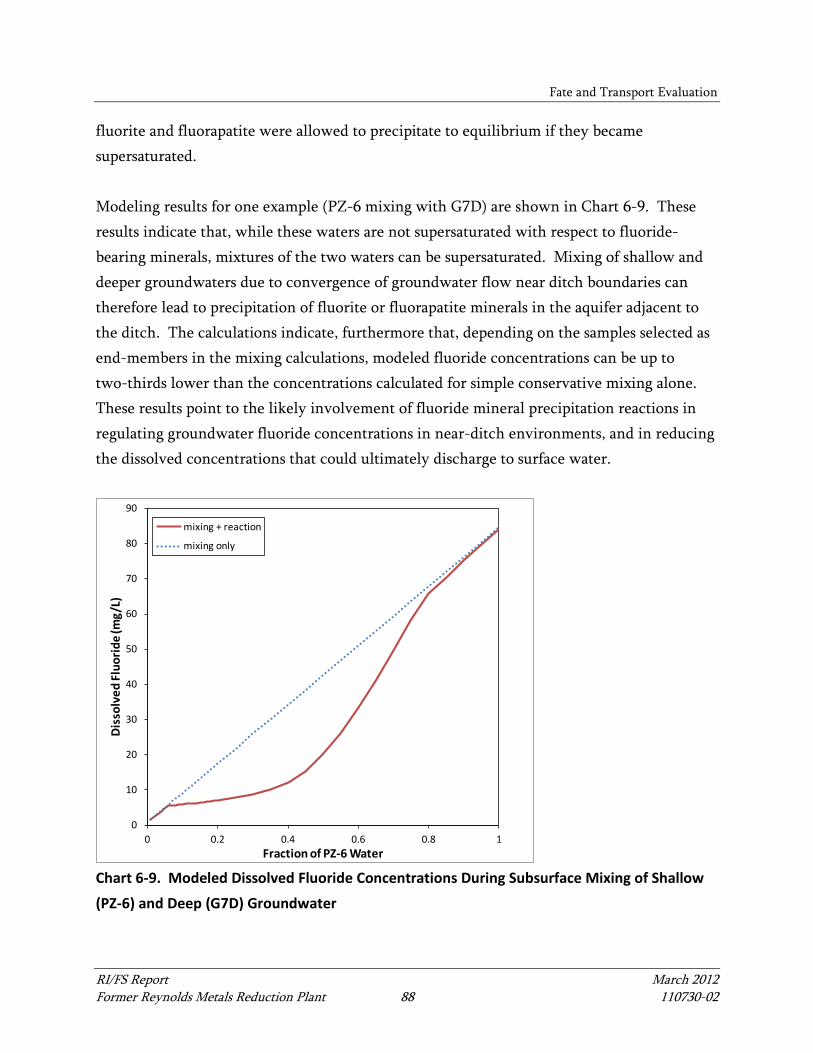
Fate and Transport Evaluation
RI/FS Report March 2012 Former Reynolds Metals Reduction Plant 88 110730-02
fluorite and fluorapatite were allowed to precipitate to equilibrium if they became supersaturated. Modeling results for one example (PZ-6 mixing with G7D) are shown in Chart 6-9. These results indicate that, while these waters are not supersaturated with respect to fluoride-bearing minerals, mixtures of the two waters can be supersaturated. Mixing of shallow and deeper groundwaters due to convergence of groundwater flow near ditch boundaries can therefore lead to precipitation of fluorite or fluorapatite minerals in the aquifer adjacent to the ditch. The calculations indicate, furthermore that, depending on the samples selected as end-members in the mixing calculations, modeled fluoride concentrations can be up to two-thirds lower than the concentrations calculated for simple conservative mixing alone. These results point to the likely involvement of fluoride mineral precipitation reactions in regulating groundwater fluoride concentrations in near-ditch environments, and in reducing the dissolved concentrations that could ultimately discharge to surface water.
0
10
20
30
40
50
60
70
80
90
0 0.2 0.4 0.6 0.8 1
Diss
olve
d Fl
uorid
e (m
g/L)
Fraction of PZ-6 Water
mixing + reaction
mixing only
Chart 6-9. Modeled Dissolved Fluoride Concentrations During Subsurface Mixing of Shallow
(PZ-6) and Deep (G7D) Groundwater
Fate and Transport Evaluation
RI/FS Report March 2012 Former Reynolds Metals Reduction Plant 89 110730-02
Adsorption on iron and aluminum oxides and clay minerals provide an additional mechanism for fluoride removal from groundwater prior to discharge to surface water. These mineral sorbents are ubiquitous in the environment, and were documented in site soils in Section 6.2. Iron and aluminum oxides and clay minerals are typically abundant in the fine sediment that accumulates in the bottom of ditches over time. The presence of these materials provides an adsorptive barrier to fluoride migration from groundwater to surface water. Based on the foregoing discussion, the overall very low fluoride concentrations detected in surface water in ditches surrounding the site results from a combination of hydrologic and geochemical factors, including subsurface mixing of groundwaters from different depths, followed by mixing-induced precipitation of insoluble fluoride minerals such as fluorite and fluorapatite, and finally adsorption on clays and iron and aluminum oxides, both in the aquifer and in the ditch bottom sediments.
6.4 Processes Occurring at River Boundary
This section discusses processes occurring at the site at locations where groundwater may discharge to the surface waters of the Columbia River. Fluoride concentrations in the Columbia River adjacent to the site are low (approximately 0.2 mg/L) and statistically similar to concentrations measured upstream of the site. The surface water sampling results show empirically that groundwater discharging from the site does not have a measurable impact on fluoride concentrations in the river. Groundwater in the upper alluvium WBZ generally flows from the Columbia River towards upland areas due to hydraulic control by pumping of the CDID ditch system, except in areas on the riverside of the CDID levee, where groundwater gradients can sometimes be south and west towards the Columbia River (see Figure 4-3) depending on river stage. Vertical hydraulic gradients are generally downward in nearshore areas along the river. Monitoring wells located in these areas include G1S, G1D, R1S, R1D, R4S, R4D, and SSA7-MW-01 in the eastern part of the site and G6S, G6D, and RLSW-4 in the western part. Fluoride concentrations are typically fewer than 2 mg/L in the deeper wells, while higher concentrations are found in the shallower wells, with a maximum of 96.8 mg/L at RLSW-4.
Fate and Transport Evaluation
RI/FS Report March 2012 Former Reynolds Metals Reduction Plant 90 110730-02
Water levels in three of the wells located near the crest of the CDID levee (G6S, RLSW-4, and G1S) are persistently several feet higher than the stage of the Columbia River, without any obvious source of recharge other than precipitation. Review of well logs indicates that these wells are likely monitoring groundwater that is perched above low permeability horizons within the CDID levee or adjacent to the river bank. The persistence of these anomalously high water levels indicates as perched condition, with recharge due to local precipitation and slow drainage characteristics. The elevated fluoride concentrations at RLSW-4 and G6S (96.8 and 78.7 mg/L, respectively) also appear to be localized. The fluoride in the perched zone appears to have very limited if any impact on deeper groundwater, as evidenced by the very low fluoride concentrations detected in monitoring well G6D (approximately 1 mg/L). The observed limited vertical migration of fluoride described above, despite the strong downward vertical gradients, and the absence of detectable water quality impacts in river water, are strong indications that attenuation of fluoride concentrations in groundwater is occurring prior to discharge to surface water. In this setting, characterized by relatively low fluoride concentrations (typically 10 mg/L or less in areas where hydraulic gradients are towards the river), adsorption on clays and iron and aluminum oxides present in overbank deposits can be an important attenuation mechanism. Geochemical speciation modeling results indicate that upper alluvium WBZ groundwater adjacent to the Columbia River is supersaturated with respect to fluorapatite and other fluorophosphates minerals, although fluoride concentrations are generally too low to allow precipitation of fluorite. Precipitation of fluorophosphates is thus another potentially important attenuation mechanism in this setting. In addition, tidal mixing in nearshore areas of the upper alluvial WBZ may provide for some further reduction of groundwater fluoride concentrations, which are already relatively low, prior to discharge at the interface with the river.
Fate and Transport Evaluation
RI/FS Report March 2012 Former Reynolds Metals Reduction Plant 91 110730-02
6.5 Fluoride Fate and Transport Summary
The evaluations presented in this section document the following major processes influencing the fate and transport of fluoride within soils and groundwater at the site:
• Leaching of fluoride from source areas is presently limited by the solubility of fluorite (calcium fluoride).
• Similarly, dissolved fluoride transport in groundwater from areas historically impacted by caustic sodium fluoride solutions is limited by the solubility of fluorite (less than 100 mg/L for pH less than 8), and fluorophosphates such as fluorapatite.
• Anion exchange and adsorption to soil aluminum oxides also serve to retard fluoride movement in groundwater at the leading edge of the plume. Testing indicates that natural AEC remains in areas outside of the source area deposits. This natural capacity is available for uptake of dissolved fluoride.
Site hydrogeologic conditions are influenced by the regional drainage networks of the CDID. These drainage networks generate a groundwater gradient flowing generally northward away from the Columbia River, with shallow groundwater discharging to the waters of the CDID ditch system. Fluoride that may be present in groundwater near the groundwater/ditch boundary is subject to a number of attenuation processes, including the precipitation of fluorophosphates, anion exchange and adsorption reactions on soils present at the ditch bottom. Ditch water monitoring conducted as part of the RI has shown that these processes are capable of maintaining ditch water fluoride concentrations below 4 mg/L. In the southernmost portions of the site, groundwater gradients are at times toward the Columbia River. The portion of site groundwater that can flow toward the river is limited by site hydrogeologic gradients. Groundwater moving along this path is subject to dispersion, as well as tidally-induced mixing in river nearshore areas. Geochemical processes applicable to the boundary between groundwater and the river include adsorption, exchange and calcium fluorophosphate precipitation. Surface water concentrations measured within the Columbia River have been consistent with upriver background concentrations of approximately 0.2 mg/L or less.
RI/FS Report March 2012 Former Reynolds Metals Reduction Plant 92 110730-02
7 CONCEPTUAL SITE MODEL
This section provides a summary of the CSM developed for the site based on the findings of the remedial investigation. The CSM includes a summary of the nature and extent of contamination remaining on site, fate and transport characteristics of principal site COCs, and an evaluation of potential exposure pathways and receptors. The CSM is illustrated in Figures 7-1 through 7-4.
7.1 Nature and Extent of Contamination
The nature and extent of contamination present at the site was initially evaluated through a series of investigation and cleanup actions conducted between the 1980s and 2007. These previous actions are described in Section 2. After evaluating site data gaps, the RI activities described in this report were initiated under Ecology direction to complete the assessment of current environmental conditions. These findings of the RI provides the information necessary to define the nature and extent of contamination, develop the CSM, and support the development of cleanup alternatives in the FS consistent with MTCA requirements. The nature and extent of contamination as defined during the RI activities includes the following:
• Principal site COCs in soil are fluoride, cyanide, and PAH compounds. These compounds are associated primarily with former smelter operations and are generally present in soils in localized areas where deposits of impacted soils are currently managed on site. These localized areas include former landfills and mud ponds shown on Figure 7-1.
• A number of additional localized areas with soil impacts have been identified, including PAH-impacted soil beneath a portion of the flat storage area (SSA-4) and impacted site soils of the southeast debris fill (SSA-7). These areas are also shown on Figure 7-1.
• Sediment quality has been assessed during previous studies in 1990 and 2010. No areas of chemical contamination or sediment toxicity (as measured by bioassay testing) have been identified at the site.
Conceptual Site Model
RI/FS Report March 2012 Former Reynolds Metals Reduction Plant 93 110730-02
• Extensive testing has been performed in CDID ditch waters and surface waters of the Columbia River adjacent to the site. No exceedances of screening levels were noted in these ditch or surface water samples.
• Groundwater at the site complies with groundwater screening levels protective of groundwater drinking water use for cyanide in all portions of the site. No exceedances of screening levels have been noted for solvents, pesticides, PCB compounds, petroleum, or heavy metals. Exceedance of cPAH screening levels are limited to two wells (PZ-1 and PZ-4) located within an impacted soil deposit in the East Groundwater Area.
• Fluoride is the principal COC for site groundwater. Groundwater concentrations of fluoride exceed MCLs in portions of the West Groundwater Area and East Groundwater Area and in a localized area adjacent to the southeast debris fill area. The highest fluoride concentrations are located in the area east of the former Cryolite Recovery Plant. Fluoride concentrations in other portions of the East Groundwater Area and West Groundwater Area are more than ten-fold lower than this area. Concentrations of fluoride in groundwater adjacent to the southeast fill area are even lower, exceeding the MCL by only a narrow margin.
7.2 Fate and Transport Processes
Extensive testing has been conducted to evaluate the factors affecting the potential fate and transport of fluoride, the principal groundwater COC. Most site COCs are relatively immobile, as evidenced by the lack of groundwater impacts. Findings of the fate and transport evaluation are summarized in Section 6, and are illustrated in the CSM cross-sections shown in Figures 7-2, 7-3, and 7-4. These principal fate and transport processes include the following:
• Leaching of fluoride from source area soils is limited by the geochemical properties of the soils and groundwater. A primary example of this is the calcium-mediated solubility of fluorite (calcium fluoride) in black mud and white mud deposits.
• Certain conditions present in the area east of the former Cryolite plant (e.g., historical discharges of alkaline waters to this area) can enhance fluoride solubility in comparison to the conditions present in the black mud and white mud deposits. These conditions are localized to this area (i.e., the area east of the Cryolite plant).
Conceptual Site Model
RI/FS Report March 2012 Former Reynolds Metals Reduction Plant 94 110730-02
• Dissolved fluoride transport in groundwater away from areas historically impacted by alkaline sodium fluoride solutions is limited by the solubility of fluorite (less than 100 mg/L for pH less than 8), and fluorphosphates, such as fluorapatite.
• Anion exchange and adsorption to soil aluminum oxides also serve to retard fluoride movement in groundwater at the leading edge of the plume. Testing indicates that substantial adsorption capacity remains in soils outside of the source area deposits. This natural capacity is available for uptake of dissolved fluoride.
• These attenuation processes have limited the migration of fluoride both laterally and vertically under current hydrogeologic conditions present at the site.
Site hydrogeologic conditions are influenced by the regional drainage networks of the CDID. These drainage networks generate a groundwater gradient flowing generally northward or westward away from the Columbia River, with shallow groundwater generally discharging to the waters of the regional CDID ditch system (see Figure 7-2). Fluoride that may be present in some groundwater near the groundwater/ditch boundary is subject to a number of attenuation processes, including the precipitation of fluorite and fluorophosphates, anion exchange and adsorption reactions on soils present beneath the ditch bottom. Ditch water monitoring conducted as part of the RI has shown that these processes effectively maintain ditch water fluoride concentrations below site screening levels under existing pre-remediation conditions. Remediation measures would further protect water quality in the ditches. In the southernmost portions of the site, groundwater gradients are at times toward the Columbia River (see Figures 7-3 and 7-4). The portion of site groundwater that can flow toward the river is limited by site hydrogeologic gradients. Groundwater moving along this path is subject to dispersion, as well as tidally-induced mixing in river nearshore areas. Geochemical processes applicable to the boundary between groundwater and the river include adsorption, exchange and calcium fluorophosphate precipitation. Surface water concentrations measured within the Columbia River have been consistent with upriver background concentrations of approximately 0.2 mg/L or less.
Conceptual Site Model
RI/FS Report March 2012 Former Reynolds Metals Reduction Plant 95 110730-02
7.3 Exposure Pathways and Receptors
The site is an industrial property, surrounded by other industrial properties. Access to the site is controlled, consistent with its industrial land use. Surface drainage at the site is controlled by the on-site drainage system. Groundwater at the site has been extensively monitored, and hydrogeologic and geochemical processes have been evaluated. A series of cleanup actions have already been completed, as described in Section 2. Relevant exposure pathways and receptors for principal exposure pathways at the site include the following:
• Soil direct contact – industrial workers. Fluoride and cyanide, two of the principal COCs at the site, do not exceed industrial cleanup levels protective of direct contact exposures in any areas of the site. Most areas of impacted soils exceeding industrial screening levels (i.e., those soils containing elevated PAH and TPH concentrations) and present at the site have already been isolated from direct contact as part of previous soil cover placement or cleanup actions (e.g., partial cleanup of TPH-impacted soils at the 200,000-gallon fuel oil AST). However, localized areas of shallow impacted soil remain present on site. Further actions are appropriate to address these localized soil areas and to provide for the long-term protection against direct contact exposures.
• Protection of groundwater quality. A key consideration at the site is the protection of groundwater quality in areas that serve as a current or potential future source of drinking water. The deep alluvium WBZ, the coarse aquifer unit present at 200 feet bgs and deeper is used locally as a source of industrial and municipal water supply. Direct protection of the deep alluvium WBZ from fluoride transport is currently achieved by site hydrogeologic conditions (i.e., upward hydraulic gradients) in the shallow alluvium WBZ in the East Groundwater Area and West Groundwater Area and by the geochemical processes occurring in site soils and groundwater that prevent migration of fluoride.
• Protection of ditch and surface waters. Extensive testing of CDID ditch and surface waters at the site has been performed as part of the RI/FS, and no site-related impacts have been identified above applicable screening levels. Continued protection of ditch and surface water quality serves to prevent the migration of site COCs and protects both groundwater and surface water receptors.
RI/FS Report March 2012 Former Reynolds Metals Reduction Plant 96 110730-02
8 CLEANUP ACTION REQUIREMENTS
A final cleanup action for the site must be protective of human health and the environment, comply with cleanup standards, and comply with applicable state and federal laws. This section discusses site-specific requirements to be considered during alternative development. The assembly and evaluation of remedial alternatives are discussed in Sections 10 and 11.
8.1 Remedial Action Objectives
Based on the results of the RI portion of this study, 11 distinct FS site units (SUs) and two areas of affected groundwater (i.e., the West Groundwater Area and the East Groundwater Area) have been identified for further evaluation as shown on Figure 8-1. Specifically, the RI concluded that surface water resources are currently protected and that groundwater impacts are limited to confined, shallow zones. As groundwater migrates from these zones, site COCs (i.e., primarily fluoride in groundwater) attenuate when adequate naturally reactive minerals, such as calcium and phosphate, are present under pH neutral conditions. Site COCs in soil and waste materials are not very mobile and generally remain bound to solid media. Based on these conclusions, the following RAOs have been established for the site:
• Continue to protect surface water adjacent to the site designated for potential future beneficial use as drinking water through enhancement of natural attenuation processes, where necessary
• Protect human health and the environment by limiting direct contact with or incidental ingestion of COC-impacted media (i.e., soil, waste materials, and groundwater) based on an industrial use scenario
• Protect groundwater resources by reducing or controlling migration of contaminant-bearing water from waste and impacted soil
8.2 Applicable Federal, State, and Local Laws
Many environmental laws may apply to a cleanup action. In addition to meeting environmental standards set in applicable laws, the cleanup action must also comply with elements of other applicable environmental reviews and permitting requirements. Though a cleanup action performed under formal MTCA authorities (e.g., a Consent Decree) would be
Cleanup Action Requirements
RI/FS Report March 2012 Former Reynolds Metals Reduction Plant 97 110730-02
exempt from the procedural requirements of certain state and local environmental laws, the action must nevertheless comply with the substantive requirements of such laws (Revised Code of Washington [RCW] 70.105D.090; WAC 173-340-710). Potentially applicable federal, state, and local laws that may apply during the implementation of remedial actions at the site are summarized in the subsequent sections.
8.2.1 Federal Requirements
Potential federal requirements are specified in several statutes, codified in the United States Code (USC), and regulations promulgated in the CFR, as discussed in the following sections. The CWA (33 USC Section 1251 et seq.) requires the establishment of guidelines and standards to control the direct or indirect discharge of pollutants to waters of the United States. Section 304 of the CWA (33 USC 1314) requires the EPA to publish water quality criteria, which are developed for the protection of human health and aquatic life. Federal water quality criteria are published as they are developed, and many of them are included in Quality Criteria for Water 1986, EPA 440/5-86-001, May 1, 1986 (51 FR 43665), commonly known as the “Gold Book.” Publications of additional criteria established since the Gold Book was printed are announced in the Federal Register. Federal water quality criteria are used by states, including Washington, to set water quality standards for surface water. These standards are relevant and appropriate for possible actions at the site. Federal water quality criteria (along with related state standards) have been incorporated into the cleanup standards summarized in Section 9. Discharges of Pollutants into Navigable Waters are regulated under Sections 401 and 404 of the CWA (33 USC 1341 and 1344), 40 CFR Part 230 [Section 404(b)(1) guidelines], 33 CFR Parts 320 (general policies), 323 and 325 (permit requirements), and 328 (definition of waters of the United States). These requirements regulate the excavation of shoreline materials, the placement of fill material below the ordinary high water elevation of waters of the United States or the placement of fill in navigable waters or wetlands. Cleanup activities may include disturbance of lands designated as wetlands by the USACE. The 404 regulation is implemented by the USACE, and 401 is implemented by Ecology in Washington State.
Cleanup Action Requirements
RI/FS Report March 2012 Former Reynolds Metals Reduction Plant 98 110730-02
NPDES Waste Discharge Permit is required for discharge of pollutants to waters of the United States pursuant to Section 402 of the CWA. The cleanup of the site will generate waste water during dewatering activities that may be either discharged to the local sanitary sewer system or to surface water. Discharge of pollutants to surface water requires a permit under Section 402 of the CWA to ensure compliance with state water quality standards. NPDES permits are obtained from Ecology in Washington State. The Resource Conservation and Recovery Act (RCRA) addresses the generation and transportation of hazardous waste and waste management activities at facilities that treat, store, or dispose of hazardous wastes. Subtitle C (Hazardous Waste Management) mandates the creation of a “cradle to grave” management and permitting system for hazardous wastes. RCRA regulates “solid wastes” that are hazardous because they may cause or significantly contribute to an increase in mortality or serious illness or that pose a substantial hazard to human health or the environment when improperly managed. In Washington State, RCRA is implemented by Ecology under the State’s Dangerous Waste Regulations, Chapter 173-303 WAC (as discussed in Section 8.2.2). The Toxic Substances Control Act (TSCA; 15 USC s/s 2601 et seq. [1976]) enables the EPA to require manufacturers and processors of chemicals to test and report potential health and environment hazards of chemicals which might create an unreasonable environmental or public health hazard. The EPA also has the power to track industrial chemicals in the United States and regulate intrastate and interstate commerce under this act. Chemicals which the EPA deems to be an unreasonable risk may be prohibited from use in the United States. TSCA specifically regulates PCBs (Title I Section 6 (e)), asbestos (Title II), indoor radon gas (Title III), and lead based paint (Title IV). Additionally, TSCA regulations supplement other Federal statues such as RCRA. Endangered Species Act (16 USC 1536 (a) – (d); 50 CFR Part 402) Section 7(a) grants authority to and imposes requirements upon federal agencies regarding endangered or threatened species of fish, wildlife, or plants (listed species) and habitat of such species that has been designated as critical.
Cleanup Action Requirements
RI/FS Report March 2012 Former Reynolds Metals Reduction Plant 99 110730-02
National Historic Preservation Act (36 CFR 800) requires that when proponents seek a federal approval, the responsible federal agency must consult with the State Historic Preservation Officer and the federal Advisory Council on Historic Preservation to determine if the project would affect cultural or historic sites on, or eligible for, the National Register of Historic Places.
8.2.2 Washington State and Local Requirements
MTCA (Chapter 70.105D RCW) authorized Ecology to adopt cleanup standards for remedial actions at sites where hazardous substances are present. The processes for identifying, investigating, and cleaning up these sites are defined and cleanup standards are set for groundwater, soil, surface water, and air in Chapter 173-340 WAC. In addition to MTCA, other potential state requirements are specified in several statutes, codified in the RCW, or are regulations promulgated in the WAC. State Environmental Policy Act (SEPA; RCW 43.21C; WAC 197-11) is intended to ensure that state and local government officials consider environmental values when making decisions. The SEPA process begins when an application for a permit is submitted to an agency, or an agency proposes to take some official action such as implementing a MTCA Cleanup Action Plan (CAP). Prior to taking any action on a proposal, agencies must follow specific procedures to ensure that appropriate consideration has been given to the environment. The severity of potential environmental impacts associated with a project determines whether an Environmental Impact Statement (EIS) is required. Washington Water Pollution Control Act (Chapter 90.48 RCW; Chapter 173-201A WAC) provides for the protection of surface water and groundwater quality. Chapter 173-201A WAC establishes water quality standards for surface waters of the state. Consistent with the requirements of Chapter 90.48 RCW, Ecology issues a water quality certification for any activity, including MTCA cleanup actions, which may result in a discharge to state water. As outlined above, shoreline excavation, dredging, and/or capping actions typically constitute a “discharge” under this state regulation. The need for mitigation resulting from these activities has been further defined by the Washington State Legislature (see the section entitled “Compensatory Mitigation Policy for Aquatic Resources”).
Cleanup Action Requirements
RI/FS Report March 2012 Former Reynolds Metals Reduction Plant 100 110730-02
Washington Shoreline Management Act (Chapter 90.58 RCW; Chapter 173-14 WAC) and regulations promulgated therein establish requirements for substantial developments occurring within water areas of the state or within 200 feet of the shoreline. Cowlitz County has set forth requirements based on local considerations. Local shoreline management plans are adopted under state regulations, creating an enforceable state law. Washington Solid Waste Management — Reduction and Recycling Act (Chapter 70.95 RCW; Chapter 173-350 WAC), and regulations promulgated therein, establishes a comprehensive statewide program for solid waste handling, and solid waste recovery and/or recycling to prevent land, air, and water pollution and conserve the natural, economic, and energy resources of the state of Washington. Washington Hazardous Waste Management Act (Chapter 70.105 RCW; Chapter 173-303 WAC), and regulations promulgated therein, is the state equivalent of RCRA requirements for designating certain solid wastes as “dangerous waste.” Under this Act, materials designated as hazardous waste must be monitored until they are properly disposed of or undergo a process to become non-dangerous waste. Hazardous waste transported from the site must be tracked, sampled, and monitored under the regulations developed. This Act also governs and establishes regulations for hazardous waste treatment, storage, transfer, and disposal facilities. Solid materials subject to the requirements of this rule include remedial soils in contact with SPL or Black Mud, Black Mud, and pitch. A “contained-out” determination has been received from Ecology allowing groundwater in contact with SPL and Black Mud to be managed as a solid waste. Water Resources Act (Chapter 90.54 RCW) establishes fundamental water resource policies for preservation of Washington State water resources. Growth Management Act (Chapters 36.70A; 36.70.A.150; and 36.70.A.200 RCW; GMA) requires counties and cities to classify and designate natural resource lands and critical areas (which include “waters of the state”). Additionally, the state’s fastest growing cities and counties must adopt comprehensive plans and development regulations regarding land use within their jurisdiction. In particular, each plan must identify land within the jurisdiction that is useful for public purposes, and include a process for citing essential public facilities, including solid waste handling facilities.
Cleanup Action Requirements
RI/FS Report March 2012 Former Reynolds Metals Reduction Plant 101 110730-02
State Historic Preservation Act (Chapter 27, 34, 44, and 53 RCW) is a state law to ensure that cultural resources, such as historical and archaeological sites, are identified and protected.
8.3 Cleanup Standards
A cleanup standard defines the point of compliance (POC) and concentration of a hazardous substance in media above which the impacted media may pose a risk to human health through the exposure pathway (i.e., the cleanup level). This section presents the cleanup levels and POCs that have been developed for the site. As defined in the MTCA regulation, a remediation level (REL) defines the concentration of a hazardous substance in a particular medium above or below which a particular cleanup action component or institutional control may be used. RELs are site-specific, risk-based values that may be developed using exposure assumptions and other media-specific factors that reflect specific future site conditions under a given remedial alternative scenario. This section focuses on establishing cleanup standards; RELs are discussed along with the alternative descriptions in Section 10.
8.3.1 Methodology
The MTCA Cleanup Regulations (Sections 173-340-720, -730, and -740 WAC) establish procedures to develop cleanup levels for surface water, groundwater, and soil. The MTCA Method A procedure is applicable to sites with relatively few hazardous substances. Cleanup levels based on this method are derived through selection of the most stringent concentration presented in the following sources:
• Concentrations listed in WAC Tables 173-720-1, -740-1, and -745-1 (for groundwater and soil)
• Concentrations established under ARARs • Concentrations protective of the environment and surface water beneficial uses
Where numeric values were not provided in these sources, Method C procedures were used to develop cleanup levels. MTCA Method C procedures employ a risk-based evaluation of potential human health and environmental exposures to site COCs. The Method C procedure also requires that a cleanup level for one media must also be protective of the beneficial uses of other affected media. For example, site groundwater
Cleanup Action Requirements
RI/FS Report March 2012 Former Reynolds Metals Reduction Plant 102 110730-02
discharges into the CDID regional drainage ditches, which are periodically discharged into the Columbia River. Therefore, site-specific groundwater cleanup levels also considered surface water protection requirements. The procedures for developing cleanup levels for groundwater, surface water, and soil are outlined in the MTCA Cleanup Regulations, Sections 173-340-720, -730, and -740 WAC, respectively. Included in these sections are the specific rules for evaluating cross-media protectiveness. Where relevant to the site, cross-media protectiveness of cleanup levels is discussed below and incorporates the results of the fate and transport studies presented in previous sections of this report.
8.3.2 Surface Water Cleanup Levels and Points of Compliance
In accordance with WAC 173-340-730, surface water cleanup levels must be at least as stringent as the criteria established under WAC 173-201A, Section 304 of the Federal CWA, and the National Toxics Rule (NTR; 40 CFR Part 131). In addition, for surface water resources that may potentially be used as a drinking water source, criteria set forth in WAC 173-340-720 of MTCA must also be considered. As discussed in previous sections of this report, free cyanide and fluoride have been detected in groundwater adjacent to locations where groundwater discharges into the CDID regional drainage ditches. Free cyanide and fluoride have not been detected in Columbia River surface water adjacent to the site. For free cyanide, consistent numeric criteria are published in the state and federal regulations cited previously. These criteria are less than the state MCL (200 µg/L) and, therefore, are also protective of drinking water resources. Applicable state and federal criteria do not include published numeric values for fluoride. The state and federal MCL for fluoride is 4 mg/L. In the MTCA regulations, the point of compliance for surface water cleanup levels is the point or points at which hazardous substances are released to surface waters of the state (WAC 173-340-730[6]). While the CDID regional drainage ditches are consider surface waters of the state (because they are released via point discharges to the Columbia River), the CDID ditches themselves are not direct sources of drinking water. The location where the reasonable maximum exposure associated with consumption of drinking water is the Columbia River; however, it is not practicable to monitor that location. Accordingly, a conditional POC for surface water would be established in the CDID Ditch No. 14 water column at locations upgradient of the point of discharge to the Columbia River (i.e., the
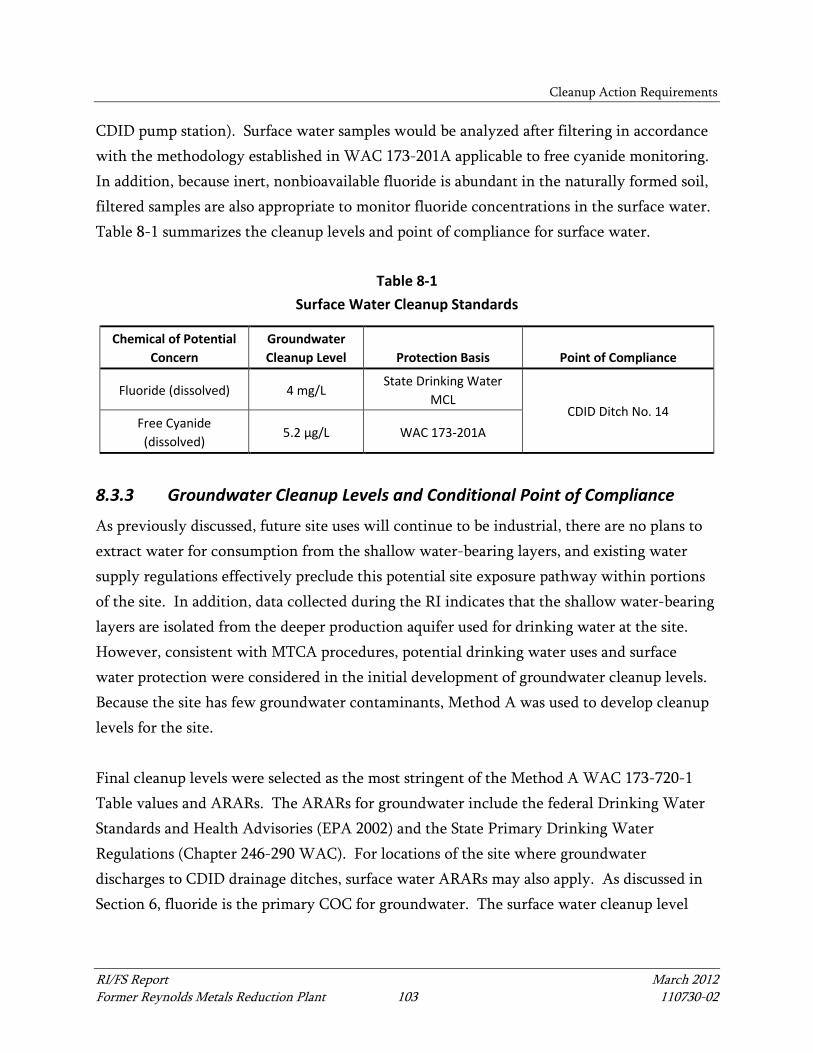
Cleanup Action Requirements
RI/FS Report March 2012 Former Reynolds Metals Reduction Plant 103 110730-02
CDID pump station). Surface water samples would be analyzed after filtering in accordance with the methodology established in WAC 173-201A applicable to free cyanide monitoring. In addition, because inert, nonbioavailable fluoride is abundant in the naturally formed soil, filtered samples are also appropriate to monitor fluoride concentrations in the surface water. Table 8-1 summarizes the cleanup levels and point of compliance for surface water.
Table 8-1 Surface Water Cleanup Standards
Chemical of Potential Concern
Groundwater Cleanup Level Protection Basis Point of Compliance
Fluoride (dissolved) 4 mg/L State Drinking Water
MCL CDID Ditch No. 14
Free Cyanide (dissolved)
5.2 µg/L WAC 173-201A
8.3.3 Groundwater Cleanup Levels and Conditional Point of Compliance
As previously discussed, future site uses will continue to be industrial, there are no plans to extract water for consumption from the shallow water-bearing layers, and existing water supply regulations effectively preclude this potential site exposure pathway within portions of the site. In addition, data collected during the RI indicates that the shallow water-bearing layers are isolated from the deeper production aquifer used for drinking water at the site. However, consistent with MTCA procedures, potential drinking water uses and surface water protection were considered in the initial development of groundwater cleanup levels. Because the site has few groundwater contaminants, Method A was used to develop cleanup levels for the site. Final cleanup levels were selected as the most stringent of the Method A WAC 173-720-1 Table values and ARARs. The ARARs for groundwater include the federal Drinking Water Standards and Health Advisories (EPA 2002) and the State Primary Drinking Water Regulations (Chapter 246-290 WAC). For locations of the site where groundwater discharges to CDID drainage ditches, surface water ARARs may also apply. As discussed in Section 6, fluoride is the primary COC for groundwater. The surface water cleanup level
Cleanup Action Requirements
RI/FS Report March 2012 Former Reynolds Metals Reduction Plant 104 110730-02
established in the previous section is based on the MCL; therefore, no adjustment to the initial groundwater cleanup level was necessary to protect surface water resources. In accordance with WAC 173-720-7(C), natural background groundwater concentrations were considered when selecting screening levels (see Section 5.1) and cleanup levels. For example, naturally-occurring arsenic has been observed at concentrations above MTCA Method A values and MCLs, 5 µg/L and 10 µg/L, respectively. Data available from the State Department of Health for Cowlitz County for the period 2001 to 2011 indicate an arsenic concentration range of up to 55 µg/L in groundwater. Per the guidelines in WAC 173-340-709(3), the 90-percentile of the background concentrations was calculated and a screening level of 42 µg/L was established in Section 5.1. Site groundwater data were screened against this value and no data were identified above the screening level; therefore, arsenic was not identified as a site COC and no cleanup level is established in this section. As defined in the MTCA regulations, the standard POC for groundwater extends from the uppermost level of the saturated zone to the lowest depth that could be potentially affected by site releases. For fluoride, it is anticipated that it would not be practicable to meet groundwater cleanup levels throughout the site within a reasonable timeframe. Therefore, compliance with groundwater cleanup levels would be measured at conditional POC monitoring points located along the shoreline, downgradient from the respective source areas in accordance with WAC 173-340-720(8)(c). For all other constituents, compliance will be evaluated at wells located where remedial action occurs or adjacent to SUs. Table 8-2 summarizes the cleanup levels and point of compliance for groundwater.
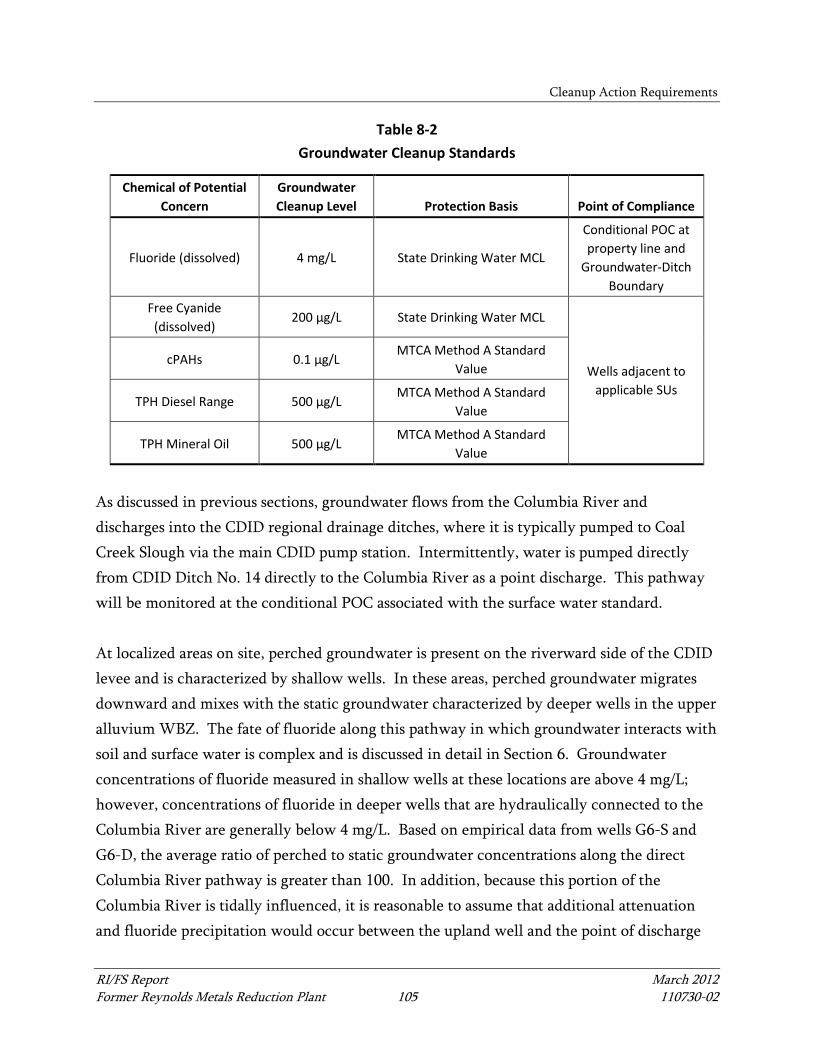
Cleanup Action Requirements
RI/FS Report March 2012 Former Reynolds Metals Reduction Plant 105 110730-02
Table 8-2 Groundwater Cleanup Standards
Chemical of Potential Concern
Groundwater Cleanup Level Protection Basis Point of Compliance
Fluoride (dissolved) 4 mg/L State Drinking Water MCL
Conditional POC at property line and
Groundwater-Ditch Boundary
Free Cyanide (dissolved)
200 µg/L State Drinking Water MCL
Wells adjacent to applicable SUs
cPAHs 0.1 µg/L MTCA Method A Standard
Value
TPH Diesel Range 500 µg/L MTCA Method A Standard
Value
TPH Mineral Oil 500 µg/L MTCA Method A Standard
Value
As discussed in previous sections, groundwater flows from the Columbia River and discharges into the CDID regional drainage ditches, where it is typically pumped to Coal Creek Slough via the main CDID pump station. Intermittently, water is pumped directly from CDID Ditch No. 14 directly to the Columbia River as a point discharge. This pathway will be monitored at the conditional POC associated with the surface water standard. At localized areas on site, perched groundwater is present on the riverward side of the CDID levee and is characterized by shallow wells. In these areas, perched groundwater migrates downward and mixes with the static groundwater characterized by deeper wells in the upper alluvium WBZ. The fate of fluoride along this pathway in which groundwater interacts with soil and surface water is complex and is discussed in detail in Section 6. Groundwater concentrations of fluoride measured in shallow wells at these locations are above 4 mg/L; however, concentrations of fluoride in deeper wells that are hydraulically connected to the Columbia River are generally below 4 mg/L. Based on empirical data from wells G6-S and G6-D, the average ratio of perched to static groundwater concentrations along the direct Columbia River pathway is greater than 100. In addition, because this portion of the Columbia River is tidally influenced, it is reasonable to assume that additional attenuation and fluoride precipitation would occur between the upland well and the point of discharge
Cleanup Action Requirements
RI/FS Report March 2012 Former Reynolds Metals Reduction Plant 106 110730-02
to the Columbia River. At similar sites along the Columbia River, an attenuation factor of 10 or greater has been observed. Therefore, it is appropriate to establish a groundwater REL in shoreline wells that is protective of surface water resources and above which, additional remedial action may be considered. Therefore, a conservative fluoride groundwater REL of 400 mg/L will be established and monitored in shallow wells located along the Columbia River shoreline.
8.3.4 Soil Cleanup Levels
The current and future site use plans include industrial storage and light industrial operations, and meet the requirement of a “traditional industrial use” under the MTCA regulations (Section 173-340-745 WAC). Thus, industrial use is the appropriate basis for development of site-specific soil cleanup levels using MTCA Method A and C procedures. Soil cleanup levels were developed for fluoride, PAHs, TPH, and PCBs by considering the following potential exposure/risk pathways:
• Human health protection from direct soil contact • Human health protection from soil-to-groundwater pathway exposure • Human health protection from soil-to-air pathway exposure • Terrestrial ecological protection
8.3.4.1 Direct Soil Contact Pathway Exposure
Future development plans at the site include grading of the existing site with a minimum of 12 inches of clean fill and asphalt pavement; therefore, direct contact exposures to soil will be minimized. The primary potential pathway for direct contact would occur during earthwork operations and other activities required for site development. Accordingly, cleanup levels were initially derived using Method C WAC Equations 173-340-745-1, -745-2, and -745-3 for non-carcinogenic, carcinogenic, and petroleum COCs, respectively. No modifications were made to the standard parameters for these equations. However, because the TSCA regulation for PCBs lists more restrictive cleanup levels than those derived under Method C, the initial PCB cleanup level was adjusted downward from 66 mg/kg to 10 mg/kg. This value is also consistent with the Method A concentration for Industrial Use scenarios.
Cleanup Action Requirements
RI/FS Report March 2012 Former Reynolds Metals Reduction Plant 107 110730-02
8.3.4.2 Soil-to-Groundwater Pathway Exposure
Cleanup levels based on Method C direct contact must also consider the protection of groundwater resources. However, when empirical data exists that indicates that current groundwater impacts are not occurring and sufficient time has elapsed for migration from source areas to the point of measurement to reinforce that demonstration, then cleanup levels derived for direct contact would not require adjustment. Under some remedial scenarios and in some parts of the site, groundwater resource protection may be achieved by other means (e.g., groundwater remediation measures). Section 5 discusses the groundwater monitoring that has been performed that demonstrates that site groundwater is currently in compliance with Method A cleanup levels. For PAHs, concentrations were observed below 0.1 µg/L (the Method A cleanup level for cPAH) and source control work is planned in SUs 9 and 11 to remove impacted soils above MTCA Method C cleanup levels to limit direct contact exposures. Concentrations of PAHs in groundwater at SU3 have been observed slightly above 0.1 µg/L in wells PZ-1 and PZ-4; however, these concentrations have reduced significantly since 2002 when cPAH concentrations were observed up to 1 µg/L in some wells. Therefore, the PAH soil cleanup level was not adjusted downward for protection of groundwater resources for these areas. Site-specific evaluations have been conducted to evaluate the factors controlling leaching of fluoride contained within the calcium-rich black mud and white mud deposits. As discussed in Section 6.1, the mineralogy of these materials limits the solubility and leachability of fluoride species. The extent of this influence can be observed in the measured Kd values developed using lysimeter and SPLP data (see Table 6-1). The average Kd value for these materials was 823 L/kg. MTCA Equation 173-340-747-1 (the standard 3-phase partitioning model is presented subsequently) is the standard approach used by Ecology to determine soil constituent concentrations protective of groundwater resources. However, because the solubility of fluoride is limited by pH and the availability of other ions (such as calcium and phosphate), Equation 173-340-747-1 is not an accurate method for predicting the leachability of fluoride. For example, as discussed in Section 6.2, when a calcium source is mixed with groundwater containing dissolved fluoride under neutral pH conditions, fluoride will react with calcium to precipitate fluorite. After the reaction occurs—thus, reducing fluoride concentrations in groundwater, while increasing fluoride concentrations in soil—a
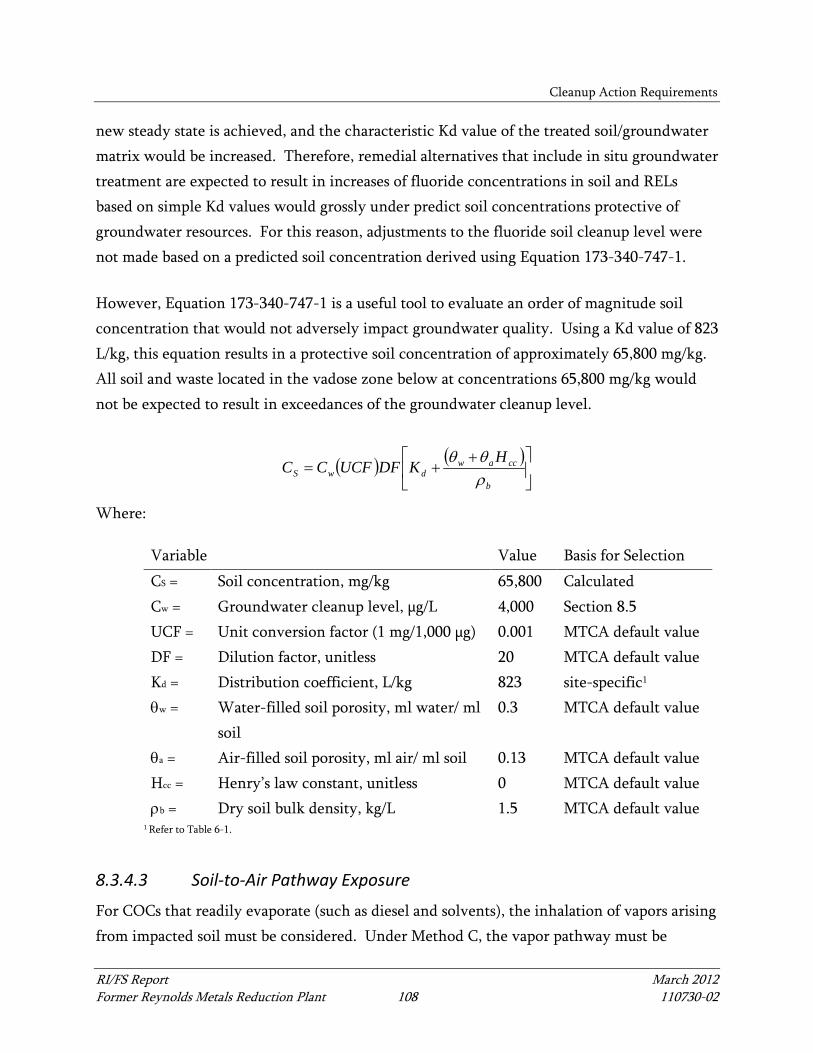
Cleanup Action Requirements
RI/FS Report March 2012 Former Reynolds Metals Reduction Plant 108 110730-02
new steady state is achieved, and the characteristic Kd value of the treated soil/groundwater matrix would be increased. Therefore, remedial alternatives that include in situ groundwater treatment are expected to result in increases of fluoride concentrations in soil and RELs based on simple Kd values would grossly under predict soil concentrations protective of groundwater resources. For this reason, adjustments to the fluoride soil cleanup level were not made based on a predicted soil concentration derived using Equation 173-340-747-1. However, Equation 173-340-747-1 is a useful tool to evaluate an order of magnitude soil concentration that would not adversely impact groundwater quality. Using a Kd value of 823 L/kg, this equation results in a protective soil concentration of approximately 65,800 mg/kg. All soil and waste located in the vadose zone below at concentrations 65,800 mg/kg would not be expected to result in exceedances of the groundwater cleanup level.
( ) ( )
++=
b
ccawdwS
HKDFUCFCCρθθ
Where:
Variable Value Basis for Selection CS = Soil concentration, mg/kg 65,800 Calculated Cw = Groundwater cleanup level, µg/L 4,000 Section 8.5 UCF = Unit conversion factor (1 mg/1,000 µg) 0.001 MTCA default value DF = Dilution factor, unitless 20 MTCA default value Kd = Distribution coefficient, L/kg 823 site-specific1 θw = Water-filled soil porosity, ml water/ ml
soil 0.3 MTCA default value
θa = Air-filled soil porosity, ml air/ ml soil 0.13 MTCA default value Hcc = Henry’s law constant, unitless 0 MTCA default value ρb = Dry soil bulk density, kg/L 1.5 MTCA default value
1 Refer to Table 6-1.
8.3.4.3 Soil-to-Air Pathway Exposure
For COCs that readily evaporate (such as diesel and solvents), the inhalation of vapors arising from impacted soil must be considered. Under Method C, the vapor pathway must be
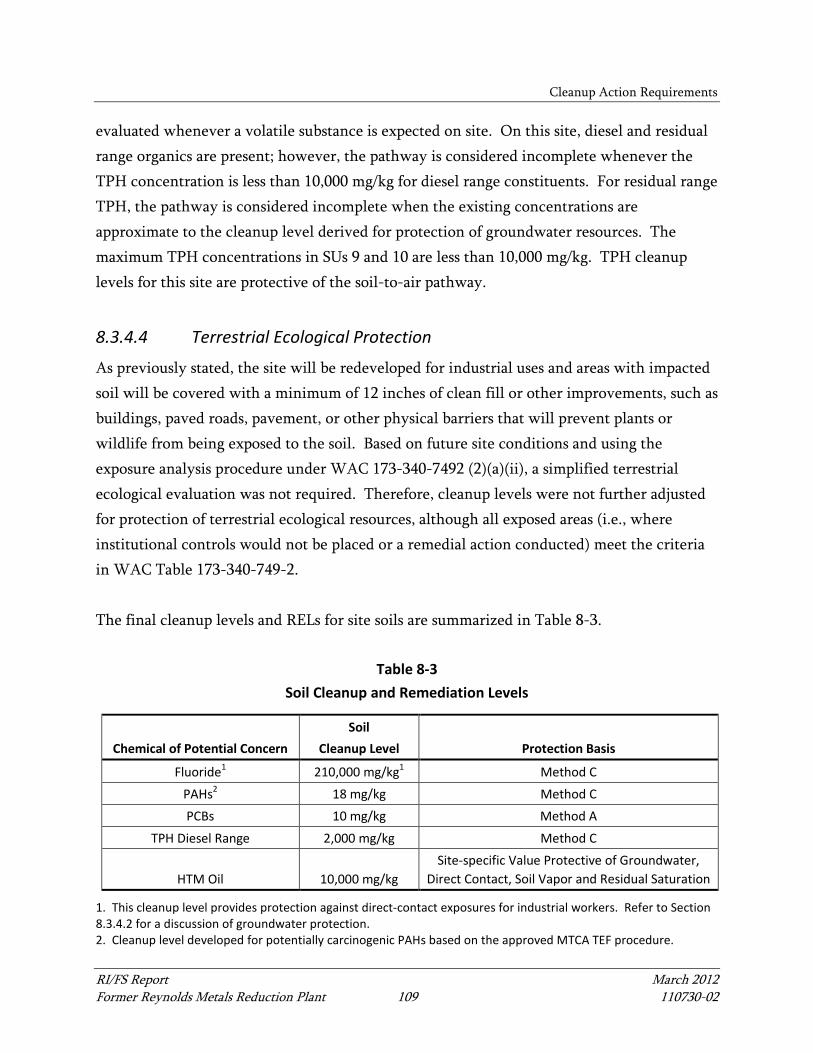
Cleanup Action Requirements
RI/FS Report March 2012 Former Reynolds Metals Reduction Plant 109 110730-02
evaluated whenever a volatile substance is expected on site. On this site, diesel and residual range organics are present; however, the pathway is considered incomplete whenever the TPH concentration is less than 10,000 mg/kg for diesel range constituents. For residual range TPH, the pathway is considered incomplete when the existing concentrations are approximate to the cleanup level derived for protection of groundwater resources. The maximum TPH concentrations in SUs 9 and 10 are less than 10,000 mg/kg. TPH cleanup levels for this site are protective of the soil-to-air pathway.
8.3.4.4 Terrestrial Ecological Protection
As previously stated, the site will be redeveloped for industrial uses and areas with impacted soil will be covered with a minimum of 12 inches of clean fill or other improvements, such as buildings, paved roads, pavement, or other physical barriers that will prevent plants or wildlife from being exposed to the soil. Based on future site conditions and using the exposure analysis procedure under WAC 173-340-7492 (2)(a)(ii), a simplified terrestrial ecological evaluation was not required. Therefore, cleanup levels were not further adjusted for protection of terrestrial ecological resources, although all exposed areas (i.e., where institutional controls would not be placed or a remedial action conducted) meet the criteria in WAC Table 173-340-749-2. The final cleanup levels and RELs for site soils are summarized in Table 8-3.
Table 8-3 Soil Cleanup and Remediation Levels
Chemical of Potential Concern Soil
Cleanup Level Protection Basis
Fluoride1 210,000 mg/kg1 Method C PAHs2 18 mg/kg Method C PCBs 10 mg/kg Method A
TPH Diesel Range 2,000 mg/kg Method C
HTM Oil 10,000 mg/kg Site-specific Value Protective of Groundwater,
Direct Contact, Soil Vapor and Residual Saturation
1. This cleanup level provides protection against direct-contact exposures for industrial workers. Refer to Section 8.3.4.2 for a discussion of groundwater protection. 2. Cleanup level developed for potentially carcinogenic PAHs based on the approved MTCA TEF procedure.
Cleanup Action Requirements
RI/FS Report March 2012 Former Reynolds Metals Reduction Plant 110 110730-02
8.3.4.5 Point of Compliance
The standard POC for direct contact with soils extends from the ground surface to the reasonable estimated depth of potential future soil excavations (e.g., to accommodate deep foundations or similar facilities), which can extend to 15 feet bgs or deeper [see WAC 173-340-740(6)(d)]. As set forth in WAC 173-340-740(6)(f), for MTCA cleanup actions that involve containment of hazardous substances, soil cleanup levels will typically not be met at the standard POC in soils shallower than 15 feet bgs. In these cases, the cleanup action consisting of engineered caps, may be determined to comply with cleanup standards, provided that:
• The selected remedy is permanent to the maximum extent practicable using the procedures in WAC 173-340-360 (see Section 10)
• The cleanup action is protective of human health and the environment • The cleanup action is demonstrated to be protective of terrestrial ecological receptors
under WAC 173-340-7490 through 173-340-7494, as described herein • Institutional controls are put in place under WAC 173-340-440 that prohibit or limit
activities that could interfere with the long-term integrity of the containment system (see Section 10)
• Compliance monitoring under WAC 173-340-410 and periodic reviews under WAC 173-340-430 are designed to ensure the long-term integrity of the containment system (see Section 10)
• The types, levels, and amount of hazardous substances remaining on-site and the measures that will be used to prevent migration and contact with those substances will be specified in the draft CAP
RI/FS Report March 2012 Former Reynolds Metals Reduction Plant 111 110730-02
9 SCREENING OF CLEANUP TECHNOLOGIES
In this section, cleanup technologies are evaluated following MTCA guidance for possible implementation at the site. Potentially applicable technologies are identified and retained for assembly of site-specific alternatives in Section 10. Cleanup technologies are typically organized under General Response Actions that represent different conceptual approaches to remediation. At the site, the following five general response actions have been identified:
• Institutional Controls • Monitored Natural Attenuation • In Situ Containment • In Situ Treatment • Removal with On-site Consolidation/Containment or Off-site Disposal
Technology screening begins by identifying available technologies that will not address site COCs or are not able to be implemented for technical reasons. These technologies are eliminated at this initial screening stage. Retained technologies are evaluated further and for each affected medium (soil, waste material, and groundwater). Cleanup technologies under the same general response action are evaluated relative to one another on the basis of the following three criteria:
• Effectiveness. The effectiveness criterion evaluates the technology for its protectiveness and reduction in contaminant toxicity, mobility, or volume. Both short-term and long-term effectiveness are evaluated. Short-term effectiveness addresses the construction and implementation periods. Long-term effectiveness evaluates the technology after the action is in place.
• Implementability. The implementability criterion evaluates the technology for technical and administrative feasibility. Technical feasibility refers to the ability to construct, operate, maintain, and monitor the action during and after construction and meet technology-specific regulation during construction. Administrative feasibility refers to the ability to obtain permits for off-site actions and availability of specific equipment and technical specialists.
Screening of Cleanup Technologies
RI/FS Report March 2012 Former Reynolds Metals Reduction Plant 112 110730-02
• Cost. The cost criterion is used to compare different technologies. Typically, the full cost of a given technology cannot be determined at this screening level; however, knowledge of typical technology costs obtained from vendors, cost-estimating guides, prior projects, and engineering judgment are used to determine the relative cost of a technology compared with similar technologies.
9.1 Institutional Controls
Institutional controls are measures undertaken to limit or prohibit activities that may interfere with a cleanup action or result in exposure to hazardous substances. They may be physical restrictions, such as fences, or legal restrictions, such as use limitations recorded on the property deed. Potentially applicable institutional controls include the following:
• Fences and warning signs to control access to the site or specific areas on the site • Deed restrictions addressing land use and soil excavation • Deed restrictions to preclude drinking water use • Use restrictions and monitoring requirements to prevent disturbance of caps or other
engineered controls All of the above institutional controls are potentially effective at preventing exposure to hazardous substances, are easy to implement, and can be implemented at relatively low cost. Therefore, they have been retained for further consideration.
9.2 Natural Attenuation
Natural attenuation is the reduction in concentrations of COCs in soil, groundwater, and surface water through a combination of naturally occurring physical, chemical, and biological processes. As a general response action, monitored natural attenuation provides monitoring to document the presence and effectiveness of natural processes removing or containing site COCs. Measures to enhance natural processes are considered under the In Situ Treatment general response action. Natural attenuation is an important mechanism affecting
Screening of Cleanup Technologies
RI/FS Report March 2012 Former Reynolds Metals Reduction Plant 113 110730-02
contaminant fate and transport under any cleanup action involving contaminant mass left in place. Furthermore, the results of the groundwater fate and transport study presented in the RI Report indicate that natural attenuation processes are occurring. Residual groundwater impacts would likely persist upon waste/affected media removal due to the low permeability nature of the shallow aquifer materials. Enhanced natural attenuation, such as the addition of reactive materials to standard excavation backfill, is also effective and is discussed in Section 9.4.1. As a standalone technology, monitored natural attenuation is highly implementable and cost effective at the site. Therefore, monitoring of natural attenuation was carried forward for more detailed analysis in this FS.
9.3 In Situ Containment
In situ containment involves confining hazardous substances in situ through placement of physical barriers. Containment technologies may be designed to prevent contact with and/or migration of the hazardous substances. Use of in situ containment technologies typically results in minimal short-term releases of hazardous substances during construction and can provide a relatively lower cost, effective method of reducing the potential for exposure. The main disadvantage is that containment technologies do not typically result in a reduction in containment mass, volume, or toxicity. A common method of controlling exposure to soils containing elevated concentrations of COCs is to place an engineered cap over the materials. The long-term cap integrity can be maintained through implementation of appropriate institutional controls. Where practicable, the placement of clean cover materials as necessary to achieve adequate cap thickness may be separated from underlying potentially impacted materials with a marker indicating the cap boundary. Process options for soil capping include the following:
Screening of Cleanup Technologies
RI/FS Report March 2012 Former Reynolds Metals Reduction Plant 114 110730-02
• Soil Cover. Placing clean soil on the surface provides a barrier that prevents exposure to underlying soil but allows stormwater to infiltrate. Soil covers are generally permeable and when implemented without additional measures would not address the soil-to-groundwater/surface water pathway for soils beneath the cap. Total cover thicknesses of 2 feet are typical in this application, potentially varying based on specific land uses and the presence of existing clean cover materials.
• Low-Permeability Capping. A low permeability cap, constructed of low-permeability soils such as compacted sandy, clay, would not only prevent exposure to underlying soils, but would also reduce stormwater infiltration through potentially impacted materials, thereby reducing mobility of contaminants located in the unsaturated soil zone. Engineered materials could also be used in areas requiring a durable surface, such as high-traffic areas.
• Impermeable Cap. An impermeable cap, constructed of a combination of engineered materials such as geosynthetic fabrics or asphalt, in combination with soil layers, is a third and more-protective, but also more expensive alternative. In addition to preventing exposure to underlying soils, this cap also eliminates stormwater infiltration through potentially impacted materials, thereby reducing mobility of contaminants located in the unsaturated soil zone.
Both soil cover and low-permeability capping are proven, effective technologies that are easily implemented at the site. Low-permeability caps are more costly than soil cover, but the added protection may be appropriate under some conditions to reduce infiltration. Therefore, both of these technologies have been retained for further consideration of impacted soil containment. Impermeable caps are significantly more expensive to construct and maintain. The overall benefits are only moderately incremental over low-permeability caps in that shallow groundwater is present at the site and the reduction of infiltration relative to the low-permeability caps are not significant enough to warrant the additional expense. Impermeable caps have not been retained for further consideration.
9.4 In Situ Treatment
A common approach to site remediation is the application of in situ technologies that address contaminant occurrences in the subsurface without removing large volumes of impacted
Screening of Cleanup Technologies
RI/FS Report March 2012 Former Reynolds Metals Reduction Plant 115 110730-02
materials. In situ treatment technologies can potentially reduce the concentration, mobility, and/or toxicity of COCs. They can also minimize potential releases of hazardous substances and the amount of waste generated. The disadvantage of many in situ treatment technologies is that their effectiveness can be limited by subsurface conditions that create inefficiencies in treatment processes. In situ treatment can be applied to both soil and groundwater. In general if source material is removed, in situ treatment can be applied to address residual groundwater impacts. In situ treatments relevant for this project include: direct injection of chemical reagents to stabilize or solidify soil, permeable reactive barriers, and backfill amended with reactive agents.
9.4.1 In Situ Soil Treatment
Stabilization. Depending on in situ conditions, chemical reagents can be injected or mixed directly into a potential source area to address elevated soil and groundwater conditions. Ideally, the chemical reagents would react with the soil or the COCs in the groundwater to reduce the concentration of COCs or decrease their mobility. The effectiveness of this technology can be limited in heterogeneous and low-permeability soils or where there is extensive debris due to poor distribution of the reagents. Because the SUs tend to contain variable, low-permeability soils and due to the uncertainty of stabilization effectiveness for complete fluoride treatment, this technology was not retained for further consideration. Solidification. In this technology, soil is stabilized by adding amendments to immobilize contaminants resulting in a low-permeability, subsurface mass. Potential amendments include pozzolans and cement. Amendments can be mixed with soil in situ. This treatment method does not destroy contaminants and often increases the volume of impacted material. The additional volume generated by this technology and the cost of in situ stabilization is typically more expensive compared to more reliable, ex situ methods; therefore, this technology has not been retained for consideration.
9.4.2 In Situ Groundwater Treatment
Permeable Reactive Barriers. Permeable reactive barriers (PRBs) consist of constructed and backfilled trenches built vertically and perpendicular to the groundwater flow path to intercept the flow. The trenches would be backfilled with a permeable mixture of reactive
Screening of Cleanup Technologies
RI/FS Report March 2012 Former Reynolds Metals Reduction Plant 116 110730-02
materials that are engineered to decrease the concentrations of COCs in the groundwater as it is allowed to pass through. In the case of fluoride treatment, the PRB trenches would be backfilled with a combination of bone meal as a calcium delivery mechanism and limestone to modify the groundwater pH. Bench scale testing would be performed during remedial design and prior to installation to fine tune the design approach. PRB trenches require minimal maintenance and operational costs. This technology was retained for its proven effectiveness at similar applications, its ability to be implemented, and its relatively low cost. Backfill Amended with Reactive Agents. In areas where excavation would occur below the seasonal high water table, backfill can be amended with a reactive agent to promote long-term reduction of residual COCs concentrations in groundwater. The backfill would consist primarily of typical soil backfill mixed on site with the same reactive agents used in the PRBs. The amended backfill enhances the natural attenuation processes that are occurring on site and would potentially reduce the restoration timeframe of impacted site groundwater. This technology is cost-effective and could easily be implemented at the site. For these reasons it was retained for consideration.
9.5 Removal and Ex Situ Treatment or Disposal
Removal of impacted soil and waste has been widely applied at remediation sites. Removed impacted materials are treated and/or disposed of either on site or at an off-site, permitted disposal facility. This general response action has the advantage of providing (where practicable) the greatest removal of contaminants from a site. Main disadvantages include the potential for short-term releases of hazardous substances during removal operations and technical limitations to removing materials below the groundwater table, particularly near surface water bodies. Additionally, this technology can become prohibitively expensive as material volumes increase and wastes, some potentially hazardous, are generated. Potentially applicable technologies for removal and ex situ treatment and/or disposal of impacted media are presented below.
9.5.1 Soil Removal Technologies
Impacted soils can be effectively removed by dry excavation or dredging (excavation below the groundwater elevation); however, some limitations exist as noted in the following evaluation.
Screening of Cleanup Technologies
RI/FS Report March 2012 Former Reynolds Metals Reduction Plant 117 110730-02
Dry Excavation. Excavators, backhoes, and other conventional earth moving equipment are the most common equipment used to remove impacted soil from upland areas. Dry excavation of soil below the groundwater table may also be facilitated through the installation of temporary cofferdams or sheet pile walls and the subsequent lowering of the groundwater table. Dry excavation is a proven method; however, costs associated with dewatering and groundwater drawdown can be substantial and dewatered fluids would require disposal or treatment prior to discharge. Therefore, dry excavation is retained for removal of soils above and just below the groundwater table. Wet excavation. Wet excavation is a method of excavation that allows the removal of soil below the groundwater table without the necessary dry conditions required of traditional methods. The major drawback of this method is that the excavated material has moisture contents up to 50 percent by volume. This material must be dewatered prior to transport off-site disposal. Partial dewatering can also be accomplished by pumping overlying water into temporary containment prior to treatment and/or disposal. Costs associated with processing and disposal of this additional waste product can be high. Wet excavation is retained for limited areas where excavations are conducted at depths more than a few feet below the groundwater table.
9.5.2 Soil Consolidation and Disposal
Excavated soils may either be disposed of directly or treated, using one or more of the technologies retained in the analysis above, and then disposed. Disposal options for soil are described in the following paragraphs. Beneficial Use of Black Mud. Excavated black mud has some commercial value and could be used beneficially for energy recovery if the appropriate approvals are granted by Ecology and EPA. At this time, however, this option has significant regulatory hurdles and, therefore, is not retained for remedial alternative development in Section 10. In the event a viable option to beneficially use this material becomes available, the Respondents will consult with Ecology and apply for the appropriate regulatory approvals.
Screening of Cleanup Technologies
RI/FS Report March 2012 Former Reynolds Metals Reduction Plant 118 110730-02
On-site Consolidation. Materials and soil excavated in areas can be consolidated into one or more locations beneath covers or caps to minimize the potential for direct contact and migration of COCs to groundwater. On-site consolidation and containment is less costly than off-site landfill disposal, but requires long-term on-site management of impacted materials. The technology is cost-effective and reduces the overall footprint of impacted material. On-site consolidation is consistent with Ecology expectations in WAC 173-340-370(5) that when materials remain on site at concentrations in excess of cleanup levels, those materials shall be consolidated to the maximum extent practicable when needed to minimize the potential for direct contact and migration of COCs. Therefore, it is retained for use in alternative development in Section 10. Off-site Landfill Disposal. Impacted soils from the site may be transported to an off-site, permitted disposal facility. This disposal method provides for secure, long-term containment of non-hazardous and hazardous solid wastes. While this can be cost-prohibitive for larger volumes of material, the technology will be retained for further development in Section 10.
9.5.3 Groundwater Pump and Treat Systems
Migration of contaminants dissolved in groundwater can be controlled by pumping groundwater from vertical wells or trenches, creating a capture zone within which groundwater flows toward the wells for extraction. The effectiveness of this technology to completely capture impacted groundwater is often limited at sites with heterogeneous soils. Hydraulic containment of groundwater through pumping is also a proven technology, but potential groundwater extraction rates at the site are expected to be quite high because of the adjacent river and large impacted areas. Operational costs would also be very high due to the required number of extraction wells, the large volume of water extracted and required subsequent treatment prior to being discharged. For these reasons, groundwater pumping and treatment is not a practicable cleanup method at the site in lieu of other technologies which directly treat site COCs in situ. Accordingly, this technology has not been retained for further detailed evaluation in this FS.
RI/FS Report March 2012 Former Reynolds Metals Reduction Plant 119 110730-02
10 DESCRIPTION OF CLEANUP ALTERNATIVES
The previous section describes potentially applicable remedial technologies and process options for the site, and evaluates those technologies based on the MTCA criteria of relative cost, effectiveness, and implementability, for application to the site. In this section, these retained technologies are combined to formulate a range of remedial action alternatives. Numerous combinations of suitable cleanup technologies can be grouped to create alternatives to address the site COCs. The remedial alternatives have been limited to compatible cleanup technologies that are combined with the goal of protecting human health and the environment. The alternatives listed below include different combinations of natural attenuation, containment, removal, disposal, and treatment. The alternatives present a full range of potential remediation options available for the site, and highlight tradeoffs associated with implementation of different remedial technologies, consistent with the objectives of the FS. The following sections include descriptions of each of the six alternatives carried forward into the detailed FS evaluation. The alternatives are arranged in general order of MTCA preference with respect to degree of permanence as reflected in generally increasing removal/disposal/treatment volumes and costs. Section 11 presents a detailed MTCA evaluation of each alternative. The following six remedial alternatives were developed for consideration at the site.
• Alternative 1. Institutional Controls and Natural Attenuation • Alternative 2. Localized Removal and Off-site Disposal, Soil Capping, Natural
Attenuation, and Institutional Controls • Alternative 3. Localized Removal and Off-site Disposal, Excavation and
Consolidation, Groundwater Treatment, Soil Capping, Natural Attenuation, and Institutional Controls
• Alternative 4. Localized Removal and Off-site Disposal, Excavation and Consolidation, Groundwater Treatment, Low-Permeability Capping, Natural Attenuation, and Institutional Controls
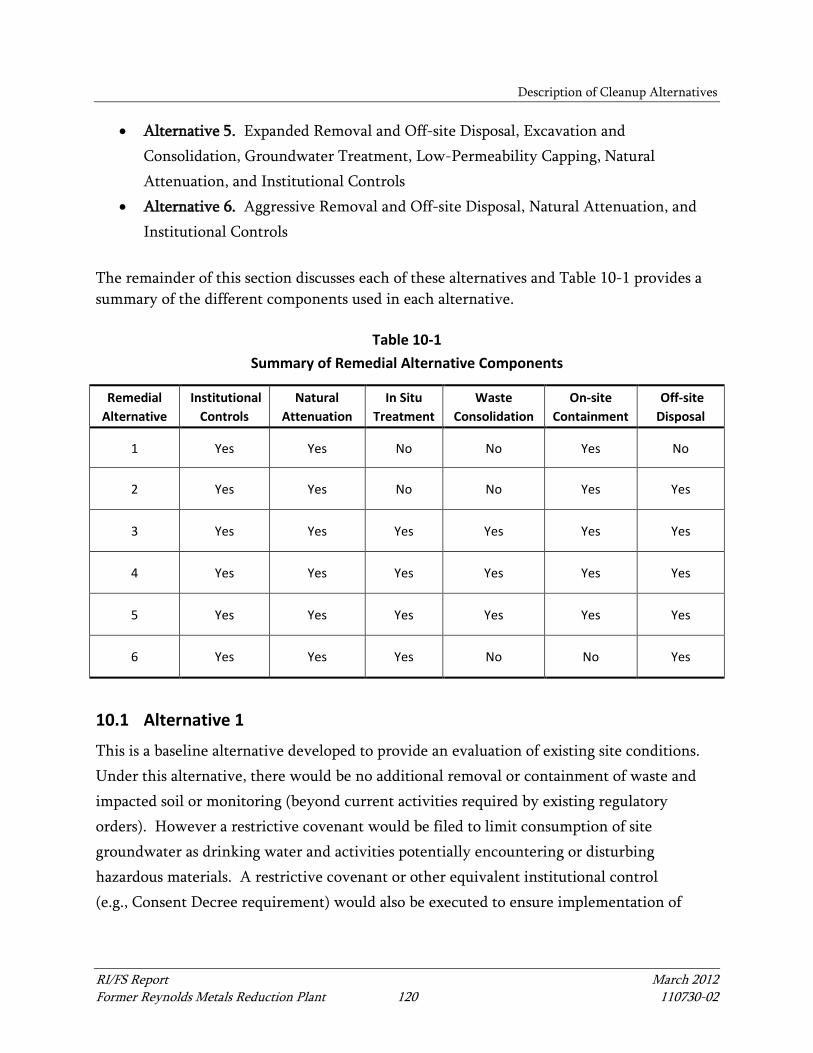
Description of Cleanup Alternatives
RI/FS Report March 2012 Former Reynolds Metals Reduction Plant 120 110730-02
• Alternative 5. Expanded Removal and Off-site Disposal, Excavation and Consolidation, Groundwater Treatment, Low-Permeability Capping, Natural Attenuation, and Institutional Controls
• Alternative 6. Aggressive Removal and Off-site Disposal, Natural Attenuation, and Institutional Controls
The remainder of this section discusses each of these alternatives and Table 10-1 provides a summary of the different components used in each alternative.
Table 10-1 Summary of Remedial Alternative Components
Remedial Alternative
Institutional Controls
Natural Attenuation
In Situ Treatment
Waste Consolidation
On-site Containment
Off-site Disposal
1 Yes Yes No No Yes No
2 Yes Yes No No Yes Yes
3 Yes Yes Yes Yes Yes Yes
4 Yes Yes Yes Yes Yes Yes
5 Yes Yes Yes Yes Yes Yes
6 Yes Yes Yes No No Yes
10.1 Alternative 1
This is a baseline alternative developed to provide an evaluation of existing site conditions. Under this alternative, there would be no additional removal or containment of waste and impacted soil or monitoring (beyond current activities required by existing regulatory orders). However a restrictive covenant would be filed to limit consumption of site groundwater as drinking water and activities potentially encountering or disturbing hazardous materials. A restrictive covenant or other equivalent institutional control (e.g., Consent Decree requirement) would also be executed to ensure implementation of
Description of Cleanup Alternatives
RI/FS Report March 2012 Former Reynolds Metals Reduction Plant 121 110730-02
appropriate construction methods for future land use development as needed, including subsurface utilities and structural piling.
10.2 Alternative 2
This alternative focuses on preventing direct contact with affected media, specifically remaining waste materials and soils and groundwater with elevated COC concentrations. Containment technologies are used to achieve compliance with cleanup levels at the site, including placement of soil cover over areas of concern and backfilling select on-site ditches that intercept groundwater. Upland soil covers would be constructed in most impacted areas. Treatment is provided through the construction of a PRB along the western edge of SU2. Long-term monitoring would be performed to verify groundwater natural attenuation. Figure 10-1 displays the proposed remedial technologies associated with Alternative 2 and Table 10-2 provides a summary list of the technologies separated by focused zones of treatment and the associated SUs. Specific components include the following:
• Restrictive Covenant. A restrictive covenant would be filed to limit consumption of site groundwater as drinking water, the disturbance of soil covers, and activities potentially encountering or disturbing hazardous materials. A restrictive covenant or other equivalent institutional control (e.g., Consent Decree requirement) would also be executed to ensure implementation of appropriate construction methods for future land use development as needed, including subsurface utilities and structural piling.
• Soil Cover. Areas with soils and waste exceeding cleanup levels would be covered with clean soil to prevent future exposure to the affected material. The design of the cover would consist of an approximate 1.5-foot layer of clean soil overlain by an operating surface. The thickness and composition of the operating surface would depend on the proposed use of the area. For light uses, a clean soil cap with topsoil and hyrdroseed would be sufficiently protective. For moderate uses, such as light vehicle traffic, compaction and a gravel surface or other engineered design may be appropriate. Some moderate consolidation and grading of individual areas is likely to occur to facilitate post-construction drainage and to minimize the overall footprint of source material. Specific SUs that would receive potential grading and enhancement of an existing soil cover include SUs 1, 2, 5, 6, and 7. A new soil cover would be constructed at SUs 3, 8, and 10. SU4 would receive a full soil cover and additional
Description of Cleanup Alternatives
RI/FS Report March 2012 Former Reynolds Metals Reduction Plant 122 110730-02
backfill to match adjacent grade in the easternmost ditch (i.e., the cryolite ditch) and an average 6-inch cover in the two westernmost ditches (i.e., the railroad and angle ditches). The former SPL ditch in SU5 would also be backfilled to meet adjacent grades.
• Soil Removal and Off-site Disposal. For SUs where small volumes of material with COCs exceeding cleanup levels are present, specifically SUs 9 and 11, the material will be removed from the site and disposed of at an approved off-site disposal facility. This will minimize the need for long-term management of the impacted material on-site and remove smaller source areas. Material from SU9 could potentially designate as dangerous waste due to elevated PAH concentrations. If so, it would be transported to a Subtitle C facility, which was assumed for the purposes of preparing the alternatives cost estimate. Material from SU11 is expected to designate as solid waste and would be transported to a Subtitle D facility.
• Monitoring. The monitoring program would focus on occurrence of COCs in groundwater downgradient of affected areas at the points of compliance established in Section 8.3 to document natural attenuation at the site. Depending on the alternative, existing monitoring well locations may be decommissioned if they are in the footprint of an excavation or cap and/or additional wells may be installed to better capture a point of compliance. The program would also include surface water monitoring. For cost estimating purposes the following frequency of events was occurred over a 30 year period. Ten quarterly and 20 annual events would be conducted within the West Groundwater Area, and five quarterly and 25 annual events would be conducted within the East Groundwater Area.
10.3 Alternative 3
Alternative 3 includes all of the remedial technologies identified in Alternative 2 with the addition of focused remedial excavation and on-site consolidation of two SUs (2 and 10), the construction of two permeable reactive barriers, and the upgrade to reactive backfill within select SUs. The waste consolidation removes materials located on the riverward side of the CDID levee and increases the areas of the site that would comply with the standard soil point of compliance. Long-term monitoring would be conducted to verify remedy effectiveness and natural attenuation of groundwater and surface water resources at the points of
Description of Cleanup Alternatives
RI/FS Report March 2012 Former Reynolds Metals Reduction Plant 123 110730-02
compliance. Figure 10-2 displays the proposed remedial technologies associated with Alternative 3 and Table 10-2 provides a summary list of the technologies separated by focused zones of treatment and the associated SUs. The additional components specifically include the following:
• Restrictive Covenant. • Permeable Reactive Barrier. A PRB would be constructed along the western
perimeter of SU2 to intercept groundwater flow that flows through the area and likely interacts with surface water in the adjacent CDID ditch. A second PRB would be constructed around SU3 at locations that intercept down-gradient groundwater that flows towards on-site and CDID drainage ditches. The PRBs would consist of a 3-foot-wide by 20-foot-deep trench filled with a mixture of bone meal and limestone.
• Soil Cover. Specific SUs that would receive potential grading and a soil cover under this alternative include SUs 1, 2, 3, 5, 6, 7, and 8. The cryolite ditch in SU4 would receive a full soil cover and additional backfill to match adjacent grade. The former SPL ditch in SU5 would also be backfilled to meet adjacent grades. All surfaces would be hydroseeded, except for SUs 3 and 5, which would be surfaced with compacted gravel.
• Waste Consolidation. Deposits from SU10 would be dry excavated, transported, and consolidated on top of the white mud deposits at SU7. The consolidated unit would then be covered with soil cover to prevent exposure to affected media. The SU10 excavation would be backfilled with imported fill and resurfaced with topsoil and hydroseed. SU2 is the second area to be excavated and consolidated. The purpose of the SU2 consolidation is to simplify the construction of the soil cover and minimize the footprint of the waste deposit.
• Reactive Backfill. Backfill consisting of a mixture of bone meal, limestone, and sand would be placed in lieu of standard import backfill below the groundwater table in locations where fluoride concentrations exceed groundwater cleanup levels. Under Alternative 3, these areas would specifically include portions of SU2 and the cryolite and former SPL ditches. The ditches would only receive soil cover as part of Alternative 2 and this upgrade is intended to augment groundwater treatment. It would also replace the 6-inch soil cover in the railroad and angle ditches with 6-inches of reactive backfill. The SU2 excavation would be resurfaced with topsoil and hydroseed.
Description of Cleanup Alternatives
RI/FS Report March 2012 Former Reynolds Metals Reduction Plant 124 110730-02
• Low-Permeability Cap. A low-permeability cap would be constructed over SU6 consisting of a minimum 2-foot layer of compacted clay or sand/silt/clay mixture. The low-permeability layer would be covered with a minimum 6-inch layer of topsoil and hydroseed. The cap area would be graded with a minimum 2 percent grade to prevent ponding of surface water on the cap surface.
• Soil Removal and Off-site Disposal. Material from SU9 would be excavated and profiled for disposal. For costing purposes, transport to a Subtitle C facility was assumed. Material from SU11 would be excavated and transported to a Subtitle D facility. The surface of SU9 would be resurfaced with gravel, while the SU11 excavation would be backfilled with imported fill.
• Monitoring. For cost estimating purposes the following frequency of events was occurred over a 30-year period. Ten quarterly and 20 annual events would be conducted within the West Groundwater Area, and five quarterly and 25 annual events would be conducted within the East Groundwater Area.
10.4 Alternative 4
Under this alternative, groundwater areas are addressed by additional treatment measures in an effort to reduce the restoration timeframe; additional areas of affected soils and waste would be managed by a combination of excavation, disposal and backfilling, and on-site consolidation; areas of remaining or consolidated wastes would be capped with a low-permeability soil to reduce infiltration and further isolate affected media. Figure 10-3 displays the proposed remedial technologies associated with Alternative 4 and Table 10-2 provides a summary list of the technologies separated by focused zones of treatment and the associated SUs. Specific components include the following:
• Restrictive Covenant. • Permeable Reactive Barrier. A PRB would be constructed on the west side of SU2. • Reactive Backfill. Under Alternative 4, these areas would specifically include
portions of SU2, SU3, SU5, and the cryolite and former SPL ditches. It would also replace the 6-inch soil cover in the railroad and angle ditches. The excavations at SU2 would be resurfaced with topsoil and hydroseed. SUs 3 and 5 would be resurfaced with gravel.
Description of Cleanup Alternatives
RI/FS Report March 2012 Former Reynolds Metals Reduction Plant 125 110730-02
• Waste Consolidation. Deposits from SUs 3 and 5 would be dry excavated using limited dewatering to the extent practicable. Wet excavation of SU3 may be required in some areas. Material from SUs 3 and 5 would be consolidated on top of SU6 and covered with a low-permeability cap. The remaining excavation would be backfilled to grade using sand and reactive material below the groundwater table. SU8 would be dry excavated and consolidated within SU7. The base of the SU8 excavation would be regarded to match surrounding grade and resurfaced with topsoil and hydroseed. Deposits from SUs 3 and 5 would be excavated, transported, and consolidated with black mud deposits at SU 6. This consolidated media would then be capped to prevent exposure to affected media. Waste at SUs 2 and 10 would be consolidated and backfilled and/or resurfaced in the same manner as in Alternative 3.
• Low-Permeability Cap. A low-permeability cap would be constructed over SUs 1, 6, and 7 with a surface consisting of a minimum 6-inch layer of topsoil and hydroseed.
• Soil Removal and Off-site Disposal. Material from SU9 would be excavated and profiled for disposal. For costing purposes, transport to a Subtitle C facility was assumed. Material from SU11 would be excavated and transported to a Subtitle D facility. The surface of SU9 would be resurfaced with gravel, while the SU11 excavation would be backfilled with imported fill.
• Monitoring. For cost estimating purposes the following frequency of events was occurred over a 30 year period. Ten quarterly and four annual events would be conducted within the West Groundwater Area, and five quarterly and 9 annual events would be conducted within the East Groundwater Area.
10.5 Alternative 5
This alternative is similar to Alternative 4, but with expanded groundwater treatment and significantly expanded removal and off-site disposal of source areas. Figure 10-4 displays the proposed remedial technologies associated with Alternative 5 and Table 10-2 provides a summary list of the technologies separated by focused zones of treatment and the associated SUs. Specific components include the following:
• Restrictive Covenant. • Permeable Reactive Barrier. A PRB would be constructed on the west side of SU2. In
addition to the previously-discussed PRBs, an additional PRB would be around the
Description of Cleanup Alternatives
RI/FS Report March 2012 Former Reynolds Metals Reduction Plant 126 110730-02
northern and eastern perimeter of SUs 7 and 8 to provide further protection against groundwater COC migration. This PRB would be constructed to reduce the restoration timeframe and reduce the potential for migration pathways at points of compliance.
• Waste Consolidation. Waste at SU2 would be consolidated in the same manner as in Alternatives 3 and 4.
• Reactive Backfill. Under Alternative 5, these areas would specifically include portions of SU2, SU3, SU5, and the cryolite and former SPL ditches. It would also replace the 6-inch soil cover in the railroad and angle ditches. The excavations at SU2 would be resurfaced with topsoil and hydroseed. SUs 3 and 5 would be resurfaced with gravel.
• Low-Permeability Cap. A low-permeability cap would be constructed over SUs 2, 6, and 7 with a surface consisting of a minimum 6-inch layer of topsoil and hydroseed.
• Soil Removal and Off-site Disposal. An expanded number of SUs where waste material with COCs exceeding the cleanup level is present will be addressed by soil removal and off-site disposal. Solid wastes from SUs 1, 8, 10, and 11 would be excavated and disposed of at a Subtitle D facility. Soils from SUs 3, 5, and 9 would be profiled, excavated and disposed of at an appropriately permitted, off-site landfill facility. For cost estimating purposes, material from SUs 3, 5, and 9 were assumed to require Subtitle C disposal. SU8 would be resurfaced with topsoil and hydroseed, SU 9 would be resurfaced with gravel, and excavations at SUs 10 and 11 would be backfilled with imported fill.
• Monitoring. For cost estimating purposes the following frequency of events was occurred over a 30 year period. Ten quarterly and four annual events would be conducted within the West Groundwater Area, and five quarterly and 9 annual events would be conducted within the East Groundwater Area.
10.6 Alternative 6
This alternative consists of the removal of affected soils and waste to achieve cleanup levels. The goal of this alternative is to minimize the restrictions and institutional controls necessary at the site by removing and disposing of known waste material off-site. Figure 10-5 displays the proposed remedial technologies associated with Alternative 6 and Table 10-2 provides a
Description of Cleanup Alternatives
RI/FS Report March 2012 Former Reynolds Metals Reduction Plant 127 110730-02
summary list of the technologies separated by focused zones of treatment and the associated SUs. Specific components include the following:
• Restrictive Covenant. • Permeable Reactive Barrier. A PRB would be constructed on the west side of SU2
and expanded north along the length of the CDID Ditch No. 14. This PRB would be constructed to reduce the restoration timeframe and reduce the potential for migration pathways at points of compliance.
• Reactive Backfill. Under Alternative 6, these areas would specifically include SU2, SU3, SU5, and the cryolite and former SPL ditches. It would also replace the 6-inch soil cover in the railroad and angle ditches. The excavations at SU2 would be resurfaced with topsoil and hydroseed. SUs 3 and 5 would be resurfaced with gravel.
• Soil Removal and Off-site Disposal. Under this alternative material from all SUs would be excavated and disposed of off site. Solid wastes from SUs 1, 7, 8, 10, and 11 would be excavated and disposed of at a Subtitle D facility. Soils from SUs 2, 3, 5, 6, and 9 would be profiled, excavated and disposed of at an appropriately permitted, off-site landfill facility. For cost estimating purposes, material from SUs 2, 3, 5, 6, and 9 were assumed to require Subtitle C disposal. Excavations at SUs 6, 7, and 8 would be resurfaced with topsoil and hydroseed, SU9 would be resurfaced with gravel, and excavations at SUs 10 and 11 would be backfilled with imported fill.
• Monitoring. For cost estimating purposes the following frequency of events was occurred over a 30 year period. Eight quarterly events would be conducted within the West Groundwater Area, and three quarterly would be conducted within the East Groundwater Area.
RI/FS Report March 2012 Former Reynolds Metals Reduction Plant 128 110730-02
11 EVALUATION OF CLEANUP ALTERNATIVES
This section provides a comparative evaluation of the six remedial alternatives described in Section 10, to support selection of a preferred cleanup action in accordance with MTCA requirements. MTCA identifies specific criteria against which alternatives are to be evaluated, and categorizes them as either “threshold” or “other” criteria. All cleanup actions must at a minimum meet the requirements of the threshold criteria. The other MTCA criteria are considered when selecting from among the alternatives that fulfill the threshold requirements. The six remedial alternatives are evaluated against the threshold criteria in Section 11.1 and against the other MTCA criteria in Section 11.2.
11.1 Minimum Requirements for Cleanup Actions
WAC 173-340-360(2) defines the minimum requirements that all remedial alternatives must achieve in order to for selection as a final cleanup action at a site. In this WAC section, MTCA identifies specific criteria against which alternatives are to be evaluated, and categorizes them as either “threshold” or “other” criteria. All cleanup actions must meet the requirements of the threshold criteria. The other MTCA criteria are considered when selecting from among the alternatives that fulfill the threshold requirements. This section provides an overview of these regulatory criteria. The consistency of each alternative with these criteria is then discussed in the subsequent sections.
11.1.1 Threshold Requirements
The MTCA threshold requirements for a selected cleanup action are as follows:
• Protect human health and the environment • Comply with cleanup standards (established in Section 8.3) • Comply with applicable state and federal laws (identified in Section 8.2) • Provide for compliance monitoring
The overall protectiveness that a cleanup alternative provides depends on its ability to meet cleanup standards for site COCs. Cleanup standards include a cleanup level and a location (i.e., POC) where compliance with the cleanup level must be demonstrated. Five of the six alternatives are expected to meet threshold criteria, although the estimated time required to
Evaluation of Cleanup Alternatives
RI/FS Report March 2012 Former Reynolds Metals Reduction Plant 129 110730-02
achieve compliance with cleanup standards at the standard POC will vary among the alternatives. The exception is Alternative 1, which upon evaluation, may not meet threshold requirements because the alternative relies primarily upon institutional controls, monitored natural attenuation, and monitoring. Alternatives which rely primarily on institutional controls must include permanent solutions if possible, in accordance with WAC 173-340-440(6). Natural attenuation can be considered a permanent solution and active remedial measure when the requirements of WAC 173-370(7) are met, which include source control activities implemented to the maximum extent practicable. The process to evaluate whether or not alternatives use permanent solutions to the maximum extent practicable is a component of the “other MTCA requirements’’ discussed in the following section. Therefore, all alternatives developed in Section 10 are assumed to meet MTCA threshold criteria and will be evaluated with respect to restoration timeframes and other relevant MTCA considerations are provided as part of the following disproportionate cost analysis (DCA).
11.1.2 Other MTCA Requirements
Other requirements for evaluating remedial alternatives for the selection of a cleanup action include the following:
• Use of permanent solutions to the maximum extent practicable (WAC 173-340-360(3)). MTCA specifies that when selecting a cleanup action, preference shall be given to actions that are “permanent solutions to the maximum extent practicable.” The regulations specify the manner in which this analysis of permanence is to be conducted. Specifically, the regulations require that the costs and benefits of each of the project alternatives be balanced using a DCA.
• Provide for a reasonable restoration timeframe (WAC 173-340-360(4)). MTCA places a preference on those alternatives that, while equivalent in other respects, can be implemented in a shorter period of time. MTCA includes a summary of factors that can be considered in evaluating whether a cleanup action provides for a reasonable restoration timeframe.
• Consider public concerns (WAC 173-340-360). Ecology considers public concerns by making draft copies of remedial decision documents available for review and comment.
Evaluation of Cleanup Alternatives
RI/FS Report March 2012 Former Reynolds Metals Reduction Plant 130 110730-02
11.2 Alternatives Evaluation
This section provides a qualitative evaluation of each alternative with respect to the MTCA seven criteria included in WAC 173-340-360(3)(e) as part of the DCA procedures. The following sections provide brief descriptions of how the particular alternative meets the objectives established by the DCA criteria. Alternatives are then compared to each other with respect to the criteria to determine which alternative would implement the most practicable permanent solution for the site. The analysis concludes with a reasonable restoration timeframe evaluation using consideration factors provided in WAC 173-340-360(3)(b).
11.2.1 Protectiveness
Protectiveness is defined as the degree to which overall protectiveness of human health and the environment is achieved by a given alternative. This includes the extent of reduction of existing risks; length of time required to obtain cleanup standards at the site; risks, both on and off site, that would occur from implementing the alternative; and the overall improvement of environmental quality. Alternative 1. Soil covers or existing structures currently isolate most impacted areas exceeding soil cleanup levels protective of direct contact pathways. Management of site groundwater exposure is achieved through institutional controls and natural attenuation is the primary remedial action implemented to achieve cleanup levels. The time to achieve groundwater cleanup levels throughout the site is expected to be long under this alternative (i.e., much greater than 100 years), although groundwater already meets cleanup levels within the site boundaries where a conditional POC could be established. No supplemental source control activities would be performed. Natural attenuation of groundwater along the migration pathway to surface water (i.e., the Columbia River and the CDID drainage ditches) is well demonstrated; therefore, no off-site risks are associated with this alternative. Alternative 2. With respect to groundwater and surface water, Alternative 2 provides a similar level of protectiveness to Alternative 1. Alternative 2 provides an increased reduction in on-site risk as all areas which exceed soil cleanup levels would either be removed and disposed of off site or isolated by a minimum 2-foot soil cover. Therefore, soil
Evaluation of Cleanup Alternatives
RI/FS Report March 2012 Former Reynolds Metals Reduction Plant 131 110730-02
cleanup levels would be met at the completion of construction. A negligible increase in off-site risk would result from the transport of excavated materials to off-site landfill facilities. Alternative 3. Similar to Alternative 2, all material exceeding soil cleanup levels would be either removed and disposed of off site or isolated by a minimum 2-foot soil cover. In addition, approximately 6.2 acres of impacted soil and waste would be excavated and consolidated into existing on-site containment areas resulting in a reduction in areas requiring institutional and engineering controls to limit exposure. Excavated areas that contributed to groundwater cleanup level exceedances would be backfilled with reactive materials, resulting in a reduced timeframe to achieve groundwater cleanup levels within a portion of SU2at the standard POC. Additional treatment is achieved through the construction of a PRB adjacent to SU3, which also contributes to a reduced groundwater restoration timeframe at the standard POC. Finally, source control along the groundwater to CDID ditch water pathway is enhanced through the construction of a PRB, further reducing potential off-site risk. Alternative 4. With respect to soil and surface water, Alternative 4 provides a similar level of protectiveness in comparison to Alternative 3. An additional 7.7 acres of impacted soil and waste would be excavated and consolidated into existing on-site containment areas. Excavated areas that contributed to groundwater cleanup level exceedances would be backfilled with reactive materials, resulting in a reduced timeframe to achieve groundwater cleanup levels at the standard POC within SU3. All soil covers limiting direct contact are upgraded to a low-permeability cap. Although enhancements are made to further reduce rainwater infiltration and treat residual COCs in groundwater, a marginal reduction in the time to achieve groundwater cleanup levels at the standard POC is expected. Alternative 5. This alternative provides no incremental benefit with respect to reduction risks associated with on-site exposures. Approximately 140,000 cubic yards (cy) of impacted soil and waste material that was consolidated and contained on site under preceding alternatives is transported off site for disposal under Alternative 5. Transporting of this material increases potential short-term, off-site risks and does not reduce the length of time necessary to achieve soil cleanup levels at standard POCs. However, source control along the
Evaluation of Cleanup Alternatives
RI/FS Report March 2012 Former Reynolds Metals Reduction Plant 132 110730-02
eastern property line adjacent to SUs 6 and 7 reduce potential off-site risk associated with COCs in groundwater. Alternative 6. This alternative includes excavation and off-site disposal of all soil above cleanup levels; therefore, upon completion of construction, compliance with soil cleanup levels would be attained throughout the soil column (i.e., the standard POC). No soil covers or low-permeability caps would be required. This alternative does pose the greatest potential short-term, off-site risk, as approximately 623,000 cy would be transported to an off-site disposal facility. With the exception of Alternative 1, all of the alternatives provide adequate degrees of protectiveness by removing direct contact with waste materials and by including varying degrees of treatment for affected groundwater. The discussion presented in Table 11-1, which provide numeric values for the alternatives, are intended to be relative to other alternatives and are based on the degree of overall protectiveness of the proposed technologies associated with each alternative. Given the importance of this criterion, the weighting is the maximum (30 percent) relative to other criteria in determining the overall environmental benefit of an alternative.
11.2.2 Permanence
The permanence of a cleanup action is measured by the degree to which it permanently reduces the toxicity, mobility, or volume of hazardous substances. For example, treatment actions that destroy contaminants (thereby reducing toxicity, mobility, and volume) are considered under MTCA as more permanent than containment actions (which only reduce the mobility). Alternative 1. This alternative relies upon natural attenuation to reduce the COC concentrations in groundwater. As discussed in Section 6, the mobility of fluoride is generally limited by a number of chemical reactions which results in the precipitation of various stable fluoride compounds such as fluorite and fluorapatite. Because no enhancement of natural attenuation processes occurs under Alternative 1, no reduction can be expected beyond baseline conditions. No excavation or consolidation of site soils or
Evaluation of Cleanup Alternatives
RI/FS Report March 2012 Former Reynolds Metals Reduction Plant 133 110730-02
wastes occurs under this alternative; therefore, no volume reduction of hazardous substances would occur. Alternative 2. This alternative provides a marginal increase in permanence in comparison to Alternative 1 as approximately 2,340 cy of impacted soil and waste material is permanently removed from the site. No further enhancements to reduce COC mobility or toxicity occur as part of Alternative 3. Alternative 3. This alternative reduces contaminant mobility and toxicity is permanently reduced using treatment methods such as the construction of two PRBs and placement of reactive backfill in SUs with groundwater exceeding site cleanup levels. Alternative 4. This alternative includes low-permeability caps over all impacted soils and waste materials, which will reduce the mobility of COCs managed on site. An additional 5.3 acres of reactive backfill is placed in this alternative in comparison to Alternative 3, which provides groundwater treatment through a PRB. Both technologies are effective in reducing contaminant levels in groundwater, but the Alternative 4 approach provides a marginal increase in permanence because it targets are larger treatment area. Alternative 5. This alternative provides a similar level of permanence with respect to COC mobility and toxicity reduction in comparison to Alternative 4, which is enhanced by the inclusion of a PRB along the eastern property line adjacent to SUs 6 and 7. With respect to volume reduction, approximately 140,000 cy of impacted soil and waste material would be permanently removed from the site. However, this material would not be treated so no further reduction in toxicity would occur. Alternative 6. This alternative removes all impacted soil and waste material (approximately 623,000 cy) from the site. However, like Alternative 5, this material would not be treated so no further reduction in toxicity would occur. Approximately 26 acres of SUs with groundwater exceeding site cleanup levels would be backfilled with reactive materials, reducing the toxicity of COCs in groundwater to the highest degree.
Evaluation of Cleanup Alternatives
RI/FS Report March 2012 Former Reynolds Metals Reduction Plant 134 110730-02
The toxicity and volume of contaminants that are addressed by containment will be reduced over the long term by natural attenuation, even though the time to reduce contaminant toxicity and volume may vary. Therefore, all alternatives provide a relatively high degree of permanence over the long term. Alternatives that would implement groundwater treatment further reduce the mobility of site contaminants, but only excavation and disposal off site will address the overall volume reduction of hazardous substances. The scoring of each alternative reflects these observations. To evaluate the relative permanence of these alternatives, a comparative analysis of the degree of permanence of the remedial alternatives over the short-term is presented in Table 11-1.
11.2.3 Effectiveness Over the Long Term
Long-term effectiveness includes the degree of certainty that the alternative will be successful, the reliability of the alternative during the restoration timeframe, the magnitude of residual risk with the alternative in place, and the effectiveness of controls required to manage remaining hazardous substances. MTCA ranks the following types of cleanup action components in descending order of relative long-term effectiveness:
• Reuse and recycling • Destruction or detoxification • Immobilization or solidification • On-site or off-site disposal in an engineered, lined, and monitored facility • On-site isolation or containment with attendant engineering controls • Institutional controls and monitoring
Long-term effectiveness considerations applicable to each alternative include the following:
• Alternative 1. This alternative relies on natural attenuation (a form of COC destruction) to achieve groundwater cleanup levels. As discussed in Section 6, the chemical reactions that attenuate fluoride in groundwater are well documented at the site. The limitations on the processes are understood and there is a high degree of confidence that the reactions will continue to occur in the future. Under Alternative 1, the restoration timeframe to achieve groundwater cleanup levels at the standard POC of compliance is expected to be very long (i.e., greater than 100 years). However, during this time on-site isolation through existing soil covers (which covers
Evaluation of Cleanup Alternatives
RI/FS Report March 2012 Former Reynolds Metals Reduction Plant 135 110730-02
most areas), institutional controls, and monitoring can be reliably used to manage other exposure pathways. Alternatively, a conditional POC could be established closer to impacted areas within the property boundaries, where groundwater cleanup levels would be met immediately.
• Alternative 2. This alternative provides similar long-term effectiveness in comparison to Alternative 1 with respect to groundwater. Alternative 2 provides additional long-term control other exposure pathways through the limited removal of impacted soil and waste material and soil covers placed over all material managed on site.
• Alternative 3. The long-term effectiveness provided by this alternative with respect to groundwater is achieved through a combination of natural attenuation, consolidation and on-site containment of impacted soils and waste material, and in situ treatment of residual groundwater. Residual groundwater would be treated as dissolved concentrations of fluoride actively attenuation on reactive backfill placed in excavations and the PRBs.
• Alternative 4. This alternative provides similar long-term effectiveness in comparison to Alternative 3 with respect to groundwater, increasing the residual groundwater treatment area by 5 acres. Immobilization of site COCs is further enhanced by the substitution of a soil cover for a low-permeability cap over all areas where impacted soil and waste material is managed on site.
• Alternative 5. This alternative provides an increased level of long-term effectiveness over Alternative 4 by reducing the volume of impacted soil and waste material managed on site. No additional upgrades to the cleanup action components that would result in improved long-term effectiveness are included in Alternative 5, with the exception of an additional PRB constructed adjacent to SUs 6 and 7.
• Alternative 6. This alternative provides a high degree of long-term effectiveness through the removal of all impacted soil and waste material from the site and increased residual groundwater treatment in SU2. Low residual risk is expected to remain on site after construction; however, natural attenuation of site groundwater may still be required to achieve cleanup levels at the standard POC.
Given the natural attenuation rates estimated for the site, it is thought that the long-term effectiveness of each alternative will not be a concern. Additionally, all of the alternatives would use relatively low-tech solutions and as such the degree of certainty and reliability of
Evaluation of Cleanup Alternatives
RI/FS Report March 2012 Former Reynolds Metals Reduction Plant 136 110730-02
the alternatives is relatively constant. The rankings listed above provide the greatest variance between the alternatives and are the basis for the values shown on Table 11-1.
11.2.4 Management of Short-Term Risks
Management of short-term risks is the degree to which human health and the environment are protected during construction and implementation of the alternative. Potential risks of implementing each alternative and the potential effectiveness of best management practices at controlling short-term risks are discussed as follows:
• Alternative 1. No construction would occur as part of this alternative; therefore, potential short-term risks would be limited to field crew during groundwater and surface water monitoring activities.
• Alternative 2. Limited construction would occur as part of this alternative. Potential short-term risks would be limited to field crew during groundwater and surface water monitoring activities and construction workers during grading and excavation of the small volume of material designated for off-site disposal. Standard best management practices can be implemented to ensure worker health and safety and minimize incidental releases to the environment (e.g., erosion control measures). Potential risks associated with off-site transport of excavated materials are expected to be negligible.
• Alternative 3. More excavation work is included in this alternative in comparison to Alternative 2; however, standard best management practices can be implemented to manage potential risks to human health and the environment. Potential risks associated with off-site transport of excavated materials are expected to be negligible.
• Alternative 4. Approximately 7.7 acres of additional excavation work is included in this alternative; however, the scale of the construction of this alternative is comparable to Alternative 3. Therefore, management of potential short-terms is expected to be similar.
• Alternative 5. This alternative increases the off-site removal of impacted soils and waste material from approximately 2,340 cy to 140,000 cy. Transport of this material for off-site disposal could require over 4,500 truck and trailer trips across local roads and state highways. The nearest Subtitle C landfill is located in Arlington, Oregon, approximately 180 miles away from the site. Best management practices can be
Evaluation of Cleanup Alternatives
RI/FS Report March 2012 Former Reynolds Metals Reduction Plant 137 110730-02
implemented to prevent material releases; however, the short-term risk to non-industrial environments is significantly increased under this alternative.
• Alternative 6. This alternative includes the off-site removal of approximately 623,000 cy of impacted soils and waste material. Transport of this material for off-site disposal would require over 10,500 truck and trailer trips across local roads and state highways. The nearest Subtitle C landfill is located in Arlington, Oregon, approximately 180 miles away from the site. Best management practices can be implemented to prevent material releases; however, the short-term risk to non-industrial environments is significantly increased under this alternative.
Given the moderated toxicity of waste material at the site, short-term risks are relatively minimal for all of the alternatives. Alternatives with increased excavation tend to have higher short-term risks, due to handling and disposal concerns, but best management practices are well established for these actions and are easy to implement. As with the other criteria, the values presented in Table 11-1 are intended to be relative to the other alternatives.
11.2.5 Technical and Administrative Implementability
Evaluating an alternative’s technical and administrative implementability includes consideration of the following:
• Potential for landowner cooperation • Whether the alternative is technically possible • Availability of necessary facilities, services, and materials • Administrative and regulatory requirements • Scheduling • Size and complexity of the alternative • Monitoring requirements • Access for construction and monitoring • Integration of existing operations with the remedial action.
Implementability considerations applicable to the alternatives are described as follows:
Evaluation of Cleanup Alternatives
RI/FS Report March 2012 Former Reynolds Metals Reduction Plant 138 110730-02
• Alternative 1. This alternative is technically and administratively feasible to implement. This alternative would not interfere with existing site uses but would also not reduce the areas which may restrict potential future site uses.
• Alternative 2. This alternative is technically and administratively feasible to implement. This alternative would result in minimal interferences with existing site uses and would not reduce the areas which may restrict potential future site uses.
• Alternative 3. Although more complex than Alternative 2, this alternative is technically and administratively feasible to implement. This alternative would result in minimal interferences with existing site uses and most construction work would occur in locations away from existing site operations. Alternative 3 reduces the overall area allocated to long-term management of impacted soil and waste material on site in comparison to Alternative 2; therefore, expanding areas that could be used in the future.
• Alternative 4. This alternative is equally implementable in comparison to Alternative 3 and provides an additional reduction in the area allocated to managing impacted soil and waste material on site.
• Alternative 5. This alternative provides an equivalent reduction in the area allocated to long-term management of impacted soil and waste material on site in comparison to Alternative 4; however, it is less implementable because it is likely that the large volume of material being removed from the site would impact existing facility operations.
• Alternative 6. This alternative does not include long-term management of impacted soil and waste material on site; therefore, future limitations to site uses would be negligible. However, it is the least implementable alternative because it is likely that the large volume of material being removed from the site would impact existing facility operations.
In general, all of the alternatives use technologies that are commonly applied as part of remedial actions and hence the benefit values shown in Table 11-1 are relative to the other alternatives. The general complexity is the most variable factor and the value presented has less to do with the remaining considerations because all of the remaining considerations are relatively constant between the alternatives.
Evaluation of Cleanup Alternatives
RI/FS Report March 2012 Former Reynolds Metals Reduction Plant 139 110730-02
11.2.6 Consideration of Public Concerns
The Draft FS will be made available for public review and comment. The degree to which each alternative considers public concerns will be evaluated by Ecology after public comments are received. Ecology will determine what modifications, if any, are required prior to issuing the Final FS.
11.2.7 Cost
Estimated costs for each remedial alternative are summarized in Table 10-2 and Table 11-1. Details regarding assumptions and methodology used to develop the cost estimate are provided in Appendix G. Cost estimates include design, construction oversight, capital costs, and long-term operation and maintenance costs but do not include fees associated with remedial investigations, Ecology oversight, or legal costs. The costs presented reflect FS-level design estimates and are presented with a range of contingency levels (+50/-30 percent).
11.2.8 Provision for a Reasonable Restoration Timeframe
The restoration timeframe analysis can consist of qualitative and relative estimates of the restoration timeframe for each alternative. Under MTCA, evaluation of a reasonable restoration timeframe includes the following factors to consider:
• Potential risks posed by the site to human health and the environment • Practicability of achieving a shorter restoration time frame • Current use of the site, surrounding areas, and associated resources that are, or may
be, affected by releases from the site • Potential future use of the site, surrounding areas, and associated resources that are,
or may be, affected by releases from the site • Availability of alternative water supplies • Likely effectiveness and reliability of institutional controls • Ability to control and monitor migration of hazardous substances from the site • Toxicity of the hazardous substances at the site • Natural processes that reduce concentrations of hazardous substances and have been
documented to occur at the site or under similar site conditions
Evaluation of Cleanup Alternatives
RI/FS Report March 2012 Former Reynolds Metals Reduction Plant 140 110730-02
Under all alternatives, groundwater and surface water cleanup standards are currently met within ditch and surface waters of the Columbia River. Therefore, the restoration timeframe to protect ecological receptors is immediate. In addition, all alternatives (including Alternative 1 to a lesser extent) achieve soil cleanup standards immediately after construction of engineering controls (e.g., soil covers) and implementation of institutional controls (e.g., deed restrictions regarding disturbance of soil and groundwater). All alternatives will include long-term management of groundwater quality within the site, in a manner protective of groundwater and surface water resources, and meet groundwater cleanup levels at locations within the property where a conditional POC could be established.
11.2.9 Summary
Table 11-1 provides a summary of the qualitative DCA criteria evaluation for each alternative discussed in the preceding section. It also provides a numeric rating of the environmental benefits provided by each alternative, with 10 representing an alternative that satisfies the criteria to the highest degree and 0 representing the least. The final environmental benefit score is then compared to the estimated cost of each alternative to determine which alternative provides the incrementally greatest degree of environmental benefit while considering the most cost-effective use of technology—that is, which alternative uses permanent solutions to the maximum extent practicable. Chart 11-1 provides a graphic summary of the DCA and compares environmental benefits and costs for each alternative. Environmental benefits ranged from 4 for Alternative 1 to 8 for Alternative 6. In general, the greatest environmental benefits were associated with higher cost alternatives. However, the breakpoint at which incremental costs begin to outweigh incremental environmental benefits is illustrated on Chart 11-1. For each alternative, the environmental benefit per cost ratio (EBC ratio) was calculated and plotted. A “knee” in the EBC ratio curve is evident at Alternative 2. Alternatives 3 and 4 had similar ratios of 0.4 and 0.3, respectively, while the EBC ratio approaches zero for Alternatives 5 and 6. The chart also indicates the rate at which costs increase among alternatives. The point at which costs begin to outweigh benefits can be estimated as the point where the EBC ratio and cost curves intersect. Therefore, one could conclude that Alternative 2 provides the
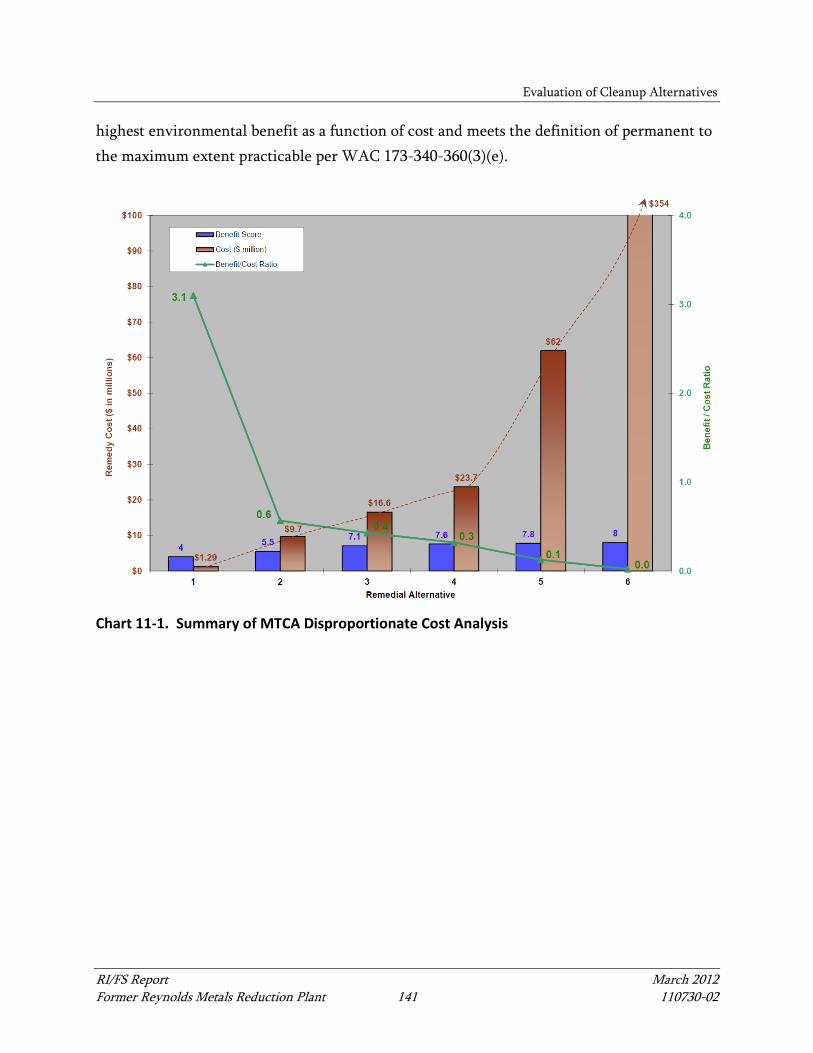
Evaluation of Cleanup Alternatives
RI/FS Report March 2012 Former Reynolds Metals Reduction Plant 141 110730-02
highest environmental benefit as a function of cost and meets the definition of permanent to the maximum extent practicable per WAC 173-340-360(3)(e).
Chart 11-1. Summary of MTCA Disproportionate Cost Analysis
RI/FS Report March 2012 Former Reynolds Metals Reduction Plant 142 110730-02
12 PREFERRED REMEDIAL ALTERNATIVE
The preceding sections present and evaluate six site-wide remedial alternatives that represent a range of remedial technologies and process options. When viewed together, the relative benefits and tradeoffs associated with implementation of different alternatives are apparent. This section identifies the recommended cleanup action alternative for the site, consistent with MTCA requirements and expectations for cleanup action alternatives. As discussed in Section 11.2.6, the community’s comments will also be considered by Ecology when selecting the cleanup remedy for the site under MTCA. The results of the DCA indicate that Alternative 2 is permanent to the maximum extent practicable. Alternative 2 also meets the four MTCA threshold criteria and achieves cleanup levels for all media at a conditional POC at the end of construction. The alternative makes use of engineering and institutional controls to reduce on-site and off-site risks during the timeframe necessary for COC concentrations to attenuate below cleanup levels at a standard POC. However, Alternative 2 does not fully achieve other MTCA expectations such as the use of treatment as a permanent groundwater remedial technology to the extent practicable, and consolidation of large waste volumes. Therefore, pending community comment, Alternative 3 is chosen as the provisional preferred alternative for the site because it the most practicable alternative that includes groundwater treatment and consolidation of on-site waste materials. This alternative blends a number of remedial technologies, including removal, soil cover, groundwater treatment, and monitored natural attenuation, resulting in a cost-effective approach for addressing site COCs. The following attributes contribute to the provisional identification of Alternative 3 as the preferred remedial alternative under MTCA remedy selection criteria (WAC 173-340-360):
• Complies with MTCA and with other applicable standards and laws • Achieves human health and environmental protection in a relatively rapid time
frame, compared with the range of alternatives evaluated and to the extent practicable with respect to groundwater restoration
• Reduces the volume of affected media and waste in the environment
Preferred Remedial Alternative
RI/FS Report March 2012 Former Reynolds Metals Reduction Plant 143 110730-02
• Includes protective, engineered in situ confinement of black mud waste deposits that are not practicable to remove
• Consolidates impacted soils remaining on site to the extent practicable, consistent with Ecology expectations for remedial alternatives (WAC-173-340-370)
• Has minimal and manageable short-term construction risks, compared with the range of alternatives evaluated
• Uses multiple technologies to provide maximum long-term effectiveness. • Is implementable • Is protective under the industrial land uses for which the property is zoned and has
historically been used, consistent with the uses at surrounding properties • Is cost effective, relative to the range of alternatives evaluated
When compared with the recommended alternative, the costs associated with implementing other alternatives with a potential for additional environmental benefit (i.e., Alternatives 4 through 6) are substantial and disproportionate and do not provide any significant incremental degree of increased environmental protectiveness.
RI/FS Report March 2012 Former Reynolds Metals Reduction Plant 144 110730-02
13 REFERENCES
Anchor (Anchor Environmental, L.L.C.), 2003. Voluntary Cleanup Report – Underground Gasoline Tank – Former Reynolds Longview Cable Plant. Prepared for Washington Department of Ecology. January 2003.
Anchor, 2006. Alcoa Longview Facility Data Report. Prepared for Washington Department of Ecology. August 2006.
Anchor, 2007a. Remedial Investigation Work Plan: Chinook Ventures, Inc. Prepared for Washington Department of Ecology. June 2007.
Anchor, 2007b. Remedial Investigation Report: Chinook Ventures, Inc. and Northwest Alloys, Inc. Prepared for Washington Department of Ecology. June 2007.
Anchor QEA, 2010a. Sampling and Analysis Plan Chinook Ventures Sediment Characterization, Longview Washington. Prepared for Chinook Ventures. Prepared by Anchor QEA. August 2010.
Anchor QEA, 2010b. Sediment Characterization Report: Chinook Ventures Area A and Surficial Sediments. Prepared for the Dredged Material Management Office and Washington State Department of Ecology. Prepared by Anchor QEA. November 2010.
Anchor QEA, 2011a. Memorandum: Quarterly Groundwater Monitoring Results for the Closed Black Mud Pond, 2004 to 2010 – Former Longview Reduction Plant. Prepared for Washington State Department of Ecology. Prepared by Anchor QEA. March 2011.
Anchor QEA, 2011b. Work Plan Addendum – Former Reynolds Metals Reduction Plant. Prepared for Washington State Department of Ecology on behalf of Northwest Alloys and Millennium Bulk Terminals. Prepared by Anchor QEA. August 2011.
Anchor QEA, 2011c. Well Locations & Former Reynolds Metals Reduction Plant Work Plan Addendum. Prepared for Northwest Alloys, Inc. and Millennium Bulk Terminals-Longview LLC. Prepared by Anchor QEA. December 14, 2011.
References
RI/FS Report March 2012 Former Reynolds Metals Reduction Plant 145 110730-02
Anchor QEA, 2011d. Work Plan Addendum No. 2 – Former Reynolds Metals Reduction Plant: Monitoring Well Location at SSA 7 (Southeast Fill Area). Prepared for Northwest Alloys and Millennium Bulk Terminals – Longview, LLC. Prepared by Anchor QEA. December 20, 2011.
Anchor QEA, 2011f. Closed Black Mud Pond Cover Maintenance Plan – AO 8027, Condition 5. Prepared for Washington State Department of Ecology on behalf of Millennium Bulk Terminals – Longview, LLC. Prepared by Anchor QEA. August 2011.
Chinook Ventures Inc. (Chinook), 2010. Memorandum: DMMP Suitability Determination. Prepared by Anchor QEA, LLC for Chinook. November 4, 2010.
Ecology (Washington State Department of Ecology), 1978. Memorandum: Scrubbing Liquor Spill. August 8, 1987.
Ecology, 1980. Memorandum: Oil Spill from Ship Dock at Reynolds’ Dock. February 7, 1980.
Ecology, 1982. The Generation of Spent Potlinings by the Primary Aluminum Industry. Prepared by Timothy L. Nord and Ross Potter (Ecology). December 1982.
Ecology, 1983. Order No. DE 83-293 issued to Reynolds Metals Company, Longview. July 20, 1983.
Ecology, 1985. Letter from George Houck (Ecology) to Harold Hayes (Reynolds): Quarterly Groundwater Monitoring Results from SPL Storage Area Wells: June 1983 to February 1985. March 25, 1985.
Ecology, 1986. Memorandum: Reynolds PCB Cleanup. February 14, 1986. Attachment: Letter to Tom Dickey (Reynolds) February 20, 1986.
Ecology, 1988. Letter to Tom Dickey (Reynolds): Spill of Polyalkaline Glycol at Reynolds Plant. December 1988.
Ecology, 1991. Reynolds Metals Company – Class II Inspection – February 1990. Prepared for Washington State Department of Ecology. Prepared by Merc Heffner (Ecology). June 1991.
References
RI/FS Report March 2012 Former Reynolds Metals Reduction Plant 146 110730-02
Ecology, 2007. Workbook Tools for Calculating Soil and Ground Water Cleanup Levels under the Model Toxics Control Act Cleanup Regulation. Publication 01-09-073. Revised December 2007.
Ecology, 2009. Final Analysis Report for PAHs in Chinook Ventures Pet Coke Samples, Manchester Environmental Laboratory. February 2009.
Ecology, 2011. Guidance for Remediation of Petroleum Impacted Soils. Publication 10-09-057. September 2011.
EMCON, Inc. (EMCON), 1996. 1995 Annual Groundwater Monitoring Report, Reynolds Cable Plant, Longview, Washington. Prepared by EMCON. Prepared for Reynolds Metals Company. January 1996.
EPA (U.S. Environmental Protection Agency), 2002. National Primary Drinking Water Regulations—Announcement of the Results of EPA's Review of Existing Drinking Water Standards and Request for Public Comment; Proposed Rule. Federal Register. Vol. 67, No. 74. p. 19,030. April 17, 2002.
Evarts, R.C., O’Connor, J.E., Wells, R.E., and Madin, I.P., 2009. The Portland Basin: A (Big) River Runs Through It. GSA Today 19(9), p. 4-10.
Evren Northwest, Inc., 2004. Underground Storage Tank Decommissioning and Assessment Report. Prepared for Longview Aluminum and Washington State Department of Ecology. Prepared by Evren Northwest, Inc. June 2004.
MFG (MFG, Inc.), 2000. Limited Phase II Environmental Site Assessment Report – Reynolds Metals Site. Prepared by MFG, Inc. (reviewed by Anchor Environmental in February 2004). Prepared for Washington State Department of Ecology. December 2003.
MFG, Inc., 2003. Draft Site Investigation Report – North and South CEATS and selected South Plant Source Area CEATS – Vols. I & II. Prepared by MFG, Inc. (reviewed by Anchor Environmental in February 2004). Prepared for Alcoa. December 2003.
Northwest Alloys, Inc., 2011a. Demolition and Cleanup Accomplishments at the Former Reynolds – Longview Plant. Prepared for Alcoa. Prepared by Northwest Alloys. June 2011.
References
RI/FS Report March 2012 Former Reynolds Metals Reduction Plant 147 110730-02
Northwest Alloys, 2011b. Spent Potliner, Black Mud, and White Mud Management History: Former Reynolds Plant- Memo. Prepared for Alcoa. Prepared by Northwest Alloys, Inc. October 2011.
Parkhurst, D.L., and Appelo, C.A.J., 1999. User's guide to PHREEQC (Version 2) -A computer program for Speciation, Reaction-Path, 1D-Transport, and Inverse Geochemical Calculations: U.S. Geological Survey Water-Resources Investigations Report 99-4259, 312 p.
Phipps, W.M., 1987. Geologic Map of the Mount St. Helens Quadrangle, Washington and Oregon. Open File Report 87-4. Division of Geology and Earth Resources, Washington Department of Natural Resources.
PNE (Pacific Northern Environmental), 1991. Underground Storage Tank Decommissioning Site Assessment. Prepared by PNE. Prepared for Reynolds Metals Company. December 1991.
PNE, 1992. Independent Interim Cleanup Status Report. Prepared by PNE. Prepared for Reynolds Metals Company. March 1992.
PNE, 1993. Preliminary Hydrogeologic Assessment: Reynolds Metals Company Cable Plant. Prepared by PNE. Prepared for Reynolds Metals Company. January 1993.
PNG (Pacific Northern Geoscience), 1994. Focused Remedial Investigation and Feasibility Study: Reynolds Metals Cable Plant. Prepared by PNG. Prepared for Reynolds Metals Company. July 1994.
Reynolds (Reynolds Metals Company), 1984a. Correspondence between Reynolds and Ecology. Regarding: Black Mud Spill in July 1984, Relief from Penalty DE. 84-452. July to August 1984.
Reynolds, 1984b. Correspondence between Reynolds and Ecology. Regarding: PCB Spill in July 1984. July to October 1984.
Reynolds, 1986a. Correspondence between Reynolds and Ecology. Regarding: Accidental Black Mud Release in June 1986. June 1986.
Reynolds, 1986b. Correspondence between Reynolds and Ecology. Regarding: Accidental Black Mud Release in September 1986. September 1986.
References
RI/FS Report March 2012 Former Reynolds Metals Reduction Plant 148 110730-02
Reynolds, 1986c. Summary Report of PCB Clean-up Activities – Reynolds Metals Company. Prepared for Washington State Department of Ecology. January 1986.
Reynolds, 1988. Correspondence between Reynolds and Ecology. Regarding: Accidental Black Mud Release in August 1988. September 1988.
Reynolds, 1991. 200,000 Gallon Diesel AST Independent Cleanup Documents. 1991-1993.
Reynolds, 1992. Operations and Maintenance Manual: Black Mud Pond Post-Closure Care. Prepared by Reynolds. November, 1992.
Reynolds and CH2M Hill, 1991. Closure Plan and Post-Closure Plan for the Longview Reduction Plant. Prepared for Washington State Department of Ecology. Prepared by Reynolds Metals Co. and CH2M Hill. July 1991.
Spiegel, S.J., and Pelis, T.K. 1990. Regulations and practices for the disposal of spent potliner by the Aluminum industry. JOM, Vol. 2, Issue 73, pp. 70-73, November 1990.
Swanson, R.D., McFarland, W.D., Gonthier, J.B., and Wilkinson, J.M., 1993. A Description of Hydrogeologic Units in the Portland Basin, Oregon and Washington. U.S. Geological Survey (USGS) Water Resources Investigations Report 90-4196.
Sweet, Edwards and Associates, Inc., 1986. Reynolds Solid Waste Site Soil and Groundwater Investigation. Prepared for Reynolds Metals Co. Prepared by Sweet, Edwards and Associates, Inc. March 1986.
Walsh, T.J., 1987. Geologic Map of the Astoria and Ilwalco Quadrangles, Washington and Oregon. Open File Report 87-2. Division of Geology and Earth Resources, Washington Department of Natural Resources.

TABLES

FIGURES