Embed Size (px)
Citation preview
DFAI"
RECYCLE/REUSE LITERATURE SEARCH REPORT
Manuscript Completed: December 1998 Date Published:
Prepared by J.E. Hammelman, W.J. Puglia, R.L. Gotchy
Science Applications International Corporation 1410 Springhill Road McLean, VA 22102
Prepared for Division of Regulatory Applications Office of Nuclear Regulatory Research U.S. Nuclear Regulatory Commission Washington, DC 20555-0001

TABLE OF CONTENTS
Preface ...................................................... vii
1. INTRODUCTION AND SUMMARY ......................................... 1-1
1.1 Background ... .................................................... 1-1 1.2 Purpose of this Report ................................................ 1-2 1.3 Generation of Waste Materials and Equipment During Normal
Operations and Decommissioning ....................................... 1-3
1.3.1 W aste Generation ........................................... 1-4 1.3.2 Potential Volumes and Masses for Recycle or Reuse ....................... 1-5 1.3.3 Forecase of Annual Volume of Potentially Recycleable Material ............. 1-7
1.4 Disposal of Materials from Nuclear Facilities at LLW Sites ........................ 1-8 1.5 Decontamination Technologies ... ....................................... 1-9 1.6 Recycle of Metal in the United States and Worldwide ........................... 1-10 1.7 Standards for Recycle and Reuse in the United States and Worldwide ................. 1-11 1.8 Previous Dose Assessment Studies for Recycle and Reuse ........................ 1-11 1.9 Preliminary Economic Evaluation of Material Disposition ....................... 1-1
2. GENERATION OF WASTE MATERIALS AND EQUIPMENT DURING NORMAL OPERATIONS AND DECOMMISSIONING .................................... 2-1
2.1 Introduction ...................................................... 2-1 2.2 Nuclear Reactors ... ................................................ 2-1
2.2.1 Normal Operations of Reactors ... ................................. 2-1
2.2.2 Decommissioning of Reactors ... .................................. 2-7
2.3 Fuel Cycle Facilities ................................................. 2-15
2.3.1 Normal Operations of Fuel Facilities ................................. 2-15 2.3.2 Decommissioning of Fuel Facilities ................................. 2-16
3. DISPOSAL OF MATERIALS FROM NUCLEAR FACILITIES AT LLW SITES ............ 3-1
3.1 Current and Projected Status of Commercial Low Level Waste Disposal/Storage Capacity ......................................... 3-1
3.1.1 Introduction .................................................. 3-1 3.1.2 Background .................................................. 3-1 3.1.3 Compact Regions with Currently Operating Disposal Sites .................... 3-2 3.1.4 Compact Regions without Operating Disposal Sites ......................... 3-5 3.1.5 Unaffiliated States Planning to Construct Disposal Facilities .................. 3-8 3.1.6 Unaffiliated States/Jursidictions Not Planning to Construct Disposal Facilities ..... 3-10 3.1.7 Summary ... ................................................ 3-11
3.2 Current and Projected Costs of Commercial Low-Level Waste Disposal ............... 3-13
ii

TABLE OF CONTENTS (continued)
Sectio
3.2.1 Introduction/Background ....................................... 3-13 3.2.2 Costs for LLW Disposal .. ...................................... 3-13 3.2.3 Factors Affecting Costs of Disposal in Future LLW Disposal Facilities ......... 3-15 3.2.4 Future LLW Disposal Costs .. .................................... 3-21
3.3 Summary/Conclusions .. ............................................ 3-23
4. DECONTAMINATION TECHNOLOGIES .................................... 4-1
5. RECYCLE OF METAL IN THE UNITED STATES AND WORLDWIDE .............. 5-1
5.1 Introduction ... ................................................... 5-1 5.2 US Commercial Metal Recycle Industries ... ............................... 5-1
5.2.1 Iron and Steel Recycling Industries ................................. 5-4 5.2.2 Copper Recycling Industry ........................................ 5-23 5.2.3 Aluminum Recycling Industry ...................................... 5-35
5.3 Nuclear Metal Recycle Industry ......................................... 5-55
5.3.1 US Nuclear Contaminated Metal Recycle Industry ....................... 5-55 5.3.2 International Nuclear Contaminated Recycle Activity .................... 5-64
6. STANDARDS FOR RECYCLE AND REUSE IN THE UNITED STATES AND WORLDWIDE ................................................... 6-1
6.1 Introduction ...................................................... 6-1 6.2 Standards Applicable or Relevant to the Recycle or Reuse of Material .............. 6-3
6.2.1 General Dose Standards .......................................... 6-3
6.2.2 Dose Standards Specific for Recycle or Reuse ........................... .6-3 6.2.3 Activity Standards .............................................. 6-5
7. DOSE ASSESSMENT STUDIES FOR RECYCLE AND REUSE OF CONTAMINATED MATERIALS ........................................ 7-1
7.1 Background ....................................................... 7-1
7.2 Synopsis of Selected Dose Assessment Studies ............................... 7-3 7.3 Discussion ....................................................... 7-10
8. REFERENCES .... ................................................... 8-1
iii

LIST OF FIGURES
3-1 Current Configuration of Compact Regions/Host States and Unaffiliated States ............ 3-3
3-2 Projected Facility Operating Dates for New LLW Disposal Facilities ................... 3-12
5-1 Generalized Diagram of Scrap Gneeration and Recycle Paths in the Production of M etal ................................................. 5-3
5-2 Iron/Steel Production Material Flow - 1990 .................................... 5-6
5-3 Generalized Diagram of Recycle Paths for Iron and Steel Scrap ...................... 5-18
5-4 Copper Production Material Flow - 1990 ....................................... 5-25
5-5 Generalized Diagram of Recycle Paths for Copper Scrap ............................ 5-30
5-6 Aluminum Production Material Flow - 1990 .................................... 5-37
5-7 Generalized Diagram of Recycle Paths for Aluminum Scrap .......................... 5-47
5-8 Current Recyclable Scrap Metal Material Flow .................................. 5-57
iv

LIST OF TABLES
Table
1-1 Generation of Low Level Waste by Industry and Waste Category for Years 1987 through 1989 ............................................. 1-4
1-2 Estimated Volumes of Concrete and Metal Associated with the Decommissioning of a Reference Large BWR and PWR ........................................ 1-5
1-3 Estimated Annual Volume of Waste with Potential for Reuse and Recycle Produced During Normal Operations for all BWRs, PWRs and Fuel Cycle Facilities ............... 1-6
1-4 Estimated Volumes of Concrete and Metal Associated with Potential for Reuse and Recycle Produced During Decommissioning of a Reference Large BWR and PWR ......... 1-7
1-5 Comparison of Isotopic Distribution Expected for Reactor Contaminated Piping and Concrete .. ................................................. 1-12
1-6 Summary of Preliminary Cost Comparison for Disposal and Recycle of Contaminated Metal .................................................. 1-13
2-1 Reference Annual Volumes of Wastes Produced During Normal Operations by a Typical PWR and BWR ................................................. 2-2
2-2 Level of Activity and Distribution of Radionuclide Contaminants Associated with Non-compacted Trash ................................................. 2-4
2-3 Concentration Ranges, Averages, and Distribution for Radionuclides in Corrosion Films Internally Deposited in Piping and Hardware Exposed to Liquid Radwastes and Secondary Coolant ..................................... 2-5
2-4 Mass of Major Materials in a Typical Large (1000 MWe) PWR ....................... 2-7
2-5 Reference Waste Masses Produced During the Decommissioning of a Typical PWR ......... 2-8
2-6 Estimated Mass of Major Materials in a Typical Large (1000 MWe) BWR ............... 2-9 2-7 Reference Waste Masses Produced During the Decommissioning of a Typical
Large (1000 MWe) BWR ................................................. 2-9
2-8 Concentration Ranges, Averages, and Distribution for Radionuclides in Corrosion Films on Piping Exposed to Primary Coolant ............................. 2-11
2-9 Distribution of the Radionuclide Inventory Estimates for Three Pressurized Water Reactors ......................................... 2-12
2-10 Concentration Ranges, Averages, and Distribution for Radionuclides Associated with Concrete from Highly Contaminated Areas Within Selected Nuclear Generating Stations ......................................... 2-12
3-1 Host States and Planned Technologies for LLW Disposal ........................... 3-17
3-2 Sensitivity of Costs to Disposal Technology .................................... 3-18
3-3 Unit Costs of Disposal as a Function of Annual Receiving Rate ........................ 3-18
3-4 Selected Cost Estimates for Future LLW Disposal ................................ 3-22
4-1 Summary of Decontamination Technologies ..................................... 4-2
5-1 Salient Statistics for US Iron and Steel Production - 1990 ............................ 5-7
5-2 Raw Steel Production by Grade and Type of Furnace - 1990 .......................... 5-8
5-3 Net Shipments of Steel Products by Market Classifications - 1990 ..................... 5-12
5-4 Net Shipments of Steel Products by Grades - 1990 ................................ 5-13
5-5 Salient Statistics for US Steel Scrap - 1990 ...................................... 5-15
5-6 Consumption of Iron and Steel Scrap by Grade - 1990 .............................. 5-16
5-7 US Regional Summary of Iron and Steel Scrap Consumption - 1990 .................... 5-17
5-8 Summary of Occupational Injury/Illness Data for the Production of Iron and Steel Products - 1990 ............................................ 5-20
v

LIST OF TABLES (continued)
Table Ene
5-9 Salient Statistics for US Copper Production - 1990 ................................ 5-26 5-10 Consumption of Refined Copper and Copper-Based Old Scrap
by Processing Consumers - 1990 .. ......................................... 5-27 5-11 Apparent Consumption of Refined Copper by End Use Sector - 1990 .................... 5-28 5-12 Summary of Secondary Refining Capability in the US - 1991 ....................... 5-32 5-13 Estimated Consumption of Copper-Base Old Scrap by
Scrap Type and Processor - 1990 ............................................ 5-33 5-14 Salient Statistics for US Aluminum Production - 1990 .............................. 5-38 5-15 Composition Limits and Uses of Some Aluminum Wrought and Casting Alloys ............ 5-40 5-16 End-Use Distribution of Aluminum Products in the US by Industry - 1990 ................. 5-41 5-17 Total Aluminum Industry Shipments - 1990 .................................... 5-43 5-18 End-Use Distribution of Aluminum in the US by Major Products - 1990 ................. 5-44 5-19 Commonly Used Alloys Found in Consumer Products .............................. 5-46 5-20 Production of Secondary Aluminum Alloys by
Independent Smelters in the US - 1990 ....................................... 5-49 5-21 US Consumption of New and Old Aluminum Scrap by Class ....................... 5-50 5-22 US Consumption of Purchased New and Old Aluminum Scrap
and Sweated Pig in 1990 ............................. ................. 5-51 5-23 Estimates for Old Scrap Aluminum Generation and Recovery for 1979 ................... 5-53 5-24 Summary of Year End Prices for Selected Types of Aluminum Scrap .................... 5-54 5-25 Summary of Energy Requirements to Produce Aluminum Metal ....................... 5-55 5-26 Summary of Radioactive Scrap Metal Generation in the Nuclear Industry ............... 5-63
6-1 Summary of Dose and Activity Standards Worldwide .............................. 6-2 6-2 Radionuclide Concentration Limits for Disposal of Dry
Solid Waste with Conditioning According to Italian ENEA Technical Guide No. 26 .................................................. 6-7
7-1 Summary of Selected Dose Assessment Studies ................................... 7-4 7-2 Assessment Scenarios Treated in Reviewed Studies: Iron and Steel .................... 7-13 7-3 Assessment Scenarios Treated in Reviewed Studies: Aluminum ....................... 7-13 7-4 Assessment Scenarios Treated in Reviewed Studies: Copper ......................... 7-13 7-5 Summary of Results of Studies on Exemption Levels for Recycle ....................... 7-14
vi

Preface
This report summarizes a literature search conducted as the first of five tasks under an NRC
contract entitled Guidance and Models for Reuse/Recycle Material. This Task 1 report discusses
background information on reuse and recycle of contaminated equipment and material from NRC
licensed facilities. The information was originally intended to provide the basis for subsequent
tasks, primarily Task 2, where dose assessments are estimated for potential exposure scenarios
related to reuse and recycle. Although Task 1 was scheduled to be seven months in duration, the
work was initiated in late 1992 and was completed in early 1994.
Information from the Task 1 literature search provided an adequate basis to initiate Task 2. Task
2 began in late 1993 and was to be completed within 2 years after completion of Task 1 (- 1996).
However, as Task 2 progressed, the scope of the project grew and background information not
contained in the Task 1 draft report was required. Also, unavoidable project delays and other
NRC commitments (e.g., the recent rulemaking addressing radiological criteria for
decommissioning) resulted in lengthening the period for completion of Task 2. During this
extended time, significant additions to the literature that were relevant to Task 2 were published,
including a draft report published by the EPA and an IAEA report addressing recycle of material.
New information was incorporated into Task 2, but the Task 1 draft report was not updated.
This Task 1 report is being published as a historical baseline for completion of Task 2.
Information and terminology used in this report are not current and are not always consistent with
the separately published Task 2 report (to be published as NUREG-1640). For example, this
report uses the term "recyclable scrap metal (RSM)", which is not used in NUREG-1640 because
of confusion over its meaning. Also, this report uses different units and unit abbreviations than
NUREG-1640 and was written assuming that the Task 2 report would be published as a
companion (this report makes reference to a "Volume IH" that does not exist). In summary, this
report contains important and relevant information, however, NUREG-1640 contains more
complete and recent information on such topics as reuse and recycle of materials, metal industry
practices, and refinery scenario parameter values.
vii
1. INTRODUCTION AND SUMMARY
1.1 Background
After a nuclear facility ceases operation and completes decommissioning, its NRC license is terminated and the
facility structures and lands are released for unrestricted public use. Currently, there are inconsistencies between
NRR, NMSS, and individual state programs in the standards that are applied to the release of contaminated material.
To address this, the NRC is currently assessing potential pathways of exposure resulting from unrestricted use of
lands and structures (Kennedy, 1992) and is considering a rulemaking to codify criteria for acceptable levels of
residual radioactivity for release of the structures and lands for unrestricted use.
When these nuclear facilities undergo decommissioning, there are large quantities of equipment, components, piping,
etc., which remain and require disposition, some of which are contaminated with radionuclides. The levels of
radioactive contamination in these materials vary from high levels, which require that the materials be managed and
disposed of as waste at licensed disposal sites in order to protect the public and the environment, down to very low
levels where the material does not present a significant risk to the public or the environment. Some of this material
may be decontaminated and released for unrestricted use. Other material may have low enough levels of
radioactivity that it could be released for unrestricted reuse without the need for decontamination. There may be
an economic incentive to recycle or reuse this material in other products. Similarly, during normal facility
operations, certain equipment, components, etc., may be released for unrestricted use and potentially recycled.
Currently, small quantities of such equipment, components, etc., are released for unrestricted use during operations
using the existing case-by-case criteria noted above.
In current practice, material which is contaminated with very low levels of radioactivity is normally classified as
low-level radioactive waste and is disposed of in licensed burial grounds. The existing capacity of low level waste
management systems in the US (burial grounds and storage systems) is extremely limited and progress on
designating and siting new facilities very slow, the classification of some of this material from decommissioning
as low level waste may not be an appropriate or optimum use of limited resources such as storage or disposal space,
dollars, or material itself in cases where the waste material could be recycled or reused.
Because of the maturing of the nuclear industry and the potential for large scale decommissionings with large
quantities of contaminated material, the NRC is conducting an overall reassessment of the potential radiological
impact of release and recycle and/or reuse of equipment, components, materials, etc., during both decommissioning
and normal facility operations. Such a reassessment includes an evaluation of both the doses and costs of alternative
means for dealing with these materials. The NRC is assessing the nature and amount of these slightly contaminated
1-1

wastes and the impacts that would result if this material were to be made available for recycle or reuse. For this
effort, this report uses the following definitions of recycle and reuse:
1) Recycle - conversion of materials (e.g., steel, copper, aluminum) present in components from a nuclear facility to form new products through normal industrial processes, which would then be available in the public sector;
2) Reuse - transfer of a functional component, system or material from a nuclear facility to some other application where it would then be used to carry out its original function;
3) Controlled recycle/reuse
a) Controlled recycle - conversion of materials present in components from a nuclear facility to form new products through normal industrial processes that would be restricted in their use to nuclear facilities.
b) Controlled reuse - transfer of a functional component, system or material from one nuclear facility to another for similar applications. As an example, the controlled reuse of a contaminated but operable pump would involve the transfer of the pump from facility A to facility B where it would continue to be used as a pump.
1.2 Purpose of this Report
The intent of this report is to provide background information to be used in selecting the appropriate set of pathway
scenarios for assessing the health and safety impacts of the potential large-scale reuse and recycle of contaminated
nuclear material. The pathway analysis is contained in Volume II of this report. The information presented in this
report summarizes the results of an extensive literature search. If additional information needs are identified as part
of the pathway assessment, then the literature search will be expanded to address these needs. Based on the
extensive library of resources which has been compiled and personal contacts which have been established during
the literature search, future information needs can be rapidly addressed.
This volume presents information in order to assess: current generation of contaminated nuclear material in the US
as well as projections of future generation rates; disposal practices at low level waste (LLW) sites; current
decontamination technologies and regulatory standards in the US and worldwide; as well as a summary of previous
dose pathway assessments.
The information is presented in a set of stand-alone Chapters describing the relevant information to support the
pathway analysis in Volume II. The Chapters focus in the following areas: (1) amounts of material available at
nuclear facilities that are potentially available for recycle, (2) current disposition of this material in the existing
licensed LLW disposal facilities, (3) summary of the various decontamination technologies that exist which have
the potential for treating this material, (4) current commercial reuse and recycle efforts for both contaminated and
1-2

non-contaminated material in the US and worldwide; (5) current standards regarding the disposition of this material,
and (6) previous dose assessment studies evaluating the disposition of this material. Chapters 2 - 7 provide the
results of this review and Sections 13 - 1.8 provide a summary of those chapters.
Section 1.9 combines all of the information presented in Chapters 2 - 7 to provide a preliminary economic analysis
of the potential benefits of disposal versus recycle. Note, these estimates contain a large amount of uncertainty,
since they are based on raw estimates of material generation rates, unit disposal and decontamination costs, scrap
value, and decontamination efficiencies.
1.3 Generation of Waste Materials and Equipment During Normal Operations and Decommissioning
Chapter 2 presents information on the amounts of waste material and equipment which are expected to be generated
during the operation or decommissioning of both nuclear reactors and nuclear fuel cycle facilities. For reactors,
information is also presented on the expected radionuclide content of this material and equipment. In general, the
materials which are considered to have potential for reuse and recycle in nuclear reactor and fuel cycle facilities
are: concrete, iron/steel, aluminum and copper.
There was no single source of information which contained all of the relevant material to accurately estimate the
material volumes and radionuclide content of material described above. The information presented are best
estimates, based on a thorough literature search of activities carried out to support the US NRC, EPRI and several
international organizations (e.g., Euratom, CEC). In some studies, information was presented as material volumes,
while other studies referenced material masses. Conversion factors were developed for each type of material
considered based on the available information. In the end, information from several different studies was combined
to provide the best available estimate. All relevant sources are referenced and, in general, the data is considered
to be accurate to within a factor of 2.
Section 1.3.1 summarizes the expected quantities of waste generated by nuclear reactors and fuel cycle facilities,
and Section 1.3.2 discusses the quantities of waste materials from nuclear facilities that are potentially recyclable.
Section 1.3.3 provides a forecast of the projected total annual volume of potentially recyclable material, based on
current schedules for nuclear reactor license renewal. All information presented in the following sections are
represented in volumetric units (mn).
Chapter 2 discusses this information in more detail and also includes an estimate of the expected radionuclide content
of this material.
1-3

1.3.1 Waste Generation
Low level waste (LLW) is generated at 9perating reactors and fuel cycle and non-fuel cycle facilities at the rate of
about 50,000 cubic meters per year. Table 1-I provides a breakdown of LLW generation for the years 1987
through 1989. This information was compiled by the NRC based on a detail review of the burial records of the
three operating commercial burial grounds during the years 1987 through 1989 (USNRC, 1990b).
The table presents information on the amount of waste that was generated by the commercial nuclear power industry
alone (represented by utilities and private industry) and by all generators (including academic institutions, hospitals,
government and commercial generators). This table shows that the majority of the low, level waste is generated by
the nuclear power industry (utilities and the private industry) and most of the waste by volume is class A waste.
Class A waste contains the lowest levei of activity of all LLW (as defined by 10.CFR.61) and has. the highest
potential for reuse and recycle.
Table 1-1. Generation of Low Level Waste (LLW) By Industry and Waste Category for the Years 1987 through 1989
Volume of Class A LLW Total Volume of LLW Total Volume of LLW Generated by Utilities Generated by Utilities From All Generators
and Private Industry (m3) and Private Industry (m3) (i 3) Year
1987 45,000 46,000 52,000
1988 35,000 36,000 40,000
1989 38,000 40,000 46,000
In addition to the operational waste, there will be waste materials and equipment generated during the
decontamination and decommissioning (D&D) of licensed nuclear facilities. Estimates of the volumes of material
that would be expected to be generated during the D&D of a reference large BWR and PWR have been estimated
(Smith, 1979; Oaks, 1980; Elder, 1980) and these are summarized in Table 1-2. These volumes were derived by
estimating the total mass of each type of material used in the construction of a reference BW'R and PWR, and
determining the distribution of material status in terms of activated, contaminated and clean material. This
information was derived by combining the results of several different sources and is described in more detail in
Section 2.2.2. 1. It is estimated that the actual volumes that would be generated during a decommissioning project
could vary as much as 100% from the reference values presented in the table. This variation would be due to
1-4

details of plant design (e.g., the use of liners or not), the quality of the maintenance of components used in a
specific facility (which impacts the frequency and size of leaks), general housekeeping practice.
The estimated volumes of contaminated material that would be generated during the decommissioning of an
individual fuel cycle facility is expected to be very small compared to a nuclear reactor and there are relatively few
licensed fuel cycle facilities. For a typical fuel facility, it has been estimated that as much as 500 m3 of equipment,
piping, and ducting could potentially be recycled.
Table 1-2. Estimated Volumes of Concrete and Metal Associated with the Decommissioning of a Reference Large BWR and PWR
Material Category Concrete Metal Material Volume (m3) Material Volume (mi3)
BWR PWR BWR PWR
Activated 800 800 1,500 1,000
Contaminated 11,000 12,000 8,000 7,500
Clean 280,000 140,000 38,000 42,000
TOTAL: 292,000 153,000 47,500 50,500
1.3.2 Potential Volumes of Material for Recycle or Reuse
Some fraction of the routine LLW presented in Section 1.3.1 is.expected to have potential for recycle or reuse.
Table 1-3 provides estimates of the LLW volumes occurring during normal operations that could potentially be
recycled. This estimate is based on an analysis of information compiled under the sponsorship of the Electric Power
Research Institute (Daloisio, 1989) and the NRC (USNRC, 1981). Details of the development of these estimates
of waste volumes and masses that could be recycled, based on the total metal content in the waste material, are
presented in Chapter 2.
1-5
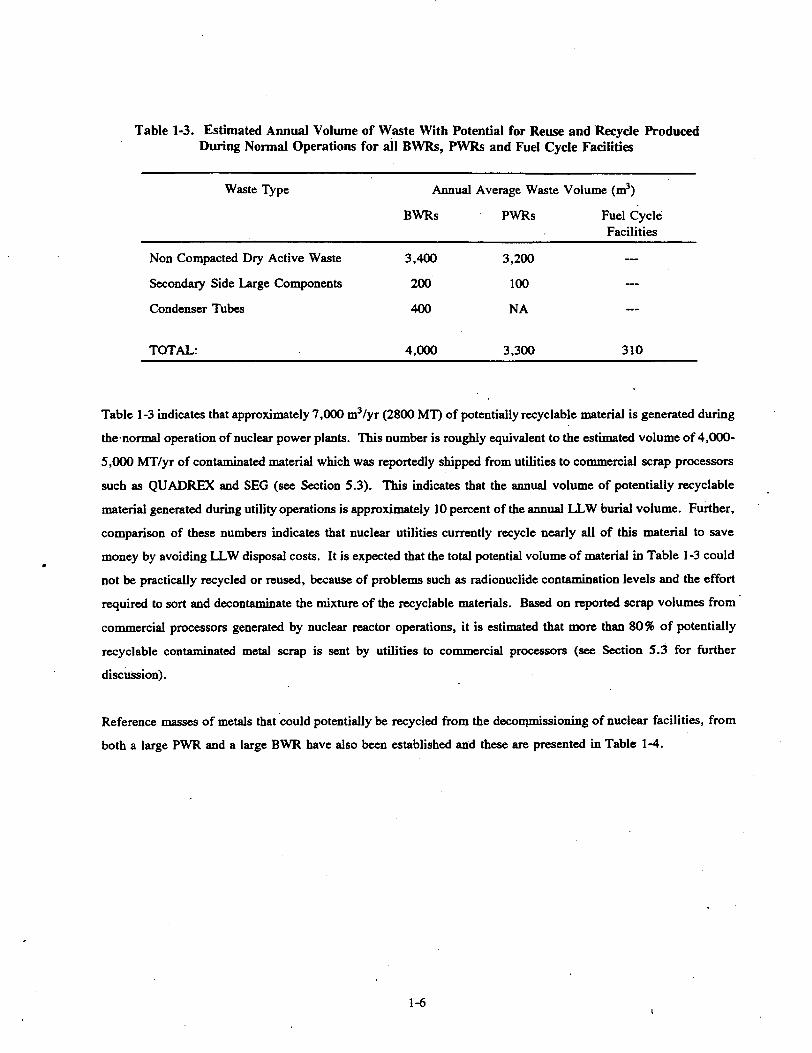
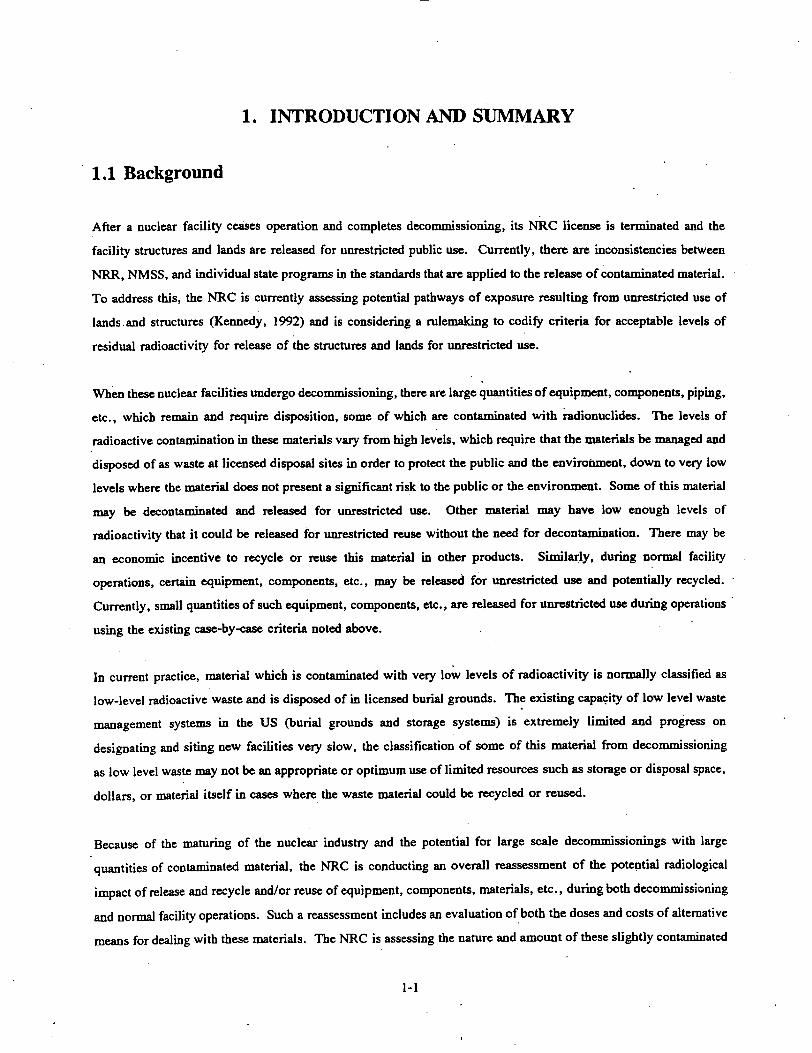
Table 1-3. Estimated Annual Volume of Waste With Potential for Reuse and Recycle Produced During Normal Operations for all BWRs, PWRs and Fuel Cycle Facilities
Waste Type Annual Average Waste Volume (m3 )
BWRs PWRs Fuel Cycle Facilities
Non Compacted Dry Active Waste 3,400 3,200
Secondary Side Large Components 200 100 -
Condenser Tubes 400 NA --
TOTAL: 4,000 3,300 310
Table 1-3 indicates that approximately 7,000 m3/yr (2800 MT) of potentially recyclable material is generated during
the-normal operation of nuclear power plants. This number is roughly equivalent to the estimated volume of 4,000
5,000 MT/yr of contaminated material which was reportedly shipped from utilities to commercial scrap processors
such as QUADREX and SEG (see Section 5.3). This indicates that the annual volume of potentially recyclable
material generated during utility operations is approximately 10 percent of the annual LLW burial volume. Further,
comparison of these numbers indicates that nuclear utilities currently recycle nearly all of this material to save
money by avoiding LLW disposal costs. It is expected that the total potential volume of material in Table 1-3 could
not be practically recycled or reused, because of problems such as radionuclide contamination levels and the effort
required to sort and decontaminate the mixture of the recyclable materials. Based on reported scrap volumes from
commercial processors generated by nuclear reactor operations, it is estimated that more than 80% of potentially
recyclable contaminated metal scrap is sent by utilities to commercial processors (see Section 5.3 for further
discussion).
Reference masses of metals that could potentially be recycled from the decommissioning of nuclear facilities, from
both a large PWR and a large BWR have also been established and these are presented in Table 1-4.
1-6
Table 1-4. Estimated Volumes of Concrete and Metal Associated with Potential for Reuse and Recycle Produced During Decommissioning of a Reference Large BWR and PWR
Material Category Concrete Metal Material Volume (m3) Material Volume (m3)
PWR BWR PWR BWR
Activated 800 800 1,500 1,600
Contaminated 11,700 10,800 7,600 6,700
TOTAL: 12,500 11,600 9,100 8,300
The numbers presented in Table 1-4 for potentially recyclable material are based on the material which was
considered to be "Active" or "Contaminated" in Table 1-2. Comparison of the estimated total volume of concrete
and metal from D&D presented in Table 1-2 with the potentially recyclable volume of each material in Table 1-4
shows that for steel, the recyclable portion is expected to be on the order of 20% of the total material volume, while
for concrete the volume percentages of recyclable material are on the order of 5-15%..
Of the material reported as "Metal" in Table 1-4, more than 99% is expected to be steel with about I % copper and
about 0.01 % aluminum. The latter materials are used primarily in cables and heat transfer materials.
1.3.3 Forecast of Annual Volume of Potentially Recyclable Material
This section provides a forecast of the total annual volume of potentially recyclable material that is expected to be
generated, based'on current schedules for nuclear reactor license renewal. Since the estimated volume of potentially
recyclable material from fuel cycle facilities is more than an order of magnitude smaller than reactors, only reactor
D&D material volumes are considered.
Currently, the vast majority of potentially recyclable material is generated during the normal operation of nuclear
facilities, as there has been very little decommissioning activity to date. The expected volume of potentially
recyclable material from D&D will become significant if several reactors are undergoing D&D at the same time.
Table 1-2 shows the reference volumes of waste materials expected to be generated during reactor D&D. To
illustrate, if it is assumed that three reactors were undergoing D&D at the same time and the duration of the D&D
operation was about three years, the annual volumes of potentially recyclable material generated would be on the
order of 20,000 m3/year which is approaching the current annual burials of LLW reported in Table 1-1.
1-7

assumed that three reactors were undergoing D&D at the same time and the duration of the D&D operation was about
three years, the annual volumes of potentially recyclable material generated would be on the order of 20,000 m3/year
which is approaching the current annual burials of LLW reported in Table 1-1.
If a large number of reactors undergo D&D at the same time (as is expected following the turn of the century), the
annual volume of wastes generated would far exceed the current annual burials of LLW.
1.4 Disposal of Materials from Nuclear Facilities at LLW Sites
Chapter 3 discusses expected availability and costs associated with disposal of materials from nuclear facilities at
licensed LLW disposal facilities. In the future, LLW disposal cost and availability are expected to strongly influence
reuse and recycle practices.
Currently, materials from nuclear facility operations are disposed of at LLW sites at the rate of about 45,000 mn3 per
year (1.5 million ft3). The disposition of this waste is changing as a result of developments that are occurring in the
waste disposal area. Today, the total volume of contaminated material which is potentially recyclable only represents
about 10 percent of the annual LLW burial volume. This is expected to significantly increase in the future as large
numbers of nuclear facilities undergo D&D.
Over the past few years there have been only three active low level disposal sites in the nation, but this number is
decreasing. The Nevada disposal site was closed at the end of 1992 and the South Carolina site is scheduled to close
January 1, 1996. In addition to the reduction in the number of operating sites, restrictions are being placed on the
amount of waste that is received from other regions of the country. While many regions and states have plans to
develop waste storage or disposal facilities, progress toward siting and designing such facilities is very slow. In many
instances, there are no schedules for facility openings. The net result is that most waste generators are having to make
plans to store LLW on their site until disposal or regional storage is possible.
It is very difficult to prepare cost projections for disposal of waste materials from nuclear facilities because the costs
are strong functions of the annual waste volume that is handled and, in some cases, surcharges and fees that are placed
on all or some of the waste that is handled. During the 1990s unit disposal costs are projected to range from $5,300
to $10,600 per m3 ($150 to $300 per ft3).
1-8

1.5 Decontamination Technologies
Chapter 4 provides an overview of various techniques and processes that might be used in decontaminating nuclear
components, equipment and/or materials prior.to disposal or recycle/reuse.
An extensive literature search was performed to identify all decontamination technologies that have been
demonstrated to have potential applications to nuclear material. Decontamination processes can be classified as
either surface decontamination processes or volume decontamination processes. Surface decontamination processes
are generally either an abrasive or a high pressure cleaning process, or a chemical bath process. Volume
decontamination processes are destructive in nature and generally involve either melting or electrical dissolution of
the metal.
The various decontamination processes are summarized in tabular form in Chapter 4. For each of the processes
identified, the table provides the following categories of information: a general description of the process, the
materials or chemicals used in the process, typical decontamination factors (DFs), wastes produced by the process
which ultimately require disposal, an example application of the process, any quantitative or qualitative cost data
that was available, reference documents, and miscellaneous comments.
The DF is defined as the ratio of activity before and after the decontamination process. The total activity measured
can be divided by either the mass or the surface area of the item being surveyed, giving units such as Bq/g or
Bq/cm2 . As can be expected, the DF for a process was shown to be very specific to the type and composition of
the material being removed. Certain common alloying agents (i.e., cobalt and nickel) tend to bond right into the
metal during volume decontamination processing, while others that do not normally alloy tend to leave the metal
as byproducts in the slag or dust. Because of these types of phenomena, the chemical properties of the contaminants
need to be considered when selecting the appropriate decontamination technique. Chapter 4 provides a compilation
of all laboratory and industrial-scale experiments that have been performed to characterize the behavior of
contaminants for various decontamination processes.
Since there has .not been a great deal of experience world-wide in decontaminating large amounts of nuclear
contaminated material, only limited data is currently available on expected waste volumes and costs associated with
industrial-scale application of some decontamination processes.
1-9

1.6 Recycle of Metal in the United States and Worldwide
Chapter 5 describes current commercial recycle and reuse efforts for both non-contaminated and contaminated metals
in the U.S. and worldwide for steel, copper, and aluminum. The information collected addresses both conventional
recycle of non-contaminated material as well as current recycle practices for material from nuclear facilities in the
U.S.
For the commercial recycle industry, copper, steel and aluminum were selected for examination, as they are the
metals most commonly used in nuclear power plant construction. The information presented includes a discussion
of: (1) overall domestic production and use, (2) structure of the scrap metal industry, (3) costs of recycle, and (4)
recycle process steps. Chapter 5 also examines existing practices regarding recycle of slightly contaminated metals
in the U.S. and worldwide, including estimated material flows for contaminated scrap processing.
The major points which can be drawn from the discussion in Chapter 5 are:
1) The extent of recycle for specific metals depends on the market value for the scrap metal and the general supply of the scrap. For low-valued high-volume metals such as iron or steel (scrap values of pennies per pound), there is recycle potential which tends to be of a local nature because the collection and hauling costs can easily become greater than the selling price of the scrap material. For such low-valued, high-volume metals not all of the scrap is recycled. In contrast, higher value metals such as copper and aluminum have very high recycle percentages because the collection and transportation costs are generally less than the selling price of the scrap metal at the recycle facility. For these metals, there are accumulations of these metals awaiting recycle.
2) At the present time, about 4,000 to 5,000 MT/year of material is recycled from licensed nuclear operations. Material with only surface contamination is released according to the limits in NRC Regulatory Guide 1.86. Material which has volumetric contamination is not released on an unrestricted basis but must go to a licensee or an organization that is exempt from licensing, such as the DOE. The recycling is performed primarily by two companies, SEG and QUADREX, both of which are licensed by the state of Tennessee. Most of the recycled material is carbon steel with smaller amounts of stainless steel or Inconel, copper alloys; and aluminum.
3) The mass of material potentially available for recycle from nuclear operations (on the order of a few tens of thousands of tons per year of steel, a few tens to hundreds of tons of aluminum and
..copper) are very small in comparison to the normal industrial recycle amounts. Old (postconsumer) iron and steel scrap is recycled at the rate of about 30 million metric tons per year, old copper scrap is recycled at the rate of about half a million metric tons per year, and old aluminum scrap is recycled at the rate of over one million metric tons per year. All of these flows are about three orders of magnitude greater than the potential contribution from nuclear facilities.
1-10
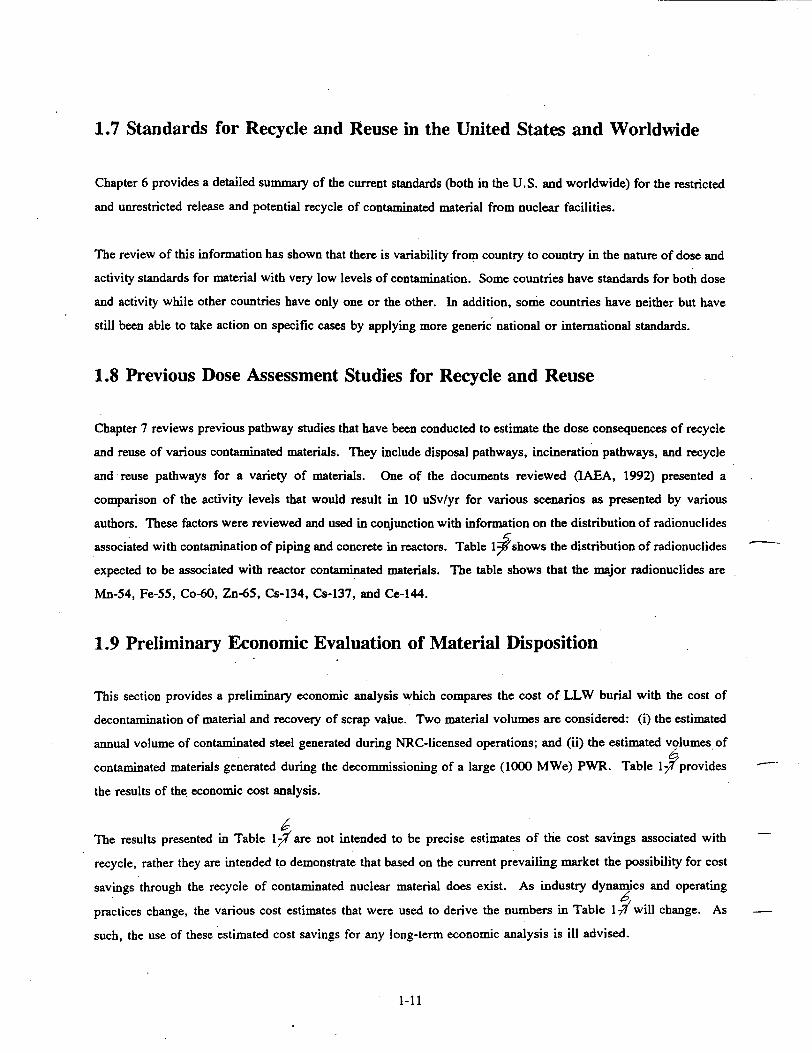
1.7 Standards for Recycle and Reuse in the United States and Worldwide
Chapter 6 provides a detailed summary of the current standards (both in the U.S. and worldwide) for the restricted
and unrestricted release and potential recycle of contaminated material from nuclear facilities.
The review of this information has shown that there is variability from country to country in the nature of dose and
activity standards for material with very low levels of contamination. Some countries have standards for both dose
and activity while other countries have only one or the other. In addition, some countries have neither but have
still been able to take action on specific cases by applying more generic national or international standards.
1.8 Previous Dose Assessment Studies for Recycle and Reuse
Chapter 7 reviews previous pathway studies that have been conducted to estimate the dose consequences of recycle
and reuse of various contaminated materials. They include disposal pathways, incineration pathways, and recycle
and reuse pathways for a variety of materials. One of the documents reviewed (IAEA, 1992) presented a
comparison of the activity levels that would result in 10 uSv/yr for various scenarios as presented by various
authors. These factors were reviewed and used in conjunction with information on the distribution of radionuclides
associated with contamination of piping and concrete in reactors. Table 1 shows the distribution of radionuclides
expected to be associated with reactor contaminated materials. The table shows that the major radionuclides are
Mn-54, Fe-55, Co-60, Zn-65, Cs-134, Cs-137, and Ce-144.
1.9 Preliminary Economic Evaluation of Material Disposition
This section provides a preliminary economic analysis which compares the cost of LLW burial with the cost of
decontamination of material and recovery of scrap value. Two material volumes are considered: (i) the estimated
annual volume of contaminated steel generated during NRC-licensed operations; and (ii) the estimated volumes of 6
contaminated materials generated during the decommissioning of a large (1000 MWe) PWR. Table 1-/provides
the results of the. economic cost analysis.
The results presented in Table 1-I are not intended to be precise estimates of the cost savings associated with
recycle, rather they are intended to demonstrate that based on the current prevailing market the possibility for cost
savings through the recycle of contaminated nuclear material does exist. As industry dynamics and operating
practices change, the various cost estimates that were used to derive the numbers in Table 1 will change. As
such, the use of these estimated cost savings for any long-term economic analysis is ill advised.
1-11

Table 1-5. Comparison of Isotopic Distribution Expected for Reactor Contaminated Piping and Concrete
Piping
Radionuclide Primary Secondary Concrete (% Activity) (% Activity) (% Activity)
Mn- 54 2.54 13.11 0.38
Fe- 55 69.96 81.92 12.29
Ni- 59 0.01 0.00 0.05
Co- 60 13.57 3.44 6.76
Ni- 63 1.70 0.16 0.30
Zn- 65 11.87 1.20 0.00
Sr- 90 .0.01 0.01 0.01
Ag-110 m 0.11
Sb-125 0.03 0.00
Cs-134 0.06 19.06
Cs-137 0.12 0.07 22.75
Ce-144 38.11
Eu-152 0.06
Eu-154 0.04
Eu-155 0.02
Cm-242 0.15 0.07 0.05
TOTAL: 100.00 100.00 100.00
1-12
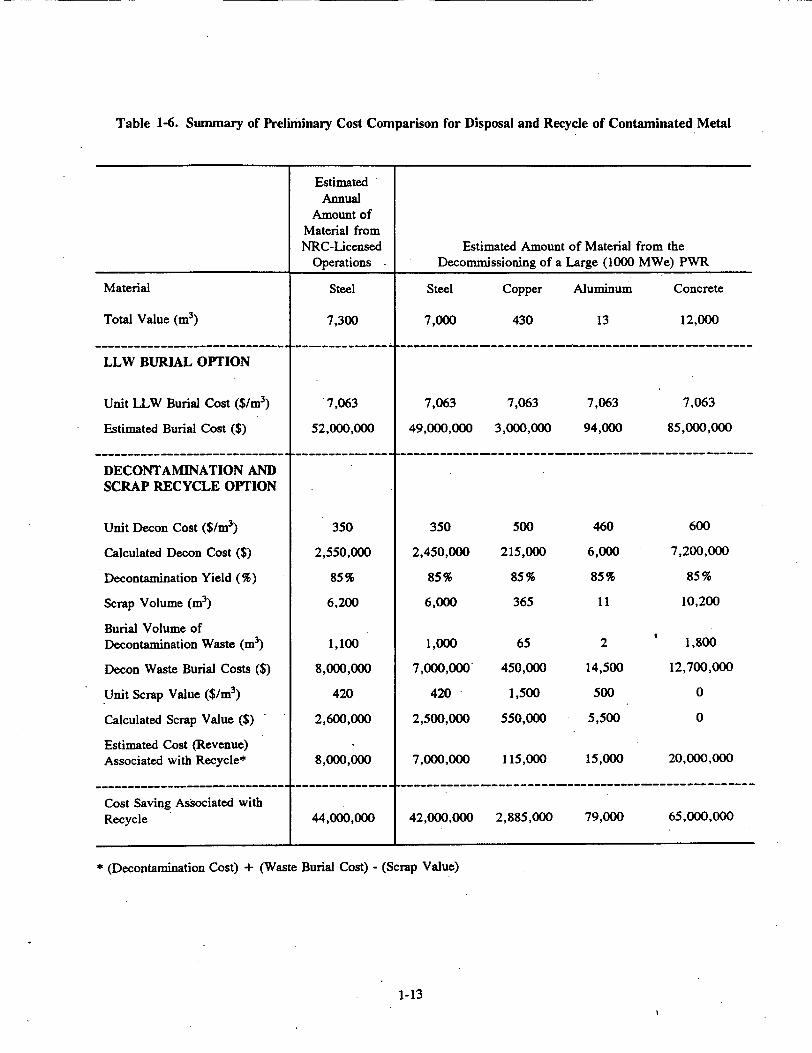
Table 1-6. Summary of Preliminary Cost Comparison for Disposal and Recycle of Contaminated Metal
Estimated Annual
Amount of Material from NRC-Licensed Estimated Amount of Material from the
Operations Decommissioning of a Large (1000 MWe) PWR
Material Steel Steel Copper Aluminum Concrete
Total Value (m3) 7,300 7,000 430 13 12,000
LLW BURIAL OPTION
Unit LLW Burial Cost ($/m 3) 7,063 7,063 7,063 7,063 7,063
Estimated Burial Cost ($) 52,000,000 49,000,000 3,000,000 94,000 85,000,000
DECONTAMINATION AND SCRAP RECYCLE OPTION
Unit Decon Cost ($/m 3) 350 350 500 460 600
Calculated Decon Cost Cs) 2,550,000 2,450,000 215,000 6,000 7,200,000
Decontamination Yield (%) 85% 85% 85% 85% 85%
Scrap Volume (m3) 6,200 6,000 365 11 10,200
Burial Volume of Decontamination Waste (mn3) 1,100 1,000 65 2 1,800
Decon Waste Burial Costs ($) 8,000,000 7,000,000' 450,000 14,500 12,700,000
Unit Scrap Value ($/m 3) 420 420 • 1,500 500 0
Calculated Scrap Value ($) 2,600,000 2,500,000 550,000 5,500 0
Estimated Cost (Revenue) Associated with Recycle* 8,000,000 7,000,000 115,000 15,000 20,000,000
------------------------ ----- - - - - ----------------------------.
Cost Saving Associated with Recycle 44,000,000 42,000,000 2,885,000 79,000 65,000,000
• (Decontamination Cost) + (Waste Burial Cost) - (Scrap Value)
1-13
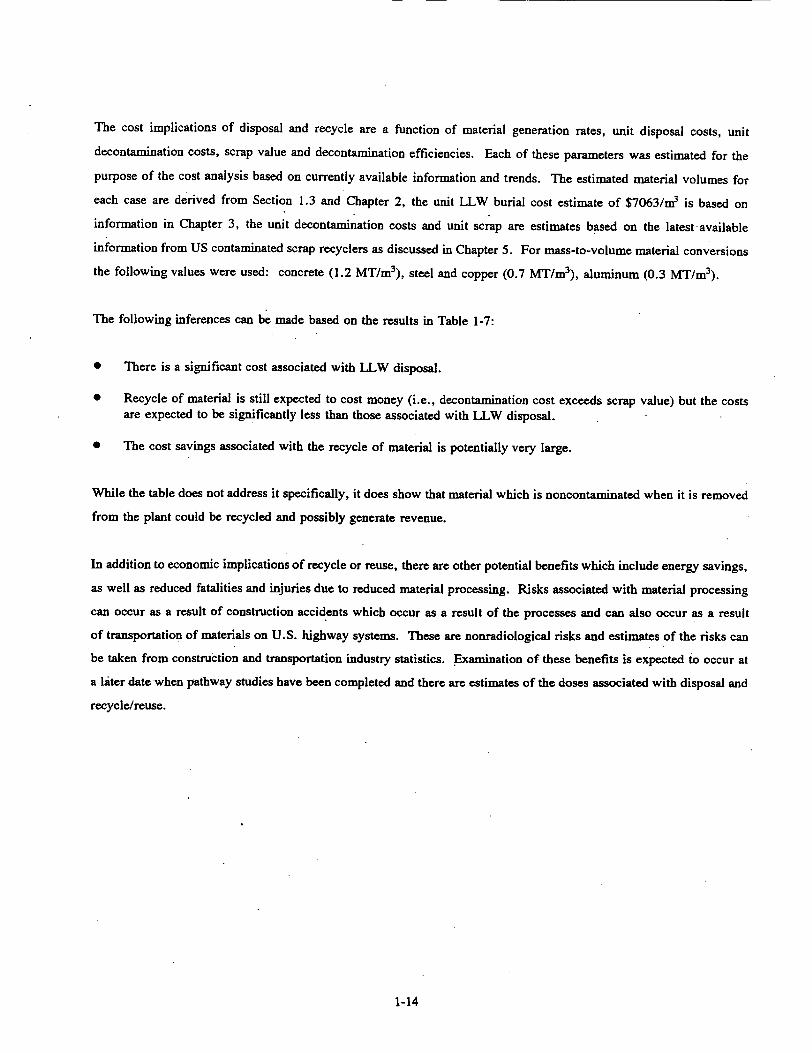
The cost implications of disposal and recycle are a function of material generation rates, unit disposal costs, unit
decontamination costs, scrap value and decontamination efficiencies. Each of these parameters was estimated for the
purpose of the cost analysis based on currently available information and trends. The estimated material volumes for
each case are derived from Section 1.3 and Chapter 2, the unit LLW burial cost estimate of $7063/m 3 is based on
information in Chapter 3, the unit decontamination costs and unit scrap are estimates based on the latest available
information from US contaminated scrap recyclers as discussed in Chapter 5. For mass-to-volume material conversions
the following values were used: concrete (1.2 MT/m3), steel and copper (0.7 MT/m 3), aluminum (0.3 MT/m3).
The following inferences can be made based on the results in Table 1-7:
* There is a significant cost associated with LLW disposal.
* Recycle of material is still expected to cost money (i.e., decontamination cost exceeds scrap value) but the costs are expected to be significantly less than those associated with LLW disposal.
* The cost savings associated with the recycle of material is potentially very large.
While the table does not address it specifically, it does show that material which is noncontaminated when it is removed
from the plant could be recycled and possibly generate revenue.
In addition to economic implications of recycle or reuse, there are other potential benefits which include energy savings,
as well as reduced fatalities and injuries due to reduced material processing. Risks associated with material processing
can occur as a result of construction accidents which occur as a result of the processes and can also occur as a result
of transportation of materials on U.S. highway systems. These are nonradiological risks and estimates of the risks can
be taken from construction and transportation industry statistics. Examination of these benefits is expected to occur at
a later date when pathway studies have been completed and there are estimates of the doses associated with disposal and
recycle/reuse.
1-14

2. GENERATION OF WASTE MATERIALS AND EQUIPMENT DURING NORMAL OPERATIONS AND DECOMMISSIONING
2.1 Introduction
The purpose of this chapter is to present information on the slightly contaminated equipment and materials that
are expected to be generated during normal operations and decommissioning at NRC-licensed facilities, which
have the potential for being reused or recycled. The presentation is organized into two major sections that are
based on facility types - Section 2.2 is devoted to nuclear reactors and Section 2.3 to nuclear fuel cycle
facilities. For reactors, information is also presented on the expected radionuclide content of this material and
equipment. In general, the materials which are considered to have potential for reuse and recycle in nuclear
reactor and fuel cycle facilities are: concrete, iron/steel, aluminum and copper.
There was no single source of information which contained all of the relevant material to accurately estimate the
material volumes and radionuclide content of material described in this chapter. The information presented are
best-estimates, based on a thorough literature search of activities carried out to support the US NRC, EPRI and
several international organizations (e.g., Euratom, CEC). In some studies, information was presented as
material volumes, while other studies referenced material mass masses. Conversion factors were developed for
each type of material considered based on the available information. In the end, information from.several
different studies was combined to provide the best available estimate. All relevant sources are referenced and,
in general, the data is considered to be accurate to within a factor of 2.
2.2 Nuclear Reactors
Information is reviewed regarding the amount of material and radionuclide contamination level that is generated
and may be recycled during normal operations (Section 2.2.1) and during decommissioning (Section 2.2.2).
2.2.1 Normal Operations of Reactors
2.2.1.1 Volumes and Masses of Waste Material and Equipment
The operation of nuclear power reactors results in the generation of a variety of wastes, including protective
clothing, contaminated tools and equipment, filters, irradiated metals, fittings, valves, wood, paper, and plastic.
The amount of these materials produced at a reactor varies depending on the current operating status of the
2-1

reactor (major outage versus normal full power operation), the details of the reactor support systems such as the
waste treatment systems, and the type of reactor (PWR versus BWR).
One source of information on this waste material is the Electric Power Research Institute (EPRI) which, as part
of a research effort to support a rulemaking petition for Below Regulatory Concern (BRC), identified and
evaluated several different waste streams produced at nuclear power plants which were potential candidates for
exemption from low-level waste disposal requirements. Of twelve waste streams that were identified, three
were identified as potentially attractive from a reuse or recycle viewpoint (Dalosio, 1989). These three waste
streams were:
"* non-compacted dry active waste (DAW): material and small components such as tools, conduit, pipes, valves, fittings, and other scrap material which is not normally compacted before disposal as radwaste;
"* secondary side large components: any large pieces of equipment (not considered non-compacted DAW) from the steam and condensate systems (secondary side) of both BWRs and PWRs, which typically contain very low levels of surface or volumetric activity. Examples include feedwater heaters, piping, condensate pumps, etc.;
"* condenser tubes: low activity tube bundles resulting from the replacement of BWR condenser tubes.
The volumes and mass associated with these three equipment categories which EPRI identified as having
potential for reuse or recycle are presented in Table 2-1. The table shows that the non-compacted dry active
waste stream has a much larger volume than the other two and there is variation in the volume of the non
compacted dry active waste stream with reactor type. The waste volumes for secondary side large components
and condenser tubes were converted to a mass basis using a nominal burial density of 700 kg/m3 (obtained from
PNL estimates of burial volumes of metallic waste from the decommissioning of PWRs and BWRs). For non
compacted dry active waste, a nominal density of 350 kg/m 3 was used based on an estimated scrap yield of 50
percent.
2-2

Table 2-1. Reference Annual Volumes of Wastes with Potential for Reuse and Recycle Produced During
Normal Operations by a Typical PWR and BWR.
Annual Average Waste Volume from a PWR
Annual Average Waste Volume from a BWR
Waste Type (M3) (MT) (M3 ) (MT)
Non Compacted Dry 41.9 14.6 90.6 31.7 Active Waste
Secondary Side Large 1.4 1.0 5.7 4.0 Components
Condenser Tubes N/A N/A 10.8 7.5
The volume estimates were checked against other estimates of these waste streams. The EPRI non-compacted
dry active waste volume estimate was compared against an earlier estimate prepared by the NRC in the Draft
Environmental Impact Statement (EIS) for the rulemaking in 10 CFR 61 (USNRC, 1981). That document
presented an estimate for non-compactible trash that was on the order of 105 to 110 cubic meters per year for
an average 1000 MWe LWR. (These estimates were not revised in the Final EIS for the 10 CFR Part 61
rulemaking). Waste classified as non-compactible trash is generally non-combustible and has a high percentage
of metallic components. These include irradiated reactor internals such as filters, instrumentation, tools, and
miscellaneous equipment. As such, it is considered to be comparable to EPRI's designation of non-compactible
dry active waste. Although NRC estimates are about a factor of two larger than the EPRI estimate for the PWR
and about the same for the BWR, this difference is not considered significant given the uncertainty in these
types of estimates and the expectation that there would be some decrease over the years as a result of industry
efforts to minimize waste generation due to increases in waste disposal costs.
Using the reference volumes for potentially recyclable material in Table 2-1 and considering the total population
of operating reactors (77 PWRs, 37 BWRs), the estimated annual volume of such waste produced during normal
operations is 2,400 MT (7,000 in3). These numbers indicate that roughly 60% of the 4,000-5,000 MT of metal
which is sent by nuclear utilities to contaminated scrap recyclers such as QUADREX each year (see Section
5.3). About 85-90% of the material processed is sold as commercial scrap with the remaining 10-15% being
sent to licensed LLW disposal sites.
2-3

2.2.1.2 Radionuclide Content of Waste Material and Equipment
The only source of information on contamination levels and distribution of nuclides for non-compacted dry
active waste (uncompacted trash) was the NRC DEIS for the 10 CFR Part 61 Regulations (USNRC, 1981).
This information is presented in Table 2-2. The major nuclides were Co-60, Cs-137, and Fe-55. Comparison
of total activity levels shows BWR contamination levels are expected to be significantly higher than those
associated with PWRs.
Information on contamination levels and radionuclide distribution for secondary side components and condenser
tubes was found in a report by PNL (Abel, 1986). Information from this report is presented in Table 2-3. The
table shows there are large variations in contamination levels. On the average, the major radionuclides are Fe
55, Mn-54, and Co-60.
It should be noted that concentration levels presented in Tables 2-2 and 2-3 provide a statement of the relative
abundance of various isotopes as they are presented in material as it is removed from the plant. From a public
health and safety point of view, the significance of these results depends on how this material is processed and
ultimately disposed of afterwards. This is the very subject of the dose pathway assessment studies in Volume H
of this report.
2-4

Table 2-2. Level of Activity and Distribution of Radionudide Contaminants Associated with Non-compacted Trash
NRC Non-compacted Trash
PWR BWR Radionuclide (% Activity) (% Activity)
H-3 1.33 0.29 C-14 0.05 0.02 Mn-54 0.00 0.00 Fe-55 26.13 25.60 Ni-59 0.03 0.03 Co-58 0.00 0.00 Co-60 50.55 42.79 Ni-63 9.63 0.58 Sr-90 0.10 0.05 Nb-95 0.00 0.00 Zr-95 0.00 0.00 Ru-106 0.00 0.00 Ag-110 m 0.00 0.00 Sb-125 0.00 0.00 Cs-134 0.00 0.00 Cs-137 11.03 30.38 Pu-238 0.03 0.01 Pu-239 240 0.02 0.00 Pu-241 1.06 0.24 Cm-244 0.01 0.01
Total Activity .525 3.79 Ci/m
3
2-5
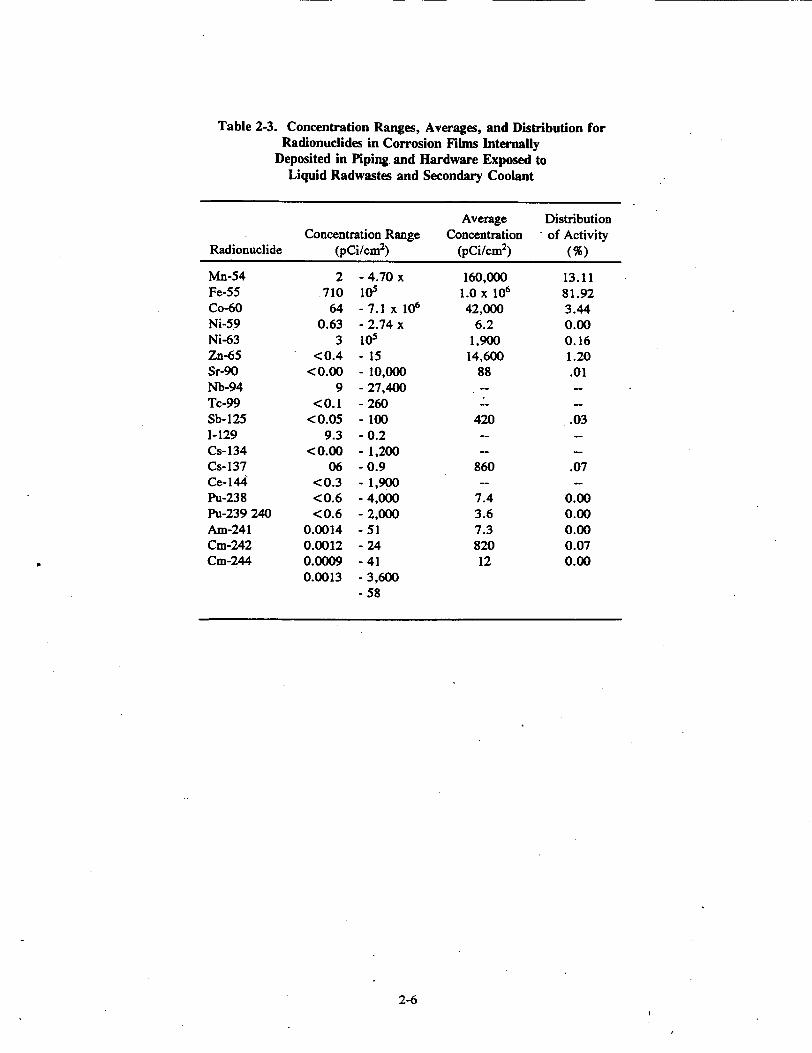
Table 2-3. Concentration Ranges, Averages, and Distribution for Radionuclides in Corrosion Films Internally
Deposited in Piping. and Hardware Exposed to Liquid Radwastes and Secondary Coolant
Average Distribution Concentration Range Concentration - of Activity
Radionuclide (pCi/cm 2) (pCi/cm 2) (%)
Mn-54 Fe-55 Co-60 Ni-59 Ni-63 Zn-65 Sr-90 Nb-94 Tc-99 Sb-125 1-129 Cs-134 Cs-137 Ce-144 Pu-238 Pu-239 240 Am-241 Cm-242 Cm-244
2 710
64 0.63
3 <0.4
<0.00 9
<0.1 <0.05
9.3 <0.00
06 <0.3 <0.6 <0.6
0.0014 0.0012 0.0009 0.0013
- 4.70 x 10⁵ -7.1 x 10⁶ - 2.74 x 10⁵ - 15 - 10,000 - 27,400 - 260 -100 - 0.2 - 1,200 -0.9 -1,900 - 4,000 - 2,000
-51 - 24 -41 - 3,600 - 58
160,000 1.0 x 10⁶
42,000 6.2
1,900 14,600
88
420
860
7.4 3.6 7.3 820 12
13.11 81.92 3.44 0.00 0.16 1.20 .01
.. 03
.07
0.00 0.00 0.00 0.07 0.00
2-6

2.2.2 Decommissioning of Reactors
2.2.2.1 Volumes and Masses of Waste Material and Equipment
Pressurized Water Reactor (PWR)
In a PWR, heat is transferred from the reactor pressure vessel to a heat exchanger by water kept under high
pressure in order to achieve high temperature without boiling in the primary system. Steam is generated in the
secondary circuit. The steam is used to drive the turbine to produce electricity. Fuel for the PWR is slightly
enriched uranium dioxide (U0 2) in rod form, encased in zircaloy cladding. The design and manufacture of the
PWR fuel is such that is has a very low potential for leakage. In addition, primary coolant system water is
treated to reduce radiation exposure to workers.
Nevertheless, at the end of a reactor's operating life, various components in the reactor primary coolant system
will have different types and levels of radionuclide contamination. The material that is very near the reactor
core (the reactor pressure vessel and internal components, the piping within the biological shield, and the
materials that form the biological shield) will have undergone neutron irradiation during the operating life of the
reactor and as a result will contain activation products distributed throughout these materials. This material is
referred to as activated equipment and has radioactive isotopes throughout the material volume, not just on the
surface.
Components, equipment, and piping throughout the facility can have surface contamination as a result of the
deposition of radionuclides on their internal surfaces. Contamination associated with the primary system
components and piping and with other systems in contact with the primary system, such as the auxiliary system
or radwaste system, would contain radionuclides from any leaking fuel or from activation of corrosion products
present in the water within the reactor vessel. This contamination deposits on the equipment and piping
surfaces. Contamination levels on piping and equipment in the secondary cooling system is generally
significantly lower due to the heat exchange barrier. This material is referred to as contaminated and has
varying levels of. radioactivity, depending on the facility. This equipment can be decontaminated to reduce the
levels of radioactivity. Certain components in certain systems in a reactor (i.e., circulating water, service
water, etc.) do not come into contact with any radioactivity and are referred to as "clean."
When the reactor is decommissioned, all the equipment, components, and piping are removed and the structure
is demolished. An estimate was made of the materials associated with the decommissioning of a large PWR.
This estimate was based primarily on an ORNL study (Bryan, 1974) which presented a listing of materials in a
PWR and provided information on the distribution of these materials throughout the major plant systems. The
2-7

ORNL report did not, however, identify material at the component level. A second source of information was a
PNL study on the decommissioning of a large PWR (PNL, 1985). This report identified some of the major
components of a reactor that would be contaminated, but it did not identify all of the materials in a PWR.
Comparisons of information in the two reports were made where possible. Such comparisons are considered to
be indicative of the variability that can be expected between individual plants. As an example, the ORNL report
identifies about 3,600 MT of steel in reactor building equipment while the PNL report identifies about 2,800
MT. Only the PNL report provides details on the major components contributing to the mass. The major
components and their mass are reactor vessel and head, 400 MT; steam generators (4), 1,250 MT; coolant
pumps (4), 340 MT; and piping, 600 MT. The comparisons of concrete in the reactor building are more
difficult. The ORNL report estimates 54,000 MT of concrete associated with the reactor building which
includes the containment structure, while the PNL report identified about 13,000 MT, but this PNL estimate
was only for structures within containment. Table 2-4 provides an estimate of the total mass, of material within
a large PWR with the information drawn largely from the ORNL report which addressed the entire PWR
facility.
Table 2-4. Mass of Major Materials in a Typical Large (1000 MWe) PWR
Mass of Mass of Mass of Mass of Concrete Steel Copper Aluminum
Plant Area (MT) (MT) (MT) (MT)
Reactor Building and 55,000 12,000 60 5 Equipment
Auxiliary Building and 34,000 1,500 Equipment
Fuel Building and 7,000 500 Equipment
Turbine Building and 31,000 13,000 52 1 Equipment
Control Building 17,000 2,000 6
Main Cooling System 28,000 2,500 (Canals or Tower)
Electrical Plant 1,300 1,000 560 4
Total* 180,000 35,000 700 18
* Includes materials from plant areas other than the major ones identified in the table
2-8

An estimate was also made of the general contamination status of this material at the time of reactor
decommissioning. For these estimates, the primary source of information was the PNL report along with a
Euratom report (Group of Experts) and a CEC report (Charles, 1992). The material was grouped into three
broad categories: (i) activated material which would come from the reactor core region, (ii) contaminated
material which would cover material with surface contamination at levels above free release, and (iii) clean
material which should be uncontaminated. The contaminated material would be equipment which contained the
primary coolant, the rad waste systems, and areas where there were leaks or spills. Table 2-5 provides a
summary of the expected waste masses produced during the decommissioning of a typical PWR. While
individual reactors are expected to vary from these reference values because of design and operational specifics
at each plant, this distribution of material status is considered to be typical.
Table 2-5. Reference Waste Masses Produced During the Decommissioning of a Typical PWR
Concrete Steel Copper Aluminum Material Category (MT) (MT) (MT) (MT)
Activated 1,000 1,000 0 0 (0.5%) (3%)
Contaminated 14,000 5,000 300 4 (7.5%) (14%) (43%) (22%)
Clean 165,000 29,000 400 14
(92%) (83%) (57%) (78%)
Total 180,000 35,000 700 18
Boiling Water Reactor (BWR)
In a BWR, water is used as both coolant and moderator and is allowed to boil in the core. The steam from the
reactor is dried and then used to drive the turbine to produce electricity. The designs of a boiling water reactor
core are similar to those of pressurized water reactor. BWR fuel is also U0 2 in rod form with zircaloy
cladding, and is designed and manufactured to have low leakage potential. Contamination at a BWVR is caused
in the same manner as at a PWR, resulting in activation of equipment and deposition of radioactive by-products
on the equipment and component surfaces.
In many areas the design of a BWR is comparable to that of a PWR. Systems which are included at both types
of plants are expected to have higher levels of radioactive contamination in a BWR because this equipment has
2-9
routine contact with radionuclides during the operating life of the plant. The basic design of the electrical plant
would not be expected to change based on the style of the reactor. The turbine plant equipment and the
instrumentation and control equipment is basically made up of the same types and quantities of materials
regardless of the style of the reactor.
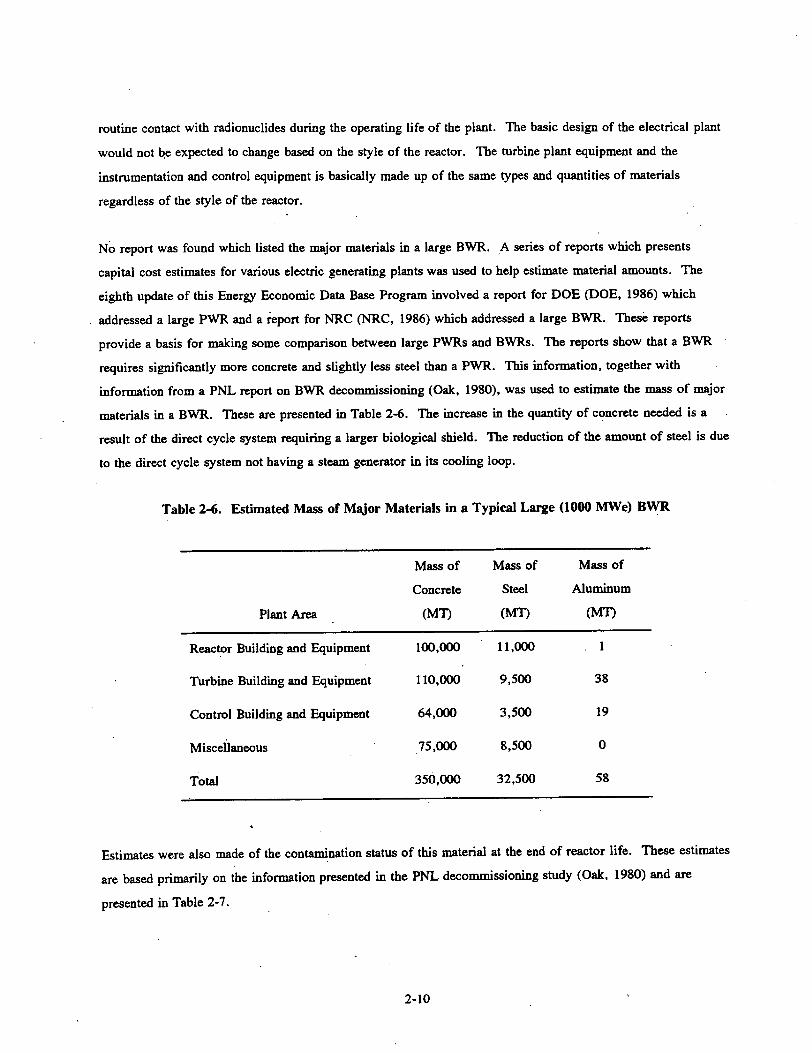
No report was found which listed the major materials in a large BWR. A series of reports which presents
capital cost estimates for various electric generating plants was used to help estimate material amounts. The
eighth update of this Energy Economic Data Base Program involved a report for DOE (DOE, 1986) which
addressed a large PWR and a report for NRC (NRC, 1986) which addressed a large BWR. These reports
provide a basis for making some comparison between large PWRs and BWRs. The reports show that a BWR
requires significantly more concrete and slightly less steel than a PWR. This information, together with
information from a PNL report on BWR decommissioning (Oak, 1980), was used to estimate the mass of major
materials in a BWR. These are presented in Table 2-6. The increase in the quantity of concrete needed is a
result of the direct cycle system requiring a larger biological shield. The reduction of the amount of steel is due
to the direct cycle system not having a steam generator in its cooling loop.
Table 2-6. Estimated Mass of Major Materials in a Typical Large (1000 MWe) BWR
Mass of Mass of Mass of
Concrete Steel Aluminum
Plant Area (MT) (MI) (MT)
Reactor Building and Equipment 100,000 11,000 1
Turbine Building and Equipment 110,000 9,500 38
Control Building and Equipment 64,000 3,500 19
Miscellaneous 75,000 8,500 0
Total 350,000 32,500 58
Estimates were also made of the contamination status of this material at the end of reactor life. These estimates
are based primarily on the information presented in the PNL decommissioning study (Oak, 1980) and are
presented in Table 2-7.
2-10

Table 2-7. Reference Waste Masses Produced During the Decommissioning of a Typical Large (1000 MWe) BWR
Material Category Concrete Steel
(MI) (MT)
Activated 1,000 1,100
Contaminated 13,000 4,700
Clean 334,000 26,700
While the previous discussion has presented reference masses for a large PWR and a large BWR, it must be
recognized that reactor design within this country has not been standardized to any significant extent. There is
significant variation in plant layout and component size for plants of similar type. Consequently, there are
variations in the amounts and types of materials used at a reactor site.
Additional variability is expected to be associated with the estimates of status of material at the end of plant life.
The levels of contamination will be a function of design features as well as component performance and
operating practice. The variations in design was previously mentioned and the variations of component
performance could lead to variations in the number of leakage incidents and the number of maintenance
operations which would be expected to be related to the extent of contamination. Variations in operating
practice can affect housekeeping practices, which can result in varying levels of contamination.
As can be seen from Tables 2-5 and 2-7, BWRs and the PWRs produced roughly the same types and quantities
of waste masses during decommissioning. This is consistent with the estimates of contaminated material that is
reported in CEC publications (Charles, 1992 and CEC, 1988).
2.2.2.2 Radionuclide Content of Waste Material and Equipment
Because of the variability in contamination levels in PWRs and BWRs at the end of reactor life, only one
presentation of information is made concerning types and levels of contamination. This information was drawn
from a PNL report which measured contamination in various PWRs and BWRs. This report examined
contamination in primary coolant systems, secondary coolant systems and concrete.
2-11

This investigation showed that the most abundant isotopes associated with primary and secondary reactor piping
and hardware are expected to be Mn-54, Fe-55, Ni-63, and Co-60. Zn-65 was present in significant amounts
on the corrosion film in BWRs. There can also be traces of transuranic elements such as plutonium, curium,
and americium. The level and makeup of the radioactive contamination is expected to be quite variable from
plant to plant based on the analysis that was performed of selected nuclear plants (Abel, 1986; p. 16). The
information on the distribution of radionuclides found in primary and secondary piping and hardware is
presented in Tables 2-3 and 2-8.
The investigation also examined the expected distribution (based on percent total activity) of radionuclides
among primary and secondary piping and hardware. The majority (an estimated 75 to 95 percent) of the
radionuclide contamination is expected to be in the steam generators while the second major source of
contamination (an estimated 5 to 10 percent) is expected to be in the radwaste area (Abel, 1986). Table 2-9
presents this data for three PWRs.
Concrete associated with the bioshield and the sump area directly under the reactor vessel will be subject to
neutron irradiation. Concrete that is subject to spills will also be contaminated. The distribution of
radionuclides associated with contaminated concrete is presented in Table 2-10 (Abel, 1986). The table shows
that the dominant radionuclides are expected to be Fe-55, Cs-134, Cs-137, and Ce-144.
2-12
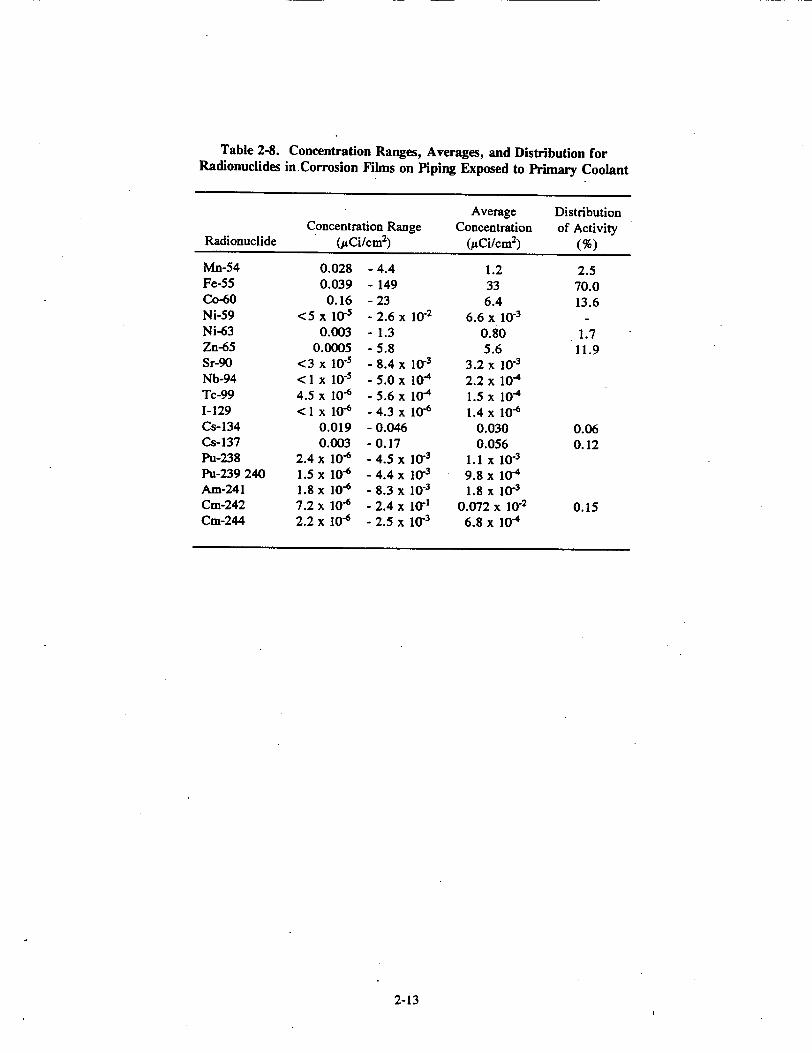
Table 2-8. Concentration Ranges, Averages, and Distribution for Radionuclides in Corrosion Films on Piping Exposed to Primary Coolant
Average Distribution Concentration Range Concentration of Activity
Radionuclide (jUCi/cm 2) (,UCi/Cm 2) (%)
Mn-54 0.028 - 4.4 1.2 2.5 Fe-55 0.039 - 149 33 70.0 Co-60 0.16 - 23 6.4 13.6 Ni-59 <5 x 10⁻⁵ - 2.6 x 10⁻² 6.6 x 10⁻³ Ni-63 0.003 - 1.3 0.80 1.7 Zn-65 0.0005 -5.8 5.6 11.9 Sr-90 <3 x 10 - 8.4 x 10⁻³ 3.2 x 10⁻³ Nb-94 <I x 10-' -5.0x 10⁴ 2.2x 10⁻⁴ Tc-99 4.5 x 10⁻⁶ - 5.6 x 10⁻⁴ 1.5 x 10⁻⁴ 1-129 <1 x 10⁻⁶ -4.3x 10⁻⁶ 1.4x 10⁻⁶ Cs-134 0.019 - 0.046 0.030 0.06 Cs-137 0.003 - 0.17 0.056 0.12 Pu-238 2.4 x 10.6 -4.5 x 10⁻³ 1.1 X 10⁻³
Pu-239 240 1.5 x 10⁻⁶ - 4.4 x 10⁻³ 9.8 x 10⁻⁴ Am-241 1.8 x 10⁻⁶ - 8.3 x 10⁻³ 1.8 x 10⁻³
Cm-242 7.2 x 10⁻⁶ - 2.4 x 10⁻¹ 0.072 x 10⁻² 0.15 Cm-244 2.2 x 10⁻⁶ - 2.5 x 10⁻³ 6.8 x 10⁻⁴
2-13

Table 2-9. Distribution (%) of the Radionuclide Inventory Estimates for Three Pressurized Water Reactors
Turkey Indian Rancho Point-2 Point-1 Seco
Steam Generators 89 77 94 Pressurizer 0.5 0.5 0.33 RCS Piping 0.9 2.6 0.71 Piping (Except (RCS) <0.01 14 <0.01 Secondary System 0.1 0.2 0.05 Radwaste 9.2 7 5
Table 2-10. Concentration Ranges, Averages, and Distribution for Radionuclides Associated with Concrete from Highly Contaminated
Areas Within Selected Nuclear Generating Stations
Average Distribution Concentration Range Concentration of Activity
Radionuclide (pCi/cm2) (pCi/cm 2) (%)
Mn-54 Fe-55 Co-60 Ni-59 Ni-63 Sr-90 Nb-94 Tc-99 Ru-106 Ag-110m Cs-134 Cs-137 Ce-144 Eu-152 Eu-154 Eu-155 Pu-238 Pu-239 240 Ami-241 Cm-242 "Cm-244 Np-237
35 2,200
590 30
3,100 1.6 <3
0.27 <30
59 70
550 26 9
90 10
0.025 0.089
0.10 0.06 0.05
0.013
- 21,000 - 830,000 - 460,000 - 2,400 - 6,400 - 480 -50 - 2.4 -190 - 3,600 - 1.7 x 10⁶ - 2.0 x 10⁶ -3.1 x 10⁶ - 3,100 - 1,500 - 500 - 48 -21 - 30 - 1,800 - 52 - 0.26
0.4 12.3 6.7
0.3
0.1 19.1 22.8 38.2 0.1
6,200 200,000 110,000
860 4,800
170
1.6
1,800 310,000 370,000 620,000
1,000 680 260 14 7.7 8.7 880 13
0.016
2-14

2.3 Fuel Cycle Facilities
Equipment, components, and waste materials that have the potential for reuse and recycle are also generated by
the fuel cycle facilities that support reactor operations. These facilities include the fuel conversion facilities and
the fuel fabrication facilities. The total generation of recyclable material volumes from these facilities is
expected to be less than those from reactors because they are smaller in size and fewer in number. There are,
as of 1993, two uranium conversion facilities and six fuel fabrication facilities in the United States.
2.3.1 Normal Operations of Fuel Facilities
While no direct estimates were identified for fuel cycle industry generation of equipment, components, etc. with
high reuse or recycle potential, the NRC has previously estimated that about 15.5 m3/GWe-year of non-process,
non-combustible waste was generated by the nuclear fuel fabrication industry during normal operation (NRC,
1981). Given the current annual U.S. nuclear power generation rate of about 66 GWe (EIA, 1991), this results
in an annual estimate of about 1,000 m3/year. Because this estimate is for all non-process, non-combustible
waste, it is expected to be a high estimate of the actual material that is a candidate for reuse or recycle from
these facilities. It is estimated that less than 25% of this annual volume has both low levels of contamination
and involves material that could be reused or recycled. If this estimated volume is used in conjunction with a
nominal material density of 700 kg/m3 , a value representative of the average density of metallic waste that is
buried from the D&D of a reactor (Oak, 1980; Smith 1979), the total estimated mass is on the order of 175
MT/year (250 m3/yr) for the total population of fabrication facilities.
NRC also estimated that the total volume of waste generated from fuel conversion facilities was 9.6 m3/GWe-yr
(NRC, 1981). Using the same annual power generation rate, this results in an estimated annual volume of about
630 m3/year. As with the previous NRC estimate, this is considered to be a high estimate of the amount of
material available for reuse or recycle. As part of its license renewal, Sequoyah Fuels Corporation estimated its
annual generation rate for contaminated equipment to be about 30 m3 per year (SFC, 1992). If this estimate is
applied to both U.S. conversion facilities, the total volume of material with very low levels of contamination
would be on the order of 60 m3/year, or about ten percent of the NRC estimate of the total LLW generated
from such facilities. SFC 'presented no mass estimate along with the volume estimate. Assuming the same
nominal density of 700 kgim3 which was used above, this corresponds to an annual mass of 42 MT/year.
This analysis indicates that the total amount of metallic material that is being generated by the nuclear fuel cycle
facility operations, with the potential for reuse or recycle, is on the order of 200 MT/year (310 m3/yr).
2-15

2.3.2 Decommissioning of Fuel Facilities
Equipment, components, etc. with very low levels of contamination are produced during facility operations.
Similar to reactors, when a fuel cycle facility is decommissioned, the equipment, components, piping, etc. are
dismantled and are available for potential recycle and reuse. This can result in material with very low levels of
contamination being produced during facility decommissioning. Based on an earlier study which estimated the
waste that would be generated during the decommissioning of a uranium fuel fabrication facility (Elder, 1980),
it is estimated that as much as 500 to 600 MT of equipment, piping, and ducting could be recycled if it could be
adequately decontaminated.
It is estimated that a similar mass would be associated with the decommissioning of a uranium conversion
facility.
2-16

3. DISPOSAL OF MATERIALS FROM NUCLEAR FACILITIES AT LLW SITES
3.1 Current and Projected Status of Commercial Low Level Waste Disposal/Storage Capacity
3.1.1 Introduction
The equipment, components, and materials generated during normal operations and decommissioning of nuclear
facilities may potentially be released for unrestricted use and be available for recycle. Alternatively, it may be
found to be unacceptable for such release and must instead be disposed of at licensed low level waste (LLW)
disposal sites.
The purpose of this chapter is to present information on the current availability and cost of commercial LLW
disposal to support future cost/benefit analysis of various disposal alternatives. With the exception of describing
the material acceptance criteria for individual facilities, this chapter does not attempt to characterize the content of
LLW or develop insights about scrap recycle flow. These issues are addressed in Chapters 4, 5 and 6.
In the future, LLW disposal cost and availability will drive reuse and recycle practices. Today, the reuse and
recycle of contaminated materials from nuclear facilities does not influence LLW cost/availability to any great
extent, as potentially recyclable material only represents about 10 percent of annual LLW burial volume. If large
numbers of nuclear facilities were to undergo D&D, however, this would have a significant impact on LLW disposal
volume, as well as availability and cost of'disposal.
Historically, expansion of LLW disposal capacity and the associated costs have been very volatile due to a number
of political and economic influences. As a result, the capacity forecasts and cost estimates presented in this section
should be understood in this context. To the greatest extent possible, the main influences which impact the cost and
capacity estimates will be identified and discussed; however, no attempt is made here to project what future costs
will be.
3.1.2 Background
The Low-Level Radioactive Waste Policy Act of 1980, as amended by the Low-Level Radioactive Waste Policy
Amendments Act of 1985 (LLRWPAA), made States responsible for the disposal of commercial low-level
radioactive waste generated within States' borders. The LLRWPAA provides the framework for States to establish
3-1

the LLW management and disposal capacity needed for their LLW, and encourages States to form compacts for
management of LLW by maintaining that the disposal of LLW can be most effectively carried out on a regional
basis. The LLRWPAA ensured that the LLW disposal facilities operating when the Act was passed remained open
through the end of 1992.
The LLRWPAA also set up a system of milestones, incentives, and penalties to promote steady progress of States
towards development of LLW disposal capacity. The critical milestone of January 1, 1993 has already been
reached, when the LLW disposal facilities operating when the LLRWPAA was passed in 1985 are no longer
obligated to accept LLW from outside their State or Compact. Therefore, beginning in 1993, some States will not
have a disposal site for the LLW generated within their borders, and storage at the point of generation will begin
to be a more widely used management practice for LLW.
Since 1985, States have been engaged in activities to form regional compacts and to establish new LLW disposal
capacity. Currently, there are nine Compact regions totalling 42 States that have operating LLW disposal facilities
or plans to establish new LLW disposal facilities. There are also five States that are unaffiliated with a compact
that have plans to establish new LLW disposal facilities on their own. There are five States/Jurisdictions that are
not currently affiliated with a compact that do not have plans to construct a new LLW disposal facilities. Figure
3-1 shows the current alignment of States and Compacts for LLW disposal. Of the Compacts or States with plans
to establish new facilities, four complete license applications have been prepared and submitted to the appropriate
regulatory authorities.
The following sections summarize the development of LLW disposal capacity and the progress of States under the
LLRWPAA as of January 1, .1993.
3.1.3 Compact Regions with Currently Operating Disposal Sites
Following the passage of the LLRWPAA in 1985, three Compacts were formed, comprised of 19 States, that
included the three operating disposal facilities at Barnwell, SC, Beatty, NV, and Richland, WA. According to the
LLRWPAA, as of January 1, 1993, these three Compacts are no longer obligated to accept LLW for disposal from
outside the Compact.
3-2

j Midwest
Southwestern
Rocky Mountain
Appalaci
' Centra Midwe
Active disposal site
Current host state (Washington has no plans to close its facility, Nevada and South Caroli plan to close their facilities)
Northwest
Designated.compact host state
Approved compact
Unaffiliated state not planning to host a disposal site
Unaffiliated state planning to host. a disposal site
Source: Updated from the U.S. Department of Energy, i992 Annual Report on Low-Level Radioactive Waste Management Progress (Washington, D.C.; November 1993)
Figure 3-1. Current Configuration of Compact Regions/Host States and Unaffilated States
H>" .
ME
hlan
Se PcT Northeast
st DC 0
Southeast
PR
w
*.. . . .. . . .

3.1.3.1 Northwest Interstate Compact on Low-Level Radioactive Waste Management
[ Member States: Alaska, Hawaii, Idaho, Montana, Oregon, Utah, and Washington (Host) ]
The LLW disposal facility in Richland, WA, which was operating when the LLRWPAA was passed, will remain
open as the host facility for the Northwest Compact. Also, a contract between the Northwest Compact and the
Rocky Mountain Compact (see next section) will result in the Richland, WA facility hosting disposal of LLW from
the Rocky Mountain Compact States until their new disposal facility is operating.
In addition, the Northwest Compact has granted authority to the Envirocare Facility in Utah to dispose of non
reactor mixed LLW and large volume, non-reactor bulk LLW from a single site of the following types; slightly
contaminated soils, process sludges, demolition rubble, and decontamination and decommissioning wastes.
3.1.3.2 Rocky Mountain Low-Level Radioactive Waste Compact
[Member States: Colorado (Host), Nevada (Host until Jan. 1, '93), New Mexico, Wyoming]
The LLW disposal facility in Beatty, NV, which was operating when the LLRWPAA was passed, remained open
and was the host facility for the Rocky Mountain Compact until January 1, 1993. The Beatty LLW disposal facility
is no longer accepting LLW for disposal, and is in the process of being closed. Colorado is the host State for a
new LLW disposal facility in the Rocky Mountain Compact.
In the meantime, LLW generated in the Rocky Mountain Compact will be disposed at the Richland,- WA LLW
disposal facility under a contract signed between the Rocky Mouintain and Northwest Compacts. The contract,
finalized late in 1992, allows up to 6000 ft3 of Rocky Mountain Compact LLW to be disposed annually at the
Rich]and disposal site, plus a three percent annual increase. Also, there is a special provision for disposal of a total
of 140,000 ft3 of LLW associated with the decommissioning of the Fort St. Vrain nuclear power plant.
Colorado has only recently initiated activities to develop a new LLW disposal facility for the Rocky Mountain
Compact. Therefore, there is no a schedule of milestones that shows when the facility is planned to be opened for
operations.
3-4

3.1.3.3 Southeast Interstate Low-Level Radioactive Waste Management Compact
[ Member States: Alabama, Florida, Georgia, Mississippi, North Carolina (Future Host), South Carolina (Host),
Tennessee, Virginia]
The LLW disposal facility in Barnwell, SC, which was operating when the LLRWPAA was passed, remains open
and is the host facility for the Southeast Compact until January 1, 1996. Legislation signed into law in 1992 allows
the facility to accept LLW generated out of the Compact until July 1, 1994, provided that the Host State for the
Compact where the waste is coming from or the unaffiliated State that the waste is generated in is making progress
in development of a new LLW disposal facility. After July 1, 1994, the Barnwell facility will be closed to LLW
generated outside of the Southeast Compact.
Southeast Compact LLW will be accepted at Barnwell through January 1, 1996 provided that conditions concerned
with continued progress in North Carolina on development of a new LLW disposal facility for the Southeast
Compact are met. Progress on siting and development of a new disposal facility continues in North Carolina. The
current schedule indicates that site selection will be completed in October 1993, with facility operations beginning
in early 1996, shortly after the Barnwell facility closes.
3.1.4 Compact Regions Without Operating Disposal Sites
Six Compacts without operating LLW disposal facilities, comprised of 23 States, are in various stages of developing
new facilities to dispose of LLW generated by their member States.
3.1.4.1 Appalachian States Low-Level Radioactive Waste Compact
[Member States: Delaware, Maryland, Pennsylvania (Host), and West Virginia]
Pennsylvania, the host State for the Appalachian States Compact, is making progress towards development of a new
LLW disposal facility. Chem-Nuclear Systems, Inc, the developer of the facility in PA, submitted recommendations
for three suitable sites to the Pennsylvania Environmental Quality Board in August 1992 for the Board to determine
the next steps in development of the facility. In the meantime, the State of Pennsylvania is in the midst of
interactions with the NRC for obtaining limited Agreement State status for the State to obtain regulatory authority
over the LLW disposal facility.
The current schedule calls for Chem-Nuclear to submit, a complete license application to the Pennsylvania
Department of Environmental Resources by early 1994, and for the facility to be operational by mid-1996.
3-5

3.1.4.2 Central Interstate Low-Level Radioactive Waste Compact
[ Member States: Arkansas, Kansas, Louisiana, Nebraska (Host), and Oklahoma ]
A license application was filed with the Nebraska Department of Environmental Control (DEC) by USEcology in
July 1990 to construct and operate a new LLW disposal facility just outside Butte, NE. The license was denied by
DEC following the review of the application and additional information submitted by USEcology in response to DEC
questions raised by the presence of wetlands near the proposed site. The schedule for the original facility called
for the facility to be operational by November 1995, but this latest development has changed the schedule. No new
projections are available.
3.1.4.3 Central Midwest Interstate Low-Levd Radioactive Waste Compact
[Member States: Kentucky, Illinois (Host)]
In October 1992, the Illinois Siting Commission found the proposed site for a new disposal facility in Martinsville,
IL unsuitable. The site had been characterized and included in a complete license application submitted for review
in May 1991 by Chem-Nuclear Inc. to the Illinois Department of Nuclear Safety (IDNS).
The original schedule for development of the Illinois disposal facility established operations for mid-1994. This
schedule has been impacted by the Siting Commission decision and at this time, no new schedule has been
established.
The IDNS conducted a survey to determine whether generators would have adequate onsite storage up until the time
the disposal facility is operational. The survey indicated adequate onsite storage would be available for
approximately two years, so the State has decided not to develop a central interim storage facility.
3.1.4.4 Midwest Interstate Low-Level Radioactive Waste Management Compact
[Member States: Indiana, Iowa, Minnesota, Missouri, Ohio (Host), Wisconsin]
From 1987 until July 1991, Michigan was a member of the Midwest Compact and was the designated Host State
for a new LLW disposal facility. On July 24, 1991, the Midwest Compact Commission revoked the State of
Michigan's membership in the compact. This action ended Michigan's role as the Host State for the compact, and
Ohio automatically became the Host State.
3-6

It is estimated that the change in host State will delay the development of a new LLW disposal facility for the
Midwest Compact by at least five years. Based on the most recent schedule for development of a new facility in
Michigan when it was still the HostState for the Midwest Compact, this delay means that a new facility would be
operational in Ohio by 2002 at the earliest. Ohio is in the process of developing enabling legislation and a siting
plan to start development of a new facility.
3.1.4.5 Northeast Interstate Low-Level Radioactive Waste Management Compact
[Member States: Connecticut (Host), New Jersey (Host)]
Steady progress was being made in Connecticut toward developing a new LLW disposal facility until Summer 1991.
Errors were discovered in Connecticut's site screening process used to recommend sites for further characterization.
Several steps were taken to correct the errors and this resulted in a delay estimated at about one year. However,
in May 1992, new legislation was signed into law in Connecticut requiring that the entire process for development
of a new disposal facility in Connecticut be started over. The previous schedule estimated that site operations
would begin in late 1996, but this will no doubt be delayed. No new estimated start of operations date has been
set yet.
New Jersey continues with its efforts to progress with site development activities and develop a new LLW disposal
facility. Their efforts, however, are lagging behind some other State's progress. Enabling legislation was passed
only in June 1991 and the time since then has been devoted to promulgation of regulations and other administrative
functions. It is estimated that a new facility will be operational in 1997.
In the meantime, the New Jersey Department of Environmental Protection and Energy formed a task force to
address issues and concerns of LLW generators regarding storage of LLW. The task force will look at issues and
obstacles generators are facing in preparing for and implementing interim storage of LLW and assisting them in
developing solutions to those issues and obstacles.
3.1.4.6 Southwestern Low-Level Radioactive Waste Disposal Compact
[Member States: Arizona, California (Host), North Dakota, South Dakota]
California has progressed steadily towards opening a new LLW disposal facility. USEcology completed site
characterization and submitted a license application to the California Department of Health Services (DHS) in
December 1989. The DHS completed its review of the license application in 1991.
3-7

Currently, the opening of the disposal facility in California is delayed by legal action. The opening of the facility
can occur shortly after these issues are resolved, which is estimated to be in the early part of 1993.
3.1.5 Unaffiliated States Planning to Construct Disposal Facilities
There are five States without operating LLW disposal facilities that are in various stages of developing new facilities
to dispose of LLW generated in the State. In most cases, these States have chosen not to participate in a compact
effort.
3.1.5.1 Maine
Progress on development of a LLW disposal facility continues to be made in Maine. The Maine Low-Level
Radioactive Waste Authority's site selection process was working towards reducing the number of candidate sites
for further evaluation from five to two at the end of 1992.
Also, Maine has begun to explore other options for disposal of LLW, as Maine is actively pursuing a possible
compact arrangement with Texas. Negotiations with Texas are not being conducted by the Authority, therefore,
progress on development of a new facility continues on schedule. The current projection estimates that a facility
could be operational in Maine by December 1996.
3.1.5.2 Massachusetts
Site selection continues to be on hold in Massachusetts until all LLW management regulations are promulgated.
This regulatory effort includes obtaining Agreement State status from the US NRC, which has only recently begun.
The current schedule estimates a new facility will be operational in Massachusetts by December 1996.
In the meantime, Massachusetis is developing a-program to manage the storage of LLW, perhaps at a central storage
location, until a disposal facility is operational, but this effort is also on hold since the Barnwell, SC facility will
remain open for acceptance of LLW from Massachusetts until July 1, 1994.
3.1.5.3 New York
Under current NY State law, site selection cannot begin until a preferred disposal method or methods is approved
by the LLW facility regulator, the Department of Environmental Conservation. The process of determining the
preferred method has just started, and it is estimated that it will take at least two years to complete. Thus, at this
time, there is no scheduled date for a new facility to be operating in NY for LLW disposal.
3-8

Another effort affecting the disposal facility development process in NY is the recent enactment of legislation in
favor of considering the West Valley Nuclear Service Center (WVNSC) site for the location of the NY LLW
disposal facility. The legislation resulted from the vote of the Ashford, NY Town Board to reverse the State ban
on siting a LLW disposal facility at the WVNSC.
3.1.5.4 Texas
In January 1991, a lawsuit brought by the Counties of El Paso and Hudspeth against the Texas Low-Level
Radioactive Waste Authority resulted in the abandonment of siting activities at the preferred site for a new LLW
disposal facility at Fort Hancock, TX.
However, following resolution of the appeal process concerning this lawsuit, the Texas legislature gave the
Authority eminent domain and limited the location for the LLW disposal site to a specific 400 square mile area
outside the Fort Hancock Site. The Authority identified two potential suitable sites on a 16,000 acre parcel of land
owned by a private corporation willing to sell the land. Since the new siting region is within 30 miles of the
abandoned Fort Hancock site, a significant amount of the characterization work already conducted was applicable
to the new siting regions.
Before the Fort Hancock Site was abandoned, a substantial part of the license application had been completed. The
Authority revised the license application to include all available information on the new Faskin Ranch site, and
submitted the completed sections to the Texas Water Commission for review.
The current schedule in Texas estimates that the complete license review will be completed by April 1994 and
operations could begin by January 1996.
The Texas legislature also gave the State permission to enter into a compact with one or more States as long as
compact members are limited to a cumulative amount of waste not to exceed 20% of the projected Texas waste
generation over a 50-year time period. The Texas governor's office has been contacted by Maine, Vermont,
Massachusetts, Connecticut, New Jersey, New Hampshire, Washington DC, Nebraska, and Michigan regarding a
compact with Texas, but no formal agreements have been reached.
3.1.5.5 Vermont
Progress on development of a new LLW disposal facility in Vermont has been slow. Vermont law requires that
a site at the Vermont Yankee nuclear power station be characterized for possible use by the new disposal site.
3-9

However, in September 1991, the Vermont Low-Level Radioactive Waste Authority terminated further
characterization work at Vermont Yankee for a number of technical reasons.
In 1992, a program was adopted to provide funding to towns to study the economic and social impacts of hosting
the LLW disposal facility. A study was also commissioned to evaluate possible facility designs given the geology
and climate of Vermont. The best estimate at this time shows a new facility for disposal of LLW in Vermont
opening no earlier than late 1999.
The outlook for a possible compact arrangement with Texas looks better, however. Serious discussions between
Texas, Vermont, and Maine have resulted in the drafting of compact language which should be introduced into the
Texas legislature this year. If the Texas legislature passes the compact law quickly enough, enabling legislation
could be introduced in the current legislative sessions of Maine and Vermont.
3.1.6 Unaffiliated States/Jurisdictions Not Planning to Construct Disposal Facilities
There are five States/Jurisdictions without operating LLW disposal facilities that are not planning to develop new
facilities to dispose of LLW generated inside their borders.
3.1.6.1 District of Columbia
The District of Columbia (DC) had a contract with the Rocky Mountain Compact for disposal of their waste through
1992. As of January 1, 1993, when the contract expired, DC LLW could not be accepted at either of the two
operating disposal facilities. There is no progress to date on negotiating a new contract or a compacting
arrangement for disposal of DC LLW, although the District his had discussions with Texas about the possibility
of forming a compact.
3.1.6.2 Michigan
Michigan was the designated Host State for development of a new LLW disposal facility for the Midwest Compact
until being expelled from the Compact by the Midwest Compact Commission in July 1991. A primary reason for
the expulsion was that restrictive siting criteria established in Michigan made it impossible to find a suitable site for
facility characterization. Also, Michigan has long contended that the LLRWPAA is flawed and the mandates of
the law are unconstitutional.
Since settling a lawsuit related to their expulsion from the Compact, the Michigan Low-Level Radioactive Waste
Authority has been assisting Michigan generators in establishing adequate storage for their LLW. The Authority
3-10
is also evaluating whether a central storage facility is required to consolidate storage of LLW. No activities are
being conducted in Michigan towards development of a new LLW disposal facility.
3.1.6.3 New Hampshire
New Hampshire also had a contract with the Rocky Mountain Compact for disposal of their waste through 1992.
This contract has also expired, and a new one is not in place. New Hampshire has had negotiations with Texas
regarding the possibility of establishing a compact, but no formal arrangements have been made. There are no
activities being conducted in New Hampshire towards development of a LLW disposal facility.
3.1.6.4 Puerto Rico
Puerto Rico is considered a State under the LLRWPAA, and is required to meet the milestones of the Act. Puerto
Rico generates a very small amount of LLW, primarily medical and research waste. Puerto Rico has been out-of
compliance with the requirements of the LLRWPAA since 1986 and has been denied access to any operating LLW
disposal facility since 1987. No discussions to arrange for disposal of Puerto Rico LLW are underway or
anticipated.
3.1.6.5 Rhode Island
Rhode Island's situation is similar to DC and New Hampshire in that the contract under which LLW generated in
Rhode Island was disposed expired on January 1, 1993, and no other arrangements are in place at this time. Unlike
DC and New Hampshire, however, Rhode Island has not approached Texas about forming a compact.
3.1.7 Summary
The LLRWPAA contains a target date of January 1, 1996 for States to manage the LLW generated within their
borders, and to have an operating LLW disposal facility (although the recent US Supreme Court decision striking
down the provision giving title to the States over the LLW takes some of the effectiveness out of this milestone).
As can be determined by the previous discussions, the States have made varied progress towards achieving this goal;
however, only the Hanford, WA LLW site is assured of being operational on this date. Figure 3-2 shows the
projected operational dates (where available) of new LLW disposal facilities being developed under the LLRWPAA.
3-11
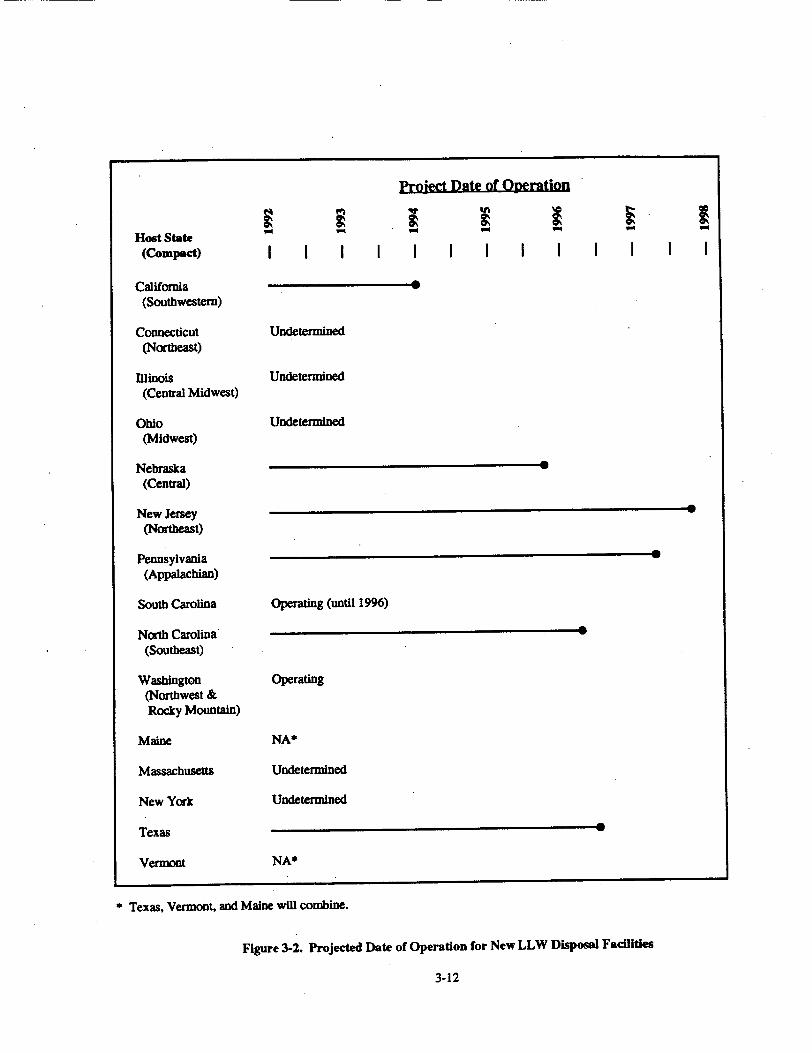
Project Date of Operation
11111 11 1 II
California (Southwestern)
Connecticut (Northeast)
Illinois (Central Midwest)
Ohio (Midwest)
Undetermined
Undetermined
Undetermined
Nebraska (Central)
New Jersey (Northeast)
Pennsylvania
(Appalachian)
South Carolina
North Carolina (Southeast)
Washington (Northwest & Rocky Mountain)
Maine
Massachusetts
New York
Operating (until 1996)
Operating
NA*
Undetermined
Undetermined
Texas
Vermont NA*
* Texas, Vermont, and Maine will combine.
Figure 3-2. Projected Date of Operation for New LLW Disposal Facilities
3-12
Host State (Compact)
-111--w

3.2 Current and Projected Costs of Commercial Low-Level Waste Disposal
3.2.1 Introduction/Background
As States began to develop new LLW disposal facilities following the passage of The Low-Level Radioactive Waste
Policy Act of 1980, it became clear that many aspects of LLW disposal would be different from the practices of
the past. One of the biggest differences in LLW disposal will be the costs of disposal, although it is difficult to
measure these costs accurately at this point because not enough States or Compacts have progressed far enough with
development of the new facilities.
However, many studies have been conducted by the Compacts and States developing new facilities to estimate the
costs of developing the facility, and ultimately the cost for disposal of LLW that would be received at the facility.
These studies have been conducted over the last 10 or so years, some prior to the passage of the LLRWPAA, and,
therefore, they estimate costs of disposal of LLW based on various frames of reference concerning the present
situation with commercial LLW disposal. For example, some of the older studies used estimates of volumes of
LLW to be accepted for disposal that were higher than what was actually accepted. As such, some of the estimates
could be considered "better" than others in reflecting the costs of disposal of LLW. Nevertheless, these studies all
present a basis for discussing the future costs of disposal of commercial LLW given the progress of establishment
of new facilities discussed in Section 3.1.
One State, California, has progressed far enough that a rate structure was established for operation of the facility,
and an estimate of the costs for disposal of LLW if the facility were to begin operations within the next couple of
months is available.
3.2.2 Costs for LLW Disposal
The cost for disposal of LLW accepted at a disposal facility is based on the life-cycle costs of developing, operating,
and closing the facility, which is divided equitably and charged to generators sending LLW to the facility for
disposal. The basic unit of measurement of cost for disposal of waste at operating LLW disposal facilities in the
US is $/f-t3 The cost for disposal of a specific package of LLW will be estimated in 1993 dollars. The basic rate
will be reported in $/ft3 multiplied by the volume of the waste package, plus surcharges associated with the weight
and surface dose rate of the package and whether additional equipment is required to handle the package, plus taxes,
and fees. Disposal costs will also be converted to a cost per m3 and indicated in parentheses.
3-13

The life-cycle costs of a LLW disposal facility include many items that cost money for any construction project of
this type, for example, the cost of'land acquisition. However, they also include a few costs that are unique to
disposal of LLW. The costs include site selection and characterization, licensing, construction, financing, operation,
closure, and the return on the investment to the developer and operator and the interest on borrowed capital.
Total life-cycle costs for a LLW disposal facility can be divided into two categories: primary costs and fimancing
costs. Facility costs would vary for private and public developer-operators due to a different tax status, as well as
the fact that a publicly financed facility would not include a return. on investment. In some of the following
discussions, the costs for specific elements would be different for a public versus private LLW disposal facility.
Since there are only a few licensed facilities currently operating and each individual cost element is subject to
uncertainty, these discussions will not differentiate cost at that level of detail.
Primary costs can be divided further into development costs, operating costs, and postoperating costs.. Primary costs
are the total cash expenditures expected over the life-cycle of the facility.
Development costs include capital costs and indirect costs for siting, licensing, and construction of the facility.
Capital costs include land acquisition, engineering design, buildings, construction management, roads and site
preparation, security, environmental monitoring, equipment, legal fees, and facility permitting and licensing.
Indirect costs include administrative and general supply expenses incurred during development.
Operating costs are associated with the everyday operation of the facility during the time that it accepts and disposes
of waste. These costs include labor, materials, equipment maintenance and replacement, license renewal fees,
supplies, environmental monitoring expenses, regulatory expenses, overhead, insurance, financial assurance costs,
and annual contributions to a post-operation care fund. This would also include interest on any borrowed funds for
a private developer.
Postoperating costs are costs associated with the closure of the site and its maintenance during any institutional
control period. These costs are incurred after the facility is no longer accepting and disposing of LLW. Closure
costs include building removal and surface work, including backfilling and stabilization and final land contouring.
Institutional control period expenses include environmental monitoring and facility surveillance. As mentioned
above, a post-operation care fund is established to cover closure and institutional care costs and is collected during
the operations period as. part of the fee for disposal of waste. Contributions to this fund are made annually and
would be invested by the facility. Also, a financial assurance mechanism is required to be in place from the first
day of operations of the facility to cover postoperational costs in the event the facility closes earlier than scheduled
and not enough money has been collected from LLW generators. The cost of the financial assurance mechanism
3-14

is calculated as 2% of the difference between the total required post-operation costs and the amount contained in
the post-operations sinking fund. The fee for the financial assurance mechanism is assessed annually.
Financing costs for a private sector LLW disposal facility is equal to the sum of the after-tax cash flows less the
total investment made by the developer. For a public sector facility, it is assumed that 100% debt financing was
required to build the facility and the financing cost is the interest paid on this debt.
3.2.3 Factors Affecting Costs of Disposal in Future LLW Disposal Facilities
A number of factors influence the elements of cost for disposal of LLW discussed in the previous section. These
factors include the size of the site, the amount of waste received, the engineering requirements of the facility, the
duration of postoperational care, etc. These factors have influenced the current costs for disposal of LLW,
however, it appears that many of the elements contributing to the life-cycle costs for disposal of LLW will be much
more-expensive for the new LLW disposal facilities being developed under the LLRWPAA. The following factors
seem to be the major contributors to estimates that disposal of LLW in the future will be much more expensive than
the present.
3.2.3.1 Higher Development Costs
As progress is made by the States and Compacts to establish new LLW disposal facilities, an ever increasing amount
of money is being spent on their development. There are several reasons behind these high development costs,
including added site selection and characterization steps, increased regulatory requirements, and public and
community awareness and involvement.
Siting of the new LLW disposal facilities has become more complicated in most States and has utilized more
resources and money. In some cases, notably Texas, Nebraska, and Illinois to date, the original sites chosen to host
the facility are not going to be developed further after the expenditure of considerable funds and will no longer host
the new disposal facilities. In Texas an alternative site has been chosen after a second site selection and
characterization. process.
Expensive and thorough characterization of the sites and surrounding communities is being conducted to ensure that
environmental effects are held to a minimum and to ensure that baselines for environmental monitoring of the
facilities are established correctly. For example, at the new LLW disposal site in California, the protection of the
desert tortoise, whose natural habitat could be affected by the facility, has resulted in the expenditure of a greai deal
of money to study the tortoise's habitat and to develop plans to mitigate the possible effects to the habitat. More
money will be spent as the facility moves into operations in order to implement the mitigation plan.
3-15

Regulatory and permitting requirements are also causing the expenditure of greater amounts of money. Additional
regulatory requirements, beyond Federal and State requirements already in place, have been placed on the facilities
by the enabling legislation passed by States to establish the facility under the LLRWPAA. For example, in both
Pennsylvania and Massachusetts, the enabling legislation authorizing the development of the new LLW disposal
facility required the Host State to obtain Agreement State status with the US Nuclear Regulatory Commission so
that the State could regulate the disposal of LLW. This regulatory process is time-consuming and expensive.
Community and public involvement has resulted in additional expense to develop new LLW disposal facilities.
Developers/operators have designed and implemented expensive community awareness and outreach programs in
an attempt to gain public acceptance of the new facilities before opposition could mobilize against them. Lawsuits
have been brought against every new facility as it approached operations, causing added expense.
These factors, and more, have resulted in much larger costs for development than most experts would have
predicted. To provide some measure of the spiraling costs of disposal facility development, a 1988 estimate of the
cost to develop the new facility in California was $6 million (Gershey, 1990). As of February 1993, the
developer/operator had spent $37 million on facility development (Gershey, 1993).
3.2.3.2 Expensive Disposal Technologies
In order to gain public acceptance of new facilities for LLW disposal, States and Compacts found thatthey needed
to consider and decide on the use of highly engineered alternative disposal technologies which were more complex
than the technology of shallow land burial employed by past and currently operating LLW disposal facilities. Table
3-I shows the current Host States developing new LLW disposal facilities and the disposal technology planned to
be used or technologies being evaluated for possible use for the new facility in the State. Only California is
planning to use shallow land burial. Even there, however, the technology will be enhanced near-stirface disposal
similar to what is conducted at Barnwell and Hanford, but with changes to the operations to provide greater
protection for higher class and higher activity LLW.
The use of more. sophisticated engineering technology at these facilities means that many of the life-cycle cost
elements will be much higher for new facilities compared to traditional facilities. Costs for facility design will be
higher because of more complex systems for items such as environmental monitoring and other facility functions.
Construction costs, especially materials, supplies, and equipment, will be much higher. And licensing and
permitting costs will be much higher than those for traditional shallow land disposal because regulators will require
more time to review and approve the more complex facility. Table 3-2 provides life-cycle cost estimates for each
of the engineered disposal technologies being considered for the new LLW disposal facilities (Stanton, 1986).
3-16

Table 3-1. Host States and Planned Technologies for LLW Disposal
Host State (Compact)
California (Southwestern)
Connecticut (Northeast)
Illinois (Central Midwest)
Ohio (Midwest)
Nebraska (Central)
New Jersey (Northeast)
Pennsylvania (Appalachian)
South Carolina
North Carolina (Southeast)
Washington (Northwest & Rocky Mountain)
Maine
Massachusetts
New York
Texas
Vermont
Planned Facility
Operations
1994
Undetermined
Undetermined
Undetermined
Late 1995
Late 1997
Early 1997
Operating (until '96)
Early 1996
Operating
NA*
Undetermined
Undetermined
Mid 1996
NA*
Planned Disposal Technology(ies)
Enhanced Shallow Land Burial
Undetermined
Above-Grade Earth-Mounded Va Canisters
Activities not yet initiated
Above-Grade Earth-Mounded V• Canisters
Undetermined
Above-Grade Earth-Mounded Vs Canisters
Traditional Shallow Land Burial
bult with Concrete
tult with Concrete
Lult with Concrete
Above-Grade Earth-Mounded Vault with Concrete Canisters
Traditional Shallow Land Burial
Above-Ground, Roofed Building within another Building
Undetermined
Undetermined
Below-Ground Vault and Concrete Canisters
Below-Ground Vault, Earth-Mounded Vault, or EarthMounded Vault with Concrete Canisters
* As discussed, the Texas-Vermont-Main Compact will shortly become official, which will remove the
responsibilities of Maine and Vermont to operate LLW disposal facilities.
3-17

Table 3-2. Sensitivity of Costs to Disposal Technology
life-Cycle Costs Disposal Technology ($ million)
Shallow Land Disposal 196
Below Ground Vault 294
Modular Concrete Canisters 300
Above Ground Vault 395
Earth Mounded Concrete Bunker 434
(Facility to receive 235,000 ft3 of LLW annually for 30 years)
Table 3-3. Unit Costs of Disposal
Receiving Rate (ft3/year) (m3/yr.)
6,000 170
67,000 1,900
131,000 3,700
as a Function of Annual Receiving Rate
Annual Cost Unit Cost ($ million) ($/ft3) ($/m3)
10.8 1,800 64,000
10.8 160 5,700
12.0 92 3,300
(Below Ground Vault Technology - Private Developer)
3-18

3.2.3.3 Reduced and Varying Waste Volumes
One of the most significant factors affecting the disposal of costs of LLW is the volume expected to be received
at the facility. This is because volume is used as the basis for equitably dividing up the life-cycle costs for the
facility among those who use its services. There are many fixed costs for developing, operating, and closing a LLW
disposal facility, and these costs have little variation, regardless of the amount of waste disposed. The cost
estimating studies that have been done by States and Compacts have clearly shown the relationship between volume
received and unit cost charged to the generator. For example, Table 3-3 (Stanton, 1986) shows the unit costs of
disposal as a function of annual receiving rate for a below ground vault disposal facility for the Northeast Compact.
Note the small change in annual operating costs even though the amount of waste received changes dramatically.
3.2.3.4 Surcharges, Fees, and Taxes
As a result of increasing public awareness and opposition to the development of new LLW disposal facilities under
the LLRWPAA, Compact Commissions and State LLW Development Authorities have proposed incentives and
disincentives to win over Local, State, and County governments, citizen groups, environmentalists, and other groups
opposed to development of the new facilities. In most cases, incentives will take the form of large contributions
from the operator of the facility into the local tax base, to support such items as improvements to roads, schools,
the infrastructure, etc. Disincentives may take the form of large fines and penalties associated with problems and
abnormal occurrences at the facility. The funds required to make the payments under either of these systems will
come directly from the generators using the facility in the form of surcharges, fees, and taxes.
The historical sites using'shallow land burial did not have incentive or disincentive programs to consider when they
were being established. However, most of them have had incentives and disincentives added to their fees in the
form of taxes and local surcharges added over the years of operation. For instance, at the Barnwell, SC disposal
facility, a South Carolina LLW disposal tax of $6/ft3 (200/M3) is added to the costs of each package of LLW
disposed. This tax provides funds for the South Carolina public education system. Also, a $220 surcharge is
currently being added to every cubic foot ($8,000/m3) of LLW being accepted at Barnwell from outside the
Southeast Compact as an incentive to force further development of new LLW disposal capacity.
The magnitude of some of the incentives and disincentives could dramatically affect the cost of LLW. For example,
in Illinois, the current law states that the developer/operator of a LLW disposal facility will pay an annual
Community Benefit Fee starting at $2.25 million to be adjusted annually for inflation. Using the amount of LLW
generated in the Central Midwest Compact in 1991 (104,000 ft3 or 3,000 m3) (DOE, 1992) as an approximation,
this Fee will add $20/f-0 ($700/M3) to the cost of LLW disposal in a facility in Illinois when it begins operation.
3-19

3.2.3.5 Increased Liability
In recent years, a number of problems have been discovered with near-surface waste disposal facilities. These
problems have occurred at municipal refuse landfills and hazardous waste facilities as well as at LLW disposal
facilities. Discoveries of previously unknown disposal sites where "midnight" dumping (unauthorized) occurred,
and leaking waste disposal sites are but two of the types of problems discovered with disposal facilities. These and
other discoveries have led to enactment of federal remedial action legislation such as the Comprehensive
Environmental Response, Compensation, and Liability Act (CERCLA or "Superfund") and similar State laws to
pay for cleanup of problem waste disposal facilities and to try to prevent reoccurrences of the problems.
Litigation involving the parties potentially responsible for any environmental damage that could be alleged to occur
from the problem waste sites has resulted. The combination of cleanup of old disposal sites- and the damages
awarded in legal cases results in extremely high costs for parties found responsible for the problem waste sites.
Operators of future LLW disposal facilities will need financial mechanisms, including liability insurance, to protect
themselves against unforeseen occurrences that could result in problems at the disposal facility. Liability insurance
coverage and other financial mechanisms established for this contingency will be very expensive and will add to the
total costs of operating a newly developed LLW disposal facility.
3.2.3.6 Disposal of Commercial Mixed LLW
A factor that could affect the costs of disposal of LLW is the possibility that commercial mixed LLW will need to
be disposed of in the LLW facility being developed under the LLRWPAA. Although it could be possible to develop
another separate facility for mixed LLW disposal, it may not be feasible at this point considering the small volume
of mixed LLW and the difficulty establishing a new facility for LLW without hazardous constituents in the waste.
A more likely scenario would be for a new LLW disposal facility to propose changes to design and operation to
accommodate the small amount of mixed LLW in storage and newly generated mixed LLW that needs disposal.
This facility would recover the costs for changes and additions to dispose of mixed LLW by establishing a separate
fee for mixed LLW disposal. However, facility modifications and operations changes will naturally affect the costs
for LLW disposal, making it more expensive. There also would be the possibility that an operator would recover
some of the costs for mixed LLW disposal from LLW generators since the operator may not take the chance that
the small amount of mixed LLW to be received can cover the full costs of operations without establishing a charge
rate that they feel would be prohibitively high and would not be supportable by the industry. A measure of the .difference in LLW versus mixed LLW disposal can be found at the Department of Energy Hanford Central Waste
Complex where LLW disposal costs $44/ft3 ($1,600/m3 ) compared to $133/ft3 ($4,750/m3) for mixed LLW storage.
The difference is quite large even without a charge added to the mixed LLW for its eventual disposal.
3-20

3.2.3.7 Facility Lifetime
Another factor that affects the costs of disposal of LLW is the projected lifetime of facility operations. Since the
life-cycle costs are the basis for the disposal charge passed onto the generators, the number of years that money will
be collected from generators is crucial in determining the unit charge for waste disposal. Most State and Compacts
are planning for facilities to have either 20- or 30-year operating lives. The charge would obviously be greater per
waste volume unit if a facility was planned to operate for 20 years versus 30 years.
3.2.4 Future LLW Disposal Costs
As previously mentioned, future LLW disposal costs have not been determined yet because most of the States and
Compacts have not progressed enough to determine the full life-cycle costs for the new disposal facility being
developed, and therefore, the unit charge rate for disposal. Most States and Compacts have commissioned studies
to estimate how much it will cost to dispose of LLW in their new disposal facilities. Many of the factors causing
increases in cost elements have been recognized and taken into account in these studies. This is especially true of
the affects of engineered alternatives and the reductions in volumes to be received for disposal at the new facilities.
These studies have been conducted over the last 10 years or so, and as such, contain assumptions to formulate the
estimates that may not be accurate in today's political and economic environment. Nevertheless, these estimates
provide some measure of what LLW disposal will cost in the future. Table 3-4 shows the estimated future costs
for disposal of LLW contained in selected studies for Compacts and States. The results selected to be included in
this table are from some of the more contemporary studies conducted. Other studies that were performed in the
early 1980s do not reflect recent developments in the establishment of new LLW disposal facilities and those results
are not included in the table. (For comparison purposes, the cost for disposal of LLW in 1988 was approximately
$25/ft3 ($900/m3), not counting taxes, fees, and other surcharges).
The studies conducted for New York and Texas in 1988 reflect an estimated cost for future LLW disposal of four
times the rate being charged by the LLW disposal facilities operating at the time the study was conducted. Using
the same relationship, an estimate of future disposal costs would be approximately $160/ft3 ($5,700/m3) based on
the current charge rate for disposal of LLW of $40/ft3 ($1,400/M3), excluding surcharges, taxes, and fees.)
The clearest indication of the costs for LLW disposal in the future comes from the development of the new LLW
disposal facility in California. Even though ground has not been broken there, and uncertainty still exists regarding
when operations will begin, the design, engineering, licensing, and other preoperational activities have progressed
enough for a rate structure to be established for the facility. It is estimated by USEcology that if operations were
authorized in February 1993 to begin as soon as possible, the unit cost for disposal at the California facility for
3-21

Table 3-4. Selected Cost Estimates for Future LLW Disposal
Estimated Unit Disposal Cost Study Year ($/ft3) ($/m 3) Comments
Northeast 1988 $77 - $1800 $2,750 - $64,000 Below Ground Vault Compact Study design (1800/ft 3 for Class ftf. 9) B/C waste facility)
DOE Study 1985 $23 $800 Shallow Land Burial (SLB)
(fO RPef. ,0) $40 $1,400 Improved SLB
$48 $1,700 Augured Holes $142 $5, 100 Mined Cavities
Rogers Study 1985 $30 - $40 $2,800 - $3,600 SLB, Above and Below
(fUm Ref. 10) Ground Vaults and
Concrete Canister designs evaluated
New York 1988 $80 - $100 $2,800 - $3,600 Below and Above Ground Study Vault and Mined Cavity 01M• ef. 6) designs evaluated
Texas Study 1988 $80 - $100 Below Ground Vault (•fm RWf. 6 design
3-22

disposal of LLW would be $250 - $300/ft3 ($9,000 - $11,000/m 3) (Shaffner, 1993). The estimated charge rate also
rises dramatically with delay, due principally to continued environmental monitoring and payment on borrowed
money. USEcology estimates that with each I month delay, the charge rate is rising as much as $25/ft ($900/m 3)
(Shaffner, 1993).
A recent development reported in Chapter 1 that provides some optimism concerning the costs for disposal of LLW
is the opening of the Envirocare disposal facility in.Utah. This disposal facility only accepts large volume, non
reactor bulk LLW from a single site of the following types; slightly contaminated soils, process sludges, demolition
rubble, and decontamination and decommissioning wastes. However, accepting only these limited high volume
slightly contaminated waste streams allows the Envirocare facility to charge very low rates, on the order of $4/ft3
($140/M3), for disposal of the waste. Recognizing the major differences between this facility's design, operation,
regulation, etc. and the new LLW disposal facilities being developed that will be able to accept all LLW streams,
it is no surprise that it can charge such a low rate for disposal of waste. However, at least it affords relief for waste
generators for some of the waste streams to be generated. This is especially true of decontamination and
decommissioning projects, which can dispose of large quantities of low-activity waste such as building rubble and
soil at a much reduced rate than at new LLW disposal facilities being developed under the LLRWPAA.
3.3 Summary/Conclusions
Progress on development of new LLW disposal facilities under the LI.RWPAA is slow. Only California, the Host
State for the Southwestern Compact, is close to operating a new disposal facility, and it is not certain when the final
roadblocks to its opening can be removed. Two States that had been making significant progress were recently dealt
serious blows, when both the Illinois and Nebraska sites selected to host the new LLW disposal facilities were found
unacceptable. Even though the Barnwell SC LLW Disposal Facility is still open to all LLW, some generators are
storing the LLW they generate in order to avoid paying the out-of-Compact surcharges. In the future, more
generators will need to store LLW they generate, and only a couple of States have organized programs to evaluate
the adequacy of generator's storage and to see if the State needs to establish centrally managed LLW storage.
When the new LLW disposal facilities do open, it is certain that costs for LLW disposal will be much higher than
in the past. The best measure of the future costs for LLW disposal is California, where a rate structure has been
established for disposal of LLW at the new facility. The developer/operator of the California facility, USEcology,
estimates that, if the facility were authorized to open today, the charge for LLW disposal would range from
$250-$300/ft' ($9,000 - $11,000/rn). While no charge rates are available at this time for other new LLW disposal
facilities, it is possible that charge rates will be in the same range as California's.
3-23

The Envirocare disposal facility in Utah will provide some relief on the costs for disposal for some LLW generators,
as the facility has been approved to accept large volume, non-reactor bulk LLW from a single site of the following
types; slightly contaminated soils, process sludges, demolition rubble, and decontamination and decommissioning
wastes. The current charge rate for disposal of large volumes of these waste streams at Envirocare is approximately
$4/ft3 ($140/mr).
3-24

4. DECONTAMINATION TECHNOLOGIES
Various techniques and processes have been developed, demonstrated, and effectively used for the decontamination
of radioactive materials from nuclear facilities. This chapter provides an overview of many of these technologies,
focusing on those technologies which may be used prior to the recycle or reuse of metallic materials. Table 4-1
summarizes the major characteristics of various decontamination technologies. For each technology, the table
provides a general description, the materials or chemicals used for the process, typical decontamination factors
(DFs), wastes produced by the process which ultimately require disposal, an example application of the process,
any quantitative or qualitative cost data that was available, reference documents, and miscellaneous comments.
Decontamination processes can be classified as either surface decontamination processes or volume decontamination
processes. Surface decontamination processes are generally either an. abrasive or high pressure* cleaning process
or a chemical bath process. Volume decontamination processes are necessarily destructive in nature and generally
involve either the melting of metal with thermal or electrical energy or the electrical dissolution of the metal, in
order to release or redistribute radionuclides bound in the metal matrix. The decontamination technologies
summarized in Table 4-1 are grouped by surface decontamination technologies and volume decontamination
technologies. The process identified in the literature as "CONAP" involves both a surface chemical decontamination
and a volumetric decontamination by melting in a foundry.
The materials and chemicals identified on Table 4-1 include abrasives, solvents, detergents, etc. used in blasting
and cleaning processes; various acids and complexing agents used in chemical and electrochemical processes; and
fluxes used in foundry and melting processes. In general, the materials and chemicals required are standard
industrial commodities that are readily obtainable.
The decontamination factor (DF) is defined as the ratio of activity before and after the decontamination process.
Total activity measured can be divided by either the mass or the surface area of the item being surveyed, giving
units such as Bq/g or Bq/cm2. Surface area based DFs are used for surface decontamination processes. Volume
based DFs are used for volumetric decontamination processes. The referenced literature occasionally gave
numerical DFs for specific processes; if so, these are included in the table. Somewhat less frequently, the literature
stated only that either "low" or "high" DFs were typical, with a value of roughly 10 being a dividing line. For
many processes, no data concerning DFs could be readily found. DFs quoted in the references range from less than
unity for one process under development (obviously not beneficial under the conditions represented by the
experimental run which yielded this value) to 10,000 or more for a particular electropolishing process and for a
process that combined chemical surface decontamination and melting in a foundry.
4-1

Table 4-1. Summary of Decontamination Technologies
Deconteminadon General Materials/ Typical Waste Produced Example of Technology Description Chemicals Used DFjs) Requiring Disposal Application Cost Data Reference Comments
SURFACE DECONTAMINATION TECHNOLOGIES
Vacuum cleaning
Brushing, washing, or
scrubbing
Water-based processes:
Liquid Abrasive Blastingo/Docontamlnation ILAB/ LAD)
High pressure water / steam jetting
Ultra high pressure
water decontamination
Flowing abrasive
Freon cleaning
Vacuuming used to remove loose
contaminants such as dust of
particulates from a surface or to
collect dust from other processes.
Manual or power brushing to remove
loose or soluble cdhtaminatlon.
Abrasive action of solid grit. or particles entrained in high volume water stream at 100 psi removes
corrosion products from
contaminated metal. Air Injection
can improve effectiveness.
Water or steam jets are directed at
high pressures (3000-6000 psi) onto
contaminated objects to remove loose or fixed contamination, as in
paint or rust.
Water at pressures up to 35,000 psi blasted onto sur
faces with nozzles about 1 Inch from
the surface removes heavy
oxidation/surface coatings. Fine
abrasives can enhance performance.
Grains of abrasives are suspended in
water and circulated'through a
system. The grains hit or rub the
Inner surfaces of pipes and com
" ponents, removing CRUD
mechanically
Freon solvent directed onto the
surface under high pressure.
Collected contamlnatlon.
Solvents, detergents, or
soluble abrasives may be added to improve performance.
Aluminum oxide particles, glass beads, sand, or metal patticles.
Solvents, detergents, or soluble abrasives may be added to Improve performance.
Garnet, aluminum oxide, or iron fillings, with grit size 40 to 120 mesh.
B4C particles
Freon
Inexpenslve
"High' DFs Uquid waste stream and possible dislodged solid wastes;
filters, precast, and resin.
Labor Intensive, but relatively Inexpensive
Solidified grits ewater can be recycled - If It is, spent resins would presumably
need to be disposed ofi.
1100
Uquid waste stream and dislodged solid wastes.
Liquid waste stream; spent Ion-eochange resins, If contaminated water Is recycled; grits, If used.
Abrasives, sludge, cartridge filter
Filter cartridges and some mixed waste.
Tests conducted at Oak Ridge K-26 Site.
Unit costs ($/ton): Average - 700 Ferrous scraps
-600 Aluminum scraps
-1600
Fereday 1989; Most widely and Koch 1991 frequently used meth
to remove loose contamination.
Fearady 1989; Potential for higher Koch 1991; occupational exposur
NDC 1992 although remote operation is possible i some cases.
Koch 1991; Effective in removing Whitfleld 1991 Alpha contamination.
Once-through procest not adequate for removing Bets con. tamination since It ca be hidden In cracks, folds, edges, etc.
Feraday 1989; A spray process may Koch 1991; used for vertical Whltfield 1991 surfaces, while a spir
process may be used
horizontal surfaces.
Whirtfield 1991
Yosunaka et al.Decontamination of a portion of the
Japan Power
Demonstration
Reactor
IJPDR) primary
coolant system
Faraday 1989; Non-destructive; NDC 1992; effective on tools. Whitfield 1991 electric motors, precir
parts, delicate compo
nonts, etc.

Table 4-1. Summary of Decontamination Technologies (continued)
Deconteaminatlon General MaterIalsl Typical Waste Produced Example of Technology Description Chemicals Used DOF(* Reqtding Diaposal Application Coat Data Reference Comments
Dry grit blasting Hard abrasive materials are directed Sand, carborundum, or Grits, filters, precoat. 100,000 lbs. of NDC 1992; Argonne deconteminawith compreased air at high metal particles; corn
velocities, pressed air.
High frequency mechanical vibrations are induced In a bath of solvent, resulting In cavitation on the surfaces of the objects, which abrades the surface contaminants. Addition of chemical reagents can Intensify the process.
Mechanical process using 2-5 mm Solid HO, cnompressed 2 ice particles fed into compressed air air stream; removes soft crud to reduce radiation exposure during maintenance and Inspection work.
slightly radioactive steal scraps were decontaminated for unrestricted
release at the Argonne Nat'l. Labs In 1991.
Liquid waste stream, depending on solvent bath; dislodged solid wastes.
No secondary solid waste; Used In Japan to "Ieas secondary liquid decontaminate waste than conventional pump casings,
mechanical methods (hy- valves, and
drojet cleaning, manual primary circuit brush cleaning) piping of BWRs.
Whitfield 1991 scrap was aold for $92/ton. Process sa% an additional $160K I waste packaging and
disposal.
Faraday 1989; Effective for small
Koch 1991; reusable equipment,
Whitfield 1991 metal tools, valve par
filter elements, preclsi
equipment.
Oguchl 1989 Literature doe.sn't
specifically cite uses I
pre-recycle decontaml
tion; described as a
means of removing sc
crud prior to visual/dy
penetrant examinatior
of base material.
High concentration chemical decontamination processes
Low concentration chemical decontamination processes
In general, refers to processes with Nitric, HCI, sulfuric, reagent solutions of higher than 1 % citric, oxalic, or HF (2-15%1. Some special processes acids; EDTA; eamappear as separate table entries plexing agents; below. Inhibitors
In general, refers to processes using Oxalic acid, formlate, reagent solutions of 1 % or less. Re- plcolinic acid, citric acid, agents can be added directly to the EDTA coolant of an entire reactor coolant circuit. Some special processes appear as separate table entries
below.
>10 Liquid wastes; solid wastes, Including filters, precaat, arni resin; mixed wastes, If acid is used; and secondary waste.
14-86 Same as above, In general. Decontamination
Chemicals can be of the primary regenerated, coolant system of
the reactor BR3 in Mol. Belgium using the *CORD* process.
Faraday 1989; Koch 1991; NDC 1992; Whitfield 1991
Can be destructive. Some named high-cor
processes are NOPAC
CITROX, TURCO 462
NS-1
Faraday 1989; Have been used for o, Koch 1991; 20 years. NonWhitfield 1991 destructive and more
suitable for decontaminating items whic are intended for fur•N use, such as entire rt tot coolant circuits or single components.
Sdme named low-corm
processes are CORD,
LOMI, CAN-DECON,
CANDEREM, POD, an,
MOPAC 88.
Pre-oxidation/ reducing Complex chemical immersion decontamination methods utilizing a chemical bath. process The process treats the object by two
steps: pre-oxidation and reduction. The liquid waste stream can be
treated using a reverse osmosis IROI
Process
KMnO,, HNO,. oxalic acid, NS-1
620 Condensed waste solution Decontamination 116% of system volume), of a portion of the RO module Japan Power
Demonstration Reactor IJPDR) primary coolant system
Ultrasonic cleaning
Ice-blasting
Yasunaka at al.

Table 4-1. Summary of Decontamination Technologies (continued)
Decontamination General Meterialsl Typical Waste Produced Example of Technology Description Chemicals Used DFOs) Requdding Disposal Application Cost Date Referenca Comments
Redox decontamination
Regenerative Nitric/HF Process
Electro-chemical decontamination fe.k.a., efectropolishing)
CO, grit blasting
Advanced decontamination systems
Sulfuric acid and cerium IIVI used In
a two-step process:
decontamination and liquid waste
treatment.
Material Is soaked in a dilute solution
of nitric end hydrofluoric acids.
Solution is regenereted using a
strong acid cation exchanger,
The process Is the reverse of
electroplating. Anodic dissolution
removes contamination on or In
metal surfaces by the controlled
removal of a thin layer of surface
metal including corrosion films.
Solid CO, particles are propelled by
compressed air onto the surface to be decontaminated. CO, particle
shatters on Impact and flashes into
dry CO, gas. Foreign materials are
captured on H:PA filters.
Some techniques currently in various
stages of R&D are laser
decontamination, microwave
decontamination and accelerator
transmutation of wastes.
HS0,, cerium ilVI sulfate, cerium IMV
Dilute solution of nitric (0.6 to 1.0 wt%) and
hydrofluoric 10.06 wt%) acids
Phosphoric, sulfuric, or oxalic acid as an electrolyte.
900 Condensed waste solution, regenerated sulfuric acid,
ion exchange membranes, cartridge filters, resin
10 *Small volume' of spent ion exchange resin and
recovered acids In concentrated form.
Decon. to background level Is feasible
Solid CO, [dry Ice)
Volumes of secondary waste solutione are low, but they may req iro special chemical trestment before disposal.
Used HEPA filters
Decontamination
of a portion of the Japan Power Demonstration Reactor (JPDR) primary coolant
system.
Decontamination of Irradiated fuel storage baskets
1304 1.&.1 from Pickering Nuc. Gen. Station.
Successfully
applied to metal scrap from the steam, condensate, and feed.
water cycle during decommissioning of Grundremmingen A.
Decontamination of materials from Surry, N. Anna, Fitzpatrick, Oconee, Clinton, Beaver Villey, Pilgrim, Millstone 2, and NNP 1.
Yasunaka et al.
Husain 1988
Expansive process: employed as a last resort or for high value metals. Labor Intensive.
Faraday 1989; May be applied to Koch 1991; surface contaminatic Whitfield 1991 but generally emploý
for volume decontan tion. Personnel expc can be a problem.
NDC 1992; Whit field 1991
Whitfield 1991 These may also be explored aspotential ume decontaminatior technologies.
- VOLUME DECONTAMINATION TECHNOLOGIES
Metallic scrap Is malted In an
Induction or other furnace; slag and filter dusts are separated, and the re
covered metal can be reused for the construction of shielding plates and casks for the transport of radioactive
material. State-of-the-art experience in a specific technique known as
zone refining or polishing has been gained by the nickel processing
Industry.
Electro-kinetic separation of metals and redionuclides. May be performed in the aqueous/liquid phase or in the molten metal phase.
Borosllicate glass flux.
Chemical usage is minimal.
Steel: < 2 Slag 12-6 vol%) and filter dust 10.1 vol%). Other
Copper: 60 secondary waste components era furnace
Brass: 20- lining and used filters. 100
Waste generation Is
minimal.
(Planned) malting of some 1700 t of
metal scrap from the decommissioning of the Nelde
rachbach plant.
Unit costs 11/ton): Ferrous scrap
- 800 Aluminum scraps
- 2400 Copper acrapa
.1600
Suitable for areas where electricity is
inexpensive.
Sappok 1991; Sappok 1999; Schuster 1989; Seidler 1987; Whitfield 1991
Uteratura focuses or
melting for column reduction, reusable products for the nucl sector. Experimental melting of scrap stee
shows that 80-90% radioactivity remains
melt (mainly Co6O).
Aerosols are released
during the melting pr,
coss.
Whitfield 1991
Melt-refining
Electro-refining

Table 4-1. Summary of Decontamination Technologies (continued)
Decontamination General Materials/ Typical Wast. Produaed Example of
Technology Description Chemicals Used OF(ea "requirng Disposal Application Cost Date Reference Comments
Electroslsg refining Contaminated metallic waste In the Flutes consisting of 40 <1 to 10 Slag, filter dust. Experimental More energy- Uds 1987
iESR) form of a rod, cylinder, or tube Si02,-30 CaO-20 AIo- efficient than
becomes an electrode which is 10 CeF, for Iron and 14 resistance furnaces.
inserted into a water-cooled copper LIF-78 HCI-IO B&CI, for furnace mold. Electrical power Is aluminum supplied and joule heat melts the electrode, forming an Ingot.
- NAMED PROCESSES INVOLVING A COMBINATION OF SURFACE AND VOLUME DECONTAMINATION
CONAP Alkaline pre-trbatment, oxidation "Alkaline" (7), po- > 10,000 Radioactive sludge, filter 8 t of stainless Hebrant 1989 Process carried out ir
phase with potassium permanganate tassium permanganate, dust, slag. steel piplng from less than 3 weeks;
In en acidic media, dissolution phase "acidic media," Tihange I volume of chemical I
using a complexing agent, and rins- complexing agent. recycled; yielded tlions used was only :
ing phase, followed by melting of 146 1 of sludge mi; reusable product.
material In foundry, and 163 kg of shielding blocks weig
filter dust and 28 kg; literature was
slag. specific as to chemic used.

When considering DFs, it is important to undeistand that the DF for a process may be very specific to the type and
composition of the contamination being removed. Processes which are not well suited to the type of contamination
to be removed may be simply ineffective, or they may make existing contamination more difficult or even
impossible to remove. For example, when melt-refining scrap steel, it has been demonstrated that most of cobalt,
silver, and other radionuclides remain in the melt and the final ingot. If scrap steel that has surface contamination
containing Co-60 is intended to be recycled, it would be a serious mistake to attempt melt-refining without first
applying an effective surface decontamination technique. Otherwise, the Co-60 which was initially only on the
surface would become evenly distributed through the metal. Similarly, uranium tends to adhere to aluminum during
melting. However, in this case, special fluxes can be used to remove the uranium from the aluminum. In contrast
to cobalt, americium is almost completely transferred to the slag in the melt-refining of steel. Cesium is largely
volatilized or adsorbed by the slag. Tritium present as surface and volume contamination in components of heavy
water cooled/moderated reactors is removed by volatilization. Technetium-99 is difficult to remove by melt-refining
in most metals except aluminum.
Table 4-1 identifies for each process listed, the waste products generated which ultimately need to be disposed of.
These waste products include both primary and secondary wastes. Primary wastes are the solid, liquid, or mixed
wastes resulting directly from the contamination or the process commodity directly applied to remove it. Secondary
wastes are generally the materials or items which become contaminated or which hold contamination as a result of
the process or as a result of secondary processes, such as ion exchange treatment of recyclable process water.
Secondary wastes include things such as filter elements and dust, spent ion exchange resins, slag, and furnace
linings. For more detailed cost/benefit analyses which may be performed in the future, the cost liabilities for
disposing of these wastes would need to be factored in on the debit side of the cost/benefit equation.
Limited data was available on the quantity of wastes produced by various decontamination processes. This was due
mainly to the fact that there have been few large-scale applications of decontamination technologies. Most of the
reference documents were written to publish the results of small or laboratory-scale application of various processes
when they were used for specific decontamination projects. When this was the case, the specific project is
mentioned in Table 4-1 under the column entitled "Example of Application." These projects have been carried out
in the U.S., Canada, Europe, and Japan.
Cost data obtained to date is somewhat sketchy, but is included in Table 4-1 where available. Some quantitative
cost data is included, but for the most part, the data provided is qualitative in nature, e.g., the relative expense of
one process versus another, or the fact that a process is relatively inexpensive, or so expensive as to be prohibitive
except under certain circumstances.
4-6

5. RECYCLE OF METAL IN THE UNITED STATES
AND WORLDWIDE
5.1 Introduction
This chapter examines the recycle and reuse efforts for contaminated and non-contaminated metals in the US and
world-wide.
Section 5.2 summarizes the US commercial recycle industry for iron and steel, copper, and aluminum. A separate
subsection for each metal is divided into four parts.
1. The "Overview of Domestic Production and Use" section provides an overall material flow for each metal, a summary of salient statistics, as well as information pertaining to how the metal is processed, major categories of consumers, and distribution of products.
2. The "Scrap Recycling Industry" section describes the scrap recycling industry for each metal, how much scrap is generated, its type and how it is processed. Information related to recycling rates and product lifecycles is presented where available. Estimates of total old scrap generation and consumption by scrap type, or grade, is also provided.
3. The "Factors Relevant to Cost Benefit Studies" section provides relevant information such as: accident statistics (i.e., worker injury/fatality rates), scrap prices and their relationship to scrap supply and demand, studies which have estimated the cost of metal refining versus recycling, energy requirements for various processes, etc.
4. The "Factors Relevant to Worker Exposure Scenarios" section provides information that may be relevant to dose pathway calculations. This section includes information relevant to how byproduct materials (i.e.,.process slag and fumes) are generated, processed and disposed of, as well as relevant regulatory issues and/or standards for a particular metal.
Section 5.3 examines metal recycle and reuse for nuclear contaminated metals. The primary focus is on US
activities in this area with a brief summary of international activities. Specifically, estimates are provided for the
total volume of contaminated metal scrap in storage and the annual generation rate for contaminated scrap in the
US. Breakdowns of the annual generation of contaminated scrap by metal are also provided, as well as a discussion
of the techniques that are currently employed to process contaminated scrap.
5.2 US Commercial Metal Recycle Industries
This section summarizes the commercial metal recycling industry for iron and steel, copper and aluminum. The
information is intended to provide a "snapshot" overview of the entire recycling industry for each metal, using 1990
5-1

data. Special emphasis is placed on the handling and treatment of old scrap (sometimes referred to as obsolete, or
post-consumer scrap), as any metal material coming from decommissioning and decontamination activities in the
nuclear industry would be considered to be old scrap.
Any material which has sufficient metal content for recycling is referred to as scrap metal. Although the definitions
may vary somewhat by industry, there are three general categories of scrap metal that are used in the various metal
fabrication processes, they are: home, new, and old scrap.
" Home scrap (also called revert or runaround scrap) consists of unusable products that are produced during the processing or fabrication of a metal into a form which is usable for manufacturing. Home scrap that is produced during metal fabrication can include items such as cuttings and trimmings from castings, rejected ingots, and damaged or rejected material. The amount of home scrap generated and its use varies by metal industry.
" New scrap (or prompt industrial scrap) is generated by companies during the manufacture of consumer or industrial finished products. It may consist of machine turnings, flashes from forgings, trimmings from pressing and stamping operations, etc. New scrap is generally of high quality and its chemical and physical properties can be well documented. As such, it is generally more expensive than old scrap.
" Old scrap (also called obsolete, dormant, or post consumer scrap) includes obsolete, worn out or broken products which have been consumed by the general public or in industrial applications. Depending on the type of metal and its composition, old scrap may either be directly melted to form a product of specific chemical composition, or it may be refined into pure metal to remove impurities before processing. As such, old scrap normally requires careful sorting and classification.
Although it may vary somewhat among different metal industries, the primary producers are involved in the
reduction of mined metal ore into its pure metallic form while the secondary producers are mainly involved in
processing scrap. Some "integrated" primary producers have fabrication and manufacturing capabilities at the mine
site and are also consumers of scrap. In addition, some metal reduction processes use a certain amount of scrap
as feed.
Figure 5-1 provides a generalized diagram showing how different types of scrap are generated and recycled. As
shown in the figure, production and consumption of metal create a feedback of scrap to the production cycles.
Home scrap is generally reused directly by the fabricator and since it does not leave the process facility, most
estimates of scrap utilization do not include home scrap. New scrap does not normally require any preparation for
reprocessing and it can be directly reused by the primary and secondary industries. Most new scrap generated in
the production of end products is recycled to the production cycle immediately after it is generated. The amount
of new scrap which is purchased by brokers before being recycled to the production cycle varies according to the
form and end-use of the metal as well as its recycle value. For old scrap, however, virtually all metal which is
recycled is purchased by brokers according to the demand. Thus, the recycle time for old scrap is normally much
longer than for new and home scrap. Also included in the figure are the scrap dealers that often purchase and
5-2

Processing of metal for manufacturing (i.e., mill products, castings, etc.)
Consumers of processed metal (manufacturers of end products)
Figure 5-1: Generalized Diagram of Scrap Generation and Recycle Paths in the Production of Metal
5-3

collect scrap from industrial sources and commercial collectors and sell it back to fabricators and primary and
secondary consumers.
The recycling rate for various metals depends not only on the availability of the scrap, but also on its residual value.
Aluminum and copper have very high residual value. As such, the supply of available scrap for those metals
generally does not meet the demand. For these high value metals, it is generally economically attractive to process
any scrap that may be available and the recycling rate for these metals is often referred to as "supply-driven."
Although prices have tended to fluctuate historically, current scrap prices for aluminum and aluminum alloys
average about $0.75 per pound, while copper and copper alloys average slightly more than $1.00 per pound. For
supply-driven metals, the recycling rates are linked to their availability and the technological ability to recover the
metal from the form of scrap. Iron and steel scrap on the other hand, has traditionally had very little residual value
(on the order of a few cents per pound) with supply far exceeding demand. Because steel scrap is a
"demand-driven" commodity, the ability to recycle a given volume of scrap depends both on the quality of scrap
(i.e., its chemical characteristics) and its location (i.e., the cost associated with delivering the scrap to a dealer for
recycling).
The following subsections provide a more detailed description of the iron and steel, copper and aluminum
commercial recycling industries, respectively.
5.2.1 Iron and Steel Recycling Industries
5.2.1.1 Overview of Domestic Production and Use
Steel is made primarily of iron and carbon with thousands of'varieties possible by varying the content of iron,
carbon and alloying elements. The carbon content can vary from 0.25% to 2% while harder grades have a higher
carbon content. Alloy steels contain certain alloying elements such as chromium, nickel, manganese, silicon,
vanadium and molybdenum, which make them more resistant to wear, corrosion and heat than carbon steels.
Stainless steel is the most popular of the alloy steels. The most common of the stainless steels contain 18%
chromium and 8% nickel.
A number of different furnace operations are employed to reduce iron ore or scrap into the various grades of steel.
Iron ore which is mined is processed in.a blast furnace to produce hot molten iron, or "pig iron." Pig iron and iron
and steel scrap are the sources of iron for steelmaking in basic oxygen and open hearth furnaces; electric furnaces
rely almost exclusively on iron and steel scrap.
5-4

Facilities involved in iron and steel include ferrous foundries, steel mills, and the ferrous scrap industry. Foundries
pour molten cast iron or steel into molds to produce casting with the approximate shapes of final products. Steel
mills cast relatively simple steel shapes that the mills roll or hammer into finished products, such as sheet, bar, or
structural shapes. Steel mills can be divided into two categories. The first category is integrated mills, which
produce pig iron from ore (a small amount of scrap is sometimes added to cool the metal), refine the pig iron into
steel, and process it into a form suitable for manufacture, usually flat products like sheet and strip. The entire
integrated process is normally located at or near a mine site. The second category of steel mills are the
non-integrated mills, which melt scrap in electric arc furnaces and cast the steel in continuous casting machines.
Steel Production Data
The steel industry consists of about 75 companies that produce raw steel from mined ore and scrap at 120 locations,
with a combined production capacity of about 107 million MT. The 1990 production of raw steel was about 89.9
million MT, corresponding to 11.6 % of world production and 84.7 % of the total US combined production capacity.
The integrated plants accounted for approximately 63 % of total steel production in 1990 (Peters, 1992; AISI, 1990).
Figure 5-2 summarizes the iron and steel production material flow for 1990. Note that the data for reported scrap
consumption in Figure 5-2 is for all types of scrap (home, new, and old), since the Bureau of Mines data does not
differentiate between different types of scrap. Table 5-1 provides a summary of salient statistics for iron and steel.
About 87.5 % of all steel production is carbon steel, with alloy steel accounting for about 10.4% and stainless steels
about 2.1 %. Table 5-2 summarizes the production of raw steel by grade of steel and type of furnace. In terms of
type of cast, about 60.6 million MT (67.4%) of steel was produced by continuous casting, with about 29.3 million
MT (32.5%) produced in ingots (AISI, 1990).
Mining
According to the US Bureau of Mines, there was about 49.7 million MT of iron ore produced by 20 companies
operating 22 mines (21 open pit and one underground), 16 concentration plants, and 10 pelletizing plants in 1990
(Peters, 1992; US Bureau of Mines, 1992). About 98 % of iron ore is consumed in blast furnaces to produce crude
liquid iron, or "pig iron," with a small amount consumed by foundries and directly reduced into products. In 1990,
total consumption of pig iron was about 51. 1 million MT.
Integrated Steel Mills
Pig iron was produced by 13 companies operating integrated steel mills, with 46 blast furnaces. Almost all pig iron
produced was delivered in liquid form to basic open hearth or basic oxygen furnaces located at the same site for
5-5

Primary
"Integrated"
Producers
S&rap (b)Scrape°)
Open Heth I
Liquid iron and scrap refined Into raw steel and manufactured into products mainly sheet and ship.
SOxygen Furnaces
To non. integred produce,.
Direct Casting of iron
IF -0 - Furnaces
Pig iron
Pig iron
Direct melting of virtually all grades of scrap consumed by manufacturers - mainly for shape, plate and long products
Scrap consumed by Foundries to produce ductile Iron or steel for casting
Iron produced by Foundries for casting
(a) Based on information in the "Iron and Steel Annual Report. 1990." and the "Iron and Steel Scrap Annual Report. 1990., US Bureau of Minn. April '92 and the "1990 Annual Statistical Report. published by the American Iron and Steel Inst
(b) Include all 3 types of scrap (home, new and old). Bureau of Mines data only reports total acrap consumed by various types of furnaces, it does not differentiate between different types of scrap
Figure 5-2: Iron/Steel Production Material Flow - 1990(a) (Thousand Metric Tons)
-I
Seconday
"Nonintegrated"
Producers
I
Mass

Table 5-1: Salient Statistics for US Iron and Steel Production - 1990*
(Volumes reported in thousands of MT)
1990
United States
* Mine production of Pig Iron 49,772
* Steel production:
- Carbon 78,718
- Stainless 1,852
- All other alloy 4,845
Total: 89,914
- Basic Oxygen Furnaces, % 59.1
- Electric Arc Furnaces, % 37.4
- Open Hearth Furnaces, % 3.5
* Continuously Cast Steel, % 67.4
* Capacity Utilization, % 84.7
* Imports of Major Steel Products 15,602
* Exports of Major Steel Products 3,912
"* Net Shipments:
- Steel Mill Products 77,255
- Steel castings 909
- Iron castings 8,363
"* Average price to steel mill products (cents per lb) 26.3
World Production
* Pig Iron 539,726
* Steel 773,620
Data taken from "Minerals Commodity Summaries - 1992," and "Iron and Steel Annual Report, 1990." US Bureau of Mines.
5-7

Table 5-2: Raw Steel Production by Grade and Type of Furnace - 1990"
(Thousand MT)
Total
Type of Furnace Carbon Alloy Stainless Shipments Percent
Open Hearth 2,917 261 -- 3,178 3.5
Basic Oxygen 48,916 4,329 --- 53,400 59.4
Electric Arc 26,885 4,845 1,852 33,335 37.1
Total: 78,718 9,345 1,852 89,913 100 (87.5%) (10.4%) (2.1%)
* Data taken from "Annual Statistical Report," American Iron and Steel Institute, 1990 and is for steel
products only. Data was not included for Cupola and Electric Induction furnaces because they are used primarily for producing iron castings.
5-8
refining into raw steel. The integrated companies make almost exclusively "flat" products, sheet and strip. These
are affected by the strength of the consumer goods markets, mainly automotive and appliances.
In 1990, basic oxygen furnaces (BOF) accounted for about 59.1 % of total steel production, with open hearth
furnaces accounting for only about 3.5%. At the end of 1990, there were 3 open hearth shops with 3 operable
furnaces, and 25 basic oxygen shops with 58 operable furnaces. The last of the three open hearth shops are
expected to be closed and replaced with BOF within the next few years (Peters, 1992).
In a BOF process rapid combustion is provided by high purity oxygen, which is blown through the roof or fed
through the bottom of the furnace in controlled amounts to produce steel of the desired carbon content and
temperature. The metal feed to the furnace generally contains 4.0-4.5% carbon, 0.3-1.5% silicon, 0.25-2.2%
manganese, 0.03-0.05 % sulfur, and 0.05-0.20% phosphorous. Oxidation is employed as the mechanism to convert
a molten bath of pig iron and scrap into steel. The oxygen combines with unwanted elements (except sulfur) to
form oxides that either leave the bath as gases or as slag. Various steelmaking fluxes are added during the refining
process to reduce the sulfur and phosphorous contents of the metal bath to the desired level. The mechanism by
which sulfur is removed does not involve direct reaction with oxygen but instead depends on the conditions of the
slag (i.e., basicity, state of oxidation and temperature). The quantities of hot metal, scrap, and fluxes charged for
a given heat are calculated such that at the end of blowing the prescribed oxygen, the steel bath will have the desired
carbon content and temperature.
A typical BOF can process about 275 MT of steel in 45 minutes with only about 15 minutes of this time being used
for the actual refining (US Steel, 1985, p.34). Most BOF consume 20-30% of the total metallic charge as cold
scrap. Scrap is usually abundantly available and less expensive than hot metal, and therefore, increased scrap
melting in BOF is generally a desired objective. Scrap usage in the BOF is limited, however, because the oxidation
of carbon and silicon is the only source of heat for melting scrap, and scrap typically has much lower levels of
carbon and silicon than pig iron. Even with preheating of scrap, the maximum amount of scrap per charge is about
40%. Home scrap produced within the mill itself is generally preferable to old scrap, since it does not affect the
final quality of the steel.
Nonintegrated Steel Mills
The nonintegrated steel producers melt scrap in electric arc furnaces and cast the steel in continuous casting
machines. Nonintegrated steel producers normally produce "shape" or "long" products, such as wire rods,
structural shapes and bars, and the product is normally a high-strength low alloy steel. Hence, they are largely
dependent on the construction industry.
5-9

For some high quality steel products direct reduced iron is substituted for scrap, in order to minimize the retention
of certain residual elements such as copper and tin in the final product. The melting is controlled as an electric
current arcs from one electrode, through the metallic charge in the furnace, to another electrode. Oxygen gas is
injected into the bath to oxidize with alloying elements which are removed in the slag. Most electric arc furnaces
are basic-lined using a complete bottom consisting of impregnated magnesite brick. About 64.8 million MT of iron
and steel scrap (including home, new and old scrap) was consumed in 1990 (based on reported consumption), with
about 58% being consumed by electric arc furnaces (Peters, 1992).
The electric arc furnace can refine a material charge with any ratio of pig iron to scrap, but typically operates with
a solid charge of almost all scrap. This permits steel to be produced at smaller plants, referred to as "mini-mills,"
that are not associated with a blast furnace complex. Mini-mills typically have much lower capital investment and
operating costs and the flexibility to operate at lower than full capacity. There are about 40 to 45 companies in the
US that operate electric arc furnaces with the total number of furnaces being on the order of several hundred.
Furnace sizes range from about 50 to 400 MT with the most common size being about 100 MT. The average
processing time to melt a change of scrap in an electric arc furnace is about two hours.
Because of its flexibility with respect to charge of materials and its suitability for intermittent operation, the electric
furnace is sometimes used to supplement the output of other steelmaking processes in large integrated mills in short
demand peaks.
Iron and Steel Products
Domestic steel mills shipped about 77.2 million MT of products in 1990, including about 3.9 million MT that was
exported. There were also about 9.2 million MT of iron and steel castings produced in 1990. In addition, about
15.6 million MT of iron and steel products were imported. The distribution of steel product shipments was reported
as follows: steel service centers and distributors, 24.8% (most of this steel is ultimately used by the construction
industry); construction, 14.3%; automotive, 13.1%; steel for converting and processing, 11.1%; containers.
packaging and shipping materials, 5.3 %; and all others, 31.4%. Tables 5-3 and 5-4 summarize the net shipments
of iron and steel products in 1990 by market classification and product grades, respectively.
5-10

Table 5-3: Net Shipments of Steel Products by Market Classifications - 1990*
(Thousand MT)
Steel Mill Market Classification Products Percent
Steel for converting and processing 8,555 11.1
Independent forgers (not elsewhere classified) 871 1.1
Industrial fasteners 339 0.4
Steel service centers and distributors 19,192 24.8
Construction 11,104 14.3
Automotive 10,091 13.1
Rail Transportation 982 1.3
Shipbuilding and marine equipment 308 0.4
Aircraft and aerospace 30 0.0
Oil and gas industry 1,720 2.2
Mining, quarrying, and lumbering 495 0.6
Agricultural 647 0.8
Machinery, industrial equipment and tools 2,171 2.8
Electrical equipment 2,230 2.9
Appliances, utensils and cutlery 1,400 1.8
Other domestic and commercial equipment 979 1.3
Containers, packaging and shipping materials 4,067 5.3
Ordnance and other military 114 0.1
Export (reporting companies only) 2,261 2.9
Non-classified shipments 9,760 12.6
Total 77,255 100
* Data taken from "Annual Statistical Report," American Iron and Steel Institute, 1990.
5-11

Table 5-4: Net Shipments of Steel Products by Grades - 1990*
Total
Steel Mill Products Carbon Alloy Stainless Shipments
Semi-finished 7.1% 12.9% 9.8% 7.4%
Shapes and plates 17.0% 9.7% 13.6% 16.5%
Rail and accessories 0.7% --.--- 0.6%
Bars 15.7% 47.1% 9.1% 17.3%
Pipe and tubing 5.1% 12.9% 2.7% 5.5%
Wire-drawn and/or rolled 1.1% 0.6% 1.5% 1. 1%
Tin mill products 5.1% -- --- 4.7%
Sheets and strip 48.3% 15.6% 63.3% 46.8%
Total (thousand MT): 71,653 4,225 1,378 77,255
* Data taken from "Annual Statistical Report," American Iron and Steel Institute, 1990
5-12
5.2.1.2 Scrap Recycling Industry
Scrap Type
There are three general categories of iron and steel scrap that are used in the various steelmaking processes:
Home scrap (or revert scrap) consists of unusable products which result in the course of steelmaking and finishing
operations and is always recycled. These would include pit scrap; ingots too short to roll; rejected ingots; crop ends
from slabs; shear cuttings from trimming flat rolled products; pieces damaged in handling and finishing; etc. In
general, about 30-35 % of all iron and steel consumed in the manufacture of products becomes home scrap (Kirk
Othmer, 1983b; US Steel, 1985, p.339).
New scrap (or prompt industrial scrap) is generated by the steel consumers and is widely recycled because it is
usually of high quality and its chemical and physical properties can be well documented. It may consist of unwanted
portions of plate or sheet, trimmings resulting from pressing and stamping operations, machine turnings, rejected
products scrapped during manufacture, flashes from forgings, etc.
Old scrap (also called obsolete, dormant or post-consumer scrap) includes all other ferrous scrap. This category
includes obsolete, worn out or broken products from the consuming industries. The main types of old scrap
recycled in the US are railroad, machinery, automotive, and municipal solid waste. Old scrap requires careful
sorting and classification to prevent the contamination of steel in the furnace with unwanted chemical elements from
alloys that may be present in some of the scrap. As a result, there are over 70 different specifications covering
various grades of scrap for use in refining steel. Some manufacturers segregate their scrap into as many as 300
separate categories. About 10 million MT of scrap per year is recycled from junked automobiles and an additional
I million MT from the steel can industry.
Scrap Consumption
All domestic production data for iron and steel scrap published by the Bureau of Mines are estimates based on
monthly and annual surveys of US operations. For 1990, a Bureau of Mines internal evaluation indicated that the
scrap consumption reported in its annual report was underestimated by about 8.7 million MT (Peters, 1992; AISI,
1990). For the purposes of this report, the 8.7 million MT was assumed to consist of each of the three categories
of scrap in the same relative proportions as was estimated in the reported numbers. This additional "under-reported"
consumption was added to the reported numbers in order to estimate total scrap consumption.
5-13
The reported total domestic consumption of ferrous scrap by the iron and steel industry, as reported by the Bureau
of Mines, in 1990 was 64.8 million MT; composed of about 40.5 million MT net receipts (new and old scrap), 23.6
million MT home scrap and 0.6 million MT inventory adjustments. Scrap exports for 1990 totaled about 11.6
million MT valued at $1.64 billion, while scrap imports totaled about 1.3 million MT valued at $0.17 billion
(Peters, 1992). The estimated total domestic consumption (considering under-reported consumption) for 1990 was
73.5 million MT. The apparent generation of old and new scrap in the US (net receipts plus imports minus exports)
was about 56.7 million MT in 1990. Table 5-5 provides a summary of the salient statistics for iron and steel scrap.
Included in Table 5-5 are estimates of total iron and steel scrap consumption which considers both estimated total
domestic consumption (which includes the 8.7 million MT claimed by the Bureau of Mines), as well as reported
consumption only. The consumption of iron and steel scrap (includes all types of scrap) by type of furnace is
summarized in the production material flow diagram presented in Figure 5-2.
In 1990, the US Bureau of Mines reports that about 40.5 million MT of ferrous scrap valued at $4.71 billion was
purchased by domestic consumers from brokers, dealers, and other outside sources (accounting for under-reporting,
we estimate this number to be about 46.4 million MT). It is estimated that this scrap consists of about 60-70% old.
scrap with the remainder prompt industrial scrap. Steel mills (both integrated producers and mini-mills) accounted
for 73 % of all scrap received from brokers, dealers and other outside sources; steel foundries received 5%; and iron
casting producers received 22%. Presentation of data for iron and steel scrap consumption and utilization in this
report does not distinguish between new and old scrap. This is due to the nature in which purchased scrap is
handled, segregated, and pre-processed. All scrap which is of similar chemical composition is combined into large
bundles at the dealer sites. Thus, it is nearly impossible to distinguish between new and old scrap for most grades.
Table 5-6 provides a summary of 1990 receipts of iron and steel scrap (includes both old and post-industrial scrap)
from brokers, dealers, and other outside sources in the US by scrap grade, while Table 5-7 provides a regional
summary of scrap receipts.
Figure 5-3 is-a generalized diagram of scrap generation and recycle paths in the production of iron and steel. Old
scrap pathways are indicated by dotted lines. As discussed above, consumption data reported by the Bureau of
Mines does not distinguish between different types of scrap. Included in the table are estimates of scrap volumes
for different paths which are important from a reuse and recycle perspective. Those numbers were estimated based
on converstions with persons from the Bureau of Mines and commercial scrap processors.
Recycling and Life Cycles
Iron and steel scrap has traditionally had very little residual value, and as such, supply of iron and steel scrap far
exceeds demand. Because steel scrap is a demand-driven commodity, the ability to recycle a give volume of scrap
depends not only on the quality of the scrap (i.e., its chemical characteristics) but also on the cost associated with
5-14

Table 5-5: Salient Statistics for US Steel Scrap - 1990*
(Thousand MT and Thousand Dollars)
1990
Apparent consumption 73,491 /e - Net receipts of purchased scrap (includes both old 46,433 /e
and new scrap) - Home scrap 27,058 /e
Reported consumption 64,791 - Net receipts of purchased scrap (includes both old 40,515
and new scrap) - Home scrap 23,613 - Miscellaneous (includes receipts of scrap from 663
company owned plants and changes in inventory)
Exports - Scrap 11,605 - Value $1,635,218
" Imports - Scrap 1,312 - Value $171,510
" Apparent generation of old and prompt industrial scrap in the 56,726 /e Us
" Scrap consumption (includes home, new and old scrap): - Basic oxygen furnaces, percent 23.2% - Electric arc furnaces, percent 57.7% - Open hearth furnaces, percent 1.0% - Electric induction furnaces, percent 1.0% - Cupola furnaces, percent 13.1% - Blast furnaces, percent 4.0%
* Data taken from "Iron and Steel Scrap Annual Report, 1990," US Bureau of Mines, April 1992.
/e Bureau of Mines data is understated by about 8.7 million MT according to internal evaluation. Scrap consumption data reported here is postulated to include the unreported 8.7 million MT.
5-15

Table 5-6: Consumption of Iron and Steel Scrap by Grade - 1990* (Thousand MT)
Scrap Grade
Carbon Steel:
L low phosphorous plate and punching
* Cut structurals and plate
* No. 1 heavy melting steel
* No. 2 heavy melting steel
* No. 1 and electric furnace bundles
* No. 2 and all other bundles
* Electric Furnace, 1 foot and under (no bundles)
* Railroad rails
* Turnings and borings
* Slag scrap (Fe content)
* Shredded or fragmentized
* No. 1 busheling
* All other carbon steel scrap
Total Carbon Steel:
Stainless Steel:
Alloy steel (except stainless)
Ingot mold and stool scrap
Machinery and cupola cast iron
Cast-iron borings
Motor blocks
Other iron scrap
Other mixed scrap
Total Scrap:
Consumptiont
2,103
2,547
7,711
3,555
5,365
965
103
475
1,367
953
3,759
1,860
4,428
35,301
564
201
456
1,075
593
431
885
1,007
40;515
5-16
Percent
4.6
5.6
16.9
8.8
11.8
"2.1
0.2
1.0
3.0
2.1
8.3
4.1
9.7
77.5
1.2
0.4
1.0
2.4
1.3
0.9
1.9
2.2
1 00
Data taken from "Annual Statistical Report," American Iron and Steel Institute, 1990
t Includes both new and old scrap.
Total
Scrap:
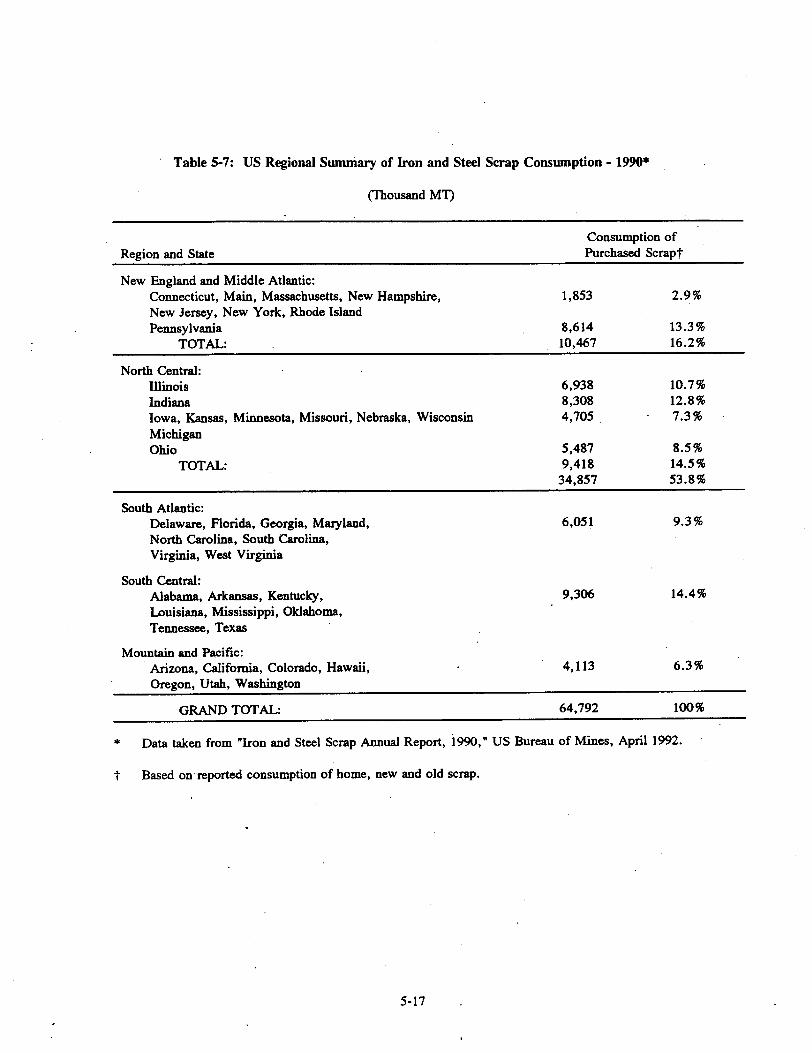
Table 5-7: US Regional Summary of Iron and Steel Scrap Consumption - 1990*
(Thousand MT)
Consumption of
Region and State Purchased Scrapt
New England and Middle Atlantic: Connecticut, Main, Massachusetts, New Hampshire, 1,853 2.9% New Jersey, New York, Rhode Island Pennsylvania 8,614 13.3%
TOTAL: 10,467 16.2%
North Central: Illinois 6,938 10.7% Indiana 8,308 12.8% Iowa, Kansas, Minnesota, Missouri, Nebraska, Wisconsin 4,705 7.3% Michigan Ohio 5,487 8.5%
TOTAL: 9,418 14.5% 34,857 53.8%
South Atlantic: Delaware, Florida, Georgia, Maryland, 6,051 9.3% North Carolina, South Carolina, Virginia, West Virginia
South Central: Alabama, Arkansas, Kentucky, 9,306 14.4% Louisiana, Mississippi, Oklahoma, Tennessee, Texas
Mountain and Pacific: Arizona, California, Colorado, Hawaii, 4,113 6.3% Oregon, Utah, Washington
GRAND TOTAL: 64,792 100%
* Data taken from "Iron and Steel Scrap Annual Report, 1990," US Bureau of Mines, April 1992.
t Based on reported consumption of home, new and old scrap.
5-17

Consumers of processed metal (manufacturers of end products)
I 189,914
IEnd products New scrap
I * 21,597
Old scrap Scap I)
*43,1941 II I
IscrapDealer Numbers are estimated bawA
US Steel 2/3 of reported scrap consun
Reservoir
Figure 5-3: Generalized Diagram of Recycle Paths for Iron and. Steel Scrap (Thousand MT of Recoverable Steel Content)
d on assumption that nption is old scrap
5-18

delivering the scrap to the recycler. Because of the low recycle value for most grades of iron and steel scrap, data
for the consumption of old scrap is not as widely available as it is for many other metals which have a higher
residual value, such as aluminum and copper. Since steel is a corrodible material and many of its products are
rolled into flat sheets, this results in a short life cycle for a large number of steel products, which discourages
recycling. In a general sense, the recycling rate for building steel and reinforced concrete is at least 30 to 50 years,
while steel that goes into white goods (commercial products) may have a life expectancy between 10 and 15 years
(Brown, 1992).
5.2.1.3 Factors Relevant to Cost Benefit Studies
Production Data
A Bureau of Mines study estimates that the quantity of ferrous scrap (all types) consumed in the US by integrated
and mini-mill steel producers in order to produce 1 ton of raw steel has risen from about 0.51 ton in 1970 to 0.61
ton in i990 (Brown, 1992). This is due mainly to advances in continuous casting technology which is a more
efficient forming technology than ingot casting and results in less generation of home scrap. In 1990, 67.4% of
all steel was continuously cast. This increased utilization of continuous casting over ingot casting has resulted in
increased steel mill processing yields and less generation of home (internally generated) scrap. Generation and
consumption of home scrap in US steel mills has decreased from about 60% of all scrap in 1970 to about 27% in
1990. This trend is expected to continue and result in an increased demand for old scrap (Brown, 1992).
Occupational Injury Data
The American Iron and Steel Institute (AISI) publishes data for the rates of occupational injuries for employees
engaged in the production of iron and steel products. Based on those data, the frequency of occupational death is
about 3.3E-04 per year or 8.OE-05 per work year (assuming 2,000 work hrs/yr). Table 5-8 provides a summary
of the data reported to AISI for 1990.
Energy Requirements and Productivity
It has been estimated that the average number of man-hours required per ton of steel produced in the US steel
industry in 1990 was about 3.5 (AMM, 1987).
Various studies have estimated the processing time and energy requirements associated with processing pig iron and
scrap in BOF and electric arc furnaces. A typical BOF can process 300 tons of steel in 45 minutes with only about
15 minutes of this time being used for the actual refining (US Steel, 1985, p.3 4 ). A sample calculation for a typical
5-19

Table 5-8: Summary of Occupational Injury/Illness Data for the Production of Iron and Steel Products - 1990*
1990
1. Aggregate number of man-hours (millions) 321
2. OSHA recordable injuries/illnesses: a. Fatalities 12 b. Low workday cases 7,204 c. Other medical treatment cases 14,014 d. Total (2a through 2c) "21,230
3. Frequency rate (# injuries/illnesses per 200,000 man-hours worked) 13.2
4. OSHA workdays lost (thousands) 202
5. Severity rate (lost workdays per 200,000 man-hours worked) 159
* Data taken from "Annual Statistical Report," American Iron and Steel Institute (AISI).
5-20

electric arc furnace to process 72.6 MT of light density scrap into mild carbon steel indicates the following: a power
requirement of about 520 kW-hr per MT, a scrap yield of about 89%, and a 2 hour processing time (US Steel,
1985, p.663). Another source, estimates a power, requirement of about 500 kWt per ton, with energy requirements
of about 2,200 kW-hr per ton (Kirk-Othmer, 1983c).
5.2.1.4 Factors Relevant to Worker Exposure Scenarios
Standards Relating to Work Health and Safety
The Code of Federal Regulations (CFR) 29 Part 1910, Section 1000 provides limits for airborne contaminants for
toxic and hazardous substances that may affect workers' safety. With respect to the processing of iron and steel
scrap, the applicable standards are that the time-weighted average (over eight hours) of an employee's airborne
exposure to all particulates shall not exceed 15 mg/mr3 to total dust inhalation and 5 mg/m 3 for a respirable fraction.
In addition, for iron oxide fumes there is a short term exposure limit (15 minute time-weighted average) of 10 ppm.
Byproduct Material
All of the emissions of volatized gaseous metals that are generated during the refining of iron and steel are ventilated
and processed in the "baghouse." All dust that is generated is treated as toxic hazardous waste. Due to the high
content of zinc and other valuable chemicals, some of the dust that is generated is reprocessed to concentrate these
metals. Most plants have wet processes on-site which form dust material into concrete for disposal in landfills.
In addition, new processes have been recently developed which involve vitrification with the resulting products used
in the construction industry. In all, about 80% of all dust generated is recycled in some form to avoid landfill
disposal.
The slag that is generated during iron and steel refining is not considered toxic, since it falls below certain levels
prescribed by EPA. This maierial is reprocessed and used in commercial applications such as road construction.,
etc.
Contaminated Scrap
Though there are many different radioactive materials that are potential scrap metal contaminants, much of the
radioactivity encountered in scrap handling is considered "naturally occurring radioactive material" (NORM). Scrap
containing NORM can be found in the scale that attaches to crude oil transmission pipe walls or to oil drilling pipe
as the pipe passes through oil basin depths (radium is the most common contaminant). Radiation levels in drilling
5-21
pipe can be quite high, but this class of scrap is not covered by any Federal, and only a few state, disposal
regulations (Modem Casting, 1991).
Most refiners have radiation detectors for incoming material that are set just above background (Modem Casting,
1991). There are about 30 railcars worth of slightly contaminated radioactive material that has been detected when
entering refineries that now has no place to go (i.e., it cannot be processed and the landfills will not take it)
(Wieczorowski, 1993). It has been estimated that daily there is anywhere from one to five railcars or trailer loads
of scrap being rejected or found with radioactivity in the US. More than 75 % of the times a radiation detector goes
off at a site, there is no perceivable radiation source and when the material is tested it is usually revealed to be
NORM (NRC, 1990). There have been a smaller number of incidents where sealed sources have been detected.
Most of these sealed sources have come from industrial applications (i.e., smoke detectors, static eliminators, etc.)
The cost of disposing of this material as hazardous waste is prohibitively high and the refining industry is lobbying
for the implementation of some sort of standard that would allow them to melt small amounts of contaminated
material (below some prescribed level) as a small percentage of each charge in order to get rid of it.
At the other extreme, there have been several significant and highly publicized incidents (probably about one per
year) where a radioactive source entered a refinery undetected and was processed. In a recent study for the years
1985-1989, 30 responding states reported 92 incidents of radioactive materials found in steel scrap, melted in a steel
making facility, or contained in slag or other byproducts of steel or aluminum smelting and foundry operations
(Kerr, 1990). Of the seven most recent contamination events reported in a recent trade magazine, five involved
industrial gauges (containing elements such as 137cesium, 6°cobalt, 226 radium, or 241americium) mixed with or affixed
to scrap. It has been estimated that there are about 500,000 radioactive gauging devices in the US. These devices
are used by the public under licensed exemptions from NRC requirements and they present the greatest
contamination threat because of their sheer numbers and the amount of radioactive materials they contain (Modem
Casting, 1991).
These incidents have ended up costing the steelmakers on the order of several million dollars per incident, because
the melting of the source has caused contamination in the baghouse and associated ductwork, etc. which then had
to be replaced. In 1983, for example, about 25 curies of Cobalt 60 were inadvertently mixed in metal scrap at a
steel mill and smelted. The cost for decontaminating this facility and disposing of the waste exceeded four million
dollars. Since then, there have been other instances of accidental smelting, both in the US and abroad, with the
disposal costs reaching over one million dollars in each facility (NRC, 1990).
5-22

5.2.2 Copper Recycling Industry
5.2.2.1 Overview of Domestic Production and Use
There are over 370 recognized copper and copper alloys that are produced and -are in use in this country. These
alloys are divided into broad categories of wrought and cast metals. The major classes are: coppers, which contain
greater than 99.3% copper; high copper alloys, which contain at least 94% copper; brasses, which contain zinc as
the primary alloying agent; bronzes, which contain tin as the primary alloying agent, but also contain other metals;
copper-nickels, which contain nickel as the primary alloying metal; leaded coppers, which are cast alloys containing
at least 20% lead, but no zinc or tin; and special alloys, which are copper alloys not covered in the above group
(Jolly, 1992).
According to the US Bureau of Mines, domestic mine production of copper ore in 1990 was about 1.6 million MT
valued at over $4.3 billion (Jolly, 1992). Most copper concentrates are processed through a three stage smelting
process to produce an enriched copper melt (usually 97% to 98.5% copper) known as "blister copper." Implicit
in the smelting process is a stage where the blister is fire refined by oxidation for removal of the impurities in a
reverbatory furnace. The fire refining process uses oxidation, fluxing, and reduction, and a refined ingot, wirebar,
slab or billet is usually poured. The reduction is accomplished by partly covering the molten metal with coke and
inserting green wooden poles through the furnace door. Copper oxide in the melt is converted to copper by the
reducing gases formed. The end product is then normally cast into anode shape and further treated in an electrolyte
bath to form "refined copper cathode" through electrolysis. Alternatively, copper cathode can be obtained directly
from an electrowinning process, where copper cathode is plated directly from copper-bearing solutions leached at
the mine site through solvent extraction methods. Secondary copper, or scrap, can either be refined or directly
melted into usable form (there is a single facility which processes copper scrap by electrowinning, however, it did
not begin operation until 1991). The secondary refining of copper is normally performed through electrolysis using
the same process as for primary copper. A smaller amount of secondary copper is processed by fire refining and
directly cast into usable form for processing. Similar to the primary fire refining this process uses oxidation, fluxing
and reduction, however, instead of an anode, a refined ingot, wirebar, slab or billet is usually poured. For
applications where the scrap composition is fairly homogeneous, scrap can be directly melted in an electric or gas
fired furnace to form products of similar chemical composition. There is also a very small amount of old scrap
that is used in the smelting of primary refined copper, mainly for cooling the copper of the copper melt. This
amount of scrap is so small that it is not considered in the material flow presented in this report. Figure 5-4
provides an overview of the relationship between various processes that are used to refine copper ore and scrap
into copper products. Included in this figure are estimates of copper production material flow for each process.
Table 5-9 provides a summary of the salient statistics for US copper production in 1990.
5-23

Cepp. Or.Bhktor Cojppe
"Primary" Refining:
LVI
.0.
SCepper-BOWIS Ore
IM. r
metal is refined by electrolysis RefuMod Copper Catoed (cathode)
metal Is leached
at the mine site c Cheb and drawn out ofclution
"Secondary" Recovery:
(a) Unless otherwise indicated, material flows based on information in the "Copper Annual Report, 1990," US Bureau of Mines, Apri 192. (b) This number includes a small amount of imported fire refined copper. (c) These numbers are estimated. Bureau of Mines Copper Annual Report Table 22 data indicates that 70.7% of all copper-base scrap (new and old) consumed in refining is old scrap. This
percentage was multiplied by the total scrap consumption for each type of furnace to estimate old scrap consumption. (d) This number represents the total volume of primary material available for processing, considering mine production, imports, exports, stocks, etc. This number does not represent total mine
production.
Figure 5-4: Copper Production Material Flow - 1990 (a) (Thousand Metric Tons of Recoverable Copper Content)
Copper Ore

Table 5-9: Salient Statistics for US Copper Production - 1990*
(Thousand MT)
1990
United States
Mine production 1,587 Primary refinery production 1,577 Primary refined cooper from scrap (new and old) -441 Old scrap generation 535 Exports: Refined 211
Unmanufactured 780
Imports: Refined 262 Unmanufactured 512
Consumption of refined copper (reported) 2,150 Apparent consumption of refined coppert 2,168 Price: (weighted avg., cathode, cents/lb, producers) 123.16
World
Mines 8.815 Smelters 9,378 Refineries 10,642 Price: (London, grade A, avg. cents/lb) 121.02
Data taken from "Minerals Commodity Summaries - 1992," and "Copper Annual Report, 1990," US
Bureau of Mines.
Defined as primary refined production + copper from old scrap + refined imports - refined exports + changes in stocks.
5-25
The principle states for copper mining are: Arizona (61% - 13 mines); New Mexico (18% - 2 mines); and Utah
(14% - I mine). For primary refining of copper, there are currently 9 primary smelters, 8 electrolytic furnaces,
and 14 electrowinning plants. Although Figure 5-4 indicates that there was a small amount of primary fire refined
copper produced in 1990, there are currently no operating fire refining operations in the US. For secondary refining
of copper scrap, there are 6 operating fire refineries, and 2 electrolytic refiners (Jolly, 1993b).
US Bureau of Mines statistics report that about 2.15 million MT of refined copper was consumed in 1990, including
about 441 thousand MT new and old scrap used in primary and secondary refineries. Overall, there was about
0.535 million MT of old copper scrap consumed, and 0.774 million MT of new copper scrap consumed (Jolly,
1992).
Copper Products
The major categories of processing consumers for refined copper and copper scrap are: refineries, wire rod mills,
brass mills, chemical plants, ingot makers and foundries. In 1990, there were about 20 operating wire rod mills,
41 brass mills, 28 ingot makers, and over 700 foundries, chemical plants and miscellaneous manufacturers.
Table 5-10 summarizes the consumption of refined copper and copper scrap by each of the major categories of
processing consumers.
Copper products are used in a number of different industrial applications, including: building construction, electrical
and electronic products, industrial machinery and equipment, transportation, and consumer goods. A summary of
refined copper consumption by industrial application is presented in Table 5-11.
5.2.2.2 Scrap Recycling Industry
Scrap Type
The Institute of Scrap Recycling (ISR) recognizes over 53 classes of copper and copper alloy scrap. The major
unalloyed grades of scrap are No. 1 copper which contains greater than 99% copper and is usually remelted, and
No. 2 copper which contains 94.5 - 99% copper which usually must be refined.
Scrap Generation
In 1990, an estimated 1.6 million MT of copper-base scrap, containing an estimated 1.3 million MT of copper, was
consumed in the US. Copper-base old scrap consumption was about 0.535 million MT while copper-base new scrap
consumption was about 0.774 million MT (Jolly, 1992). Of the total of 0.535 million MT of copper-base old scrap
5-26

Table 5-10:' Consumption of Refined Copper and Copper-Based Old Scrap by Processing Consumers - 1990 (Metric Tonnes)('ý
Refined Copper Consumption
Cu-Based(b) Old Scrap Consumption
Refineries -- (0.0%) 311,150 (62.0%)
Wire Rod Mills 1,653,490 (76.9%) 1 32,626(c) (6.5%)
Brass Mills 445,200 (20.7%) I
Chemical Plants 1,086 (0.05%) 2,404 (0.5%)
Ingot Makers 4,479 (0.2%) 123,850 (24.7%)
Foundaries 14,550 (0.7%) 31,650 (6.3%)
Miscellaneous(d) 31,601 (1.5%) --- (0.0%)
2,150,426 (100%) 502,040 (100%)
(a) Material flows based on information in the "Copper Annual Report, 1990," US Bureau of Mines, April 1992.
(b) Scrap volume estimates are based on copper-based scrap only; the total volume of copper recovered from all scrap in 1990 is somewhat higher (535,372 for old scrap).
(c) Available data does not differentiate between wire rod and brass mills.
(d) Includes iron and steel plants, primary smelters producing alloys other than copper, consumers of copper powder and copper shot, and other manufacturers.
5-27

Table 5-11: Apparent Consumption of Refined Copper by End Use Sector - 1990*
Cu Consumption
Industrial Application (xl 000 MT) (Percent)
Electrical 1,561 72
Construction 325 15
Industrial Machinery and Equipment 108 5
Transportation 87 4
Ordnance 22 1
Other Uses 65 3
Data compiled by the Copper Development Association (CDA). The electrical component has been extracted from all end-use categories except electrical and ordnance. Ordnance reflects US Department of Commerce ACM military shipments.
5-28
that was consumed in 1990, about 0.502.million MT or 93.8%, came from copper-base metals. Of the remaining
old scrap, about 6.1 % came from aluminum-base metals, with the remainder coming mainly from nickel-base and
zinc-base metals (Jolly, 1992).
Figure 5-5 is a generalized diagram of scrap generation and recycle paths in the production of copper. Old scrap
pathways are indicated by dotted lines. As shown in the figure, old scrap is either consumed by secondary smelters
or directly remelted into end-products by the manufacturers. For the most part, old scrap is not consumed by the
primary refiners. The figure also indicates that generation of recyclable copper old scrap in the nuclear industry
in 1990 was less than 1 % of the annual old scrap utilization for copper.
Scrap Process Technology
Most old scrap which is recovered must be refined into a usable form for processing. Of the 0.535 million MT
of old copper scrap that was generated in 1990, about 0.223 million MT was directly remelted and the remaining
0.312 million MT was refined, with about 0.191 million MT fire refined and the remaining 0.121 million MT
processed by smelting and electrolysis, as indicated in Figure 5-3. Beginning in 1991, there is also a small amount
of copper scrap that is processed through electrowinning.
For the refining of copper scrap, there are currently 6 operating fire refineries in the US with a total capacity of
0.196 million MT, 5 secondary smelters with a total capacity of about 0.436 million MT, 2 electrolytic refiners with
a total capacity of 0.2 million MT, and 1 electrowinning plant with a capacity of 0.09 million MT. Most impure
old copper scrap from sources such as radiators, electronics, cable or tubing is generally processed by smelters and
refiners fall into this category. Table 5-12 provides a summary of the location and capacity of each of the secondary
refining facilities in the US.
Nearly all of the scrap that was remelted was alloy scrap which was processed into material of similar chemical
composition. In most cases, scrap melters are located alongside the manufacturing process (i.e., brass and wire
rod mills). As such, the number and location of scrap melters was not readily available information.
Special processes are used in the recycle of electronic scrap, due to the complexity of the material which may
include large amounts of plastics, organic flame retardants and ceramics; further, the relatively high gold and silver
content in such scrap makes this-scrap economically attractive. A number of different processing techniques are
employed including: mechanical dismantling by crushing and separation by means of density or conductivity, thermal
dismantling, and various solvent extraction and electrowinning techniques.
5-29

-1,100 Iyr !"
US Copper Reservoir
.65,000 In 1990or-r
312 II
Secondary smelters and refiners (use exclusively scrap)
ling of metal for manufacturing I
and wire rod mills, ingot makers) I
2,150 223 II II
- I
of processed metal & manufacturers of end products
mills, foundries, chemical plants)
535 *
* I Generation rate of recyclable copper old scrap in the nuclear |
industry is -4/yr or -0.8% of annual old scrap utilization
Figure 5-5: Generalized Diagram of Recycle Paths for Copper Scrap (Thousand MT of Recoverable Copper Content)
5-30

Table 5-12. Summary of Secondary Refining Capability in the US - 1991
Process Location 1991 Capacity
Smelters: Sauget, IL 70,000 Alton, IL 135,000 Philadelphia, PA 16,000 Gaston, SC 110,000 Carrollton, GA 105,000
TOTAL: 436,000
Fire Refiners: Sauget, IL 55,000 Indiana 34,000 Chicago, IL 500 Reading, PA 70,000 Philadelphia, PA 4,500 Warrenton, MO 32,000
TOTAL: 196,000
Electrolytic: Sauget, IL 80,000 Gaston, SC 120,000
TOTAL: 200,000
Electrowinning: Newman, IL 900
5-31

Scrap Consumption
The scrap consuming industries in the US include refiners, ingot makers, brass and wire-rod mills, foundries and
miscellaneous chemical plants. The utilization of scrap (new and old) varies widely by industry. Most wire rod
mills use very little scrap as direct feed without further processing. Advances in continuous cast rod technology
require some mills to use very clean, high grade scrap, if used directly at all. Scrap comprises less than 5% of feed
used. Brass mills are the principle consumers of No. I copper scrap and account for more than 75 % of the copper
alloy scrap intake. Nearly all of the copper raw material used to produce specialty alloy ingot for use in foundries
was scrap, much of it used in'a direct melting process.
Specific data for old scrap utilization is not widely available, as most data is reported in terms of total scrap
consumption. More than 70% of all old scrap is consumed by the primary refiners and ingot makers, consisting
largely of No. 2 copper and recycled automobile radiators. Most of the remaining old scrap is used to produce
brass and bronze ingots. Fabricators, such as brass and wire rod mills, prefer to use as much clean scrap as
possible to conserve on using more expensive primary refined metals. As such, typically less than 20% of their
scrap consumption is old scrap. Table 5-13 estimates the consumption of copper-based old scrap by scrap type and
processor in 1990. It should be noted that numbers reported in Table 5-12 are for copper-base scrap only
(aluminum-base and other metal scrap containing copper are not included). Based on these estimates, the largest
old scrap categories were: No. 2 copper, 35.8%; cartridge cases and brass, 13.5%; automobile radiators, 13.2%;
No. 1 copper, 11.1%; low grade residues, 8.5%; and red brass, 7.9%.
Recycling and Life Cycles
The total scrap recycling rate for copper (as a percentage of total copper consumption) in 1990 was about 61 %,
while the recycling rate for copper old scrap by itself was about 25%. About 22% of refined copper produced in
the US in 1990 was from scrap, with about 15% of refined copper production coming from old scrap.
The availability of copper scrap is linked with the quality of products consumed (i.e., their turnover rate) and their
life cycles. According to one study, copper in electrical plants and machinery averages 30 years; in non-electrical
machinery, 15 years; in housing, 35 years; in transportation, 10 years; and in all other end use sectors about 10
years. The average for the entire industry was about 25 years (Olper, 1984, p.36).
5-32

Table 5-13: Estimated Consumption of Copper-Base Old Scrap by Scrap Type and Processor - 1990*
(MT Gross Weight)
Estimated Old Scrap Consumptiont [Values in () represent Percent of Old Scrap vs. Total Scrap
Consumption]
Smelters, Foundaries, Refiners Brass Mills and Chemical, and Percent of
and Ingot- Wire Rod Mills Manufacturers Total Total Old
Scrap (Grade) Makers Scrap
No. 1 Copper 38,429 18,364 23,349 80,142 11.1 (29) (7) (69) (19)
No. 2 Copper 238,825 14,859 5,020 258,704 35.8 (88) (23) (71) (75)
Total Unalloyed 277,254 33,223 28,369 338,846 46.9
Scrap (44)
Red Brass 42,745 4,289 10,124 57,158 7.9 (84) (60) (60) (76)
Leaded Yellow Brass 2,636 24,006 399 27,040 3.7 (12)
Yellow and Low ...... 14,912 2.1 Brass (12)
.Cartridge Cases and ...... 97,726 13.5
Brass (100)
Auto Radiators 87,885 N/A 7,062 94,947 13.2 (100) N/A (100) (100)
Bronzes 11,108 0 N/A 11,108 1.5 .(100) (0) (100) (60)
Ni-Cu Alloys .....-- 3,195 0.4 (15)
Low Grade Residues 61,511 N/A N/A 61,511 8.5 (45) N/A N/A (45)
Other Alloys 23,358 7,744 N/A 15,551 2.2
(50) (50) N/A (50)
Total Alloyed Scrap 383,149 53.1 (46)
Total Scrap 721,995 100.0 (45)
Scrap consumption based on information in the "Copper Annual Report, 1990," US Bureau of Mines, April 1992. Volume
estimates represent gross weight of scrap and not copper weight.
"t Old scrap consumption wasn't available for 1990; values in () were estimated based on old scrap utilization for 1989.
5-33

5.2.2.3 Factors Relevant to Cost Benefit Studies
Cost Studies
There have been various studies which have estimated the energy costs of refining. One study estimated the cost
of producing secondary copper to be about half the cost of producing primary copper. Excluding the energy content
of the materials used, which can be estimated to be about 5 Gj per ton, refined copper from ore would require about
70 Gj of total energy, while to recover pure copper from scrap would require only about 35 to 40 Gj per ton (Olper,
1984, p.36). Another source estimated 117.9 Gj (28.2 million Kcal) per ton for producing primary copper from
ores and only 18.8 Gj (4.5 million Kcal) per ton for producing secondary copper (Shamsuddin, 1986). Another
source estimates energy consumption of about 45 Gj per ton for smelting and refining of low grade scrap, and only
about 5 Gj per ton for direct remelting and casting of scrap (Kirk-Othmer, 1983a).
Copper Generation Rate
The US reservoir of copper materials in use, or abandoned in place, was estimated to be about 63.5 million MT
in 1991, increasing since 1983 at a rate of about 1.1 million MT per year (Carrillo, 1974). However, another
Bureau of Mines Study predicted the annual increase in unrecovered copper to increase to over 2.2 million tons
by the year 2000 (Olper, 1984, p.30-36).
5.2.2.4 Factors Relevant to Worker Exposure Scenarios
Standards Relating to Worker Health and Safety
The Code of Federal Regulations (CFR) 29 Part 1910, Section 1000 provides limits for airborne contaminants for
toxic and hazardous substances that may affect workers' safety. With respect to the processing of copper scrap,
the applicable standards are that the time-weighted average (over eight hours) of an employee's airborne exposure
to copper shall not exceed 0.1 mg/mi3 for fumes, and I mg/m 3 for copper dusts and mists.
In addition, 29 CFR Part 1910, Section 1025 provides limits for airborne lead contamination that applies to brass
and bronze ingot manufacturers, lead chemical manufacturers, secondary copper smelters, and non-ferrous
foundries. For lead, the time-weighted average (over eight hours) of an employee's airborne exposure shall not
exceed 50 pg/m3 .
5-34

Uses of Slag
Large quantities of slags are produced in copper smelting plants. Depending on the ore and scrap quantity being
processed, up to 4 tons of reverbatory slags will be generated in the production of one ton of copper (Jolly, 1993a).
Limited space in many plants has encouraged continuing research activities into finding uses for slag. Some uses
have included: railroad ballast, aggregate for roadmaking, soil conditioners, slag wool, a porous aggregate for light
weight concrete, etc. These products are only processed when the metal content of the slag is below applicable
standards.
Other Regulatory Issues
Some other regulatory issues that have been identified include:
" Recently there has been strict legislation of the emissions associated with the incineration of lead-containing plastic wire coverings and fluff. This has lead to increased use of mechanical dismantling of cable.. An estimated 340,000 tons of cable are chopped every year in the US resulting in about 158,000 tons of plastic waste that must be disposed of in some way. Lead-containing plastics are not recyclable and land fill costs are becoming prohibitively high.
" Proposed legislation limits lead content in alloys to 2%. Since the average copper alloy contains about 8% lead, the scrap to be used in the future will have to be diluted which will increase the cost of certain alloys. It is expected that fewer high lead copper alloys will be produced in the next decade.
" The Solid Waste Disposal Act, section 201 would deem as hazardous waste any discarded material that contained more than 1% of any heavy metal. If passed, this could severely curtail recycling efforts for certain materials.
5.2.3 Aluminum Recycling Industry
5.2.3.1 Overview of Domestic Production and Use
Industry Structure
The world aluminum industry is composed of six large integrated firms, about 50 smaller publicly owned
companies, and governments of centrally planned and market economy countries; these control about 40%, 25%.
and 35% of world aluminum production capacity, respectively (US Department of the Interior, 1985).
Aluminum metal is produced in electrolytic cells through the reduction of aluminum oxide (alumina), which is
refined from impure hydrated alumina found in bauxite ore.
5-35

The US is entirely dependent on foreign sources for metallurgical-grade bauxite. Major deposits of bauxite are
located in countries remote from the main aluminum producing and consuming centers in North America and
Europe. In 1990, over 70% of the worlds bauxite was produced in Australia, Guinea, Jamaica and Brazil.
According to the US Bureau of Mines, the US imported about 12.1 million MT of bauxite in 1990 (Plunkert, 1992).
Bauxite imports are shipped to five domestic alumina plants, which produce smelter grade alumina for the US
primary metal industry. These refineries are located in Texas, Louisiana and the US Virgin Islands. These five
refineries are insufficient to meet the demand of the US primary metal industry, and therefore, the US must also
import alumina to supplement its domestic requirements. In 1990, the US produced about 5.2 million MT of
alumina at its five plants. In addition, there were an additional 4.1 million MT of alumina that was imported and
about 1.2 million MT that was exported (Plunkert, 1992).
About 8.05 million MT of alumina was consumed by primary refiners to produce about 4.05 million MT of
aluminum in 1990, corresponding to about 23% of world production. Figure 5-6 summarizes the aluminum
production material flow for 1990, while Table 5-14 provides a summary of salient statistics for aluminum.
Specifications
Commercially pure aluminum usually contains about 99.7% aluminum. Aluminum is also available in strain
hardened conditions of higher strength and reduced ductility. There are also over 100 commercially available
aluminum alloys which are generally divided into two groups: wrought and casting. The Aluminum Association
uses a code to designate the purity and alloy content of wrought alloys and to register the composition of casting
alloys and ingot. The range of compositions of wrought aluminum alloys and selected casting alloys is summarized
in Table 5-15.
Aluminum Consumption
The US remains the largest consumer of aluminum in the world. The container and package industry is the largest
end use consumer of aluminum metal, accounting for about 28% of domestic aluminum consumption in 1990. The
Can Manufacturers Institute reported that about 88 billion aluminum cans were shipped in 1990, representing about
95% of all beverage can shipments. Beverage cans with aluminum bodies, can ends and tabs accounted for more
than 80% of the metal used by the containers and packaging industry.
Metal products such as residential siding, doors and windows, roofing, mobile homes, awnings and canopies.
heating and ventilation applications, screening, bridges and guardrails, and other building and construction uses
accounted for about 16% of total usage in 1990.
5-36

Integrated 0552US Alumna 5,230-B 1rnc9,057u 4,048 Primary Proces sing Plants Refiners';ý Producers: 4,070
Bauxite Alumina Aruminur Imports Imports Exports
1,5 19 Fous2 Sndrismt•
Secondary
Chemical Plants
(a) Material flows based on informnation in the "Aluminum, Bauxite and Alumina Annual R.-,;or - 1990," US.Bmu.au of Mines.
Figure 5-6: Aluminum Production l-1-teril Flow - 19900)
(Thousand MT'

Table 5-14: Salient Statistics- for US Aluninun Production - 1990*
(Thousand MT)
1990
Change in stocks +2
Primary production 4,048
Value $6,604,398
Secondary recovery
- Old scrap 1,359
- New scrap 1,034
Imports for consumption (crude and semicrude) 1,514
Total Supply 7,957
Less total exports (crude and semicrude) 1,659
Available supply for domestic manufacturing 6,298
Apparent consumptiont 5,264
World aluminum production 17,817
* Data taken from "Aluminum, Bauxite, and Alumina Annual Report - 1990," US Bureau of Mines.
t Apparent aluminum supply available for domestic manufacturing less recovery from purchased new scrap (a measure of consumption in manufactured end products).
5-38

Table 5-15: Composition Limits and Uses of Some Aluminum Wrought and Casting Alloys*
(Weight Percent)
Designation Aluminum Copper Manganese Magnesium Silicon Other Constituents Applications
Wrought Alloy Serns
99.0-99.75 0.2 0.05 0.05 1.0 0.1 zinc, 0.05 titanium
Balance 1.9-6.8 0.2-1.8 0.02-1.8 0.1-1.2 1.3 iron, 0.2 titanium, 2.3 nickel
do.f 0.3 0.3-1.5 0.2-1.3 0.6 0.4 zinc, 0.1 titanium, 0.7 iron
do.t 0.1-1.3 0.05-1.3 3.6-13.5 3.6-13.5 1.3 nickel, 0.2 zinc
do.t 0.2 0.01-1.0 0.5-5.6
do.t 0.1-1.2 0.03-1.1 0.35-1.5
do.t 0.05-2.6 0.1-0.7 0.1-3.4
0.45 0.35 chromium, 0.2 titanium, 7.0 iron
1.8 2.4 zinc, 1.0 iron
0.7 0.35 chromium, 8.0 zinc, 0.2 titanium
Electrical conductor, chemical equipment, cooking utensils
Forgings, aircraft, rocket fuel tanks
Ductwork, cable bodies, hydraulic tubing
Welding and brazing wire, pistons
Bus and truck bodies, screens, pressure vessels, aircraft tubing
Heavy duty structures, pipe, bus bars
Aircraft structurals and skins
Diecasting Ingot:
A380 do.t 3.0-4.0 0.5 0.1 7.5-9.5 0.5 nickel, 3.0 zinc, 1.3 iron
General purpose castings
1.0 0.35
do.t 3.5-4.5 0.35
0.25 0.35
0.1 11.013.0
1.2-1.8
0.5 nickel, 0.5 zinc, 1.3 iron
1.0 2.3 nickel, 0.35 zinc, 0.25 titanium
0.2-0.4 6.5-7.5 0.6 iron, 0.35 zinc, 0.25 titanium
Large instrument cases
Cylinder heads, engine pistons
Automotive transmission cases, aircraft and marine fittings.
* Informatioii taken from "Mineral Facts and Problems, 1985," Chapter for Aluminum, US Department of the Interior.
t Balance after deducting percent contribution of specified alloying constituents, plus other normal impurities.
5-39
1000
2000
3000
400
5000
6000
7000
A413 do.t
Sand and Permanent Mold Casting Ingot:
342
356 do.t

The transportation industry was also a major consumer of aluminum metal, accounting for about 18% of total
consumption in 1990. Passenger cars accounted for about one-half of transportation uses; trucks, buses and trailers
one-third; with commercial and naval marine vessels, railroad cars, military and recreation vehicles composing the
remainder.
Other major consumers of aluminum include the electrical industries, consumer durables, and machinery and
equipment. Table 5-16 summarizes the end-use distribution of aluminum products in the US by consuming
industries, based on information compiled by the Aluminum Association.
Aluminum Products
The Aluminum Association estimates that total net shipments of mill products, including imports, by domestic
producers in the US amounted to about 7.2 million MT in 1990 (Aluminum Association, 1991). About 18% of
shipments were in ingot form, with the remaining 82 % in the form of mill products from US producers and imports.
Table 5-17 provides a summary of total aluminum industry shipments, including imports and exports, for 1990.
Of all shipments of aluminum products in 1990, more than 56% were flat products in the form of sheet, plate and
foil. About 17% of all products were ingot form, with an additional 17% in extrusions and billets. The remaining
7% of products were in the form of rod, bar and wire, forgings and impacts, and powder. Table 5-18 provides data
on the end-use distribution of aluminum by its major products.
5.2.3.2 Scrap Recycling Industry
Scrap Type
The aluminum scrap which is recyclable can be generated either from old, discarded or obsolete material, or from
scrap that is generated during the manufacturing of aluminum products.
New scrap is generated from aluminum wrought and cast products as they are processed into consumer or industrial
products. New scrap classifications for aluminum include: solids, clippings and cuttings; borings and turnings (from
machining operations); residues; obsolete and surplus products (mill products and castings).
Old scrap is the aluminum retrieved from 'post-consumer" wastes of all types. The major categories of old scrap
include: used beverage cans, automobiles, siding and roofing material, construction material, etc.
5-40

Table 5-16: End-Use Distribution of Aluminum Products in the US by Industry* - 1990
(Thousand MT)
Industry Consumption Percent of Total
Containers and packaging 2,161 27.9
Building and construction 1,211 15.6
Transportation 1,390 18.0
Electrical 590 7.7
Consumer Durables 504 6.6
Machinery and equipment 444 5.8
Other Markets 260 3.4
Total to domestic users 6,498 85.0
Exportst 1,160 15.0
Grand Total 7,744 100
Adjusted Net Totalt '7,167 -
Data are taken from "Annual Statistical Review for 1991," the Aluminum Association. Includes net shipments of mill products as reported by domestic producers to the US Department of Commerce, plus imported mill products.
t Reflects statistical adjustment made by the Aluminum Association to account for an overstatement (or understatement) in net reported shipments.
5-41

Table 5-17: Total Aluminum Industry Shipments* - 1990
(Thousand MT)
Net Shipments Amount Percent Total
Total 7,167t 100
Ingots 1,272 17.7
Mill products
- US producers 5,438 75.9
- Imports 458 6.4
US exportst 1,160 16.2
US consumers 6,008 83.8
Data are taken from "Annual Statistical Review for 1991," the Aluminum Association. Includes net
shipments of mill products as reported by domestic producers to the US Department of Commerce, plus imported mill products.
Includes statistical adjustment made by the Aluminum Association to account for an overstatement (or understatement) in net reported shipments. Actual net shipments of mill products as reported by domestic producers to the US Department of Commerce, plus imported mill products is somewhat higher (7.744 thousand MT).
5-42

Table 5-18: End-Use Distribution of Aluminum in the US by Major Products* - 1990
(Thousand MT)
Total Percent of
Product Shipments Total
Sheet, plate and foil 4,391 56.7
Ingot 1,471 19.0
Extrusions and tube 1,324 17.1
Conductor 287 3.7
Rod, bar and wire •139 1.8
Forgings and impacts 77 1.0
Powder 54 0.7
Total 7,744 100
* Data are taken from "Annual Statistical Review for 1991," the Aluminum Association. Includes net
shipments of mill products as reported by domestic producers to the US Department of Commerce, plus
imported mill products.
5-43

Scrap Processing
There are several hundred dealers that purchase and collect scrap from industrial sources, as well as scrap contained
in discarded industrial or commercial products or from small commercial collectors, and prepare the various
materials for resale. Dealers also may sometimes sort and prepare the scrap (i.e. cleaning, shearing, cutting, and
grading of scrap) as required by prospective buyers. In general, the composition of well segregated aluminum-based
scrap will fall within the ranges given in Table 5-15. Such scrap is then sold to the independent secondary smelters,
the integrated primary producers, and others.
In recycling, aluminum-base scrap is usually melted in gas or oil fired reverbatory furnaces of 10 to 50 MT
capacity, sometimes with a small amount of primary ingot material and alloying elements to control the chemical
characteristics of the final product. Aluminum scrap is always processed separately from primary material, even
scrap which is consumed by the integrated primary producers. The principle refining of aluminum-base scrap is
the removal of magnesium by treating the molten metal with chloride, aluminum fluoride, or mixtures of sodium
and potassium chlorides and fluorides (US Department of the Interior, 1985). To facilitate handling, a significant
portion of the old aluminum scrap, and in some cases new scrap, is melted to form a solid ingot called "sweetened
pig." Sweated aluminum is formed into ingot molds and can be sold to smelters based on analysis where it can
be further treated to form specification-grade aluminum ingot.
Scrap Generation
Analysis indicates that recovered old, or post-consumer, scrap typically takes one of three major forms: (1)
aluminum cans, (2) automotive scrap, and (3) municipal waste recovery scraps consisting of mixed aluminum alloys
and mixed nonferrous alloys. Table 5-19 provides a listing of commonly used alloys found in consumer products,
including those which are capable of utilizing large volumes of scrap recovered from consumer sources (Aluminum
Association, .1985). From this table, it is clear that virtually all UBC old scrap consists of aluminum alloys 3004,
3104, and 5182. Two major groups of wrought alloys, the 3000 and the 5000 series, make up the majority of
readily recoverable old aluminum scrap in municipal refuse. On a weight basis, 75-80% of the readily recoverable
aluminum in muinicipal waste consists of three alloys - 3003, 3004 and 5182, a significant portion of this being
aluminum cans. Automotive scrap includes a variety of wrought and cast alloys, as indicated in the table.
Figure 5-7 is a generalized diagram of scrap generation and recycle paths in the production of aluminum. Old scrap
pathways are indicated by dotted lines. As shown in the figure, most old scrap is consumed by secondary
processors either at the smelter site or by industrial processors in the production of pre-casting alloys. The
remaining old scrap is in the form of used beverage containers (UBCs) which are directly remelted by the primary
scrap processors in the production of new UBCs. The figure also indicates that the generation of recyclable
5-44

Table 5-19: Commonly Used Alloys Found in Consumer Products
Si Fe Cu Mn Mg Zn Ti Ea. Total Uses
Wrought Alloys:
1235 0.65 SI+Fe
2036 0.5
3003t 0.6
3004t
3005t
3104
3105"t
0.3
0.6
0.6
0.6
5052 0.25
5182t 0.2
5657 0.08
6063 0.2-0.6
6061 0.4-0.8
7016 0.1
8079 0.05-0.3
Casting Alloys:
A 380.1 7.5-9.5
390.0 16-18
0.5
0.7
0.7
0.7
0.8
0.7
0.4
0.35
0.1
0.35
0.7
0.12
0.71.3
0.5
2.2-3.0
0.050.2
0.25
0.3
0.5
0.10.4
1.01.5
1.01.5
1.01.5
0.05- 0.80.25 1.4
0.3 0.30.8
0.1 0.1
0.15 0.20.5
0.1 0.03
0.1 0.1
0.15- 0.15 0.4
0.45- 0.03 1.0
0.05 - -
0.5
0.3-0.6
1.0-1.5
1.0-1.5
0.8-1.4
0.3-0.8
0.:
0
0
0
0.1
2-0.5
.03
0.1
1.13
.03
1.0 3.0-4.0 0.5 0.1 2.9
1.3 4.0-5.0 0.1 0.45-0.65 0.1
0.1 0.06 0.03 - - Printed foil
0.25 0.15 0.05 0.15 Auto body sheet
0.1 - - 0.05 0.15 Cooking "utensils; packaging
0.25 - - 0.05 0.15 Can bodies
0.25 0.1 0.05 0.15 High strength
residential building
material
0.25 0.1 0.05 0.15 Can bodies
0.4 0.1 0.05 0.15 Residential building
material
0.1 - - 0.05 0.15 Appliances; truck trailer
0.25 0.1 0.05 0.15 Can ends; auto body sheet
0.05 - - 0.2 0.05 Bright auto trim
0.1 0.1 0.05 0.15 Extrusions
0.25 0.15 0.05 0.15 Extrusions
4.0- 0.03 0.3 0.1 Bumpers
5.0
0.1 - - 0.05 0.15 Household foil
.. .. - 0.5 Die castings
0.2 0.1 0.2 Engine block
* Data taken from the "Aluminum Recycling Casebook," the Aluminum Association, December, 1985.
t Alloys which are capable of utilizing large volumes of scrap recovered from consumer sources.
5-45

I alumir, fabrica
adanimu ~idll
I Home scrap]
?Consume
E E
631 .1UMMuu iyr 1
US Aluminum reservoi
7 I I
mry S 513 Aluminumn ingot
(Imeltem)
- ---I
Pde o pr
ato extrusion billets, etc
a products and castg. I manufacturers of end productsi
fabricators, chemical plants, etc.)
1,0341 " II
1,359
728
* Generation rate of recyclable old aluminum scrap In the
nuclear ldutry k - 0.06% of man ual old scrap utilization
(a) Reported numbers are based on US consumption of aluminum for 1990; exports of aluminum products and scrap are not included.
Figure 5-7: Generalized Diagram of Recycle Paths for Aluminum Scrap (a) (Thousand MT of Recoverable Aluminum Content)
5-46

aluminum old scrap in the nuclear industry in 1990 was about 0.6% of the annual old scrap utilization for
aluminum..
Scrap Consumption
in 1990, about 2.4 million MT of aluminum was recovered from new and old scrap. About 1.36 million MT of
this secondary aluminum was recovered from post-consumer, or old scrap (Plunkert, 1992).
The consumers of aluminum scrap can be placed in one of the following general groupings: secondary aluminum
producers, primary aluminum producers, non-integrated fabricators, foundries, and chemical producers:
Secondary aluminum producers smelt or refine scrap and dross and in 1990 they consumed about 43 % of all recycled aluminum old scrap. In general, the secondary producer does not use the most selective, higher purity scrap. Most scrap that reaches a secondary producer is a mixture of alloys and cannot be indiscriminately remelted to make finished products and must first be sampled for chemical analysis, moisture content, etc. The smelter will then blend the varioas grades of scrap to reach the desired chemical content. Most of the old scrap that is consumed by secondary smelters is used to make pre-casting alloys, with about 20% used to make extrusion billets, and a much smaller amount used in miscellaneous applications. Table 5-20 provides a summary of the secondary aluminum alloys that were produced by independent smelters in the US in 1990.
0 Primary producers may either purchase scrap or may contract-fabricate returned scrap into mill products for their customers. In 1990 they consumed about 46% of all recycled old scrap. Most of the old scrap consumed by primary producers is in the form of old UBCs which are directly returned to primary producers for reprocessed into new can sheet. Some extrusion billets and pre-casting alloy are also processed.
0 Non-integrated fabricators, foundries and chemical producers combined account for about 11 % of all scrap consumption.
Table 5-21 provides a summary of US consumption of new and old scrap by class of consumer (Plunkert, 1993)
while Figure 5-6 summarizes the aluminum production material flow for old scrap.
The major sources of aluminum old scrap are beverage cans which accounted for about 59% of all old scrap
generated in 1990 (Plunkert, 1992). Most of the remaining scrap comes from automobiles, with a smaller
component coming from building and construction (i.e., aluminum siding, etc.). Table 5-22 provides a more detailed
breakdown of old scrap, new scrap and sweated pig consumption for each class of consumer.
Recycling and Life Cycles
The total scrap recycling rate for aluminum in 1990 (aluminum content of scrap consumed plus scrap exports as
a percentage of adjusted total consumption) was about 41%. It is impossible to determine how much exported scrap
5-47
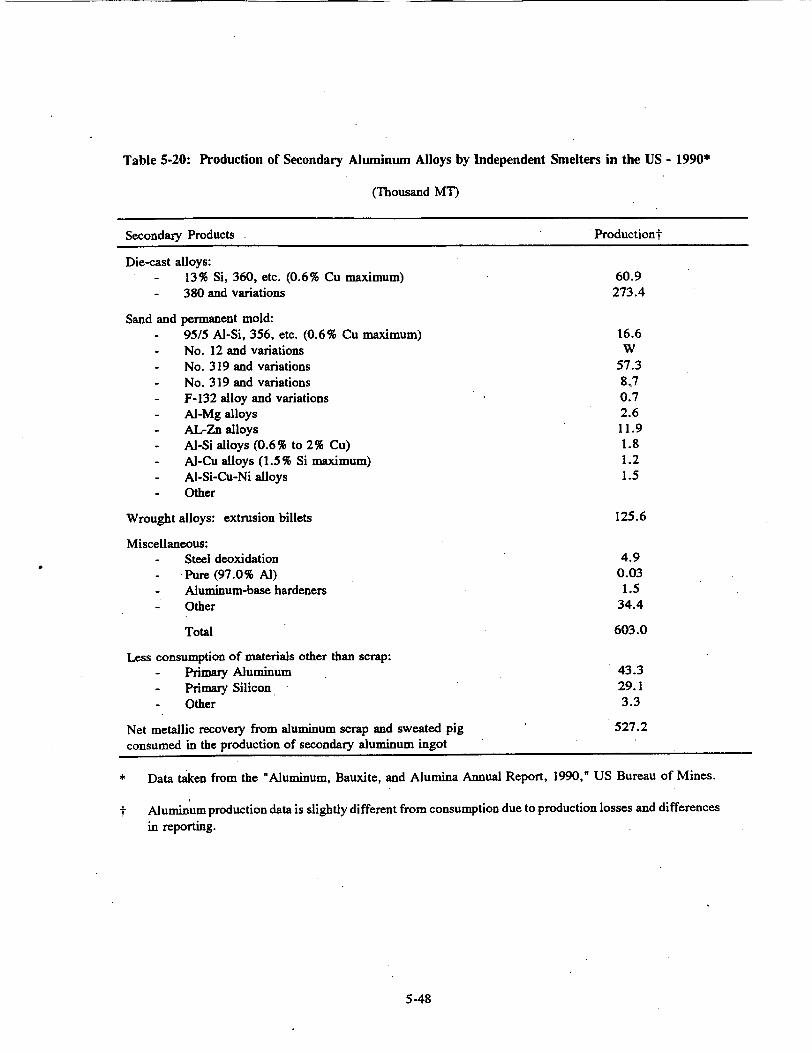
Table 5-20: Production of Secondary Aluminum Alloys by Independent Smelters in the US - 1990*
(Thousand MT)
Secondary Products Productiont
Die-cast alloys: - 13% Si, 360, etc. (0.6% Cu maximum) 60.9
- 380 and variations 273.4
Sand and permanent mold: - 95/5 Al-Si, 356, etc. (0.6% Cu maximum) 16.6
- No. 12 and variations W - No. 319 and variations 57.3 - No. 319 and variations 8,7 - F-132 alloy and variations 0.7 - Al-Mg alloys 2.6 - AL-Zn alloys 11.9 - Al-Si alloys (0.6% to 2% Cu) 1.8 - Al-Cu alloys (1.5% Si maximum) 1.2 - Al-Si-Cu-Ni alloys 1.5 - Other
Wrought alloys: extrusion billets 125.6
Miscellaneous: - Steel deoxidation 4.9 - Pure (97.0% Al) 0.03 - Aluminum-base hardeners 1.5 - Other 34.4
Total 603.0
Less consumption of materials other than scrap: - Primary Aluminum 43.3 - Primary Silicon 29.1 - Other 3.3
Net metallic recovery from aluminum scrap and sweated pig 527.2 consumed in the production of secondary aluminum ingot
* Data taken from the "Aluminum, Bauxite, and Alumina Annual Report, 1990," US Bureau of Mines.
t Aluminum production data is slightly different from consumption due to production losses and differences in reporting.
5-48

Table 5-21: US Consumption of New and Old Aluminum Scrap,* by Class
(Thousand MT)
Old Scrap New Scrap
Class Consumption Consumption
Secondary smelters 582 360
Primary producers 631 454
Fabricators 88 158
Foundries 19 51
Chemical Producers 39 11
Total 1,359 1,034
* Based on information reported to the US Bureau of Mines.
5-49
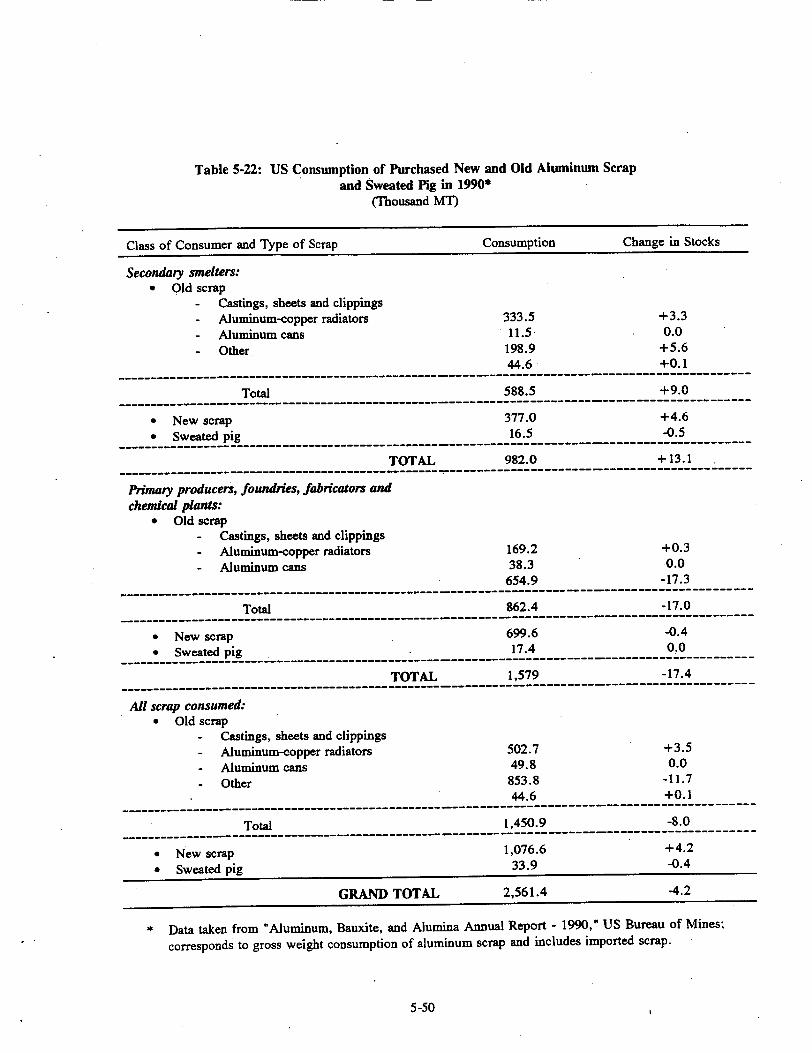
Table 5-22: US Consumption of Purchased New and Old Aluminum Scrap and Sweated Pig in 1990*
(Thousand MT)
Class of Consumer and Type of Scrap Consumption Change in Stocks
Secondary smelters: Old scrap
- Castings, sheets and clippings - Aluminum-copper radiators 333.5 +3.3 - Aluminum cans 11.5 0.0 - Other 198.9 +5.6
44.6 +0.1 --------------------------------------------------------------------------------
Total 588.5 +9.0 -------------------------------------------------------------------- -------------
* New scrap 377.0 +4.6 * Sweated pig 16.5 -0.5
-----------------------------------------------------------------------TOTAL 982.0 +13.1
----------------------------------------------------------------------Primary producers, foundries, fabricators and chemical plants:
* Old scrap - Castings, sheets and clippings - Aluminum-copper radiators 169.2 +0.3 - Aluminum cans 38.3 0.0
654.9 -17.3 --------------------------------------------------------------------------------
Total 862.4 -17.0 ------------------------------------------------------- -------------------------
• New scrap 699.6 -0.4
* Sweated pig 17.4 0.0 --- --------------------------------------------------------------------
TOTAL 1,579 -17.4
All scrap consumed: * Old scrap
- Castings, sheets and clippings - Aluminum-copper radiators 502.7 +3.5 - Aluminum cans 49.8 0.0 - Other 853.8 -11.7
44.6 +0.1 --------------------------------------------------------------------------------
Total 1,450.9 -8.0 -------------------------------------------------------------
* New scrap 1,076.6 +4.2
* Sweated pig 33.9 -0.4
GRAND TOTAL 2,561.4 -4.2
• Data taken from "Aluminum, Bauxite, and Alumina Annual Report - 1990," US Bureau of Mines:
corresponds to gross weight consumption of aluminum scrap and includes imported scrap.
5-50

is old scrap, however, it can be estimated that the recycling rate for aluminum old scrap by itself in 1990 was about
22-26%.
Aluminum scrap has a high residual value, and thus, its recycling rate is linked to its availability and the
technological ability to recover the aluminum from the form of scrap. There have not been any life cycle studies
performed for the aluminum industry since the late 1970s. Due to recent advances in recycling technology,
particularly with regard to UBCs, it is expected that the recycling rates for certain classes of aluminum products
may be somewhat different today. A study done at Battelle Laboratories in 1972 estimated the following lifecycles
for different sources of aluminum scrap: containers and packaging, 1 year; consumer durables and transportation,
10 years; building and construction, 35 years; machinery and equipment, 20 years; all others, 10 years (Battelle,
1972).
A 1979 study estimated life cycles for about 75 end uses for which aluminum shipment data is accumulated. The
life cycles ranged from 3 months for metal cans to 60 years for electrical power transmission and distribution cables.
The study also used estimated lifecycle, product weight and stock consumption data to estimate the input/output of
aluminum recovery from old scrap. Table 5-23 is an estimated matrix of aluminum old scrap generation and
recovery for 1979. From this table it is concluded that in 1979 about 23 % of old scrap was actually recovered for
recycling, about 44% could be added to the old scrap recycling stream, and the remaining 33% was classified as
too difficult to recover for technological and economic reasons (Aluminum Association, 1985).
5.2.3.3 Factors Relevant to Cost Benefit Studies
Markets and Prices
Purchase prices for aluminum scrap, as quoted by the American Metal Market (AMM), have experienced significant
fluctuations historically. Table 5-24 summarizes the year-end price ranges for selected types of aluminum scrap.
Energy Requirements
It has been estimated that the recycling of aluminum consumes about 5% of the energy required to produce
aluminum metal from bauxite ore. It has been estimated that overall, mining, refining and reduction energy
requirements for the production of aluminum range from 125 to 161 million Btu per MT of aluminum metal. In
comparison, between 3 and 30 million Btu per MT of energy are estimated to be required to recover 1 MT of
aluminum from aluminum-base scrap. Table 5-25 provides a summary of the energy requirements for each of the
various stages required to produce aluminum metal.
5-51

Table 5-23: Estimates for Old Scrap Aluminum Generation and Recovery for 1979*
(Thousand MT Gross Weight)
Not Presently Recovered
Total Old Scrap Difficult Possible Possible
Becoming to Consumer Other Actually Source Available Recover Collection Channels Recovered
Building and construction 141 32 59 64 27
Transportation 500 102 - - 170 227
Consumer durables 318 64 95 95 64
Electrical 91 36 - - 45 9
Machinery and equipment 182 55 - - 95 32
Containers and packaging 1,045 500 364 - - 182
Other 91 7 - - 67 17
TOTAL 2,409 795 518 537 558 (100%) (33.0%) (21.5%) (22.3%) (23.2%)
Source - Estimate by the Aluminum Company of America, as reported Casebook," the Aluminum Association, December 1985.
in "Aluminum Recycling
5-52

Table 5-24: Summary of Year End Prices for Selected Types of Aluninum Scrap*
Scrap Type
Mixed low copper aluminum chips
Old sheet and cast aluminum
Clean, dry aluminum turnings
UBCs
Secondary aluminum ingots
- Alloy 380 (1% zinc content)
- Alloy 360 (0.6% copper content)
- Alloy 319
* Data taken from the American Metal Market.
5-53
Price Range (C/pound)
51¢ - 52¢
42c -44
45C - 47C
42C - 46C
73C - 74.5C
76C - 77C
74C - 75.5C
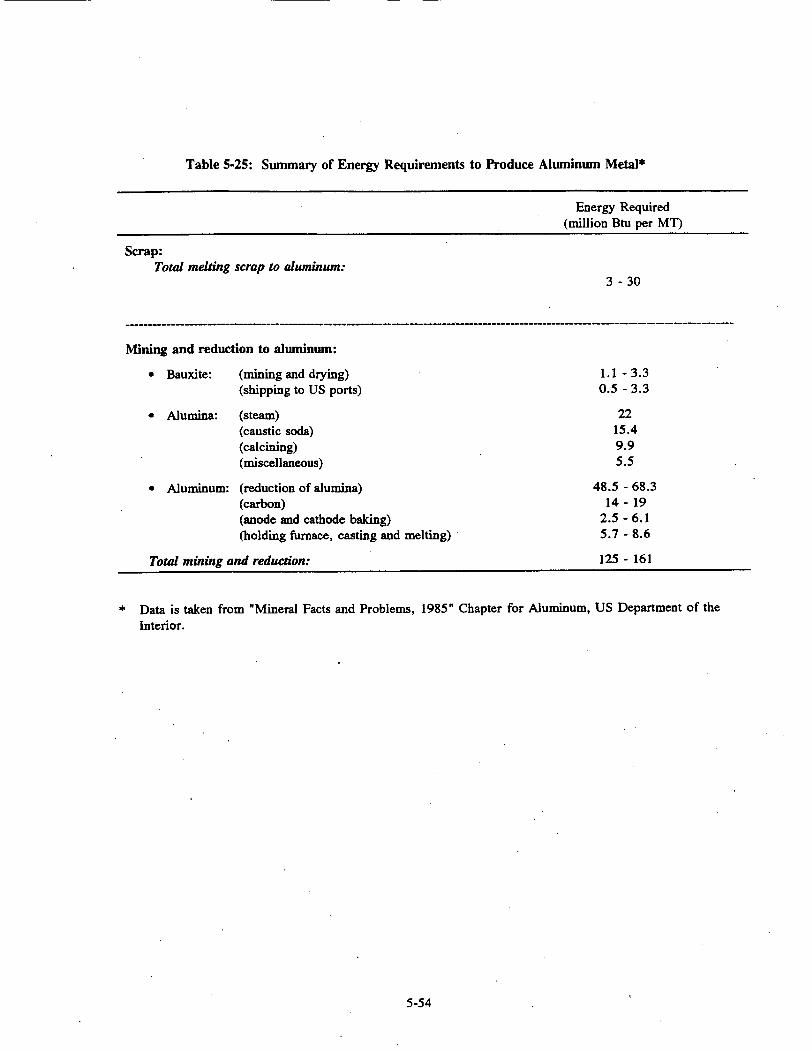
Table 5-25: Summary of Energy Requirements to Produce Aluminum Metal*
Energy Required (million Btu per MT)
Scrap: Total melting scrap to aluminum:
3 - 30
Mining and reduction to aluminum:
* Bauxite: (mining and drying) (shipping to US ports)
1.1 - 3.3 0.5 - 3.3
" Alumina:
" Aluminum:
(steam) (caustic soda) (calcining) (miscellaneous)
(reduction of alumina) (carbon) (anode and cathode baking) (holding furnace, casting and melting)
Total mining and reduction:
22 15.4 9.9 5.5
48.5 - 68.3 14- 19
2.5-6.1 5.7 - 8.6
125- 161
* Data is taken from "Mineral Facts and Problems, 1985" Chapter for Aluminum, US Department of the
Interior.
5-54

5.2.3.4 Factors Relevant to Worker Exposure Scenarios
Standards Relating to Worker Health and Safety
CFR 29 Part 1910, Section 1000 provides limits for airborne contaminants for toxic and hazardous substances that
may affect workers' safety. With respect to the processing of aluminum scrap, the applicable standards are that
the time-weighted average (over eight hours) of an employee's airborne exposure to aluminum shall not exceed 15
mg/m 3 for total dust inhalation and 5 mg/m 3 for a respirable fraction.
5.3 Nuclear Metal Recycle Industry
.5.3.1 US Nuclear Contaminated Metal Recycle Industry
5.3.1.1 Overview of Current Domestic Production and Use
Based on information that will be presented in this section, it has been estimated that a total of about 20,000 MT
of potentially recyclable scrap metal (RSM) is generated each year in the US. The main producers of contaminated
scrap are the nuclear industry, the Department of Energy (DOE) and the Department of Defense (DOD). Figure
5-8 provides an overview of the RSM material flow in the US. A brief summary of contaminated scrap production
and disposition for each of the main producers is provided in the following paragraphs.
The nuclear industry consists mainly of commercial power plants, test and research reactors and industrial facilities.
Based on a detailed analysis of both utility and commercial reuse and recycling practices, it is estimated that the
nuclear industry as a whole generates about 5,000-6,000 MT of RSM per year. Of this amount, about 85% of the
annual generation of RSM comes from commercial nuclear reactors. This corresponds to about 50 to 60 MT per
reactor unit per year. In general, RSM is only decontaminated and/or recycled in the nuclear industry when there
is an economic benefit to do so. As such, the RSM that is generally recycled is either clean (i.e., no measurable
activity) or has relatively small amounts of surface contamination. As shown in Figure 5-8, there are several
different ways in which RSM generated within the nuclear industry is processed and disposed of. Most of the
material generated by nuclear utilities is purchased by commercial processors who employ various surface
decontamination techniques to reduce the level of activity to acceptable levels and resell the material commercially
as scrap (Loiselle, 1993). In addition there is a smaller component of as much as 500 MT per year of material that
is surface decontaminated and reused within the industry (Graves, 1993). There is also a small amount of scrap.
estimated to be less than 10% of the total RSM volume (less than 500 MT/yr), which is decontaminated for
unrestricted release on-site by individual utilities. The amount of decontamination activity performed by utilities
is estimated to be small, however, as only a small number of utilities have extensive decontamination expertise in-
5-55
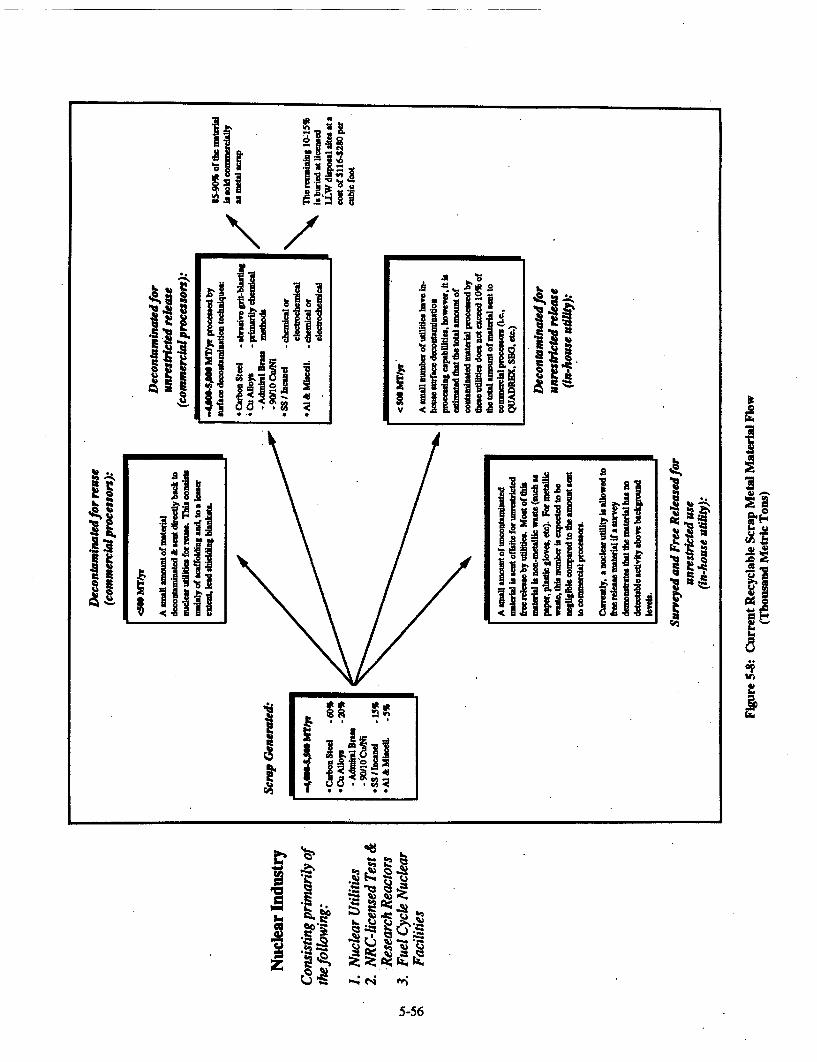
-. q
I. 8
I j�1i�i '� *
0'-� I � �j�z
to�iI �I# �
I.. E.g
In
h.
I � *1 i�j I� I iiii�.I
.f * * * *
9�,
� � �
I ii *��j�I6iI �.� � z �
5-56

Decontaminated for restricted release (commercial processors):
Department of Energy
Consisting of the entire SDOE weapons complex
Scrap Generated:
-15,00 MT/yr
[This number is expected to increase to
SsuLu ',AtAlS muuu as V/U'VV
MT/yr with increased D&D activities within DOE]
SEG currently has a contract to decontaminate by metal melting about 2,000 MT of metal from
Pernould at a cost of $1/lb.
SEG is pursuing additional contract
agreements with DOE to decontaminate contaminated scrap for restricted use within DOE.
SEG is the only remaining finalist under consideration for the DOE scrap metal program (SMP) which, if awarded, will
call for melting about 60,000 MT of contaminated scrap
Stored Scrap (within DOE):
.1,500,000 MT of contaminated recyclable scrap metal in storage in the DOE complex
- 80% at Nevada Test Site
- -10% at Oak Ridge Reservation
Metal ingots reused in - o nuclear applications
within DOE
(1) SEG expects to process about 7,500 MT of contaminated scrap metal (DOE and DOD) in its metal melt facility in 1993. The SEG melter
has a 2OMT capacity, 7,200 kWt induction furnace with a rated capacity of about 5 MT/hr or -25,000 MT/yr.
Figure 5-8: Current Recyclable Scrap Metal Material Flow (Continued) (Thousand Metric Tons)

Decontaminated for restricted release (commercial processors):
Department of Defense
Consisting primarily of the following:
1. Conventional weapons testing
2. Army and Navy Test Reactors
Scrap Generated:
From conventional weapons tests (mainly metal targets containing depleted Uranium projectiles)
and
From occasional decommissioning of Army and Navy test reactor's
(r
Stored Scrap (within DOD):
Tens-of.thousands of MT of contaminated recyclable scrap metal are in storage at DOD test range sites.
Some of this material is currently being released for processing to SEG.
No Metal ingots reused in nuclear applications
(1) SEG expects to process about 7,500 MT of contaminated scrap metal (DOE and DOD) in its metal melt facility in 1993. .The SEG melter has a 2OMT capacity, 7,200 kWt induction furnace with a rated capacity of about 5 MT/hr or ,-25,000 MT/yr.
Figure 5-8: Current Recyclable Scrap Metal Material Flow (Continued) (Thousand Metric Tons)
SEG currently has a basic ordering agreement with DOD to melt contaminated metal from weapons testing sites for restricted reuse within DOE. To date, about 4,500 MT of material has been processed.
Ireactors

house. There is also a component of material which contains undetectable levels of activity when surveyed which
is freely released by utilities. With the exception of obsolete steam generators, there is no significant RSM storage
in the nuclear industry. There are currently 12 obsolete steam generator units containing about 4,400 MT of RSM
which are being stored on commercial nuclear reactor sites in the US and an additional 19 steam generator units
which are scheduled for replacement in the next several years which would add an additional 6,900 MT of RSM
(Loiselle, 1993).
DOE estimates that it generates about 15,000 MT of RSM each year with about 1.5 million MT of RSM in storage.
It has been estimated that the annual generation of RSM may increase to as much as 90,000 MT per year with
increased dismantling and decommissioning activities (Whitfield, 1991). There has been not been any continuous
recycling of RSM in the DOE complex, however, a contract was recently awarded which calls for decontaminating,
through metal melting, about 2,000 MT of RSM from the Fernould site for restricted release and reuse in nuclear
applications within DOE (Carder, 1993).
Generation of RSM within DOD comes mainly from metal targets containing depleted Uranium projectiles resulting
from conventional weapons testing activities and the occasional decommissioning of test reactors operated by the
Army and Navy. The annual generation rate for RSM within DOD is not known, but is expected to be quite small.
It is estimated that the total volume of RSM present at weapons testing sites is on the order of tens of thousands
of MT (Carder, 1993). There has not been any continuous recycling of the RSM that has been generated within
DOD, however, there was a contract awarded in 1992 which calls for decontaminating RSM from weapons testing
sites and RSM generated from test reactors has been processed from time to time.
5.3.1.2 Treatment / Disposition of Recyclable Scrap Metal
There are four companies in the US which decontaminate RSM. Each of the four have the capability to remove
surface contamination by a variety of techniques ranging from high pressure water, to abrasive, chemical and
electrochemical techniques. Most of the surface decontamination activity involves material generated in the nuclear
industry which is processed for unrestricted release according to the guidelines set forth in R.G. 1.86. QUADREX
processes most-of this RSM (as much as 75% in 1992), with Chemical Waste Management (CWM-DSSI),
ALARON and Scientific Ecology Group (SEG), processing the rest. If it is determined that the material cannot be
economically decontaminated below release levels, it is volume reduced and packaged for burial as low level waste.
Since all material coming in has undergone contamination characterization by the licensed generator, a cost/benefit
decision is normally made on how to economically dispose of surface contaminated RSM, based on the cost of
decontamination and low level waste disposal costs. Higher disposal costs tend to justify greater efforts at
decontamination.
5-59

For processing of surface contaminated metal, each processing facility is required to have a state-issued license.
The QUADREX facility has a Radioactive Material License issued by the State of Tennessee, and has limits written
into its license, on the kinds and amounts of radioactive material which it is authorized to process. The total on-site
inventory of radioactive materials can not exceed 100 curies, and there are additional limits for individual classes
of isotopes. With regard to the unrestricted release of materials, the QUADREX license requires that the material
only have surface contamination and that the surface contamination levels of the material meet the criteria set forth
in R.G. 1.86. Material that has been processed requires a 100% survey of all surfaces to verify that it meets the
release limits specified in the license. The SEG license is also issued in Tennessee and its conditions are very
similar to those delineated above. DSSI and ALARON's licenses are expected to be similar.
Decontamination of RSM generated in DOE and DOD has only recently begun. All RSM that has been processed
from DOE and DOD to date has been for restricted release for applications within the nuclear industry. An
important reason for this is that most of the metal that is generated within DOE and DOD involves homogeneous
contamination of the metal. There is no applicable standard that allows for free release of homogeneously
contaminated metal; R.G. 1.86 only addresses surface contamination. Homogeneous decontamination is normally
accomplished though metal melting, unless certain common alloying agents are contained in the metal. During metal
melting, these common alloying agents (i.e., cobalt and nickel) will normally go right into the metal, while others
that do not normally alloy will go into the slag or dust. Because of this phenomenon, surface decontamination is
often employed before metal melt to remove certain alloying elements that may be present in the surface oxide layer
of the metal. A more detailed discussion of the various decontamination techniques is provided in Chapter 4.
SEG has led commercial efforts to enter into contract agreements with DOE and DOD to process its RSM. SEG
has the only licensed metal melt facility in the US and the facility has only recently begun full-scale operation. The
melter is a 20 ton, 7,200 kWt induction furnace, with a rated capacity of about 5 tons per hour which translates into
a capacity of about 25,000 MT per year. SEG expects to melt approximately 7,500 MT of material in the 1993
calendar year (Carder, 1993). The metal that is melted is beneficially reused, primarily within DOE (i.e., the
production of shield blocks) with potential applications in the nuclear power industry (i.e., B25 burial boxes).
5.3.1.3 Contaminated Scrap Processing and Generation in the Nuclear Industry
As indicated in Section 5.3.1.1, about 5,000-6,000 MT of RSM is generated each year in the nuclear industry. This
number has remained fairly constant in recent years, however, increased decommissioning activities in future years
will have a significant impact on the generation of RSM. About 85% of this material is generated by the
commercial nuclear power industry, with the remaining 15% coming from industrial nuclear facilities, and from
the decommissioning of test and research reactors. This material can be either be disposed of as low level waste
at a licensed disposal site (at a cost of $100-$280/ft), or sold commercially as scrap if it can be demonstrated to
5-60

be within acceptable release levels either by the utility or commercial processor. As such, RSM is only recycled
from the nuclear industry when there is an economic benefit to do so. which means that the recycled material is
generally either clean (i.e., no measurable activity) or has relatively small amounts of surface contamination.
Table 5-26 provides a summary of the types of RSM that are generated in the nuclear industry and their approximate
volumes, as well as the types of surface decontamination techniques that are typically employed (Graves, 1993).
The mechanism by which RSM material can be authorized for unrestricted release is different among commercial
processors and nuclear utilities. As described in Section 5.3.1.2, the criteria for unrestricted released for non-utility
licensees involve isotope specific activity limits which are similar to the levels prescribed in R.G. 1.86. For nuclear
utilities, however, unrestricted release of scrap material is possible only if there are no detectable quantities of
radioactivity. The NRC requires licensees that free release material to survey all material before it is released, and
to verify that the material has undetectable levels of activity.
As summarized in Figure 5-8, there are several different ways in which RSM generated within the nuclear industry
is processed and disposed:
" Most of the material generated by nuclear utilities is purchased by commercial processors who employ
various surface decontamination techniques to reduce the level of activity to acceptable levels and resell
the material commercially as scrap (Loiselle, 1993).
" A smaller amount of material (less than 500 MT per year) is decontaminated for reuse within the
commercial nuclear power industry. There is about 3 million MT of scaffolding currently in use in the
commercial nuclear power industry and about 700-850,000 pounds of scaffolding is decontaminated for
reuse each year. To a much lesser extent, lead shielding blankets (with plastic covers) are also
decontaminated and reused (Graves, 1993).
" There is also a small amount of scrap, estimated to be less than 10% of the total RSM volume (less than
500 MT/yr), which is decontaminated and released for unrestricted use by individual utilities. The
amount of decontamination activity performed by utilities is estimated to be small as few utilities have
extensive decontamination expertise in-house. Due to the restrictions for unrestricted release imposed
on the nuclear utilities by the NRC (i.e., only non-detectable material can be released), the vast majority
of utilities contract virtually all of their RSM for disposal to commercial processors (i.e., QUADREX, SEG, ALARON, etc.).
" There is also material which contains undetectable levels of activity when surveyed, and is free released
as non-radiological waste by utilities. Much of this material is expected to be non-metallic dry active
waste such as paper, plastic gloves, etc.
" With the exception of obsolete steam generators, there is no significant RSM storage in the nuclear
industry. There are currently 12 obsolete steam generator units containing about 4,400 MT of RSM
which are being stored on commercial nuclear reactor sites in the US. There are an additional 19 steam
generator units which are scheduled for replacement in the next several years which would add an
additional 6,900 MT of RSM (Loiselle, 1993). Obsolete steam generators are expected to have extremely
high levels of surface and volume contamination which is not amenable to traditional surface
decontamination methods to reduce -activity levels to within acceptable limits for unrestricted release.
5-61

Table 5-26: Summary of Radioactive Scrap Metal Generation in the Nuclear Industry
Percent of Total Scrap Surface Decontamination
Type of Scrap Volume Technique(s)
Carbon steel 60 Abrasive grit-blasting (using peanut shells, glass beads, silicon, or steel)
Copper alloys 20 Primarily chemical methods (baths) to remove - Admiralty Brass the oxide layer - 90:10 Cu-Ni alloy.
Stainless steel and incanel 15 Chemical or electrochemical techniques
Aluminum and miscellaneous 5 Chemical or electrochemical techniques
5-62

As such, the nuclear utilities have not yet determined what the appropriate disposal method will be for obsolete steam generators.
5.3.1.4 Contaminated Scrap Processing and Generation in the DOE Weapons Complex
It has been estimated that the current RSM generation rate in the DOE Complex is about 15,000 MT per year
(Whitfield, 1991). It should be noted that the DOE Complex includes weapons research activities performed as part
of production operations (Weapons Complex), and as such, nearly all RSM generated in the production of weapons
for DOD is generated as part of production operations in DOE. The RSM generation rate within DOE is expected
to increase significantly to over 90,000 MT per year as soon as decontamination and decommissioning (D&D)
projects begin (Whitfield, 1991).
In addition, a preliminary investigation has concluded that about 1.5 million MT of RSM is stored at various DOE
sites, representing about 2% of the total scrap metal production in the US. About 80% of all existing DOE scrap
metals were reported to be stored at the Nevada Test Site, with about 8 % reportedly stored at various DOE storage
yards in the Oak Ridge Reservation (Whitfield, 1991).
Data on the composition of scrap metals stored in the DOE Weapons Complex are quite scarce. Ongoing D&D
projects generate much of the 15,000 MT per year discussed above and these projects have no plans for
comprehensive RSM recycling. The production operations (Weapons Complex) at the DOE facilities reportedly
generates significant volumes of low level and TRU contaminated metal scraps. No publicly available data,
however, currently exist on this waste stream.
There has been not been any continuous recycling of RSM in the DOE complex; however, there have been some
efforts in the last several years to process RSM generated within DOE, mainly for restricted release for use in
nuclear applications. Currently, SEG has a contract with DOE for the processing of about 2,000 MT of RSM,
associated with the decommissioning activities at the Fernould site, at a cost of about $1 per pound. SEG is also
the only commercial processor under consideration for the DOE Scrap Metal Program (SMP) at Oak Ridge. If
awarded, SMP calls for processing about 60,000 MT of RSM (Carder, 1993).
5.3.1.5 Contaminated Scrap Processing and Generation in DOD
Generation of RSM within DOD consists mainly of metal targets containing depleted Uranium projectiles used for
conventional weapons testing activities. In addition, a small amount of RSM has been generated during the
occasional decommissioning of test reactors operated by the Army and Navy. The annual generation rate for RSM
5-63

is not known, but is expected to be quite small. The vast majority of RSM is contained in various weapons testing
sites.
There has not been any continuous recycling of RSM generated within DOD; however, SEG has entered into a basic
ordering agreement with DOD to melt contaminated metal from weapons testing sites for restricted reuse within
DOE, presumably to make lead shield blocks. To date, about 4,500 MT of RSM has been processed from a single
weapons testing site. The agreement calls for processing material from a number of sites. It has been estimated
that the total volume of RSM contained in weapons testing sites is on the order of tens of thousands of MT (Carder.,
1993).
5.3.2 International Nuclear Contaminated Recycle Activity
The Commission of the European Communities (CEC) has an active program researching the decontamination of
metal scrap from nuclear facilities. Industrial-scale processing of contaminated material (on the order of several
thousand MT of material) has been performed in the Federal Republic of Germany, and to a lesser degree in
France. Each country has a licensed facility dedicated to the melting of contaminated scrap metal.
In addition to this activity, research into possible melting processes, products, byproducts and radiological impact,
as well as continuing work on other means of decontamination of equipment, materials, sites and buildings is being
routinely done on a much smaller scale in several different countries.
The following sections summarize the activities of each country:
5.3.2.1 Germany
There has been a moderate amount of contaminated scrap recycling in Germany. More than 4,000 MT of metal
has been decontaminated by melting at two different facilities since 1983. It also appears that there has been some
material that has been surface decontaminated. Germany now has a licensed plant which is dedicated to the melting
of contaminated metal generated by the nuclear industry, and the amount of contaminated scrap recycling is expected
to continue to increase in the future. The focus of German decontamination efforts has been on restricted use in
nuclear applications, and as such, it does not appear that there is any overlap with the commercial recycling
industry for noncontaminated metals.
Initially, experiments into decontamination by metal melting were performed using an existing 20 MT coreless
line-frequency-induction furnace at the Siempelkamp Foundry, Krefeld, Germany which was backfitted with a
special charging device and a filter system (Sappok, 1987). Details of the melting work are described in a number
5-64

of papers by Dr. Manfred Sappok (Sappok,. 1987; Sappok, 1989a; Sappok, 1991; and Sappok, 1992). These papers
describe the initial test melter that was used to process about 1,500 MT of contaminated scrap. The metallic scrap
had come partially from the decommissioning of the Gundremmingen nuclear power station, and also from
backfitting and repairs of about seven operating nuclear power plants.
After the initial tests at the Siempelkamp Foundry were conducted, the decision was made to build a plant dedicated
to the melting of contaminated material. Construction of a plant was initiated in early 1989 and the plant was
commissioned in late 1989. A medium frequency coreless induction furnace with a weight of 3.2 MT was chosen.
Its melting capacity is 2 MT/hr (Sappock, 1991). The plant has an offgas system specifically designed to
accommodate the radioactive aerosols that are generated by the melting of contaminated metal. The facility is
licensed by the German authorities and has limits on the input material (less than 200 Bq/g for alpha, beta and
gamma emitters); the amount of fissile material introduced into the facility (100 Bq/g); the amount of fissile material
in the product (1 g/100 kg of scrap); and the amount of fissile material in the slag (3 g/ 100 kg of slag). As of 1992,
about 2,500 MT of material have been melted at this new facility. This material has included iron and steel, as well
as aluminum, copper and brass (Sappok, 1992). The total quantities that have been melted are not stated in: the
article, but the information presented suggests that several MT of each metal have been melted in the new furnace.
Many of the research efforts that have been performed in Germany have been completed as part of the European
Community's research and development program on the decommissioning of nuclear installations (1989-1993). The
following paragraphs summarize the research efforts which have taken place:
"In 1985-86, a series of melting tests were performed at the Siempelkamp melter involving 175 MT of mixed steel scrap (activity 7 Bq/g) to produce shielding plates, 30 MT of carbon steel scrap (activity 5 Bq/g) to produce high quality castings, and 34 MT of austenitic steel scrap (activity 12 Bq/g) to produce bars for later recycling (Huber, 1987). These melting experiments concluded that the melt retained about 95% of the 6°Co which was the dominant radionuclide in the scrap treated, with smaller amounts of 10Ag and 125Sb found in some melts; the slag (1-1.5 wt% of the scrap input) contained the bulk of the Cesium activity, as well as smaller amounts of 54Mn, 60Co, 6 5Zn, 144Ce and 154tEu; and the filter dust (0.1-0.4 wt% of scrap input) contained all types of radionuclides present in the scrap.
" A recent paper reports that over 4,000 MT of material has been removed to date from the Gundremmingen nuclear power station during its decommissioning (Eickelpasch, 1992). The decommissioning of the turbine hall has'resulted in the decontamination and production of about 1,700 MT of metal (primarily steel) that can be used for unrestricted purposes, and about 1,500 MT of metal (primarily iron and steel) that was processed at the Siempelkamp foundry for production of waste containers to be returned for service in nuclear stations (Eikelpasch, 1983). In addition to the steel and iron, the paper reports the melting of 140 MT of admiralty brass (Sappok, 1989b). A recent IAEA report states that at the Gundremmingen site. about 365 MT of decontaminated concrete was used as a dam to block off a lake (IAEA, 1988). It is expected that more concrete will be used in this manner in the future. It was also reported that 1,100 MT of metal and 400 MT of concrete were released for unrestricted reuse.
" Another effort involves a large-scale investigation into alpha-emitter behavior under melting of
alpha-contaminated steel from nuclear facilities, and to demonstrate the feasibility of the unrestricted release
5-65

of this material for reuse within legal limits (CEC, 1991a). The work is being performed cooperatively between Siemens AG, KWU Erlangen, and Siempelkamp Giesserie (SG). Following laboratory scale melts, large scale melts of about 100 MT of uranium and Pu-contaminated material from Siemens fuel fabrication and about 5 MT of Th-contaminated steel waste were scheduled to be carried out in early 1992. The specific contamination of the treated radwaste is estimated to be in the range of _5 200 Bq/g (alpha/beta) and the anticipated fission product inventory is estimated at about 200 g of U-235 and 1 g of Pu. The melts will be carried out in a 200 liter induction furnace.
" Another effort contracted to Siemens of Germany involved an investigation of recycling radioactive non-ferrous aluminum and copper by melting processes. This was undertaken to evaluate the behavior of the most relevant isotopes during melt decontamination in order to support guidelines for unrestricted release of material (CEC, 1991b). In this project 0.16 MT of radioactive surface contaminated aluminum scrap from different nuclear power plants was melted in a laboratory scale induction furnace (600 mm diameter crucible, 212 liter volume). After melting, a decontamination factor of 30 has been achieved for 6OCo and a factor of 3.5 for l)mAg. This project is ongoing through December, 1993.
" Another effort, performed by. TUV-Bay, involved an evaluation of the radiological aspects of recycling contaminated concrete debris in order to support the development of limiting values for the restricted release of concrete with low level residual activity for selective non-dangerous utilization (i.e., noise barriers, earth fill, foundation material, etc.) (CEC, 1991c). This work focuses on simulating the washout of radioactivity by rainwater using a concrete test specimen from Gundremmingen Unit A. Twenty years worth of precipitation will be simulated over a 20 month span. Filtered concrete aggregates are collected from water that has seeped through the test specimen and measured spectroscopically. This work is ongoing through December, 1993.
" In another research effort in Germany, 67 200 liter drums of decontaminated scrap originating from the Obrigheim and Gundremmingen nuclear power plants were melted in an industrial furnace under an atmosphere to produce about 22 MT of ingots and 0.8 MT of slag. About 97% of the 6OCo (1 Bq/g in the scrap) remained in the billet and about 90% of the 137Cs (0.5 Bq/g) went into the slag. The remainder went into the furnace liner and the cooler parts of the air duct system. The overall volume reduction including the slag was over 70% (Pflugrad, 1985).
" There have also been experiments involving the industrial-scale melting of tritium-contaminated steel from nuclear installations (CEC, 1991). This effort treated contaminated steel scrap from the Niederaichbach nuclear power plant and a tritium laboratory, in order to try to trap the tritium released during the melting process in a specially adapted exhaust system. The waste consisted of 13 tritium gas bottles and more than I MT of dismantled tubes, valves and housing materials. A total of about 0.6 MT of scrap with a specific activity of 100 Bq/g.was melted.
5.3.2.2 France
A recent effort in France completed as part of the European Community's research and development program on
the decommissioning of nuclear installations (1989-1993) involved the melting of ferritic steel arising from the
dismantling of the G2/G3 reactors at Marcoule in a furnace installed at the dismantling site (CEC, 1991d). This
effort involves the manufacture and installation of a 15 t electric arc heated melting furnace on the dismantling site
of the G2/G3 graphite/gas reactors at Marcoule and to decontaminate through melting about 700 MT (out of a total
of about 4,000 MT) of ferrous steel which will be continuously cast into 25 kg ingots. The steel scrap is expected
to have contamination levels on the order of 20-40 Bq/cm 2. The following assumptions have been estimated for
5-66

the activity level and mass balance of steel scrap in the proposed furnace design: 250 Bq/g maximum basic activity;
30 Bq/g maximum during melting operations; total quantity of dust particles generated during the melting process
(including graphite and refractory particles) is estimated at 10 kg per MT of steel; the slag is estimated at 10 kg per
MT of cast steel (or I %); the ventilation system is assumed to trap about 97.5 % of particulate matter, the remaining
particles will remain as fallout in the melting zone; and hot gases are cooled through a water jacket running from
the furnace through an air cooling system before the HEPA filters.
Active testing of the melter with contaminated steel was expected tor begin in early 1992. Further, in preparation
for this work, preliminary melting of contaminated scrap was carried out in an industrial furnace, involving 3.8 MT
of sections of piping from the G2/G3 reactors with a residual activity of 2.4 Bq/g. It was found that 60Co accounted
for about 95 % of the activity in the contaminated scrap metal and its distribution in the processed dust/slag/castings
was in the same proportions as the molten scrap. The remaining 5 % of the activity contained 137Cs, with about 90%
of the 137Cs found in the dust particles and 10% in the slag.
In addition to the work that is being done at Marcoule, several other research efforts have been cited in the
literature, these include:
0 It has been reported that about 30,000 Uranate transport drums, weighing about 750 MT, are decontaminated, remelted and released for unrestricted use each year in France (Chapius, 1986).
* Research has been performed at CEA/CEN Grenoble on the separation of stainless steel constituents using transport in the vapor phase (CEC, 1985).
* More than 1,500 MT of lead contaminated with < 750 Bq/g was melted with a decontamination factor up to 1,000 (IAEA, 1988).
Decontamination of tritiated metal generated in heavy water cooled/moderated reactors by melting has been practiced in France for many years. The primary purpose of this research has been tritium recovery and the melting process is only used for scrap with a tritium content of more than 37 TBq/t. The resulting ingot activity has been about 37 GBq/t (Guetat, 1986).
5.3.2.3 Japan
Japan has no practice in reuse or recycling of contaminated metals, but is conducting research in various technical
areas related to such practices (Jupiter, 1992). The principle research areas at this time are:
* A demonstration program which involves the manufacture of concrete reinforcing bars from contaminated metals for use in construction at nuclear utilities. This research is being conducted by Nippon Steel Corporation and Mitsubishi Materials Corporation.
5-67

* A demonstration program to manufacture drum liners which will be used for shielding on nuclear waste drums. This research is being conducted by Mitsubishi Materials Corporation, Nippon Steel Corporation, and Kobe Steel, Ltd.
Articles published in the literature discuss other research that has been conducted. A 1987 article in Nuclear
Technology reports research related to the melting of uranium contaminated metal (Uda, 1987). There has also been
research reported which is related to the surface decontamination of contaminated metals with ice (Oguchi, 1989).
5.3.2.4 Netherlands
The Netherlands has no practice in recycling or reuse of contaminated metals, however, it has participated as part
of the European Community's research and development program on the decommissioning of nuclear installations
(1989-1993).
Recent research efforts in the Netherlands have involved investigating the potential for the recycling of
activated/contaminated reinforcement metal in concrete (CEC, 1991e). This effort involved investigating whether
or not contaminated steel could be recycled, as aggregate or reinforcement in concrete for new nuclear installations.
Three different types of steel shapes were tested, fibres (long and short), granules and steel scrap. The
contaminated steel was melted in order to gain activity reduction and a controllable product. For contaminated
stainless steel and mild steel (mainly contaminated by 6°Co and 137 Cs), several different recipes for concrete were
evaluated utilizing different combinations of contaminated metals and shapes. Each type of concrete was tested.
versus the workability and strength standards for concrete. It is not clear how much contaminated metal, if any,
has been processed in this program.
5.3.2.5 United Kingdom
There has been no large-scale recycling of contaminated material in the UK, however, there has been some research
and experimentation of metal melting technology. In the UK, solid insoluble radioactive waste with an activity of
less than 0.4 Bq/g may be disposed of without authorization. This limit has been applied to a number of small
operations in which a few MT of material have been recycled by smelting. In one application, about 2 MT of
radioactive components were treated during 16 melts in 0.5 MT induction and 5 MT electric arc furnaces. The level
of activity in the ingots were brought below 0.37 Bq/g by diluting up to 50 times with inactive scrap and by
separation of radionuclides during melting (Gomer, 1985). The work showed that 60Co remained in the ingot and
137Cs went into the slag.
5-68

5.3.2.6 Switzerland
In Switzerland, laboratory studies have been performed to assess the behavior of 6°Co and 137 Cs during the melting
of metallic scrap from nuclear power plants (Schenker, 1985). The results have shown that during melting, the
percentages of 60Co going into the casting were about 73% in an air atmosphere and about 94% if an argon cover
was used. For 137Cs , the results showed that 95% was trapped by the crucible if air was used and 69% with argon;
most of the rest escaped as an aerosol.
5.3.2.7 Sweden
Sweden is in the process of establishing a decommissioning policy that can be used for planning and implementation
of the coming Swedish decommissioning program. As part of this activity, the National Institute for Radiation
Protection (NIRP) has encouraged a Swedish company, Studsvik Energiteknik AB, to set up a melter to develop
and test melting of low level contaminated scrap material for reuse (Bergman, 1987). It is not known how much,
if any, contaminated material has been processed to date in this program.
It has also been reported that about 1,500 MT of nuclear reactor heat exchanger tubes at 500 Bq/kg (gamma) have
been melted in Sweden for unrestricted reuse since 1982 (Swedish National Institute for Radiation Protection, 1986).
It was reported that the tubes were used for the production of ship propellers and similar items.
5.3.2.8 Italy
The Italian Regulatory Authority has criteria for exemption levels, as delineated in Appendix E, however, it does
not appear that there has been any recycling of contaminated material from nuclear facilities. Since 1983, five small
research reactors have been completely dismantled and one nuclear power plant has been authorized to perform
activities aimed at safe storage conditions, including partial dismantling of equipment. Solid materials resulting from
these decommissioning activities have been monitored for unrestricted release according to exemption guidelines
(Benassai, 1988).
5-69

6. STANDARDS FOR RECYCLE AND REUSE IN THE UNITED STATES AND WORLDWIDE
6.1 Introduction
This section presents a summary of the standards that currently are used for restricted or unrestricted release of slightly contaminated material. The standards have been identified based on reviews of technical literature and contacts with regulatory and licensee personnel. The material is organized to address dose standards for members of the public (Sections 6.2.1 and 6.2.2) and then to address specific activity standards for specific material (Section 6.2.3).
The review of this information has shown that there is variability in the nature of dose and activity standards related to the disposition of material with very low levels of radioactive contamination. Some countries such as Finland have both dose and activity standards while other countries have only one or the other. In addition, some countries have neither but have still been able to take action on specific cases by applying more generic national or international standards. Table 6-1 summarizes the status relative to dose and activity standards in the countries covered by this review.
6-1

Draft - 04111/94
Table 6-1. Summary of Dose and Activity Standards Worldwide Related to Disposition of Material with Low Levels of Contamination
Dose Standards
None
Activity Standards Nature of Cases That Have Been Handled Under Existing Standards
Standards for beta and Have handled thousands of tons of gamma contamination of material for both restricted and iron and steel that have unrestricted recycle different adtivity levels depending on the subsequent use of the material
United Kingdom
France
Italy
Japan
Finland
Canada
Australia
United States
None
None
None
None established in law although some recommendations have been made
Yes
Yes
Yes, for uranium ore contaminated material
No
None None identified
None specific to this situation, but some related ones have been used
Specific standards for low level solid waste that does not require any treatment before release
None
Yes
No
No
Regulatory Guide 1.86
Steel and concrete is recycled into the commercial sector with some restrictions. Lead is recycled only to the nuclear industry.
None identified
Investigations and demonstrations are underway related to the manufacturing of concrete reinforcing bars and waste drum liners for use in nuclear facilities
None identified
None identified
None identified
Several thousands of tons per year is recycled without restrictionsis recycled without restrictions
6-2
Country
Germany

6.2 Standards Applicable or Relevant to the Recycle or Reuse of Material
This section presents dose standards that are generic in nature (not specifically developed or recommended for use in material reuse or recycle situations) and specific in nature (ones that are specifically applicable to reuse or recycle
situations).
6.2.1 General Dose Standards
ICRP
The ICRP has published principles for radiation protection in the area of waste disposal (ICRP, 1985). In this document, the ICRP concluded that annual effective doses on the order of 100 uSv/year could be disregarded and individual actions that result in effective doses on the order of 10 uSv/year could be exempted from regulatory practice. This reduction by a factor of ten allows for the situation where an individual may be subjected to exposure from several actions and still not receive a dose greater than the 100 uSv/year standard.
IAEA
The International Atomic Energy Agency (IAEA) published a report which provided recommendations for exempting material and practices from regulatory control. The report, IAEA Safety Series 89 (IAEA, 1988), calls for the application of two principles before a practice is exempted from basis safety standards. These principles are 1) individual risk must be sufficiently low so as to not warrant regulatory concern, and 2) radiation protection including the cost of regulatory control must be optimized.
6.2.2 Dose Standards Specific for Recycle or Reuse
This section presents dose standards or recommendations that are specific for such actions or practices as the recycle or reuse of material from nuclear facilities that have very low levels of radioactive contamination.
Japan
While the Government of Japan has not proposed any standards, the Japanese Radiation Council in a 1987 report suggested a criterion for exemption of material from low level waste disposal. The criterion was an individual dose of 10 uSv/yr (1 mrem/yr). This dose level is low enough that members of the public will not be exposed to
6-3

radiation levels that exceed the I mSv/yr (100 mrem/yr) dose limit for the public, even considering multiple sources
(Oshino, 1988; Yamamoto, 1989).
Canada
The Atomic Energy Control Board (AECB) is the Canadian federal agency with'responsibility for nuclear regulation. The AECB uses 0.05 mSv/year (50 uSv/year) as a de minimis dose of radiation for individuals as a result of disposal of slightly contaminated materials. Actions are approved on the basis of this standard, but on a case-by-case basis provided that analysis shows that the radiological impact will be localized and the potential for exposure of large populations is small. In addition, the case-by-case approval is often granted as a result of the AECB working in conjunction with provincial regulatory authorities whose regulatory area may be impacted by the exemptions (Jack,
1988; AECB, 1989)
Italy
ENEA/DISP is the Italian regulatory authority that addresses disposition of very slightly contaminated material. The Advisory Committee for Radiological Protection, a consultive body of the ENEA/DISP, has approved the use of an individual dose equivalent of 10 uSv/year as the dose level below which further efforts in the optimization of dose reduction is not necessary. This dose standard is used in the development of activity standards for the release of very slightly contaminated material (Benassai, 1988).
Australia
Australia's "Code of Practice on Radiation Protection in the Mining and Milling of Radioactive Ores, 1987" has a provision that allows regulatory authorities to grant exemptions from some or all of the radiation protection requirements if they are satisfied that no employee is likely to receive an effective dose in excess of 5 uSv/year and no member of the public is likely to receive an effective dose in excess of 1 uSv/year.
Finland
The Finnish Center for Radiation and Nuclear Safety (STUK) has issued a YVL guide for the exemption of nuclear waste from regulatory control (STUK, 1992). This standard allows exemption from regulatory control if the expected radiation exposure to the maximally exposed member of the public or worker at unlicensed facilities is less than 0.01 mSv/year (10 uSv/yr) and the collective dose is less than 1 man-Sv per year.
6-4

6.2.3 Activity Standards
Commission of the European Communities (CEC)
A working party under the Group of Experts was formed on the initiative of the CEC and pursuant to Article 31 of the Euratom Treaty. The working party examined the establishment of both dose limits (individual and collective) and clearance levels (release limits). The working party decided in favor of clearance limits because of practical problems associated with dose standards. The clearance limits that were recommended (CEC, 1988) were:
1) for beta/gamma radiation; a limit of I Bq per gram averaged over a maximum mass of 1000 kg and the additional requirement that no single item exceed 10 Bq per gram,
for non-fixed contamination, a limit of 0.4 Bq per gram on accessible surfaces averaged over 300 cm 2 or over the relevant surface if it is less than 300 cm 2; for fixed contamination a limit of 1 Bq per gram.
2) for alpha radiation; a limit of 0.04 Bq per gram measured over any area of 300 cm2 of any part of
the surface.
Germany
Germany has a metal recycling program in place and there are standards that guide this program. There are standards which have been recommended by the German Radiation Protection Agency to the German Government for unrestricted release and two versions of controlled recycling (R. Neider, 1992). These are:
The unrestricted release standards for steel and iron are overall activity of less than 0.1 Bq/gram and surface contamination of less than 0.5 Bq/cm 2 for beta-gamma emitters. Each item has to comply with the standard and the surface contamination may be averaged over areas of 100 cm 2. In addition, there should be no detectable alpha contamination.
The release standard for steel and iron that is to be melted is an overall activity of less than 1 Bq/gram, surface contamination of less than 0.5 Bq/cm2 for beta-gamma emitters, and some certification that the released material is actually going into a furnace with other clean scrap.
6-5

The controlled recycling standard for iron and steel allows for the controlled melting of steel or iron which has activity greater than 1 Bq/gram or has a geometry too complicated to measure. This type of material can be melted under licensed conditions, but the material produced by this method of melting must be less than 1 Bq/gram in any case and may be released for unrestricted use only if the specific activity is less than 0.1 Bq/gram.
For all of these cases, alpha contamination is excluded. Standards for alpha contaminated material are being prepared. Similar standards for contaminated aluminum and copper are also in preparation.
Germany also has a standard for the release of scrap that has surface contamination only as a result of uranium mining and milling operations. This standard allows for the recycle of material that has surface contamination levels of less than 0.5 Bq/cm 2 as long as all the parts are destroyed so that they can not be reused and are then melted.
France
The French legislation for the disposition of material with very low levels of contamination is based largely on the Euratom Directive for basic radiation safety standards. This standard states that non-naturally occurring substances with an activity concentration of 100 Bq/g or less are exempt from the reporting and authorization requirements. While the standard was not prepared with disposal or recycling in mind, it has been used by the French as the basis for the disposal and recycling of small quantities of waste (Charles, 1992).
Italy
Radioactive wastes which decay to radioactive concentrations on the order of some hundreds of Bq/gram in time periods ranging from a few decades to a few centuries are categorized as second category waste by the Italian Directorate for Nuclear Safety and Radiation Protection in technical guide No. 26 (ENEA, 1988). This guide identifies dry solid waste which does not exceed specific radionuclide concentrations as being waste which can be disposed without any preventive conditioning. The radionuclide concentration units for solid dry waste are presented in Table 6-2.
6-6

Table 6-2. Radionuclide Concentration Limits for Disposal of Dry Solid Waste with Conditioning According to Italian ENEA Technical Guide No. 26
Radionuclide Concentration Limit
Radionuclide with half life less than 5 years 18.5 K Bq/g (500 nCi/g) Radionuclide with half life greater than 5 years 370 Bq/g (10 nCi/g) Cs-137 and Sr-90
740 Bq/g (20 nCi/g) Co-60
18.5 K Bq/g (500 nCi/g)
Finland
In addition to the dose limit identified previously, the Finnish regulatory authority has specific activity limits for material to be exempted from regulatory control (STUK, 1992). These limits are:
Total activity concentration: beta or gamma activity shall not exceed 1 Bq/gram or alpha activity shall not exceed 0. 1 Bq/gram. The activity can be averaged over 1000 kg of waste. In addition, no single item weighing less than 100 kg may contain more than 100 Bq of beta or gamma activity or 10 Bq of alpha activity.
Surface Contamination: beta or gamma surface contamination shall not exceed 4 kBq/m2 (0.4 Bq/cm 2) or alpha activity shall not exceed 400 Bq/m 2 (0.04 Bq/cm2). The measurements are to be averaged over an area of less than 0. 1 m 2
.
Japan
According to a paper by Yamamoto (Yamamoto, 1989) the Japanese laws which regulate the utilization of atomic energy and radiation, the Reactor Law and the RI Law, do not explicitly present or refer to criteria for the reuse of sites, facilities, materials, or waste. Some reuse is authorized when facilities are at the end of their life and owners present decommissioning plans which present proposed decontamination levels and disposition of material to the regulatory authorities. If the plans contain reuse or recycle proposals and if they are approved, then de facto criteria are established on a case-by-case basis.
6-7

Apart from the laws which are the basis for regulation of nuclear activities, the Japanese Nuclear Safety Commission, an advisory organ to the Japanese government, issued a report on regulatory policy for low level waste which indicated the possibility of restricted reuse of extremely low level radioactive wastes.
United States
The United States Nuclear Regulatory Commission has been using Regulatory Guide 1.86 "Termination of Operating Licenses for Nuclear Reactors," as a statement of methods and procedures considered to be acceptable by the NRC staff for reactor license termination. The guidance also identifies criteria that can be used to determine if the equipment and structures can be released for unrestricted use. Table I of this guide was not based on any individual dose objective, but rather on variations in background and lower limits of detection for survey instruments.
6-8

7. DOSE ASSESSMENT STUDIES FOR RECYCLE AND REUSE OF CONTAMINATED MATERIALS
7.1 Background
Over the last twenty years various assessments have been made, in the United States and in Europe, to quantify the potential for radiation exposure to workers and the general public from recycle of contaminated metals and other materials. The general approach for these assessments is based on formulation and evaluation of scenarios that describe hypothetical situations in which workers or members of the public might be exposed to radioactivity in recycled metals. Iron and steel have received the most attention (O'Donnel 1978, Oztunali 1984, CEC 1988, Neider 1988, Charles 1992, Deckert 1992, IAEA 1992, Kennedy 1993) followed by copper (O'Donnel 1978, Oztunali 1984, Deckert 1992, Garbay 1992) and aluminum (Bergman 1985, Deckert 1992, Garbay 1992, Kennedy 1993). A few studies have considered recycle of concrete (Charles 1992, Kennedy 1993) and glass (Oztunali 1984).
The principle difference in approach between studies done in the United States and Europe lies in their treatment of radiation dose limits. The general practice in Europe has been to compare the estimated radiation doses resulting from mandated "exemption level" concentrations of radioactivity with established de minimis doses. Exemption level concentrations are those below which unrestricted release of contaminated material is deemed to have insignificant potential for adverse impacts on public health. Concentrations below exemption levels are therefore not subject to regulation. Similarly, de minimis doses are those below which no significant potential for adverse impacts on public health is thought to exist and no regulatory control is required. The most commonly evaluated exemption level is 1 Bq/g and the most commonly used de minimis dose is 10 uSv/year (CEC 1988). Most studies conducted in the United States estimate the normalized radiation doses from unit concentrations of radioactivity without reference to either exempt levels or de minimis dose limits.
There is no generally accepted standard method for conducting dose. assessments of recycled materials. 'However, in many respects all of the key dose assessment studies are similar to one another in technical approach. This is largely due to the fact that these studies are not entirely independent. For example, many make reference to earlier work done in the United States for the U. S. Nuclear Regulatory Commission and rely on it for calculational methods and parameter values (O'Donnel 1978). In spite of these similarities in technical approach, the radiation doses estimated by these studies vary widely. This is a natural consequence of the way in which exposure scenarios are developed.
The key studies assessing recycle of contaminated materials depend on the evaluation of hypothetical exposure scenarios. Scenario-based assessments are widely used to estimate the potential risks of exposure to radioactivity
7-1

and other materials. It is characteristic of scenario-based assessments that they are very sensitive to the assumptions incorporated in their exposure scenarios. The way in which these scenarios are developed has a direct influence on how the results of each assessment are interpreted. Therefore, it is important to understand the nature and limitations of scenario-based assessments in general.
Each scenario consists of a description of the hypothetical circumstances surrounding potential human exposures. These circumstances typically include 1) the magnitude, duration, and other characteristics of the radioactive release (e.g. the source term), 2) the estimated concentrations of radioactivity resulting from transport through the environment and 3) assumptions about various elements of human behavior that control exposure to those concentrations of radioactivity. Each of these three elements is distinctly different in nature and suffers from different limitations.
The models that are used to estimate transport of radioactivity are, in part, mathematical descriptions of the physical and chemical processes in the environment. Typical transport pathways include atmospheric dispersion of airborne effluents, dispersion of liquid effluents in groundwater, and movement of radioactivity through the food chain. Recycle studies may also include models of physical transport through industrial processes that can bring radioactivity into contact with people. These processes can include scrap decontamination and handling, smelting, manufacturing, and distribution of products containing recycled materials. The transport models tend to be similar from one scenario-based study to another. The mathematical treatment of these processes tends to follow conventional approaches developed for a broad range of other assessments. In addition, because the transport models are intended to estimate concentrations of radioactivity, they are subject to confirmation by direct measurements of those concentrations. For these and other related reasons, comparison of transport models among different assessment studies often focuses on the selection of values for specific parameters in the analysis rather than on the fundamental models used.
Assumptions about human behavior surrounding potential exposures are treated quite differently from the transport models. Once the concentrations of radioactivity in the environment, the workplace, or consumer products have been estimated, evaluation of potential exposure depends on assumed patterns of behavior that vary widely depending on the purpose of the study. Often the available range of circumstances is so wide as to allow for any level of exposure from negligible to extreme. One common approach is to attempt description of a "bounding" scenario in which potential exposure is maximized even though the combination of circumstances described may be unusual or improbable. Another approach is to develop a suite of "typical" scenarios that address a range of possible exposures. In either case, the results of the analysis often depend more on the choice of scenario than on the numerical value of any particular parameter in the calculation. Therefore, comparisons between studies should focus on the stated purpose for the analysis and the scenario descriptions used.
7-2

As a consequence of this dependence on the specific scenario and parameters used, comparison of dose estimates
across studies requires some care. Accounting for differences between studies can be complicated and often requires
more detailed information than is available in the open literature. Some studies are sufficiently well documented,
with all equations and parameter values provided, so that individual dose calculations can be checked
(O'Donnel 1978, Kennedy 1992, Charles 1993). In these cases, differences between scenarios can be evaluated and
the consequences of different assumptions can be evaluated. Other publications provide only summary results and
brief descriptions of scenarios that are not a sufficient basis for detailed comparison with other studies. With this
caution in mind, the following sections review eleven key dose assessment studies for recycle of radioactively
contaminated materials.
7.2 Synopsis of Selected Dose Assessment Studies
There is a broad literature on the use of scenario-based dose assessments for a variety of applications such as
operation of nuclear facilities, evaluation of accidental releases of radiation, and radioactive waste treatment and
disposal. This review focuses on only the much smaller number of studies that specifically address the recycle or
reuse of radioactively contaminated materials. Eleven key dose assessment studies are described here, numbered
from I to 11. These numbers are also used to refer to each study in the tables that follow. Each synopsis provides
a reference citation, describes the purpose of the study, the recycled materials it treats, and the radionuclides
considered. A tabular summary of these studies is presented in Table 7-1.
1. Bergman, C., R. Boge, "Collective Doses from Recycling of Contaminated Scrap Metal", National Institute of Radiation Protection, Sweden, 1985.
The purpose of this document was to present a summary of collective doses calculated during an actual recycling
event that occurred in Sweden. The event was at Ringhals 1, a 750 MW(e) BWR-reactor, where the aluminum
brass alloy turbine condenser tubes were replaced by titanium tubes in 1981. At the time of replacement, the
condenser had been in service for seven years. Thirty five tons of metal were ultimately recycled. Twenty one
radionuclides were considered. This document only calculated doses for occupational and public exposure during
the recycling process. The recycled metal was to be used in manufacturing ships propellers. Only inhalation and
direct external exposures were considered.
This document went through the recycling process step-by-step and stated what type of exposure would be critical
and what the collective dose (occupational and public) would be in each step. A contamination level of
approximately 100 Bq/kg, based on the dose-rate measurements taken at the time of replacement. The results are
not given in a table format, only in the text.
7-3

Table 7-1. Summary of Selected Dose Assessment Studies
Doc Material Reuse Radionuclides Scenarios Calculated No. Recycled (Y/N) Considered
1 Fe
2 Fe
3 Fe, concrete
4 Fe, AI, Cu
5 A], Cu
6 Fe
7 None
8 Fe, AI, and concrete
9 Fe
10 Fe, Cu
11 Fe, Cu, glass steel
N
Y
N
Y
N
Y
Y (land)
Y
Y
N
N
21 listed
a, t3, 7
45 listed
non-a (Co-60) a (Pu-239)
9 listed
56 listed
over 200 (including decay chains)
16 listed
a, 0, 7'
27 listed
85 listed
Occupational: handling, transport, smelting (collective doses)
Qccupational: scrap piles, repair Public: furniture, cars, slag in concrete Doses: individual and collective
Occupational: smelting, transportation, fabrication Public: smelting, furniture, cars, residential construction Doses: individual and collective
Occupational: scrap yard, transport, foundry and production Public: products > 1000 kg, and <1000 kg
Occupational: storage, refining, manufacture Public: use of products, copper IUD, slag
Public: landfill, incineration, recycle and reuse
Occupational: building renovation Public: building (office) occupancy, drinking water, residential use of land
* No doses calculated
Occupational: 7 scenarios Public: 6 scenarios Doses: individual and collective
Public - waste disposal
Occupational: scrap yard, smelter Public: smelters, slag, frying pans, plumbing
Occupational: smelter workers (individual dose) Public: "All persons in a recycle pathway"
(collective dose)
7-4

2. RADIATION PROTECTION No. 43, "Radiological Protection for the Recycling of Materials from the Dismantling of Nuclear Installations", Commission of European Communities, Luxembourg, November, 1988.
The purpose of this document is to recommend criteria for the recycle and reuse of materials from nuclear facilities.
This document specifically discussed steel, but it can also be applied to copper and aluminum. The radionuclides
that are addressed are those which are known to be present in nuclear installations. The scenarios discussed were
occupational and public. The occupational scenarios involved the workers in the recycle process, while the public
scenarios involved the consumer use of products or exposure to large structures with contaminated recycled material
(i.e., reinforcements in buildings, or slag in concrete).
These scenarios were chosen based on conservative assumptions which allow for the normal uses of steel products.
The calculations were made based on the following clearance levels: I Bq/g for 1000 kg or 0.4 Bq/cm2 over 300
cm 2 for 0/1y and 0.04 Bq/cm2 over 300 cm 2 for a-contaminated materials.
The values of the parameters used were based on realistic data from the steel industry, as much as possible. When
the values varied greatly, the value that resulted in the highest dose was chosen. While the models used were very
simplified, the scenarios are described in detail (e.g., the time it takes for a pump repair and the average distance
to the worker). The equations used, as well as the parameter values were listed. Both individual and collective
doses were calculated for the scenarios. The collective dose of the ultimate disposal of the recycled steel and
aluminum was also calculated. This document gives doses for each scenario and for each radionuclide as well as
total doses.
3. Charles, D. and G. M. Smith, Waste Management Study for Large Volumes of Very Low Level Waste from Decommissioning of Nuclear Installations, Intera Information Technologies, December 1992.
The purpose of this study was to examine the available waste management options for very low level radioactive
waste from decommissioning of nuclear power stations in the CEC. The report characterized the waste streams of
interest; described the waste management options of unrestricted release, recycling/reuse, and disposal as radioactive
waste. The materials considered for recycling were steel and concrete. Individual and collective doses were
calculated for both occupational and product consumer scenarios. Occupational scenarios included smelter,
manufacturing, and transportation workers. Product consumer scenarios included users of steel furniture and
automobiles made from recycled steel and residents of buildings constructed from recycled concrete and steel
products. To evaluate: the effects of radioactive decay, sets of scenarios in each category were calculated for
materials used at different times following reactor shut down.
Results were presented for only those radionuclides giving the largest proportion of the dose for each scenario.
However, all equations were provided and data were given for all radionuclides. The results for the unreported
7-5

nuclides could, in principle, be calculated using the information provided. The equations and parameter values used
were derived largely from CEC Report No. 43 (CEC 1988).
4. Deckert, Ah., R. Graf, and R. G6rtz, "Radiation Exposure to the General Public from Reclaimed Metals Out of Nuclear Facilities", Proceedings of the Symposium on Waste Management, Vol. 2, pp 1809-1814, Tucson, AZ, March 1-5, 1992.
The purpose of this article was to present a systematic method for studying the radiological consequences of
releasing slightly activated or contaminated metallic material from a control zone. The following materials were
addressed in this article: ferrous metals, aluminum, and copper from operation and decommissioning of LWR
nuclear power facilities. Radiation dose from individual radionuclides was not addressed. Two mixtures of
radionuclides were discussed, non a-contaminated (primarily Co-60) and a-contaminated (primarily Pu-239). Two
exposed groups were discussed; process workers and product users. -The process workers scenarios involved the
actual process of recycling the material. Two different sets of scenarios involved the public; exposure to steel
products under 1000 kg and products over 1000 kg.
Deckert used a stochastic (Monte Carlo) approach to estimate concentrations of radioactivity in recycled steel. The
equations and basic parameters for exposure to these concentrations were deterministic (non-stochastic) and were
taken from O'Donnell, 1978. Exemption limits of 0.5 Bq/100 cm2 and 1.0 Bq/g were assumed. The resulting
doses are compared to the de minimis dose of 10 uSv/yr. The published documentation is insufficient to duplicate
the analysis. However, Deckert discussed the different factors which should be considered when developing a.
scenario, such as inhalation of foundry exhaust by the workers and the public and ingestion from normal wear of
a frying pan.
Rather than providing a comprehensive list of radiation dose for many radionuclides, this article only gives examples
of exposures calculated. For example, it lists the average individual dose from 200 simulations of exposure to
recycled steel containing no alpha emitters as 13 uSv/yr and the 99th perceritile dose as 69 uSv/yr.
5. Garbay, H., A.M. Chapuis, "Radiological Impact of Very Slightly Radioactive Copper and Aluminum Recovered from Dismantled Nuclear Installations", Commission of European Communities, Luxembourg, 1992.
The purpose of this document was to define the derived applicable limits by studying the radiological impact of
copper and aluminum recycling in terms of individual risk. This document addressed copper and aluminum
recovered from French PWR's. The radionuclides considered were: Fe-55, Co-60, Ni-63, Sr-90, Ru-106. Ag
1 Oim, Cs-137, Pu-238, and Pu-239. The authors calculate exposures to workers, consumers, and the general
public. Several commercial products using recycled copper were addressed. The dose limiting scenario was use
7-6

of an interuterine device (IUD) made out of recycled copper. The exposures calculated are for external and
ingestion for the consumer and inhalation during the recycling process for the general public. Occupational
exposures included inhalation and external.
This document calculated concentrations limits resulting in a dose of 10 uSvlyr. The scenarios are briefly
described but no details on the modeling approach are given. The equations and parameter values for different
generic exposure scenarios are also given. The distribution of radionuclides during copper and aluminum scrap
smelting (maximum fractions) are given. The doses are given in several different forms (tables).
6. IAEA, "Exemption from Regulatory Control -- Recommended Unconditionally Exempt Levels for Radionuclides in Solid Materials", Draft Working Document, November 1992.
The purpose of this document was to recommend a set of exempt levels which apply to solid materials regardless
of how they are to be used after control has been relinquished. The approach taken in this study is unique.
Rather than conducting new assessment calculations, this document summarizes other studies on the recycle and
reuse of slightly contaminated metals. It lists contamination levels resulting in an individual dose level of 10
uSv/a calculated in the dose-limiting scenario from each of the other studies, but does not describe the
calculational methods or the details of the scenarios. Rather, it uses the results for comparative purposes against a
set of exempt levels calculated on the radiological characteristics of each radionuclide. The studies summarized in
this report address contamination levels for landfill disposal, incineration, recycle of steel, and direct reuse of
tools and buildings. The following references, which dealt with recycle and reuse, were summarized:
A. International Atomic Energy Agency, Draft Working Document on the Application of Exemption
Principles to Recycle of Materials from Nuclear Facilities, IAEA, Vienna, 1991. (Reference No. 8
listed above)
B. Commission of the European Communities, Radiological Protection Criteria for the Recycling of
Materials from the Dismantling of Nuclear Installations, Radiation Protection No. 43, CEC,
Luxembourg, 1988. (Reference No. 2 listed above)
C. Elert, M., Wiborgh, M. and Bengtsson, A., "Basis for Criteria for Exemption of Decommissioning
Waste", Kemakta Ar 91-26, Kemakta Konsult AB, Stockholm, Sweden, 1992.
D. Garbay, H., Chapuis, A.M., Cahuzac, 0., Guetat, P., Haristoy, D., Renaud, P., "Impact Radiologique,
dfi au cuivre et A I'aluminium tr~s faiblement radioactifs provenant du d6mant~lement 'installations
nucl6aires, EUR 13160FR, Commission of the European Communities, Luxembourg, 1991. (An earlier
version of reference No. 5 listed above)
7-7
Draft - 04/11)94
F. Guetat, P., Chapuis, A., Renaud, P., "Disposal of Very Low Radioactive Wastes (VLRW) in Conventional Industry. The Case of Landfill for Municipal or Industrial Refuse"* Joint Int. Symp. on Environmental Consequences of Hazardous Waste Disposal, Stockholm, Sweden, May 27-31, 1991.
7. Kennedy, W.E., and D.L. Strenge, "Residual Radioactive Contamination from Decommissioning: Volume I, Technical Basis for Translating Contamination Levels to Annual Total Effective Dose Equivalent", September, 1992, NUREG/CR-5512.
The purpose of this report was to provide gepieric and site-specific dose conversion factors for residual radioactivity.
No recycled materials were considered, only the reuse of land and structures was discussed. However, this study
is key to the assessment of recycling for three reasons. First, the issue of residual radioactivity from
decommissioning is closely related to the recycling of materials from decommissioning. Second, it presents a
comprehensively documented methodological approach which can be broadly applied to recycling assessments.
Finally, this study provides a basis for comparing disposal of decommissioning waste as the primary waste
management alternative to recycling.
Over 200 radionuclides, including decay chains, were addressed in four scenarios: Residual contamination in
buildings, building renovation activities and normal building occupancy; and unrestricted use of land, drinking water
(only) scenario and residential use of land. The major exposure pathways, direct exposure, inhalation, and
ingestion, were included for each scenario.
The authors of this report took a generic modeling approach to estimating doses from residual radioactivity in
buildings and land. Input parameters for each exposure pathway and scenario were selected to provide a prudently
conservative estimate of the potential radiation dose to a member of a given populationgroup. That is, the derived
estimates may be overestimates, but they would not be "worst case'. Each scenario was described in detail and
listed the equations used. Volume I does not give actual dosimetric results for the given scenarios. Volume 2 of
this report will contain the user's guide for the computer code under development for the implementation of the
models in Volume 1. Volume 3 will contain a sensitivity analysis of parameters used in the modeling, and a
comparison with previously used guidance such as NRC Regulatory Guide 1.86.
8. Kennedy, W.L., F.R. O'Donnell, and G. Linsley, "Exemption Principles Applied to the Recycle and Reuse to Materials of Nuclear Facilities" (Draft), IAEA, publication anticipated in 1993.
The purpose of this study was to "illustrate a methodology that can be used by national Authorities to develop
practical radiological criteria for exemption by recycle and reuse." Recycled materials addressed in this study were
aluminum, steel, and concrete from pressurized water reactors. Equipment reuse scenarios addressed tools and
7-8

and buildings with surface contamination. Bulk or volume contamination typical of activation products was not
treated. Sixteen radionuclides were considered: (CI-36, Ca-41, Mn-54, Fe-55, Co-60, Ni-63, Zn-65, Sr-90, Nb
94, Ic-99, Cs-137, Eu-152, U-238, Pu-239, Pu-241, Am-241). Occupational doses were calculated for external,
inhalation, and ingestion. Public doses were calculated for external and ingestion pathways. The occupational
exposures were calculated only during the recycling process, and the public doses were estimated only for use of
the resulting products. The public doses from recycle processes such as exhaust from the foundry were not
calculated. Individual and collective doses were calculated for both occupational and public.
The calculations were based on an assumed activity of I Bq/g of each nuclide for specific activity and 1 Bq/cm2
for surface activity. This document provides a detailed description of the type of workers exposed and the
different exposures to the public. It also listed the assumptions used in calculating the doses (i.e., the amount
initially recycled, the consumer products useful lifetime, and the amount that is again recycled). This document
also provides the individual and collective doses for each radionuclide, each scenario (public and occupational),
each recycle step, and each exposure mode (inhalation, ingestion, external). It also states the limiting exposure
mode for each radionuclide (i.e., recycle step, scenario, exposure pathway).
9. Neider, R. et al, "Criteria and Conditions for the Unrestricted Release of Materials from
Decommissioned Nuclear Facilities", Proceedings of an International Conference on Radiation Protection
in Nuclear Energy, Sidney, Australia, April 18-22, 1988.
This article states the criteria for unrestricted release of materials from decommissioned nuclear facilities. The
materials addressed by Neider are steel and iron. The radioactive contaminants considered were classed as a-, f3-,
or y-emitters but no specific radionuclides were given. No specific scenarios were discussed. Neider described
several different environmental transport pathways associated with waste disposal. Neider used a stochastic model
for physical transport through industrial processes that can transfer contamination to consumer products.
The following exemption limits were assumed: 1 Bq/g for 1000 kg or 0.4 Bq/cm 2 over 300 cm2 for [/y and
0.04 Bq/cm2 over 300 cm 2 for a-contaminated materials. There was no documentation provided for the dose
calculations.
10. O'Donnell, F.R. et al, "Potential Radiation Dose to Man from Recycle of Metals Reclaimed from a Decommissioned Nuclear Power Plant", U.S. Nuclear Regulatory Commission, NUREG/CR-0134, 1978.
7-9

This is among the earliest comprehensive dose assessments for recycled metals and has provided the technical
approach for several subsequent studies. The purpose of this report was to present a "generic methodology for
estimating radiation doses to individuals and to population groups from recycling radioactively contaminated scrap
metals that may be reclaimed from decommissioned nuclear power plants, or any other nuclear facility."
O'Donnell demonstrated the methodology by using a hypothetical problem. This report addressed the recycle of
ferrous metals and copper. Twenty seven radionuclides which are characteristic of nuclear power plant
inventories were considered for both, occupational and public scenarios. The occupational scenarios included
doses received by the workers during the recycle process. The public scenarios included the use of products by
consumers as well as the dose to the members of the public who live near smelters or are exposed to slag. The
exposure pathways considered are external and internal (ingestion and inhalation).
The scenarios were based on detailed time and distance descriptions of industrial processes. In the frying pan
manufacture scenario, for example, the number of hours spent by a foundry worker at specified distances from the
pans at each step of fabrication were included in the analysis. The exemption limit of 10 pCi/g was assumed, to
be consistent with Reg. Guide 1.86. The key equations and parameter values are given for the generic scenarios.
The dose calculations were done using a modified version of the CONDOS code. Dose conversion factors were
given for each of the 27 radionuclides.
11. Oztunali, 0.1., and G.W. Roles, "De Minimis Waste Impacts Analysis Methodology", US NRC, NUREG/CR-3585, February, 1984.
This report presents a methodology for calculating exposures to individuals and populations resulting from the
recycle of the metal or glass component of de minimis waste. The materials addressed were glass, copper,
stainless steel, and bulk iron. Eighty five radionuclides were considered and both occupational and public
scenarios were addressed. In this report, the term "public" refers to "all persons in the recycle pathway
(population)". This report referred to O'Donnell 1978 for the description of the scenarios. The exemption limits
assumed were: 10 pCi/g for most, 2 pCi/g for Sr-90, and 0.2 pCi/g for Pu-239, Am-241. The equations used
and the parameter values for the highest dose scenario are given.
7.3 Discussion
Even though the potential for radiation exposure from recycled materials has been evaluated by several
independent investigators over the last twenty years, there is no comprehensive study that addresses all the
materials of concern or all the major categories of relevant exposure scenarios in a consistent manner. Taken
7-10

together, the eleven key studies reviewed here represent a broad coverage of the materials and scenarios of
interest. However, because of the inherent difficulties in comparing differently formulated scenarios, the results
of these studies can not easily be combined to give a comprehensive evaluation.
Evaluation of the literature on dose assessment studies depends strongly on the scenarios included in these
assessments. Typical scenarios address some combination of individual and collective doses to workers, product
consumers, and members of the general public. These scenarios fall into two general groups, depending on
whether they emphasize the industrial process of recycling contaminated materials or the end use of products
containing radioactivity. Tables 7-2 through 7-4 indicate which types of scenarios have been evaluated in the
eleven selected studies for iron and steel, copper, and aluminum. It is clear from these tables that no single
assessment has covered all the scenarios of interest in a consistent way for even these four metals. Even when
taken together, the available assessments do not allow easy comparison of potential radiation doses for different
metals and different radionuclides.
.The draft working document of the IAEA (reference 6), for example, includes comparisons of results from
several assessment studies. These include studies of incineration, landfill disposal, and recycling for as many as
56 radionuclides. The differences among these studies were such that no directly comparable scenarios were
identified. Rather, the approach was to compare the limiting, or highest dose, scenario from each study for each
radionuclide. Even this approach required careful reading of the assessments under comparison so that some
available assessment studies were set aside because of obvious biases in the results. Even with these precautions,
dose estimates range over several orders of magnitude. Explaining the differences in these results requires a
detailed examination of scenario assumptions and parameter values, making it very difficult to formulate general
conclusions.
Occupational scenarios are typically formulated to evaluate potential radiation doses to workers at various steps in
the recycling process. Each investigator made different assumptions about the recycling industry and identified
different occupational activities to characterize the potential radiation hazards to workers. In those studies where
collective dose to workers is evaluated, there was no general agreement in estimates of the affected population of
workers.
Consumer exposure scenarios vary even more widely than those for workers. They range from evaluation of
close physical contact by individuals with recycled metals to remote and incidental exposure by populations of
consumers. One end of this spectrum is exemplified by scenarios such as the hypothetical copper interuterine
device (IUD) considered in Garbay, 1992. The other extreme includes such scenarios as exposure to
7-11

contaminated steel used in reinforcing bars for roadways and bridges considered in Charles, 1992.
Doses to the general public are'usually based on projected exposure to effluent releases associated with the recycle
process or product use. Scenarios addressing these doses typically include exposure to atmospheric effluents from
industrial processes, such as smelting, or external radiation from transportation and distribution of contaminated
consumer products. Disposal of industrial by-products, such as smelter slag, also provide the basis for estimates
of dose to the public. Public dose scenarios show the greatest apparent consistency among the different studies
reviewed. However, attempts to compare dose estimates among studies have shown that even fairly conventional
scenarios, such as landfill disposal, show a very wide range of estimated doses.
7-12

Table 7-2. Assessment Scenarios Treated in Reviewed Studies: Iron and Steel
Product Use Recycle Process Inhalation Ingestion External [ Inhalation Ingestion External
Individual Dose
Worker 2,3,4,6, 2,3,4,6, 2,3,4,6, 8,10,11 8,10,11 8,10,11
Consumer 4,10,11 4,8,10,11 2,3,4,8,10,11 Public 4,10,11 4,10,11 2,3,4,8,10,11 3,6,9 3,6,9 3,6,9
Collective Dose
Worker 2,8 2,8 .2,8
Consumer 8 2,8
Public 2,8
Table 7-3. Assessment Scenarios Treated in Reviewed Studies: Aluminum
Product Use Recycle Process
Inhalation Ingestion External [ Inhalation Ingestion External
Individual Dose
Worker 4,8 4,8 4,8 Consumer 4 4,8 4,8
Public 4 4 4,8
Collective Dose Worker 1,5,8 8 1,5,8
Consumer 5,8 5,8 Public 5 5,8 1,5 1
Table 7-4. Assessment Scenarios Treated in Reviewed Studies: Copper
Product Use Recycle Process
•Inhalation Ingestion External Inhalation Ingestion External
Individual Dose Worker 1,10,11 1,10,11 1,10,11
Consumer 1,10,11 1,10,11 1,10,11
Public 1,10,11 1,10,11 1,10,11
Collective Dose
Worker 5 5 Consumer 5 5
Public 5 5 5
7-13

The wide range of numerical results from different assessments is illustrated by the data presented in Table 7-5
adapted from IAEA, 1992. The values in the table are nuclide-specific exemption levels, corresponding to an
individual dose of 10 uSv/year, derived from the limiting scenarios of several different studies. Calculated
exemption levels for Co-60 are a useful example since Co-60 is often a major dose contributor in consumer product
scenarios. The values in Table F-5 for Co-60 range from I x 10-2 to 5 x 100 Bq/g. In comparison, the nearest
corresponding value from Charles, 1992 would suggest an exemption level for Co-60 of 2 x 10² Bq/g.
While there are difficulties in comparing the numerical results from these studies, there are some broad
generalizations that can be drawn from them. For example, the estimated doses from the use of contaminated metals
in consumer items are dominated by external exposure from gamma-emitting radionuclides. Further, the gamma
emitters of greatest concern are those that are the most difficult to separate from metals during the smelting process.
Thus, radionuclides such as Co-60, Cs-134, and Cs-137 generally result in the highest estimated doses for these
scenarios. While most scenarios for doses to workers show similar large contributions from external exposure to
gamma-emitters, inhalation dose to workers can be significant under some sets of assumptions. This is particularly
true if alpha-emitting transuranics are assumed to be present during the smelting and manufacturing processes. In
contrast, an entirely separate set of radionuclides and exposure pathways tends to dominate dose estimates for
landfill disposal of these contaminated materials. Ingestion dose generally becomes the most important pathway and
the radionuclides of interest include the long-lived, environmentally mobile radionuclides such as Ni-63.
The scenarios that lead to the largest projected collective doses are those where contaminated material is widely
distributed in the population. Consumer use of recycled steel, for example, generally results in higher dose
estimates than transportation of products containing recycled steel.
Finally, there appears to be a consensus among all the studies reviewed here regarding the significance of the
potential radiation doses from recycling contaminated materials. All estimates of radiation doses to the public are
quite small and are arguably insignificant as a public health concern. In particular, the proposed European
exemption levels of 1 Bq/g seem to ensure annual doses of less than 10 uSv/yr. None of these studies indicate the
potential for large radiation doses that would present a significant threat to the public health.
7-14

Table 7-5. Summary of Results of Studies on Exemption Levels for Recycleab (Bq.g)-'
Steel Alumninum Copper Concrete All Materials
Elert et (larbay et Garbay et Elert et I AEA CEC a]. IAEA al. al. IAEA Haristoy al. G3uetat
Radionuclides (1991ard (1988)P (1991) (1991 ar (1991)C (1991) (1991ard(? (1991) (1991)
H-3 5 x10⁻² 7 x10'
C-14 3___ x___ 310' 2 x10'
Na-22 Ilx lop
Na-24 5 x 10"'
P-32 7 x1W
S-35 ______ __2 x 10'
CI-36 I x10-1 2 x10²
Ca-45 7 x 16' 7 x10'
Cr-5I 7 x 10'
Mn-54 4 x10~' I x t0 8 x to, lx tl 2 x10' 6 x1W I 1x id 4 x10² 2 xtCP
Fe-55 I x104 2 x1W 2 x W I t)2 xx0 Wx0 2 x 10 2 x1W 2 x10' 2 x1W
Fe-59 2 x ICP
Co-57 2 x 10'
Co-58 3 x P 3 x10⁻² 2 x UP
Co-60 I xlto- 2 xUP Ix t- 3 x10-' 5 x HP 2 x10' 3 x10-' lx iP I X10-2 1 x tP
Ni-63 2 x10' 2 x1' 2 x IW 4 x10' 1 x10 4 x1NO 1x t05 1x1 1CP Ix to
Zn-65 6 x10-' 2 x lP 2 x E 3 x10' 8 x to 2 x IP 5 x10² 3 x10H
Sr-89 ______ _____ _____ I x 103
Sr-90 5 x10' 4 x10' 2 x I' 2 x10" 8 x W 3 xlW 3 xlW 2 x 16 2x 10 2 x 10
Y-90 5___ x___ 510-' 3 x 10
Nb-9 .4 2 x HY 2 .x l0" 5 x t- 7 x UP 2 x10' 2 xl1- 2 1 x CP
Tc-99m ___________2 x 10'
Tc-99 7 x IW 3 x 1W 2 x10⁴ 5 x C 5 x10-' 6 x10'
Ru- 106 1 x If 4 x10' 6 x1W 2 x10⁻² 1 xlto
S.-. Urn

Table 7-5. Summary of Results of Studies on Exemption Levels for Recyclea.b (Continued) (Bq.g)"'
Steel Aluminum Copper Concrete All Materials
Elert et Garbay et Garbay et Elert et 1AEA CEC al. 1AEA al. al. IAEA Haristoy al. Guetat
Radionuclides (1991a)d (1988). (1991) (1991a)d (1991)C (1991)Y (1991a)d (?) (1991) (1991)
Ag-Il0m 6 x I0 2 x 10' 1 x I0°
Cd-109 3 x 10²
In-Ill 6 x 10°
1-123 2 x 10'
1-125 2 x 10² 1-129 8 x 10⁴ 2 x 10²
1-131 6 x 10"
Sb-124 1 x 10²
Cs-134 5 x 1 0 2 x 10 0 l x I01 3 x 10' 2 x 10⁻² 1 x 10
Cs-137 5 x 10'1 8x 10 ° 5x 10U 1 x 10 ° 2x 10' 9x 10, 1 x 10P 6x 10² 3x 10⁻² 3 x 10 °
Ce-144 2 x 10²¹ 3 x 10'
Pm-147 2 x 10² 1610 2 1x10
Eu-152 4x10-' 1 x 10 1 x 10 5x101 x x1 02 3x I0 3x 10² 2x 10H
Eu-192 3 x 10²
Au-198 6 x 10² TI-201 3 x 10'
Pb-210 7 x.10-'
Po-2 10 5 x 10°
Th-228 1 x 10⁻¹
Th-230 1 x la'
Th-232 I x 10.2
Ra-226 2 x IC0 1 x 10 °
Ra-228 2 x I0°
(1-234 5 x 10' 7 x 10² 3 x 10-'
0~'

Table 7-5. Summary of Results of Studies on Exemption Levels for Recyclei'b (Continued) (Bq.g)"1
Steel Aluminum Copper Concrete All Materials
Elert et Garbay et Garbay et Elert et I AEA CEC ad. IAEA al. al. IAEA Haristoy al. Guetat
Radionuclides (1991a)d (1988)r (1991) (1991a)d (1991)0 (1991)c (1991a)d (?) (1991) (1991)
U-235 3 x 10' 7 x 1H 3 x 10T'
U-238 I x (10 5x l0° 5x101 7x 10° 3 x 10° I x 10° 4x 10-'
Np-237 I x l01 2 x 1H I x 10
Pu-239 3 x I0T" 1 Ix I0- 1x 10⁻² 1 x l0P I x l01 2 x UP I x i1, 9 x IT- IxX 10-1
Pu-240 I x 10.2 3 x 1l' 9 x IT. I x I0T
Pu-241 IxltO 6x10T' 7x10' 5x101 5x10IT 4x UP
Am-241 3 x 10"' I x I0T I x lT 2 I x 10 1x l01 2 x HP I x id) 3 x lI' 9 x 10-3 x 10-,
Cm-244 2 x lItT 2 x 10⁻² 2 x l0' 3 x I0° '2 x 10⁻² 2 x 10⁻¹
The values listed from each of the studies are the most limiting from the various exposure scenarios considered. Except where noted, values are based on an individual dose level of lOuSv.a. Based on an individual dose criterion of lOuSv.a for exposures of large groups of people and 50uSv.a for relatively small groups of
individuals. Base case results - dilution and partitioning not included. Includes a dilution fictor of 10.
a. b. C.
d. e.

8. REFERENCES
Abel, K.H., et. al.; Residual Radionuclide Contamination Within and Around Commercial Nuclear Power Plants; Pacific Northwest Laboratory; NUREG/CR-4289; February, 1986.
AECB; Radiation Protection Requisites for the Exemption of Certain Radioactive Materials from Further Licensing upon Transferral for Disposal, Regulatory Document F-85, 1989.
Aluminum Association, Aluminum Recycling Casebook, December 1985.
Aluminum Association, Aluminum Annual Statistical Review for 1991, 1992.
American Iron and Steel Institute (AISI), 1990 Annual Statistical Report, August, 1991.
American Metal Market (AMM), American Metal Market Annual Report, 1987.
Battelle Memorial Institute, A Study to Identify Opportunities for Increased Solid Waste Utilization, US Environmental Protection Agency, Table B-I, 1972.
Benassai, S., et. al., "Criteria Governing the Exemption Rules of Radioactive Materials From Regulatory Control in Italy," presented at the Workshop on Rules for Exemption from Regulatory Control, published asNUREG/CP-0 101, held at the Pan American Health Organization, October 17-19, 1988.
Bergman, C., et. al., "Decommissioning Policy in Sweden," presented at the 1987 International Decommissioning Symposium, Pittsburgh, PA, CONF-871018-Vol. 1., October 4-8, 1987.
Bergman, C., R. Boge, Collective Doses from Recycling of Contaminated Scrap Metal, National Institute of Radiation Protection, Sweden, 1985.
Brennecke, P. and D. Rittscher, "Conditioning and Disposal of Decommissioning Wastes"; Kerntechnik 56 (1991) No. 6; 1991.
Brown, R., US Bureau of Mines, Iron and Steel Scrap Annual Report, 1990, April 1992.
Bryan, R.H., and I.T. Dudley; Estimated Quantities of Materials in a 1000 MW(e) PWR Power Plant, ORNL-TM4515; Oak Ridge National Laboratory; Oak Ridge, Tennessee; June, 1974.
Carder, B., Telephone conversation between B. Puglia of SAIC and B. Carder of SEG, February 23, 1993.
Carrillo, F.V., Hibpshman, M.H., and Rosenkranz, R.D., Recovery of Secondary Copper and Zinc in the United States, US Bureau of Mines, IC 8622, p.58, 1974.
Catherine C. Stanton & Associates, Inc., Technical Information Related to Operating Alternatives Under the Northeast Compact Commission Regional Management Plan, July 1988.
Chapius, A.M., et. al., "How to Decrease Doses due to Radioactive Metal Recycling," presented at a workshop on Melting and Recycling of Radioactive Materials from Decommissioning of Nuclear Installations, Karlsruhe, Commission of the European Communities, May 27-28, 1986.
Charles, D. and G.M. Smith; Waste Management Study for Large Volumes of Very Low Level Waste from Decommissioning of Nuclear Installations; report prepared by Intera Information Technologies for CEC, IE2713-5, Version 2; Oxfordshire, U.K.; December, 1992.
8-1

Commission of the European Communities (CEC) - Nuclear Science and Technology, The Community's Research and Development Program on the Decommissioning of Nuclear Installations (1989-93), First Annual Progress Report, EUR 10740 EN, 1985.
Commission of the European Communities (CEC); Radiation Protection No. 43, Radiological Protection Criteria for the Recycling of Materials From the Dismantling of Nuclear Installations, Recommendations from the Group of Experts set up under terms of Article 31 of the Euratom Treaty, Luxembourg, November 1988.
Commission of the European Communities (CEC) - Nuclear Science and Technology, The Community's Research and Development Program on the Decommissioning of Nuclear Installations (1989-93), Annual Progress Report, EUR 14498 EN, 1991.
Copper Development Association, Annual Data, 1992 - Copper Supply and Consumption, 1992.
Dalosio, G.S. and C.P. Deltete; Below Regulatory Concern Owners Group: Evaluation of Candidate Waste Types, Revision 1, NP-5670, Electric Power Research Institute, Palo Alto, California, March 1989.
Davies, I.L., C.C. Fleischer, and A.A. Paton, "Developing Techniques for Removing Activated Concrete"; Nuclear Engineering International; March 1987.
Deckert, A., R. Graf, R. Gortz, "Radiation Exposure to the General Public from Reclaimed Metals Out of Nuclear Facilities," Proceedings of the Symposium on Waste Management, Vol. 2, pp. 1809-1814, Tucson, AZ, March 1-5, 1992.
Eickelpash, N., W. Stang, H. Steiner, "Waste Minimization and Scrap Recycling During Decommissioning Work of the KRB Nuclear Power Plant, Unit A," Proceedings of Spectrum '92 Nuclear and Hazardous Waste Management, p. 1505 - 1508, Boise Idaho, August 23-27, 1992.
Eikelpasch, N., Lasch, M., "Electrochemical Decontamination Experience at the Gundremmingen Power Plant," International Conference on Water Chemistry of Nuclear Reactor Systems, Bournemouth, UK, October 17-21, 1983.
Elder, H.K. and D.E. Blahnik; Technology, Safety and Costs of Decommissioning a Reference Uranium Fuel Fabrication Plant, Pacific Northwest Laboratory, NUREG/CR-1266, October 1980.
Energy Information Administration (EIA); Commercial Nuclear Power 1991, U.S. Department ofEnergy, Washington D.C., DOE/EIA-0438(91), August, 1991.
Feraday, M.A., "The International Atomic Energy Agency's Program on Decontamination and Decommissioning;" Nuclear Technology, Vol. 86, Aug. 1989; February 1989.
Garbay, H. and A.M. Chapuis, Radiological Impact of Very Slightly Radioactive Copper and Aluminum Recovered from Dismantled Nuclear Installations, Commission of European Communities, Luxembourg, 1992.
Gershey, E.L., et. al., Low-Level Radioactive Waste, From Cradle to Grave, Van Nostrand Reinhold, New York, NY, 1990.
Gomer, C.R., Lambley, J.T., Melting of Contaminated Steel Scrap Arising from the Dismantling of Nuclear Power Plants, Report EUR-10188, CEC, Brussels, 1985.
Graves, P., Telephone conversation between B. Puglia of SAIC and P. Graves of QUADREX, January 4, 1993.
8-2

Guetat, P., "Fusion Wastes: Technical and Radiological Aspects. Consequences for NET and FCTR Waste Management," IAEA Technical Committee Meeting on the Safety of Fusion Reactors, Culham, UK, November 3-7, 1986.
Hebrant, P., "Lending Piping a New Lease On Life"; Nuclear Engineering International; January 1989.
Hock, R., C. von Koch, J. Brauns; "Criteria for Unrestricted Reuse of Waste Material Arising at Nuclear Facilities"; Radiation Protection in Nuclear Energy, Proceedings of an International Conference on Radiation Protection in Nuclear Energy, International Atomic Energy Agency, Vienna, 1988, volume 1, p. 277-284, 1988.
Huber, B., "Advances in the European Community's Program on Research on Decommissioning," 1987 International Decommissioning Symposium, Pittsburgh, PA, October 4-8, 1987.
Husain, A., "A Process for Decontaminating Stainless Steels to Release Limits"; Nuclear Technology, Vol. 85, Apr. 1989; November 1988.
ICRP; Radiation Protection Principles for the Disposal of Solid Radioactive Waste, ICRP Publication 46, Annals or the ICRP, 15 (4), Pergamon Press, 1985.
International Atomic Energy Agency (IAEA), Exemption from Regulatory Control - Recommended Unconditionally Exempt Levels for Radionuclides in Solid Materials, Draft Working Document, November, 1992, published as IAEATECDOC-855, January 1996..
International Atomic Energy Agency (IAEA), Factors Relevant to the Recycling or Reuse of Components Arising from the Decommissioning and Refurbishment of Nuclear Facilities, Technical Reports Series No. 293, Vienna, 1988.
International Atomic Energy Agency (IAEA), Principles for the Exemption of Radiation Sources and Practices from Regulatory Control, IAEA Safety Series No. 89, Vienna, 1988.
Jack, G.C.; "Current Situation in Canada with Respect to De Minimias; Proceedings of the Workshop on Rules for Exemption from Regulatory Control, Washington D.C., October 17-19, 1988; sponsored by the U.S. NRC in cooperation with the Nuclear Energy Agency, OCED; NUREG/CP-0101, 1988.
JAERI and USEPA (Wolbarst et al, Editors), Residual Radioactivity and Recycling Criteria; September 27-28, 1989.
Jolly, J., US Bureau of Mines, Supplemental information provided by J. Jolly, February 9, 1993b.
Jolly, J., US Bureau of Mines, Copper Scrap Annual Report, 1991, Draft January, 1993a.
Jolly, J., US Bureau of Mines, Copper Annual Report, 1990, April 1992.
Jupiter Corporation, Communication between Clyde Jupiter of Jupiter Corporation and Ikuo Hoshino of JDC Corporation and Norimitsu Koshiba of Adtechs Corporation, November, 1992.
Kennedy, W.E.,.D.L. Strenge, Residual Radioactive Contamination from Decommissioning: Volume 1, Technical Basis for Translating Contamination Levels to Annual Total Effective Dose Equivalent, September, 1992, NUREG/CR-5512.
Kennedy, W.L., F.R. O'Donnell, and G. Linsley, Exemption Principles Applied to the Recycle and Reuse to Materials of Nuclear Facilities, due out from IAEA in 1993.
8-3

Kerr, G.W., "CRCPD and State Activities on Radioactivity and Scrap Metal," Conference of Radiation Control Program Directors Report, ISRI Workshop, September, 1990.
Kirk-Othmer, Kirk-Othmer Encyclopedia of Chemical Technology, 3rd. Edition, Volume 21, p.558, 1983c.
Kirk-Othmer, Kirk-Othmer Encyclopedia of Chemical Technology, 3rd Edition, Volume 19, p.954, 1983b.
Kirk-Othmer, Kirk-Othmer Encyclopedia of Chemical Technology, 3rd Edition, Volume 6, p.855, 1983a.
Koch, C.v. and R. Gruner, "Decontamination During Decommissioning;" Kerntechnik 56 (1991) No. 6; 1991..
Loiselle, V., Telephone conversation between B. Puglia of SAIC and V. Loiselle of QUADREX, February 12, 1993.
Low-Level Radioactive Waste Management, 1993- New LLRW Disposal Capacity - Almost, Proceeds ofthe Eighth Annual Decisionmakers' Forum, sponsored by The Radioactive Exchange, June 1992.
Midwest Interstate Low-Level Radioactive Waste Commission, Assessment of Impacts From Different Waste Treatment and Waste Disposal Technologies, RAE-8503/2-2, May 1986.
"Detecting Radioactive Materials in Scrap," Modern Casting, pp. 29-31., September, 1991.
Neider, R., R. Gortz, M.K. Muller, D. Kucheida, E. Wirth; Criteria and Conditions for the Unrestricted Release of Materials for Decommissioned Nuclear Facilities"; Radiation Protection in Nuclear Energy, Proceedings of an International Conference on Radiation Protection in Nuclear Energy, International Atomic Energy Agency, Vienna, 1988, volume 1, p. 284-294, 1988.
Neider, R.; "Exemption Limits for Contaminated Materials to be Recycled and for Low Level Radioactive Waste From Nuclear Power Stations and Uranium Mining and Milling Areas in South-Eastern Germany", Waste Management '92, Proceedings of the Symposium on Waste Management at Tucson, Arizona, March 1-5, 1992.
Neider, R. et al, Criteria and Conditions for the Unrestricted Release of Materials from Decommissioned Nuclear Facilities, Proceedings of an International Conference on Radiation Protection in Nuclear Energy, Sidney, Australia, April 18-22, 1988.
O'Donnell, F.R. S.J. Cotter, D.C. Kocher, E.L. Etnier, A.P. Watson, Potential Radiation Dose to Man from Recycle of Metals Reclaimed from a Decommissioned Nuclear Power Plant, U.S. Nuclear Regulatory Commission, NUREG/CR-0134, 1978.
Oak, H.D., G.M. Holter, W.E. Kennedy, Jr., G.J. Konzek; Technology, Safety and Costs of Decommissioning a Reference Boiling Water Reactor Power Station; NUREG/CR-0672; Pacific Northwest Laboratory, Richland Washington; June, 1980.
Oguchi, T., "Using Ice to Blast Off Crud," Nuclear Engineering International, p. 49-50, January, 1989.
Olper, M., "Aspects of Secondary Copper Industry," Recycling Today, V. 22, No. 9, pp.30-36, September 1984.
Oshino, M. and Yoshikazu Yoshida; "Present Status on Exemption of Radioactive Waste From Regulatory Control in Japan"; Proceedings of the Workshop on Rules for Exemption from Regulatory Control, Washington D.C., October 17-19, 1988; sponsored by the U.S. NRC in cooperation with the Nuclear Energy Agency, OCED; NUREG/CP-0101, 1988.
Oztunali, 0.1., and G.W. Roles, De Minimis Waste Impacts Analysis Methodology, U.S. NRC, NUREG/CR-3585, February 1984.
8-4
Pacific Northwest Laboratories, Updated Costs for Decommissioning Nuclear Power Facilities (EPRI NP-4012); May 1985.
Personal Communication between D. Widmeyer of SAIC and James A. Shaffner ofUSEcology, Rocklin, CA, February 19, 1993.
Personal Communication between D. Widmeyer ofSAIC and Lawrence A. Saraka of Roy F. Weston, Inc., Westminster, PA, February 12, 1993.
Peters, A., Iron and Steel Annual Report, 1990, US Bureau of Mines, April 1992.
Pflugrad, K., et. al., "Treatment of Steel Waste Coming from Decommissioning of Nuclear Stations by Melting," Proceedings of the International Nuclear Decommissioning Planning Conference, Bethesda, MD, July 16-18, 1985.
Plunkert, P., Aluminum, Bauxite and Alumina Annual Report, 1990, US Bureau of Mines, March 1992.
Robertson, D.E., et. al.; Below Regulatory Concern Owners Group: Radionuclide Characterization of Potential BRC Waste Types From Nuclear Power Stations, NP-5677, Electric Power Research Institute, Palo Alto, California, March, 1989.
Rogers and Associates Engineering Corporation (RAEC), Below Regulatory Concern (BRC) Owners Group: A Comparison of the EPA Generic Cost-Benefit Analysis With an Industry-Specific Analysis (EPRI NP-5673); November 1989.
S. Cohen & Associates, Inc. and Eastern Research Group, Inc., Characterization of Class-A Low-Level Radioactive Waste and of Non-Radioactive Waste Management (1986-1990), Summary Report; July 1992.
Sappok, M., and M. Seidler, "Melting Radioactive Scrap," Nuclear Engineering International, p. 43 - 45, March, 1987.
Sappok, M., "Results of Melting Large Quantities of Radioactive Steel Scrap;" Nuclear Technology, Vol. 86, Aug. 1989; February 1989c.
Sappok, M., "Development of a Large Container Cast of Low Level Radioactive Steel," Proceedings of the 9th International Symposium on the Packaging and Transportation of Radioactive Materials, Washington D.C., Organized in Cooperation with IAEA and hosted by U.S. DOE, CONF-890631, June 11-16, 1989a.
Sappok, M., "Results of Melting Large Quantities of Radioactive Steel Scrap," Nuclear Technology, Vol. 86, August 1989, p. 188 - 191, August, 1989b.
Sappok, M., "Recycling of Metallic Materials from the Dismantling of Nuclear Plants," Kerntechnick Vol. 56, No. 6, p. 376 - 378, 1991.
Sappok, M. and G. Rettig, "Results of Melting Large Quantities of Radioactive Metallic Scrap," Proceedings of Spectrum '92 Nuclear and Hazardous Waste Management, p. 120 - 131, Boise Idaho, August 23-27, 1992.
Scheker, E., et. al., "Swiss Investigate Melting of Metallic Scrap from NPPs," Nuclear Eur., Volume 9, pp. 42-43, 1985.
8-5

Schuster, E. and K.A. Pflugrad, "Behavior of Actinides and Other Difficult to Measure Radionuclides in the Melting of Contaminated Steel"; Nuclear Technology, Vol. 86, Aug. 1989; February 1989.
Seidler, M. and M. Sappok, "Melting Radioactive Scrap;" Nuclear Engineering International; March 1987.
Sequoyah Fuels Corporation (SFC); Letter to John W. N. Hickey of NRC from James J. Sheppard of SFC, Subject License No. SUB-1010; Docket No. 40-8027, License Renewal Application, Questions for Clarification SFC Environmental Assessment, October 30, 1992.
Shamsuddin, M., "Metal Recovery From Scrap and Waste," Journal of Metals, pp.24-31, February 1986.
Siebert, D.L., Impact of Technology on the Commercial Secondary Aluminum Industry, US Bureau of Mines, Report IC-8445, 1970.
Smith, R.I. and L.M. Polentz; Technology, Safety, and Costs of Decommissioning a Reference Pressurized Water Reactor Power Station; NUREG/CR-0130; Pacific Northwest Laboratory, Richland Washington; August, 1979.
State of Colorado, Office of the Governor, Economics of a Low-Level Radioactive Waste Management Facility for the Rocky Mountain Region, DOE/ID/12371-6, September 1983.
STUK; Exemption from Regulatory Control of Nuclear Wastes; YVL Guide 8.2, Finnish Center for Radiation and Nuclear Safety; Helsinki, Finland, March, 1992.
U.S. Bureau of Mines, Minerals Commodity Summaries, 1992.
U.S. Department of Energy (DOE), Directions in Low-Level Radioactive Waste Management, An Analysis of LowLevel Waste Disposal Facility and Transportation Costs, National Low-Level Radioactive Waste Management Program, DOEILLW-6Td, April 1983.
U.S. Department of Energy (DOE), 1986, Phase VIII Update (1986) Report for the Energy Economic Data Base Program EEDB-VIII, DOE/NE-0079, December, 1986.
U.S. Department of Energy (DOE), 1990 Annual Report on Low-Level Radioactive Waste Management Progress, DOE/EM-0059P, September 1991.
U.S. Department of Energy (DOE), 1991 Annual Report on Low-Level Radioactive Waste Management Progress, Unpublished Draft, November 1992.
U.S. Department of the Interior, Minerals Facts and Problems, Chapter on Aluminum, 1985.
U.S. Nuclear Regulatory Commission (NRC); Draft Environmental Impact Statement on 10 CFR Part 61 "Licensing Requirements for Land Disposal of Radioactive Waste", NUREG-0782, September, 1981.
U.S. Nuclear Regulatory Commission (NRC), 1986, Energy Economic Data Base (EEDB) Program Phase VIII Update (1986), BWR Supplement, NUREG/CR-4764, December 1986.
U.S. Nuclear Regulatory Commission (NRC), Report on Waste Burial Charges, NUREG-1307, July 1988.
U.S. Nuclear Regulatory Commission (NRC), Transcript of Proceedings, Nuclear Regulatory Commission Advisory Committee on Nuclear Waste, 45th ACNW Meeting, Bethesda, Maryland, pp. 206-293, 30 July 1990.
U.S. Nuclear Regulatory Commission (NRC); G.W. Roles, Characteristics of Low-Level Radioactive Waste Disposed During 1987 Through 1989, NUREG-1418, December 1990.
8-6
U.S. Nuclear Regulatory Commission (NRC), Report on Waste Burial Charges, NUREG- 1307, Revision 2, July 1991.
U.S. Steel, The Making, Shaping and Treating of Steel, 10th. Edition, p.34-663, 1985.
Uda, T., Yoshihiro Ozawa, and Hajime Iba; "Melting of Uranium-Contaminated Metal Cylinders by Electroslag Refining," Nuclear Technology, Vol. 79, p. 328 - 337, December, 1987.
Uda, T., Y. Ozawa, and H. Iba, "Melting ofUranium-Contaminated Metal Cylinders By Electroslag Refining;" Nuclear Technology, Vol. 79, Dec. 1987); May 1987.
Weiczorowski, P., Telephone conversation between B. Puglia of SAIC and P. Weiczorowski of the Steel Manufacturers
Association, January 21, 1993.
Whitfield, R.P., Radioactive Scrap Metal Recycling: A DOE Assessment; October 1991.
Yamanoto, H. and Masao Oshino; "Current Status of Residual Radioactivity Criteria in Japan", Residual Radioactivity and Recycling Criteria, Workshop Proceedings St. Michaels, Maryland, September 1989, United States Environmental Protection Agency, Japan Atomic Energy Research Institute, EPA 520/1-90-013, PB91-179119, p. 193196, 1989.
Yasunaka et al. [JAERI], Decontamination Technology for Decommissioning of Nuclear Facilities.
8-7


![Reduce Reuse Recycle[1]](https://img.pdfslide.us/doc/110x75/5528136655034684588b464f/reduce-reuse-recycle1.jpg)