Embed Size (px)
Citation preview

DRAFT PETITION TO DESIGNATE THE
WATERS OF PUGET SOUND AS A
NO DISCHARGE ZONE
Prepared for Washington State Department of Ecology
Prepared by Herrera Environmental Consultants, Inc.

Note: Some pages in this document have been purposely skipped or blank pages inserted so that this document will copy correctly when duplexed.

DRAFT PETITION TO DESIGNATE THE WATERS OF PUGET SOUND AS A
NO DISCHARGE ZONE
Prepared for
Washington State Department of Ecology
Northwest Regional Office
3190 160th Avenue Southeast
Bellevue, Washington 98008
Prepared by
Herrera Environmental Consultants, Inc.
1220 Fourth Avenue
Olympia, Washington 98506
Telephone: 360/754-7644

i
jr 12-05362-000 petition to designate puget sound as ndz
CONTENTS 1. Introduction ............................................................................................................................. 1
2. Evaluation Process ................................................................................................................... 3
3. Proposed No Discharge Zone and Boundaries ........................................................................ 5
4. Certification of Need................................................................................................................ 9
4.1. Puget Sound Partnership Action Agenda ....................................................................... 9
4.2. Puget Sound’s Economic and Recreational Importance .............................................. 10
4.3. Costs and Benefits of Establishing a NDZ for Puget Sound .......................................... 11
4.4. Protected Areas and Beneficial Uses............................................................................ 11
4.5. Hydrology ..................................................................................................................... 11
4.6. Water Quality ............................................................................................................... 12
4.6.1. Water Quality Standards ............................................................................... 15
4.6.2. Status and Trends of Key Pollutants .............................................................. 15
4.7. Existing Pollutant Reduction Measures ........................................................................ 30
4.7.1. Marine Sanitation Devices ............................................................................. 35
5. Vessel Population .................................................................................................................. 37
5.1. Recreational Vessels ..................................................................................................... 37
5.2. Commercial Vessels ...................................................................................................... 40
6. Pumpout Facilities ................................................................................................................. 49
6.1. Pumpout Facilities for Recreational Vessels ................................................................ 49
6.2. Pumpout Facilities and Commercial Vessels ................................................................ 49
7. Implementation Strategy ....................................................................................................... 53
7.1. Education and Outreach ............................................................................................... 53
7.2. Enforcement ................................................................................................................. 54
7.3. Evaluation and Continued Success ............................................................................... 54
8. References ............................................................................................................................. 57
Appendix A Pumpout Facility Information

ii
jr 12-05362-000 petition to designate puget sound as ndz
TABLES Table 1. Marine Water Quality Standards for Dissolved Oxygen and Indicator Bacteria
in Puget Sound. .......................................................................................................... 16
Table 2. Major Components of the Puget Sound Nitrogen Cycle. .......................................... 22
Table 3. Marine Sanitation Device Summary. ......................................................................... 36
Table 4. Vessel Registrations by Vessel Length and County in 2011. ..................................... 39
Table 5. Oceangoing Vessel Entries into Puget Sound for 2005. ............................................ 43
Table 6. Puget Sound Harbor Vessel Population for 2005. ..................................................... 43
Table 7. Vessel Traffic Density (number of signals/mile2/day) by Vessel Type and Action Area in 2005 for the VTRA Model. ................................................................. 44
Table 8. Mobile Pumpout Services Available to Puget Sound Boaters. .................................. 50
FIGURES Figure 1. Proposed NDZ Boundaries. .......................................................................................... 7
Figure 2. Marine Protected Areas. ............................................................................................ 13
Figure 3. Designated Beneficial Use of Waters within Puget Sound Based on Water Quality Standards. ..................................................................................................... 17
Figure 4. Impaired Waters Due to High Bacteria Concentrations. ........................................... 19
Figure 5. Frequency of Water Samples Exceeding the Bacteria Standard in Puget Sound. ........................................................................................................................ 23
Figure 6. Classification of Commercial Shellfish Growing Areas in Puget Sound. .................... 25
Figure 7. Status of Recreational Shellfish Harvesting Areas in Puget Sound. .......................... 27
Figure 8. Relative Ranking of Median Dissolved Oxygen Concentrations at Ecology PSEMP Stations Between 1999 and 2008.................................................................. 31
Figure 9. Impaired Waters Due to Low Dissolved Oxygen. ...................................................... 33
Figure 10. Puget Sound Vessel Registrations by County and Vessel Length. ............................. 38
Figure 11. Estimates of Moorage Number and Locations and Public Pumpout Facilities in Puget Sound. .......................................................................................................... 41
Figure 12. Summary of All Commercial Vessel Traffic in Puget Sound. ..................................... 45
Figure 13. Selected Commercial Vessel Traffic in Puget Sound. ................................................ 46

December 2013
Draft Petition to Designate the Waters of Puget Sound as a No Discharge Zone 1
1. INTRODUCTION
Puget Sound is a natural resource of incredible value to Washington State and the nation. It is estimated that Puget Sound drives $20 billion in economic activities in Washington State that result from commercial and recreational fishing, shellfish aquaculture, tourism, boating, and international trade (Ecology 2008). Bounded by the Olympic Mountains and Vancouver Island to the West, and the Cascade Mountains to the East, it is place of unparalleled beauty. The nutrient-rich waters brought in by tidal currents from the Pacific Ocean provide nourishment for a vast diversity of life, from microscopic invertebrates to the salmon and orca whales vital to the region’s cultural history and identity. Its 2,500 miles of shoreline provide critical habitat for fish, mammals, and birds, and provide shellfish harvesting and swimming opportunities for the region’s residents and visitors. Sadly, deteriorating water quality is placing many of Puget Sound’s valuable resources at risk.
Over the past several decades, human-caused sources of nutrients, pathogens, and toxic contaminants are thought to have degraded the water quality of Puget Sound and are putting many of its beneficial functions at risk. Large areas of Puget Sound have been designated as impaired waters under the Clean Water Act (CWA) due to persistent low dissolved oxygen (DO) concentrations and high concentrations of fecal indicator bacteria. Numerous public swimming beaches have been closed due to bacterial contamination concerns, and approximately 36,000 acres of commercial shellfish growing areas have been closed due to bacterial contamination.
Untreated vessel sewage discharges, less than 3 miles from shore, are currently prohibited within Puget Sound. Sewage that has been treated by a United States Coast Guard (USCG) approved marine sanitation device (MSD), however, may be discharged anywhere. Treated vessel sewage discharges often contain high concentrations of nutrients and pathogens, may contribute to decreased DO, and may contain toxic disinfection chemicals, and excreted pharmaceuticals. As such, even treated vessel sewage discharges can degrade water quality and contribute to water quality impairments.
The Washington State Department of Ecology (Ecology) is requesting that the United States Environmental Protection Agency (US EPA) designate the marine inland waters of Puget Sound, and waters of Lake Washington, Lake Union the Lake Union Ship Canal and connecting water bodies a No Discharge Zone (NDZ) pursuant to CWA Section 312(f)(3). In a NDZ the discharge of sewage (also known as blackwater) from vessels is prohibited. The NDZ does not apply to other vessel discharges such as graywater, bilge, or ballast discharges unless they are combined with sewage prior to discharge. The following report addresses the seven elements (listed below) required to designate a NDZ under CWA Section 312 (f)(3):
A certification that the waters included in the petition require greater environmental protection than the applicable federal standard
A map showing locations of pumpout facilities

December 2013
2 Draft Petition to Designate the Waters of Puget Sound as a No Discharge Zone
A description of the location of pumpout facilities
A schedule of operating hours for the pumpout facilities
Vessel size limits or draught limits for the pumpout facilities
Information on treatment of wastes from pumpouts and verification that treatment conforms with federal law
Information on area vessel population and usage

December 2013
Draft Petition to Designate the Waters of Puget Sound as a No Discharge Zone 3
2. EVALUATION PROCESS
Over the past 2 years, Ecology and Herrera Environmental Consultants (Herrera) have been gathering data for evaluating the appropriateness and feasibility of establishing a NDZ for Puget Sound. This was a multifaceted effort that involved: reviewing and summarizing existing water quality data; compiling an accurate database of pumpout facilities available to Puget Sound boaters and commercial vessel operators; and several outreach efforts aimed at learning about existing vessel sewage management practices and attitudes, and ways to improve access to pumpout facilities so that NDZ compliance is straightforward for boaters and commercial vessel operators alike. The results of these research efforts are detailed in a series of seven informational memorandums available at Ecology’s NDZ website: http://www.ecy.wa.gov/programs/wq/nonpoint/CleanBoating/nodischargezone.html.
The water quality data review focused primarily on identifying known water quality impairments and problems that could be worsened by vessel sewage discharges. While a number of studies and reports were reviewed, the primary data sources were the most recent 303(d) list of impaired waters and Washington State Department of Health (WDOH) data on shellfish harvesting area and beach closures.
Information on public pumpout facilities for recreational vessels was obtained via the Washington State Parks Department (WSPD) pumpout facility data base. The number, location, and operation of pumpout facilities changes regularly, so every pumpout facility was contacted to verify its operation. The operators of mobile pumpout boats were also contacted to verify their vessel capacity, areas of operation, and ability to take on additional business.
A survey of over 300 Puget Sound boaters was conducted in the summer of 2012. The information gathered via this effort helped determine the percentage of Washington boaters that already use pumpout facilities and how many more might require access to pumpout facilities if Puget Sound were designated a NDZ. It also helped assess whether boaters were satisfied with the number and locations of existing pumpout facilities, and where additional pumpout facilities are desired.
Commercial vessel owners and operators from several industries were contacted to learn about sewage management practices on their vessels. Information gathered during this effort helped catalog existing pumpout options capable of serving commercial vessels. This information-gathering campaign also helped determine what modifications to their vessels and routines many commercial vessel operators would have to make to be able to comply with NDZ regulations.
Outreach for the Puget Sound NDZ began in 2011 by contacting recreational and commercial boating organizations, environmental groups, shellfish growers, and ports, in addition to other state agencies and tribal entities. Ecology launched an informational website outlining the NDZ development process which includes technical reports developed during the process and links
December 2013
4 Draft Petition to Designate the Waters of Puget Sound as a No Discharge Zone
to pertinent information. Ecology also identified more than 300 stakeholder groups and individuals and requested input from them throughout the NDZ evaluation process.
An advisory committee of stakeholders was assembled to guide decision making for the NDZ. The committee was comprised of representatives from state agencies, recreational boating and liveaboard advocacy groups, environmental interest groups, commercial vessel owners associations, tribal representatives, and ports. Two advisory committee meetings were held in June and July of 2013. Most of the first meeting was devoted to providing an overview of the information collected during to support the NDZ decision making process. At the second meeting the advisory committee provided direct input to; defining the geographic boundaries of the NDZ, infrastructure capacity and needs, and implementation needs (e.g., outreach, enforcement, and evaluation measures.
Based on the information gathered over the past 2 years and the outcomes of the advisory committee meetings, Ecology has concluded that there is sufficient need for establishing an NDZ in Puget Sound to protect water quality. Ecology has also determined that there are a sufficient number of pumpout facilities available to recreational boaters and methods to prevent vessel sewage discharges from the vast majority of commercial vessels, with certain commercial vessels being allowed additional time to retrofit vessels.

December 2013
Draft Petition to Designate the Waters of Puget Sound as a No Discharge Zone 5
3. PROPOSED NO DISCHARGE ZONE AND
BOUNDARIES
The proposed NDZ includes all inland waters of Puget Sound and applies to all recreational and commercial vessels. The western boundary of the NDZ would be the exit of the Strait of Juan de Fuca near the entrance of Admiralty Inlet. This boundary is known and visible to vessel operators as it is the line between New Dungeness lighthouse and Discovery Island lighthouse. The northern boundary would include all Washington State waters of the San Juan Islands. The proposed NDZ includes all areas to the south of the San Juan Islands including South Puget Sound, Hood Canal, and the fresh waters of Lake Washington, Lake Union, the Lake Union Ship Canal, and the connecting water bodies. The specific boundaries of the proposed NDZ are clearly delineated on Figure 1.
The geographical boundaries were determined by reviewing the vessel counts, and pumpout availability and distribution data, as well as the information collected on water quality concerns and locations of sensitive resources and public health protection. Ecology reviewed all of the data collected during the 2-year evaluation process on the number of vessels, locations of vessels, types of vessels, and the number and distribution of stationary and mobile pumpout facilities. Ecology evaluated mapped data such as sensitive water bodies, shellfish growing areas, and locations of known water quality problems. And Ecology conducted numerous stakeholder meetings including two Advisory Group meetings in which the pros and cons of the various geographic boundary options were analyzed. The analysis concluded that all of the inland marine waters of Puget Sound as well as the fresh waters of Lake Washington, Lake Union and the ship canal should be designated to adequately protect water quality and public health and that the infrastructure to prevent vessel sewage discharges was adequate.
The NDZ would immediately apply to all vessels with the exception of small and mid-sized commercial vessels that operate almost exclusively within the NDZ that do not already have a Type III MSD. Examples of vessels that might fit these criteria would be tug boats, resident commercial fishing vessels, and NOAA research vessels. The exception is included because there are some unique challenges associated with retrofitting these types of vessels, such as requiring engineered designs with extra safety considerations. These vessels would have a temporary exemption from the new NDZ regulations, but would still be required to comply with existing state and federal discharge regulations. The exemption would only apply until each boat’s next dry dock maintenance event or for no more than 3 years from the effective date of the NDZ.


!(
!(
British Columbia
Lake Washington
Lake Union
New Dungeness Lighthouse
Discovery Island Lighthouse
Seattle
Tacoma
Everett
Auburn
Renton
Bellingham
Olympia
Marysville
Mount Vernon
Port Angeles
King
Clallam
Skagit
Jefferson
Whatcom
Snohomish
Pierce
Mason
Grays Harbor
Kitsap
San Juan
Kittitas
ThurstonYakima
Island
£¤101
£¤2
UV18
UV104
UV16
UV167
UV512
UV520
¥¦90
¥¦5
¥¦90
633600
633600
712800
712800
792000
792000
871200
871200
950400
950400
1029600
1029600
1108800
1108800
1188000
1188000
1267200
1267200
1346400
1346400
1425600
1425600
1504800
1504800
0 0
7920
0
7920
0
1584
00
1584
00
2376
00
2376
00
3168
00
3168
00
3960
00
3960
00
4752
00
4752
00
5544
00
5544
00
6336
00
6336
00
7128
00
7128
00
Figure 1.Proposed NDZ Boundaries.
0 15 307.5
Miles
Produced By: GIS ( )Project: K:\Projects\Y2012\12-05362-000\Project\Task_6_Report\NDZ_area.mxd (10/25/2013)
LegendProposed NDZ boundary
!( Lighthouse
Coordinates: NAD83 WahingtonState Plane North (feet)


December 2013
Draft Petition to Designate the Waters of Puget Sound as a No Discharge Zone 9
4. CERTIFICATION OF NEED
Water quality declines over the past several decades have put many of Puget Sound’s economic, recreational, and ecological functions at risk. Thousands of acres of shellfish aquaculture and harvesting areas are currently closed due to health hazards posed by bacterial contamination. Likewise, many swimming beaches are closed annually to protect beachgoers from getting sick. Low DO concentrations caused by excess nutrients in the water have resulted in large die-offs of marine life in several areas of Puget Sound.
Microbial pathogens, disinfection chemicals, and other additives present in MSD discharges degrade water quality and pose direct threats to human health. According to the Clean Vessel Act (CVA) of 1992, “sewage discharged by recreational vessels because of an inadequate number of pumpouts is a substantial contributor to localized degradation of water quality in the United States.” Substantial progress has been made since passage of the CVA in providing boaters access to pumpout facilities. However, the discharge of MSD treated waste from recreational and commercial vessels still poses a risk to water quality of Puget Sound. Under the current regulatory framework, illegal discharges are very difficult to prevent and enforce, and even legal, treated sewage discharges contain fecal bacteria concentrations that are many times higher than the state water quality standards.
Most previous and ongoing water quality improvement efforts focus on reducing watershed-based sources of pollution. Point source pollution is largely addressed through the National Pollutant Discharge Elimination System (NPDES). Non-point source pollution is being reduced through watershed rehabilitation, pollutant source reduction, and new water treatment technologies.
Vessel sewage is a type of non-point source pollution. Even though vessel sewage discharges may account for only a small portion of the total pollutant load entering Puget Sound, their impacts may be disproportionally large. Because vessels are mobile, their discharges may occur directly over sensitive environmental resources, causing localized water quality problems. Eliminating vessel sewage discharges by establishing a NDZ for Puget Sound will work in concert with watershed-based pollutant reduction efforts to restore water quality and maintain the many beneficial human uses and ecological functions of Puget Sound.
4.1. Puget Sound Partnership Action Agenda
Tremendous efforts are being made by the state, local municipalities, and environmental advocacy groups aimed at improving water quality and restoring habitat in Puget Sound. The Puget Sound Partnership (PSP) is a state agency established to lead efforts to protect and restore Puget Sound.
The Puget Sound Partnership has developed an Action Agenda, a roadmap to restore Puget Sound by 2020. As part of the most recent Action Agenda update, PSP developed a set of recovery targets to be achieved by 2020 (PSP 2011a). Addressing vessel sewage is a

December 2013
10 Draft Petition to Designate the Waters of Puget Sound as a No Discharge Zone
component of the Action Agenda. Designating Puget Sound as a NDZ will offer the greatest protection possible from vessel sewage pollution and will satisfy the Action Agenda marine sewage goal. The Action Agenda and recovery targets can be viewed at PSP’s website (http://www.psp.wa.gov/action_agenda_center.php).
To help target restoration efforts tied to the Action Agenda, PSP has designated “Action Areas” that roughly correspond to the main basins of Puget Sound. While Action Areas are not specifically related to the NDZ, they are referenced several times in this petition because they are useful geographic units for framing discussions about the NDZ.
4.2. Puget Sound’s Economic and Recreational Importance
Puget Sound is an economic engine for the region. It was recently estimated that industries and activities conducted on Puget Sound account for $20 billion of the region’s economy on an annual basis. A large portion of this comes from commercial and recreational fishing, shellfish aquaculture, tourism, and boating, all of which are dependent on good water quality.
Probably the most direct link between the economic vitality of the region and excellent water quality is through the commercial shellfish industry. In 2008, the Puget Sound shellfish industry was estimated to have generated $44 million in revenue. Shellfish aquaculture has shown steady growth since 1985, with over 20 million pounds harvested in recent years (PSP 2009). The Washington State Department of Health designates the status of commercial shellfish and recreational harvesting areas based on the potential health risk posed to people by consuming shellfish harvested in those areas. Approximately 190,000 acres of tidelands are classified for commercial and recreational shellfish harvest. In 2011, approximately 36,000 acres, or 19 percent, of the total potential growing area was closed to harvesting, representing substantial revenue losses. The majority of the acreage was closed due to fecal bacteria pollution (PSP 2011b). The Puget Sound Partnership has set a recovery goal of a net increase of 10,800 acres where shellfish may be harvested, including 7,000 acres where harvest is currently prohibited.
Recreational shellfish harvesting is nearly as important to the regional economy as commercial harvest. The value of shellfish harvested recreationally is estimated to be $42 million annually. Recreational shellfish harvest takes place at hundreds of beaches throughout Puget Sound As with commercial shellfish growing areas, WDOH is responsible for ensuring that shellfish that are harvested recreationally are safe to eat.
Shellfish resources are particularly vulnerable to vessel sewage discharges. As will be described in detail later in this petition, even treated vessel sewage discharges have very high bacteria concentrations and the treatment processes used would provide no real treatment for viruses or other pathogens. The fact that these discharges can occur directly over or very near shellfish beds or swimming areas means that they pose a much greater public health risk than other waste discharges. Each year, about 390,000 people participate in recreation activities in the waters or on the beaches of Puget Sound. Thousands of people use Puget Sound beaches every weekend to enjoy the scenery and the water, as well as to dig for clams and oysters. Public swimming beaches are monitored for bacteria and other toxins. In 2011, one-quarter of monitored swimming beaches were closed because of fecal bacteria contamination (PSP 2012).

December 2013
Draft Petition to Designate the Waters of Puget Sound as a No Discharge Zone 11
The Puget Sound Partnership has set recovery target of having all public swimming beaches meeting the US EPA bacteria standard by 2020 (PSP 2012).
Recreational fishing is valued at $57 million annually when peripheral expenses such as fuel and equipment purchases are considered (Ecology 2008).
4.3. Costs and Benefits of Establishing a NDZ for Puget Sound
Clearly, Puget Sound is crucial to the economic vitality and cultural identity of the region and the State. Maintaining and improving the water quality of Puget Sound by establishing a NDZ will help ensure that industries dependent on excellent water quality will sustain their success and continue to grow. There are however costs associated with establishing a NDZ that will affect a range of stakeholders (Herrera 2012a). The primary cost to vessel operators is the cost to retrofit vessels that do not have adequate holding capacity. There are also indirect costs, which are difficult to quantify, such as the cost in time required navigating to and from pumpout facilities. Building and maintaining pumpout facilities, particularly large capacity facilities for commercial vessels can be also costly. The Clean Vessel Act grant program pays the bulk of the costs associated with recreational pumpouts, but there are no similar programs for commercial pumpouts. Even in light of the costs of establishing a NDZ, they are outweighed by the benefits of clean water.
4.4. Protected Areas and Beneficial Uses
Puget Sound provides critical and unique habitat for a variety of species, ranging from orca whales to forage fish and native shellfish. Marine protected areas (MPAs) are areas that are designated as requiring extra protection due to their fragile and unique habitats or species, or because they are culturally historic sites or they enhance fisheries abundance and biodiversity. While MPAs by no means provide a complete inventory of the valuable marine resources, they are an important tool for visualizing the extent of environmentally important areas throughout Puget Sound.
Washington State has designated 127 MPAs that are administered by a number of different agencies; 71 are located in Puget Sound (Figure 2). Marine protected areas are generally small (the average size is 23 acres); only about 5 percent of the Puget Sound coast is covered by an MPA. Marine protected areas offer various degrees of protection for marine resources by having harvest and access restrictions, for example. Despite their status, with a few exceptions, MPAs are not protected from vessel discharges.
4.5. Hydrology
Puget Sound comprises four deep basins connected by shallower sills. The basins correspond to the Hood Canal, Central Puget Sound (North and South), and Whidbey Basin (Figure 1) (University of Washington 2009). Central Puget Sound is the deepest basin, with depths consistently exceeding 200 meters (m) (Cannon 1983). South Puget Sound is much shallower. Although water depths in South Puget Sound reach 150 m, many of the inlets are 50 m or shallower (Ecology 2009). The Whidbey Basin is also shallower than the main basin in Central Puget Sound and has variable depths ranging from 8 to 150 m (University of Washington 2012). Hood Canal is deep throughout the north-south trending portion, with depths frequently exceeding 175 m. Where Hood Canal bends to the east and changes to an east-west

December 2013
12 Draft Petition to Designate the Waters of Puget Sound as a No Discharge Zone
orientation, it is much shallower, with depths only reaching about 40 m (Turney 2004). Lake Washington and Lake Union, while not part of Puget Sound, are connected via the Lake Washington Ship Canal to Shilshole Bay.
Puget Sound has complex hydrology that results from the interaction of tidal currents, freshwater inflow, and the physical features that define the bathymetry of the basin. The deeply incised fingers left behind by the last glaciations resulted in a network of narrow channels and shallow sills, which restrict and alter the mixing and circulation of water throughout the Sound. As a result, some areas of the Sound, particularly South Puget Sound and Hood Canal, experience poor circulation and are prone to water quality impairments (PSP 2010).
Water circulation in Puget Sound is driven by tidal currents, the surface outflow of fresh water, and the deep inflow of salt water from the ocean. There are 10,000 rivers and streams that contribute fresh water to Puget Sound, but 14 main rivers located predominately in central and north Puget Sound account for the majority of the freshwater sources (PSP 2008). Due to density differences, the less dense fresh water remains near the surface and flows out of the Sound through Admiralty Inlet. The majority of the oceanic input, which is denser and typically more nutrient-rich, enters into Puget Sound at depth through Admiralty Inlet and travels south through the main basin. Some mixing between the more saline ocean water and the less dense surface water occurs, as the ocean water is forced upward as it travels over the Admiralty Inlet Sill and near the south end of the main basin at the Tacoma Narrows Sill between Central and South Puget Sound (Newton 2002).
Water circulation and flushing rates influence water quality and are especially important factors in determining an area’s susceptibility to eutrophication. In general, circulation and flushing is more rapid in the northern segments of Puget Sound. Greater river water inputs and a shorter, more direct connection with the ocean facilitate greater net flow and circulation in these areas. Hood Canal and South Puget Sound are much more poorly flushed due, in part, to sills at their mouths, which restrict exchange with the rest of Puget Sound. Other factors related to the timing and strength of stratification in Hood Canal and South Puget Sound also limit the net volume of water exchange flushing time (Gustafson et al. 2000).
4.6. Water Quality
Good water quality is at the heart of the ecological, economic, and recreational benefits provided by Puget Sound. Over the past several decades, human-caused sources of nutrients, pathogens, and toxic contaminants are thought to have degraded the water quality of Puget Sound and are putting many of its beneficial functions at risk. Treated vessel sewage discharges often contain high concentrations of nutrients and pathogens, may contribute to decreased DO, and are likely to contain toxic disinfection chemicals as well as pharmaceuticals. The following sections provide a general overview of Puget Sound water quality in relation to four indicators: bacteria, DO, nutrients, and toxic chemicals.

British Columbia
Seattle
Tacoma
Everett
Auburn
Renton
Bellingham
Olympia
Marysville
Mount Vernon
Port Angeles
King
Clallam
Skagit
Jefferson
Whatcom
Snohomish
Pierce
Mason
Grays Harbor
Kitsap
San Juan
Kittitas
ThurstonYakima
Island
£¤101
£¤2
UV18
UV104
UV16
UV167
UV512
UV520
UV104
¥¦90
¥¦5
¥¦405
¥¦90
633600
633600
712800
712800
792000
792000
871200
871200
950400
950400
1029600
1029600
1108800
1108800
1188000
1188000
1267200
1267200
1346400
1346400
1425600
1425600
1504800
1504800
0 0
7920
0
7920
0
1584
00
1584
00
2376
00
2376
00
3168
00
3168
00
3960
00
3960
00
4752
00
4752
00
5544
00
5544
00
6336
00
6336
00
7128
00
7128
00
Figure 2.Marine Protected Areas.
0 15 307.5
Miles
Produced by GISProject: K:\Projects\Y2012\12-05362-000\Project\Task_6_Report\marine_protected_areas.mxd (9/24/2013)
LegendManaging agency
National Parks Service (NPS)National Oceanic and AtmosphericAdministration (NOAA)US Fish & Wildlife Service(US F&WS)WA Department of Fish & Wildlife(WA DFW)WA Department of NaturalResources (WA DNR)WA Department of Ecology(WA DOE)WA Parks and RecreationCommission (WA P&RC)University of Washington FridayHarbor Laboratories (UW FHL)CountyAction area boundary
Coordinates: NAD83 WahingtonState Plane North (feet)


December 2013
Draft Petition to Designate the Waters of Puget Sound as a No Discharge Zone 15
4.6.1. Water Quality Standards
In Washington, water quality is regularly evaluated against the surface water quality standards that are set forth in WAC 173-201 to assess whether the water complies with the CWA. The water quality standards establish numeric and narrative criteria for a water body to protect its existing beneficial uses for both aquatic life and recreation. Figure 3 shows the beneficial use designations of Puget Sound waters. The majority of Puget Sound is designated as extraordinary or excellent aquatic life use and as primary contact recreation beneficial uses. These designations speak to the importance and value of good water quality throughout all of Puget Sound and demonstrate that the need for clean water is not limited to just a few areas.
Of the four water quality indicators selected for summary in this report, fecal bacteria and DO are the two that are assigned specific water quality standards. Some toxic contaminants are also assigned numeric standards and are most frequently evaluated by fish tissue and sediment sampling, rather than water quality monitoring. Nutrients are not discussed in relation to the water quality standards because there are no marine water quality standards for nutrients. However, low DO concentrations are often an indicator of elevated nutrients and eutrophication; therefore, the discussion of DO impairments cannot be isolated from the discussion of elevated nutrients.
Water quality standards for fecal indicator bacteria (fecal coliform and enterococci bacteria) and DO are defined in Table 1. Waters that fail to meet water quality standards are designated as impaired, and are included on the 303(d) list of impaired waters (CWA 40 CFR 130.7).
4.6.2. Status and Trends of Key Pollutants
This section provides an overview of the status and trends of bacteria pathogens, DO, nutrients, and toxic contaminants. These parameters were chosen because they are the most likely to be affected by vessel sewage discharges. A number of sources were used to develop the following summaries; however, the bulk of the information presented in the following sections was summarized from the 2011 Puget Sound Science Update (PSP 2011b).
Bacteria
In Puget Sound, fecal bacteria monitoring is conducted by numerous state and local agencies. Ecology conducts bacteria monitoring at Puget Sound Ecosystem Monitoring Program (PSEMP) stations. The Washington Department of Health (WDOH) monitors fecal bacteria in shellfish growing areas and administers the bacterial environmental assessment communication and health (BEACH) monitoring program for recreational beaches. Many local municipalities also have bacteria monitoring problems to study and address local problems. All of these programs have identified bacterial contamination problems in many areas of Puget Sound.
Water Quality Standard Impairments
In Puget Sound there are many areas where water quality is considered as impaired due to bacteria levels failing to meet water quality standards (Figure 4). The majority of fecal bacteria impairment listings are in South Puget Sound, Hood Canal, and other poorly flushed embayments. However, areas with better flushing are also susceptible to fecal bacteria problems, particularly near urbanized areas. For example, there are a number of fecal bacteria impairments along the east side of central Puget Sound, in spite of this region being relatively well flushed.

December 2013
16 Draft Petition to Designate the Waters of Puget Sound as a No Discharge Zone
Table 1. Marine Water Quality Standards for Dissolved Oxygen and Indicator Bacteria in Puget Sound.
Beneficial Uses Dissolved Oxygen Lowest 1-day
Minimum Indicator Bacteria Aquatic Life Recreation
Extraordinary Primary Contact
7.0 mg/L Fecal coliform organism levels must not exceed a geometric mean value of 14 colonies/100mL, with not more than 10% of all samples (or any single sample when < 10 sample points
exist) obtained for calculating the geometric mean value > 43 colonies/100 mL.
Excellent Primary Contact
6.0 mg/L Fecal coliform organism levels must not exceed a geometric mean value of 14 colonies/100mL, with not more than 10% of all samples (or any single sample when < 10 sample points
exist) obtained for calculating the geometric mean value > 43 colonies/100 mL.
Good Secondary Contact
5.0 mg/L Enterococci organism levels must not exceed a geometric mean value of 70 colonies/100 mL, with not more than 10% of
all samples (or any single sample when < 10 sample points exist) obtained for calculating the geometric mean value
> 208 colonies/100 mL.
Fair Secondary Contact
4.0 mg/L Enterococci organism levels must not exceed a geometric mean value of 70 colonies/100 mL, with not more than 10% of
all samples (or any single sample when < 10 sample points exist) obtained for calculating the geometric mean value
> 208 colonies/100 mL.
mg/L = milligrams per liter
Recreational Beaches
Recreational beaches are monitored as part of the BEACH Program (Ecology 2011). The BEACH program monitoring uses the US EPA Beach Act (40 CFR 131) single sample maximum standard for enterococci of 104 colonies per 100 milliliters (mL) to determine whether beaches are safe for swimming. Between 2004 and 2011, 123 Puget Sound beaches were monitored. Among the sampled beaches, 86 had at least one sample exceeding the standard. BEACH program monitoring during 2004 and 2005 also documented that the highest number of bacteria exceedances were in locations where communities rely predominately on on-site septic systems (PSP 2007).
Data from the BEACH monitoring program was used to assign categories of low, moderate, and high based on the relative frequency of samples exceeding the standard. Thirty-one of 123 beaches monitored were rated as a high risk for bacteria contamination, and 85 were rated as a moderate risk. Of course, most of the public beaches are not monitored as part of the program, so it is likely that many more beaches pose a public health risk due to fecal contamination. The locations of the monitored beaches and the bacteria contamination risk are

San Juan / Whatcom
Strait of Juan de Fuca
Whidbey Basin
Hood Canal
South Puget Sound
North CentralPuget Sound
South Central Puget Sound
British Columbia
Seattle
Tacoma
Everett
Auburn
Renton
Bellingham
Olympia
Marysville
Mount Vernon
Port Angeles
King
Clallam
Skagit
Jefferson
Whatcom
Snohomish
Pierce
Mason
Grays Harbor
Kitsap
San Juan
Kittitas
ThurstonYakima
Island
£¤101
£¤2
UV18
UV104
UV16
UV167
UV512
UV520
UV104
¥¦90
¥¦5
¥¦405
¥¦90
633600
633600
712800
712800
792000
792000
871200
871200
950400
950400
1029600
1029600
1108800
1108800
1188000
1188000
1267200
1267200
1346400
1346400
1425600
1425600
1504800
1504800
0 0
7920
0
7920
0
1584
00
1584
00
2376
00
2376
00
3168
00
3168
00
3960
00
3960
00
4752
00
4752
00
5544
00
5544
00
6336
00
6336
00
7128
00
7128
00
Figure 3.Designated beneficial use of waterswithin Puget Sound based on waterquality standards.
0 15 307.5
Miles
Produced by GISProject: K:\Projects\Y2012\12-05362-000\Project\Task_6_Report\designated_beneficial_use_WQ.mxd (9/24/2013)
LegendAquatic life use
Extraordinary - primary contactExcellent - primary contactGood - secondary contactFair - secondary contactAction area boundary
Coordinates: NAD83 WahingtonState Plane North (feet)


San Juan / Whatcom
Strait of Juan de Fuca
Whidbey Basin
Hood Canal
South Puget Sound
North CentralPuget Sound
South Central Puget Sound
British Columbia
Seattle
Tacoma
Everett
Auburn
Renton
Bellingham
Olympia
Marysville
Mount Vernon
Port Angeles
King
Clallam
Skagit
Jefferson
Whatcom
Snohomish
Pierce
Mason
Grays Harbor
Kitsap
San Juan
Kittitas
ThurstonYakima
Island
£¤101
£¤2
UV18
UV104
UV16
UV167
UV512
UV520
UV104
¥¦90
¥¦5
¥¦405
¥¦90
633600
633600
712800
712800
792000
792000
871200
871200
950400
950400
1029600
1029600
1108800
1108800
1188000
1188000
1267200
1267200
1346400
1346400
1425600
1425600
1504800
1504800
0 0
7920
0
7920
0
1584
00
1584
00
2376
00
2376
00
3168
00
3168
00
3960
00
3960
00
4752
00
4752
00
5544
00
5544
00
6336
00
6336
00
7128
00
7128
00
Figure 4.Impaired waters due to high bacteria concentrations.
0 15 307.5
Miles
Produced by GISProject: K:\Projects\Y2012\12-05362-000\Project\Task_6_Report\impaired_water_bacteria.mxd (9/23/2013)
LegendImpaired water
BacteriaAction area boundary
Coordinates: NAD83 WahingtonState Plane North (feet)


December 2013
Draft Petition to Designate the Waters of Puget Sound as a No Discharge Zone 21
illustrated in Figure 5. Nineteen beaches on Lake Washington and Lake Union are monitored by King County for bacteria. Closures due to bacteria contamination are rare, but they do occur. A listing of historical beach closures is available at King County’s swimming beach monitoring website (http://green.kingcounty.gov/swimbeach/).
Commercial Shellfish Harvest
Shellfish are filter feeders, and they can accumulate pathogens that are present in the water column and sediments. High concentrations of bacteria can result in the closure of commercial shellfish growing areas and closures of beaches used for recreational shellfish harvest. Due to the potential health risk associated with eating contaminated shellfish, WDOH monitors bacteria concentrations in waters that are used for shellfish aquaculture or recreational harvest on a regular basis. Approximately 190,000 acres of commercial and recreational shellfish growing tidelands are monitored. All harvesting areas, whether commercial or recreational, are subject to the bacteria standard described in Table 1 for primary contact. Based on the results of sampling and other hydrologic factors, commercial shellfish growing areas are designated using the following systems:
Commercial Growing Areas:
o Approved: Mean concentration of fecal coliform bacteria does not exceed 14 colonies per 100 mL.
o Conditionally Approved: Meets the 14 colonies per 100 mL standard during predictable periods and therefore is approved for use only during those periods.
o Restricted: Bacterial water quality does not meet the standard for approved classification. Shellfish grown in restricted areas may be relayed (transplanted) to another area for an extended period before marketing.
o Prohibited: Fecal material, pathogenic organisms, or otherwise harmful substances have been detected at dangerous concentrations. Commercial harvest is not allowed.
The locations and status designations of commercial growing areas are shown on Figure 6.
The majority of commercial harvest areas remain open or conditional. However, harvest is prohibited on about 36,000 acres, or 19 percent of the total potential growing area of 190,000 classified acres. Some of these areas are closed due to pollution sources such as biotoxins or synthetic chemicals, but the majority of closures are due to fecal bacteria pollution (PSP 2011c).
The Washington State Department of Health recently evaluated long-term trends in fecal pollution at 21 commercial growing areas for the period between 1998 and 2011. While there was some variability among the areas evaluated, most showed a moderate improving trend over the study period. A few areas showed marked improvements; these improvements were thought to be the result of remediation of failing onsite septic systems and public education (WDOH 2011).

December 2013
22 Draft Petition to Designate the Waters of Puget Sound as a No Discharge Zone
Recreational Shellfish Harvest
Recreational shellfish harvest takes place at approximately 500 beaches throughout the Sound, which are shown on Figure 7. As with commercial shellfish growing areas, WDOH is responsible for ensuring that shellfish harvested from these beaches are also safe to eat. Evaluations of public harvesting beaches are similar to that of commercial shellfish growing areas. Based on factors such as proximity to pollutant sources and measured fecal indicator bacteria concentrations, WDOH will classify the beaches as:
Open: Water has been tested and determined safe for shellfish harvest
Advisory: Shellfish harvest is permitted, but thorough cooking of shellfish is recommended
Closed: Harvest is prohibited either due to contaminants or fecal pollution, or because the beach hasn’t been tested
A substantial number of recreational shellfish harvesting beaches are listed as closed, particularly in South Puget and Central Puget Sound. While many of these beaches may be closed because they have not been tested; many are closed due to known bacterial contamination. The locations and status designations of recreational growing areas are shown on Figure 7.
Nutrients
Puget Sound is a naturally nutrient-rich water body. Coastal upwelling, the process by which nutrient-rich but oxygen-poor bottom water is transported to the surface, typically occurs along the Pacific Coast between April and September (Gustafson et al. 2000). Exchange of this water through the Strait of Juan de Fuca is the single largest source of dissolved inorganic nitrogen (DIN) to Puget Sound; this “marine loading” accounts for about 86 percent of the nitrogen load to the Sound. Rivers, sewage, groundwater, and atmospheric deposition contribute a substantial quantity of nitrogen, but individually account for only small portions of the nitrogen load (Table 2) (Herrera 2010). There are no marine water standards for nutrients, so there are no documented impairments as the result of high nutrient concentrations.
Table 2. Major Components of the Puget Sound Nitrogen Cycle.
DIN Input Annual Loading (MT/year) Annual Loading (percent)
Marine Loading 148,920 86.4%
Rivers 11,000 6.4%
Sewage 5,658 3.3%
Groundwater 3,650 2.1%
Atmospheric Deposition 3,103 1.8%
Total Input 172,331 100%
DIN = dissolved inorganic nitrogen MT/yr = million tons per year Note: This table was adapted from Table 2 in Herrera (2010).

!(
!(
!(
!(
!(
!(
!(
!(
!(
!(
!(!(
!(
!(
!(
!(
!(
!(
!(
!(
!(
!(
!(
!(!(
!(
!(
!(
!(
!(
!(!(
!(!(
!(!(
!(
!(
!(!(!(
!(!(!(!(
!(
!(
!(!(!(
!(!(!( !(!(!(
!(!(!(!(
!(
!(
!(!(
!(!(
!(!(
!(!(
!(!(!(
!(!(!(!(!(!(!(!(
!(!(!(!(!(!(!(!(
!(!(
!(!(!(
!(
!(
!(!(
!(!(!(
!(
!(!(!(
!(
!(!(!(!(!(
!(!(!(
!(!(!(
!(
!(!(
!(
!(
!(
!(
!(!(
!(!(!(
!(
!(!(
!(!(!(!( !(
!(
!(
!(!(!(!(!(
!(!(
!(!(!(
!(!(!(
!(!(!(
!(!(!(!(!(!(!(
!(!(!(!(!(
!(
!(
!(
!(
!(
!(
!(!(!(!(!(
!(!(!(!(!(!(!(!(
!(
!(!(!(
!(!(!(!(
!(
!(!(
!(
!(!(
!(!(!(!(
!(!(!(!(!(!(!(
!(!(!(
!(!(!(
!(!(!(!(!(
!(
!(!(!(!( !(!(!(
!(!(!(
!(!(!(
!(!(!(!(!(!(!(!(!(!(!(!(!(!(!(
!(!(
!(!(!(!(!(!(!(!(!(
!(!(
!(
!(!(
!(!(!(
!(!(!(!(!(
!(!(!(!(
!(!(!(!(
!(
!(!(!(!(!(!(!(!(!(
!(
!(!(!(!(!(!(!(!(!(
!(
!(!(!(!(
!(!(!(!(!(
!(!(!(!(!(!(!(!(
!(!(
!(!(!(!(!(!(
!(
!(!(!(
!(!(!(!(!(
!(
!(!(!(!(
!(
!(!(!(!(!(!(!(!(!(!(
!(!(!(
!(
!(
!(!(!(!(!(!(
!(
!(!(
!(!(!(!(!(!(!(
!(!(!(!(!(
!(!(
!(!(!(!(!(!(!(!(!(
!(!(!(
!(!(
!(
!(!(!(!(!(!(
!(!(!(!(!(!(!(!(!(!(!(
!(
!(!(!(!(!(!(!(!(!(!(!(
!(!(!(
!(
!(!(!(!(!(!(!(!(
!(!(!(!(!(!(!(!(!(!(!(!(!(!(!(
!(!(!(!(!(!(!(!(!(
!(
!(!(!(
!(
!(
!(
!(
!(!(!(!(!(!(!(!(
!(!(!(
!(!(!(!(!(!(
!(!(!(
!(!(!(!(
!(!(!( !(
!(!(
!(!(!(!(
!(!(
!(!(!(!(!(
!(
!(!(!(!(!(!(!(!(!(!(!(!(
!(
!(!(
!(!(!(!(
!(!(!(!(!(!(
!(!(!(!(!(!(!(!(!(!(!(
!(!(!(!(!(!(!(!(!(!(!(!(!(!(!(!(!(!(
!(
!(!(!(!(!(!(!(!(!(!(!(!(!(!(!(!(!(!(!(
!(!(!(!(!(!(
!(
!(!(
!(
!(
!(
!(
!(!(!(!(!(!(!(
!(!(
!(!(!(!(!(!(!(!(!(!(!(!(!(!(
!(!(!(!(
!(!(
!(
!(
!(!(!(!(!(!(!(!(
!(!(!(!(!(!(
!(!(!(!(!(!(!(
!(
!(
!(!(!(
!(!(!(!(!(
!(!(
!(!(!(!(!(!(
!(
!(!(
!(!(!(!(!(!(!(!(!(!(!(!( !(
!(!(!(!(!(
!(!(
!(!(
!(!(!(!(
!(
!(!(
!(
!(!(!(!(!(!(!(
!(!(
!(!(
!(!(!(
!(
!(
!(!(
!(!(!(
!(!(
!(
!(!(!(
!(
!(!(!(!(!(
!(
!(
!(!(!( !(!(!(!(!(
!(!(
!(!(
!(!(!(
!(
!(
!(
!(
!(
!( !(
!(
!(!(!(
!(!(
!( !(!(!(!(!( !(
!(
!(!(
!(!(!(
!(!(!(!(!(!(!(
!(
!(!(!(!(!(!(!(!(!(
!(
!(!(!(
!(!(
!(!(
!(!(!(
!(!(!(!(!(!(!(
!(!(!(!(!(!(!(!(!(
!(!(!(
!(!(!(!(!(!(!(!(!(!(
!(!(
!(
!(!(!( !(!(!(!( !( !(!(!(
!(!(
!(!(!(
!(
!(!(
!(
!(!(!(!(!(!(
!(!(!(!(!(!(!(!(!(!( !(
!(!(!(!(!(
!(
!( !(!(!(!(!(
!(
!(
!(
!(!(!(!(!(
!(!(!(!(
!(!(!(
!(!(!(!(!(!(
!(!(
!(
!(
!(!(!(
!(
!(
!(!(!(
!(!(!(!(
!(
!(!(
!(
!(!(
!(
!(
!(
!(
!(!(
!(!(!(!(
!(!(!(!(!(
!( !(!(!(!(
!(
!(!(!(
!(
!(!(!(
!(
!(!(!(!(!(
!(!( !(
!(!(
!(!(
!(!(
!(
!(!(!(!(!(!(!(!(!(!(!(!(!(
!(!(
!(!(
!(
!(!(
!(!(
!(
!(!(
!(
!(!(!(
!(!(!(
!(!(
!(
!(
!(
!(
!(
!(
!(!(!(
!(
!(
!(
!(
!(
!(!(
!(!(!(
!(
!(
!(
!(
!(!(
!(
!(!(
!(
!(!(!(!(
!(!(!(
!(!(
!(
!(!(!(!(
!(
!(!(!( !(!(
!(!(
!(
!(!(
!(
!(
!(
!(
!(
!( !(
!(
!(
!(!(
!(
!(!(!(
!(
!(
!(
!( !(!(
!(
!(
!(
!(
!(!(!(
!(
!(
!(
!(
!(!(!(
!(
!(
!(
!(
!(
!(
!(
!(
!(
!(
!(!(
!(
!(!(
!(!(
!(
!(
!(!(
!(
!(
!(
!(
!(
!(!(!(
!(
!(
!(!(!(
!(
!(!(!(
!(
!(
!( !(!(
!(
!(
!(
!(
!(!(!(
!(!(
!(
!(!(
!(
!(
!(
!(
!(
!(
!(!(
!(
!(
!(
!(
!(
!(
!(
!(!(
!(
!(
!(
!(
!( !(
!(!(
!(
!(
!(!(
!(
!(!(
!(!(!(!(!(!(!(
!(!(!(!(
!(
!(!(
!(
!(
!(
San Juan / Whatcom
Strait of Juan de Fuca
Whidbey Basin
Hood Canal
South Puget Sound
North CentralPuget Sound
South Central Puget Sound
British Colu m bia
Seattle
Tacoma
Everett
Auburn
Renton
Bellingham
Olympia
Marysville
Mount Vernon
Port Angeles
King
Clallam
Skagit
Jefferson
Whatcom
Snohomish
Pierce
Mason
Grays Harbor
Kitsap
San Juan
Kittitas
ThurstonYakima
Island
£¤101
£¤2
UV18
UV104
UV16
UV167
UV512
UV520
UV104
¥¦90
¥¦5
¥¦405
¥¦90
633600
633600
712800
712800
792000
792000
871200
871200
950400
950400
1029600
1029600
1108800
1108800
1188000
1188000
1267200
1267200
1346400
1346400
1425600
1425600
1504800
1504800
0 0
7920
0
7920
0
1584
00
1584
00
2376
00
2376
00
3168
00
3168
00
3960
00
3960
00
4752
00
4752
00
5544
00
5544
00
6336
00
6336
00
7128
00
7128
00
Figu re 5.Frequ enc y of water sam ples exc eed ing th e bac teria stand ard in Pu get S ou nd .
0 15 307.5
Miles
Prod u c ed by GISProjec t: K:\Projec ts\Y2012\12-05362-000\Projec t\Task_6_Report\water_sam ples_pu blic _beac h .m xd (10/31/2013)
Legend!( Not m onitored
Insu ffic ient d ata ( <10 sam ples)No sam ples exc eed c riterion≤ 7.5% of sam ples exc eed c riterion> 7.5% of sam ples exc eed c riterionAc tion area bou nd ary
Coord inates: NAD83 Wah ingtonS tate Plane North (feet)
Note: Bacteria standard is 104 MPN/100 mL for Enterococcus.


!!
!!
!!
!!
!!
!!
!!
!C
!C
!C
!C
!C
!C
!C
!C
!C
!C!C
!C
!C
!C
!C
!C
!C
!C
!C
!C
!C
!C
!C
!C!C
!C
!C
!C
!C
!C
!C
!C
!C
!C
!C
!C
!C
!C
!C
!C
!C
!C !C
!C
!C
!C
!C
!C
!C
!C
!C
!C
!C
!C
!C
!C
!C
!C
!C
!C
!C
!C!C
!C
!C
!C
!C
!C
!C
!C
!C
!C
!C
!C!C
!C
!C
!C!C
!C
!C
!C
!C
!C
!C
!C
!C
!C
San Juan / Whatcom
Strait of Juan de Fuca
Whidbey Basin
Hood Canal
South Puget Sound
North CentralPuget Sound
South Central Puget Sound
British Columbia
Seattle
Tacoma
Everett
Auburn
Renton
Bellingham
Olympia
Marysville
Mount Vernon
Port Angeles
7
6
5
4
King
Clallam
Skagit
Jefferson
Whatcom
Snohomish
Pierce
Mason
Grays Harbor
Kitsap
San Juan
Kittitas
ThurstonYakima
Island
£¤101
£¤2
UV18
UV104
UV16
UV167
UV512
UV520
UV104
¥¦90
¥¦5
¥¦405
¥¦90
3
2
1
633600
633600
712800
712800
792000
792000
871200
871200
950400
950400
1029600
1029600
1108800
1108800
1188000
1188000
1267200
1267200
1346400
1346400
1425600
1425600
1504800
1504800
0 0
7920
0
7920
0
1584
00
1584
00
2376
00
2376
00
3168
00
3168
00
3960
00
3960
00
4752
00
4752
00
5544
00
5544
00
6336
00
6336
00
7128
00
7128
00
Figure 6.Classification of commercial shellfishgrowing areas in Puget Sound.
0 15 307.5
Miles
Produced by GISProject: K:\Projects\Y2012\12-05362-000\Project\Task_6_Report\commercial_shellfish.mxd (12/12/2013)
LegendCommercial shellfish growing area
ApprovedConditionalProhibitedRestrictedUnclassified
Threatened growing area1 Padilla Bay2 South Skagit Bay3 Port Townsend4 Dyes Inlet5 Burley Lagoon6 Pickering Passage7 Filucy Bay!C Wastewater treatment plant
Action area boundary
Coordinates: NAD83 WahingtonState Plane North (feet)


!C
!C
!C
!C
!C
!C
!C
!C
!C
!C!C
!C
!C
!C
!C
!C
!C
!C
!C
!C
!C
!C
!C
!C!C
!C
!C
!C
!C
!C
!C
!C
!C
!C
!C
!C
!C
!C
!C
!C
!C
!C !C
!C
!C
!C
!C
!C
!C
!C
!C
!C
!C
!C
!C
!C
!C
!C
!C
!C
!C
!C!C
!C
!C
!C
!C
!C
!C
!C
!C
!C
!C
!C!C
!C
!C
!C!C
!C
!C
!C
!C
!C
!C
!C
!C
San Juan / Whatcom
Strait of Juan de Fuca
Whidbey Basin
Hood Canal
South Puget Sound
North CentralPuget Sound
South Central Puget Sound
British Columbia
Seattle
Tacoma
Everett
Auburn
Renton
Bellingham
Olympia
Marysville
Mount Vernon
Port Angeles
King
Clallam
Skagit
Jefferson
Whatcom
Snohomish
Pierce
Mason
Grays Harbor
Kitsap
San Juan
Kittitas
ThurstonYakima
Island
£¤101
£¤2
UV18
UV104
UV16
UV167
UV512
UV520
UV104
¥¦90
¥¦5
¥¦405
¥¦90
633600
633600
712800
712800
792000
792000
871200
871200
950400
950400
1029600
1029600
1108800
1108800
1188000
1188000
1267200
1267200
1346400
1346400
1425600
1425600
1504800
1504800
0 0
7920
0
7920
0
1584
00
1584
00
2376
00
2376
00
3168
00
3168
00
3960
00
3960
00
4752
00
4752
00
5544
00
5544
00
6336
00
6336
00
7128
00
7128
00
Figure 7.Status of recreational shellfish harvesting areas in Puget Sound.
0 15 307.5
Miles
Produced by GISProject: K:\Projects\Y2012\12-05362-000\Project\Task_6_Report\recreational_shellfish.mxd (12/12/2013)
LegendRecreational shellfish beach
ApprovedClosedConditionalUnclassified
!C Wastewater treatment plantAction area boundary
Coordinates: NAD83 WahingtonState Plane North (feet)


December 2013
Draft Petition to Designate the Waters of Puget Sound as a No Discharge Zone 29
The abundance of nutrients is responsible for the incredible biomass and biodiversity supported by Puget Sound, but it is also a liability because excessive amounts of nutrients lead to increased algal growth, causing eutrophication and increased frequency of harmful algal blooms (HABs).
Nitrogen is the limiting nutrient for algal growth in Puget Sound during the summer months. As a result, increases in nitrogen during the summer can cause a corresponding increase in algae production. Most species of algae cause little direct harm to the aquatic environment. However, when the algae die and decompose, oxygen levels in the water column can be depleted, resulting in oxygen concentrations that are too low to support fish and other aquatic life. Dissolved oxygen is discussed in greater detail in the following section.
Another problem associated with increased algae growth is the potential for development of harmful algal blooms (HABs). HABs which are caused by the proliferation of acutely toxic algae, pose a risk to humans and marine life. Shellfish may accumulate dangerous levels of biotoxins during HAB events. Consumption of contaminated shellfish by humans, marine mammals, and birds leads to illnesses such as paralytic shellfish poisoning or amnesic shellfish poisoning. HABs can also pose a risk to bathers and pets exposed to the water. WDOH regularly monitors biotoxin levels in shellfish collected in commercial growing areas and at some recreational beaches. HABs most frequently cause shellfish bed closures and advisories during the summer. HABs can occur in both fresh and saltwater, so the lakes included in the NDZ also have the potential to experience HABs. While it is as yet unknown what causes algae to start developing biotoxins, any discharge of waste and resultant change in chemical characteristic of the water, such as from vessels, is a potential concern.
Dissolved Oxygen
Dissolved oxygen depletion in Puget Sound is related to nutrient enrichment and water stratification and circulation. In many regions of Puget Sound, low DO is a natural consequence of the Sound’s deep, fjord-like bathymetry, where water column stratification and slow flushing lead to long residence times of deep water that is not in contact with the atmosphere. Low DO concentrations and related fish kills in Hood Canal have been observed as early as the 1950s (Turney 2004), suggesting that low DO is not a new phenomenon. However, there is some evidence to suggest that the frequency and severity of low DO events, particularly in Hood Canal and South Puget Sound, are increasing in severity and duration (Turney 2004; PSP 2011b). For example, DO concentrations in Hood Canal in late summer 2010 were the lowest on record. Given the increase in human activities over the past 50 years (e.g., development, recreation, deforestation, and other watershed modifications), it is suspected that human factors are leading to increasing DO problems (PSP 2011b).
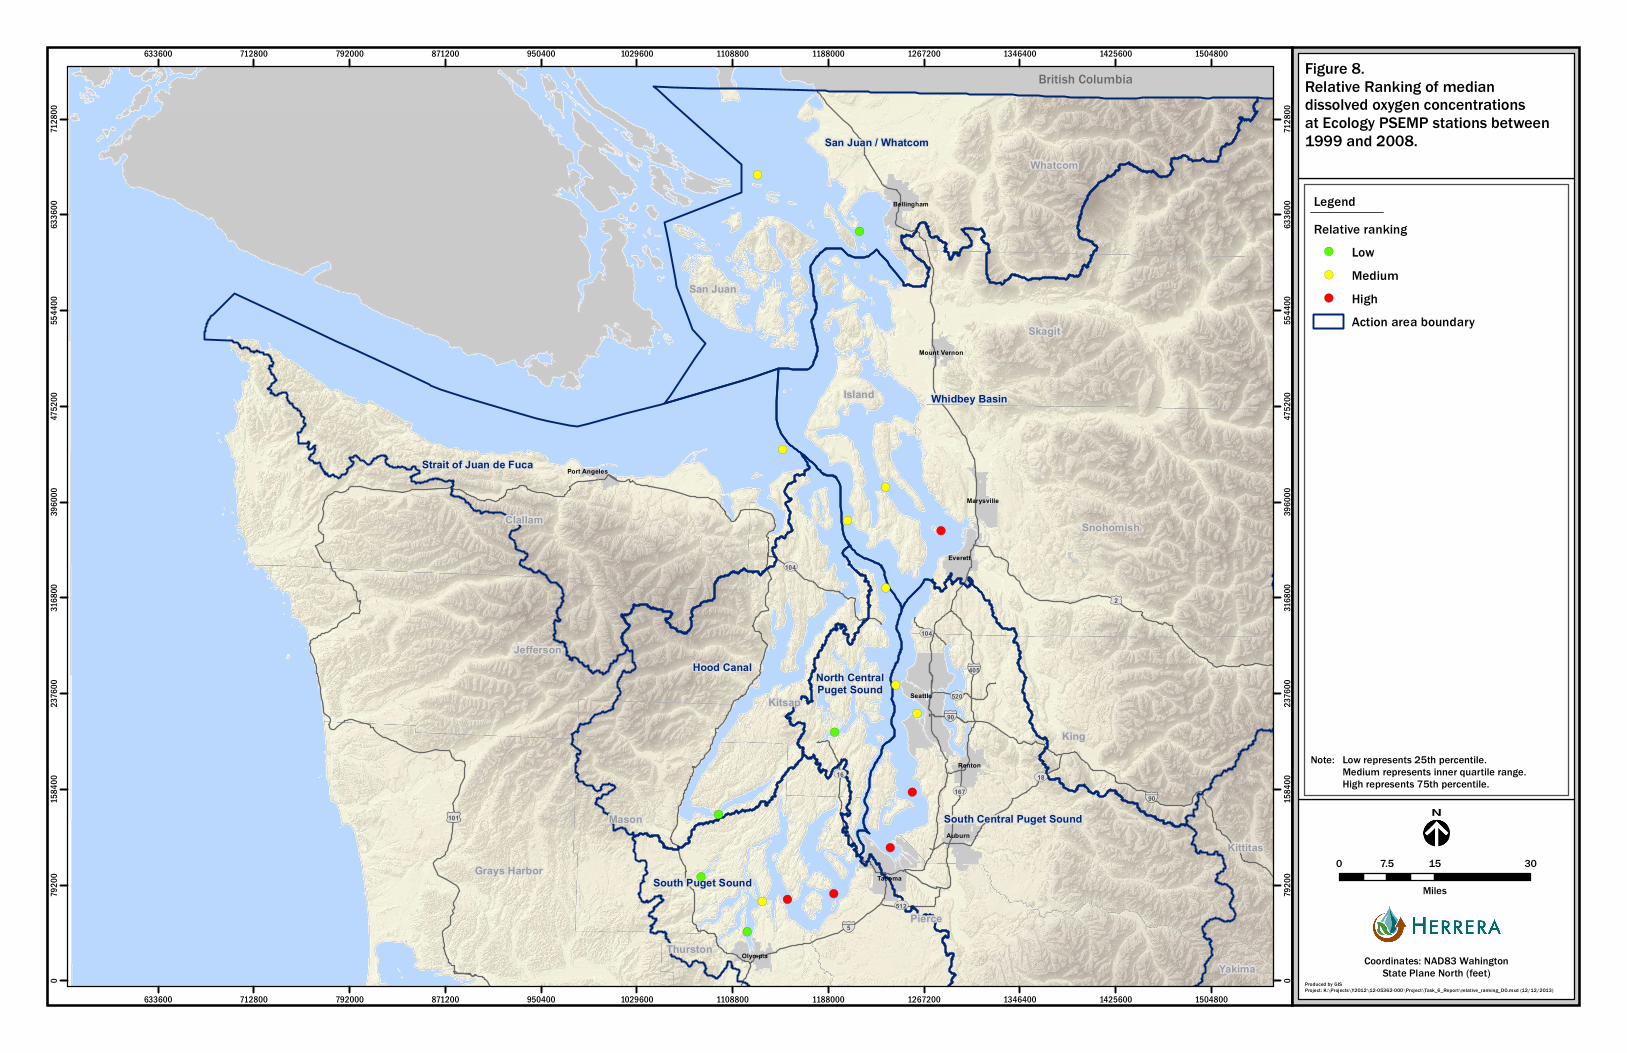
Dissolved oxygen problems are not limited to Hood Canal and South Puget Sound. Low DO is present seasonally at many locations. Figure 8 identifies Ecology’s PSEMP water quality monitoring stations and the frequency of low DO concentrations at those stations. The spatial distribution of DO problems is also visible on Figure 9, which shows waters impaired due to low DO. While the number and severity of low DO occurrences is highest in Hood Canal and South Puget Sound, low DO events have been documented throughout Puget Sound. These typically occur in protected embayments with poor flushing.

December 2013
30 Draft Petition to Designate the Waters of Puget Sound as a No Discharge Zone
Toxic Contaminants
Human activities have also resulted in the introduction or increase in a number of toxic contaminants in Puget Sound. There are many pathways by which these chemicals have entered the water. They may have been discharged by factories, deposited from the air, or have been washed off the land surface via rainwater. Vessel sewage, even when treated, is a source of contaminants. For example, treated vessel sewages contain disinfection chemicals like chlorine and formaldehyde which are toxic to both humans and marine life. Vessel sewage discharges also contain personal care products and excreted pharmaceuticals which can cause reproductive problems in animals.
4.7. Existing Pollutant Reduction Measures
Many water quality improvement programs are underway throughout the Puget Sound basin. These programs are administered at all levels of government (federal, tribal, state, county, and municipal) and also include efforts by community-based, non-profit organizations. The scope of the programs range from adoption of federal and state regulations aimed at reducing non-point source pollution, to small tributary- or parcel-scale cleanup and mitigation efforts. These efforts are addressing pollution from many different sources, including; stormwater runoff, agricultural runoff, industrial and wastewater discharges, failing septic systems, and combined sewer outfalls, to name a few. The main directive of the Puget Sound Partnership (PSP) is to coordinate and track these efforts. The PSP has established recovery targets for multiple indicators and an Action Agenda for meeting those targets. Details on the Action Agenda, recovery targets, and ongoing work for improving Puget Sound can be found at the PSP Action Agenda web page (http://www.psp.wa.gov/action_agenda_center.php).
Several voluntary and compulsory measures are in place to reduce vessel sewage discharges into Puget Sound or reduce their impact. Section 312 of the CWA prohibits discharge of untreated vessel sewage within 3 miles from shore within state boundaries, which is generally assumed to include most inland waters of Puget Sound. Most of the cruise ships that transit through Puget Sound have agreed to a voluntary memorandum of understanding that prohibits them from discharging sewage within Puget Sound without seeking special advanced treatment permission from Ecology. Via funding through the CVA, Washington State Parks has worked to build a network of pumpout facilities available to recreational boaters to safely discharge sewage waste to land based facilities.
Even with measures in place to reduce vessel sewage discharges, Puget Sound is still vulnerable to many of the impacts related to such discharges. The treated vessel sewage that is allowed to be discharged under existing regulations, still degrades water quality and poses a potential health threat. As described below, bacteria levels in treated vessel sewage is typically far higher than state water quality standards and far higher than what is allowed by municipal wastewater treatment facilities. And, as described previously, these vessel discharges can occur directly over or very near shellfish beds and recreational beaches and swimming areas. In addition, some of the sewage discharge reduction measures, such as the MOU signed by cruise ship operators are voluntary and may be halted at any time.
San Juan / Whatcom
Strait of Juan de Fuca
Whidbey Basin
Hood Canal
South Puget Sound
North CentralPuget Sound
South Central Puget Sound
!(
!(
!(
!(
!(
!(
!(
!(
!(
!(
!(
!(
!(
!(
!(
!(
!(
!(
British Columbia
Seattle
Tacoma
Everett
Auburn
Renton
Bellingham
Olympia
Marysville
Mount Vernon
Port Angeles
King
Clallam
Skagit
Jefferson
Whatcom
Snohomish
Pierce
Mason
Grays Harbor
Kitsap
San Juan
Kittitas
ThurstonYakima
Island
£¤101
£¤2
UV18
UV104
UV16
UV167
UV512
UV520
UV104
¥¦90
¥¦5
¥¦405
¥¦90
633600
633600
712800
712800
792000
792000
871200
871200
950400
950400
1029600
1029600
1108800
1108800
1188000
1188000
1267200
1267200
1346400
1346400
1425600
1425600
1504800
1504800
0 0
7920
0
7920
0
1584
00
1584
00
2376
00
2376
00
3168
00
3168
00
3960
00
3960
00
4752
00
4752
00
5544
00
5544
00
6336
00
6336
00
7128
00
7128
00
Figure 8.Relative Ranking of median dissolved oxygen concentrations at Ecology PSEMP stations between 1999 and 2008.
0 15 307.5
Miles
Produced by GISProject: K:\Projects\Y2012\12-05362-000\Project\Task_6_Report\relative_ranking_DO.mxd (12/12/2013)
LegendRelative ranking!( Low!( Medium!( High
Action area boundary
Coordinates: NAD83 WahingtonState Plane North (feet)
Note: Low represents 25th percentile. Medium represents inner quartile range. High represents 75th percentile.


San Juan / Whatcom
Strait of Juan de Fuca
Whidbey Basin
Hood Canal
South Puget Sound
North CentralPuget Sound
South Central Puget Sound
British Columbia
Seattle
Tacoma
Everett
Auburn
Renton
Bellingham
Olympia
Marysville
Mount Vernon
Port Angeles
King
Clallam
Skagit
Jefferson
Whatcom
Snohomish
Pierce
Mason
Grays Harbor
Kitsap
San Juan
Kittitas
ThurstonYakima
Island
£¤101
£¤2
UV18
UV104
UV16
UV167
UV512
UV520
UV104
¥¦90
¥¦5
¥¦405
¥¦90
633600
633600
712800
712800
792000
792000
871200
871200
950400
950400
1029600
1029600
1108800
1108800
1188000
1188000
1267200
1267200
1346400
1346400
1425600
1425600
1504800
1504800
0 0
7920
0
7920
0
1584
00
1584
00
2376
00
2376
00
3168
00
3168
00
3960
00
3960
00
4752
00
4752
00
5544
00
5544
00
6336
00
6336
00
7128
00
7128
00
Figure 9.Impaired waters due to lowdissolved oxygen.
0 15 307.5
Miles
Produced by GISProject: K:\Projects\Y2012\12-05362-000\Project\Task_6_Report\impaired_water_bacteria_DO.mxd (10/31/2013)
LegendImpaired water
Dissolved oxygenAction area boundary
Coordinates: NAD83 WahingtonState Plane North (feet)


December 2013
Draft Petition to Designate the Waters of Puget Sound as a No Discharge Zone 35
4.7.1. Marine Sanitation Devices
Even though it is required that sewage discharged from vessels in Puget Sound is treated by an MSD, such discharges can still degrade water quality. A range of types and expected performance from the MSDs are currently available. Table 3 summarizes the treatment performance standards for each type of MSD and compares them to bacterial water quality standards. For all types of MSDs, the vessel technology treatment standard for bacteria is lower than the Washington State water quality standard for primary contact recreation (Table 1, Table 3) (USACE 2004). Additionally, many MSDs often perform far below the mandated treatment standards under normal use (US EPA 2008). There are also concerns over the impacts associated with the disinfection chemicals that are used and then released to the environment.
Results from a survey conducted in 2012 indicate that approximately 96 percent of survey respondents indicated that the recreational vessels used on Puget Sound have an MSD. The overwhelming majority (91 percent) had a holding tank (Herrera 2013) and was required to use pumpout facilities under existing state environmental laws. About 5 percent of the vessel population used Type I or Type II MSDs. A holding tank would need to be installed on these vessels in addition to, or instead of, the existing MSD to be able to comply with a NDZ.
Commercial vessel operators were contacted directly or sent questionnaires regarding marine sanitation practices in the summer of 2012. Most commercial vessels had a Type II MSD, and many commercial vessels had a holding tank installed in addition to the treatment device. Some vessels, particularly tug boats, only had a Type II MSD (i.e., no holding tank). As with the recreational vessels, a holding tank would need to be installed on these vessels in addition to, or instead of, the existing MSD to be able to comply with a NDZ.

December 2013
36 Draft Petition to Designate the Waters of Puget Sound as a No Discharge Zone
Table 3. Marine Sanitation Device Summary.
MSD Type
Allowable Vessel
Installations Primary Mode of
Operation
Discharge Currently Allowed
in Washington Waters?
USCG Treatment Standards
Bacteria Standard for Primary Contact Recreation and Extraordinary Aquatic
Life Use
Bacteria Standard for Secondary Contact Recreation and Fair
Aquatic Life Use
Type I Recreational vessels <69 feet in length
Maceration / Chlorination
Yes No visible floating solids: A fecal coliform bacteria count not greater than
1,000 per 100 mL Fecal coliform organism levels must not exceed a geometric
mean value of 14 colonies/100 mL, with not more than 10% of all samples (or any single sample when < 10 sample points exist)
obtained for calculating the geometric mean value > 43 colonies/100 mL.
Enterococci organism levels must not exceed a
geometric mean value of 70 colonies/100 mL, with not more than 10% of all samples (or any single
sample when < 10 sample points exist) obtained for calculating the geometric
mean value > 208 colonies/100 mL.
Type II All vessels Aeration, Clarification, Disinfection
Yes A fecal coliform bacteria count not greater than
200 per 100 mL; no more than 150 milligrams of
total suspended solids per liter
Type III All vessels Holding Tank No Storage only. No discharge allowed and
therefore no performance standard.
AWTS All vesselsa Biological reactor / UV Sterilization
Yes Same as Type II
a While AWTS are allowed on any vessel type, they are large and costly, therefore they are typically only installed on large passenger vessels. AWTS = Advanced Wastewater Treatment System USCG = US Coast Guard UV = ultraviolet mL = milliliters

December 2013
Draft Petition to Designate the Waters of Puget Sound as a No Discharge Zone 37
5. VESSEL POPULATION
Evaluating whether access to pumpout facilities is sufficient to meet the requirements of CWA 312(f)(3) begins with estimating the vessel population of the water body. Since Puget Sound experiences high volumes of recreational and commercial vessel traffic, and the sewage disposal considerations are vastly different between the two vessel groups, they will be discussed separately.
5.1. Recreational Vessels
Two methods were used to estimate the recreational vessel population of Puget Sound. One method was based on boater registration records obtained from the Washington State Department of Licensing (DOL), and the second was obtained by counting the number of moorages and slips available to boaters. The results from both methods are described below.
Table 4 and Figure 10 provide a summary of the vessel registration data from 2011, which was obtained from DOL. (While vessel registration does vary between years from 2005 to 2011, the relative standard deviation in vessel registrations was less than 1 percent; therefore, 2011 registration data can be considered representative of the current vessel population.) The data lists the number of boats registered in each county by size class. In 2011, there were 153,103 vessels registered in the counties adjacent to Puget Sound. This number includes recreational vessels as well as some commercial vessels registered in Washington State. This data set is not a perfect measure of boats using Puget Sound. For example, not every vessel registered in a county adjacent to Puget Sound is moored or operated in the same county, or even in Puget Sound, and many boats may be exclusively used on lakes and rivers. Conversely, a vessel which is moored and operated in Puget Sound may be registered somewhere far away. It is believed that the number of registered vessels listed by county in Table 4 represents a conservative (high) estimate of the potential recreational vessel population.
Not all of the registered vessels would require access to pumpout facilities. Smaller boats, such as day sailors or runabouts that are used for excursions of a few hours in length rather than for entire days, do not typically have any kind of toilet facility or MSD. If boats shorter than 21 feet in length are subtracted from the DOL database (i.e., counting only boats 21 feet in length and larger), there are a total of 43,677 registered vessels. This represents the maximum population of locally registered recreational vessels that might require access to pumpout facilities or services under NDZ regulations. A small number of registered vessels may also be small, locally registered, commercial vessels such as fishing boats or tug boats, which are included in the registration data and would result in an overestimate of the number of recreational vessels.
Not surprisingly, there are more registered vessels in counties with larger populations, i.e., Snohomish, King, Pierce, and Thurston counties. Similarly, there are more large vessels (those likely requiring access to pumpout facilities) in the more populated counties bordering Puget Sound. Although vessels may be registered in one county and moored or operated in another,

December 2013
38 Draft Petition to Designate the Waters of Puget Sound as a No Discharge Zone
Figure 10. Puget Sound Vessel Registrations by County and Vessel Length.

December 2013
Draft Petition to Designate the Waters of Puget Sound as a No Discharge Zone 39
there is likely a correlation between registration location and boat location. Therefore, there is probably a greater need for pumpout stations in the more populated areas of Puget Sound than in the less populated areas.
Table 4. Vessel Registrations by Vessel Length and County in 2011.
County
Vessel Length Total
Registered Under 16 Feet 16-20 Feet 21-40 Feet Over 40 Feet
Clallam 1,414 1,565 771 64 3,814
San Juan 696 601 1,303 229 2,829
Whatcom 2,501 2,850 2,669 259 8,279
Island 2,254 2,104 1,180 75 5,613
Skagit 2,920 2,844 2,517 458 8,739
Snohomish 9,013 9,748 5,469 253 24,483
Jefferson 809 731 891 104 2,535
Mason 1,693 1,975 679 44 4,391
Kitsap 3,372 4,012 2,978 377 10,739
King 14,508 17,520 13,754 1,742 47,524
Pierce 8,457 10,884 5,283 477 25,101
Thurston 2,986 3,969 1,938 163 9,056
Total 50,623 58,803 39,432 4,245 153,103
The number of recreational vessels was also estimated by counting moorages and slips available to Puget Sound boaters. The number and location of moorages (slips and buoys) were estimated by conducting a virtual flyover of Puget Sound using Google Earth imagery captured during the summers of 2011 and 2012. Marina slips (both vacant and occupied), as well as vessels moored at popular mooring areas (e.g., Sucia Island in the San Juan Islands), were counted. During the virtual flyover, all marina slips, as well as any group of more than 15 moored vessels (signifying a mooring field) were counted and recorded. This data was used to create a map showing the concentrations of moorages (Figure 11). Individual marinas were not singled out because the goal of this exercise was to determine the potential number of boats in a given geographic area, rather than a marina-by-marina assessment of boater population. Personal moorages (i.e., shoreside docks and personal mooring buoys) were not counted. Boats stored at personal moorages are thought to only represent a small portion of the total vessel population, and in many cases the boats that are moored at personal moorages are less than 21 feet in length and, therefore, would not have toilet facilities. Therefore, excluding boats stored at personal moorages is not thought to have significantly affected the accuracy of this vessel population estimate.
Vessel moorage capacity provides a valuable insight into where and how many boats there may be in Puget Sound. Larger vessels, particularly those with MSDs, are likely to be moored during the boating season. Smaller vessels are likely to be trailered. Therefore, using moorage capacity (i.e., the number of slips and buoys available for boats) ensures that fewer vessels without MSDs are included in the total vessel count. Slips used by commercial fishing boats and other

December 2013
40 Draft Petition to Designate the Waters of Puget Sound as a No Discharge Zone
smaller commercial vessels would have been included in the estimate, but it was estimated that this would account for only about 500 vessels (Herrera 2012b).
There are approximately 23,555 moorages in Puget Sound, based on the virtual flyover estimate (Figure 11). While this number is much smaller than the number of registered vessels over 21 feet (43,677), similar, albeit more detailed spatial patterns, were observed. For example, as with registered vessels, there are much higher concentrations of moorages in more urban and populated areas (e.g., Seattle, Everett, and Tacoma). But, there are also a large number of moorages in popular boating destinations like the San Juan Islands, Anacortes, and Bellingham. The Strait of Juan de Fuca and the area around Whidbey Island have the lowest number of moorages compared with the rest of Puget Sound.
The method used for estimating the number of moorages underestimates the total Puget Sound moorage capacity. Personal moorages were not counted, and neither were areas with less than 15 slips or moorages. There are many personal moorages and small marinas with less than 15 slips throughout Puget Sound, particularly in Hood Canal and Lake Washington, so this method could be underestimating the available moorages by a thousand moorages or more. It is generally accepted that smaller boats (those less likely to have toilet facilities beyond a porta-potty) are found at personal moorages, so ignoring this sector is not expected to contribute to a significant underestimate of the need for pumpout facilities. However, many of those vessels moored at smaller marinas are likely to be large enough to contain an MSD, so leaving them out could lead to an underestimate of pumpout facility needs. Conversely, this exercise counted slips and buoys, not boats. Although some marinas may operate at full capacity during peak seasons, many do not. To meet the needs of a mobile boating population, there needs to be an excess of moorages to allow boaters to move freely between areas, so it can be assumed that there are fewer boats than the total number of moorages available. The various problems (overestimates and underestimates) with the methodology may balance each other out to some extent. Overall, however, the results obtained by using this methodology likely represent an overestimate of the boat population, albeit less of an overestimate than what was calculated based on DOL registration information.
5.2. Commercial Vessels
Many different sizes and types of commercial vessels frequent Puget Sound. They range from smaller vessels used for charter fishing to huge freighters, tankers, and cruise ships. The number of commercial vessels was estimated from a study conducted by the Puget Sound Maritime Air Forum (Starcrest 2007). According to that study, there were 2,937 entries of large oceangoing vessels into Puget Sound in 2005 (Table 5). It was estimated that there are 678 other commercial vessels that operate mostly within Puget Sound (e.g., escort tugs) or have Puget Sound as their home port (e.g., the fleet of fishing vessels that travels to Alaska each year) (Table 6). Since the location of commercial vessels is more dynamic than that of recreational vessels, the question is less about the absolute number of commercial vessels in Puget Sound and more about vessel traffic patterns such as how many, what kind, and where are vessels operating at a given time.
Most commercial vessels are required to send out an Automated Identification System (AIS) signal (US Department of Homeland Security 2013). The AIS signal announces a ship’s identity,

San Juan / Whatcom
Strait of Juan de Fuca
Whidbey Basin
Hood Canal
South Puget Sound
North CentralPuget Sound
South Central Puget Sound
!(
!(!(
!(
!.!
!(
!.!
!.!
!( !.!
!.!
!.!
!.!
!.!
!(
!(
!.!!.!!.!
!(
!.!
!( !.! !(!(
!.!
!.!!(
!(
!.!
!.!
!.!
!(
!.!
!(!(
!.!
!.!
!.!
!.!
!(
!(
!(
!.!
!(
!(
!.!
!.!
!(
!(
!(
!(
!.!
!.!
!.!
!(
!.!
!(
!.!
!.!
!(
!.!
!.!!.!
!.!
!.!
!.!
!.!
!.!
!.!
!.!
!.!
!.!!(
!.!
!(
!(
!.!
!(
!.!
!(
!.!
!.!
!.!
!.!
!(!(
!(
!.!
!.!
!(
!.!
!.!
!.!
!(
!.!
!(
!(
!.!
#*
#*
#*
#*
#*#*
#*
#*
#*
#*
#*
#*
#*
British Columbia
Seattle
Tacoma
Everett
Auburn
Renton
Bellingham
Olympia
Marysville
Mount Vernon
Port Angeles
King
Clallam
Skagit
Jefferson
Whatcom
Snohomish
Pierce
Mason
Grays Harbor
Kitsap
San Juan
Kittitas
ThurstonYakima
Island
£¤101
£¤2
UV18
UV104
UV16
UV167
UV512
UV520
UV104
¥¦90
¥¦5
¥¦405
¥¦90
633600
633600
712800
712800
792000
792000
871200
871200
950400
950400
1029600
1029600
1108800
1108800
1188000
1188000
1267200
1267200
1346400
1346400
1425600
1425600
1504800
1504800
0 0
7920
0
7920
0
1584
00
1584
00
2376
00
2376
00
3168
00
3168
00
3960
00
3960
00
4752
00
4752
00
5544
00
5544
00
6336
00
6336
00
7128
00
7128
00
Figure 11.Estimates of Moorage Numberand Locations and Public Pumpout Facilities in Puget Sound.1
0 15 307.5
Miles
Produced by GISProject: K:\Projects\Y2012\12-05362-000\Project\Task_6_Report\marinas_pumpouts_landscape.mxd (9/24/2013)
LegendMoorage Count
< 2525 - 100100 - 500500 - 1000
> 1000#* Mobile pumpout2
!( Pumpout only!.! Pumpout with dump station
Action area boundary
Coordinates: NAD83 WahingtonState Plane North (feet)
Notes:1. Pumpout facility information is continually changing. For up-to-date information, the Washington State Parks pumpout database should be accessed.
2. Mobile pumpout locations indicate the home marina for the pumpout vessels. The area serviced by each vessel, and maximum distance traveled varies by company and the demand for their services.


December 2013
Draft Petition to Designate the Waters of Puget Sound as a No Discharge Zone 43
type, and position in real time. The data is used by the US Coast Guard for homeland security purposes and by ship captains to help avoid collisions. Some larger recreational vessels (such as yachts) may also use an AIS system and, therefore, would be included in this dataset.
Table 5. Oceangoing Vessel Entries into Puget Sound for 2005.
Vessel Type Number of Vessels
Auto Carriers 188
Bulk Carriers 310
Container Ships 1,336
Cruise Ships 167
General Cargo 169
Oceangoing Tugs 146
Miscellaneous 16
Reefer 5
Roll on Roll Off 133
Tanker 467
Total 2,937
Table 6. Puget Sound Harbor Vessel Population for 2005.
Harbor Craft Vessel Type Number of Vessels
Commercial Fishing 347
Ocean Tugboats 68
Harbor Tugboats 60
Excursion 60
Government 52
Ferry 45
Workboat 27
Assist and Escort Tugboats 19
Total 678
Automated Identification System data for 2005 was collected and compiled by the George Washington University Engineering Management and Systems Engineering Department. This data set is a compilation of every transit by large vessels with AIS transponders. The geographic units for this analysis were ‘Action Areas,’ which were assigned by PSP as part of the Action Agenda. The boundaries of each action area are depicted on all the maps included in this document. The data was combined and summarized to reveal traffic density for each vessel type by day, and for each Action Area, as shown in Table 7.
Traffic density, for the purpose of this analysis, is defined as the total number of signals (the number of vessels) received in 2005, divided by 365 (the number of days in the year), and divided again by the square mileage of the Action Area. The result of this calculation gives an average

December 2013
44 Draft Petition to Designate the Waters of Puget Sound as a No Discharge Zone
number of vessels that passed through each square mile of an Action Area on any given day. Data from the table can be interpreted in many ways. The table can be used to determine which type of commercial vessels have the highest average density in Puget Sound (i.e., fishing vessels); which Action Area has the greatest density of commercial vessels (i.e., South Central Puget Sound); and, for individual Action Areas, which commercial vessels are dominant (for example in South Puget Sound, the tug-barge category has the greatest density, while in North Central Puget Sound, it is ferry traffic).
Table 7. Vessel Traffic Density (number of signals/mile2/day) by Vessel Type and Action Area in 2005 for the VTRA Model.
Action Area Cargo Ship Ferry
Fishing Vessel
Military Vessel
Passenger Ship
Research-Other
Sail-Whale
Tug-Barge Total
Strait of Juan de Fuca
5.82 0.65 6.81 0.86 0.34 0.23 0.49 2.69 17.89
San Juan/ Whatcom
2.89 1.98 17.62 1.19 0.35 0.04 0.50 4.31 28.88
Whidbey Basin 0.74 3.70 17.59 0.65 0.08 0.10 1.71 5.87 30.43
North Central Puget Sound
3.09 14.71 2.37 2.28 0.40 0.38 3.65 8.98 35.85
South Central Puget Sound
1.73 50.02 1.60 2.54 0.39 0.20 7.15 14.42 78.04
South Puget Sound
0.03 0.00 0.00 1.26 0.00 0.00 1.88 9.60 12.78
Hood Canal NA NA NA NA NA NA NA NA NA
Total Puget Sound 3.90 5.35 9.91 1.18 0.32 0.17 1.30 4.87 26.99
VTRA = Vessel Traffic Risk Assessment
The South Central Puget Sound Action Area experiences the most commercial vessel traffic for almost all vessel categories (Table 7, Figure 12). The majority of the traffic is ferry vessels, but there is also a substantial amount of tugboat and ‘sail whale’ traffic (yachts and whale-watching boats), followed by the other vessel categories. Cargo ship and fishing vessel traffic is highest along transit routes (such as the Strait of Juan de Fuca) and where there are major ports and refineries.
Washington State Department of Transportation Ferries and U.S. military vessels use their own pumpout facilities (Herrera 2012b). Therefore, for the purpose of this analysis, these vessel categories were omitted, as their need for access to pumpout facilities is already met and would not be affected by the institution of a NDZ. When ferries and military vessels are omitted (Figure 13) patterns in traffic among the other vessel categories become more apparent. Fishing vessels are the dominant vessel traffic category in the San Juan/Whatcom, Whidbey Basin, and the Strait of Juan de Fuca Action Areas. Tugs and barges are the dominant vessel traffic category in North and South Central Puget Sound, and the South Puget Sound Action Areas, although tug and barge traffic is moderately high in all of the Action Areas. Sail-whale activity is largely limited to the more urban action areas.

December 2013
Draft Petition to Designate the Waters of Puget Sound as a No Discharge Zone 45
Figure 12. Summary of All Commercial Vessel Traffic in Puget Sound.

December 2013
46 Draft Petition to Designate the Waters of Puget Sound as a No Discharge Zone
Figure 13. Selected Commercial Vessel Traffic in Puget Sound.

December 2013
Draft Petition to Designate the Waters of Puget Sound as a No Discharge Zone 47
Many, if not most commercial vessels, will not have to modify their routines or vessels to be able to comply with the NDZ. The majority of large freight vessels (Table 5) and the commercial fishing fleet that works out of Alaska, already hold their waste and discharge it outside of State waters, although these are voluntary measures. All WSDOT ferries and U.S. military vessels have holding tanks and use large scale pumpout facilities where they are moored. It appears from the research that the primary vessels that may have to change their practices and likely retrofit their vessels are tug boats and those commercial fishing boats that operate almost exclusively within the proposed NDZ.


December 2013
Draft Petition to Designate the Waters of Puget Sound as a No Discharge Zone 49
6. PUMPOUT FACILITIES
6.1. Pumpout Facilities for Recreational Vessels
A review of Puget Sound pumpout facilities and mobile pumpout services conducted in the spring of 2013 documented that there are 113 publicly accessible, land-based pumpout facilities and 12 pumpout boats that operate in Puget Sound (Herrera 2013). The locations of the pumpout facilities and home harbors for the pumpout boats are shown on Figure 11 and Table 8. Details for each facility consistent with the requirements of CWS 312(f)(3) are included in Appendix A. (Ecology will confirm the final number of pumpout facilities and provide missing details before the final petition is submitted to EPA.)
Pumpout facilities and mobile services appear to be conveniently located for most Puget Sound boaters. Land-based pumpout facilities appear to be approximately proportionally distributed with vessel population. Likewise, the pumpout boats operate in the areas where there are more boats. Figure 11 shows pumpout facilities and mobile pumpouts with moorage locations. Clearly, there are more pumpouts where there are the more boats. Even where there are only a small number of moorages, there is usually a pumpout close by, or the area is within the service areas of the pumpout boats (Table 8).
Based on CVA guidelines, the Puget Sound area, overall, has plenty of pumpout facilities to serve the recreational vessel population. The CVA guidelines suggest that there should be a ratio of between 300 to 600 boats per pumpout during the period of peak occupancy. The definition of occupancy rate and a detailed procedure on completing the CVA calculations is described in the CVA guidelines (CVA 1994). Based on DOL vessel registration data, there are a maximum of 43,667 boats in Puget Sound that could require access to pumpout facilities. At the 40 percent peak occupancy rate recommended by the CVA guidelines, 17,467 of the 43,667 boats would require access to a pumpout facility during peak boating season. Under this scenario, there would be a ratio of 177 boats for each pumpout facility, not including the mobile services. Using the lower and probably more reasonable boat population estimate of 23,555 obtained from the moorage count, and the same 40 percent occupancy rate (9,422 boats), there would be a ratio of 96 boats per pumpout, not including the mobile services. By these calculations, the Puget Sound has at a minimum nearly two times, to a maximum of more than six times, more pumpout facilities than what is suggested in the CVA guidelines. A few respondents to the boater survey indicated that there are some locations where access to pumpout facilities could be improved. . Although the overall capacity for recreational vessels comfortably exceeds the guidelines Ecology is continuing to work on adding additional pumpouts in key areas.
6.2. Pumpout Facilities and Commercial Vessels
The sewage management considerations of large commercial vessels are different than those of small recreational vessels. The ability of large commercial vessels to comply with NDZ regulations is dependent on the vessel’s sewage holding capacity.

December 2013
50 Draft Petition to Designate the Waters of Puget Sound as a No Discharge Zone
Table 8. Mobile Pumpout Services Available to Puget Sound Boaters.
Company Service Areas Number of Boats Price
Primary Type of Vessels Serviced
Capacity to Serve Large Vessels
Where Is Pumped Sewage Disposed?
Terry and Sons Seattle Area 1 Free All vessels Yes Public pumpouts
Rose Head Service
Port Everett Only 1 $15-23 All vessels Yes Public pumpout
SS Head Seattle Area 2 $20 and up 95% liveaboard Yes Seattle wastewater system
Seattle Sanitation Service
Seattle Area 1 $25 Primarily liveaboards Yes Seattle wastewater system
Pelican Pump Olympia Area 1 ~$24 (more for big tanks)
Primarily liveaboards Yes Swantown Pumpout
Pump Me Out Seattle Area, Tacoma Area, Anacortes, and San Juan
Islands
3 $25-35 Liveaboards and other vessels
Yes Generally public pumpouts
Sweet Pea Pumping Service
Liberty Bay and Port Madison
2 $20-30 (more for big tanks)
Unknown 110 gallon capacity Poulsbo wastewater system
Phecal Phreak Roche Harbor Marina 1 Free as part of moorage fee
All vessels Yes Public pumpout
Pumpty Dumpty Port of Friday Harbor and nearby Marinas
1 $5-32 (more for big tanks)
All 150 gallon capacity Friday Harbor wastewater system

December 2013
Draft Petition to Designate the Waters of Puget Sound as a No Discharge Zone 51
Most of the large, transient commercial vessels that are only in Puget Sound for a short period of time (e.g., cruise ships, freighters and tankers) have large enough holding tanks so that they can hold their waste during the time they are in Puget Sound. Should these vessels need to be pumped out, they can contract with a shore-based pumper truck or one of the mobile pumpout services listed in Table 8.
As a result of the studies and outreach done in 2012 and 2013, it was agreed that certain commercial vessel groups (resident tug boats, resident commercial fishing vessels, and NOAA research vessels) might need time to retrofit their vessels for compliance and that additional pumpout facilities were needed to provide the infrastructure for compliance. Due to the unique challenges associated with retrofitting these types of vessels, such as requiring an engineering design and formal approval for safety, these vessels will be allowed 3 years, or until their next dry dock maintenance event, before they would be required to comply with the NDZ. They will still be responsible for complying with existing state and federal regulations.


December 2013
Draft Petition to Designate the Waters of Puget Sound as a No Discharge Zone 53
7. IMPLEMENTATION STRATEGY
The implementation strategy for the Puget Sound NDZ will be a continually evolving process. While a designation of a NDZ represents a point in time, the NDZ will exist in perpetuity, and its success is contingent on continued management and commitment from stakeholders. The specifics of the implementation strategy will no doubt change as time passes, as vessel practices change, and new information technologies become available. However, the basic elements discussed below outline a basic framework that will facilitate the successful implementation of the NDZ.
7.1. Education and Outreach
Education and outreach is a central strategy for other successful NDZs in the United States. The more boaters are aware of the requirements, the reasons for them (i.e., water quality protection), and the locations of pump out facilities, the more likely they are to comply with the requirements and have a positive attitude about doing so.
Education and outreach for the Puget Sound NDZ began in 2011 by reaching out to recreational and commercial boating organizations, marina operators, ports, other state agencies, environmental groups, the shellfish industry, and tribal interests. A recreational boater survey was conducted during the summer of 2012, and Ecology launched an informational website outlining the NDZ development. In addition, Ecology identified more than 300 stakeholder groups and individuals and requested early input from them throughout the NDZ evaluation process. This allowed Ecology to both obtain valuable input and started the process of bringing awareness of potential new requirements regarding how vessel sewage is managed. Outreach efforts will continue, especially in the early years of the NDZ, so that boaters and commercial vessel operators know that the new law is taking effect, what it means for them, and how they can manage their vessel sewage.
Outreach and education will focus on reaching the maximum number of boaters and raising awareness of the new requirements. A combination of traditional strategies and new technologies will be used. The following list identifies a few strategies that have proved successful in other states, and some new ones that may help Washington boaters.
Including NDZ information sheets with vessel registration renewal paperwork
Informational signs at boat launches and marinas
Social media to get the word out
Meetings and notifications to commercial vessel groups and associations
Information on Ecology’s existing Clean, Green Boating websites as well as State Park’s existing website on pumpout information and related vessel websites
Building on the Clean Marina program to provide information to boaters and to encourage marinas assistance in preventing sewage discharges.

December 2013
54 Draft Petition to Designate the Waters of Puget Sound as a No Discharge Zone
Including NDZ education as part of boater education curriculum
A GPS linked mobile app that would show boaters when they are in the NDZ and where they can find the nearest pumpout based on their current location
Community meetings to discuss the requirements of the NDZ and enforcement approaches
Inclusion of NDZ information on the “Puget Sound Starts Here” web page
The time leading up to the establishment of a NDZ can also be used to test outreach and messaging strategies and to determine which ones are most effective at educating boaters on what they need to do to comply with the NDZ and where they can find the nearest pumpouts.
7.2. Enforcement
Active and extensive enforcement will not be a central strategy to successful implementation of an NDZ in Puget Sound. Yet, the NDZ does need to be enforceable to be effective. The threat of high fines may be the only effective tool for deterring illegal discharges in certain situations. What entities may enforce the NDZ requirements, and how fines may be assessed and allocated has not been determined yet. It is the experience of other states with NDZs that enforcement is most effective when multiple agencies can enforce the requirements. Examples of these agencies might include harbor masters, public health officials, and fish and wildlife law enforcement. Ecology is working with State lawmakers and the USCG to ensure that all levels of law enforcement may enforce the NDZ. This will likely include lawmaking for the delineation of authority and monetary fines. It is the desire of Ecology to ensure that any fines assessed as a result of NDZ infractions will go into a fund dedicated to water quality improvement.
Ecology will work with EPA, USGS and any identified local authorities to formalize enforcement authorities and develop enforcement protocols. Then Ecology will work with state legislators to establish monitory fines and possibly delineate enforcement authorities. Factors to be considered in identifying authorizing entities include current authorities of agencies, agency resources and capacities, boater legal rights, and successful enforcement strategies from elsewhere.
7.3. Evaluation and Continued Success
Ecology will conduct or sponsor boater survey efforts that will evaluate attitudes towards the NDZ and difficulties that they may have complying with NDZ requirements. The questions asked on this survey will be similar to those asked during the 2012 boater survey that was jointly conducted by Washington Sea Grant and Ecology (Herrera 2013). These surveys were conducted in person at boat ramps and boat shows, but surveys could also be conducted by mail as part of the boat registration renewal process, or via monthly mailers sent by marinas.
Washington State Parks will continue to track the estimated number of gallons of sewage pumped at pumpouts funded by CVA grants and will encourage accurate data gathering. The installation of most of the public pumpout facilities in Puget Sound was funded by CVA grants and represents a majority of the pumpouts likely to be used by boaters. The State

December 2013
Draft Petition to Designate the Waters of Puget Sound as a No Discharge Zone 55
Parks data will be used to track pumpout facility usage. A sharp increase in usage following implementation of the NDZ would indicate that the program is having a positive effect on boater’s sewage disposal habits. A decrease in usage over time, taking into account other factors such as weather and the economy, could indicate that boaters are losing interest in the program, and that more outreach and education is needed.
Washington State Parks will continue to maintain and update the database of pumpout facilities available to boaters and continue to ensure that pumpouts are operational and in compliance. Continued favorable opinion of the NDZ is contingent on maintaining and documenting the number of pumpout facilities available to boaters. The data State Parks collects for the CVA program will be used to fulfill this requirement. Maintaining an accurate database of operational pumpouts is also important for boaters because they are dependent on current information to know where they may go for a pumpout. If this list is not accurate or up-to-date boaters are likely to become frustrated and less likely to comply with requirements in the future. An annual review of pumpout facilities will be submitted to US EPA. Ideas are being considered on how to get information about broken pumpouts quickly transmitted from boaters to repair persons in order to minimize the downtime of pumpouts. New technology is also being looked at that might be able to help boaters obtain real-time data on wait times at stationary pumpouts or to schedule a mobile pumpout.
The number of shellfish beds upgraded or opened and water quality improvements are also potential metrics for evaluating the success of a NDZ. Directly linking a water quality improvement, however, with the establishment of a NDZ is difficult due to the many sources of pollution. As all of these sources of pollution are being addressed over time through the efforts of agencies, businesses and the public, Puget Sound ecological health is expected to recover.


December 2013
Draft Petition to Designate the Waters of Puget Sound as a No Discharge Zone 57
8. REFERENCES
Cannon, G.A. 1983. An Overview of Circulation in the Puget Sound Estuarine System. Technical Memorandum ERL PMEL-48. NOAA Pacific Marine Environmental Laboratory, Seattle, Washington. June 1983.
CVA. 1994. The Clean Vessel Act Pump Station and Dump Station Technical Guidelines. Federal Register, Vol. 59, No. 47, March 10, 1994.
Ecology. 2008. Focus on Puget Sound: Economic Facts. Publication Number 06-01-006 (rev. 10/08). Washington State Department of Ecology.
Ecology. 2009. South Puget Sound Dissolved Oxygen Study- South and Central Puget Sound Water Circulation Model Development and Calibration External Draft Review. Washington Department of Ecology, Olympia, Washington. October 15, 2009.
Ecology. 2011. South Puget Sound Dissolved Oxygen Study: Interim Nutrient Load Summary for 2006-2007. Publication Number 11-03-001. Washington Department of Ecology. January 2011.
Gustafson, R.G., W.H. Lenarz, B.B. McCain, C.C. Schmitt, W.S. Grant, T.L. Builder, and R.D. Methot. 2000. Status Review of Pacific Hake, Pacific Cod, and Walleye Pollock from Puget Sound, Washington. Technical Memo-44. NOAA Marine Fisheries Science Center. November 2000.
Herrera. 2010. Nitrogen Removal with Shellfish Harvest in Oakland Bay and Puget Sound. Prepared for Pacific Shellfish institute by Herrera Environmental Consultants, Inc., Seattle, Washington. February 25, 2010.
Herrera. 2012a. Puget Sound No Discharge Zone For Vessel Sewage: Puget Sound Condition, Sewage Discharge, and the Costs and Benefits of Establishing a NDZ. Ecology Publication Number 12-10-031. Prepared for Washington State Department of Ecology, Olympia, Washington, by Herrera Environmental Consultants, Inc., Olympia, Washington. April 2012.
Herrera. 2012b. Puget Sound No Discharge Zone for Vessel Sewage: Puget Sound Vessel Population and Pumpout Facilities. Ecology Publication Number 12-10-031. Prepared for Washington State Department of Ecology, Olympia, Washington, by Herrera Environmental Consultants, Inc., Olympia, Washington. May 2012.
Herrera. 2013. Puget Sound No Discharge Zone For Vessel Sewage: Recreational Boater Survey. Prepared for Washington State Department of Ecology, Olympia, Washington, by Herrera Environmental Consultants, Inc., Olympia, Washington. May 2013.
Newton, J. 2002. Summary of South Puget Sound Area Water Quality Study. Publication Number 02-03-020. Washington Department of Ecology. May 2002.
PSP. 2007. Puget Sound Update: Ninth Report of the Puget Sound Assessment and Monitoring Program. Seattle, Washington. Pg. 260.
December 2013
58 Draft Petition to Designate the Waters of Puget Sound as a No Discharge Zone
PSP. 2008. Puget Sound Facts. Puget Sound Partnership Resource Center website: http://www.psparchives.com/puget_sound/psfacts.htm.
PSP. 2010. Strategic Science Plan. June 2010 final review draft.
PSP. 2011a. Ecosystem Recovery Targets. Puget Sound Partnership website: http://www.psp.wa.gov/downloads/AA2011/062011EcosystemRecoveryTargetList.pdf. July 2011.
PSP. 2011c. Puget Sound Vital Signs: Shellfish Beds Reopened. Puget Sound Partnership website: http://www.psp.wa.gov/vitalsigns/shellfish_beds_reopened.php.
PSP. 2012. The 2012/2013 Action Agenda for Puget Sound. Puget Sound Partnership. August 2012.
Puget Sound Partnership. 2011b. Puget Sound Science Update. April 2011.
Starcrest. 2007. Puget Sound Maritime Air Emissions Inventory. Prepared for Puget Sound Maritime Air Forum by Starcrest Consulting Group, LLC. April 2007.
Turney. 2004. An Introduction to Hood Canal. United States Geological Survey Western Leadership Team Meeting: http://wa.water.usgs.gov/projects/hoodcanal/data/HC.pdf.
University of Washington. 2009. Puget Sound Basin. University of Washington River Systems Research Group Center for Environmental Visualization. University of Washington River Systems Research Group website.
University of Washington. 2012. Physical and Biological Oceanography of the Puget Sound. University of Washington Center for Environmental Visualization website: http://www.cev.washington.edu/lc/CLFISH497/Web5.html.
US EPA. 2008. Cruise Ship Discharge Assessment Report. US Environmental Protection Agency, Oceans and Coastal Protection Division, Office of Wetlands, Oceans and Watersheds, Washington, D.C. December 2008.
US Department of Homeland Security. 2013. AIS Frequently Asked Questions. US Department of Homeland Security Website. http://www.navcen.uscg.gov/?pageName=AISFAQ. Site accessed April 27, 2013.
USACE. 2004. Marine Sanitation Devices. US Army Corps of Engineers Clean Marinas website: http://www.lrn.usace.army.mil/CleanMarinas/pdf/msd.pdf.
WDOH. 2011. Status and Trends in Fecal Coliform Pollution in Shellfish Growing Areas of Puget Sound: Year 2010. Washington Department of Health, Office of Shellfish and Water Protection. December 2011.

APPENDIX A
Pumpout Facility Information


October 2013
Draft Petition to Designate the Waters of Puget Sound as a No Discharge Zone A-1
Appendix A: Pumpout Facility Information.
Facility Name Location Water Body Marina Phone
Number Latitude Longitude Hours of
Operationb
Max Vessel Length
Min Depth at Low
Tide Where Treated
Port of Allyn Hood Canal Dock Allyn Hood Canal (360) 275-2455 46°24'" 122°49'" 24 hours 50 feet 20 feet North Bay Case Inlet Water Reclamation Facility
Marine Servicenter Anacortes Puget Sound (360) 293-8200 48°30'06" 122°36'02" Variable 60 20+ Anacortes WWTP
Port of Anacortes - Cap Sante Boat Haven
Anacortes Puget Sound (360) 293-0694 48°30'39" 122°36'13" 24 hours 90 12 Anacortes WWTP
Skyline Marina Anacortes Puget Sound (360) 293-5134 48°29'18" 122°40'37" Mon-Friday 100 10 Anacortes WWTP
Washington State Ferry Terminal, Anacortes
Anacortes Puget Sound Anacortes WWTP
Pump Me Out Anacortes, Tacoma, Seattle
Tacoma to Pt. Roberts
(877) 786-6731 Public Pumpouts
City of Bainbridge Island, Eagle Harbor Waterfront Park
Bainbridge Island Puget Sound (206) 730-5165 47°37'15" 122°31'10" 24 hours 150 5 City of Bainbridge Island Winslow WWTP
Harbour Marina Bainbridge Island Puget Sound (206) 842-6502 47°37'25" 122°31'37" 24 hours 60 15 Seattle City Sewer
Winslow Wharf Marina Bainbridge Island Puget Sound (206) 842-4202 47°37'40" 122°31'20" 9:00 am - 5:00 pm
80 12 City of Bainbridge Island Winslow WWTP
US Submarine Base – Bangor Bangor Puget Sound Central Kitsap WWTP
Port of Allyn NorthShore Dock Belfair Puget Sound (360) 275-2430 47°25'09" 122°54'11" Variable 50 3 Allyn North Bay Sewer System
Bellingham Cruise Terminal – Port of Bellingham
Bellingham Puget Sound Bellingham WWTP
Squalicum Harbor-Port of Bellingham
Bellingham Strait of Georgia
(360) 676-2542 48°45'13" 122°30'29" 24 hours 100 10 Bellingham WWTP
Seacrest Marina Between Marysville and Everett
Puget Sound (425) 252-4823 48°1'52" 122°11'17" 24 hours 40 ft 5-Apr Offsite

October 2013
A-2 Draft Petition to Designate the Waters of Puget Sound as a No Discharge Zone
Facility Name Location Water Body Marina Phone
Number Latitude Longitude Hours of
Operationb
Max Vessel Length
Min Depth at Low
Tide Where Treated
Blaine Harbor-Port of Bellingham
Blaine Strait of Georgia
(360) 647-6176 48°59'26" 122°45'56" 8:00 am - 5:00 pm
120 12 Blaine WWTP
Semiahmoo Marina Blaine Strait of Georgia
(360) 371-0440 48°59'22" 122°46'02" 24 hours 75 12 Blaine WWTP
Port of Brownsville Bremerton Puget Sound (360) 692-5498 47°38'58" 122°36'46" 24 hours 65 25 Central Kitsap WWTP
Port Washington Marina Bremerton Puget Sound (360) 479-3037 47°34'46" 122°38'39" 24 hours 60 20
Pleasant Harbor Marina Brinnon Hood Canal (360) 796-4611 47°39'70" 122°55'07" 24 hours 150 8 On-Site Septic System
Port of Coupeville Coupeville Strait of Juan de Fuca
(360) 678-5020 48°13'29" 122°41'34" 24 hours 80 2 City of Coupeville WWTP
Deer Harbor Marina Deer Harbor Puget Sound (360) 376-3037 48°37'14" 123°0'17" 8:30 am - 4:30 pm
150 5 Offsite
City of Des Moines Marina Des Moines Puget Sound (206)-824-5700 47°24'06" 122°19'58" 24 hours 75 unknown Midway Sewer District System
Port of Edmonds Edmonds Puget Sound (425)774-0549 ext. 232
47°48'36" 122°23'31" 24 hours 110 Edmonds WWTP
Washington State Ferry Terminal, Edmonds
Edmonds Puget Sound Edmonds WWTP
Naval Station Everett Everett Puget Sound Everett WPCF
Port of Everett Marina Everett Puget Sound (425) 259-6001 47°59'51" 122°13'26" 24 hours 11 Everett WPCF
Port of Everett Marine Park & Boat Ramp
Everett Puget Sound (425) 259-6001 47°59'52" 122°13'26" 24 hours 143 14,18 Everett WPCF
Rose Head Service Everett Puget Sound (425) 501-5242 By appointment
Everett WPCF
Port of South Whidbey Freeland Puget Sound (360) 331-5494 48°02'18" 122°24'11" 70 6
Port of Friday Harbor Marina Friday Harbor Puget Sound (360) 378-2688 48°32'21" 123°00'48" 24 hours 64 10 Friday Harbor WWTP

October 2013
Draft Petition to Designate the Waters of Puget Sound as a No Discharge Zone A-3
Facility Name Location Water Body Marina Phone
Number Latitude Longitude Hours of
Operationb
Max Vessel Length
Min Depth at Low
Tide Where Treated
Pumpty Dumpty Friday Harbor San Juan Islands
Friday Harbor WWTP
Washington State Ferry Terminal, Friday Harbor
Friday Harbor Puget Sound Friday Harbor WWTP
Gray Goose Landing Friday Harbor Puget Sound 622 Warbass Way
Friday Harbor WWTP
Warbass Way Marina Friday Harbor Puget Sound 620 Warbass Way
Friday Harbor WWTP
Arabella's Landing Marina Gig Harbor Puget Sound (253) 255-5050 47°20'03" 122°35'00" 24 hours 150 8 City of Gig Harbor WWTP
Gig Harbor Gig Harbor Puget Sound (253) 858-3535 47°20'07" 122°35'13" 24 hours 50 4 City of Gig Harbor WWTP
Jeresich City Dock Gig Harbor Puget Sound (253) 851-6170 47°19'54" 122°34'46" 24 hours 50 19 City of Gig Harbor WWTP
Murphy's Landing Marina Gig Harbor Puget Sound (253) 851-3093 47°20'13" 122°35'19" Variable City of Gig Harbor WWTP
Poseidon's Landing - Maritime Chanlery
Gig Harbor Puget Sound (253) 853-7100 47°19'58" 122°34'52" City of Gig Harbor WWTP
Driftwood Keys Club Hansville Hood Canal (360) 638-2077 47°54'26" 122°35'11" 24 hours 40
Sweet Pea Pumping Service Hansville Puget Sound
Harbour Village Marina Kenmore Lake Washington
(425) 485-7557 47°45'35" 122°15'77" 24 hours 50 6
Port of Kingston Kingston Puget Sound (360) 297-3545 47°47'38" 122°29'58" Variable 90 15 Kitsap County Kingston WWTP
Carillon Point Marina Kirkland Lake Washington
(425) 822-1700 47°39'21" 122°12'34" 24 hours 90 6 Kirkland City Sewer
La Conner Marina La Conner Puget Sound (360) 466-3118 48°24'04" 122°29'48" 24 hours 60 10 La Conner City Sewer
Penrose Point State Park Lakebay Puget Sound (253) 884-2514 47°15'29" 122°45'15" 24 hours 30 3 On site septic system
Islands Marine Center Lopez Island Puget Sound (360) 468-3377 48°30'55" 122°54'56" Variable 80 30

October 2013
A-4 Draft Petition to Designate the Waters of Puget Sound as a No Discharge Zone
Facility Name Location Water Body Marina Phone
Number Latitude Longitude Hours of
Operationb
Max Vessel Length
Min Depth at Low
Tide Where Treated
Blake Island State Park Manchester Puget Sound (360) 731-8330 47°32'37" 122°29'00" 24 hours 10
Navy Supply Center, Puget Sound
Manchester Kitsap County - Manchester WWTP
Twin Bridges Marina Mt Vernon Puget Sound (360) 466-1443 48°27'" 122°31'" 24 hrs 34 7 Offsite
Washington State Ferry Terminal, Mukilteo
Mukilteo Puget Sound Big Gulch (Mukilteo) WWTP
Mystery Bay State Park Nordland Admiralty Inlet
(360) 385-1259 48°03'27" 122°41'42" 24 hours 55 4 Offsite
Deception Pass State Park Oak Harbor Puget Sound (360) 675-3767 48°24'06" 122°37'30" 24 hours 40 ft 10 Goes to Navy
Oak Harbor Marina Oak Harbor Puget Sound (360) 279-4575 48°17'12" 122°38'03" 24 75 12 City of Oak Harbor Sewer
Pelican Pump Olympia Puget Sound (360) 402-8231 By appointment
Swantown Public Pumpout
Percival Landing Park Olympia Puget Sound (360) 753-8380 47°02'55" 122°54'19" 24 hours 50 8 LOTT
Port of Olympia - Swantown Marina
Olympia Puget Sound (360) 528-8049 47°03'31" 122°53'46" 24 hours 100 12 LOTT
Westbay Marina Olympia Puget Sound (360) 943-2022 47°03'56" 122°54'47" 24 hours 50 4 LOTT
Zittel's Marina Olympia Puget Sound (360) 459-1950 47°09'56" 122°48'28" Variable 45 8 LOTT Via Pumper Truck
West Sound Marina Orcas Puget Sound (360) 376-2314 48°37'46" 122°57'36" Variable 40 5 Offsite
Point Roberts Marina Point Roberts Strait of Georgia
(360) 945-2255 48°58'21" 123°03'46" 24 hours 200 7
Port Angeles Boat Haven Port Angeles Port Angeles Harbor
(360) 457-4505 48°07'33" 123°27'07" 24 hours 160 10 City of Port Angeles WWTP
Port Hadlock Marina Port Hadlock Admiralty Inlet
(360) 385-6368 48°01'54" 122°44'43" 24 hrs 150 15 Offsite

October 2013
Draft Petition to Designate the Waters of Puget Sound as a No Discharge Zone A-5
Facility Name Location Water Body Marina Phone
Number Latitude Longitude Hours of
Operationb
Max Vessel Length
Min Depth at Low
Tide Where Treated
Port Ludlow Bay Marina Port Ludlow Hood Canal (360) 437-0513 47°55'17" 122°41'08" 24 hours 100 15 Olympic Water and Sewer Inc. WWTP
Port of Bremerton Port Orchard Puget Sound (360) 876-5535 47°33'48" 122°37'21" 24 hrs 20 Bremerton WWTP
Point Hudson Marina Port Townsend Admiralty Inlet
(800) 228-2803 48°06'57" 122°44'58" 24 hours 100 8 Port Townsend WWTP
Washington State Ferry Terminal, Port Townsend
Port Townsend Admiralty Inlet
Port Townsend WWTP
Liberty Bay Marina Poulsbo Puget Sound (360) 779-7762 47°43'27" 122°38'38" 8:00 am - 6:00 pm
80 6 City of Poulsbo to Central Kitsap WWTP
Port of Poulsbo Marina Poulsbo Puget Sound (360) 779-9905 47°43'58" 122°39'52" 8:00 am - 4:30 pm
80 7 City of Poulsbo to Central Kitsap WWTP
Quilcene Boat Haven Quilcene Hood Canal (360) 765-3131 47°48'07" 122°51'58" 24 hours 40 6 Onsite Septic
Port Orchard Railway Marina Reno Puget Sound (360) 876-2522 47°32'29" 122°38'43" 24 hours 150 0 South Kitsap Water Reclamation Facility (Port
Orchard WWTP)
Phecal Phreak Roche Harbor Puget Sound 9:00 am - 5:00 pm
30 Roche Harbor Resort WWTP
Roche Harbor Resort Roche Harbor Puget Sound (360) 378-2155 48°36'43" 123°09'25" 24 hours 80 15 Roche Harbor Resort WWTP
Ballard Mill Marina Seattle Lake Washington
(206) 789-4777 47°39'44" 122°22'58" 24 hours 50 15 City Sewer
Boat Street Marina Seattle Lake Union (206) 634-2050 47°38'9" 122°18'8" 24 hours 70 >15 Seattle City Sewer
Elliott Bay Marina Seattle Puget Sound (206) 285-4817 47°37'36" 122°23'31" 24 hours 160 30 Seattle City Sewer
Fairview Marina Seattle Lake Union (888) 673-1118 47°37'54" 122°19'51" 24 hours 40 >15 city of seattle sewer

October 2013
A-6 Draft Petition to Designate the Waters of Puget Sound as a No Discharge Zone
Facility Name Location Water Body Marina Phone
Number Latitude Longitude Hours of
Operationb
Max Vessel Length
Min Depth at Low
Tide Where Treated
Fishermen’s Terminal - Port of Seattle
Seattle Lake Union Ship Canal
47°39'33" 122°22'39" 7:00 am - 9:00 pm
100
Morrison's North Star Fuel Dock/Diamond Marina
Seattle Lake Union (206) 284-6600 47°38'41" 122°20'38" Variable 200 >15 Seattle City Sewer
Parkshore Marina Seattle Lake Washington
(206) 725-3330 47°31'20" 122°15'40" 24 hours 50 5 Seattle City Sewer
Port of Seattle - Bell Harbor Marina
Seattle Puget Sound (206) 787-3914 47°36'31" 122°20'48" 24 hours 100 22 Seattle City Sewer
Seattle Sanitation Service Seattle Lake Union Ship Canal
(206) 713-6436 By appointment
Seattle City Sewer
Shilshole Bay Marina Seattle Puget Sound (206) 787-3387 47°40'33" 122°24'46" 24 hours 100 16 Seattle City Sewer
SS Head Seattle Puget Sound (206 223-9991 By appointment
Closest Public Pumpout
port of everett Sequim Strait of Juan de Fuca
(360) 417-3440 48°03'56" 123°02'23" 24 hours 100 12 Large onsite septic system
Jarrell Cove State Park Shelton Puget Sound (360) 426-9226 47°16'53" 122°53'16" 24 hours 4
Jarrell's Cove Marina Shelton Puget Sound (360) 426-8823 47°17'03" 122°53'12" 10:00 am - 6:00 pm
100 5
Oakland Bay Marina Shelton Puget Sound (360) 426-1151 47°13'24" 123°06'18" 24 hours 50 20 Offsite
Port of Silverdale Silverdale Puget Sound (360) 698-4918 47°38'30" 122°41'41" 6:00 am - 10:00 pm
150 10 Central Kitsap WWTP
Stuart Island State Park/Reid Harbor & Prevost Harbor
Marine Parks
Stuart Island San Juan Islands
(360) 378-2044 48°40'30" 123°12'00" 24 hours 60 4 Roche Harbor Resort WWTP
16th Street Moorage Tacoma Puget Sound (253) 572-2524 47°14'73" 122°26'00" 8:00 am - 12:00 am
300 15 City of Tacoma WWTP

October 2013
Draft Petition to Designate the Waters of Puget Sound as a No Discharge Zone A-7
Facility Name Location Water Body Marina Phone
Number Latitude Longitude Hours of
Operationb
Max Vessel Length
Min Depth at Low
Tide Where Treated
Breakwater Marina, Inc. Tacoma Puget Sound (253) 752-6663 47°18'27" 122°30'48" 7:00 am - 8:00 pm
15 City of Tacoma WWTP
Chinook Landing Marina Tacoma Puget Sound (253) 627-7676 47°16'50" 122°24'09" 8:30 am - 5:00 pm
65 8 City of Tacoma WWTP
Crow's Nest Marina Tacoma Puget Sound (253) 272-2827 47°17'37" 122°25'14" Variable 40 38 City of Tacoma WWTP
Delin Docks Tacoma Thea Foss Waterway
(206) 391-6431 47°15'00" 122°25'48" 8:00 am - 12:00 am
60 6 City of Tacoma WWTP
Dock Street Marina Tacoma Thea Foss Waterway
(253) 572-2524 47°14'29" 122°26'00" 8:00 am - 12:00 am
130 6 City of Tacoma WWTP
Dock Street Marina 17 Tacoma Thea Foss Waterway
(253) 572-2524 47°14'29" 122°26'00" 8:00 am - 12:00 am
130 6 City of Tacoma WWTP
Dock Street Marina Albers Tacoma Thea Foss Waterway
(253) 572-2524 47°14'29" 122°26'00" 8:00 am - 12:00 am
130 6 City of Tacoma WWTP
Foss Harbor Marina Tacoma Puget Sound (253) 272-4404 47°15'22" 122°26'01" Variable 90 60 City of Tacoma WWTP
Foss Landing Marina Tacoma Puget Sound (253) 627-4344 47°14'38" 122°25'55" 5-Aug 75 5 City of Tacoma WWTP
Narrows Marina Tacoma Puget Sound (253) 564-3032 Variable City of Tacoma WWTP
Point Defiance Boathouse Marina
Tacoma Puget Sound 47°18'26" 122°30'56" Variable 50 City of Tacoma WWTP
Point Defiance Marina Complex
Tacoma Puget Sound (253) 591-5325 47°18'22" 122°30'48" 24 hours 60 16 City of Tacoma WWTP
Tacoma Youth Marine Center/ (aka) Commencement Bay
Marine services
Tacoma Thea Foss Waterway
(253) 383-0851 Variable 90 No restriction
Tacoma City Sewer
Terry & Sons Marine Pumpout Tacoma Puget Sound (206 437-6764 By appointment
Pumpouts in Parkshore Marina, Kirkland and
Carylon Point

October 2013
A-8 Draft Petition to Designate the Waters of Puget Sound as a No Discharge Zone
Facility Name Location Water Body Marina Phone
Number Latitude Longitude Hours of
Operationb
Max Vessel Length
Min Depth at Low
Tide Where Treated
Totem Moorage Tacoma Puget Sound (253) 272-4404 47°15'27" 122°26'07" 24 hours 90 60 Tacoma City Sewer
Tyee Marina Tacoma Puget Sound (253) 383-5321 47°17'42" 122°25'28" Variable 65 65 City of Tacoma WWTP
Alderbrook Inn Union Hood Canal (360) 898-2252 47°21'00" 123°04'05" By appointment
85 Alderbrook Inn WWTP
Hood Canal Marina Union Hood Canal (360) 898-2252 47°21'54" 123°05'67"
Twanoh State Park Union Hood Canal (360) 275-2222 47°22'49" 122°58'30" 24 hours 3 Large Scale OSS
Day Island Yacht Club University Place Puget Sound (253) 565-3777 2120 91st Ave W.
Chambers Creek WWTP
Dockton Park Vashon Puget Sound (206) 463-2947 47°22'22" 122°27'17" Variable 60 20
Note: Blue highlighting indicates pumpout facilities for government vessels. Green highlighting indicates mobile pumpout boats. a The pumpout facilities listed in Appendix A primarily came from the Washington State Parks Pumpout Database with a few additions that were identified during this study. Additional details such
as sewage treatment locations and hours of operation and draft restrictions are still being gathered and will be included with the final petition submitted to EPA. b Hours of operation listed as ‘variable’ refers to pumpout facilities whose hours vary by season, day of the week, or are not open on some days of the week. Specific hours of operation may be
obtained by calling the marina or by visiting the Washington State Parks website (http://www.parks.wa.gov/boating/pumpout/ )