Embed Size (px)
Citation preview

CODES AND STANDARDS ENHANCEMENT INITIATIVE (CASE)
Draft Measure Information Template –
Automated Lighting Controls and Switching
Requirements in Warehouses
2013 California Building Energy Efficiency Standards
California Utilities Statewide Codes and Standards Team, March 2011
This report was prepared by the California Statewide Utility Codes and Standards Program and funded by the California utility customers under the auspices of the California Public Utilities Commission.
Copyright 2011 Pacific Gas and Electric Company, Southern California Edison, Sempra Utilities.
All rights reserved, except that this document may be used, copied, and distributed without modification.
Neither PG&E, SCE, SoCalGas, SDG&E, nor any of its employees makes any warranty, express of implied; or assumes any legal liability or
responsibility for the accuracy, completeness or usefulness of any data, information, method, product, policy or process disclosed in this
document; or represents that its use will not infringe any privately-owned rights including, but not limited to, patents, trademarks or
copyrights

Draft CASE report—
Automated Lighting Controls and Switching
Requirements in Warehouses
2011 California Building Energy Efficiency Standards
Sempra Draft Report March 2011
CONTENTS
1. Overview ................................................................................................................ 1
2. Methodology .......................................................................................................... 4 2.1 Data on Lighting Energy Use ............................................................................................. 4 2.2 Effect of Daylighting on Savings ....................................................................................... 4 2.3 Data on Space Geometry .................................................................................................... 5
2.4 Stakeholder Meetings ......................................................................................................... 6 2.5 Designer/User Survey ......................................................................................................... 7
2.6 Review of Current Standards .............................................................................................. 7 2.7 Lighting Models ................................................................................................................. 7 2.8 Emergency Lighting Models .............................................................................................. 8
2.9 Market and Pricing Survey ................................................................................................. 8 2.10 Cost-Effectiveness Calculation........................................................................................... 8
3. Analysis and Results ............................................................................................ 9 3.1 Percentage of Floorspace Devoted to Warehouse Space Types ......................................... 9
3.2 Review of Current Code Language Content and Context Review ..................................... 9 3.2.1 Current Title 24 Standards ........................................................................................... 9
3.2.2 Code Requirements for Emergency Lighting ............................................................ 11 3.2.3 IESNA Recommended Illuminance Levels ............................................................... 11
3.3 Energy and Peak Load Savings ........................................................................................ 12 3.3.1 Savings per Square Foot ............................................................................................ 14 3.3.2 Statewide Savings ...................................................................................................... 15
3.4 Results of Designer/User Survey ...................................................................................... 17 3.5 Lighting Model and Simulations ...................................................................................... 17
3.5.1 Warehouse Simulation ............................................................................................... 17
3.6 Market and Pricing Survey ............................................................................................... 19 3.7 Cost Effectiveness ............................................................................................................ 21
3.7.1 Sensor Costs per Square Foot .................................................................................... 21 3.7.2 Life Cycle Cost and Benefit:Cost Ratio..................................................................... 23
4. Recommended Language for the Standards Document, ACM Manuals, and the Reference Appendices .......................................................................................... 25
4.1 Summary of Proposed Changes ........................................................................................ 25
4.2 Proposed Language........................................................................................................... 26 SECTION 101(b) .................................................................................................................... 26

SECTION 131 – INDOOR LIGHTING CONTROLS THAT SHALL BE INSTALLED .... 26
SECTION 146(c)—CALCULATION OF ALLOWED INDOOR LIGHTING POWER
DENSITY ................................................................................................................................ 27 4.3 NOTES FOR TABLE 146-C:........................................................................................... 28
4.4 Material for Compliance Manuals .................................................................................... 28
5. Bibliography and Other Research ..................................................................... 29 5.1 Codes and Standards ......................................................................................................... 29 5.2 Personal Communications ................................................................................................ 29 5.3 Other ................................................................................................................................. 29
6. Appendices .......................................................................................................... 31 Appendix A – Stakeholder Group Participants .......................................................................... 31 Appendix B—Illuminance Plots for Warehouses ...................................................................... 32
Appendix C—Results of Market and Pricing Survey ................................................................ 34 Appendix D –Energy Use Graphs .............................................................................................. 36
TABLE OF FIGURES
Figure 1. The nine space types used in the analysis ........................................................................ 5 Figure 2 Number of data loggers installed by space type (% of total warehouse space) ............... 9 Figure 3: Baseline and Technical Savings Potential for Non-refrigerated Warehouse Open
Spaces, by Hour of the Day and by Weekday/Weekend ......................................................... 13 Figure 4. Weekday Lighting Energy Savings from the Use Of Auto-On Auto-Off Occupancy
Sensors with a 30 Minute Time Delay(W/sf).......................................................................... 15 Figure 5. Square Footage of Lighting Affected by this Measure - Million sf per Year ................ 16
Figure 6. Energy Savings Potential from this Measure – GWh per year ...................................... 17 Figure 7. Table of Summary Data from Lumen Designer ............................................................. 18
Figure 8. Radiosity Rendering of a Warehouse Open Space in the Occupied (left) and
Unoccupied (right) States ........................................................................................................ 19 Figure 9. Radiosity Rendering of a Warehouse Aisle in the Occupied (left) and Unoccupied
(right) States ............................................................................................................................ 19 Figure 10. Number of Sales Reps Listed on each Manufacturers’ Web Site, by Region ............. 20 Figure 11. Number of Occupancy Sensors for which Prices were Obtained, by Type ................ 21 Figure 12. Average Price of Ceiling-Mounted Occupancy Sensors in Pricing Survey, by Type .. 21
Figure 13. Installed Costs for Occupancy Sensors ........................................................................ 23 Figure 14. Table of Life Cycle Cost .............................................................................................. 24 Figure 15. Illuminance Plot for Occupied State (all lighting on) .................................................. 32
Figure 16. Illuminance Plot for Unoccupied State (2/3 of lamps off) ........................................... 33 Figure 17. Results of Market and Pricing Survey .......................................................................... 36

Lighting Control and Switching Requirements in Warehouses Page 1
2011 California Building Energy Efficiency Standards Draft Report March 2011
1. Overview
Description The proposed measure is to require the installation of occupancy sensors in
warehouse aisle ways and open spaces throughout California. The occupancy
sensors are to be configured to switch off at least one-half of the installed
lighting wattage, and to be in accordance with Section 119 the occupancy
sensor time delay should be no longer than 30 minutes.
Type of Change Mandatory Measure The change would add and modify mandatory
requirements for automatic lighting controls and switching.
This change would not significantly change the scope or direction of the
current Standards. This change would not require implementation of systems
or equipment that are not already readily available on the market and for use
in the proposed applications. These systems are already regulated and
included in the current Standards for different occupancy types, and are an
option in the Power Adjustment Factor table for warehouses.
The Standards and Manuals language would be modified in order to include
the new requirements. The change would require an addition to Section 131.
Energy Benefits The energy savings benefits of this measure are reduced power loads used in
lighting end use. Because warehouses are operated during the afternoon, peak
demand will also be reduced. Savings estimates are based on measured
lighting and occupancy patterns. The table below shows annual savings in
each occupancy type, in kWh/ft2/yr, cumulative statewide savings in GWh/yr,
and cumulative statewide peak load reduction in MW/yr.
The measure is expected to save 82 GWh/yr, and to reduce peak load by
8.2 MW. Energy benefits broken down by individual spaces are as follows:
Space Type Energy
savings per
square foot
(kWh/ft2/yr)
Statewide
energy
savings
(GWh/yr)
Statewide
peak load
reduction
(MW)
Aisle Freezer 1.17 2.2 0.36
Aisle Non-refrigerated 1.50 48.7 5.62
Aisle Refrigerated 1.82 7.0 1.09
Open Non-refrigerated 1.96 21.1 0.86
Open Refrigerated 1.75 2.2 0.22
Open Freezer 1.96 1.2 0.05
Total 1.62 82.4 8.2
Non-Energy
Benefits
This measure does not provide non-energy benefits, except for the intangible
benefit of making building occupants more aware of energy use.

Automated Lighting Controls and Switching Requirements in Warehouses Page 2
2011 California Building Energy Efficiency Standards Draft Report March 2011
Environmental
Impact
The only significant environmental impacts of the measure are those related to
the energy savings.
Material Increase, (Decrease), or No Change (NC): (All units are lbs/year)
Mercury Lead Copper Steel Plastic
Others
(Indentify)
Per Unit
Measure1
NC NC NC NC NC
Per Prototype
Building2
NC NC NC NC NC
Water Quantity and Quality Increase, (Decrease), or No Change (NC):
Water Savings (or
Increase)
(Gallons/Year)
Mercury Content Other
Contaminants,
Specify
Per Unit Measure NC NC NC
Per Prototype
Building NC NC NC
Air Quality in lbs/Year, Increase, (Decrease), or No Change (NC)3:
NOX SOX CO PM10 CO2 VOC
Per Unit Measure 0.00026 0.0015 0.00037 0.00012 0.94 NC
Per Prototype
Building 0.58 3.5 0.84 0.27 2110 NC
Technology
Measures Measure Availability and Cost:
Technology to satisfy the proposed measure is readily and widely available
from multiple manufacturers. Occupancy controls have been on the market
for a substantial period of time. Acceptance and success of this technology is
widely acknowledged. The principal manufacturers are: Cooper Controls
Greengate, Hubbell, Leviton, Lightolier, Lutron, SensorSwitch, Square D and
Wattstopper. These manufacturers supply distributors throughout the state
who coordinate with electricians and contractors. The market is available to
supply adequate equipment to meet the requirements of this measure; of the
nearly three (3) dozen distributors contacted, all were prepared to fill orders
next day. A thorough market survey effort discovered that 92 distinct models
are available to serve this measure’s purpose, and the two most commonly
suggested models were CMR-9 made by SensorSwitch and W-*A (where * is
500, 1000 or 2000 ft2 coverage area) made by Wattstopper.
Useful Life, Persistence and Maintenance:
Life of ceiling mounted occupancy sensors is identified by Title 24 as 15 years
(AEC & CEC, 2005). We have assumed that the energy savings associated
with this technology will be sustained for the life of the product. Stakeholders
confirmed that there are no maintenance costs related to this technology
except for initial commissioning.

Automated Lighting Controls and Switching Requirements in Warehouses Page 3
2011 California Building Energy Efficiency Standards Draft Report March 2011
Performance
Verification
The proposed update would require commissioning during initial installation
of the system by an electrician. According to the survey of contractors
conducted by Lighting Controls Association and referenced in this report,
commissioning of occupancy sensors is already standard practice and is well
understood by contractors.
Cost
Effectiveness
The measure is cost effective with a payback period of approximately one to
three years. See section 3.7.2 for details.
Analysis Tools The benefits from this measure can be quantified using the current reference
methods. The installation and operation of this measure, along with impacts on
energy consumption can be modeled in the current reference methods and
analysis tools. However since this measure is proposed as mandatory,
analysis tools are not relevant since the measure is not subject to whole
building performance trade-offs.
Relationship to
Other Measures
The proposed measure would eliminate the current (2008) Power Adjustment
Factor of 0.2 for occupancy sensors in spaces >250sf:
PAF of 0.2 for ―Multi-level occupant sensor combined with multi-level
circuitry and switching in accordance with Section 146(a)(2)(D)‖, in ―Any
space >250 square feet enclosed by floor-to-ceiling partitions; any size
classroom, corridor, conference or waiting room.‖

Automated Lighting Controls and Switching Requirements in Warehouses Page 4
2011 California Building Energy Efficiency Standards Draft Report March 2011
2. Methodology
This section summarizes the methods we used to collect data for this CASE report. We gathered
data from a wide variety of sources and conducted several different kinds of analyses, so this
section sets out our broad methodology and describes how those methods contributed to the
overall recommendations.
2.1 Data on Lighting Energy Use
In order to assess the savings potential from this measure, we asked occupancy sensor
manufacturers for any recorded data on occupancy and lighting use. Watt Stopper and Sensor
Switch were specifically contacted because HMG knew that both of these control manufacturers
have a practice of providing loggers to interested parties for the use of logging occupancy and
light status within their own buildings. Sensor Switch was able to provide HMG with a data
logger set that included over 1,300 loggers which were installed in 51 different warehouses.
This data was gathered by customers of Sensor Switch in order to monitor energy use and
quantify savings that Sensor Switch’s occupancy sensors could potentially offer. Watt Stopper
was not able to provide any data for warehouses.
Sensor Switch loggers record both occupancy and light status (on/off) in a particular space. The
logger built by Sensor Switch is designed to check the status of a room every two minutes; this
interval is acceptable statistically because over the course of the logging duration (sometimes
many months) the recorded data provides an accurate log of the status of a particular area.
By identifying periods when the logger recorded the space as both ―unoccupied‖ and ―lights on‖,
we were able to determine the overall savings potential for the space both as a percentage of total
lighting energy use and as a percentage of absolute time. Having data at short intervals meant
that we could calculate the effect of various occupancy sensor time delays on the resulting
savings.
2.2 Effect of Daylighting on Savings
Title 24 requires that non-refrigerated warehouses have skylights installed, and that automatic
daylighting control devices (photocontrols) be installed to switch off or dim the electric lighting
when daylight levels are adequate. Therefore, in non-refrigerated warehouses, the savings
theoretically achievable by occupancy sensors are reduced because some of those savings have
already been achieved by daylighting.
We modeled the effect of daylight in the sample warehouses by using an Excel tool –SkycalcTM
–
developed by HMG for Energy Design Resources (EDR) with funding provided by Southern
California Edison (SCE). Skycalc uses DOE2 to calculate the daylight illuminances available in
a space with skylights installed. We calculated electric lighting savings based on the foot-candle
(fc) estimates from Skycalc, in conjunction with a switching scheme as described below:
Daylight < 10 fc 100% electric lights are on (no savings)
10 fc < Daylight > 20 fc 69% electric lights are on (31% savings)
20 fc < Daylight > 30 fc 39% electric lights are on (61% savings)
30 fc < Daylight 8% electric lights are on (92% savings)

Automated Lighting Controls and Switching Requirements in Warehouses Page 5
2011 California Building Energy Efficiency Standards Draft Report March 2011
Using data from a study conducted in 2005 by HMG for Pacific Gas & Electric Company
(PG&E)1, we have reduced the savings from daylighting by a factor of 8%, to take account of the
fact that photocontrol systems, while effective, do not function perfectly in practice. The 2005
study found an overall 92% realization rate for photocontrol systems in warehouses.
We used this switching scheme because it represents the most savings that can cost-effectively
be achieved in warehouses by using multi-level controls, and therefore produces a lower bound
(conservative) estimate of the remaining savings that can be achieved by the occupancy sensors.
In practice, most warehouses use only one or two levels of switching, rather than three, and are
required by Title 24 to switch off only two-thirds of the electric lighting (not the 92% we have
modeled).
2.3 Data on Space Geometry
Though the data set contains only warehouse spaces, we sub-categorized several types of space
to achieve better granularity. Following guidance given during the first stakeholder meeting, we
categorized spaces as being freezer, refrigerated or non-refrigerated spaces, and as: mezzanine,
aisles or open spaces. HMG consulted with the Stakeholder Group to confirm that the
distinction between these three space types is something that is understood by people in the
industry. Mezzanines are nonstructural floors that are added to increase the available square
footage of a warehouse. They are usually constructed from steel and come with access stairs and
their own integrated electrical power and lighting. They can be used as office space, storage for
small items, changing rooms, lockers, etc. In grocery warehouses they are sometimes used as an
interface between the warehouse and the retail space, for the transfer of goods.
Using a 3x3 matrix, each logged space was therefore categorized as being one of nine types (see
Figure 1).
Warehouse Space Type Aisle Open Mezzanine
Freezer
Non-refrigerated
Refrigerated
Figure 1. The nine space types used in the analysis
To assign the correct space type to each set of logged data, we used the descriptions that were
written by the warehouse managers of each facility at the time the loggers were installed. Many
of the locations were poorly described (e.g. ―1st Floor Warehouse‖) thus, HMG decided to omit
any sensor that was not clearly defined as one of the space types.
Note that Title 24 2008 defines the following types of warehouse buildings/spaces:
REFRIGERATED WAREHOUSE is a building or a space constructed for storage of
products, where mechanical refrigeration is used to maintain the space temperature at 55
F or less.
REFRIGERATED SPACE is a building or a space that is a refrigerated warehouse, walk-
in cooler, or a freezer.
1 McHugh, Pande, Ander, Melnyk. 2004. Effectiveness of Photocontrols with Skylighting. Published in the 2004 IESNA Annual Conference
Proceedings Paper #13 pp. 1-18 IESNA, New York. Available online at http://www.h-m-
g.com/downloads/Papers/Photocontrol_effectiveness_Paper13wcover.pdf

Automated Lighting Controls and Switching Requirements in Warehouses Page 6
2011 California Building Energy Efficiency Standards Draft Report March 2011
STORAGE, COLD, is a storage area within a refrigerated warehouse where space
temperatures are maintained at or above 32 F.
STORAGE, FROZEN is a storage area within a refrigerated warehouse where the space
temperatures are maintained below 32 F.
For the purposes of this analysis, freezer and Storage, Frozen are synonymous. Title 24 does not
currently contain definitions of aisles or open areas in warehouses, so we have added proposed
definitions, in Section 4.2.
2.4 Stakeholder Meetings
The purpose of the stakeholder meetings was to help create the lighting model of warehouse
spaces, to confirm whether the lighting layouts, lighting controls, and warehouse operating
assumptions were correct, and most importantly to confirm that the proposed measure(s) would
not have a significant adverse effect on warehouse operations.
We convened a Stakeholder Group comprised of representatives from the industries affected by
this proposal. These included:
Lighting controls manufacturers
Luminaire manufacturers
Lighting designers
Warehouse owners
Grocery Store owners
See section Appendix A – Stakeholder Group Participants for a list of Stakeholder Group
participants. We attempted to ensure that all these groups were well represented in the final
stakeholder group. In addition to the final participant list, we contacted the following people
who were unable to join the group: one (1) lighting designer, one (1) controls manufacturer, one
(1) researcher.
We conducted three meetings with stakeholders in Oakland to discuss the study’s progress.
Meetings were held on Tuesday, December 2nd
, 2008, Tuesday, March 3rd
, 2009, and Tuesday,
April 28th
, 2009. The following items were discussed in the meetings:
Current standard practice and best practice for warehouse lighting
Current code requirements and potential future changes
Current design problems and technology limitations/opportunities
Initial analysis of potential energy savings from warehouses, based on logged data
Proposed lighting layouts for warehouse open spaces and aisles
Results of a survey of designers and end-users, asking about typical lighting
configurations and controls options
Proposed code language and discussion of how people will comply in practice
Cost/Benefit analysis for proposed measures

Automated Lighting Controls and Switching Requirements in Warehouses Page 7
2011 California Building Energy Efficiency Standards Draft Report March 2011
Stakeholders provided a great deal of support and feedback on the proposals, as well as
providing insight into the potential industry/technology barriers surrounding the proposals.
Additionally, stakeholders were able to clarify common practice, design, and methods within
these particular spaces types. For instance, stakeholders gave us most of the information
required for the lighting models—typical dimensions for warehouse aisles, luminaire spacings,
lamp types, and information about how warehouses are typically broken down into different
functional areas. Most importantly, they confirmed that the use of controls in warehouses was a
suitable way to save energy, and would not interfere with warehouse operations.
HMG also contacted individuals beyond those included in the Stakeholder Group in order to
make use of knowledge of a particular topic. For instance, we contacted other lighting controls
companies that were not on the stakeholder group to confirm the functions, price and availability
of suitable occupancy sensors.
2.5 Designer/User Survey
To find out whether designers, installers or users have already used occupancy controls
successfully in these spaces, we wanted to gather information from people who had designed,
installed or maintained occupancy sensor controlled lighting. We therefore developed a web-
based survey intended for architects, lighting designers, and facility managers (the survey
questions varied between the three professions). Survey participants were asked a variety of
questions about projects on which they had used occupancy controls, including what lighting
equipment and controls were installed, the dimensions of the space, whether savings were
achieved, and any maintenance or user response issues.
2.6 Review of Current Standards
To understand the existing context in which this proposal may be established, and how it may
affect other code measures, we conducted a detailed review of sections 119, 131, and 146 of the
current (2008) Title 24 Standards. When we had developed draft language, we reviewed this
with Gary Flamm2 at the California Energy Commission to check compatibility with Title 24’s
overall structure and specific provisions, and to work out which of several language options
would be most appropriate.
Since this proposal suggests turning lights off within aisles, which are often paths of egress, it
was very important to be cognizant of the capacity for affecting lighting regulations in these
areas. We therefore reviewed Section 7.9.2.1 of the Life Safety Code within the NFPA standards
and the California Building Code Section 1003.2.9.1 in order to fully understand the current
standards regarding emergency lighting for the means of egress.
2.7 Lighting Models
We used industry-standard radiosity software (Lumen Designer) to model light distributions in
typical spaces under both a base case and proposed scenario. We calculated light levels
(footcandles) and lighting power densities (Watts/sf) for the modeled spaces. We confirmed
with the stakeholder group that the lighting layouts we had used were common lighting design
2 These discussions took place between September 2008 and March 2009

Automated Lighting Controls and Switching Requirements in Warehouses Page 8
2011 California Building Energy Efficiency Standards Draft Report March 2011
practice for these spaces. The lighting models were extremely helpful as a basis for discussing
the proposed measures, because they focused the thoughts of the Stakeholder Group on the
specific challenges that might occur in real installations.
2.8 Emergency Lighting Models
We ran additional simulations, in order to ensure that the necessary emergency light levels (1 fc
along the centerline of egress (NFPA and CA Fire Codes, see bibliography)) could be maintained
by the lighting equipment and layouts we had used in the lighting models.
2.9 Market and Pricing Survey
To find out typical market prices and availability of occupancy sensors, we contacted lighting
controls distributors to ask for prices. Because many different models of occupancy sensor were
available from each distributor, we asked them which model(s) they would recommend for
various typical applications, and asked them to price those models. We stratified the sample by
region to obtain a range of prices from different cities in California, and we attempted to obtain
prices for all the common types of occupancy sensor. Details of this analysis are provided in
section 3.7.1.
2.10 Cost-Effectiveness Calculation
Occupancy sensors are considered to have a useful life of 15 years (AEC & CEC, 2005).
Therefore we calculated estimates for annual energy savings and the resulting value of savings
over 15 years, expressed as a net present value. Although the savings returned due to occupancy
sensors are realized over 15 year life, costs are fixed and must be paid at the time of installation.
By subtracting the costs from the net present value of the cumulative savings, we calculated the
net financial benefit of the measure.
We conducted the life cycle cost calculation using the California Energy Commission Time
Dependent Valuation (TDV) methodology for the 2008 standards3. Each hour is assigned an
estimated price for energy, and the sum of these prices over the life of the measure yields the
present dollar value of savings. Life cycle cost is the difference between the TDV $ value for 15
year energy savings and the initial occupancy sensor costs. Cost effectiveness is proved when
this difference is positive; in addition, we have reported the benefit:cost ratio as an additional
measure of cost effectiveness.
3 See the California Energy Commission’s guidance on Time Dependent Valuation:
http://www.energy.ca.gov/title24/2005standards/archive/rulemaking/documents/tdv/index.html

Automated Lighting Controls and Switching Requirements in Warehouses Page 9
2011 California Building Energy Efficiency Standards Draft Report March 2011
3. Analysis and Results
This section summarizes the results of the data collection and analysis described above. It
includes an analysis of the amount of statewide floorspace, occupancy sensor energy savings,
designer survey results, equipment prices, and measure cost-effectiveness.
3.1 Percentage of Floorspace Devoted to Warehouse Space Types
To estimate the percentage of warehouse floorspace that is aisles versus open areas, we used the
proportion of each type from the sample of logged data, which was 75%/25% (aisle space vs.
open space respectively). We asked the Stakeholder Group whether this was a fair estimate of the
proportions of those two space types, and they agreed that it was.
Within these two space types, we further divided the sample by the storage temperature of the
space. Again, we used the proportions of each temperature type from the sample of logged data.
The number of loggers and the resulting percentages of total warehouse space are shown in
Figure 2. Based on stakeholder interactions, HMG defined space breakdowns as reported in
Section 2.3.
Warehouse Space Type Aisle Open Mezzanine1
Freezer 10 (2%) 0 0
Non-refrigerated 223 (65%) 73 (21%) 1
Refrigerated 28 (8%) 12 (3.5%) 15
Totals 251 (75%) 85 (25%) Omitted
1. Please see section 2.3 for a definition of the Mezzanine space type
Figure 2 Number of data loggers installed by space type (% of total warehouse space)
Of the spaces that were categorized as mezzanine, there were no freezer spaces, only one
refrigerated space, and 15 non-refrigerated spaces. Due to this small sample for Mezzanine floor
space, this data was omitted from further analysis.
3.2 Review of Current Code Language Content and Context Review
We reviewed the current Title 24 requirements for warehouses to understand how the new
requirements could most easily be incorporated into the existing code. We also reviewed other
relevant standards including the fire codes and IESNA illuminance recommendations, because
these standards ensure that people are able to see adequately and to find their way out of
buildings during an emergency. Each of these standards influenced our proposed code language
to some degree, as described below.
3.2.1 Current Title 24 Standards
In discussion with Gary Flamm at the California Energy Commission, we developed the
following understanding of how lighting controls requirements are structured within Title 24.
We conducted this review of the current standards to ensure that our proposed language does not
upset the existing structure and create contradictions or unnecessary complexity.

Automated Lighting Controls and Switching Requirements in Warehouses Page 10
2011 California Building Energy Efficiency Standards Draft Report March 2011
Structure of the Lighting Controls Requirements
Title 24 has a hierarchy of lighting controls, divided into three tiers. The first, simplest tier is
―area controls‖ (section 131(a)); this requires that each space divided by ceiling-height partitions
have a control capable of switching off all the lighting in the space. A simple wall switch is
sufficient to meet this requirement. The second tier is ―multi-level controls‖ (section 131(b)),
which requires circuitry or dimming capability to allow some of the lighting to be switched off
while the rest is left on (or vice-versa). The third is ―shut-off controls‖ that shut off some or all
of the lighting in response to a signal such as occupancy or daylighting.
Current (2008) Lighting Power Density Requirements
The 2008 Title 24 standards require that Commercial/Industrial Storage applications use the Area
Category or Tailored methods for determining area Lighting Power Density (LPD). Area
Category Method (Table 146F) allows an LPD of 0.6 W/sf for non-refrigerated storage and 0.7
W/sf for refrigerated storage. To ensure a conservative estimate of savings, in all of our
calculations we have assumed that warehouses are lit with 0.6 W/sf of lighting (for the buildings
we studied, we did not have actual LPD values).
Current (2008) Title 24 Lighting Controls Requirements
Warehouse open areas should be designated as egress routes under Section 10-103(a)(2) of Title
24, Part 14, when they serve as egress routes for the aisle ways that lead off from them. Egress
lighting of 0.3 W/sf is exempt from the requirement for area controls (wall switches occupancy
sensors) in Section 131(a). Therefore, in theory, under Title 24 2008, warehouses should have at
least one ―readily-accessible‖ wall switch that controls the lighting in the space (except for the
0.3 W/sf that is exempted). Note that because warehouse racks are not ―floor to ceiling
partitions‖, each aisle is not currently required to have separate lighting controls.
Section 131(b) requires multi-level controls in spaces that have a connected load greater than 0.8
W/sf. Because warehouses are limited to either 0.6 or 0.7 W/sf (non-refrigerated and
refrigerated respectively), they are exempt from the requirement for multi-level controls. Note,
however, that in practice there may already be two levels of control for open areas because 0.3
W/sf of the lighting may be on a separate circuit for egress lighting.
Section 131(d) Shut-Off Controls requires automatic shut-off controls in addition to the area
controls required by Section 131(a). Section 131(d) is subject to the same exemption for egress
lighting as Section 131(a). The requirement of Section 131(d) can be met with an automatic time
clock control, by occupancy sensor control, or by an automatic daylighting control device. In
daylit warehouses (i.e. all new-construction non-refrigerated warehouses) this requirement is met
in practice by the prescriptively-required automatic daylighting control device. Each automatic
shut-off control device must be equipped with a manual off-override that serves an area no larger
than 5,000 sf.
As a result of these requirements, the current least-cost configuration for warehouse lighting is to
have photocontrols with an off-override wall switch in non-refrigerated warehouses, and to have
a timeclock control in conjunction with an off-override in refrigerated warehouses. In both cases
there will be one circuit for egress lighting that is either uncontrolled (on 24/7), or controlled by
4 Note that Title 24 Part 1 is not part of the Energy Efficiency Code—the Energy Efficiency Code is Part 6, although it is often referred to simply
as ―Title 24‖ for convenience.

Automated Lighting Controls and Switching Requirements in Warehouses Page 11
2011 California Building Energy Efficiency Standards Draft Report March 2011
a time clock or a manual switch. In both cases there is no need for the aisles to have separate
controls.
Power Adjustment Factors (PAFs)
If designers choose to install bi-level controls in warehouses they can earn a Power Adjustment
Factor (PAF)5. Warehouses can claim PAF of 0.15 when the following condition is met:
―Occupant sensor controlled multi-level switching or dimming system that reduces lighting
power at least 50% when no persons are present (maximum of 2 aisles per sensor in
warehouses).‖
Skylights
Skylights are required in spaces greater than 8,000 sf with ceiling heights of 15 ft or higher6. At
least one half of the floor area shall be in the daylight area served by skylights (refrigerated
warehouses are exempt, see Exception 1 to 143c). Photo controls are mandatory in daylit areas
greater than 2,500 sf; whereas spaces smaller than 2,500 sf can receive a compliance credit for
installing controls.
3.2.2 Code Requirements for Emergency Lighting
The California Building Code Section 1003.2.9.1 states that, ―The means of egress serving
occupied portions shall be illuminated at an intensity of not less than 1 fc at the floor level.‖
The National Fire Protection Association (NFPA) Section 7.9.2.1 code states:
“Automatic motion sensor-type lighting switches shall be permitted within the means of egress,
provided that the switch controllers are equipped for fail-safe operation, the illumination timers
are set for minimum 15-minutes duration, and the motion sensor is activated by any occupant
movement in the area served by the lighting units.”
And,
―Emergency lighting facilities shall be arranged to provide initial illumination that is not less
than an average of 1 ft-candle (10.8 lux) and, at any point, not less than 0.1 ft-candle (1.1 lux),
measured along the path of egress at floor level….A maximum-to-minimum illumination
uniformity ratio of 40 to 1 shall not be exceeded.‖7
3.2.3 IESNA Recommended Illuminance Levels
The IESNA Handbook (9th
edition) recommends a minimum of 5-10 fc for simple orientation,
short visits, and bulk storage. It recommends 15-20 fc for basic visual acuity and fine item
storage (Section 10), and IESNA recommends 20-50 fc for detailed visual tasks. Stakeholders
identified areas where higher light levels may be needed, such as where workers are performing
detailed eye to hand type tasks (quality control, attaching small parts, etc). IESNA recommends
20-50 fc for detailed visual tasks/performance. Therefore, HMG recommends not including
these spaces in this proposed code change.
5 California Code of Regulations, Title 24 Part 6 Table 146C
6 California Code of Regulations, Title 24 Part 6 Section 143 c
7 NFPA section 7.9.2.1

Automated Lighting Controls and Switching Requirements in Warehouses Page 12
2011 California Building Energy Efficiency Standards Draft Report March 2011
3.3 Energy and Peak Load Savings
Each logger was in place for two to four weeks, with occupancy and light level data recorded at
two minute intervals, so the granularity of the logged data was sufficient for us to generate
accurate estimates of savings due to different occupancy sensor time delays. A brief analysis of
the effect of time delay showed that reducing the delay to less than 30 minutes resulted in almost
no additional savings, unless the delay was reduced close to zero (which is not acceptable to
occupants). This suggests that most of the savings accrue during long unoccupied periods, either
overnight or at times when a specific aisle is not being accessed.
The occupancy patterns of each of the defined warehouse spaces were analyzed to reveal savings
potential by hour of the day, and by weekday/weekend. Savings potential is defined as the
amount of time for which the space is lit and unoccupied, multiplied by the lighting power
density (LPD) of the space. Because we are calculating savings from a new construction
measure, we set all the spaces to have a LPD of 0.6W/sf, the prescriptive limit set by Title 24
2008 (Tables 146-E and 146-F).
The data set shows a distinction in pattern of use between weekend and weekdays. Figure 3
shows the distinction between baseline energy consumption (the percentage of time for which
lights were on in the sample buildings) and the energy consumption with occupancy sensors
installed (lights on and unoccupied). The technical potential for energy savings is therefore the
difference between the two lines.
This calculation is based on a 30-minute occupancy sensor time delay, i.e. we used a database
algorithm to search through the data for continuous periods of 30 or more minutes during which
the lights were on and the space was unoccupied.
The savings potential (difference between the two lines) is roughly constant throughout the day,
fluctuating between 15% and 30% (note that this difference cannot be seen during the daylit
periods in Figure 3). This suggests that savings from occupancy sensors are available at all times
of day, and therefore that many of the warehouses in the dataset had 24-hour operation.
Figure 3 shows that the savings that can be obtained by occupancy sensors in a daylit (non-
refrigerated) warehouse drop close to zero during the middle of the day because the electric
lighting has already been switched off by the photocontrol system which is prescriptively
required by Title 24. Similar plots for all warehouse space types are presented in Appendix D –
Energy Use Graphs.

Automated Lighting Controls and Switching Requirements in Warehouses Page 13
2011 California Building Energy Efficiency Standards Draft Report March 2011
Figure 3: Baseline and Technical Savings Potential for Non-refrigerated Warehouse Open
Spaces, by Hour of the Day and by Weekday/Weekend
0%
10%
20%
30%
40%
50%
60%
70%
80%
90%
100%
0 1 2 3 4 5 6 7 8 9 10 11 12 13 14 15 16 17 18 19 20 21 22 23
Pe
rce
nta
ge
of
Tim
e
Hour
Baseline and Technical Savings Potential for NonRefrigerated Warehouse Open Space
by Hour of the Day
Lighting Use with Occ Sensors Weekday Lighting Use with Occ Sensors Weekend
Lighting Use w/out Occ Sensors Weekday Lighting Use w/out Occ Sensors Weekend

Automated Lighting Controls and Switching Requirements in Warehouses Page 14
2011 California Building Energy Efficiency Standards Draft Report March 2011
3.3.1 Savings per Square Foot
In both aisles and open areas, the lighting was on for the majority of the time during the baseline
condition (93% of the day), but the lights could be switched off (because spaces were
unoccupied) for 20% of the day on average, meaning that this measure would reduce lighting
load to zero for 13% of the time during the year (20%-7%). These values are a weighted average
by the statewide floor area of each space type.
Assuming an installed load of 0.6W/sf, reducing this load to zero 13% of the time (8760 hours
times 0.13) equals 0.08 W/sf savings on average, or 0.7 kWh/sf/yr (see Figure 4 for a breakdown
of hourly savings by space type).
Note that the W/sf savings figures in Figure 4 are for weekdays only, and have been reduced
somewhat, due to the savings already achieved by daylighting, in the nonrefrigerated warehouse
types. The reduction in lighting use between 8 am and 3 pm is due to the daylight adjustment
based on Skycalc values as explained in Section 2.2.
Also note that these savings are calculated from the occupancy patterns of real buildings in the
data set, so are not based on notional assumptions about operating hours as is sometimes the case
with savings estimates.
For each of the space type classifications in Figure 2, we calculated savings per square foot
(W/sf) in Figure 4 based on operating hours as measured by the logging occupancy sensor data,
in conjunction with an assumption that the installed load in a Title 24-compliant warehouse
would be the maximum allowed 0.6 W/sf.
The savings by hour in Figure 4 due to occupancy sensors indicates that the different types of
warehouse space have distinctly different daily patterns of use, reflecting the different times at
which goods are loaded, unloaded and distributed around the warehouse. However, all types
show significant savings from occupancy sensors, which leads us to believe that the measure
should apply equally to all five of the space types shown in Figure 4.
Figure 4 shows that aisles have higher savings than open spaces, which is to be expected because
the open areas are generally thoroughfares that people use to access the aisles, so open areas
have higher levels of traffic and fewer unoccupied periods. Refrigerated and freezer spaces have
the highest potential savings, primarily because daylighting controls don’t deduct from the
savings.

Automated Lighting Controls and Switching Requirements in Warehouses Page 15
2011 California Building Energy Efficiency Standards Draft Report March 2011
Hour Aisle
Freezer
Aisle
Non-refrigerated
Aisle
Refrigerated
Open
Non-refrigerated
Open
Refrigerated
0 0.40 0.29 0.24 0.11 0.37
1 0.37 0.25 0.24 0.11 0.33
2 0.41 0.23 0.24 0.12 0.31
3 0.40 0.21 0.29 0.11 0.33
4 0.46 0.22 0.41 0.14 0.37
5 0.46 0.22 0.42 0.15 0.31
6 0.42 0.30 0.30 0.17 0.32
7 0.40 0.13 0.27 0.06 0.29
8 0.43 0.03 0.33 0.01 0.29
9 0.38 0.02 0.27 0.01 0.24
10 0.34 0.02 0.27 0.01 0.20
11 0.29 0.02 0.35 0.01 0.15
12 0.25 0.02 0.31 0.01 0.20
13 0.27 0.02 0.31 0.01 0.17
14 0.21 0.02 0.43 0.01 0.20
15 0.28 0.02 0.34 0.01 0.22
16 0.27 0.10 0.26 0.04 0.25
17 0.26 0.26 0.26 0.11 0.26
18 0.27 0.26 0.26 0.12 0.26
19 0.30 0.28 0.25 0.10 0.28
20 0.42 0.30 0.24 0.10 0.36
21 0.42 0.31 0.23 0.10 0.36
22 0.39 0.30 0.25 0.10 0.36
23 0.40 0.30 0.26 0.10 0.36
Average 0.35 0.17 0.29 0.08 0.28
Peak Savings8 0.28 0.26 0.43 0.12 0.26
Figure 4. Weekday Lighting Energy Savings from the Use Of Auto-On Auto-Off
Occupancy Sensors with a 30 Minute Time Delay(W/sf)
3.3.2 Statewide Savings
To assess statewide savings potential, we also needed to know how much floorspace within the
state of California is taken up by each of the space types. We used two data sources for this
estimation: NRNC and CEUS (see bibliography). We were able to obtain estimates for
warehouse floor space from the NRNC. A description is provided in Section 5.3.
According to the California Nonresidential New Construction (NRNC) database , new
warehouse floorspace totaled 233 million ft2
from 1999 – 2005. Therefore annual warehouse
8 Peak savings is the greatest reduction in load during any single hour between 12:00 and 18:00 on weekdays, for each space
type.

Automated Lighting Controls and Switching Requirements in Warehouses Page 16
2011 California Building Energy Efficiency Standards Draft Report March 2011
new construction was 38.8 million ft2 per year during this period. The NRNC survey details not
only the building type (warehouses belong to the CEC defined ―C&I Storage‖ space) but also the
specific occupancy area types within each building. It shows that 84% of the 38.8 million ft2 of
new warehouse construction is used for stocking and storing goods. The remaining 16% is used
for various other purposes including electronic equipment, dining, lockers and changing rooms,
offices, etc. Therefore we estimate that the annual square footage of warehouse new
construction affected by this measure will be 32.6 million ft2
(38.8 million * .84).
To calculate the square footage of lighting retrofits within existing buildings, we used the
measure life for lighting systems assumed within Title 24 (15 years) and the approximate life of
a warehouse building (30 years). Typically, therefore, each warehouse building has one lighting
retrofit within its 30 year life. This means that lighting retrofits occur in 3.3% of warehouse
floorspace per year.
Using the NRNC data that 84% of the floorspace would be subject to this new code requirement,
and that the amount of existing warehouse floorspace in California is 650 million ft2 (from
CEUS), we expect that retrofits account for another 650*0.84*(1/30) = 18.2 million ft2 of
lighting eligible for this new requirement.
We calculate that this measure will affect a total of 50.9 million square feet of lighting, as
summarized in Figure 5. In this table, the square footage for each space type is back calculated
from the grand statewide total square footage, using the proportion of space types shown in
Figure 2.
Non-refrigerated Refrigerated Freezer
Aisle 32.4 3.8 1.9
Open 10.8 1.3 0.6
Total 43.2 5.1 2.5
Grand Total 50.9
New Construction Subtotal 32.7
Lighting Retrofit Subtotal 18.2
Figure 5. Square Footage of Lighting Affected by this Measure - Million sf per Year
Figure 6 shows the projected technical savings potential from the measure. The values are
calculated by multiplying the affected square footage from Figure 5 by the energy savings per
square foot shown in Figure 4.
Automated Lighting Controls and Switching Requirements in Warehouses Page 17
2011 California Building Energy Efficiency Standards Draft Report March 2011
Non-refrigerated Refrigerated Freezer
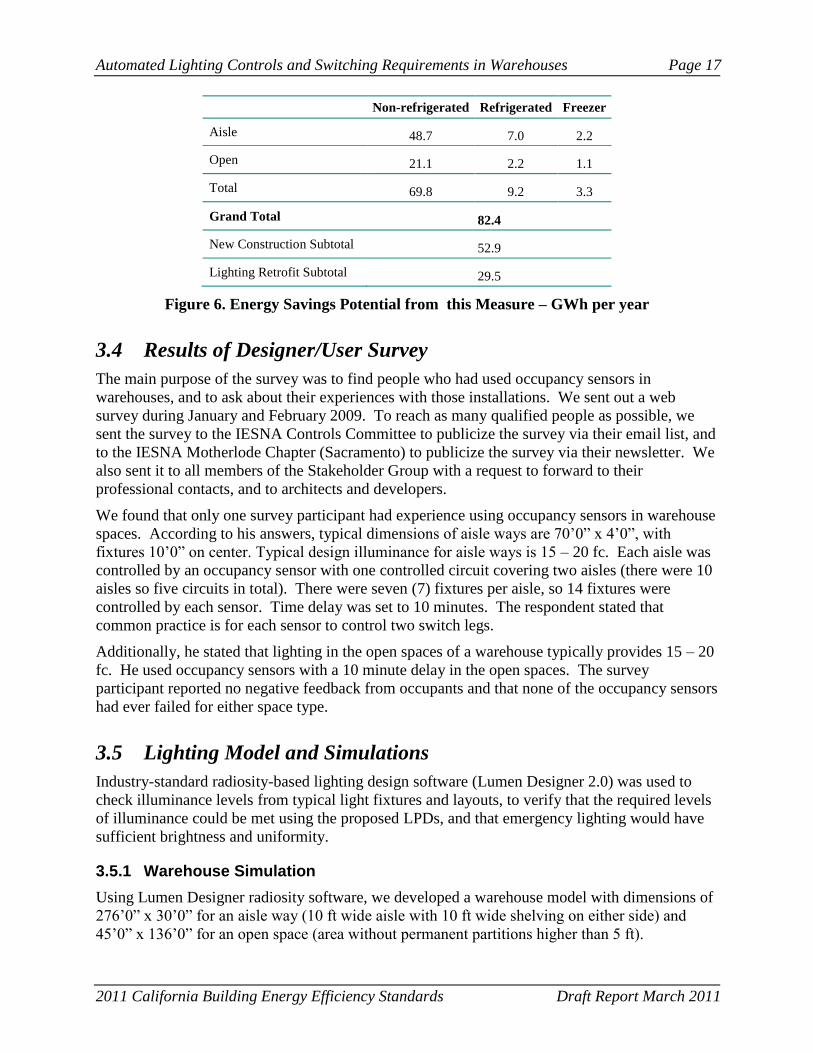
Aisle 48.7 7.0 2.2
Open 21.1 2.2 1.1
Total 69.8 9.2 3.3
Grand Total 82.4
New Construction Subtotal 52.9
Lighting Retrofit Subtotal 29.5
Figure 6. Energy Savings Potential from this Measure – GWh per year
3.4 Results of Designer/User Survey
The main purpose of the survey was to find people who had used occupancy sensors in
warehouses, and to ask about their experiences with those installations. We sent out a web
survey during January and February 2009. To reach as many qualified people as possible, we
sent the survey to the IESNA Controls Committee to publicize the survey via their email list, and
to the IESNA Motherlode Chapter (Sacramento) to publicize the survey via their newsletter. We
also sent it to all members of the Stakeholder Group with a request to forward to their
professional contacts, and to architects and developers.
We found that only one survey participant had experience using occupancy sensors in warehouse
spaces. According to his answers, typical dimensions of aisle ways are 70’0‖ x 4’0‖, with
fixtures 10’0‖ on center. Typical design illuminance for aisle ways is 15 – 20 fc. Each aisle was
controlled by an occupancy sensor with one controlled circuit covering two aisles (there were 10
aisles so five circuits in total). There were seven (7) fixtures per aisle, so 14 fixtures were
controlled by each sensor. Time delay was set to 10 minutes. The respondent stated that
common practice is for each sensor to control two switch legs.
Additionally, he stated that lighting in the open spaces of a warehouse typically provides 15 – 20
fc. He used occupancy sensors with a 10 minute delay in the open spaces. The survey
participant reported no negative feedback from occupants and that none of the occupancy sensors
had ever failed for either space type.
3.5 Lighting Model and Simulations
Industry-standard radiosity-based lighting design software (Lumen Designer 2.0) was used to
check illuminance levels from typical light fixtures and layouts, to verify that the required levels
of illuminance could be met using the proposed LPDs, and that emergency lighting would have
sufficient brightness and uniformity.
3.5.1 Warehouse Simulation
Using Lumen Designer radiosity software, we developed a warehouse model with dimensions of
276’0‖ x 30’0‖ for an aisle way (10 ft wide aisle with 10 ft wide shelving on either side) and
45’0‖ x 136’0‖ for an open space (area without permanent partitions higher than 5 ft).

Automated Lighting Controls and Switching Requirements in Warehouses Page 18
2011 California Building Energy Efficiency Standards Draft Report March 2011
Illuminance plots from the software are shown in Appendix B—Illuminance Plots for
Warehouses.
The aisle way and open area were modeled side by side with no obstructing partition, therefore
allowing light within each space to affect the adjacent light levels, as is typical in warehouses.
Fixtures were modeled consistently throughout the entire space as 3 x 32W 4’ T8 direct fixtures.
Lamps had a lumen output of 2900, and fixtures were spaced at 20’ on center. HMG ran
simulations on the model for two scenarios:
All lights on (simulating normal lighting state)
2/3 of installed lighting off (simulating unoccupied periods)
Lumen Designer results are detailed in Figure 7, and the graphical output from the software is
shown in Figure 8 and Figure 9. HMG presented these results to stakeholders and they agreed
that the lighting technologies, layouts, light levels and power densities in the simulation were
typical of standard practice in warehouses. HMG consulted the IESNA Handbook and
confirmed recommendations of 5-10 fc for simple orientation/short visits and 15-20 fc for basic
visual acuity, which this proposal would allow. Stakeholders did identify areas where higher
light levels may be needed. These would be areas were workers are performing detailed eye to
hand type tasks (quality control, attaching small parts, etc). IESNA recommends 20-50 fc for
detailed visual tasks/performance. Illuminance requirements for these tasks are almost always
provided by localized task lighting, rather than by a high level of lighting throughout the space.
Therefore we have not included detailed visual tasks in this study.
By modeling the aisle and open space in ―emergency lighting‖ mode, assuming a typical number
of fixtures equipped with emergency ballasts, HMG found that 1 fc could be easily maintained
with an LPD as low as 0.046 W/sf.
Figure 7 shows that even if the occupancy sensors were to fail in the off mode, there would still
be sufficient lighting available from the uncontrolled lamps to provide more than the 1 fc
average illuminance required for egress lighting (see shaded cells).
Space Type Lighting Conditions
Minimum
illuminance
(fc)
Average
illuminance
(fc)
Maximum
illuminance
(fc)
LPD (W/sf)
Aisle All lights on (occupied
state) 11 14 15 0.49
2/3 of lights off
(unoccupied state) 3.7 4.7 5 0.16
Open Area All lights on (occupied
state) 14 19 21 0.44
2/3 of lights off
(unoccupied state) 4.7 6.3 7 0.15
Figure 7. Table of Summary Data from Lumen Designer

Automated Lighting Controls and Switching Requirements in Warehouses Page 19
2011 California Building Energy Efficiency Standards Draft Report March 2011
Figure 8. Radiosity Rendering of a Warehouse Open Space in the Occupied (left) and
Unoccupied (right) States
Figure 9. Radiosity Rendering of a Warehouse Aisle in the Occupied (left) and Unoccupied
(right) States
3.6 Market and Pricing Survey
The market and pricing survey provides the equipment costs that form part of the basis for the
life-cycle costing in section 3.7, and serves to demonstrate that the equipment proposed for this
code measure is available from several different suppliers.
To contact lighting distributors for the survey, we started by using the lists of sales reps on the
websites of the following major occupancy sensor manufacturers. Between them, we believe
that these manufacturers account for the overwhelming majority of occupancy sensor sales in the
state. Manufacturers are listed in alphabetical order:
Cooper Controls
Greengate
Hubbell
Leviton
Lightolier
Lutron
SensorSwitch
Square D
Wattstopper
From the websites of these manufacturers we generated a list of sales reps that includes 156
businesses throughout California and is geographically segmented as shown in Figure 10.
Because the first four manufacturers we surveyed provided such a large number of sales rep
contacts, we did not pursue sales rep contacts for the remaining five manufacturers. However,

Automated Lighting Controls and Switching Requirements in Warehouses Page 20
2011 California Building Energy Efficiency Standards Draft Report March 2011
because there is so much overlap (i.e. each of the sales reps carries multiple manufacturers’
sensors), all eight manufacturers are well represented by the sales reps we surveyed. Figure 10
gives an indication of the relative market saturation based on the larger manufacturer’s sales rep
locations. The table shows that occupancy sensors are available throughout the state, and that in
each area of the state there are several manufacturers represented. This provides evidence that
the market for occupancy sensors is well established and competitive, and able to handle the
increase in orders that would result from this code change.
Region Leviton Lutron SensorSwitch WattStopper
SF Bay Area9 17 88 65 132
Inland Empire10
77 30
Los Angeles 17 264 85 99
Sacramento 17 231 20 33
San Diego 17 110 75 33
Other 17 50 33
Figure 10. Number of Sales Reps Listed on each Manufacturers’ Web Site, by Region
Seven sales reps from each region were randomly selected and called. We asked them for
occupancy sensor prices, but not all reps responded with prices. The main reason was that in
order to generate a bid query, the rep required project information (location, size, contractor
name), which we did not have. Of those willing to assist in the survey, we asked each sales rep:
Which manufacturer’s products do you most commonly sell?
What model(s) would you recommend?
What would be the labor cost for a certified electrician to complete the installation?
Can you please provide your thoughts on the relative quality of the sensors you carry and
any additional insights you have about occupancy sensors?
This survey was intended to be relatively informal and open-ended, and focused on gleaning as
much information as possible from the anecdotal responses given by lighting equipment reps
throughout the state.
As shown in Figure 11, we obtained prices on 41 ceiling-mounted occupancy sensors. We also
collected technical data on these sensors. This data was necessary to ensure that the full cost of
the sensor accessories was included, and that diversity in the market was adequately captured.
The technical data we collected included:
9 Alameda, Contra Costa, Marin, Napa, San Benito, San Francisco, San Mateo, Santa Clara , Santa Cruz, Solano, Sonoma
counties
10 Riverside and San Bernardino counties.

Lighting Control and Switching Requirements in Warehouses Page 21
2011 California Building Energy Efficiency Standards Draft Report March 2011
Area served
Time delay programming
Power pack requirement
Sensor technology (dual, ultrasonic or
infrared)
Voltage input (line or low)
Field of view (narrow, wide,
elliptical)
Line voltage Low Voltage Total
Infrared 6 3 9
Ultrasonic 19 1 20
Dual technology 2 10 12
Total 27 14 41
Figure 11. Number of Occupancy Sensors for which Prices were Obtained, by Type
Figure 12 shows the mean price for the six major types of occupancy sensor in the survey. We
have not shown the range of prices obtained from different sales rep for each sensor type, but the
range of prices was low compared to the difference between the sensor types.
As expected, line voltage sensors are cheaper than low voltage sensors. This is because low
voltage sensors are designed to allow manual-on operation, and therefore must include circuitry
for input from a low voltage switch, along with a transformer. Both these accessories add cost.
Line Voltage Low Voltage
Infrared $49.91 $62.20
Ultrasonic $99.21 $137.19
Dual technology $91.75 $108.89
Note that price includes the price of all associated power packs, lenses etc.
Figure 12. Average Price of Ceiling-Mounted Occupancy Sensors in Pricing Survey, by
Type
3.7 Cost Effectiveness
The hourly (―8760‖) estimates for energy use were multiplied by the hourly values for Time
Dependent Valuation (TDV $/kBTU) to obtain hourly estimates for the value of the energy
saved. TDV$ and kWh values were summed over 8760 hours to quantify annual savings. TDV$
are in present value dollars. Additionally, we compared the cumulative annual savings with the
costs of installing and purchasing occupancy sensors to quantify Life Cycle Cost (∆LCC).
3.7.1 Sensor Costs per Square Foot
Cost-effectiveness is determined by the price of the sensors (see 3.6) and the amount of
floorspace that can be controlled by a sensor. The Stakeholder Group told us that line voltage
infrared sensors are typical for warehouse applications, because user override is usually not
desirable (therefore low voltage switches are not required), and because ultrasonic sensors do not
work well in open areas. Based on this information we have used line voltage sensors as the basis

Automated Lighting Controls and Switching Requirements in Warehouses Page 22
2011 California Building Energy Efficiency Standards Draft Report March 2011
for the cost effectiveness calculations. From the pricing survey, the mean price of these sensors
was $49.91 (Figure 13).
For the floorspace served by each sensor, we used the 40’ on-center spacing suggested by the
stakeholder group (and typically quoted in manufacturers’ literature), along with a conservative
(low) estimate of the width of aisles, at 8’ (also from the stakeholder group). This gives an
average of 320 square feet served by each sensor—much less than the 1,000 square foot
maximum quoted by manufacturers, and therefore well within the technical capability of
commonly-available sensors. For open areas we have assumed a slightly greater coverage of 500
square feet, which is the lowest value typically quoted by manufacturers.
We used a survey conducted by Craig DiLouie for the Lighting Controls Association1 (LCA) to
estimate how often contractors are called back to fix problems with occupancy sensors (we did
not use this survey to calculate other costs). The survey found that contractors are called back to
20% of jobs to change occupancy sensor sensitivity or time delay. In our cost calculations we
have included the cost for a one-hour contractor call-back in 20% of cases.
The LCA survey also found that contractors are generally familiar with the installation and
calibration of occupancy sensors, which leads us to believe that they would be competent to
install them in warehouses for this code measure: “electrical contractors routinely calibrate
motion sensitivity and time delay settings in occupancy sensor installations; recommend
occupancy sensors in a majority of lighting retrofit projects; select time delay settings that on
average support optimal energy savings and lamp life; and are satisfied with occupancy sensor
performance, ease of installation and commissioning, and customer/occupant acceptance.”
1 DiLouie, Craig. Study Finds Occupancy Sensors Routinely Commissioned by Satisfied Contractors, but Suffer High Callback
Rate . July 2007. Accessed at http://www.aboutlightingcontrols.org/education/papers/2007_occ_sensor_study.shtml

Automated Lighting Controls and Switching Requirements in Warehouses Page 23
2011 California Building Energy Efficiency Standards Draft Report March 2011
Installed Cost (per sensor) Notes
Dual technology line
voltage sensor $49.91 From pricing survey
Installation and
commissioning $100.00 1 hour (per RS Means) at $100/hr
Callbacks $20.00 20% callbacks per LCA survey
Total $169.91
Area Served by each sensor
Length 40’ From manufacturers’ literature,
Width 8’ Conservative estimate of typical aisle width
Area 320 ft2 (500 ft
2for open spaces)
Total Cost per Square Foot
Total $0.53 /ft2 ($0.34 / ft
2 for open spaces)
Figure 13. Installed Costs for Occupancy Sensors
3.7.2 Life Cycle Cost and Benefit:Cost Ratio
The present value of the total savings over the 15 year measure life is shown in Figure 14, in the
―savings‖ column. The second column (∆LCC) is the difference between the savings estimate
and the installed cost for occupancy sensors, shown in Figure 13. Because the ∆LCC value is
positive, the measure is cost-effective over its 15 year life. Figure 14 also shows the benefit:cost
ratio for each space, i.e. the number of times the cost savings outweigh the installation costs over
the life of the measure.
The TDV calculation of the value of energy savings over the life of the measure is too
complicated to reproduce in this report, because it requires the summing of hourly values over
the course of several years, adjusted for net present value. Instead we have provided the final
values for savings and cost, shown in Figure 14.

Automated Lighting Controls and Switching Requirements in Warehouses Page 24
2011 California Building Energy Efficiency Standards Draft Report March 2011
Space Type Savings (TDV $/ft2) ∆LCC (TDV $/ft
2)
Benefit:Cost
Ratio
Aisle Freezer $3.02 $2.48 5.68
Aisle Non-refrigerated $3.33 $2.74 6.26
Aisle Refrigerated $4.39 $3.80 8.26
Open Non-refrigerated $4.29 $3.92 12.64
Open Refrigerated $4.42 $4.04 13.00
Open Freezer $4.29 $3.92 12.64
Average $3.64 $3.11 7.99
Figure 14. Table of Life Cycle Cost

Automated Lighting Controls and Switching Requirements in Warehouses Page 25
2011 California Building Energy Efficiency Standards Draft Report March 2011
4. Recommended Language for the Standards Document,
ACM Manuals, and the Reference Appendices
This section describes the specific recommended language and contains enough detail to develop
the draft standard in the next phase of work. We have used the language from the 2008 standard,
and have used underlining to indicate new language and strikethroughs to show deleted
language.
4.1 Summary of Proposed Changes
We propose to change the standards to require that at least two thirds of the lighting in
warehouse aisles and open spaces be controlled by an occupancy sensor that switches the
lighting off at unoccupied times. The occupancy sensor would have to meet the requirements for
occupancy sensors in section 119(d), with the caveat that it need not switch off all the lighting in
the space.
We propose to add a new section 131(h), to set out those spaces in which occupancy sensors are
required.
This proposal allows an opportunity to simplify the code. We propose to remove the Power
Adjustment Factor of 0.15 for ―Commercial and Industrial Storage stack areas (max. 2 aisles per
sensor)‖, allowed when the lighting is controlled by a ―Multi-level occupant sensor (see Note 21)
that reduces lighting power at least 50% when no persons are present. May be a switching or
dimming system.‖ (see Note 32) in table 146-C.
We also propose to revise section 131(b) by lowering the threshold for multi-level controls from
0.8 W/sf to 0.5 W/sf. We were advised by the Energy Commission that we should recommend a
reduction in this threshold, but not until the stakeholder process had already concluded, so we
did not have an opportunity to discuss this change with stakeholders. The threshold for multi-
level controls has not been lowered for several code cycles, during which LPDs have been
reduced significantly in many space types, so this change is required to maintain the "hierarchy"
of controls (basic switch/multi-level switching/automatic controls). Lowering this requirement
for bi-level controls would affect the following spaces:
Electrical, mechanical, telephone rooms 0.7 W/sf
Locker/dressing room 0.8 W/sf
Commercial and industrial storage (refrigerated) 0.7 W/sf
All other spaces are not affected by the drop from 0.8 W/sf to 0.5 W/sf. They are either higher
than 0.8 W/sf and therefore already required to install bi-level or they are below 0.5 W/sf.
Therefore, a change in this threshold would not negatively affect many spaces, but would allow
us to keep the hierarchy of the code intact.
Finally, we propose to lower the exemption for emergency lighting from 0.3 W/sf to 0.2 W/sf,
because the requirement to switch off at least two thirds of the lighting conflicts with the 0.3
W/sf threshold whenever the installed LPD is less than 0.6 W/sf (which it must be in
warehouses). The lighting calculations we carried out for the warehouse space (Section 3.3)
showed that sufficient emergency illuminance could be achieved in the corridor using 0.05 W/sf.

Automated Lighting Controls and Switching Requirements in Warehouses Page 26
2011 California Building Energy Efficiency Standards Draft Report March 2011
4.2 Proposed Language
We propose to add language to section 101 to describe the affected areas, and to Section 131 to
define the new requirements.
SECTION 101(b)
NONRESIDENTIAL FUNCTION AREA OR TYPE OF USE
Commercial and industrial storage is a room, area, or building used for storing items.
Aisle way is a warehouse facility term describing a long, usually narrow space between
storage racks. Aisles are usually lit using a single row of ceiling fixtures along the
centerline of the aisle.
Open area is a warehouse facility term describing a large unobstructed area that is
typically used for the handling and temporary storage of goods.
SECTION 131 – INDOOR LIGHTING CONTROLS THAT SHALL BE INSTALLED
(d) Shut-off Controls
6. Occupant sensors that reduce lighting power in the space by at least 50% and are
compliant with Section 119 shall be installed in the following spaces:
1. Corridors
2. Stairwells
3. Aisle ways in warehouses
4. Open spaces in warehouses
Each luminaire must be controlled by no more than two occupant sensors.
EXCEPTION 1 to 131(d)6: In spaces in which the installed lighting power is 80% or less of
the value allowed under the Area Category Method, occupant sensors may reduce power
by only 60%.

Automated Lighting Controls and Switching Requirements in Warehouses Page 27
2011 California Building Energy Efficiency Standards Draft Report March 2011
SECTION 146(c)—CALCULATION OF ALLOWED INDOOR LIGHTING POWER DENSITY
TABLE 146-C LIGHTING POWER ADJUSTMENT FACTORS
TYPE OF CONTROL TYPE OF SPACE FACTOR
Multi-level occupant sensor (see Note 2) combined with
multi-level circuitry and switching in accordance with Section 146(a)2D
Any space ≤ 250 square feet enclosed by floor-to-ceiling
partitions; any size classroom, corridor, conference or waiting room.
0.20
Multi-level occupant sensor (see Note 2) that reduces lighting power at least 50% when no persons are present.
May be a switching or dimming (see Note 3) system.
Hallways of hotels/motels , multi-family, dormitory, and senior housing
0.25
Commercial and Industrial Storage stack areas (max. 2 aisles per sensor)
0.15
Library Stacks (maximum 2 aisles per sensor) 0.15
Dimming
system
Manual Hotels/motels, restaurants, auditoriums, theaters 0.10
Multiscene programmable Hotels/motels, restaurants, auditoriums, theaters 0.20
Demand responsive lighting control that reduces lighting power consumption in response to a demand response
signal. (See Note 1)
All building types 0.05
Manual dimming of dimmable electronic ballasts. (see Note 3)
All building types 0.10
Demand responsive lighting control that reduces lighting
power consumption in response to a demand response signal when used in combination with manual dimming of
dimmable electronic ballasts (see Note 1 and 3).
All building types 0.15
Combined controls
Multi-level occupant sensor (see Note 2) combined with multi-level circuitry and switching in accordance with Section
146(a)2D combined with automatic multi-
level daylighting controls
Any space 250 square feet within a daylit area and enclosed
by floor-to-ceiling partitions, any size classroom, corridor, conference or waiting room. The PAF may be added to the
daylighting control credit
0.10
Manual dimming of dimmable electronic
ballasts (see Note 3) when used in
combination with a multi-level occupant
sensor (see Note 2) combined with multi-
level circuitry and switching in accordance with Section 146(a)2D.
Any space 250 square feet enclosed by floor-to-ceiling
partitions; any size classroom, corridor, conference or waiting
room
0.25
Automatic multi-
level daylightin
g controls
(See Note 1)
Total primary sidelit daylight
areas less than 2,500 ft² in an enclosed space and all
secondary sidelit areas. (see
Note 4)
Effective Aperture
General Lighting Power Density
(W/ft²)
>10% and ≤20%
>20% and ≤35%
>35% and ≤65%
> 65%
All 0.12 0.20 0.25 0.30
Total skylit daylight areas in an enclosed space less than 2,500
square feet, and where glazing
material or diffuser has ASTM D1003 haze measurement
greater than 90%
Effective Aperture
General Lighting Power Density
(W/ft²)
0.6% ≤ EA < 1%
1% ≤ EA < 1.4%
1.4% ≤ EA < 1.8%
1.8% ≤ EA
LPD < 0.7 0.24 0.30 0.32 0.34
0.7 ≤ LPD< 1.0 0.18 0.26 0.30 0.32
1.0 ≤ LPD < 1.4 0.12 0.22 0.26 0.28
1.4 ≤ LPD 0.08 0.20 0.24 0.28
NOTES FOR TABLE 146-C:
1. PAFs shall not be available for lighting controls required by Title 24, Part 6.
2. To qualify for the PAF the multi-level occupant sensor shall comply with the applicable requirements of Section 119
3. To qualify for the PAF all dimming ballasts for T5 and T8 linear fluorescent lamps shall be electronic and shall be certified to the Commission with a minimum RSE in accordance with Table 146-D.
4. If the primary sidelit daylight area and the secondary sidelit daylight area are controlled together, the PAF is determined based on the
secondary sidelit effective aperture for both the primary sidelit daylight area and the secondary sidelit daylight area.

Automated Lighting Controls and Switching Requirements in Warehouses Page 28
2011 California Building Energy Efficiency Standards Draft Report March 2011
4.3 NOTES FOR TABLE 146-C:
5. PAFs shall not be available for lighting controls required by Title 24, Part 6.
To qualify for the PAF the multi-level occupant sensor shall comply with the applicable
requirements of Section 119
To qualify for the PAF all dimming ballasts for T5 and T8 linear fluorescent lamps shall be
electronic and shall be certified to the Commission with a minimum RSE in accordance with
Table 146-D.
If the primary sidelit daylight area and the secondary sidelit daylight area are controlled together,
the PAF is determined based on the secondary sidelit effective aperture for both the primary
sidelit daylight area and the secondary sidelit daylight area.
4.4 Material for Compliance Manuals
We will develop material for the compliance manuals in the final CASE report once the
proposed code language has been approved by the California Energy Commission.
In this section, we will provide information that will be needed to develop the Residential and/or
Nonresidential Compliance Manuals, including:
Possible new compliance forms or changes to existing compliance forms.
Examples of how the proposed Standards change applies to both common and outlying
situations. Use the question and answer format used in the 2005 Residential and
Nonresidential Compliance Manuals.
Any explanatory text that should be included in the Manual.
Any data tables needed to implement the measure.

Automated Lighting Controls and Switching Requirements in Warehouses Page 29
2011 California Building Energy Efficiency Standards Draft Report March 2011
5. Bibliography and Other Research
5.1 Codes and Standards
California Code of Regulations (CCR), Title 24. 2007. Known as the California Building
Standards Code. Regarding standards for emergency egress lighting.
http://www.bsc.ca.gov/title_24/default.htm
Life Safety Code of the National Fire Protection Association (NFPA). 2003. Regarding standards
for emergency egress lighting.
http://www.nfpa.org/categoryList.asp?categoryID=124&URL=Codes%20&%20Standards
Illuminating Engineering Society of North America. 2000. Lighting Handbook, 9th
Edition.
Regarding recommended light levels for space. www.iesna.org.
California Energy Commission (CEC).2005. Life Cycle Cost Methodology – 2008 California
Building Energy Efficiency Standards. Prepared by Architectural Energy Corporation (AEC).
5.2 Personal Communications
Linda Murphy and Keith Sage. 2009. Program staff for California Multifamily New Homes
Program. Regarding plans for multifamily buildings. February 2009.
Mara Blitzer. 2008. Senior Project Manager with Tenderloin Neighborhood Development Corp.
Regarding use of occupancy sensors in multifamily corridors. October 2008.
Jay Wratten. 2008. Designer with Flack & Kurtz. Regarding use of occupancy sensors in
multifamily corridors. November 2008.
Gary Flamm. 2009. Lighting Lead at California Energy Commission. Regarding hierarchy of
code and appropriate code language for proposed measure. September 2008-March 2009.
Miguel Castellanos. 2008. Engineer with ECOM Engineering. Regarding installation and
reliability of occupancy sensors. September 2008.
Teresa Clarke. 2008. Developer with Affordable Housing Alliance. Regarding her experience
with controls in AHA’s multifamily buildings. September 2008.
5.3 Other
SensorSwitch, Inc. 2008. Logged data from occupancy sensors. Not published.
Construction Industry Research Board (CIRB). 2009. California Construction Review, May
2009. http://www.cirbdata.com/reports/index.html
WattStopper, Inc. 2002. Nightlights Fuel Energy Savings and Guest Satisfaction. Case study
conducted by Lawrence Berkeley Laboratory. www.wattstopper.com.
California Energy Commission. 2005. California Commercial End Use Survey (CEUS).
Regarding energy use intensities for lighting. http://www.energy.ca.gov/ceus/
Lighting Contractors Association (LCA).2007. Study Finds Occupancy Sensors Routinely
Commissioned by Satisfied Contractors, but Suffer High Callback Rate . Prepared by DiLouie,

Automated Lighting Controls and Switching Requirements in Warehouses Page 30
2011 California Building Energy Efficiency Standards Draft Report March 2011
Craig . July 2007. Accessed at
http://www.aboutlightingcontrols.org/education/papers/2007_occ_sensor_study.shtml
California Investor-Owned Utilities. 2007. Non Residential New Construction (NRNC) survey
database. Based on RLW Analytics, Inc. An Evaluation of the 2004-2005 Savings By Design
Program. Retrieved from www.calmac.org on 7/28/2009.
Heschong Mahone Group. 2002. Photocontrol System Field Study, report submitted to Southern
California Edison. Retrieved from www.h-m-g.com.
Automated Lighting Controls and Switching Requirements in Warehouses Page 31
2011 California Building Energy Efficiency Standards Draft Report March 2011
6. Appendices
Appendix A – Stakeholder Group Participants
The Stakeholders Group includes those who attended one of the three meetings, and a few people
who we contacted separately to make use of specific expertise. Note that the Stakeholder Group
for this proposed measure was combined with the Stakeholder Group for a measure on
occupancy sensors in hotel and multifamily buildings.
George Loisos, Architect/Lighting Designer, Loisos + Ubbelohde Architects
Lisa Bornemann, Lighting Designer, H. E. Banks + Associates
Christ Surunis, Sr. Account Supervisor - Hospitality, Lutron Electronics Company, Inc.
Teresa Clarke, Senior Project Manager, Affordable Housing Associates
Jeff Fox, Director of Projects and Product Development, Hilton Garden Inn Brand
Management
Ben Hahn, Marketing Manager, SensorSwitch
Jim Abrams, President (Now Retired), California Hotel and Lodging Association
Bobbie Singh-Allen, VP of Government Relations, California Hotel and Lodging
Association
Charles Knuffke, Panel Manager, The Watt Stopper
Gregor Stewart, Associated Lighting Representatives, Inc.
Nick Bleeker, Director of Business Development, Day-Brite Capri Omega
Gary Flamm – California Energy Commission
Jeff Fox - Hilton Hotels, Hilton Garden Brand
Rick Lawton – Safeway
Eric Richman – PNNL
Lynn Mohrfield – California Hotel and Lodging Association
Mike Crockett - Safeway

Lighting Control and Switching Requirements in Warehouses Page 32
2011 California Building Energy Efficiency Standards Draft Report October 2009
Appendix B—Illuminance Plots for Warehouses
This sections shows floor-level illuminance plots for a warehouse aisle (top of image) and open space (bottom of image) generated by
Lumen Designer using standard radiosity calculations on a regular grid.
Figure 15. Illuminance Plot for Occupied State (all lighting on)
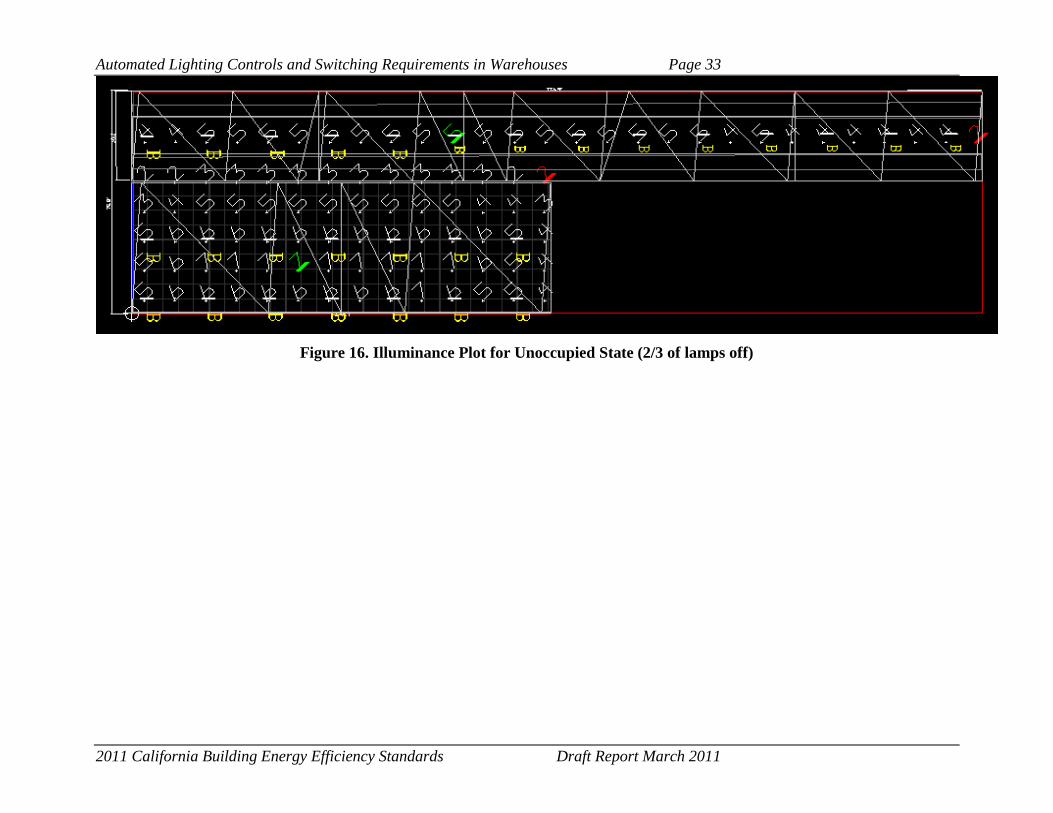
Automated Lighting Controls and Switching Requirements in Warehouses Page 33
2011 California Building Energy Efficiency Standards Draft Report March 2011
Figure 16. Illuminance Plot for Unoccupied State (2/3 of lamps off)
Lighting Control and Switching Requirements in Warehouses Page 34
2011 California Building Energy Efficiency Standards Draft Report July 2009
Automated Lighting Controls and Switching Requirements in Warehouses
Appendix C—Results of Market and Pricing Survey
This appendix shows the results of the market and pricing survey. The survey was conducted in
November and December 2008. The column showing ―Required auxiliary equipment price‖
refers to power supplies and lenses that had to be included to make the equipment functional.

Automated Lighting Controls and Switching Requirements in Warehouses Page 35
2011 California Building Energy Efficiency Standards Draft Report March 2011
Region Manufacturer
Name
Unit
Price
Req Aux
Equipment
Price
Low
voltage
model?
Line
Voltage
Model?
Infrared
Model?
Ultrasonic
Model?
Dual Tech
Model?
BA Leviton $129.00 $31.00 TRUE FALSE FALSE FALSE TRUE
IE Leviton $125.00 $35.70 TRUE FALSE FALSE FALSE TRUE
IE Leviton $107.60 $35.70 TRUE FALSE FALSE FALSE TRUE
IE WattStopper $90.44 $23.41 TRUE FALSE FALSE TRUE FALSE
IE WattStopper $74.81 $23.41 TRUE FALSE FALSE TRUE FALSE
IE WattStopper $86.00 $35.00 TRUE FALSE TRUE FALSE FALSE
IE WattStopper $100.00 $35.00 TRUE FALSE FALSE TRUE FALSE
IE WattStopper $162.00 $35.00 TRUE FALSE FALSE FALSE TRUE
IE WattStopper $43.00 FALSE TRUE TRUE FALSE FALSE
LA Leviton $137.19 TRUE FALSE FALSE TRUE FALSE
LA Leviton $91.46 TRUE FALSE FALSE FALSE TRUE
LA Leviton $157.13 TRUE FALSE FALSE FALSE TRUE
SD SensorSwitch $67.50 FALSE TRUE FALSE FALSE FALSE
SD SensorSwitch $43.50 FALSE TRUE FALSE FALSE TRUE
SD WattStopper $90.00 $30.00 TRUE FALSE FALSE TRUE FALSE
SD WattStopper $110.00 $30.00 TRUE FALSE FALSE TRUE FALSE
Sac SensorSwitch $49.95 FALSE TRUE FALSE FALSE FALSE
Sac SensorSwitch $93.75 TRUE FALSE FALSE FALSE TRUE
Sac SensorSwitch $95.00 TRUE FALSE FALSE FALSE TRUE
Sac WattStopper $105.63 $25.02 TRUE FALSE FALSE TRUE FALSE
Sac WattStopper $123.38 $25.02 TRUE FALSE FALSE TRUE FALSE
LA WattStopper $92.67 $20.67 TRUE FALSE FALSE TRUE FALSE
LA WattStopper $40.00 FALSE TRUE TRUE FALSE FALSE
LA Leviton $140.00 $34.00 FALSE FALSE FALSE FALSE TRUE

Automated Lighting Controls and Switching Requirements in Warehouses Page 36
2011 California Building Energy Efficiency Standards Draft Report March 2011
Region Manufacturer
Name
Unit
Price
Req Aux
Equipment
Price
Low
voltage
model?
Line
Voltage
Model?
Infrared
Model?
Ultrasonic
Model?
Dual Tech
Model?
BA SensorSwitch $49.00 FALSE TRUE FALSE FALSE FALSE
BA SensorSwitch $75.60 $37.32 TRUE FALSE FALSE FALSE FALSE
BA SensorSwitch $63.00 TRUE FALSE FALSE FALSE TRUE
BA WattStopper $109.00 TRUE FALSE FALSE TRUE FALSE
BA WattStopper $95.00 TRUE FALSE FALSE TRUE FALSE
BA WattStopper $120.00 $30.00 TRUE FALSE FALSE TRUE FALSE
BA WattStopper $100.00 $30.00 TRUE FALSE FALSE TRUE FALSE
BA WattStopper $80.00 $30.00 TRUE FALSE FALSE TRUE FALSE
BA WattStopper $88.20 $24.80 TRUE FALSE FALSE TRUE FALSE
BA WattStopper $107.10 $24.80 TRUE FALSE FALSE TRUE FALSE
BA WattStopper $125.10 $24.80 TRUE FALSE FALSE TRUE FALSE
BA SensorSwitch $50.00 FALSE TRUE FALSE FALSE FALSE
BA SensorSwitch $65.00 TRUE FALSE FALSE FALSE TRUE
BA WattStopper $107.00 $27.30 TRUE FALSE FALSE TRUE FALSE
BA WattStopper $91.63 $27.30 TRUE FALSE FALSE TRUE FALSE
BA WattStopper $75.00 $27.30 TRUE FALSE FALSE TRUE FALSE
BA Leviton $25.00 $31.00 TRUE FALSE TRUE FALSE FALSE
Figure 17. Results of Market and Pricing Survey
Appendix D –Energy Use Graphs
The following graphs show the energy use before occupancy sensors are installed (blue and gray
lines) and the energy use after installation (yellow and red lines). The difference between the
lines is the amount of savings realized for each space type. Each data point is the percentage of
time that lights are on for a given hour of the day. This data is first presented in section 3.3.

Automated Lighting Controls and Switching Requirements in Warehouses Page 37
2011 California Building Energy Efficiency Standards Draft Report March 2011
0%
10%
20%
30%
40%
50%
60%
70%
80%
90%
100%
0 1 2 3 4 5 6 7 8 9 10 11 12 13 14 15 16 17 18 19 20 21 22 23
Pe
rce
nta
ge
of
Tim
e
Hour
Baseline and Technical Savings Potential for NonRefrigerated Warehouse Aisles
by Hour of the Day
Lighting Use with Occ Sensors Weekday Lighting Use with Occ Sensors Weekend
Lighting Use w/out Occ Sensors Weekday Lighting Use w/out Occ Sensors Weekend
0%
10%
20%
30%
40%
50%
60%
70%
80%
90%
100%
0 1 2 3 4 5 6 7 8 9 10 11 12 13 14 15 16 17 18 19 20 21 22 23
Pe
rce
nta
ge
of
Tim
e
Hour
Baseline and Technical Savings Potential for Refrigerated Warehouse Open Space
by Hour of the Day
Lighting Use with Occ Sensors Weekday Lighting Use with Occ Sensors Weekend
Lighting Use w/out Occ Sensors Weekday Lighting Use w/out Occ Sensors Weekend

Automated Lighting Controls and Switching Requirements in Warehouses Page 38
2011 California Building Energy Efficiency Standards Draft Report March 2011
0%
10%
20%
30%
40%
50%
60%
70%
80%
90%
100%
0 1 2 3 4 5 6 7 8 9 10 11 12 13 14 15 16 17 18 19 20 21 22 23
Pe
rce
nta
ge
of
Tim
e
Hour
Baseline and Technical Savings Potential for Refrigerated Warehouse Aisles
by Hour of the Day
Lighting Use with Occ Sensors Weekday Lighting Use with Occ Sensors Weekend
Lighting Use w/out Occ Sensors Weekday Lighting Use w/out Occ Sensors Weekend
0%
10%
20%
30%
40%
50%
60%
70%
80%
90%
100%
0 1 2 3 4 5 6 7 8 9 10 11 12 13 14 15 16 17 18 19 20 21 22 23
Pe
rce
nta
ge
of
Tim
e
Hour
Baseline and Technical Savings Potential for Freezer Warehouse Aisles
by Hour of the Day
Lighting Use with Occ Sensors Weekday Lighting Use with Occ Sensors Weekend
Lighting Use w/out Occ Sensors Weekday Lighting Use w/out Occ Sensors Weekend