Embed Size (px)
Citation preview
Draft Joint FDA / Health Canada Quantitative Assessment of the Risk of Listeriosis from Soft-Ripened Cheese Consumption in North America: Answer to the Peer Review.
Food Directorate / Direction des aliments Health Canada / Santé Canada Center for Food Safety and Applied Nutrition Food and Drug Administration U.S. Department of Health and Human Services
2012

Contents I. INTRODUCTION ................................................................................................................... 3 II. CHARGE TO REVIEWERS ............................................................................................... 4 III. SPECIFIC OBSERVATIONS ........................................................................................... 44 References ..................................................................................................................................... 50
I. INTRODUCTION Listeria monocytogenes is a widely occurring pathogen that can be found in agricultural and food processing environments. Ingestion of L. monocytogenes can lead to the development of listeriosis, with consequences that may include septicemia, meningitis, encephalitis, spontaneous abortion, and stillbirth. Epidemiological data show that listeriosis has the highest hospitalization rate and one of the highest case fatality rates among foodborne diseases in the United States. Serious illness occurs preferentially in people considered as more susceptible, such as elderly and those who have a pre-existing illness that reduces the effectiveness of their immune system, and in pregnant women. The United States and Canada have experienced sporadic illnesses and outbreaks of listeriosis associated with the consumption of cheese. Both the US Department of Health and Human Services (HHS) / Food and Drug Administration (FDA) and Health Canada – Santé Canada (HS-SC) continue to evaluate the safety of soft cheese, particularly soft cheese made from unpasteurized milk. The L. monocytogenes in soft-ripened cheese risk assessment evaluates the effect of factors such as the microbiological status of milk, the impact of cheese manufacturing steps on L. monocytogenes levels, and conditions during distribution and storage on the overall risk of invasive listeriosis to the consumer, following the consumption of soft-ripened cheese in Canada and in the United States. The risk assessment evaluates the effectiveness of some process changes and intervention strategies in reducing risk of human illness. Peer Reviewers: József Baranyi, Ph.D. Institute of Food Research, Norwich Expertise: Risk Assessment Modeling, Food Microbiology, Listeria James S. Dickson, Ph.D. Iowa State University Expertise: Food Microbiology, Food Technology, Listeria Cary Frye International Dairy Foods Association Experise: Food Technology, Cheese/Dairy Industry Ralph L. Kodell, Ph.D. University of Arkansas for Medical Sciences Expertise: Biostatistics,
II. CHARGE TO REVIEWERS Please provide written responses to the following questions: Charge Questions: 1. Does the study correctly and fully answer the charge of this risk assessment? 2. The general model is divided into basic processes (Nauta 2008) that affect L. monocytogenes prevalence and levels, such as “Growth,” “Inactivation,” “Partitioning and Mixing,” “Contamination,” and “Removal.” Are these basic processes correctly considered according to the current scientific literature? In particular: a) Growth of Listeria monocytogenes in milk and in aging cheese (Section 6.1.1): Are the models, methods, data and implementations used in this study scientifically sound and up-to-date? b) Growth of Listeria monocytogenes in cheese during ripening (Section 6.1.2): Are the models, methods, data and implementations used in this study scientifically sound and up-to-date? c) In-plant contamination (Section 6.4): The study from Gombas et al. (2003) was used to infer prevalence and level of contamination of soft-ripened cheese in-plant. Is this method scientifically sound with regards to this risk assessment? d) Removal (Section 6.5): The study uses some assumptions on parameters for tests used to detect L. monocytogenes in bulk milk and in soft ripened cheese lots as risk mitigation strategies. Are these assumptions reasonable? If any of these basic processes’ implementation is not scientifically sound or if other data that would significantly change the results of the study are available, provide the corresponding references. 3. A farm to fork model is developed to estimate the exposure to L. monocytogenes from the consumption of a serving of soft ripened cheese. Are the general processes and the data used in this exposure assessment scientifically sound and based on valid and up-to-date data, methods and implementation? Provide specific details for: a) The “on farm” stage (Section 7.1); b) The “cheese processing” stage (cheese making, ripening, …) (Section 7.2); c) The “transport and marketing” and the “Retail” stage (Section 7.3); d) The “at home” stage, including consumption (Section 7.4).
If one or more of these process stages are not in line with the current practices or if other data that would significantly change the results of the study are available, please provide the corresponding references. 4. The study uses the FAO/WHO (2004) dose-response models and parameters. Is this an appropriate approach? If another approach is suggested, please provide the corresponding references. 5. Do the risk characterization sections provide useful, understandable and comprehensive results on the model? Do the risk metrics used in this report permit one to correctly answer the charge questions? 6. Comment on how the model treats the separation of uncertainty and variability and their implementation in second-order Monte-Carlo simulations. Is this methodology appropriate and well used for the purpose of the model and the available data? If not, explain what changes should be considered and how they would improve the model. Only one part of the data uncertainty is considered in the study. What other parts of uncertainty could be considered and how? 7. Is the “Discussion, limitations and caveats” section exhaustive and does it provide the reader a clear discussion of the limits of the use of the study results? 8. Comment on the adequacy of the risk assessment model documentation. Is the report clearly written? Is it complete? Does it follow a logical structure and layout? If not, suggest an alternative outline or approach for adequately and clearly documenting this risk assessment.
2
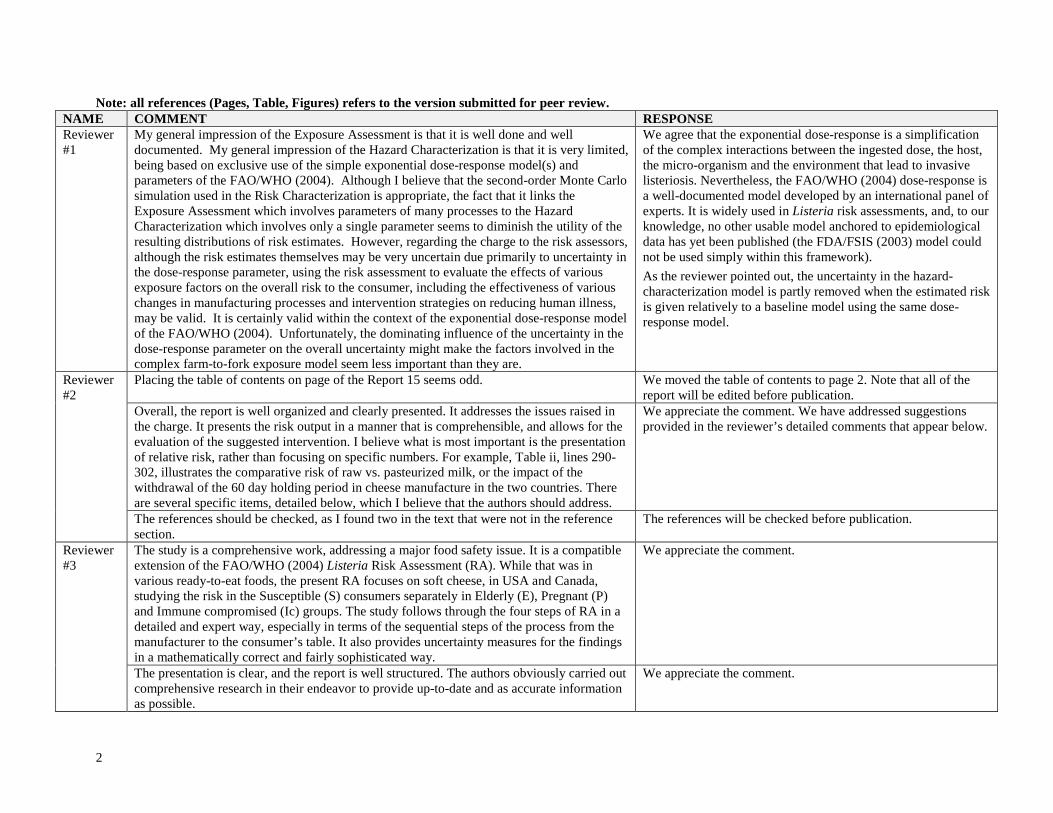
Note: all references (Pages, Table, Figures) refers to the version submitted for peer review. NAME COMMENT RESPONSE Reviewer #1
My general impression of the Exposure Assessment is that it is well done and well documented. My general impression of the Hazard Characterization is that it is very limited, being based on exclusive use of the simple exponential dose-response model(s) and parameters of the FAO/WHO (2004). Although I believe that the second-order Monte Carlo simulation used in the Risk Characterization is appropriate, the fact that it links the Exposure Assessment which involves parameters of many processes to the Hazard Characterization which involves only a single parameter seems to diminish the utility of the resulting distributions of risk estimates. However, regarding the charge to the risk assessors, although the risk estimates themselves may be very uncertain due primarily to uncertainty in the dose-response parameter, using the risk assessment to evaluate the effects of various exposure factors on the overall risk to the consumer, including the effectiveness of various changes in manufacturing processes and intervention strategies on reducing human illness, may be valid. It is certainly valid within the context of the exponential dose-response model of the FAO/WHO (2004). Unfortunately, the dominating influence of the uncertainty in the dose-response parameter on the overall uncertainty might make the factors involved in the complex farm-to-fork exposure model seem less important than they are.
We agree that the exponential dose-response is a simplification of the complex interactions between the ingested dose, the host, the micro-organism and the environment that lead to invasive listeriosis. Nevertheless, the FAO/WHO (2004) dose-response is a well-documented model developed by an international panel of experts. It is widely used in Listeria risk assessments, and, to our knowledge, no other usable model anchored to epidemiological data has yet been published (the FDA/FSIS (2003) model could not be used simply within this framework). As the reviewer pointed out, the uncertainty in the hazard-characterization model is partly removed when the estimated risk is given relatively to a baseline model using the same dose-response model.
Reviewer #2
Placing the table of contents on page of the Report 15 seems odd. We moved the table of contents to page 2. Note that all of the report will be edited before publication.
Overall, the report is well organized and clearly presented. It addresses the issues raised in the charge. It presents the risk output in a manner that is comprehensible, and allows for the evaluation of the suggested intervention. I believe what is most important is the presentation of relative risk, rather than focusing on specific numbers. For example, Table ii, lines 290-302, illustrates the comparative risk of raw vs. pasteurized milk, or the impact of the withdrawal of the 60 day holding period in cheese manufacture in the two countries. There are several specific items, detailed below, which I believe that the authors should address.
We appreciate the comment. We have addressed suggestions provided in the reviewer’s detailed comments that appear below.
The references should be checked, as I found two in the text that were not in the reference section.
The references will be checked before publication.
Reviewer #3
The study is a comprehensive work, addressing a major food safety issue. It is a compatible extension of the FAO/WHO (2004) Listeria Risk Assessment (RA). While that was in various ready-to-eat foods, the present RA focuses on soft cheese, in USA and Canada, studying the risk in the Susceptible (S) consumers separately in Elderly (E), Pregnant (P) and Immune compromised (Ic) groups. The study follows through the four steps of RA in a detailed and expert way, especially in terms of the sequential steps of the process from the manufacturer to the consumer’s table. It also provides uncertainty measures for the findings in a mathematically correct and fairly sophisticated way.
We appreciate the comment.
The presentation is clear, and the report is well structured. The authors obviously carried out comprehensive research in their endeavor to provide up-to-date and as accurate information as possible.
We appreciate the comment.
3
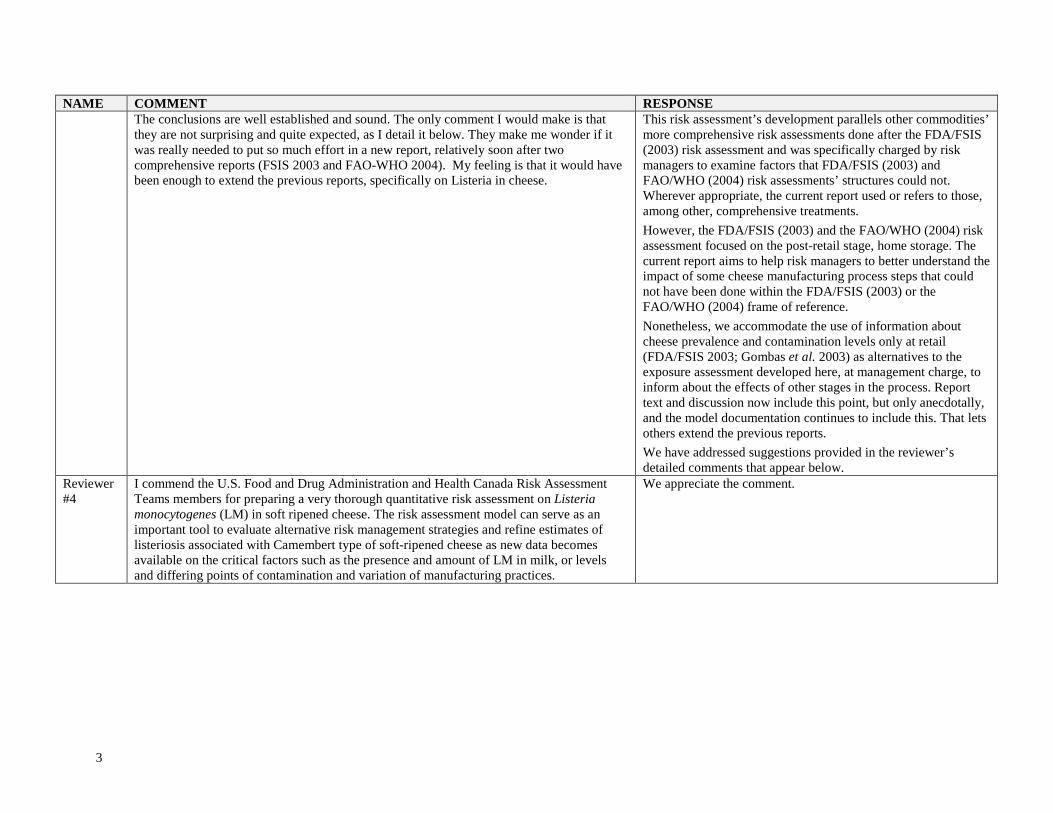
NAME COMMENT RESPONSE The conclusions are well established and sound. The only comment I would make is that they are not surprising and quite expected, as I detail it below. They make me wonder if it was really needed to put so much effort in a new report, relatively soon after two comprehensive reports (FSIS 2003 and FAO-WHO 2004). My feeling is that it would have been enough to extend the previous reports, specifically on Listeria in cheese.
This risk assessment’s development parallels other commodities’ more comprehensive risk assessments done after the FDA/FSIS (2003) risk assessment and was specifically charged by risk managers to examine factors that FDA/FSIS (2003) and FAO/WHO (2004) risk assessments’ structures could not. Wherever appropriate, the current report used or refers to those, among other, comprehensive treatments. However, the FDA/FSIS (2003) and the FAO/WHO (2004) risk assessment focused on the post-retail stage, home storage. The current report aims to help risk managers to better understand the impact of some cheese manufacturing process steps that could not have been done within the FDA/FSIS (2003) or the FAO/WHO (2004) frame of reference. Nonetheless, we accommodate the use of information about cheese prevalence and contamination levels only at retail (FDA/FSIS 2003; Gombas et al. 2003) as alternatives to the exposure assessment developed here, at management charge, to inform about the effects of other stages in the process. Report text and discussion now include this point, but only anecdotally, and the model documentation continues to include this. That lets others extend the previous reports. We have addressed suggestions provided in the reviewer’s detailed comments that appear below.
Reviewer#4
I commend the U.S. Food and Drug Administration and Health Canada Risk Assessment Teams members for preparing a very thorough quantitative risk assessment on Listeria monocytogenes (LM) in soft ripened cheese. The risk assessment model can serve as an important tool to evaluate alternative risk management strategies and refine estimates of listeriosis associated with Camembert type of soft-ripened cheese as new data becomes available on the critical factors such as the presence and amount of LM in milk, or levels and differing points of contamination and variation of manufacturing practices.
We appreciate the comment.
4
NAME COMMENT RESPONSE In general, the risk assessment does have limitations based on lack of information on the level and contamination of soft-ripened cheese due to the fact only a single study was available on the level of contamination at retail which was used to infer in-plant environmental contamination. As FDA is currently undertaking a field assignment to collect hundreds of environmental swabs and selected finished product samples for pathogen testing, including LM in soft cheese plants in the U.S., I would hope this new data could be used in the future with the risk model.
At present, however, very few data are available to infer in-plant environmental contamination, retail environment and consumer environment contamination. The major contributions that implementation, here, can make is to provide a structure (model) that can accommodate appropriate data, when they do become available, to inform the risk managers about the kinds of results that can be achieved from existing information, how the risk changes as the amount of contamination changes and to point to the absence of information as a data gap. FDA is indeed currently undertaking a field assignment to collect samples, and these data may be used in a model in the future. We, too, would see the value of updating this report when new data are available.
The predictive modeling used to model the growth of LM between point of contamination and consumption was based on the growth of LM in the Camembert (EGR20), which provided separate growth rates in the rind and the core of the cheese. This was based on the assumption “… that the pH is higher in the rind than the core and increases more than rapidly during ripening.” I have concerns that the risk assessment model of LM growth may differ in cheese made in commercial U.S. cheese processing facilities from cheese made in artisanal and farmstead operations. I have learned new information about pH changes during cheese ripening due to novel culture and processing technology used in modern commercial soft-cheese operations that differs from the traditional cheese culturing described in the risk assessment. This commercial cheese making technology is referred to as “stabilization” or “stabilized Brie and Camembert.” Stabilization, originating in France in the late 20th century, enhances the keeping quality of Brie and Camembert cheese. The principle involved is that of replacing the standard mesophilic lactic starter cultures with thermophilic cultures. In this process, the ripening cycle, when it reaches its optimum point, stabilizes so the further breakdown occurs very slowly and over-ripening seldom occurs, unlike traditional Camembert and Brie. Ripening of stabilized cheeses occurs uniformly throughout.1 Therefore, the conclusion of the risk assessment may be correct for artisanal and farmstead soft-ripened Camembert cheese that use traditional culturing, but would not accurately apply to cheese that is commercially produced in the U.S. using the stabilized culturing process. This is a critical point as it is estimated that 80-90% of Camembert sold in the U.S. is produced by the two largest commercial cheese operations. More detail about the impact of stabilized culture technology will be provided in specific comments.
An alternative, “stabilized Camembert” made with pasteurized milk at large commercial operations, is incorporated to address the new information that the reviewer brought to the project and becomes the baseline against which we compare other cases. We have addressed suggestions provided in the reviewer’s detailed comments that appear below.
5
NAME COMMENT RESPONSE Additionally, I felt the report failed to provide the reader with a clear understanding of the differences in the level of automation of cheese manufacturing, sanitation, methods to reduce post-pasteurization contamination, testing, and hazard control measures that are employed in commercial cheese operations.
We agree. The Management charge could have included, but did not include, the mandate to review and report on the important factors that the reviewer lists. Nevertheless, the model structure is one that other researchers can use to examine the effect on risk of those particular types of questions to address that knowledge gap.
It was also difficult, as a reader, to understand how the data on the estimated number of servings resulting in one case of invasive listeriosis equates to the number of servings consumed for this cheese and what proportion of cheese consumed that is made at farmstead and artisanal operations.
It was difficult, as writers, to convey information about the risk per serving in an understandable way for readers like the internal reviewers, here, without re-expressing small rates of occurrence, 1×10-p, for example, as 1 per 10p servings, without also inviting similar questions as the reviewer asks in this part of this comment. Data gaps like the absence of production data among the different cases that this risk assessment uses to describe how the risk varies among practices, are troubling. However, without those production data, that we focused on comparing only the risk per serving among cases rather than on a more global comparison, must suffice for us. This data gap was developed (section 2.4 Overview of the cheese industry) and the Summary and Limitations recalls it.
In summary, the information appears to be presented in a clear and understandable manner for the exposure assessment and risk characterization, as well as providing an accurate and in-depth discussion on the limitations of the model results and conclusions. Although as a food technologist, who is not experienced in risk modeling, I do not feel qualified to provide any review related to the mathematical formulas used for modeling.
We appreciate the comment.
It is helpful to have the risk assessment overview, and appendices in separate documents, but there seemed to be inconsistencies in terms used between these documents, such as “mild treatment,” “thermalization,” or “unspecified 3 log reduction” that I will note in my specific observations.
We changed all reference to “mild treatment”, “unspecified 3 log reduction” or “thermalization” to “3 log10 reduction” in the text and model and checked for and corrected other cases where terminology was not consistent.
Related to the effect of interventions, as noted above, the risk assessment may need to revise information related to commercial cheese making operations due to differing pH during ripening and aging that could impact LM growth curves. The choice of intervention options seemed well thought out, but did not provide any discussion on time, cost, and practicality of each intervention relative to the different types of cheese manufacturing operations.
We agree that those considerations are important to risk managers’ decisions. However, the discussion of the time, cost and practicality of each intervention is considered as out of the scope of this risk assessment. We have addressed suggestions provided in the reviewer’s detailed comments that appear below.
6
II. RESPONSE TO CHARGE QUESTIONS CHARGE QUESTION 1: Does the study correctly and fully answer the charge of this risk assessment?
NAME COMMENT RESPONSE Reviewer #1
The charge to the scientists who conducted the risk assessment is stated in the Risk Assessment Summary that accompanies the main risk assessment document. In response to the first bullet in the charge, the risk assessment evaluates, in the context of parameters appropriate for the manufacture of Camembert, the effect of factors such as presence and amounts of L. monocytogenes in milk, the impact of contamination or manufacturing practices at specific cheese-manufacturing steps, and conditions during distribution and storage on the overall risk to the consumer. Elaborate models and distributions are constructed, using available data and expert elicitation, for the phases involved in the exposure assessment. According to the sensitivity analysis, the uncertainty in ultimate risk estimates arising from the various processes involved in the complex farm-to-fork model is small compared to uncertainty with respect to the single parameter in the exponential dose-response model. This seems to downplay the significance of the many factors evaluated in the elaborate exposure assessment. Unless a more complete hazard characterization is done, including accounting for model uncertainty, it is hard to know if this risk assessment fully answers this part of the charge. However, as stated in the document, part of the uncertainty surrounding the exponential-model parameter is naturally discarded within this risk assessment, when alternatives are compared to the baseline model. In response to the second bullet point in the charge, within the context of the exponential dose-response model, the risk assessment makes it possible to evaluate the effectiveness of various changes in manufacturing processes and intervention strategies on reducing human illness. Notably, among the intervention strategies evaluated for raw-milk cheese, testing every raw-milk cheese lot and removing positive lots from the supply chain is the only alternative that leads to a mean risk lower than the one obtained in the pasteurized-milk baseline case.
See our comment on that issue above.
7
NAME COMMENT RESPONSE Variability in strain virulence was not considered in this risk assessment due to a stated lack of data (lines 1097-1100). I do not know what effect this might have on the risk of invasive listeriosis relative to other exposure factors, but it seems that it might be important.
Following this comment, we made the additional following analysis: the exponential FAO/WHO (2004) dose-response that is used in this risk assessment is an averaged dose response regarding variability in strain virulence, as it is inferred from epidemiological data that implies all kind of strains. Since 2004, the major knowledge about strain virulence is the variation in relation to subtypes encoding a full-length or truncated Internalin A (Lecuit et al. 1999; Lecuit et al. 2001; Chen et al. 2011). The “averaged” dose-response could be biased when used for soft-ripened cheese if the distribution of subtypes of Listeria in soft cheese differed from the one in other products. Using data from Chen et al. (2011) issued from an analysis of the strains isolated in the Gombas et al. (2003) study, the repartition of inlA subtypes is not significantly different in soft cheese compared to other food items (8 vs. 4 strains with/without premature stop codon (PMSC) for soft-ripened cheese, 219 vs. 271 for other food, p = 0.15. Without further data, we decided to use the FAO/WHO (2004) dose response.
Reviewer #2
The charge is discussed in lines 1-99 of the Appendix. However, it is unclear how much of this discussion is the interpretation of the Risk Assessment Team, and how much is the actual charge. I think that it is important to clarify this, perhaps including the original charge to the team in its entirety. If I were asked to point to the page or lines in the document where it clearly states “The charge from HC/FDA was…,” I would not be able to do so. Having said that, the study does address the issues described in Appendix, lines 1-99, correctly and fully.
The “Charge” section of the Appendix was indeed the original charge developed by the Risk manager Team. We made this clearer to readers by changing the name of the section to "Charge developed by the Risk Manager Team", and indicating in the text that it is the original charge statement, rather than a paraphrase or restatement.
Reviewer #3
The authors expertly go through the RA process, collect relevant data and combine them with their vast knowledge in a well-presented study. The conclusions are well established, understanding that uncertain answers can also be well established if the measures of uncertainty and their sensitivity to input parameters are provided.
We appreciate the comment.
Reviewer#4
The charge of the risk assessment was provided in the Appendixes pages 2-5 and also Scope and General Approach: “The Listeria monocytogenes soft-ripened cheese risk assessment focuses on the source(s) of Listeria monocytogenes contamination, the effects of individual manufacturing and/or processing steps and the effectiveness of various intervention strategies on the levels of L. monocytogenes in the product as consumed and the associated risk of invasive listeriosis.”
8
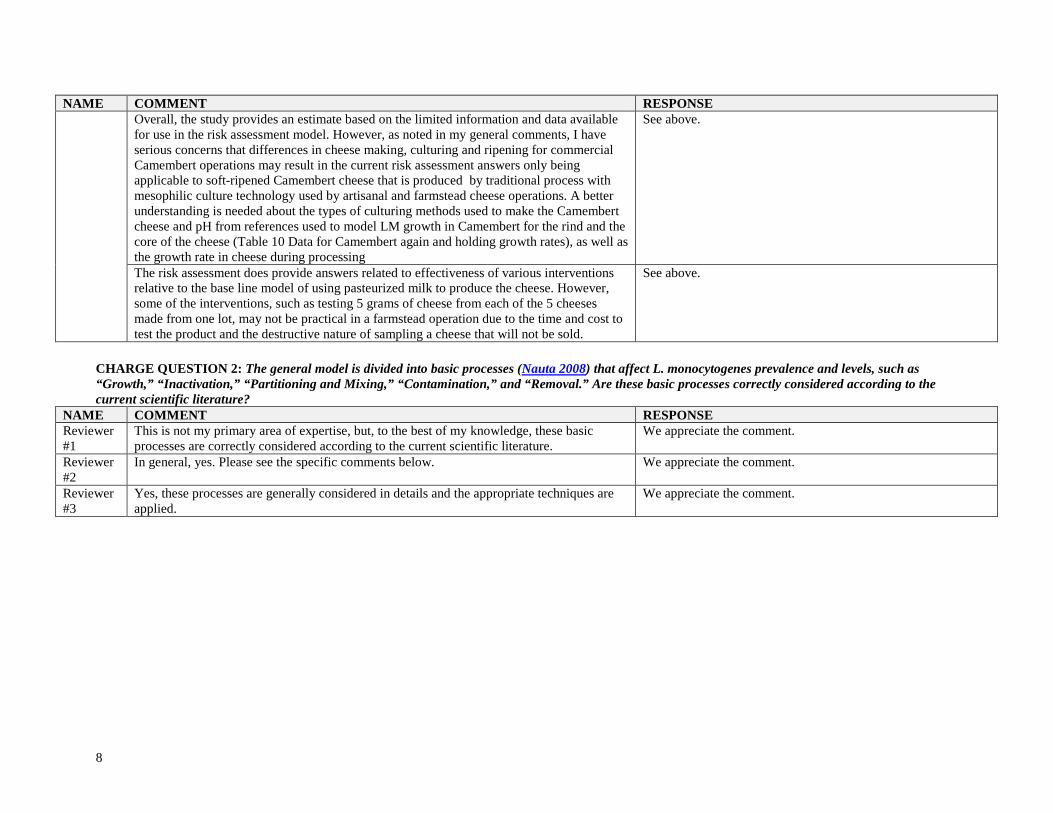
NAME COMMENT RESPONSE Overall, the study provides an estimate based on the limited information and data available for use in the risk assessment model. However, as noted in my general comments, I have serious concerns that differences in cheese making, culturing and ripening for commercial Camembert operations may result in the current risk assessment answers only being applicable to soft-ripened Camembert cheese that is produced by traditional process with mesophilic culture technology used by artisanal and farmstead cheese operations. A better understanding is needed about the types of culturing methods used to make the Camembert cheese and pH from references used to model LM growth in Camembert for the rind and the core of the cheese (Table 10 Data for Camembert again and holding growth rates), as well as the growth rate in cheese during processing
See above.
The risk assessment does provide answers related to effectiveness of various interventions relative to the base line model of using pasteurized milk to produce the cheese. However, some of the interventions, such as testing 5 grams of cheese from each of the 5 cheeses made from one lot, may not be practical in a farmstead operation due to the time and cost to test the product and the destructive nature of sampling a cheese that will not be sold.
See above.
CHARGE QUESTION 2: The general model is divided into basic processes (Nauta 2008) that affect L. monocytogenes prevalence and levels, such as “Growth,” “Inactivation,” “Partitioning and Mixing,” “Contamination,” and “Removal.” Are these basic processes correctly considered according to the current scientific literature?
NAME COMMENT RESPONSE Reviewer #1
This is not my primary area of expertise, but, to the best of my knowledge, these basic processes are correctly considered according to the current scientific literature.
We appreciate the comment.
Reviewer #2
In general, yes. Please see the specific comments below. We appreciate the comment.
Reviewer #3
Yes, these processes are generally considered in details and the appropriate techniques are applied.
We appreciate the comment.
9
NAME COMMENT RESPONSE Reviewer#4
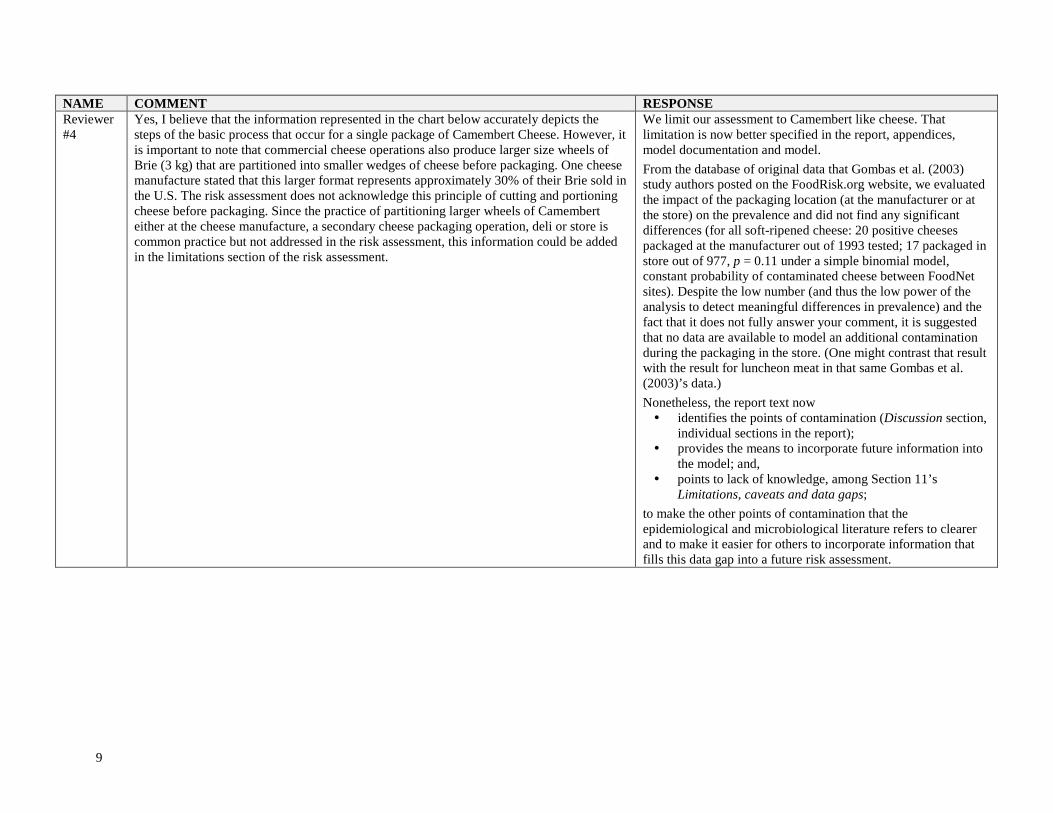
Yes, I believe that the information represented in the chart below accurately depicts the steps of the basic process that occur for a single package of Camembert Cheese. However, it is important to note that commercial cheese operations also produce larger size wheels of Brie (3 kg) that are partitioned into smaller wedges of cheese before packaging. One cheese manufacture stated that this larger format represents approximately 30% of their Brie sold in the U.S. The risk assessment does not acknowledge this principle of cutting and portioning cheese before packaging. Since the practice of partitioning larger wheels of Camembert either at the cheese manufacture, a secondary cheese packaging operation, deli or store is common practice but not addressed in the risk assessment, this information could be added in the limitations section of the risk assessment.
We limit our assessment to Camembert like cheese. That limitation is now better specified in the report, appendices, model documentation and model. From the database of original data that Gombas et al. (2003) study authors posted on the FoodRisk.org website, we evaluated the impact of the packaging location (at the manufacturer or at the store) on the prevalence and did not find any significant differences (for all soft-ripened cheese: 20 positive cheeses packaged at the manufacturer out of 1993 tested; 17 packaged in store out of 977, p = 0.11 under a simple binomial model, constant probability of contaminated cheese between FoodNet sites). Despite the low number (and thus the low power of the analysis to detect meaningful differences in prevalence) and the fact that it does not fully answer your comment, it is suggested that no data are available to model an additional contamination during the packaging in the store. (One might contrast that result with the result for luncheon meat in that same Gombas et al. (2003)’s data.) Nonetheless, the report text now identifies the points of contamination (Discussion section,
individual sections in the report); provides the means to incorporate future information into
the model; and, points to lack of knowledge, among Section 11’s
Limitations, caveats and data gaps; to make the other points of contamination that the epidemiological and microbiological literature refers to clearer and to make it easier for others to incorporate information that fills this data gap into a future risk assessment.
10
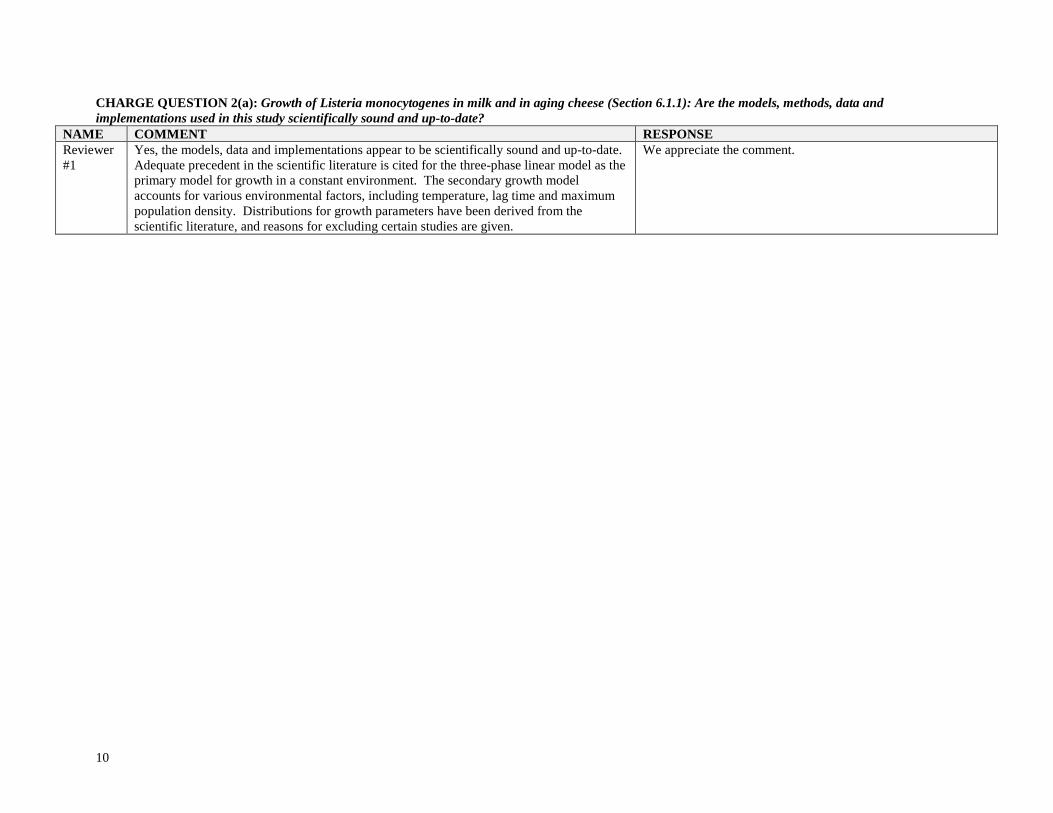
CHARGE QUESTION 2(a): Growth of Listeria monocytogenes in milk and in aging cheese (Section 6.1.1): Are the models, methods, data and implementations used in this study scientifically sound and up-to-date?
NAME COMMENT RESPONSE Reviewer #1
Yes, the models, data and implementations appear to be scientifically sound and up-to-date. Adequate precedent in the scientific literature is cited for the three-phase linear model as the primary model for growth in a constant environment. The secondary growth model accounts for various environmental factors, including temperature, lag time and maximum population density. Distributions for growth parameters have been derived from the scientific literature, and reasons for excluding certain studies are given.
We appreciate the comment.
11
NAME COMMENT RESPONSE Reviewer #2
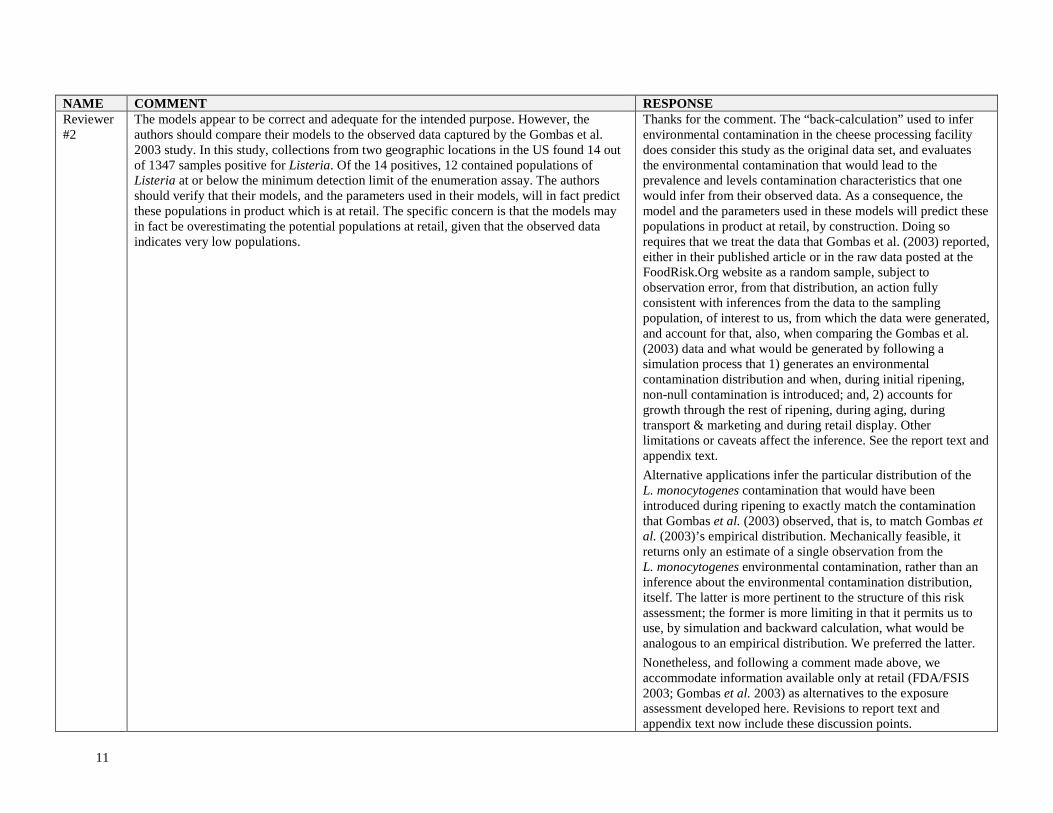
The models appear to be correct and adequate for the intended purpose. However, the authors should compare their models to the observed data captured by the Gombas et al. 2003 study. In this study, collections from two geographic locations in the US found 14 out of 1347 samples positive for Listeria. Of the 14 positives, 12 contained populations of Listeria at or below the minimum detection limit of the enumeration assay. The authors should verify that their models, and the parameters used in their models, will in fact predict these populations in product which is at retail. The specific concern is that the models may in fact be overestimating the potential populations at retail, given that the observed data indicates very low populations.
Thanks for the comment. The “back-calculation” used to infer environmental contamination in the cheese processing facility does consider this study as the original data set, and evaluates the environmental contamination that would lead to the prevalence and levels contamination characteristics that one would infer from their observed data. As a consequence, the model and the parameters used in these models will predict these populations in product at retail, by construction. Doing so requires that we treat the data that Gombas et al. (2003) reported, either in their published article or in the raw data posted at the FoodRisk.Org website as a random sample, subject to observation error, from that distribution, an action fully consistent with inferences from the data to the sampling population, of interest to us, from which the data were generated, and account for that, also, when comparing the Gombas et al. (2003) data and what would be generated by following a simulation process that 1) generates an environmental contamination distribution and when, during initial ripening, non-null contamination is introduced; and, 2) accounts for growth through the rest of ripening, during aging, during transport & marketing and during retail display. Other limitations or caveats affect the inference. See the report text and appendix text. Alternative applications infer the particular distribution of the L. monocytogenes contamination that would have been introduced during ripening to exactly match the contamination that Gombas et al. (2003) observed, that is, to match Gombas et al. (2003)’s empirical distribution. Mechanically feasible, it returns only an estimate of a single observation from the L. monocytogenes environmental contamination, rather than an inference about the environmental contamination distribution, itself. The latter is more pertinent to the structure of this risk assessment; the former is more limiting in that it permits us to use, by simulation and backward calculation, what would be analogous to an empirical distribution. We preferred the latter. Nonetheless, and following a comment made above, we accommodate information available only at retail (FDA/FSIS 2003; Gombas et al. 2003) as alternatives to the exposure assessment developed here. Revisions to report text and appendix text now include these discussion points.
12
NAME COMMENT RESPONSE Reviewer #3
This is the only section where I had the impression that there is plenty of room for improvement. The primary model is the simplest one used in the literature, but this is perfectly adequate for the purpose. Considering the relative lag time as an input parameter is a good idea. However, it remains unnoticed that the K=“lag / doubling time” ratio is practically the same as the product of the lag and the EGR, which is commonly used as the “work to be done” during the lag phase (see for example Robinson et al. Int. J. Food Microbiol. 44 (1998); Mellefont et al, Int.J Food Microbiol. 83 (2003); these two are also cited by the authors; or recently Le Marc et al, Appl.Env.Microbiol 76. (2010)). This is a parameter that quantifies the shock caused by the difference between the history and the current growth environment. Therefore, this K parameter should be considered in the same way as the inoculum size: a random variable depending on the history of the cells.
We specify now that “Kξ is linked to the “work to be done” during the lag phase h0 (Baranyi and Roberts 1994; Robinson et al. 1998; Mellefont et al. 2003), RLT and h0 being proportional to each other (Le Marc et al. 2010)”, which is the manner that the report treats the Kξ. We treat Kξ as a random variable: it varies among the Lm in contaminated cheeses, capturing interaction among cheeses, among Lm strains and among Lm contamination within strains; it has the same domain as Ross and McMeekin (2003) and Ross et al. (2009), for example. A distribution for the RLT, issued from Ross et al. (2009), was used. We specify that more precisely: “In the absence of a generally accepted model [for Kξ ], Ross and McMeekin (2003) suggested the use of a value or a distribution of Kξ taken from the relevant literature; this is what is done here, using a distribution specified from the data as summarized in Ross et al. (2009)” and do make the assumption that the Kξ distribution that Ross et al. (2009) captured captures what we intend for the Lm populations that we intend.
However, the authors’ method leads to a rather unsophisticated treatment of the dynamic scenario when the environment changes with time during the lag time. The stepwise algorithm to solve the problem with the lag in changing environment is equivalent to the simplest discretization algorithm to solve a differential equation (without mentioning the differential equation itself). Though such dynamic scenario automatically lends itself to an ODE model (Ordinary Differential Equation), the solution is not that an ODE-solver should be included in the simulation. Namely, such dynamic scenarios cause the very uncertainty that the authors want to model, so it would be like including a complexity issue twice in the analysis. I think the dynamic scenario should be replaced by a similarly simple approach like the three-phase linear model that the authors prefer for the bacterial growth curve. I am fairly sure that if the temperature increases monotonically (in the growth region!) from A to B, then taking the (A+B)/2 temperature value as a constant will result in a prediction of which the error will be far less than that caused by the variability and uncertainty of the temperature and the inaccuracy of the model anyway. Generally speaking, the random sampling of the Monte-Carlo simulation replaces the complexity of the dynamic scenarios.
Thank you for this comment. We definitively agree that most of the uncertainty (and variability) is in the cheese processing, and that some of the calculation could seem to be too precise compared to the uncertainty in the process. Rather than considering a complex ODE, we use two or three steps.
13
NAME COMMENT RESPONSE Reviewer#4
From the knowledge that I have, it appears the model used to predict growth to LM in milk is accurate, including the assumptions in the primary model, secondary model, growth rate and lag phase. The assumption that the temperature was constant during storage and handling, but changed only as a part of the transition from one step to the next is rational. As noted above, I want to highlight my concerns for further review and study of the references used to develop an EGR model for Camembert appropriate for the risk assessment to determine if the cheese was representative of traditional Camembert or of stabilized Camembert. This information could have a dramatic impact on the development of the EGR, or possibly result in development of separate EGR for each type of Camembert production due to the fact that the pH varies in the cheese during ripening depending on the culturing methods used.
See above. Differences in Lm growth between Camembert cheeses manufactured using classical and stabilized processes accrue from the differences in how far the pH falls and how rapidly it rises during ripening that the reviewer and the reviewer’s references for the processes detail. Those differences are accounted for in revisions to the report and appendices.
CHARGE QUESTION 2(b): Growth of Listeria monocytogenes in cheese during ripening (Section 6.1.2): Are the models, methods, data and implementations used in this study scientifically sound and up-to-date?
NAME COMMENT RESPONSE Reviewer #1
According to the text, more complex models than the simple model used in this risk assessment have been used by others. The reason given for not using one of the complex models is the absence of specific data and distributions on growth in Camembert for certain parameters in those models. For the simple model used, appropriate literature is cited to justify the parameterization.
We appreciate the comment. Revisions done to accommodate other reviewers’ information about differences in manufacturing processes for Camembert cheeses institute slightly more complex, but still simple models.
Reviewer #2
Yes, but the comments from the above section are also relevant to this section. See above
Reviewer #3
This is a relatively minor section, much less elaborated than the previous, but adequate for the purpose. Of course, a more detailed analysis could be added, but I don’t think that it would affect the final results.
We appreciate the comment. Revisions done to accommodate other reviewers’ information about differences in manufacturing processes for Camembert cheeses institute slightly more complex, but still simple models.
14
NAME COMMENT RESPONSE Reviewer#4
The information provided from the literature states that bacterial populations decrease gradually due to the low pH values for up to 12 days of ripening. It also assumes that during the secondary ripening, the growth of bacteria would be 0.8 log (cfu/g) on the exterior and lower growth, 0.5 log (cfu/g), for bacteria present in the interior. This assumption would apply to traditional Camembert, but due to variations in pH during the initial ripening and secondary ripening (aging), more research is need to determine if the growth would be identical for LM in stabilized Camembert. Basic differences in pH for these two types of cheese ripening were described as: “The pH of young stabilized cheese range from 5.4 to 5.5 whereas those of young traditional non-stabilized cheeses of the same type are much lower, i.e. 4.6 to 4.7. Such a higher pH in stabilized Camembert or Brie raises a question as to their ability to control growth of spoilage or food poisoning microorganisms, such as enteropathogenic Escherichia coli. Growth of E. coli is strongly influenced by pH. Rash and Kosikowski have found, for example, that enteropathogenic E. coli organisms die off readily at pH 4.6 to 4.7 but grow well at pH 5.4 to 5.5.2” IDFA is working with one of our commercial Brie and Camembert manufacture members and the University of Wisconsin Center for Dairy Research to obtain more information on the pH growth curves during culturing, ripening and aging of Camembert cheese produced with the use of stabilized culture technology. Due to the proprietary nature of this information, the firm is awaiting approval from its corporate offices. If approved, this information may be available in about 2-3 weeks. However, Dr. Mark Johnson at U. Wisc CDR provided this information about the difference in pH between traditional and stabilized culture technology: “The big difference is the lowest pH attained in each type of cheese. With traditional Brie (mesophilic cultures) the pH is slightly acid at rennet and drain but then the pH drops rapidly to ~4.7-4.8 when the cheese is salted. Upon mold growth the pH at the surface can rapidly go as high as pH 6 but the interior remains low for weeks until ammonia finally leaches in to it. With stabilized Brie the pH is higher at rennet and drain but by using S. thermophilus the pH is controlled (slowed) so that a final pH of 5.1-5.3 is reached. Culture activity is controlled by lowering the temperature. The pH of stabilized Brie at the surface would be pH ~6 after mold growth.” 2 Kosikowski., F.V. and Mistry, V. V., Cheese and Fermented Milk Foods, Vol I: Origins and Principles, Third Edition (1997) p248
Thank you very much for the data and information. See above for the response. Differences in growth between classical and stabilized Camembert cheeses are detailed in the report and in the appendices.
15
CHARGE QUESTION 2(c): In-plant contamination (Section 6.4): The study from Gombas et al. (2003) was used to infer prevalence and level of contamination of soft-ripened cheese in-plant. Is this method scientifically sound with regards to this risk assessment?
NAME COMMENT RESPONSE Reviewer #1
Using the study of Gombas et al. (2003) on the prevalence and contamination of soft-ripened cheeses obtained at retail to infer the in-plant prevalence and contamination appears to be scientifically sound. Literature is cited to justify the approach of reconstructing model inputs using data obtained at another point downstream. The text spells out how distributions for prevalence and level of contamination at retail were derived from the Gombas data, how growth during the aging, marketing and retail steps was modeled, and how Spearman’s rank correlation was used to infer that high retail concentrations occur only when low level contamination (in-plant) is followed by high growth. Both the prevalence and level of contamination in-plant are estimated to be low (point estimates: 1% and 25 cfu, respectively).
We appreciate the comment, which points to a spot in the appendix text that could be clearer. The derivation of an (unknown) distribution of L. monocytogenes environment contamination that would grow to the (inferred) levels from Gombas et al. (2003) data hinges on what assumption one makes for the joint distribution of growth, say G, and the level at retail, say Y, say fY,G(y,g). We chose to simplify the joint distribution’s specification by specifying Y and G’s marginal distributions and setting ρ(Y,G) to 1, among the possible choices, only because it made fewer points in the domain space (D'Amico and Donnelly 2010) inadmissible than any other choice for ρ. A point estimate for the mean of the distribution of prevalences is approximately .01, but 25 cfu is in the upper tail of the contamination distribution. We reviewed and improved the text in the report and the appendix.
Reviewer #2
While there is precedent for using this method, the assumptions which have to be made to infer in-plant contamination rates from a single study such as this almost render it meaningless. I think that the authors may be better served by using a point estimate for in-plant contamination, and then creating a distribution around the estimate. I think this is a simpler approach, and would be no more likely to be inaccurate than the present approach.
We agree that using a single study could be worrying, whether or not we carefully qualify results and list limitations. Nevertheless, Gombas et al. (2003) appears to be the most complete and relevant data. The sensitivity analysis (section 9.2.2) provides some test on the influence of the frequency and level of contamination on the final output, as well as providing the risk managers information about the risk under particular circumstances. Also, we strengthened the text in the section on data gaps for this and other points of non-milk contamination.
16
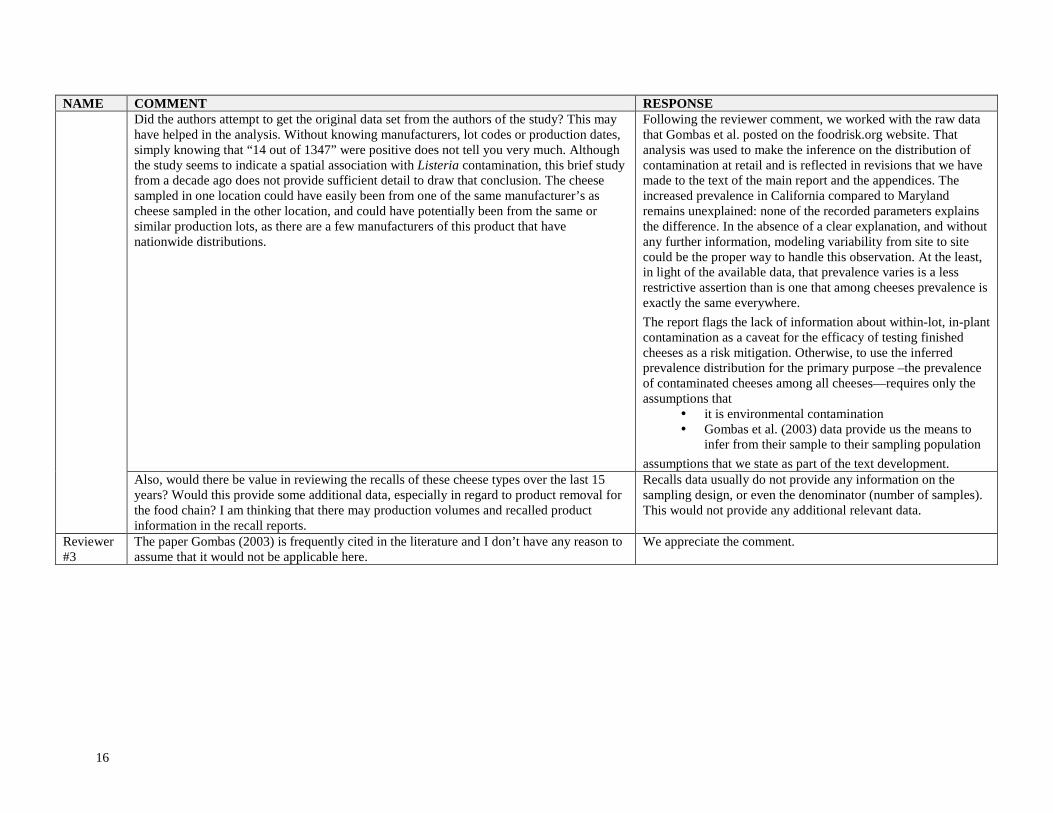
NAME COMMENT RESPONSE Did the authors attempt to get the original data set from the authors of the study? This may have helped in the analysis. Without knowing manufacturers, lot codes or production dates, simply knowing that “14 out of 1347” were positive does not tell you very much. Although the study seems to indicate a spatial association with Listeria contamination, this brief study from a decade ago does not provide sufficient detail to draw that conclusion. The cheese sampled in one location could have easily been from one of the same manufacturer’s as cheese sampled in the other location, and could have potentially been from the same or similar production lots, as there are a few manufacturers of this product that have nationwide distributions.
Following the reviewer comment, we worked with the raw data that Gombas et al. posted on the foodrisk.org website. That analysis was used to make the inference on the distribution of contamination at retail and is reflected in revisions that we have made to the text of the main report and the appendices. The increased prevalence in California compared to Maryland remains unexplained: none of the recorded parameters explains the difference. In the absence of a clear explanation, and without any further information, modeling variability from site to site could be the proper way to handle this observation. At the least, in light of the available data, that prevalence varies is a less restrictive assertion than is one that among cheeses prevalence is exactly the same everywhere. The report flags the lack of information about within-lot, in-plant contamination as a caveat for the efficacy of testing finished cheeses as a risk mitigation. Otherwise, to use the inferred prevalence distribution for the primary purpose –the prevalence of contaminated cheeses among all cheeses—requires only the assumptions that
it is environmental contamination Gombas et al. (2003) data provide us the means to
infer from their sample to their sampling population assumptions that we state as part of the text development.
Also, would there be value in reviewing the recalls of these cheese types over the last 15 years? Would this provide some additional data, especially in regard to product removal for the food chain? I am thinking that there may production volumes and recalled product information in the recall reports.
Recalls data usually do not provide any information on the sampling design, or even the denominator (number of samples). This would not provide any additional relevant data.
Reviewer #3
The paper Gombas (2003) is frequently cited in the literature and I don’t have any reason to assume that it would not be applicable here.
We appreciate the comment.
17
NAME COMMENT RESPONSE Reviewer#4
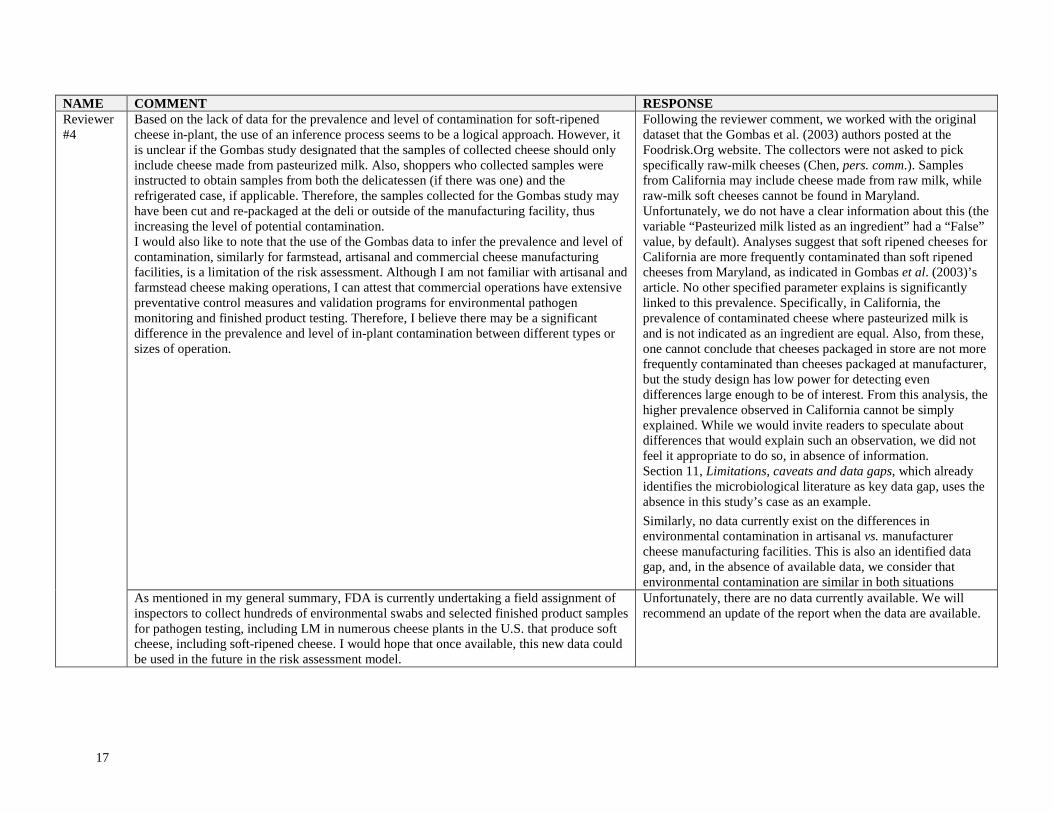
Based on the lack of data for the prevalence and level of contamination for soft-ripened cheese in-plant, the use of an inference process seems to be a logical approach. However, it is unclear if the Gombas study designated that the samples of collected cheese should only include cheese made from pasteurized milk. Also, shoppers who collected samples were instructed to obtain samples from both the delicatessen (if there was one) and the refrigerated case, if applicable. Therefore, the samples collected for the Gombas study may have been cut and re-packaged at the deli or outside of the manufacturing facility, thus increasing the level of potential contamination. I would also like to note that the use of the Gombas data to infer the prevalence and level of contamination, similarly for farmstead, artisanal and commercial cheese manufacturing facilities, is a limitation of the risk assessment. Although I am not familiar with artisanal and farmstead cheese making operations, I can attest that commercial operations have extensive preventative control measures and validation programs for environmental pathogen monitoring and finished product testing. Therefore, I believe there may be a significant difference in the prevalence and level of in-plant contamination between different types or sizes of operation.
Following the reviewer comment, we worked with the original dataset that the Gombas et al. (2003) authors posted at the Foodrisk.Org website. The collectors were not asked to pick specifically raw-milk cheeses (Chen, pers. comm.). Samples from California may include cheese made from raw milk, while raw-milk soft cheeses cannot be found in Maryland. Unfortunately, we do not have a clear information about this (the variable “Pasteurized milk listed as an ingredient” had a “False” value, by default). Analyses suggest that soft ripened cheeses for California are more frequently contaminated than soft ripened cheeses from Maryland, as indicated in Gombas et al. (2003)’s article. No other specified parameter explains is significantly linked to this prevalence. Specifically, in California, the prevalence of contaminated cheese where pasteurized milk is and is not indicated as an ingredient are equal. Also, from these, one cannot conclude that cheeses packaged in store are not more frequently contaminated than cheeses packaged at manufacturer, but the study design has low power for detecting even differences large enough to be of interest. From this analysis, the higher prevalence observed in California cannot be simply explained. While we would invite readers to speculate about differences that would explain such an observation, we did not feel it appropriate to do so, in absence of information. Section 11, Limitations, caveats and data gaps, which already identifies the microbiological literature as key data gap, uses the absence in this study’s case as an example. Similarly, no data currently exist on the differences in environmental contamination in artisanal vs. manufacturer cheese manufacturing facilities. This is also an identified data gap, and, in the absence of available data, we consider that environmental contamination are similar in both situations
As mentioned in my general summary, FDA is currently undertaking a field assignment of inspectors to collect hundreds of environmental swabs and selected finished product samples for pathogen testing, including LM in numerous cheese plants in the U.S. that produce soft cheese, including soft-ripened cheese. I would hope that once available, this new data could be used in the future in the risk assessment model.
Unfortunately, there are no data currently available. We will recommend an update of the report when the data are available.
18
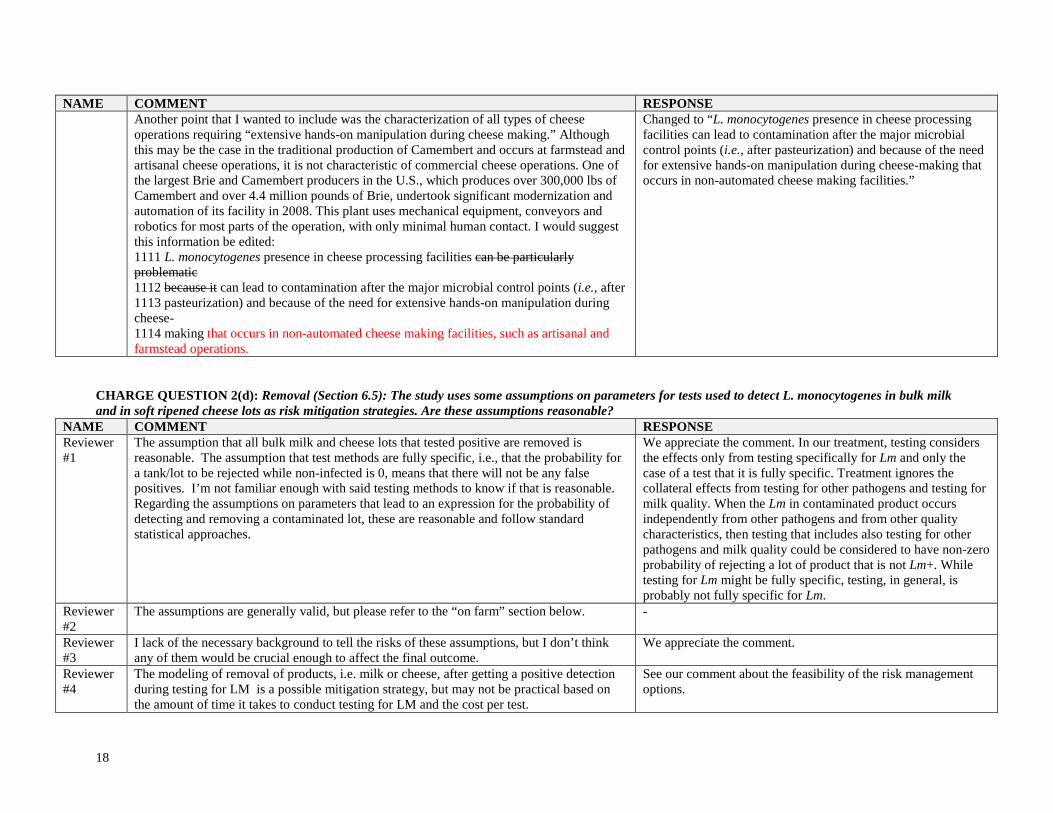
NAME COMMENT RESPONSE Another point that I wanted to include was the characterization of all types of cheese operations requiring “extensive hands-on manipulation during cheese making.” Although this may be the case in the traditional production of Camembert and occurs at farmstead and artisanal cheese operations, it is not characteristic of commercial cheese operations. One of the largest Brie and Camembert producers in the U.S., which produces over 300,000 lbs of Camembert and over 4.4 million pounds of Brie, undertook significant modernization and automation of its facility in 2008. This plant uses mechanical equipment, conveyors and robotics for most parts of the operation, with only minimal human contact. I would suggest this information be edited: 1111 L. monocytogenes presence in cheese processing facilities can be particularly problematic 1112 because it can lead to contamination after the major microbial control points (i.e., after 1113 pasteurization) and because of the need for extensive hands-on manipulation during cheese- 1114 making that occurs in non-automated cheese making facilities, such as artisanal and farmstead operations.
Changed to “L. monocytogenes presence in cheese processing facilities can lead to contamination after the major microbial control points (i.e., after pasteurization) and because of the need for extensive hands-on manipulation during cheese-making that occurs in non-automated cheese making facilities.”
CHARGE QUESTION 2(d): Removal (Section 6.5): The study uses some assumptions on parameters for tests used to detect L. monocytogenes in bulk milk and in soft ripened cheese lots as risk mitigation strategies. Are these assumptions reasonable?
NAME COMMENT RESPONSE Reviewer #1
The assumption that all bulk milk and cheese lots that tested positive are removed is reasonable. The assumption that test methods are fully specific, i.e., that the probability for a tank/lot to be rejected while non-infected is 0, means that there will not be any false positives. I’m not familiar enough with said testing methods to know if that is reasonable. Regarding the assumptions on parameters that lead to an expression for the probability of detecting and removing a contaminated lot, these are reasonable and follow standard statistical approaches.
We appreciate the comment. In our treatment, testing considers the effects only from testing specifically for Lm and only the case of a test that it is fully specific. Treatment ignores the collateral effects from testing for other pathogens and testing for milk quality. When the Lm in contaminated product occurs independently from other pathogens and from other quality characteristics, then testing that includes also testing for other pathogens and milk quality could be considered to have non-zero probability of rejecting a lot of product that is not Lm+. While testing for Lm might be fully specific, testing, in general, is probably not fully specific for Lm.
Reviewer #2
The assumptions are generally valid, but please refer to the “on farm” section below. -
Reviewer #3
I lack of the necessary background to tell the risks of these assumptions, but I don’t think any of them would be crucial enough to affect the final outcome.
We appreciate the comment.
Reviewer#4
The modeling of removal of products, i.e. milk or cheese, after getting a positive detection during testing for LM is a possible mitigation strategy, but may not be practical based on the amount of time it takes to conduct testing for LM and the cost per test.
See our comment about the feasibility of the risk management options.
19
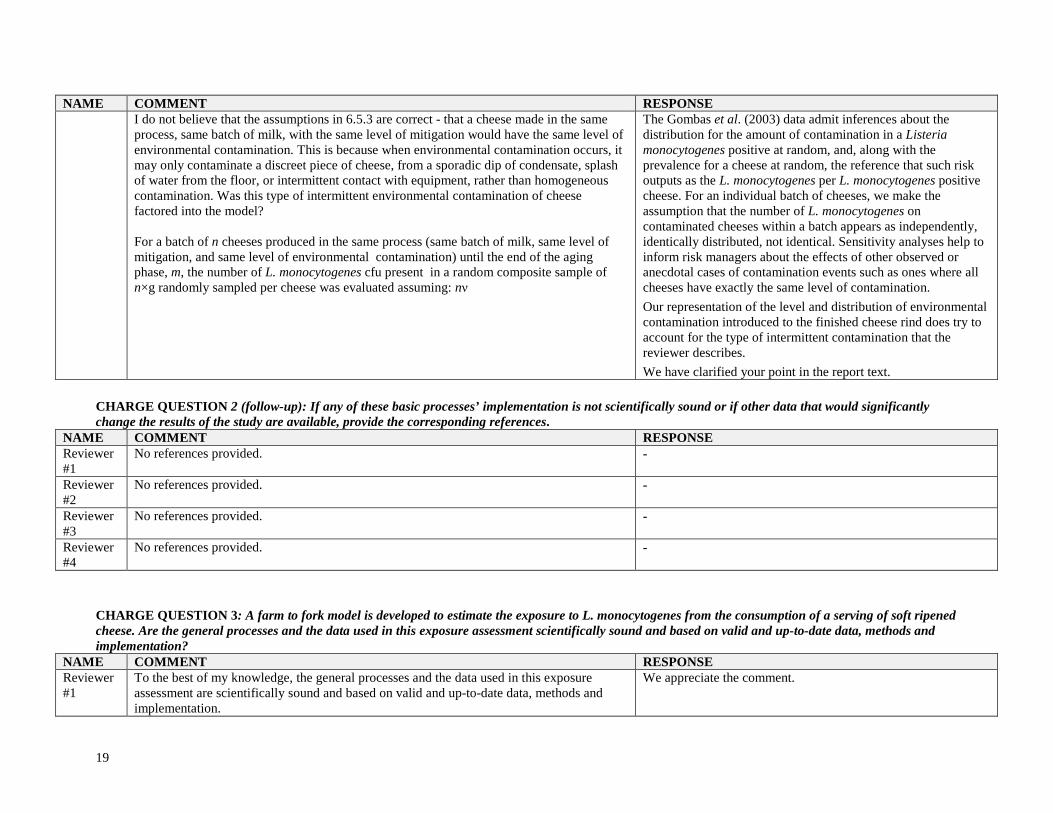
NAME COMMENT RESPONSE I do not believe that the assumptions in 6.5.3 are correct - that a cheese made in the same process, same batch of milk, with the same level of mitigation would have the same level of environmental contamination. This is because when environmental contamination occurs, it may only contaminate a discreet piece of cheese, from a sporadic dip of condensate, splash of water from the floor, or intermittent contact with equipment, rather than homogeneous contamination. Was this type of intermittent environmental contamination of cheese factored into the model? For a batch of n cheeses produced in the same process (same batch of milk, same level of mitigation, and same level of environmental contamination) until the end of the aging phase, m, the number of L. monocytogenes cfu present in a random composite sample of n×g randomly sampled per cheese was evaluated assuming: nν
The Gombas et al. (2003) data admit inferences about the distribution for the amount of contamination in a Listeria monocytogenes positive at random, and, along with the prevalence for a cheese at random, the reference that such risk outputs as the L. monocytogenes per L. monocytogenes positive cheese. For an individual batch of cheeses, we make the assumption that the number of L. monocytogenes on contaminated cheeses within a batch appears as independently, identically distributed, not identical. Sensitivity analyses help to inform risk managers about the effects of other observed or anecdotal cases of contamination events such as ones where all cheeses have exactly the same level of contamination. Our representation of the level and distribution of environmental contamination introduced to the finished cheese rind does try to account for the type of intermittent contamination that the reviewer describes. We have clarified your point in the report text.
CHARGE QUESTION 2 (follow-up): If any of these basic processes’ implementation is not scientifically sound or if other data that would significantly change the results of the study are available, provide the corresponding references.
NAME COMMENT RESPONSE Reviewer #1
No references provided. -
Reviewer #2
No references provided. -
Reviewer #3
No references provided. -
Reviewer#4
No references provided. -
CHARGE QUESTION 3: A farm to fork model is developed to estimate the exposure to L. monocytogenes from the consumption of a serving of soft ripened cheese. Are the general processes and the data used in this exposure assessment scientifically sound and based on valid and up-to-date data, methods and implementation?
NAME COMMENT RESPONSE Reviewer #1
To the best of my knowledge, the general processes and the data used in this exposure assessment are scientifically sound and based on valid and up-to-date data, methods and implementation.
We appreciate the comment.
20
NAME COMMENT RESPONSE Reviewer #2
Generally, yes, the processes and data are valid. Please see specific comments. We appreciate the comment.
Reviewer #3
This is a scenario analysis that is not my expertise, but the authors do use a lot of recent literature data, and the methodology to build them in mathematical models is reasonable. This comment refers to all the points below.
We appreciate the comment.
Reviewer#4
Overall, the figure above is accurate with one exception. For commercial cheese operations, multiple tanker trucks of milk are co-mingled into a dairy silo. So the additional white block of tanker truck 2 should be added along with the point “- number of tanker trucks per dairy silo.” Also, partial amounts of multiple dairy silos may be used to make a vat of cheese.
We used the on farm module only to model the prevalence and concentration in the bulk milk used to manufacture non-pasteurized milk cheese; the pasteurized milk cheese baseline that the risk assessment includes points to “full pasteurization” under which pasteurization would kill all bacteria. Non-pasteurized milk cheese applies only to farmstead and artisanal cheese manufacturing, and, including the milk from only one or only two farms, does not mix milk from more than 1 tanker truck or from more from 1 dairy silo. Indeed, it does not seem that any “commercial cheese operations” make non-pasteurized milk cheese in US or Canada. Nonetheless, including the reviewer’s points completes a representation of the farm to dairy silo process that is broader than the one that this risk assessment needed. Report text and appendix text liken this to additional mixing (milk from many tanker trucks) and additional partitioning (some milk from many silos) processes, that, when implemented in a case that needs it, requires specification of the number of farms per collection (into tankers) and the number of tanker loads per silo. The limited scope that the fully pasteurized milk cheese baseline institutes saved us from a search for information to correctly parameterize the full process and let us, rather, point to a situation where the value of additional information, in context, was nil. Other researchers might exploit the structure that complete specification of the process affords for other work.
21
CHARGE QUESTION 3(a): Provide specific details for the “on farm” stage (Section 7.1). NAME COMMENT RESPONSE Reviewer #1
The “on farm” stage uses a model previously used by others, which includes infected quarters within cows, infected cows within farms, and infected farms within tanker trucks, to synthesize dairy silo L. monocytogenes prevalence and concentration distributions. Appropriate literature citations are given. Prevalence estimates are reported separately for farmstead and artisanal-scale operations. An explanation is given for why the estimated distribution of concentration is bi-modal.
We appreciate the comment. Other comments also prompted revisions to report and appendix text to explain why deriving distributions for the L. monocytogenes positive prevalence and L. monocytogenes concentration in L. monocytogenes positive milk from multiple bulk tanks into multiple silos is only an exercise whose result might benefit others’ work: meeting the management charge does not need the methodology.
Reviewer #2
The authors spend a considerable amount of effort modeling the potential impact of Listeria mastitis, both sub-clinical and clinical, on the presence and populations of Listeria in raw milk. I simply do not believe that this is warranted, for two reasons. First, mastitis caused by Listeria in cattle is, by any description, a rare event. The scientific data is sketchy, and when you consider publication bias (i.e., negative studies are neither submitted for publication as frequently as positive studies, nor are they accepted if they are submitted), the inclusion of the long section and modeling of mastitis simply does not appear to be justified. The second, more pragmatic reason is that the authors already have a method for estimating contamination of bulk tanks on dairy farms. Given that the bulk milk tank will be either positive or negative, and if positive at some population per ml, the inclusion of the extraordinarily rare mastitis issue seems unnecessary.
Including the effect of Listeria mastitis reflects the microbiological literature and lets risk managers evaluate the effect of managing this source or not managing it. Even if rare, this event could be of major importance for the occurrence of high levels of contamination. Precedent risk assessments, for example, either explicitly accounted for the phenomenon (Steele et al. 1997; Bemrah et al. 1998; Sanaa et al. 2004) or explicitly assumed its control (Meyer-Broseta et al. 2003). The large-scale farm bulk tank milk surveys in the microbiological and animal husbandry literature do not separate this phenomenon’s occurrence from the occurrence of other farm environmental contamination sources in L. monocytogenes positive bulk milk and information to evaluate whether the sparse enumeration data have accounted for all sources of Lm contamination or only L. monocytogenes -environmental sources, are lacking. We have added a sensitivity analysis to the presence of mastitis to check whether or not these exceptional events have a clear impact on the mean risk of listeriosis to better inform our risk managers.
22
NAME COMMENT RESPONSE If the authors intend to retain the mastitis model, they should also evaluate their growth models in relation to the temperature differentials, which arise during milking. Milk at the approximate body temperature of a cow is cooled to below 10C in a short period of time, which means that the generation time of the bacterium will lengthen considerably. Modelling growth under rapidly declining temperatures is problematic, and it is difficult to capture the actual growth in a mathematical model.
We assumed here an absence of lag when the L. monocytogenes in milk was issued from a mastitic cow and a lag when the L. monocytogenes in milk is issued from the environment, expecting that the mastitis-source bacteria are adapted to milk and that, while no growth occurs while milk cools from body temperature to bulk tank temperature, mastitis-source milk-adapted bacteria would always begin to grow without further lag, when conditions permit, at bulk tank temperatures. Following your recommendation and Albert et al. (2005), we consider lags before growth for Lm from both on-farm contamination sources and account for time cooling to farm tank temperature, contaminating cells’ physiological state and farm tank temperatures. Model, report text and appendix text are modified accordingly.
In regards to the data, the authors cite table 15, line 1040-1042 in the Appendix for milk production. While this may be the best available data from Canada, I believe that the NASS has more accurate estimates for the US. Also, an aggregate figure for total milk production is probably a better estimate, unless there is a compelling reason to suggest that the milk from one breed of dairy cow is used disproportionately in the manufacture of soft ripened cheeses. Did the authors contact any of the trade associations or regional dairy research program to determine if this was in fact the case?
Thanks for the suggestion. We incorporated data from the USDA Animal Improvement Programs Laboratory (AIPL) to reflect country-specific production differences from what are the best available data for Canada and modified the model, report text and appendix text. While there is anecdotal information about commercial and specialty cheese manufacture from a particular breed’s cows’ milk, no information definitively indicates an overall preference. Nonetheless, alternative capabilities, no factor of which contributes very strongly to descriptions about how milk prevalence and contaminated milk’s Lm levels, relative to the factors already accounted for, are incorporated into the model, are documented and would be available for use, were additional information to become available.
Reviewer #3
See above response. -
23
NAME COMMENT RESPONSE Reviewer#4
This section states that few studies have surveyed dairy silos directly and provides very limited information to describe the LM prevalence and levels as an input. I am aware that FDA presented at the 2010 International Association of Food Protection (IAFP) findings of a nationwide survey that was conducted to determine initial microbial quality and levels of Listeria monocytogenes (LM) and Bacillus cereus in raw silo milk intended for pasteurization. The abstract stated: Listeria species were detected in 88 of 155 samples (56.77%) at an average level of 0.5736 MPN/ml and LM was detected in 76 of 158 samples (54.29%) at an average level of 0.4276 MPN/ml. No correlation was observed between the general microbial quality and prevalence of Listeria spp. and LM. Although the prevalence rates observed were higher than those reported in the literature, the levels detected were low. The higher prevalence may be due to the use of sensitive techniques and samples from commingled silos, which contain milk, and, therefore, contaminants from multiple bulk tanks. (I will attach the abstract). As this data is new, it may not have been available at the time of writing, but should be considered as an additional reference.
While that study considers prevalence and contamination levels, it does not consider farm tank samples, but rather silo raw milk intended for pasteurization (as evidenced by the very high prevalence and very low level of contamination). Fernandez-Garayzabal et al. (1987), Davidson et al. (1989) and Steele et al. (1997) observed or synthesized the same phenomenon: bulk (tanker truck, dairy silo) milk commingled from several (independent or related) sources (farms) have higher prevalence than does bulk milk from individual farm bulk tanks measured individually and that concentration in individual tank Lm+ bulk milk is different from that in commingled milk that is Lm+. The methodology used in this model reproduces the level of prevalence and level of contamination that that abstract reports if 20-30 herds’ milk were collected into a dairy silo (results not shown in the report).
CHARGE QUESTION 3(b): Provide specific details for the “cheese processing” stage (cheese making, ripening, …)(Section 7.2).
NAME COMMENT RESPONSE Reviewer #1
The “cheese processing” stage uses a model comprised of four steps: mitigation, cheese formation, ripening and aging. Some steps include sub-steps, such as inactivation, partitioning, growth, contamination and removal. Assumptions, distributions and parameterizations are derived from up-to-date scientific literature, are clearly explained, and are scientifically sound.
We appreciate the comment.
24
NAME COMMENT RESPONSE Reviewer #2
The authors make an assumption that “full” pasteurization would result in no survival of Listeria in the pasteurized milk (Full Report, Lines 2050-2052). There is some degree of process failure associated with every process, no matter how small this may be.
Thanks for the comment. If one were to apply the D-values that researchers attribute to pasteurization processes (Doyle et al. 2001) or a meta-analysis of those D-values, the accepted definitions of and parameters for pasteurization in Canadian and United States regulations and application of pasteurization (http://www.idfa.org/news--views/media-kits/milk/pasteurization-/, thermic processes higher than the norms) to the low-levels of L. monocytogenes contamination in diluted dairy silo milk, then the resulting distribution of L. monocytogenes contamination in contaminated cheeses made from milk after pasteurization is concentrated at smaller values than that L. monocytogenes contamination deemed to come from environmental contamination after cheeses are formed. The microbiological and epidemiological literature documents the consequences of failures of the pasteurization process (Fleming et al. 1985; CDC 2008), but there are no relevant data that document pasteurization failures’ occurrence frequency and extent. The report sets the risk from fully pasteurized milk cheeses as a baseline against which to measure all other cases, rather than as an assumption. We acknowledge that the report might more carefully restate so, to ensure that that case is well established and we distinguished, and that the term adopted for this report, full pasteurization, is not a regulatory term, to prevent confusion and to address the reviewer’s comment. We added, for example, “In the absence of relevant data, process failures were not considered in this report” to discussion of pasteurization as a mitigation (section 7.2.1) and carefully made text refer to full pasteurization where it referred to the baseline case.
25
NAME COMMENT RESPONSE In the “Removal” section, lines 2057-2063: The authors discuss removal in this section, and cheese testing in the Appendix. However it is unclear how many batches of this type of cheese are tested. Is Listeria commonly tested for during or after manufacture during normal industry practice? If so, at what stage (pre- or post- ripening)? Did the authors attempt to determine standard industry practices?
The text in section Testing bulk milk and cheese lots surrounding Table 58-59 set 100% testing and 100% removal of detected Lm+ units as a baseline and results strike differences between that nominal efficacy and what lesser gains would accrue under lesser levels of practice. The tests are done at the end of the ripening time at the manufacturer level, when it is the most efficient (equal or more bacteria than pre-ripening). We reviewed the text and clarified. We do not discuss the feasibility as it is out of the scope of this risk assessment. At the time of writing, neither country had regulatory requirements for testing bulk milk or cheese lots for Lm.
Also, the “aging” data for pasteurized milk cheese are based on an industry study, which reports the results of two manufacturers. Without more details of the study, it is difficult to know if this is typical of the industry, or if the two respondents represented a specific manufacturing class within the industry.
Unfortunately, we do not have additional data from this expert elicitation for industry practices. Actually, the two aging time practices provided by the industries are radically different (7-21 days for one factory and 3-5 days for the other). In France, cheeses are distributed so that consumers will have it after 21, 28 or 35 days, from beginning of manufacture, depending on individual taste, corresponding to an aging period of approximately 8, 15 or 22 days after initial ripening and packaging.
Reviewer #3
See above response.
26
NAME COMMENT RESPONSE Reviewer#4
As mentioned in my previous comments, section 7.2 makes the assumption that no contamination or redistribution of bacteria happens during packaging. This is true for a Camembert cheese that is 8 ounces and packaged as a single piece of cheese. However, some commercial plants produce 3 kg large wheels of Brie that are partitioned either before packaging at the factory, at a secondary location, or at the retail store for the cheese deli case. The risk assessment should consider the point that a limitation of the study was that cheese may be portioned before packaging, but this practice was not included in this risk assessment.
We added to the discussion in section 11, Limitations, caveats and data gaps to acknowledge other points of contamination and other practices that this risk assessment does not address due to lack of information from the microbiological literature or due to limitations on the scope of the risk assessment. To our knowledge, the Camembert cheeses sold in Canada and in the United States are packaged at the manufacturer and not portioned and repackaged at retail. The reviewer points to Brie cheese, though, as an example of a soft ripened cheese that is sometimes (often) larger at manufacturer and then cut into portions before final sale. Whence, we agree that the choice of scope limits the type of study referred to. In fact, though, the model’s structure permits studying contamination introduced at different points –retail repackaging, for example—but was not exploited for the types of cheeses considered for this report. We have made that and other points of contamination more apparent in the report text and model documentation. See responses to comments above.
Section 7.2.1 - Mitigation - Inactivation does not clearly describe the requirement time and temperature for “full pasteurization.” I would suggest more detail be provided for this bullet point.
We added: The terms "pasteurization" mean the process of heating every particle of milk or milk product, in properly designed and operated equipment, to one of the time-temperature couples provided by FDA (FDA 2009, p. 82) to clarify the mitigation that pasteurization effects.
Section 7.2.2 - The model assumed 10,000 liters for a raw silo of milk. Typically, commercial milk silos hold 30,000 gallons (113,562.3 Liters) of milk. However, the size can vary from 25,000 – 150,000 liters. Therefore using a 10,000 liter is not representative of commercial operations. A typical milk tanker holds 6,000 gallons, while some are smaller at 3,000 gallons. Adjustments in the risk model should be considered for typical size tankers and silos, which would change the amount of possible dilution from LM contamination in a single farm or truck.
Thank you for the information. For the pasteurized milk cheese baseline that the project requires from the large volumes of commingled milk used in large commercial pasteurized milk cheese making operations, accounting for the volume of the milk is methodologically unnecessary when the baseline is set to represent full pasteurization of the raw milk. The report text and appendix text have been revised to note that large scale commercial operations making pasteurized milk cheeses use milk that mixes milk from several tank trucks’ several collected farms’ milk into large volume dairy silos. Additional adjustments to the structure of the risk model have been made to permit this unused feature.
27
NAME COMMENT RESPONSE Section 7.2.3 - As previously mentioned, I would urge evaluation of this section based on information provided in 6.1, which described differences in pH for commercial Camembert produced using stabilized culture technology that could impact the information in the partitioning between interior and exterior growth of LM during ripening.
We agree. See above.
The section on environmental contamination assumes a constant fixed ripening period of 12 days. However, commercial operations report that the time from the pasteurization of milk (for cheese making) until packaging of the cheese is typically 7- 10 days (IDFA provided to FDA is attached in a separate file).
We will change the duration of the ripening process accordingly, as part of more extensive changes that capture the reviewer’s comments on differences between processes to manufacture Camembert cheeses.
In the section covering temperature during the aging period at the plant – line 2149, IDFA provided data in 2008 about two commercial cheese manufacturing operations. The data listed on line 2149 is not accurate, as the second plant reported 40°F for the minimum, maximum and most likely temperature. I agree that 37, 40 and 38 seem more realistic, and therefore appropriate, but wanted to point out what the IDFA data reported. I can verify this with the plant if needed.
Actually, the data originated from an IFDA and a CFSAN expert elicitation. We changed the citations in (CFSAN 2008; IDFA 2008).
CHARGE QUESTION 3(c): Provide specific details for the “transport and marketing” and the “Retail” stage (Section 7.3).
NAME COMMENT RESPONSE Reviewer #1
The “transport and marketing” and “retail” stages involve only growth. Time (duration) and temperature distributions for the transport and marketing stage, and the time-at-retail distribution are based on expert elicitation. The temperature distribution for the retail step is based on published data gathered on semi-solid cottage cheese by trained shoppers, and is adjusted for the design effect of the study. The approach appears to be scientifically valid, and as up-to-date as possible for the limited data available.
We appreciate the comment.
Reviewer #2
The authors indicate transport and marketing as potential growth areas, based on the data of Rsyer and Marth, and Back et al., as well as others. I am having some difficulty resolving this “growth” with the observed results of Gombas et al. I think the authors need to reconsider the growth models in terms of the observed results, to see if the models actual produce the observed results. I think the concern is that there may be other factors, which may or may not have been accounted for.
By construction, the model does produce the results from the Gombas et al. (2003) study.
Temperature of transport, line 2174 in the full report: This certainly seems to be a cumbersome approach to this equation. Is there a reason that the equation could not simply be: Ttm ~ (triangular(1.7, 4.4, 10.0))?
Thanks. This equation was written like this to outline the temperature in Fahrenheit, as provided by the CFSAN expert elicitation. Both equations are equivalent. We simplified the statement in the text accordingly.
Reviewer #3
See above response.
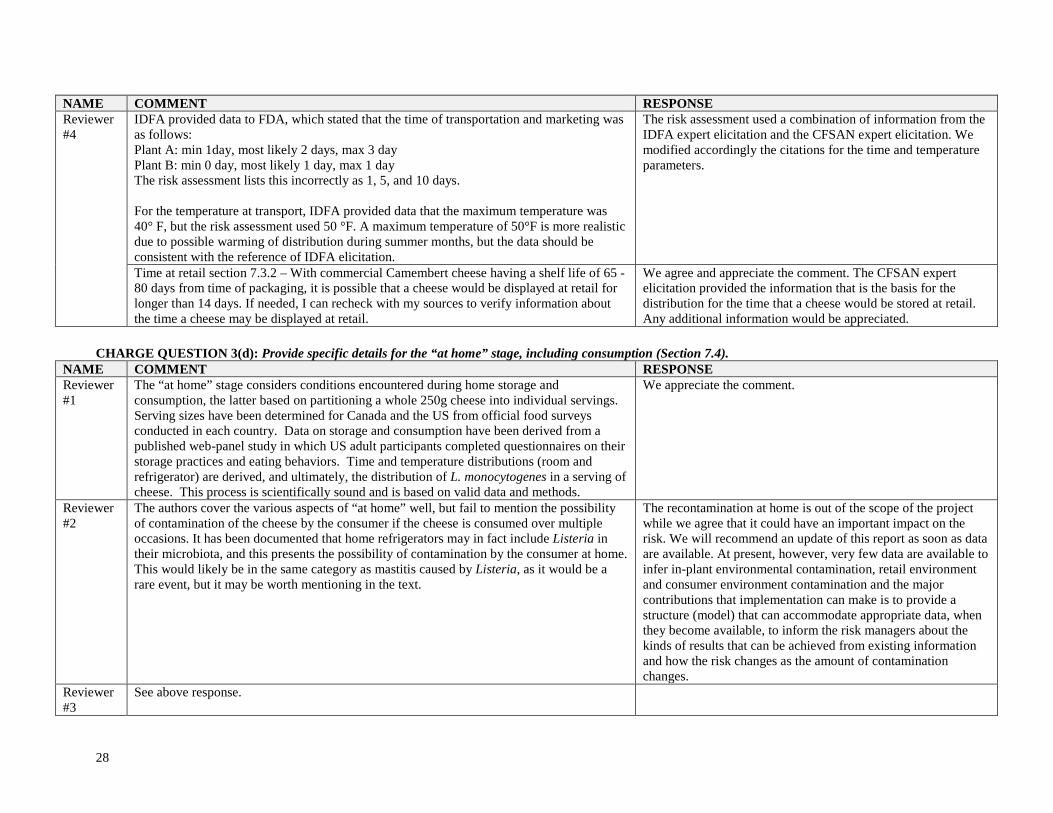
28
NAME COMMENT RESPONSE Reviewer#4
IDFA provided data to FDA, which stated that the time of transportation and marketing was as follows: Plant A: min 1day, most likely 2 days, max 3 day Plant B: min 0 day, most likely 1 day, max 1 day The risk assessment lists this incorrectly as 1, 5, and 10 days. For the temperature at transport, IDFA provided data that the maximum temperature was 40° F, but the risk assessment used 50 °F. A maximum temperature of 50°F is more realistic due to possible warming of distribution during summer months, but the data should be consistent with the reference of IDFA elicitation.
The risk assessment used a combination of information from the IDFA expert elicitation and the CFSAN expert elicitation. We modified accordingly the citations for the time and temperature parameters.
Time at retail section 7.3.2 – With commercial Camembert cheese having a shelf life of 65 - 80 days from time of packaging, it is possible that a cheese would be displayed at retail for longer than 14 days. If needed, I can recheck with my sources to verify information about the time a cheese may be displayed at retail.
We agree and appreciate the comment. The CFSAN expert elicitation provided the information that is the basis for the distribution for the time that a cheese would be stored at retail. Any additional information would be appreciated.
CHARGE QUESTION 3(d): Provide specific details for the “at home” stage, including consumption (Section 7.4).
NAME COMMENT RESPONSE Reviewer #1
The “at home” stage considers conditions encountered during home storage and consumption, the latter based on partitioning a whole 250g cheese into individual servings. Serving sizes have been determined for Canada and the US from official food surveys conducted in each country. Data on storage and consumption have been derived from a published web-panel study in which US adult participants completed questionnaires on their storage practices and eating behaviors. Time and temperature distributions (room and refrigerator) are derived, and ultimately, the distribution of L. monocytogenes in a serving of cheese. This process is scientifically sound and is based on valid data and methods.
We appreciate the comment.
Reviewer #2
The authors cover the various aspects of “at home” well, but fail to mention the possibility of contamination of the cheese by the consumer if the cheese is consumed over multiple occasions. It has been documented that home refrigerators may in fact include Listeria in their microbiota, and this presents the possibility of contamination by the consumer at home. This would likely be in the same category as mastitis caused by Listeria, as it would be a rare event, but it may be worth mentioning in the text.
The recontamination at home is out of the scope of the project while we agree that it could have an important impact on the risk. We will recommend an update of this report as soon as data are available. At present, however, very few data are available to infer in-plant environmental contamination, retail environment and consumer environment contamination and the major contributions that implementation can make is to provide a structure (model) that can accommodate appropriate data, when they become available, to inform the risk managers about the kinds of results that can be achieved from existing information and how the risk changes as the amount of contamination changes.
Reviewer #3
See above response.
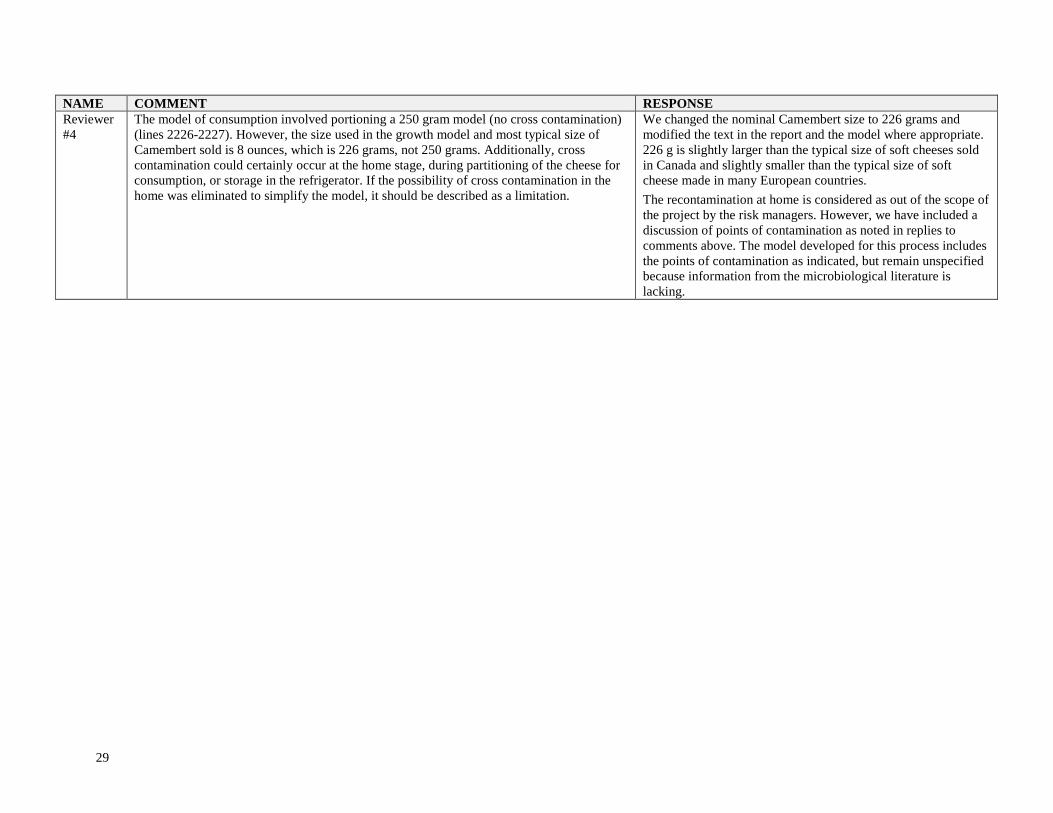
29
NAME COMMENT RESPONSE Reviewer#4
The model of consumption involved portioning a 250 gram model (no cross contamination) (lines 2226-2227). However, the size used in the growth model and most typical size of Camembert sold is 8 ounces, which is 226 grams, not 250 grams. Additionally, cross contamination could certainly occur at the home stage, during partitioning of the cheese for consumption, or storage in the refrigerator. If the possibility of cross contamination in the home was eliminated to simplify the model, it should be described as a limitation.
We changed the nominal Camembert size to 226 grams and modified the text in the report and the model where appropriate. 226 g is slightly larger than the typical size of soft cheeses sold in Canada and slightly smaller than the typical size of soft cheese made in many European countries. The recontamination at home is considered as out of the scope of the project by the risk managers. However, we have included a discussion of points of contamination as noted in replies to comments above. The model developed for this process includes the points of contamination as indicated, but remain unspecified because information from the microbiological literature is lacking.
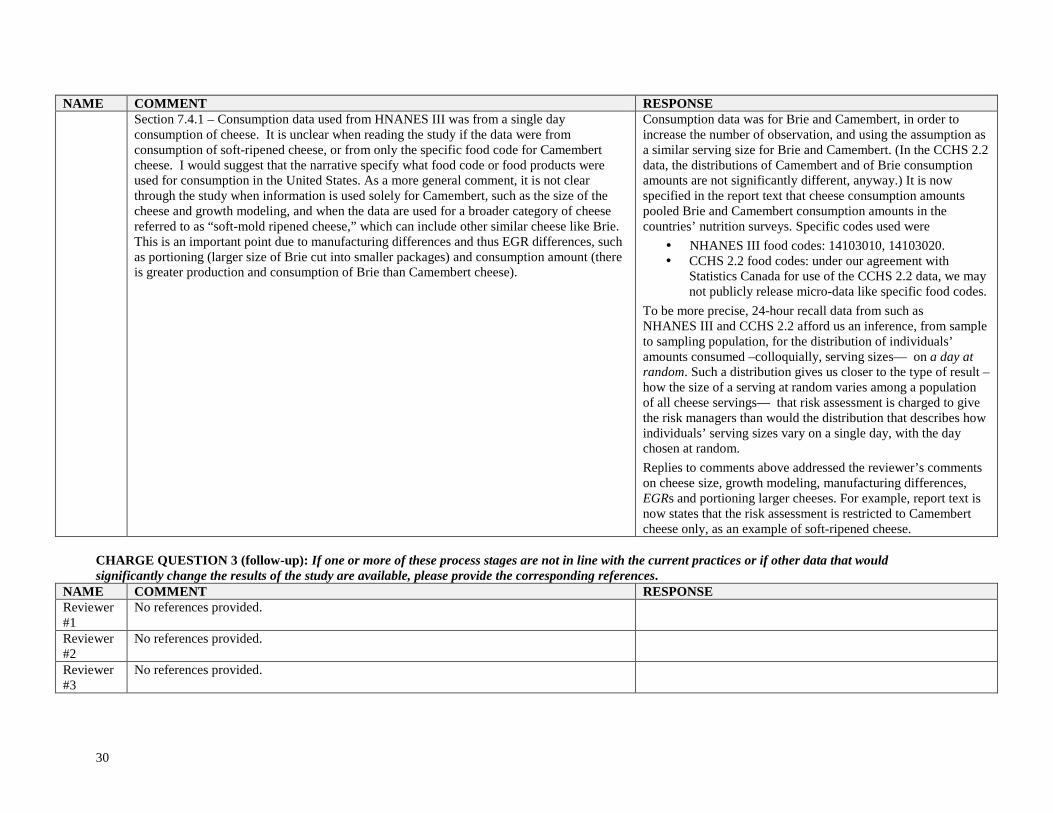
30
NAME COMMENT RESPONSE Section 7.4.1 – Consumption data used from HNANES III was from a single day consumption of cheese. It is unclear when reading the study if the data were from consumption of soft-ripened cheese, or from only the specific food code for Camembert cheese. I would suggest that the narrative specify what food code or food products were used for consumption in the United States. As a more general comment, it is not clear through the study when information is used solely for Camembert, such as the size of the cheese and growth modeling, and when the data are used for a broader category of cheese referred to as “soft-mold ripened cheese,” which can include other similar cheese like Brie. This is an important point due to manufacturing differences and thus EGR differences, such as portioning (larger size of Brie cut into smaller packages) and consumption amount (there is greater production and consumption of Brie than Camembert cheese).
Consumption data was for Brie and Camembert, in order to increase the number of observation, and using the assumption as a similar serving size for Brie and Camembert. (In the CCHS 2.2 data, the distributions of Camembert and of Brie consumption amounts are not significantly different, anyway.) It is now specified in the report text that cheese consumption amounts pooled Brie and Camembert consumption amounts in the countries’ nutrition surveys. Specific codes used were NHANES III food codes: 14103010, 14103020. CCHS 2.2 food codes: under our agreement with
Statistics Canada for use of the CCHS 2.2 data, we may not publicly release micro-data like specific food codes.
To be more precise, 24-hour recall data from such as NHANES III and CCHS 2.2 afford us an inference, from sample to sampling population, for the distribution of individuals’ amounts consumed –colloquially, serving sizes— on a day at random. Such a distribution gives us closer to the type of result –how the size of a serving at random varies among a population of all cheese servings— that risk assessment is charged to give the risk managers than would the distribution that describes how individuals’ serving sizes vary on a single day, with the day chosen at random. Replies to comments above addressed the reviewer’s comments on cheese size, growth modeling, manufacturing differences, EGRs and portioning larger cheeses. For example, report text is now states that the risk assessment is restricted to Camembert cheese only, as an example of soft-ripened cheese.
CHARGE QUESTION 3 (follow-up): If one or more of these process stages are not in line with the current practices or if other data that would significantly change the results of the study are available, please provide the corresponding references.
NAME COMMENT RESPONSE Reviewer #1
No references provided.
Reviewer #2
No references provided.
Reviewer #3
No references provided.
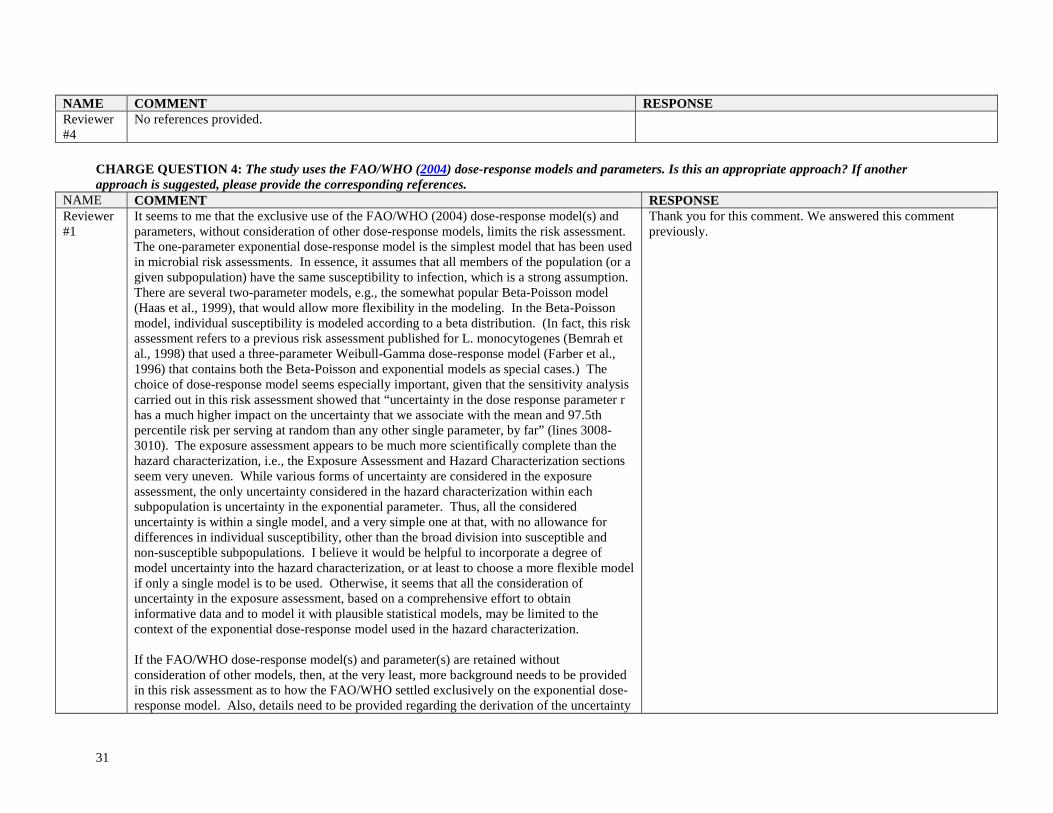
31
NAME COMMENT RESPONSE Reviewer#4
No references provided.
CHARGE QUESTION 4: The study uses the FAO/WHO (2004) dose-response models and parameters. Is this an appropriate approach? If another approach is suggested, please provide the corresponding references.
NAME COMMENT RESPONSE Reviewer #1
It seems to me that the exclusive use of the FAO/WHO (2004) dose-response model(s) and parameters, without consideration of other dose-response models, limits the risk assessment. The one-parameter exponential dose-response model is the simplest model that has been used in microbial risk assessments. In essence, it assumes that all members of the population (or a given subpopulation) have the same susceptibility to infection, which is a strong assumption. There are several two-parameter models, e.g., the somewhat popular Beta-Poisson model (Haas et al., 1999), that would allow more flexibility in the modeling. In the Beta-Poisson model, individual susceptibility is modeled according to a beta distribution. (In fact, this risk assessment refers to a previous risk assessment published for L. monocytogenes (Bemrah et al., 1998) that used a three-parameter Weibull-Gamma dose-response model (Farber et al., 1996) that contains both the Beta-Poisson and exponential models as special cases.) The choice of dose-response model seems especially important, given that the sensitivity analysis carried out in this risk assessment showed that “uncertainty in the dose response parameter r has a much higher impact on the uncertainty that we associate with the mean and 97.5th percentile risk per serving at random than any other single parameter, by far” (lines 3008-3010). The exposure assessment appears to be much more scientifically complete than the hazard characterization, i.e., the Exposure Assessment and Hazard Characterization sections seem very uneven. While various forms of uncertainty are considered in the exposure assessment, the only uncertainty considered in the hazard characterization within each subpopulation is uncertainty in the exponential parameter. Thus, all the considered uncertainty is within a single model, and a very simple one at that, with no allowance for differences in individual susceptibility, other than the broad division into susceptible and non-susceptible subpopulations. I believe it would be helpful to incorporate a degree of model uncertainty into the hazard characterization, or at least to choose a more flexible model if only a single model is to be used. Otherwise, it seems that all the consideration of uncertainty in the exposure assessment, based on a comprehensive effort to obtain informative data and to model it with plausible statistical models, may be limited to the context of the exponential dose-response model used in the hazard characterization. If the FAO/WHO dose-response model(s) and parameter(s) are retained without consideration of other models, then, at the very least, more background needs to be provided in this risk assessment as to how the FAO/WHO settled exclusively on the exponential dose-response model. Also, details need to be provided regarding the derivation of the uncertainty
Thank you for this comment. We answered this comment previously.
32
NAME COMMENT RESPONSE distributions in Table 6 for the exponential parameters, r, for susceptible and non-susceptible subpopulations. Without more details, it is not clear specifically how the percentage of the US population with increased susceptibility to L. monocytogenes, the percentage of cases of listeriosis that occur in this susceptible population, the total number of cases of listeriosis in the US, and the maximum achievable dose of L. monocytogenes per serving (FAO/WHO, 2004) are used to derive empirical distributions of r parameters for subpopulations of differential susceptibility. The description in lines 1189-1204 is nonspecific and the sentences are confusing. Given that the exposure assessment is very detailed and clear, not providing similar details on distributions and modeling processes in the hazard characterization weakens the risk assessment.
Reviewer #2
The FAO/WHO dose-response models and parameters are recognized and accepted by the scientific community. The question becomes one of whether the new food safety data (Scallan et al., 2011) affects the parameterization of the models. Clearly, the Scallan et al. data was not available when this model was developed, but it may be worthwhile evaluating how the 2011 data would impact the dose-response models, in comparison to the 1999 data.
The use of the Scallan et al. data cannot be directly plugged into the calculations that were used to derive the FAO/WHO dose response; the FAO/WHO dose-response derivation needed additionally a contemporaneous set of exposure data that is not available. (FAO/WHO (2004) had the benefit of more or less contemporaneous FDA/FSIS (2003) and Mead et al., (1999). We fully agree that the hazard characterization continues to be a weak part of L. monocytogenes risk assessment and hope that better dose response will be available in future.
Reviewer #3
The FAO-WHO (2004) report is known as one of the best of its kind and it was perfectly alright to turn to it for background information. The same holds for the FSIS 2003 report. In fact, I think it would have been sufficient (and cheaper!) just to update the latter one with a few chapters specifically on soft cheese.
See our response above.
The main results are in Table 1 of the Summary. There, one can see that the groups (Susceptible and General) differ by two orders of magnitude in terms of the probability of listeriosis caused by one serving. This is true for both the USA and Canada. No surprise here, once the r values (obtained from the FA/WHO report) differed by the same two orders of magnitude. An interesting conclusion could have been that pregnancy results higher risk than being immune compromised. However, a 2-fold difference between the group P and the other two groups is far from the orders of magnitude that we can really consider significant. The found difference between the groups is also explained on page 10 of the Report. In the main, one can say that the respective risks in Canada relate as G: E: Ic: P ≈ 1: 40: 40: 80. The same series (1: 40: 40: 80) appears in the US; just the General group is at almost twice the risk as it is in Canada. By no means can it be said that the difference between the two countries is significant, given the uncertainty of these estimations. In summary: I think it was an unnecessary complication to divide the population into two countries and the Susceptible group into three subgroups, once the same r value was used for all the three S-groups and in both countries.
Yes, we agree that data are clearly insufficient to really model differences in the exposure assessment for Canada/US and 4 group of susceptibility and there might be some justification for pooling data (among countries, among groups within countries). However, management charge and expectations dictate the use of data specific to the countries and specific to susceptibility groups where possible. Additionally, the shape and parameters of the FAO/WHO dose response model leads to a mean risk that is proportional to the r parameter, as suggested in the literature (Pouillot and Lubran 2011) and confirmed here. Conveniently, that lets us focus more on the relative risk for only a single group (Elderly Canada) when reporting risk estimates under the various interventions that the risk assessment entertains.
33
NAME COMMENT RESPONSE Reviewer#4
With my limited knowledge in this area, it seems appropriate to use the FAO/WHO dose-response and models.
-
CHARGE QUESTION 5: Do the risk characterization sections provide useful, understandable and comprehensive results on the model? Do the risk metrics used in this report permit one to correctly answer the charge questions?
NAME COMMENT RESPONSE Reviewer #1
Assuming that the hazard characterization was done adequately (see comment on charge question #4) and that the appropriate distributions of uncertainty have been selected from the tabled results to characterize the risk (see second paragraph of this comment), the risk characterization sections provide useful, understandable and comprehensive results on the model. It is emphasized throughout the document that the baseline model considers the manufacture of soft-ripened cheese (Camembert-like) made from pasteurized milk, and that alternative scenarios are characterized relative to the baseline model. The major outputs of the baseline model are expressed as the risk of invasive listeriosis per soft-ripened cheese serving at random, in a specified population (Canada or US, susceptible or non-susceptible).
We appreciate your comment.. Specifically, the baseline that the risk assessment strikes is that from cheeses made with fully pasteurized milk and with environment contamination added during cheese ripening, according to the distribution of in-plant contamination inferred from Gombas et al. (2003) data under a particular set of assumptions.
34
NAME COMMENT RESPONSE I do have a question regarding the combining of the risk per contaminated serving and the prevalence of contaminated servings to arrive at the risk per serving at random (page 114, lines 2769-2770). Apparently, the whole distribution of the risk per contaminated serving (Table 38) is combined with the prevalence of contaminated servings at the mean contaminated servings prevalence in order to get the distribution of the risk per serving at random (Table 39). How does this square with the second-order Monte Carlo approach used to get distributions of the risk per serving described on pages 100-101? According to that description, the distribution of the risk per serving was obtained in a single, large second-order Monte Carlo simulation. A similar question arises in combining the distribution of the number of L. monocytogenes in a contaminated serving (Table 35) with the dose-response function to get the distribution of the risk per contaminated serving (described page 112, lines 2717-2723). If the distribution of the number of L. monocytogenes in a contaminated serving (Table 35) is combined in a Monte Carlo simulation with the distribution of the dose-response parameter (Table 6) to get the distribution of the risk per contaminated serving, this seems to be appropriate and valid. However, it seems different from the second-order Monte Carlo approach described on pages 100-101, where a single, comprehensive Monte Carlo process was described for getting to the ultimate risk estimates, without the calculation of intermediate distributions like the one in Table 35. Additional explanation of how the approaches described on pages 112 and 114 jibe with the description on pages 100-101 is needed, especially the use of the mean prevalence of contaminated servings described on page 114 to get the distributions in Table 39.
Data suggest that such characteristics as L. monocytogenes positive bulk tank milk prevalence and occurrence of environmental contamination among cheeses vary among independent realizations of a process to make cheeses from bulk milk. That, in turn, means that prevalence of L. monocytogenes positive cheeses varies in some way, such as, but not necessarily, among regions or farm practices generating the milk that generates the cheeses. So, consumers’ risk per serving varies, and we capture that by reporting risk metrics like prevalence of contaminated servings and risk per contaminated serving distributions. From the regulators’ perspective, serving by serving risk, Pr{illness | serving}, where serving comes from a population of servings, varies but regulation concentrates risk mitigation also at the average prevalence or at the number of illnesses over some number of servings, like the number of servings in a year or the number of servings eaten by a nominal size population, say 100 000 persons in a year, paralleling epidemiological reporting measures of illness rates. In absence of annual consumption measures, even ones constructed from the production data that are not available, we construct the metric based on the average prevalence of contaminated servings. Similar reasoning must underlie also what appears in FAO/WHO (2004), since that risk assessments also reported a risk metric similar to the one that we labeled serving at random.
35
NAME COMMENT RESPONSE I do not understand why characterization of the risk per serving at random for the baseline model is presented in lines 220-235 and lines 2769-2786 based on results in Table 39 where the only source of uncertainty considered is variability. It would seem more appropriate to characterize the risk per serving at random for the baseline model in terms of the results in Tables 41 and 42, which include what is characterized in the text as “data uncertainty.” Is the choice of Table 39 instead of Tables 41 and 42 intentional or unintentional? If it is intentional, then the rationale for considering only variability in the uncertainty analysis needs to be explained. I believe that the risk metrics used in this report permit one to correctly answer the charge questions. That is, my criticisms and questions are not directed at the risk metrics themselves.
We considered for Uncertainty and Variability the concept used by the Codex Alimentarius. We have defined it more precisely now. For the case where one wants to make an inference about one particular serving, say the one that one is about to savour, variability –how the serving’s characteristic varies among all servings’ characteristics—is uncertainty. When the risk managers’ decisions account for the whole distribution of servings’ characteristics, it is about how that characteristic varies among all servings, subject to uncertainty about that variability. The choice of Table 39’s simpler presentation was intended to more gently lead readers into the results: here is the key result, how much the risk varies among servings and then, here is how uncertain data limitations make that result. Further, Table 39’s presentation also is a rather more gentle introduction of the concept of a risk per serving distribution –the risk per serving varies over the varying conditions that define a serving—for the internal reviewers who asked where, in the report, they would find the (single value of) risk reported. None of Tables 35, 38 and 39 considers uncertainty as Codex Alimentarius defines it. All parameters are set to single point values or to distributions at single point values for their parameters, generally, but not always, maximum likelihood estimates or modes of posterior distributions, to derive those tables’ risk outputs’ variability distributions. We added the fuller results.
Reviewer #2
Generally, yes, the risk characterization provides useful data. Although directly part of the metrics, I would suggest that the authors include, in the risk characterization, a summary of the estimated populations and time frame. For example, when the report indicates 1 case per 150,000,000 servings, it would help to have the context for the number of servings. In other words, how many servings are consumed by the defined population in a given time frame? Are 150 million servings consumed in 3 months or 3 years? I believe that this would help to provide better context for the outputs.
We agree that it would provide additional context for readers. However, there are few data available in either US or Canada that characterizes production volumes and distribution patterns for Brie and Camembert. While we agree that reporting a small number, 1×10-p per serving, as 1 per 10p servings, does invite readers to look for more context, such a search is fruitless, as we cannot provide that context.
36
NAME COMMENT RESPONSE Reviewer #3
I think this is an adequate characterization, and a well explained translation of the results. The separation of variability and uncertainty is well explained, though sometimes the choice for the probability distribution for uncertain data is less clear. For example, I could not follow the choice of probability distribution. If only a few cells are considered (such as p73 line 1821) in a serving, then the Poisson distribution for the number of cells is a straightforward choice. This would not cause listeriosis, but they grow to be a population over the infective dose and at that region, their destitution is lognormal. I agree with all these. However, on page 8 line 197 this is written: “…for the Canadian elderly population, 50% of contaminated servings of pasteurized milk cheese have 4 or less cfu/serving; 90% of contaminated servings have less than 760 cfu/serving…” In a contaminated serving there is at least one cell. The statement that 50% of the contaminated servings have 1, 2, 3, or 4 cells and 10% of the contaminated servings have more than 760 cells gives the picture that this cannot be a Poissonian scatter. It probably comes from lognormal distribution; but the Poisson distribution converges to Normal (and not Lognormal) as λ increases. This anomaly would not cause any harm if the low cell concentration situation (single cell level studies, which are important at contamination) are separated from the high concentration situation (population level studies, where the classical predictive models are used). I suggest that conclusions from lines of thought at population level should not be extrapolated to and explained to single cell level examples, as in the above point.
The distribution for the number of cells in a serving is derived by simulation. While it might have a closed or analytical form, we chose the more straightforward approach to enumerate the pairs {number of bacteria, how frequently it would occur} (Appendix L. monocytogenes in contaminated servings). The distribution of the number of bacteria in a serving is not Poisson, and not considered as Poisson in the model. Rather, it is more clustered and zero-inflated, particularly more so when there is some amount of growth of the contaminating bacteria deposited in a contaminated cheese and when there are multiple sources of contamination at different points in the cheeses’ life-cycle from manufacture to consumption. That, and a few other considerations, prompted the practice that we follow to capture separately the simulated frequency of the servings with exactly 0 bacteria and the simulated frequency of servings with ≥ 1 bacteria, the servings that we label L. monocytogenes positive or contaminated servings. Memory limits the size of simulations that we could run on desktop computers for this work; we found it more efficient to handle servings with 0 L. monocytogenes and servings with ≥ 1 L. monocytogenes separately in the same simulation. We agree. Using a population growth model with so few cells is a recognized limitation of the model; unfortunately, we are not aware of single cell model that could be used for this complex matrix. This limitation is repeated in the report’s section 11 Limitations, caveats and data gaps.
Reviewer#4
Yes, the risk characterization is comprehensive and useful. I think it would be helpful to the lay person to have the executive summary to provide a context that relates the “risk of invasive listeriosis per contaminated soft ripened cheese serving” to the amount of soft ripened cheese consumed. Note, it is unclear if tables 38-42 and information in the risk assessment should be labeled to describe the risk of the food solely as Camembert rather than refer to it as “soft- ripened cheese.”
There are few data available in either US or Canada that characterizes production volumes and distribution patterns for Brie and Camembert. We are thus unable to provide these estimates. We changed “soft ripened cheese” in Camembert in the caption of these tables.
37
CHARGE QUESTION 6: Comment on how the model treats the separation of uncertainty and variability and their implementation in second-order Monte-Carlo simulations. Is this methodology appropriate and well used for the purpose of the model and the available data? If not, explain what changes should be considered and how they would improve the model. Only one part of the data uncertainty is considered in the study. What other parts of uncertainty could be considered and how?
NAME COMMENT RESPONSE Reviewer #1
The separation of “uncertainty” and “variability,” as the terms are usually understood in risk assessment, and their implementation in second-order Monte-Carlo simulations seems appropriate. However, I found the discussion of uncertainty and variability sometimes to be awkward and confusing. The distinction seems clear in some places. For example, lines 241-249 provide a summary of the risk characterization for pasteurized cheese. It is stated: “Results from the second-order Monte-Carlo simulation for the baseline case suggest that the serving-to-serving variability in the risk largely overwhelms the data uncertainty, as considered in this report.” However, other places seem confusing. For example, in lines 2430-2433 it is stated: “Similar to the variability in the parameters that was transferred in the model through a Monte-Carlo simulation, it is also possible to transfer the uncertainty associated with each parameter, in order to get a measure of the aforementioned uncertainty (my emphasis) around the summary statistics of the risk outputs’ variability.” This is confusing. Isn’t the aforementioned uncertainty meant to capture both “variability” and “data uncertainty?” The whole idea of doing the second-order Monte Carlo simulation should be to account for the “overall uncertainty” in the risk outputs, whether due to variability in the processes involved or lack of specific information about parameters that characterize the processes. To this end, I believe that the methodology is appropriate and well used for the purpose of the model and the available data. However, I believe that sentences like the one in lines 2409-2411, which might be describing the “aforementioned uncertainty” referred to in lines 2432-2433, are very confusing and could be re-expressed to better advantage: “Summary statistics about how those summary statistics change across the uncertainty about inputs converge to an expression of our uncertainty about the risk output’s distribution in large enough simulations.”
We defined better what we consider as uncertainty (actually limited to data uncertainty in this report) and add the sentence you proposed. However, we consider the definition of the Codex Alimentarius for the definition of uncertainty and variability, acknowledging that these definitions are not universal. In these definitions, uncertainty is fully separated from variability.
38
NAME COMMENT RESPONSE I think the “aforementioned uncertainty” in lines 2432-2433 is (correctly) meant to represent “overall uncertainty” like in lines 2469, 3564 and 3573. In my opinion, using nomenclature that attempts to separate “variability” and “uncertainty,” now seemingly entrenched in risk assessment, can only lead to confusion. The term uncertainty should apply as an umbrella term. Underneath that umbrella should be various sources of uncertainty, such as variability and inadequate information. Inadequate information (lack of knowledge, lack of data, bias) appears to be what is meant by “data uncertainty” in this report. To eliminate confusion I recommend that, because the distinction is made here between “variability” and “data uncertainty,” the term “overall uncertainty” be used consistently throughout the risk assessment whenever uncertainty that encompasses both “variability” and “data uncertainty” is being discussed. Similarly, section and table headings that say “no uncertainty considered” are confusing. They should at least say “no data uncertainty considered.” Also, to say that the variability largely overwhelms the uncertainty (e.g., lines 2846-2847) can only mean that the variability largely overwhelms the “data uncertainty,” because variability is included in and contributes to the “overall uncertainty” so it can’t overwhelm that. Regarding what other parts of uncertainty could be considered, I have suggested in my comment on charge question #4 that model uncertainty could be considered. Such consideration would not reduce the overall uncertainty, and would likely increase the estimate of overall uncertainty; but, it might give a clearer perspective.
When we use Codex’s definitions for variability and uncertainty, we reserve variability to refer to how the risk output varies, over some well-defined population and uncertainty to refer to our cumulative knowledge or lack knowledge about that variability. Sources of uncertainty: model uncertainty, data uncertainty, estimator uncertainty; model uncertainty how we represent, summarize or simplify physical phenomena; how we represent methods to sample information from physical phenomena; that is, umbrella of model uncertainty includes basic notion of how we infer from sample to sampling population and how we extrapolate from sampling population to reference population. Most basic comparison might be between the empirical distribution, when data-informed and the parametric distribution that we choose to use to summarize those empirical data; how we represent the sampling distribution for the model’s basic outputs; estimator uncertainty small simulations generate simulation sample estimates of the summary statistics of fY(y) that we use to summarize the risk output distribution. Searching for less cumbersome terminology or less cumbersome descriptions that we could use that include the reviewer’s suggestion, without being incorrect, we really mean that we have calculated a result at the point (value, estimate, …) for each of the data inputs, whether the data describe the phenomenon or whether they describe the unknown parameters for an analytical distribution that we have used to summarize how the phenomenon varies.
39
NAME COMMENT RESPONSE The umbrella of model uncertainty includes basic notion of
how we infer from sample to sampling population and how we extrapolate from sampling population to reference population. Clear definition of sampling population from what data are observed and the design for that data gathering are notably lacking in much of microbiological literature that we reviewed for this risk assessment and, and so, the appropriate inference from data to sampling population, are commonly not reported, leaving the basic model assumption for the data, that the data are a random sample from or that experimental material is a random sample from the sampling population to which we need to make inferences is unverifiable. Van Kessel et al. (2011), reporting results from NAHMS 2007, is a refreshing contrast.
Reviewer #2
The Report adequately discusses the separation of variability and uncertainty, although what the authors categorize as variability (lines 2419 – 2421, Gombas et al.), others might consider uncertainty.
We consider the definition of the Codex Alimentarius for the definition of uncertainty and variability. For the case where one wants to make a probability statement about one particular serving, say the one that one is about to savour, variability –how the serving’s characteristic varies among all servings’ characteristics—is uncertainty. When the risk managers’ decisions account for the whole distribution of a servings’ characteristics, it is about how that characteristic varies among all servings, subject to uncertainty about that variability.
Reviewer #3
Second order Monte-Carlo (MC) simulations are becoming standard in RA, and they are definitely a valid approach here, too. The fact that uncertainty is considered only for the data is a simplification that could have detrimental effects on the accuracy of the used predictive model.
We fully agree that only some, unknown size part of the uncertainty in the model is accounted for. We have expanded some discussion points in the report to reflect that more clearly.
Note that tools exist to estimate, for example, the uncertainty of the used secondary (predictive) models for the EGR, which is one of the most influential parameters. Namely, the EGR calculation typically goes through two levels of extrapolation: from broth-based data to cheese medium and possibly from the interpolation region, defined by the combination of environmental variables where experiments were carried out to generate the predictive model. The more variables that are used in the secondary model, the more important it is to check whether the predictions are extrapolation. The WHO-FAO (2004) RA details these questions, recommending the use of accuracy and bias factors from Ross (1996) to address the first problem, and suggesting the use of the so-called “convex hull” of the experimental design to handle the second one. This is especially important close to the boundary of the mentioned convex hull, where the error in the model prediction can increase dramatically.
Regarding the predictive growth model, the uncertainty in this complex and varying matrix is probably largely underestimated. Unfortunately, we do not have any enumeration data from growth experiments that could help deriving the accuracy and bias factors that Ross (1996) addressed.
40
NAME COMMENT RESPONSE Actually, there is another extrapolation step involved in the calculations: the data for the predictive models are typically from pure cultures and the EGR, but especially the maximum population density of Listeria, can be very much overestimated in natural flora. Competition studies (with lactic acid bacteria) do exist but this issue belongs to the already discussed dynamic modeling, and I do not think addressing it would change the outcome.
Indeed. Inferences from a meta-analysis of growth experiments in the published literature took pains to construct a distribution of growth characteristics for single-strain, single-instantiation of L. monocytogenes, but failed to recognize that there is no information in the microbiological literature that would inform us about how to sample from that distribution to synthesize what would be the growth characteristics for a single-occurrence of L. monocytogenes contamination at any –-milk, cheese handling, in-plant, retail repackaging and consumer storage— point covering, as well, what combinations of strains would appear, in what proportions, in any single contaminating event. So, we suspect that we overstate the variability in the growth characteristics of the Lm that would occur among independent contaminating events, if the Lm contamination were the mixture of ≥ 1 strain, with resulting growth characteristics more like the mixture of ≥ 1 independent draws from their characterizing distributions, than if each L. monocytogenes contamination event were from only a single L. monocytogenes strain. Model structures enable simple ways to account for effects of other contaminating bacteria; lacking is information to specify their prevalence, levels and growth characteristics in these cheeses.
Reviewer#4
I do not feel qualified to comment on these questions. However, the narrative about the model component’s uncertainty in section 9.3.2 seems logical.
CHARGE QUESTION 7: Is the “Discussion, limitations and caveats” section exhaustive and does it provide the reader a clear discussion of the limits of the use of the study results?
NAME COMMENT RESPONSE Reviewer #1
Although it is difficult to judge whether this section is exhaustive, it does discuss what seem to be the most important limitations of the risk assessment. It is made clear that the growth function parameterization relies on the more extensive growth information available for Camembert cheese, and should not be unconditionally extrapolated to other soft-ripened cheese, even Brie, without appropriate discussion and qualification. It is stated that the results rely on limited data and a number of extrapolations for which the biases and uncertainties are unknown.
We appreciate your comments.
41
NAME COMMENT RESPONSE What I consider to be the main weakness of the risk assessment is noted; namely, one particular dose-response model among many alternatives, the FAO/WHO (2004) simple exponential model, was used, being directly transposed, without consideration of model uncertainty and without adequate explanatory background.
We agree and have expanded the hazard characterization section.
It is further noted in the discussion section that the sensitivity analysis shows that, within the overall uncertainty that is considered in this risk assessment, the uncertainty surrounding the r parameter of the exponential dose-response model dominates the uncertainty attributed to the risk results.
In addition, it is noted that no specific consideration on the variability in the virulence among strains was included, although it has been suggested by certain investigators.
Reviewer #2
Yes. The limitations section clearly identifies many of the issues discussed in this review. We appreciate your comments.
Reviewer #3
The authors make a fair assessment of the significance of their results. In light of being familiar with the WHO-FAO assessment, the fact that there is no surprising finding here does not decrease the merit of the study, which rigorously followed the process through.
We appreciate your comments.
Reviewer#4
In my comment above, I have listed a number of factors that should be added as limitations and data gaps. I think one limitation that needs to be expanded more fully is the fact that data were not available on prevalence and level of contamination from different types of cheese operations to compare pasteurized milk cheese and farmstead or artisanal raw milk cheese processing. As noted earlier, commercial operations have extensive preventative control measures and validation programs for environmental pathogen monitoring and finished product testing. I would suggest adding more information as noted in red below. 3521 The same prevalence and level of environmental contamination are used for industrial 3522 pasteurized milk cheese and for farmstead or artisanal raw milk cheese processing (without consideration for difference in preventative control measures to reduced contamination). Additional 3523 data on prevalence of L. monocytogenes in soft-ripened cheeses made from pasteurized milk 3524 from industrial, artisanal and farmstead scale operations are needed to better define this 3525 environmental contamination.
Thanks. We included your suggestions
42
NAME COMMENT RESPONSE I agree with this next limitation, listed below (lines 3526-3532), but suggest it be qualified to explain information that was lacking on farmstead and artisanal operations. Also, depending on how the final report addressed the point of commercial cheese operations using stabilized culture technology and differing pH for ripening, this section will need to be revised to reflect the culturing process differences. Suggested text additions are listed in red. 3526 Moreover, there is a notable lack of information about the differences in practices between large 3527 commercial cheese manufacturing operations and small farmstead cheese manufacturing 3528 operations. Notably, there is a lack of information about the time-temperature pattern, and pH during the 3529 process of cheese-making. There is lack of information about how culture selection, ripening aging, distribution, retail and 3530 home storage time and temperature characteristics differ between cheeses from large commercial 3531cheese manufacturing operations and smaller farmstead and artisanal cheese manufacturing 3532 operations.
Following suggestions, we revised the report, appendices and model to distinguish between pH profiles of different processes not previously distinguished in the draft. Also, we account for the different ripening length characteristics of the processes.
CHARGE QUESTION 8: Comment on the adequacy of the risk assessment model documentation. Is the report clearly written? Is it complete? Does it follow a logical structure and layout? If not, suggest an alternative outline or approach for adequately and clearly documenting this risk assessment.
NAME COMMENT RESPONSE Reviewer #1
The model documentation provided throughout the text and summarized in the Appendix seems adequate and complete, and it follows a logical structure and layout. Still, the model is quite complex, and it may not be possible, without extensive use, to identify any potential gaps in the documentation.
We acknowledge that reviews of complex documentation might not identify all errors, oversights and omissions. We have not identified alternatives, outside our own reviews and this review, for reviewing the documentation to correct that.
Reviewer #2
The Report and Appendix are generally well written. It is complete, and addresses the questions posed in the “Charge” section, which is outlined in the Appendix. It follows a logical design and layout. The Summary document is well prepared, although I would like to see some additional context added to the risk characterization.
The summary document, report appendices and model documentation reflect changes made in response to reviewers’ comments. However, particularly production information is lacking; that context cannot be added at this time.
I randomly picked 25 references from the text, and searched for them in the reference section. Two of the 25 were not in the reference section. I would suggest that the authors review the use of references and the completeness of the reference section.
We will review the references before finalizing the report.
Reviewer #3
The template just about followed the FSIS (2003) and WHO-FAO RAs, which is adequate; it is also easier to read for those who are familiar with the previous assessments.
We appreciate your comment.
43
NAME COMMENT RESPONSE Reviewer#4
Overall, I feel the report follows a logical structure and is laid out well. It is helpful to have a separate executive summary and appendices. The report is clearly written and does a good job describing the complex information that is required for a risk assessment, and results from the model application of alternative. I am not suggesting a different approach for the report. But, I think it is important to provide more of a context to the lay reader in the introduction or overview of the cheese industry about the amount of Camembert and soft- ripened cheese produced in the U.S. and Canada so the lay reader can better understand that the cheese considered in the risk assessment only represents a very small portion of cheese consumption. This should be relabeled as “General flow chart for traditional production of Brie and Camembert Production” General flow chart for commercial production of Brie and Camembert Production Pasteurize whole milk → Inoculate milk with starter culture (mesophilic and/or thermophilic culture Note for stabilized cheese only thermophilic culture would be added) → Add penicillium candidum to milk → Ripen milk → Add coagulant → Cut coagulum →Curd drained into hoops; hoops turned for drainage → Cheese pH drops to ~ 4.90 +/- 0.15 → Cheese salted (brine or dry salted) – Note: MOLD SPORES NOT ADDED DURING THIS STEP → Cheese onto racks, into ripening room - optional mold can be sprayed on surface of cheese, cheese turned Mold will form within 2 week period (typically 7-10 days for commercial operations) → Cheeses are packaged in breathable parchment paper and packaged →Cheese is aged and distributed. Stabilized Brie or Camembert is a general technology involving the use of thermophilic culture to keep pH levels a bit higher (~5.00) as opposed to using a mesophilic culture, which can drop the pH down to ~ 4.80 or lower. As far as pH differences between the core and beneath the rind, this can vary due to a multitude of factors. The thicker the cheese, the bigger the pH variation; the thinner the cheese, the less variation. Also, different strains of molds are more or less proteolytic. Larger plants tend to limit growth of other organisms (b. linens, other yeasts, various micrococci), as compared to smaller manufacturers. This results in a more homogenous rind color (white). Larger plants tend to dry out the surface a bit more to have more of a rind. This aids in distribution as the cheese keeps its shape. Smaller plants tend to have little or no rind. Color can be a multi flora of white, gray, and even some reddish colors from the b. linens.
We included this new (adapted) chart.
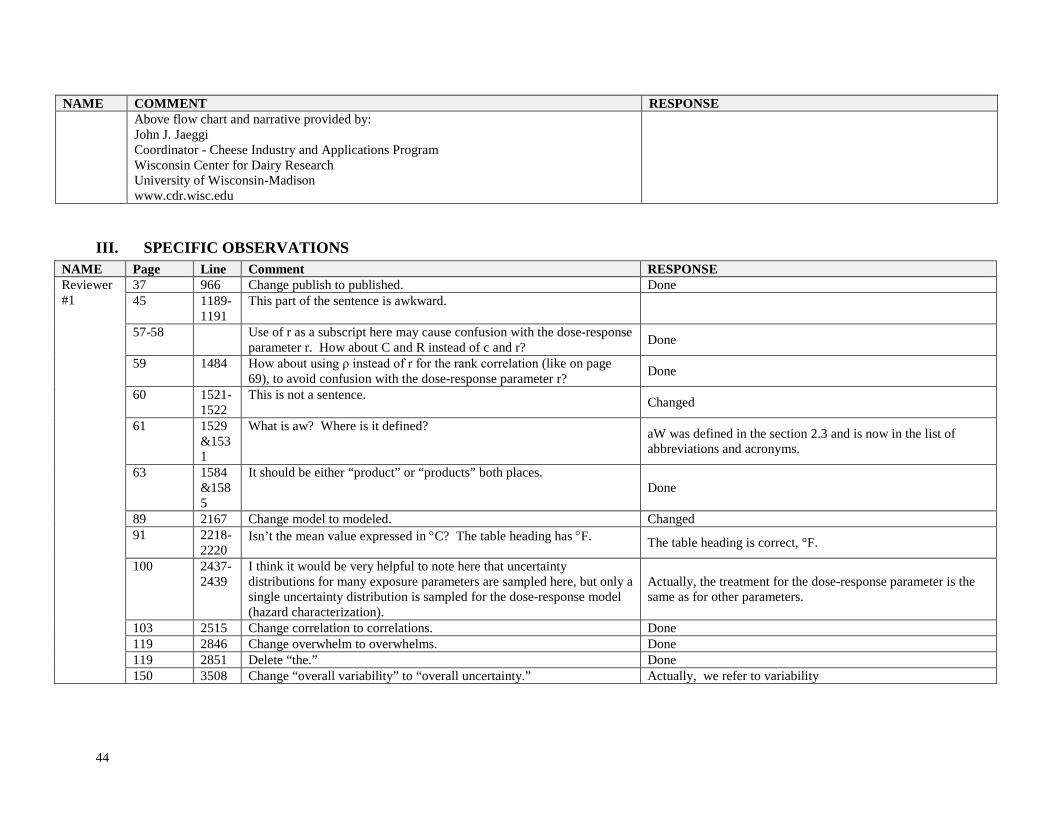
44
NAME COMMENT RESPONSE Above flow chart and narrative provided by: John J. Jaeggi Coordinator - Cheese Industry and Applications Program Wisconsin Center for Dairy Research University of Wisconsin-Madison www.cdr.wisc.edu
III. SPECIFIC OBSERVATIONS NAME Page Line Comment RESPONSE Reviewer #1
37 45
966 1189-1191
Change publish to published. This part of the sentence is awkward.
Done
57-58 Use of r as a subscript here may cause confusion with the dose-response parameter r. How about C and R instead of c and r? Done
59 1484 How about using ρ instead of r for the rank correlation (like on page 69), to avoid confusion with the dose-response parameter r? Done
60 1521-1522
This is not a sentence. Changed
61 1529&1531
What is aw? Where is it defined? aW was defined in the section 2.3 and is now in the list of abbreviations and acronyms.
63 1584&158
It should be either “product” or “products” both places. Done
5 89 2167 Change model to modeled. Changed 91 2218-
2220 Isn’t the mean value expressed in °C? The table heading has °F. The table heading is correct, °F.
100 2437-2439
I think it would be very helpful to note here that uncertainty distributions for many exposure parameters are sampled here, but only a single uncertainty distribution is sampled for the dose-response model (hazard characterization).
Actually, the treatment for the dose-response parameter is the same as for other parameters.
103 2515 Change correlation to correlations. Done 119 2846 Change overwhelm to overwhelms. Done 119 2851 Delete “the.” Done 150 3508 Change “overall variability” to “overall uncertainty.” Actually, we refer to variability
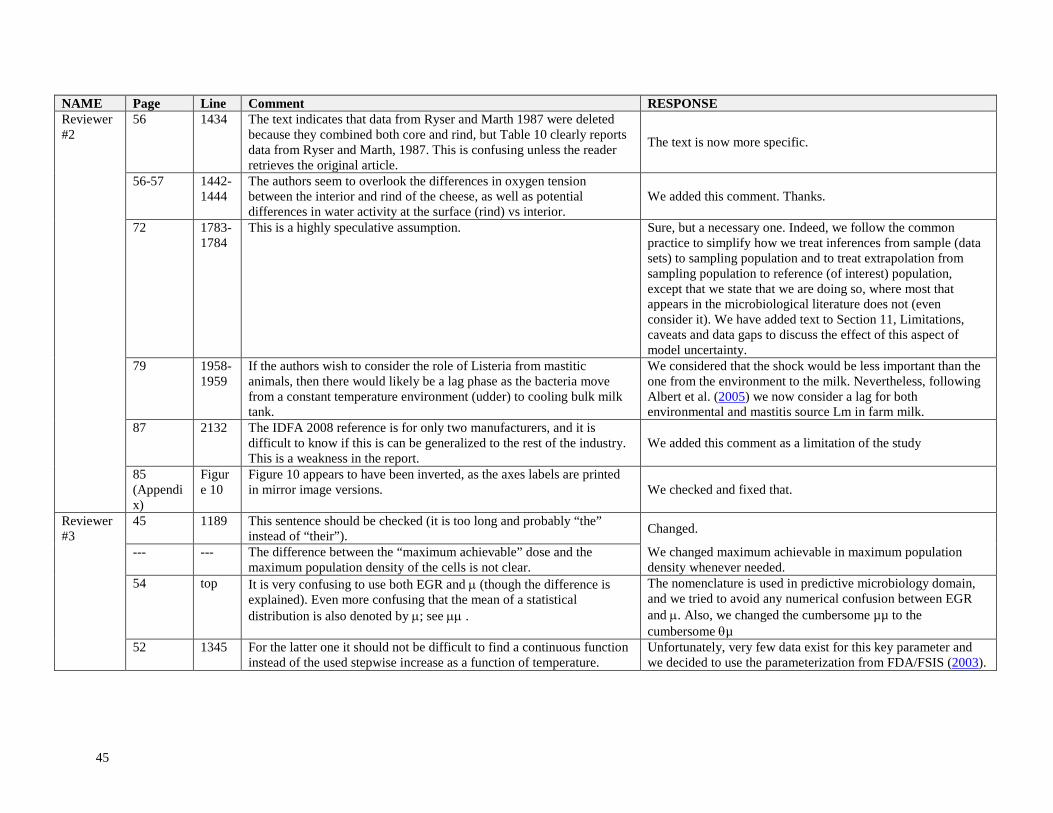
45
NAME Page Line Comment RESPONSE Reviewer #2
56 1434 The text indicates that data from Ryser and Marth 1987 were deleted because they combined both core and rind, but Table 10 clearly reports data from Ryser and Marth, 1987. This is confusing unless the reader retrieves the original article.
The text is now more specific.
56-57 1442-1444
The authors seem to overlook the differences in oxygen tension between the interior and rind of the cheese, as well as potential differences in water activity at the surface (rind) vs interior.
We added this comment. Thanks.
72 1783-1784
This is a highly speculative assumption. Sure, but a necessary one. Indeed, we follow the common practice to simplify how we treat inferences from sample (data sets) to sampling population and to treat extrapolation from sampling population to reference (of interest) population, except that we state that we are doing so, where most that appears in the microbiological literature does not (even consider it). We have added text to Section 11, Limitations, caveats and data gaps to discuss the effect of this aspect of model uncertainty.
79 1958-1959
If the authors wish to consider the role of Listeria from mastitic animals, then there would likely be a lag phase as the bacteria move from a constant temperature environment (udder) to cooling bulk milk tank.
We considered that the shock would be less important than the one from the environment to the milk. Nevertheless, following Albert et al. (2005) we now consider a lag for both environmental and mastitis source Lm in farm milk.
87 2132 The IDFA 2008 reference is for only two manufacturers, and it is difficult to know if this is can be generalized to the rest of the industry. This is a weakness in the report.
We added this comment as a limitation of the study
85 (Appendix)
Figure 10
Figure 10 appears to have been inverted, as the axes labels are printed in mirror image versions. We checked and fixed that.
Reviewer #3
45 1189 This sentence should be checked (it is too long and probably “the” instead of “their”). Changed.
--- --- The difference between the “maximum achievable” dose and the maximum population density of the cells is not clear.
We changed maximum achievable in maximum population density whenever needed.
54 top It is very confusing to use both EGR and µ (though the difference is explained). Even more confusing that the mean of a statistical distribution is also denoted by µ; see µµ .
The nomenclature is used in predictive microbiology domain, and we tried to avoid any numerical confusion between EGR and µ. Also, we changed the cumbersome µµ to the cumbersome θµ
52 1345 For the latter one it should not be difficult to find a continuous function instead of the used stepwise increase as a function of temperature.
Unfortunately, very few data exist for this key parameter and we decided to use the parameterization from FDA/FSIS (2003).
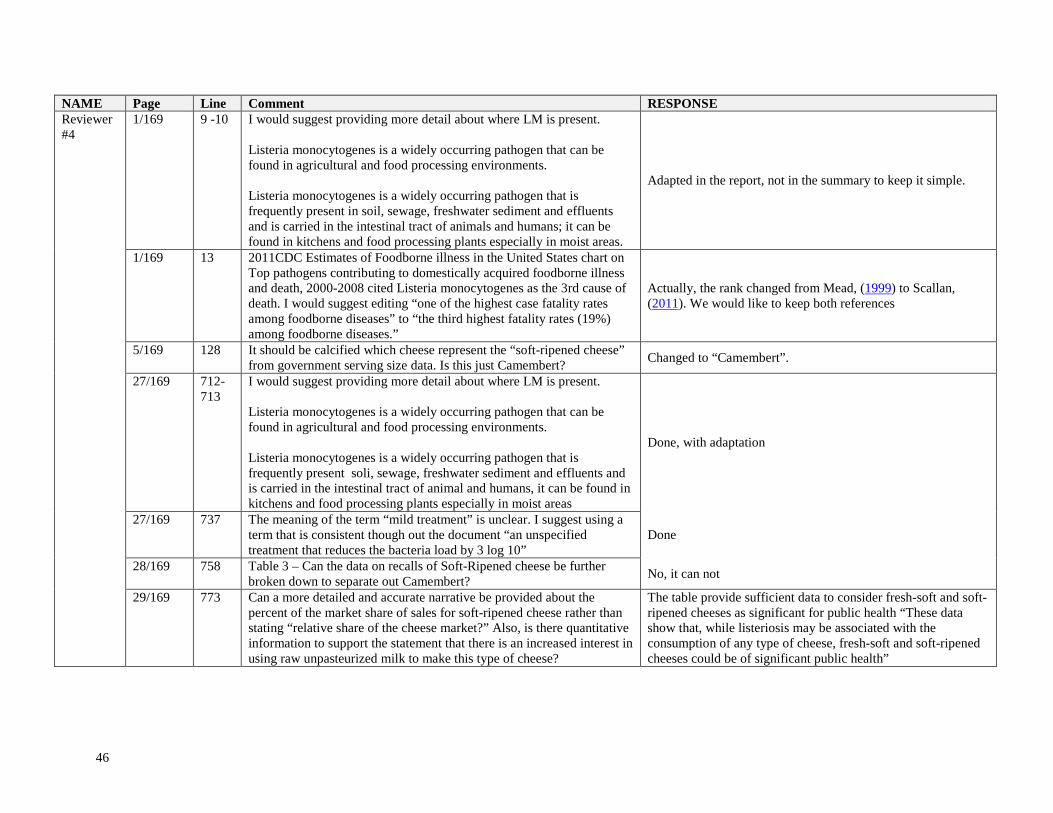
46
NAME Page Line Comment RESPONSE Reviewer#4
1/169 9 -10 I would suggest providing more detail about where LM is present. Listeria monocytogenes is a widely occurring pathogen that can be found in agricultural and food processing environments. Listeria monocytogenes is a widely occurring pathogen that is frequently present in soil, sewage, freshwater sediment and effluents and is carried in the intestinal tract of animals and humans; it can be found in kitchens and food processing plants especially in moist areas.
Adapted in the report, not in the summary to keep it simple.
1/169 13 2011CDC Estimates of Foodborne illness in the United States chart on Top pathogens contributing to domestically acquired foodborne illness and death, 2000-2008 cited Listeria monocytogenes as the 3rd cause of death. I would suggest editing “one of the highest case fatality rates among foodborne diseases” to “the third highest fatality rates (19%) among foodborne diseases.”
Actually, the rank changed from Mead, (1999) to Scallan, (2011). We would like to keep both references
5/169 128 It should be calcified which cheese represent the “soft-ripened cheese” from government serving size data. Is this just Camembert? Changed to “Camembert”.
27/169 712-713
I would suggest providing more detail about where LM is present. Listeria monocytogenes is a widely occurring pathogen that can be found in agricultural and food processing environments. Listeria monocytogenes is a widely occurring pathogen that is frequently present soli, sewage, freshwater sediment and effluents and is carried in the intestinal tract of animal and humans, it can be found in kitchens and food processing plants especially in moist areas
Done, with adaptation
27/169 737 The meaning of the term “mild treatment” is unclear. I suggest using a term that is consistent though out the document “an unspecified treatment that reduces the bacteria load by 3 log 10”
Done
28/169 758 Table 3 – Can the data on recalls of Soft-Ripened cheese be further broken down to separate out Camembert? No, it can not
29/169 773 Can a more detailed and accurate narrative be provided about the percent of the market share of sales for soft-ripened cheese rather than stating “relative share of the cheese market?” Also, is there quantitative information to support the statement that there is an increased interest in using raw unpasteurized milk to make this type of cheese?
The table provide sufficient data to consider fresh-soft and soft-ripened cheeses as significant for public health “These data show that, while listeriosis may be associated with the consumption of any type of cheese, fresh-soft and soft-ripened cheeses could be of significant public health”
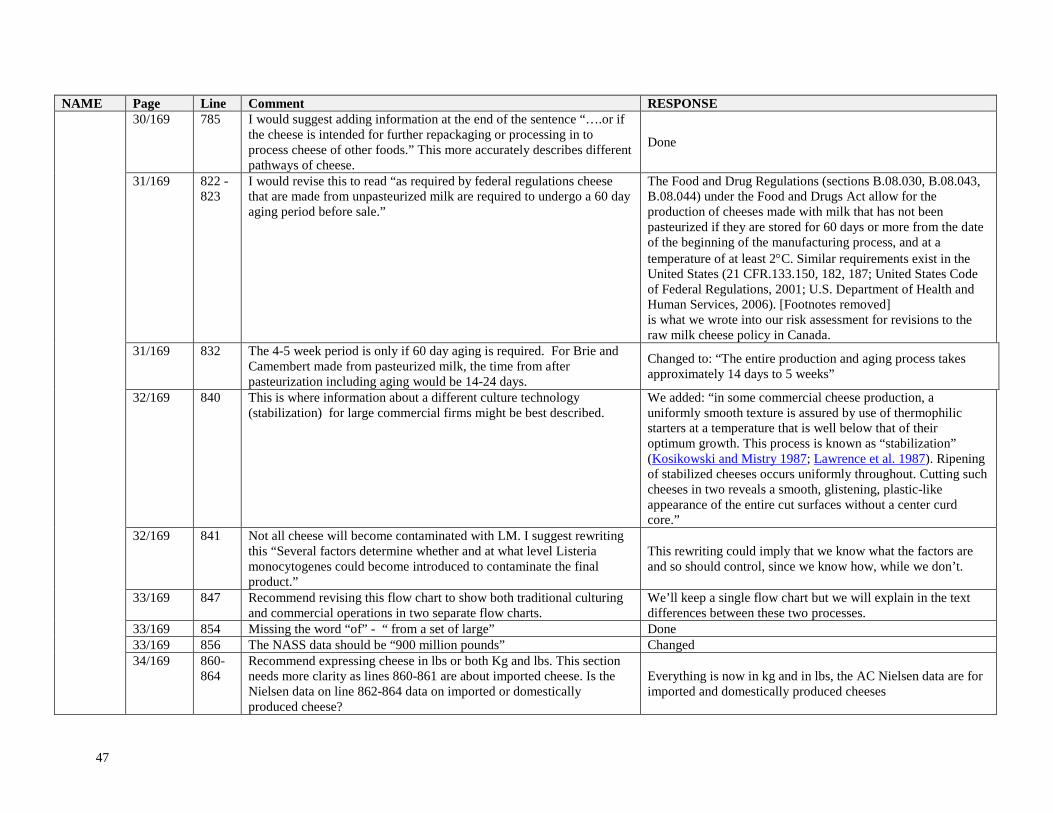
47
NAME Page Line Comment RESPONSE 30/169 785 I would suggest adding information at the end of the sentence “….or if
the cheese is intended for further repackaging or processing in to process cheese of other foods.” This more accurately describes different pathways of cheese.
Done
31/169 822 - 823
I would revise this to read “as required by federal regulations cheese that are made from unpasteurized milk are required to undergo a 60 day aging period before sale.”
The Food and Drug Regulations (sections B.08.030, B.08.043, B.08.044) under the Food and Drugs Act allow for the production of cheeses made with milk that has not been pasteurized if they are stored for 60 days or more from the date of the beginning of the manufacturing process, and at a temperature of at least 2°C. Similar requirements exist in the United States (21 CFR.133.150, 182, 187; United States Code of Federal Regulations, 2001; U.S. Department of Health and Human Services, 2006). [Footnotes removed] is what we wrote into our risk assessment for revisions to the raw milk cheese policy in Canada.
31/169 832 The 4-5 week period is only if 60 day aging is required. For Brie and Camembert made from pasteurized milk, the time from after pasteurization including aging would be 14-24 days.
Changed to: “The entire production and aging process takes approximately 14 days to 5 weeks”
32/169 840 This is where information about a different culture technology (stabilization) for large commercial firms might be best described.
We added: “in some commercial cheese production, a uniformly smooth texture is assured by use of thermophilic starters at a temperature that is well below that of their optimum growth. This process is known as “stabilization” (Kosikowski and Mistry 1987; Lawrence et al. 1987). Ripening of stabilized cheeses occurs uniformly throughout. Cutting such cheeses in two reveals a smooth, glistening, plastic-like appearance of the entire cut surfaces without a center curd core.”
32/169 841 Not all cheese will become contaminated with LM. I suggest rewriting this “Several factors determine whether and at what level Listeria monocytogenes could become introduced to contaminate the final product.”
This rewriting could imply that we know what the factors are and so should control, since we know how, while we don’t.
33/169 847 Recommend revising this flow chart to show both traditional culturing and commercial operations in two separate flow charts.
We’ll keep a single flow chart but we will explain in the text differences between these two processes.
33/169 854 Missing the word “of” - “ from a set of large” Done 33/169 856 The NASS data should be “900 million pounds” Changed 34/169 860-
864 Recommend expressing cheese in lbs or both Kg and lbs. This section needs more clarity as lines 860-861 are about imported cheese. Is the Nielsen data on line 862-864 data on imported or domestically produced cheese?
Everything is now in kg and in lbs, the AC Nielsen data are for imported and domestically produced cheeses
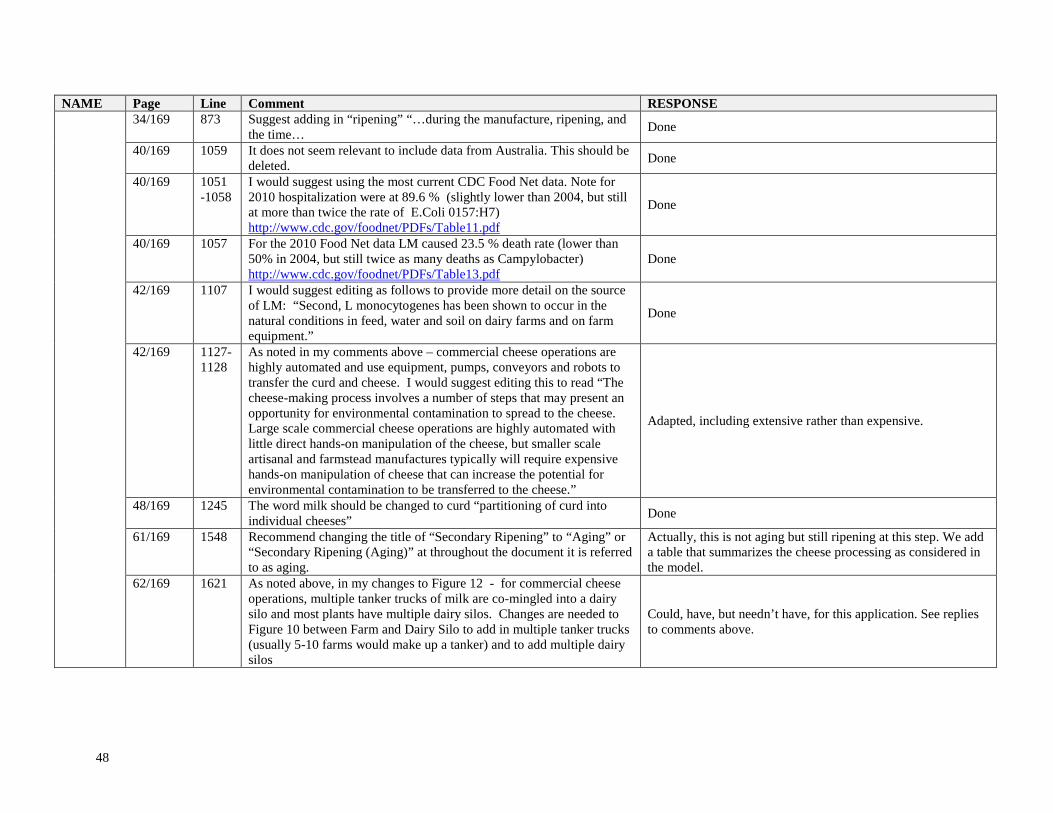
48
NAME Page Line Comment RESPONSE 34/169 873 Suggest adding in “ripening” “…during the manufacture, ripening, and
the time… Done
40/169 1059 It does not seem relevant to include data from Australia. This should be deleted. Done
40/169 1051 -1058
I would suggest using the most current CDC Food Net data. Note for 2010 hospitalization were at 89.6 % (slightly lower than 2004, but still at more than twice the rate of E.Coli 0157:H7) http://www.cdc.gov/foodnet/PDFs/Table11.pdf
Done
40/169 1057 For the 2010 Food Net data LM caused 23.5 % death rate (lower than 50% in 2004, but still twice as many deaths as Campylobacter) http://www.cdc.gov/foodnet/PDFs/Table13.pdf
Done
42/169 1107 I would suggest editing as follows to provide more detail on the source of LM: “Second, L monocytogenes has been shown to occur in the natural conditions in feed, water and soil on dairy farms and on farm equipment.”
Done
42/169 1127-1128
As noted in my comments above – commercial cheese operations are highly automated and use equipment, pumps, conveyors and robots to transfer the curd and cheese. I would suggest editing this to read “The cheese-making process involves a number of steps that may present an opportunity for environmental contamination to spread to the cheese. Large scale commercial cheese operations are highly automated with little direct hands-on manipulation of the cheese, but smaller scale artisanal and farmstead manufactures typically will require expensive hands-on manipulation of cheese that can increase the potential for environmental contamination to be transferred to the cheese.”
Adapted, including extensive rather than expensive.
48/169 1245 The word milk should be changed to curd “partitioning of curd into individual cheeses” Done
61/169 1548 Recommend changing the title of “Secondary Ripening” to “Aging” or “Secondary Ripening (Aging)” at throughout the document it is referred to as aging.
Actually, this is not aging but still ripening at this step. We add a table that summarizes the cheese processing as considered in the model.
62/169 1621 As noted above, in my changes to Figure 12 - for commercial cheese operations, multiple tanker trucks of milk are co-mingled into a dairy silo and most plants have multiple dairy silos. Changes are needed to Figure 10 between Farm and Dairy Silo to add in multiple tanker trucks (usually 5-10 farms would make up a tanker) and to add multiple dairy silos
Could, have, but needn’t have, for this application. See replies to comments above.
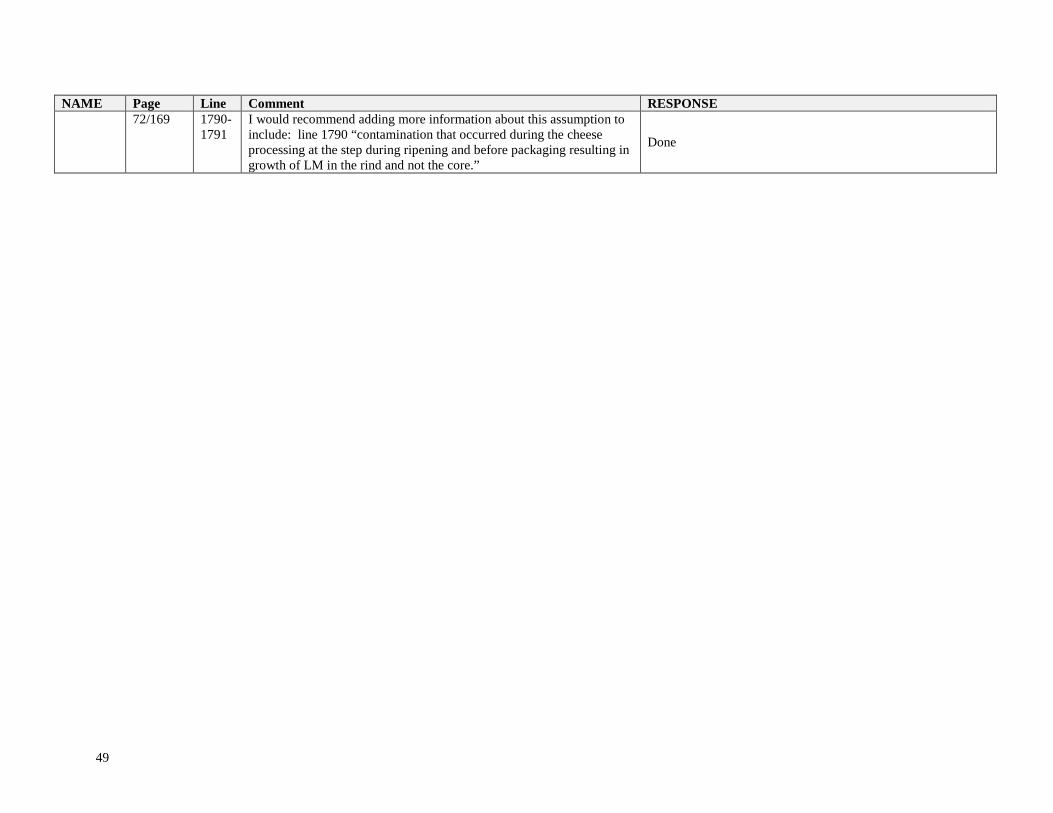
49
NAME Page Line Comment RESPONSE 72/169 1790-
1791 I would recommend adding more information about this assumption to include: line 1790 “contamination that occurred during the cheese processing at the step during ripening and before packaging resulting in growth of LM in the rind and not the core.”
Done
50
References Albert, I., R. Pouillot and J. B. Denis (2005). "Stochastically modeling Listeria monocytogenes
growth in farm tank milk." Risk Anal 25(5): 1171-1185. Baranyi, J. and T. A. Roberts (1994). "A dynamic approach to predicting bacterial growth in
food." Int J Food Microbiol 23(3-4): 277-294. Bemrah, N., M. Sanaa, M. H. Cassin, M. W. Griffiths and O. Cerf (1998). "Quantitative risk
assessment of human listeriosis from consumption of soft cheese made from raw milk." Prev Vet Med 37(1-4): 129-145.
CDC (2008). "Outbreak of Listeria monocytogenes Infections Associated with Pasteurized Milk from a Local Dairy --- Massachusetts, 2007." MMWR Morb Mortal Wkly Rep 57(40): 1097-1100.
CFSAN (2008). Data on storage times and temperatures for soft-ripened cheese from expert solicitation prepared by International Dairy Foods Association - Expert elicitation - July 30, 2008.
Chen, Y., W. H. Ross, R. C. Whiting, A. Van Stelten, K. K. Nightingale, M. Wiedmann and V. N. Scott (2011). "Variation in Listeria monocytogenes dose response in relation to subtypes encoding a full-length or truncated internalin A." Appl Environ Microbiol 77(4): 1171-1180.
D'Amico, D. J. and C. W. Donnelly (2010). "Microbiological quality of raw milk used for small-scale artisan cheese production in Vermont: effect of farm characteristics and practices." J Dairy Sci 93(1): 134-147.
Davidson, R. J., D. W. Sprung, C. E. Park and M. K. Rayman (1989). "Occurrence of Listeria monocytogenes, Campylobacter spp and Yersinia enterocolitica in Manitoba raw milk " Canadian Institute of Food Science and Technology Journal-Journal de l'Institut Canadien de Science et Technologie Alimentaires 22(1): 70-74.
Doyle, M. E., A. S. Mazzotta, T. Wang, D. W. Wiseman and V. N. Scott (2001). "Heat resistance of Listeria monocytogenes." J Food Prot 64(3): 410-429.
FAO/WHO (2004). Risk assessment of Listeria monocytogenes in ready to eat foods - Technical report. Microbiological Risk Assessment Series, no 5. Rome, Food and Agriculture Organization of the United Nations and World Health Organization: 269.
FDA (2009). Grade 'A' Pasteurized milk ordinance, U.S. Department of Health and Human Services, Public Health Service, Food and Drug Administration: 398.
FDA/FSIS (2003). Quantitative assessment of relative risk to public health from foodborne Listeria monocytogenes among selected categories of ready-to-eat foods, Food and Drug Administration, United States Department of Agriculture, Centers for Disease Control and Prevention: 541.
Fleming, D. W., S. L. Cochi, K. L. MacDonald, J. Brondum, P. S. Hayes, B. D. Plikaytis, M. B. Holmes, A. Audurier, C. V. Broome and A. L. Reingold (1985). "Pasteurized milk as a vehicle of infection in an outbreak of listeriosis." N Engl J Med 312(7): 404-407.
Garayzabal, J. F. F., L. D. Rodriguez, J. A. V. Boland, E. F. R. Ferri, V. B. Dieste, J. L. B. Cancelo and G. S. Fernandez (1987). "Survival of Listeria monocytogenes in raw milk treated in a pilot plant size pasteurizer." Journal of Applied Microbiology 63(6): 533-537.
Gombas, D. E., Y. Chen, R. S. Clavero and V. N. Scott (2003). "Survey of Listeria monocytogenes in ready-to-eat foods." J Food Prot 66(4): 559-569.
IDFA (2008). Expert elicitation.
51
Kosikowski, F. V. and V. V. Mistry (1987). Cheese and Fermented Milk Foods. Vol I: Origins and Principles. Westport (CT), Kosikowski, F.V. .
Lawrence, R. C., L. K. Creamer and J. Gilles (1987). "Texture development during cheese ripening." J Dairy Sci 70(8): 1748-1760.
Le Marc, Y., P. N. Skandamis, C. I. Belessi, S. I. Merkouri, S. M. George, A. S. Gounadaki, S. Schvartzman, K. Jordan, E. H. Drosinos and J. Baranyi (2010). "Modeling the effect of abrupt acid and osmotic shifts within the growth region and across growth boundaries on adaptation and growth of Listeria monocytogenes." Appl Environ Microbiol 76(19): 6555-6563.
Lecuit, M., S. Dramsi, C. Gottardi, M. Fedor-Chaiken, B. Gumbiner and P. Cossart (1999). "A single amino acid in E-cadherin responsible for host specificity towards the human pathogen Listeria monocytogenes." EMBO J 18(14): 3956-3963.
Lecuit, M., S. Vandormael-Pournin, J. Lefort, M. Huerre, P. Gounon, C. Dupuy, C. Babinet and P. Cossart (2001). "A transgenic model for listeriosis: role of internalin in crossing the intestinal barrier." Science 292(5522): 1722-1725.
Mead, P. S., L. Slutsker, V. Dietz, L. F. McCaig, J. S. Bresee, C. Shapiro, P. M. Griffin and R. V. Tauxe (1999). "Food-related illness and death in the United States." Emerg Infect Dis 5(5): 607-625.
Mellefont, L. A., T. A. McMeekin and T. Ross (2003). "The effect of abrupt osmotic shifts on the lag phase duration of foodborne bacteria." Int J Food Microbiol 83(3): 281-293.
Meyer-Broseta, S., A. Diot, S. Bastian, J. Riviere and O. Cerf (2003). "Estimation of low bacterial concentration: Listeria monocytogenes in raw milk." Int J Food Microbiol 80(1): 1-15.
Nauta, M. (2008). The Modular Process Risk Model (MPRM): a structured approach to food chain exposure assessment. Microbial Risk Analysis of Foods. D. W. Schaffner. Washington, D.C., ASM Press: 99-136.
Pouillot, R. and M. B. Lubran (2011). "Predictive microbiology models vs. modeling microbial growth within Listeria monocytogenes risk assessment: What parameters matter and why." Food Microbiol 28(4): 720-726.
Robinson, T. P., M. J. Ocio, A. Kaloti and B. M. Mackey (1998). "The effect of the growth environment on the lag phase of Listeria monocytogenes." International Journal of Food Microbiology 44(1-2): 83-92.
Ross, T. (1996). "Indices for performance evaluation of predictive models in food microbiology." J Appl Bacteriol 81(5): 501-508.
Ross, T. and T. A. McMeekin (2003). "Modeling microbial growth within food safety risk assessments." Risk Anal 23(1): 179-197.
Ross, T., S. Rasmussen, A. Fazil, G. Paoli and J. Summer (2009). "Quantitative risk assessment of Listeria monocytogenes in ready-to-eat meats in Australia." Int J Food Microbiol 131(2-3): 128-137.
Sanaa, M., L. Coroller and O. Cerf (2004). "Risk assessment of listeriosis linked to the consumption of two soft cheeses made from raw milk: Camembert of Normandy and Brie of Meaux." Risk Anal 24(2): 389-399.
Scallan, E., R. M. Hoekstra, F. J. Angulo, R. V. Tauxe, M. A. Widdowson, S. L. Roy, J. L. Jones and P. M. Griffin (2011). "Foodborne illness acquired in the United States—major pathogens." Emerg Infect Dis 17(1): 7-12.
52
Steele, M. L., W. B. McNab, C. Poppe, M. W. Griffiths, S. Chen, S. A. Degrandis, L. C. Fruhner, C. A. Larkin, J. A. Lynch and J. A. Odumeru (1997). "Survey of Ontario bulk tank raw milk for food-borne pathogens." J Food Prot 60(11): 1341-1346.
Van Kessel, J. A. S., J. S. Karns, J. E. Lombard and C. A. Kopral (2011). "Prevalence of Salmonella enterica, Listeria monocytogenes, and Escherichia coli Virulence Factors in Bulk Tank Milk and In-Line Filters from US Dairies." Journal of Food Protection 74(5): 759-768.