Embed Size (px)
Citation preview

DRAFT
IMPROVING ACCURACY AND REDUCING COSTS OFENVIRONMENTAL BENEFIT ASSESSMENTS
Volume III
Estimating Benefits of Reducing CommunityLow-Level Ozone Exposure
CENTER FOR ECONOMIC ANALYSISUNIVERSITY OF COLORADOBOULDER, CO 80309
September, 1985

DRAFTSeptember 1985
IMPROVING ACCURACY AND REDUCING COSTS OFENVIRONMENTAL BENEFIT ASSESSMENTS
Volume III
Estimating Benefits of Reducing CommunityLow-Level Ozone Exposure
by
Anne CoulsonMark DickieShelby Gerking
William SchulzeDonald Tashkin
USEPA Contract #CR812054-01-l
Project Officers
Dr. Alan CarlinDr. Ann Fisher
Office of Policy Analysis and PlanningU.S. Environmental Protection Agency
Washington, D.C. 20460
OFFICE OF POLICY ANALYSIS AND PLANNINGU.S. ENVIRONMENTAL PROTECTION AGENCY
WASHINGTON, D.C. 20460

CONTENTS
Tables . . . . . . . . . . . . . . . . . . . . . . . . . . . . . . . . iii
Chapter 1: Introduction and Executive Summary . . . . . . . . . . . . 1
Chapter 2: Informational Requirements to Estimate Willingness to PayUsing the Averting Behavior Method . . . . . . . . . . . . 7
2.1 Introduction . . . . . . . . . . . . . . . . . . . . . . . . 72.2 What is an Averting Behavior? . . . . . . . . . . . . . . . 92.3 A Review of the Averting Behavior and Health Literature . . 11
2.3.1 Averting Behavior and Health Models . . . . . . . . . 112.3.2 A Critique . . . . . . . . . . . . . . . . . . . . . . 16
2.4 A Basic Averting Behavior Model . . . . . . . . . . . . . . 162.4.1 Extending the Gerking-Stanley Model . . . . . . . . . 162.4.2 Estimating Willingness to Pay . . . . . . . . . . . . 202.4.3 A New Refutable Hypothesis . . . . . . . . . . . . . 242.4.4 A Dual Interpretation . . . . . . . . . . . . . . . . 25
2.5 Variations on the Averting Behavior Theme . . . . . . . . . 262.5.l Two Classes of Symptoms . . . . . . . . . . . . . . . 272.5.2 Inputs Jointly Produce Utility . . . . . . . . . . . 292.5.3 Labor-Leisure Substitutions . . . . . . . . . . . . . 31
2.6 Conclusions . . . . . . . . . . . . . . . . . . . . . . . . 31Endnotes to Chapter 2 . . . . . . . . . . . . . . . . . . . . . . 33
Chapter 3: Data Collection and Sampling Methods . . . . . . . . . . .3.1 Source of Subjects . . . . . . . . . . . . . . . . . . . . .3.2 Selection of Community . . . . . . . . . . . . . . . . . . .3.3 Sampling . . . . . . . . . . . . . . . . . . . . . . . . . .3.4 Recruitment' . . . . . . . . . . . . . . . . . . . . . . . .3.5 Payment of Subjects . . . . . . . . . . . . . . . . . . . .3.6 CORD Measures . . . . . . . . . . . . . . . . . . . . . . .3.7 Baseline . . . . . . . . . . . . . . . . . . . . . . . . . .3.8 Follow-up . . . . . . . . . . . . . . . . . . . . . . . . .3.9 Air Pollution Measures . . . . . . . . . . . . . . . . . . .3.10 Data Management . . . . . . . . . . . . . . . . . . . . . .
3434353739414142444547
Chapter 4: A Very Preliminary Analysis . . . . . . . . . . . . . . .
References . . . . . . . . . . . . . . . . . . . . . . . . . . . . . .
Appendices
49
53
A. Background Questionnaire . . . . . . . . . . . . . . . . . . 56B. Follow-Up Questionnaire . . . . . . . . . . . . . . . . . . . 89

TABLES
Number Page
Chapter 1:
1 Status of Recruitment and Completion of Baseline InterviewsGlendora, August 26, 1985 . . . . . . . . . . . . . . . . . 4
Chapter 4:
1 Status of Recruitment and Completion of Baseline InterviewsGlendora, August 26, 1985 . . . . . . . . . . . . . . . . . 50
2 Frequency of Occurrence of Symptoms; Glendora, August 26,1985 . . . . . . . . . . . . . . . . . . . . . . . . . . . 52

NOTICE
This document is a preliminary draft. It has not beenformally released by the U.S. Environmental ProtectionAgency and should not at this stage be construed torepresent Agency policy. It is being circulated forcomments on its technical merit and policy,implications.
CHAPTER 1
INTRODUCTION AND EXECUTIVE SUMMARY
This volume is a progress report on continuing research into the
dollar value of health benefits of reducing ozone levels. Previous
research aimed at estimating ozone-related health benefits have focused
mainly on measures of illness. For example, Gerking and Stanley (1986)
examined the connection between the health of St. Louis residents, the
ozone levels they face and their consumption of medical care.
Additionally, Portney and Mullahy (1983) consider the impact of rising
ozone levels on health measures such as restricted activity days, bed
disability days, and work loss days among respondents in the 1979 national
Health Interview Survey. Unfortunately, studies in this vein easily may
overlook the health benefits arising from reductions in subclinical or
minor symptomatic discomforts of ozone. Reducing these discomforts, which
include chest pain, headache, and general malaise, is a potentially large
source of dollar benefits for two interrelated reasons. First, as
discussed more fully in Gerking et al. (1984), symptomatic discomforts can
occur even in healthy adults at ambient ozone levels below the present
federal standard of .12 ppm. Second, these discomforts are experienced by
a large share of the exposed population. As a consequence, willingness to
pay to avoid them may be substantial and should be taken into account in

the regulatory impact assessment process. The willingness to pay to avoid
the symptoms of ozone exposure will be estimated using two approaches: (1)
the averting behavior method (ABM), based on excess medical expenses and
changes in activities induced by ozone exposure, and (2) the contingent
valuation method (CVM). The particular ABM approach proposed is based on a
generalization of the model used by Gerking and Stanley and the origin of
the CVM approach considered lies in the work of Loehman et al. (1979).
Consideration of the case of ozone, therefore, will serve the following
three purposes: (1) advancing the state of the art in applying two benefit
estimation techniques, (2) developing cross-comparisons of their
cost-effectiveness, and (3) obtaining policy relevant ozone benefit
estimates. This volume should be viewed as an interim report on the
progress to date in achieving these three goals.
Most of the progress to date has been made in the following areas:
(1) the design and pretesting of data collection instruments, (2) the
recruitment of subjects and collection of baseline data, (3) a very
preliminary analysis of these data, and (4) refinements in the averting
behavior theory. Two data collection instruments have been designed: the
background and follow-up surveys included as Appendices A and B,
respectively.
Following recruitment, the background survey is administered in the
participant's hone. The background survey (see Appendix A) is designed to
collect data, including: (1) the respondent's baseline health status, (2)
typical and recent contacts with the health care delivery system, (3)
leisure-time activities, changes in those activities, (these changes are
potential averting behaviors) and a direct question about the respondent's
2

averting behaviors, (4) a checklist of 26 symptoms to determine if the
respondent has experienced any of them in the two days preceding the day of
the survey, (5) a contingent valuation of those symptoms, (6) home
environment characteristics (including presence and use of air
conditioning, another possible averting activity), (7) occupational
information, and (8) standard demographic data. The background survey was
developed based on experience in previous studies, literature review, the
health and ozone telephone conference described in Gerking et al. (1984),
and reviews by experts on the ozone and health relationship and
questionnaire experts. Additionally, the survey was pretested in the
field.
The follow-up survey is designed to collect at regular intervals much
of the same type of information collected in the baseline instrument.
Information will be collected on the subject's symptoms, work and leisure
activities including travel and time spent outdoors, illness, work loss,
and medication used or medical visits. A contingent valuation question
elicits information regarding willingness to pay to avoid each symptom
experienced during the two day period covered by the survey. In the course
of each interview, the subject will be asked his/her opinion of the air
quality for the day of the call and the previous day. Because of the
close similarity between the background and follow-up surveys, the latter
was not pretested separately.
In addition to the design of data collection instruments and the
actual collection of baseline data, a very preliminary analysis of baseline
data has been performed. Although the first follow-up questionnaires were
administered during the last week in August, no data from them are
3

available for report here. Information derived from field records of
completions is the most complete; information obtained by tallying
completed forms is next; and information from computer runs of temporary
data sets is necessarily the least complete (though probably the most
interesting). All data are based on at least 120 questionnaires.
Table 1 shows the field status of the project as of August 26. As
shown, 136 baseline interviews had been completed and 13 additional
interviews have been scheduled. The number of persons refusing to
participate (13) in the study is quite low and is less than 10 percent of
the number of completed interviews.
questionnaires have been examined,
Glendora population. There are 12
Among 134 respondents whose completed
all are Caucasian as is most of the
female household heads in the group,
again similar to the distribution of household heads by gender in that
population.
TABLE 1. STATUS OF RECRUITMENT AND COMPLETION OF BASELINEINTERVIEWS; GLENDORA, AUGUST 26, 1985
BASELINE INTERVIEWS NUMBER
COMPLETED 136SCHEDULED 13STILL ATTEMPTING TO CONTACT 22REFUSED TO PARTICIPATE 13INELIGIBLE:
MOVED FROM AREA 47RETIRED 3DECEASED 2
As previously indicated, all persons in the Glendora Chronic
Obstructive Respiratory Disease (CORD) population known to have asthma,
bronchitis, or emphysema and/or have impaired lung function (FEV, less than
4

70 percent of expected) were invited to participate in the study. At
present, there are at least 28 such individuals in the sample: 16
individuals with asthma, 1 with chronic bronchitis, 2 with emphysema, 8
with asthma and bronchitis or emphysema, and 1 with bronchitis and
emphysema. All of these individuals were identified using data from
previous CORD studies. A few additional individuals with disease or
otherwise impaired lung function may be identified through the baseline
interview. Such an identification has not yet been completed as joint
analysis of a number of questionnaire items must be performed. In any
event, every effort will continue to be made to include individuals in this
category in order to meet the goal stated in Gerking et al. (1984) that
they represent 30 percent of the total sample. Additionally, a preliminary
tally of the leisure activities questions reveals that there are 39 persons
who report regularly exercising heavily or for long duration out of doors.
Therefore, since 28.6 percent of the current sample is composed of those
who regularly exercise heavily and the goal stated in Gerking et al. (1984)
is 30 percent, no special steps apparently are necessary to identify
persons in this category.
Of the 26 health symptoms considered in the baseline questionnaire,
not all can be linked to ozone exposure on the basis of medical evidence.
Of 124 completed baseline questionnaires, 51 (or 41 percent) respondents
reported having one or more symptoms. Of course, not all of the symptoms
are ozone specific. There were 73 reports of symptoms regarded as definite
ozone symptoms among the 174 reports (by 51 persons) and 51 of the 174
reports involved symptoms regarded as non-related to ozone.
5
With respect to the fourth area of progress, refinements in the theory
of averting behavior, several generalizations of the models in Gerking and
Stanley and Gerking et al. were suggested by the nature of this study.
These extensions of previous averting behavior models included: (1) an
analysis of multiple symptoms and averting behaviors, (2) consideration of
two classes of symptoms, those related and those unrelated to ozone, (3)
allowing for averting behaviors and ozone to be direct sources of utility
or disutility, and (4) accounting for ozone-induced changes in the
labor-leisure decision. For each of these generalizations, a willingness
to pay expression was derived. Much of the appeal of the ABM in its past
applications can be traced to the simplicity of the expression for
willingness to pay and the limited amount of information needed to estimate
this expression. Thus a major focus of the theoretical work was to
determine the informational requirements to estimate willingness to pay in
each of the four cases above. To summarize the theoretical results,
estimation of the bid requires information only on market and technological
parameters if the number of averting behaviors which affect only
ozone-related symptoms is at least as great as the number of ozone-related
symptoms.
The remainder of this volume is organized as follows. Chapter 2
presents the theoretical refinements of the ABM. Data collection and the
sampling plan are described in Chapter 3, while Chapter 4 presents a very
preliminary analysis of some of the baseline information collected to date.
6

CHAPTER 2
INFORMATIONAL REQUIREMENTS TO ESTIMATE WILLINGNESS TO PAYUSING THE AVERTING BEHAVIOR METHOD
2.1. INTRODUCTION
The empirical implementation of the averting behavior method (ABM),
which determines its usefulness in generating policy relevant benefit
estimates, depends in large measure on the estimation of a bid, or
willingness to pay, for small changes in the ambient levels of pollutants
faced by households. Part of the appeal of the ABM lies in the simplicity
of the expression for this bid and the straightforward estimation
procedures that can be employed as a result. In past applications of the
ABM, expressions for this bid typically have consisted of a ratio of the
price of an averting behavior to its marginal product in the household
technology, multiplied by the marginal product of the relevant pollutant in
that technology. Given observable prices and an estimable technology, the
estimation of this type of bid is relatively straightforward. This
attractive simplicity, however, is based on a model having a particular
specification of household technology and tastes. This specification
includes the following three factors: (1) one household output of
interest, (2) one or two averting behaviors, which are modelled as inputs
in the technology and which have no direct influence on utility, and (3) no
direct sources of disutility from the pollutant.
This simple specification of the averting behavior model has been
useful to the problems to which it has been applied, but has masked both
7

the generality and the limitations of the technique. Many more complicated
specifications of household technology and tastes-reduce to a simple,
estimable bid, suggesting a wide range of applicability for the ABM. In
certain other specifications, however, the estimation of the bid is more
complicated, thus calling into question, for these cases, the appeal of the
ABM as a simple and straightforward benefit estimation technique.
In the context of the present study of health and ozone, for example,
there are at least three ways in which the above specification might have
to be modified. Preliminary discussions with epidemiologists and other
medical scientists (see Gerking et al., 1984) suggest that there may be as
many as 15 symptomatic effects (outputs) of ozone exposure in addition to
any clinical health outputs. The actual existence of even a few of these
outputs would suggest the possibility that some inputs could jointly
produce more than one output. An averting activity taken to reduce chest
pain, for instance, also might reduce cough. This type of joint production
will complicate the estimation of the bid, but this same jointness may be
used to generate a new implication of the model. Second, a possible way to
avoid ozone exposure is to change the time, location or intensity of
leisure activities. Such changes could well be direct sources of utility
or disutility, and this type of jointness is known to complicate the home
production model on which the ABM is based (Pollack and Wachter, 1975).
Third, ozone is a major component in smog and thus may be a source of
aesthetic or other disutility unrelated to health. Sources of disutility
from ozone other than those operating through the health and symptom
technology may present difficulties in interpreting the bid.
8

The question arises, then, as to how seriously these intricacies would
complicate the estimation and interpretation of the willingness' to pay
expression. The purpose of this chapter is to analyze the information
required to estimate willingness to pay (WTP) in the context of an averting
behavior model. Special attention will be paid to the simplicity of the
expression for-the bid and the ability to replace marginal utility terms
with market and technological parameters. If the utility terms can be
eliminated from the WTP expression, then information is required only on
the market and technological constraints. This information is relatively
easier to discover than information regarding preferences.
The remainder of this chapter is organized into five sections.
Section 2 attempts to define formally the concept of an averting behavior.
Section 3 reviews the ABM literature. In Section 4, a general averting
behavior model is presented and analyzed; additional extensions of this
model are treated in Section 5. Conclusions follow in Section 6.
2.2. WHAT IS AN AVERTING BEHAVIOR?
An averting behavior is defined here as any action taken to avoid or
mitigate the effects of an adverse change, or to augment the effects of a
favorable change, in environmental quality. Clearly, whenever such
behaviors are important, the estimation of "dose-response" functions
outside the context of a model of human behavior is inappropriate, because
the response of the physical or biological system in question depends in
part on the behavior of the economic agents who exercise some degree of
control over the system. The specification and implementation of models
which explicitly account for the behavior of economic agents in response to
changes in environmental quality will be called the averting behavior
9

method, or ABM. The purpose of this chapter to investigate how the
specification of these models affects their implementation.
A key factor in the ABM, obviously, is the specification of averting
behaviors. One way of formalizing the above definition of averting
behavior is to consider an averting action as an adjustment in behavior in
response to an exogenous change in the environment: an averting activity
is in the nature of a comparative static derivative. A second way to
formalize this conception of averting behavior is to consider the
individual as faced with a finite set of alternative activities, locations,
and time periods, with the discrete choice from among these alternatives
conditioned on environmental quality. The exposition of this chapter will
proceed in terms of comparative statics, owing to the familiarity and
intuitive appeal of this approach. The averting behavior model then
becomes simply an extension of the comparative statics methodology of
economics. In addition to the usual comparative statics derivatives of
choice variables with respect to prices and income, we consider the optimal
responses of choice variables to exogenous changes in environmental
quality.
The importance of averting behaviors is directly related to the
freedom the individual has to adjust his behavior, that is, on the extent
of the substitution opportunities available to him. Examples of
adjustments in behavior considered here are changes in time spent outdoors,
changes in the use of air conditioning and air purifying systems, travel to
less polluted areas, and changes in the labor-leisure decision. A more
detailed discussion of the averting behaviors expected and actually found
in this study is presented in the chapter on data collection.
10
2.3. A REVIEW OF THE AVERTING BEHAVIOR AND HEALTH LITERATURE
Averting behavior models have been used in the context of air
pollution and household cleanliness (Courant and Porter, 1981; Harford,
1984; Watson and Jaksch, 1982) as well as being applied to the problems of
air pollution and human health (Cropper, 1981; Gerking and Stanley, 1986;
Harrington and Portney, 1982). Due to the nature of the present project
and the similarity among the averting behavior models named above, only two
of those models dealing with air pollution and health will be reviewed
here. A primary goal of these models is the derivation of the compensating
variation (CV) in income necessary to maintain a constant level of utility
despite a change in ambient air pollution levels. Because this approach to
calculating WTP explicitly holds utility levels constant, it is a
theoretically correct measure of the monetary value to the consumer of a
change in air pollution. The derivation of the CV in an averting behavior
context will be illustrated now by an examination of the Gerking and
Stanley model.
2.3.1 Averting Behavior and Health Models
Gerking and Stanley generalize Cropper's approach by treating health
not only as an investment good , which contributes to increased income, but
additionally as a consumption good which has a direct impact on utility.
The former authors, however, focus on only one time period rather than on
the multiperiod framework examined by Cropper. The utility function in the
Gerking and Stanley model, then, is
U = U(X, H) (1)
where X denotes a class of goods that yield direct satisfaction but do not
affect health, and H denotes the consumer's stock of health capital. This
11

health stock is treated as an endogenous variable which is produced
according to the relation
H = H(M; α, δ) (2)
where M denotes consumption of medical care, a denotes air pollution, and 6
denotes a vector of other exogenous variables, such as education, which may
influence the efficiency of health production, and where H M > 0, Ηα < 0,
H δ - 0.>
<
In addition to the production constraint in equation (2), the
individual faces the following money and time constraints:
XPx+MPM= I +A (3)
XTx + MTM + TW + TL = T (4)
WTw = I. (5)
In these equations, Pi represents the money price of commodity i, and Ti,
the time required to consume one unit of commodity i (i = X, M), A denotes
an exogenously determined amount of asset income, I denotes wage income, W
denotes the wage rate, TW denotes time spent working, T denotes total time
available, and TL denotes time lost from market and non-market activities.
TL is determined by the health stock:
TL = G(H) (6)
where G < 0.H
Equations (3), (4), (5), and (6) can be combined into the
"full-income" budget constraint
Xqx + MqM + WG(H) = WT + A (7)
where qi = (Pi + WTi), i = X, M.
The consumer is assumed to maximize utility subject to equations (2)
and (7). After substituting the health production function into the
utility function, the Lagrangian is
12

L = U(X, H(M; a, 6)) + λ [WT + A -Xqx - MqM - WG(H(M; α, δ))] (8)
where λ is the Lagrangian multiplier, and the first order conditions are
UX- λ qx = 0 (9)
UHHM -λ (qM + WGHHM) = 0 (10)
plus equation (7). The utility maximization described above markedly
differentiates the Gerking and Stanley model from the dose-response
function approach that is common in the econometric health epidemiology
literature. Gerking and Stanley reject the assumption that the individual
behaves as if he does not care about or cannot affect his health responses
to air pollution. Rather, those authors assume that the individual behaves
as if he purposefully chooses his consumption of medical care in order to
produce the level of health that, together with his chosen consumption of
the composite good, maximizes his utility. This maximization, of course,
is subject to the health and full income constraints.
The model just presented can be manipulated as follows to derive the
CV expression for WTP. First, totally differentiate both the utility
function and the full income budget constraint with respect to air
pollution, holding all prices and available time constant, to obtain
(11)
(12)
Substituting from the first order conditions into equation (11) returns the
individual to his original, constrained maximal indifference curve. The
resulting expression may be solved for qx( ∂ X/ ∂ α) and substituted into
equation (12) to yield the following expression for marginal WTP:
13

(13)
The CV expression above reveals both the key role of averting behavior
(medical care) and the simplicity of the expression for the bid. The
greater the effectiveness of medical care at the margin, and the lower its
full price, the less the individual is willing to pay for a reduction in
air pollution levels. The simplicity of the expression for WTP and the
fact that all utility terms have been eliminated makes empirical
implementation straightforward. Herein lies the appeal of the ABM: in
addition to allowing for human behavior responses to pollution, the model
reduces the complex issue of marginal health benefit estimation to a simple
expression.
Harrington and Portney arrive at a similar expression for WTP. The
motivation for those authors' approach can be understood by recalling that
the derivation of the bid described above involved holding utility constant
at its constrained maximum. This suggests that the indirect utility
function, which gives the constrained maximum of utility for any values of
the parameters, would be a useful tool. Moreover, that derivation
effectively was a proof of the envelope theorem for the particular case
under consideration. The envelope theorem (Silberberg, 1971, 1973) states
that the derivative of the indirect utility function with respect to a.
parameter is equal to the derivative of the Lagrangian with respect to that
parameter. The indirect utility function associated with the Gerking and
Stanley model is:
φ (qM, qX, W, T, A, α, δ) = max {U(X,H)|(WT+A=XqX+MqM+WG(H)}. (14)
By the envelope theorem and equation (8),
14

(15)
Holding indirect utility constant and using equation (10) yields the
expression for the bid in equation (13).
Turning to the specifics of the Harrington and Portney model, let
(direct) utility be represented by:
U = U(X, L, S) (16)
where X is as defined previously, 1 L represents leisure time and S, sick
time. Sick time is produced according to the relation:
S = S(D, α ) (17)
where a is as defined above and D represents defensive expenditures, which
can shorten the duration of sickness. Medical expenses (M) are assumed to
depend on the duration of sickness:
M = M(S(D, P)). (18)
Maximization of expression (16) subject to equations (17) and (18),
and a set of money and time constraints similar to those in Gerking and
Stanley yields indirect utility φ as a function of the parameters of this
model. Harrington and Portney then derive the following expression for the
WTP for a reduction in pollution:
(19)
In the Harrington and Portney model, the health production is
represented by S(.) and averting behavior, by D. Bearing this in mind
along with the fact that D is defined in monetary, rather than real, terms,
the similarity between equations (19) and (13) is apparent.
15

2.3.2 A Critique
The two models discussed above are useful for at least two reasons:
(1) the direct consideration given to the actions that individuals may take
to defend against the adverse health effects of pollution, and (2) the
simplicity of the expressions for WTP. These models, however, need to be
developed more fully in a number of ways. First, as discussed in the
introduction to this chapter, it may not be possible to capture the adverse
health effects of air pollution with one health output. Second, as
discussed in Section 2, the concept of averting behavior needs to be
developed beyond medical care and defensive expenditures. Third, some
consideration needs to be given to the possibility of averting behaviors
directly impacting utility. Harrington and Portney, as well as Chestnut
and Violette (1984), conjecture that this jointness will complicate the
model, but the analysis to follow will demonstrate that this is not
necessarily the case. Finally, these models do not allow for additional
sources of disutility from air pollution other than those operating through
the health technology. It is necessary to account for this possibility so
that the relationship between the health benefit expression to other types
of benefits is clear. The following two sections are devoted to exploring
the implications on the information required to estimate the bid arising
from these complications.
2.4. A BASIC AVERTING BEHAVIOR MODEL
2.4.1 Extending the Gerking-Stanley Model
This section develops the basic model of the present chapter, which
represents a generalization of the work of Gerking and Stanley. The first
generalization of those authors' model is to allow for a number of
16

subclinical or minor symptomatic discomforts of ozone exposure in addition
to any clinical health effects of exposure. Suppose there are J such
symptom and health outputs Sl, S2
, . . . , SJ . The individual is assumed to
produce desired amounts of these outputs by the use of I inputs Vl,... VI.
These inputs may include medical care, exercise, time spent outdoors, etc.
In addition to these endogenous inputs, the production of the health and
symptom outputs is influenced by the exogenous variables α, β, and δ. The
variable a denotes a vector of ambient air pollution concentrations
exclusive of ozone, β denotes ozone concentrations, and δ denotes a vector
of social and demographic variables.
The health and symptom technology is represented by the set of
equations
Sj = Sj(V1, . . . , VI; α, β, δ) j-l, . . . , J (20)
where some of the partial derivatives of any Sj may be zero. This
specification of the health and symptom technology does not preclude
jointness in production since any input may enter several of the production
functions; however, equations (20) do embody the assumption that all health
and symptom outputs are separable. This is unlikely to be the case, since
the occurrence of symptoms depends in part on a person's chronic health
status. Additionally, certain symptoms of ozone exposure, such as cough,
may aggravate other symptoms, such as chest pain. One could account for
possible nonseparabilities in production by specifying that a subset of the
outputs was functionally related to other outputs; however, that
specification is not pursued here. That specification would not change the
expression for WTP, and thus would not change the nature of the results of
this chapter. Those results involve the relationship between the number of
17

averting inputs and the number of production relations in the model. Here,
there are J production functions (one for each health or symptom output)
and I averting behaviors.
Equation (20) reveals that, although air pollution is exogenous,
symptoms are endogenous in this model. Another way to formulate the model
would be to make symptoms dependent on exposure, with exposure a function
of ambient pollution levels and averting behaviors undertaken to reduce
exposure. The results of such a model are the same as the results of this
model.
The basic form of the utility function to be considered is
U = U(X, s1, . . . , SJ), (21)
although some attention will be devoted to generalizing this function to
allow some of the endogenous and exogenous inputs to affect utility
directly. Consumers are assumed to maximize utility subject to the
production constraints (20), given values of α, β, and δ, and the following
"full income" budget constraint (Becker, 1965; Grossman, 1972):
IWT + A = Xqx + Σ Viqi + WG(S1, . . ., SJ). (22)
i=l
The only variables in equations (21) and (22) not previously defined are
the qi = (Pi + WTi), which represent the full prices of inputs Vi, where Pi
denotes the money price of Vi and Ti denotes the time required to consume
one unit of Vi (i = 1, . . . , I).
Substituting the production constraints (20) into the utility function
(21) , and maximizing the resulting expression subject to the budget
constraint (22) implies that the following conditions hold:
18

(23)
. . .
. . .
plus the constraint (22), where λ is the Lagrange multiplier associated
with the constraint, and where Ux = ∂ U /∂ X, Uj
= ∂ U/ ∂ Sj G,j
= ∂ G/ ∂ sj,
and Sj
i= ∂ Sj/ ∂ Vi(j = 1, . . . , J; i = 1, . . . , I).
The first of the necessary conditions in equations (23) is standard.
To interpret the remaining equations, consider a small change in some
input, say Vl. This change in V1 produces a change in some or all of the
symptoms Sj , and these changes in symptoms in turn influence both utility
and the time lost from market and nonmarket activities. The first term on
the left hand side, then, sums the marginal utilities of this change in
symptoms resulting from a change in V1. The term in brackets measures the
monetary cost of the change in V1 , which consists of the full unit price of
V1 plus the value of the change in time lost due to the change in V1.
Thus, this first order condition means that the individual equates the
marginal benefits of a change in V1 to the marginal cost of a change in Vl,
and the remaining conditions in equations (23) are interpreted similarly.
A CV expression for the WTP for reduced ozone concentrations may be
derived from the model presented above by a straightforward adaptation of
the Gerking and Stanley procedure, or by direct application of the envelope
theorem. In any case, the resulting expression is
19

(24)
Because the individual is able to optimally choose the levels of the
endogenous variables Vi (i = 1, . . . , I), he can defend himself optimally
against the adverse health and symptom effects of ozone exposure. Hence,
the expression for WTP contains only the direct effects of exposure Sj =β∂ Sj/ ∂ β (j = 1, . . . , J). The first term on the right hand side of (24)
represents the marginal utility gain from a small decrease in ozone levels,
converted to monetary terms by dividing by the marginal utility of full
income, and the second term represents the marginal decrease in time lost
from market and nonmarket activities, valued at the wage rate.
The empirical implementation of the bid in equation (24) is hampered
by the presence of unobservable marginal utility terms. Estimation of this
bid is simplified greatly if these marginal utility terms can be replaced
with market and technological parameters. The question to be answered is,
what additional conditions must be imposed on the model to convert equation
(24) to a simple , easily estimable bid, like equations (13) and (19).
2.4.2 Estimating Willingness to Pay
To make estimation of the WTP expression (24) straightforward, the J
marginal utility ratios Uj/ λ (j = 1, . . . , J) must be eliminated. It is
sufficient to solve for each of these ratios individually in terms of
market and technological parameters. Turning to the first order conditions
(23), since the Uj. appear in all but the first of these equations; we may
regard the remaining first order conditions (excepting the constraint) as a
system of I equations in J unknowns, and arrange this system as
20

or
. .
(25a)
(25b)
where all sums run from j = 1, . . . , J. Thus, the question is whether the
matrix equation (25) contains enough information to solve for the unknowns
Uj/ λ (j = 1, . . . , J).
According to a theorem of linear algebra, the system of equations (25)
ji:
j
has solutions if and only if the rank of the augmented matrix
[si . qi + W Σ Gjsi] has the same rank as the coefficient matrix [SJ]. (That
is, the right hand side of equation (25) is not linearly independent of the
left.) This restriction is assured if the first order conditions hold. If
in addition these ranks are equal to J, then each of the unknowns U / λ mayj
be found entirely in terms of market and technological parameters. Since
the rank of a matrix cannot exceed the lesser of its row or column
dimensions, this means that I ≥ J. Thus, two conditions are sufficient to
replace the marginal utility terms in the WTP expression (24): (1) the
first order conditions with respect to the inputs of the health and symptom
technology must hold, and (2) the number of these inputs must be at least
as great as the number of health and symptom production functions in the
model; that is, the number of averting behaviors must not be exceeded by
the number of health effects of ozone exposure.
21
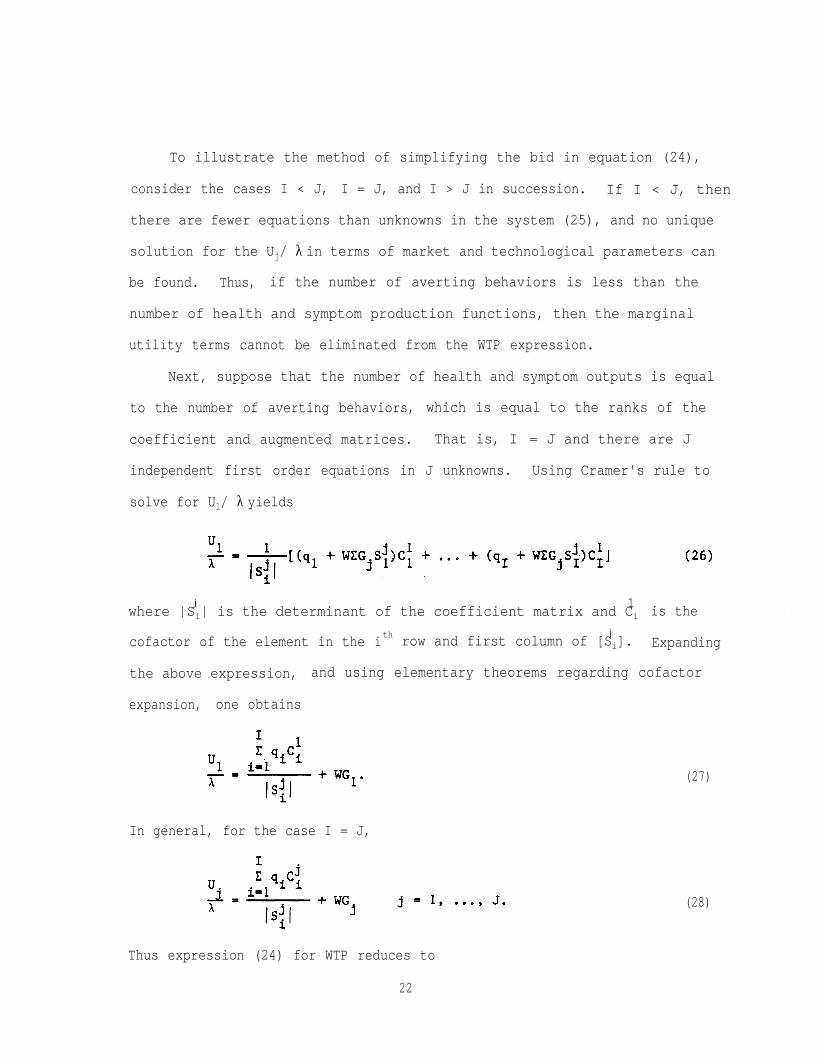
To illustrate the method of simplifying the bid in equation (24),
consider the cases I < J, I = J, and I > J in succession. If I < J, then
there are fewer equations than unknowns in the system (25), and no unique
solution for the Uj/ λ in terms of market and technological parameters can
be found. Thus, if the number of averting behaviors is less than the
number of health and symptom production functions, then the marginal
utility terms cannot be eliminated from the WTP expression.
Next, suppose that the number of health and symptom outputs is equal
to the number of averting behaviors, which is equal to the ranks of the
coefficient and augmented matrices. That is, I = J and there are J
independent first order equations in J unknowns. Using Cramer's rule to
solve for Ul/ λ yields
j
1jwhere |Si| is the determinant of the coefficient matrix and Ci is the
cofactor of the element in the ith row and first column of [Si]. Expanding
the above expression, and using elementary theorems regarding cofactor
expansion, one obtains
In general, for the case I = J,
(27)
(28)
Thus expression (24) for WTP reduces to
22

(29)
a function only of market and technological parameters. For the case I =
J, this result gives the minimum information necessary to estimate WTP for
the health benefits of ozone exposure: we need to know the full prices and
the health technology.
Finally, consider the case where the number of averting behaviors
exceeds the number of health and symptom production functions, that is,
I > J. If the rank of the coefficient matrix is equal to J, then there are
J independent equations to use in solving for the J unknown marginal
utility ratios. Given that all I first order conditions on the inputs
hold, however, there is some choice as to which J of these I equations to
use in solving for the unknowns. In other words, there are a number of
j(J x J) matrices that can be formed by deleting rows of [Si]; any one of
these could be employed in the method of solution which led to equation
(29)2 Thus, in the case I > J, there are a number of expressions for WTP
similar to equation (29). Thus, the first order conditions provide more
information than necessary to compute the bid as an additive function of
market and technological parameters: J pieces of information are needed,
but I (> J) are available. This additional information would allow the
researcher to choose the most reliable information to use in computing the
bid. For example, if data on some full price, say ql, were felt to be
inaccurate, then the first order condition on Vl would be one of those
excluded in solving for WTP. Alternatively, this additional information
could be used to test the model, as described in the next subsection.
23

In summary, estimation of WTP in the context of an averting behavior
model is hampered by the presence of unobservable marginal utility terms in
the bid, whenever the number of health and symptom outputs exceeds the
number of averting behaviors. The prospects for empirical implementation
of the model are enhanced considerably if the number of averting behaviors
is at least as great as the number of health and symptom outputs. In this
case, the marginal utility terms which appear in the bid may be replaced
with observable market and technological parameters. Moreover, the
resulting expression for WTP is additive. Estimation then is relatively
straightforward. If the number of averting behaviors equals the number of
health and symptom outputs in the model, then the individual's utility
maximization (or cost minimization) problem provides the minimum amount of
information necessary to eliminate the marginal utility terms in the WTP
expression. If the number of averting behaviors exceeds the number of
health and symptom outputs, then the first order conditions contain
additional information which may be used in a number of ways. One way in
which this additional information might be useful is in giving the
researcher some choice as to which pieces of information to use in
computing WTP. Another use of this additional information, described more
fully below, is to generate an implication of the model which may be used
as a test of the model. or as an a priori restriction to improve the
efficiency of estimation.
2.4.3 A New Refutable Hypothesis
To the extent that I > J (the number of averting behaviors exceeds the
number of health and symptom production functions), the model contains more
information than the minimum necessary to estimate the bid. This
24

additional information may be used either as a test of the model or as an
econometric restriction to improve the efficiency of estimation. Recall
that the elimination of the marginal utility terms in the bid uses two
facts: (1) the first order conditions hold, and (2) there are J
independent first order conditions on the inputs. If I > J, however, the
model implies that I first order conditions hold; hence any subset of J of
these could be used in solving for the bid. The restriction that the
various resulting expressions for the bid be equal then is equivalent to
the restriction that each of the I first order conditions on the inputs
holds. Thus, this restriction is a refutable implication of the model.
Alternatively, this restriction could be imposed a priori to increase the
efficiency of estimation.
2.4.4 A Dual Interpretation
There is an additional interpretation of the restriction I ≥ J that
may shed more light on this restriction and on the averting behavior model
as a whole. Incidentally, this interpretation suggests an alternative
estimation strategy.
Another way to formulate the consumers problem, often used in the
household production literature, is in two stages. In the first stage, the
minimum total cost of achieving given levels of health and symptom outputs
is determined, while in the second stage the utility maximizing levels of
these outputs are chosen, along with the consumption of the composite good
X. If C(q1, ..., qI, W, T, A, α, β, λ ) is the minimum cost function
defined by the solution to the first stage problem, then it can be shown
that
(30)Uj =λ
25

∂ A ∂ C∂ β = ∂ β (31)
The first of these conditions merely states that the consumer equates the
marginal benefits of each symptom to the marginal cost of its production.
The second condition indicates that WTP for decreased ozone levels is equal
to the partial derivative of the minimum total cost function with respect
to ozone. This result is due to the fact that ozone is playing the role of
a fixed factor of production in the theory of the firm; the imputed value
of ozone in production then is given by its effect on costs. Because ozone
affects the individual in this model only through its impact on health
production, then the entire benefit of ozone reduction is captured by the
reduction in the costs of achieving a given level of health. This result
suggests estimation of the cost function as an alternative implementation
strategy.
Turning now to the interpretation of the restriction I ≥ J, note that
there are I choice variables in the cost minimization problem, namely the
inputs V1, . . . VI. There are J independent output constraints in this
problem. Hence for a meaningful solution to exist, it must be true that
I ≥ J. Taking this interpretation a step further, recall that if I > J,
the additional information can be used to test whether the first order
conditions on the inputs in equation (23) hold. These conditions are
equivalent to the first order conditions on the inputs in the cost
minimization problem, and thus the test of the equality of the expressions
for the bid amounts to a test for cost minimization.
2.5. VARIATIONS ON THE AVERTING BEHAVIOR THEME
In this section three variations of the previous section's basic
26

averting behavior model are presented. The first variation considers the
case where there are two classes of symptoms: those that are related to
ozone and those that are not. The second variation allows the inputs of
the health and symptom technology, both the endogenous Vl, . . . , VI and the
exogenous β , to be direct sources of utility (or disutility). The final
variation considers possible changes in the labor-leisure decision due to
changes in ozone levels. Each of these extensions to the model has direct
empirical relevance for this project. The first is relevant because data
are being collected on ozone and non-ozone symptoms. The second variation
is potentially important because many averting behaviors such as staying
indoors or driving to the beach may involve direct changes in utility
levels. Moreover, allowing for additional sources of disutility from ozone
beyond those operating through the health technology indicates how the WTP
for health benefits is related to other estimates of consumer benefits from
ozone reduction. Finally, labor-leisure substitutions are considered
because pretesting of survey instruments suggested that this may be a
response to pollution for some people.
2.5.1 Two Classes of Symptoms
When the model allows for two classes of symptoms, those that are
related to ozone and those that are not, two subcases arise. The simplest
case is when some averting behaviors affect only the ozone symptoms and
other averting behaviors affect only the non-ozone symptoms. A second case
would occur if some averting behaviors affect both types of symptoms. In
each of these cases, the WTP expression reflects only the ozone symptoms,
but the conditions for replacing the marginal utility terms in the bid must
be reinterpreted.
27
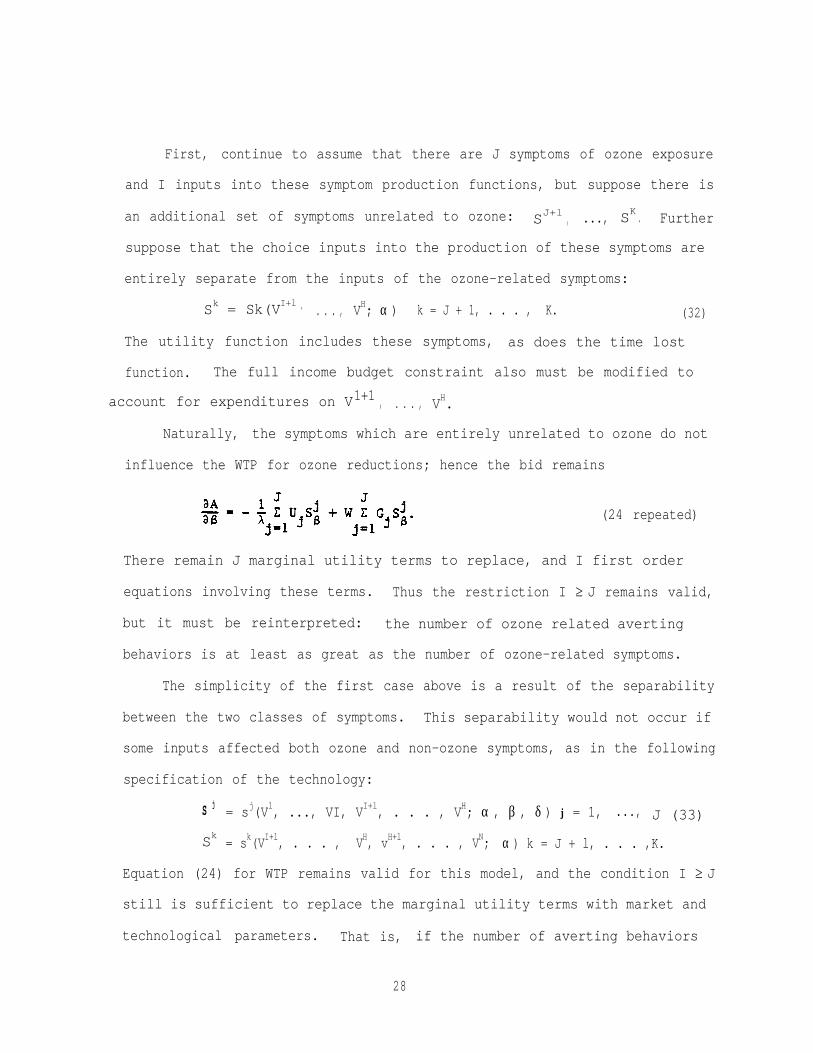
First, continue to assume that there are J symptoms of ozone exposure
and I inputs into these symptom production functions, but suppose there is
an additional set of symptoms unrelated to ozone: SJ+l , ..., SK . Further
suppose that the choice inputs into the production of these symptoms are
entirely separate from the inputs of the ozone-related symptoms:
Sk = Sk(VI+l , . . . , VH; α ) k = J + 1, . . . , K. (32)
The utility function includes these symptoms, as does the time lost
function. The full income budget constraint also must be modified to
account for expenditures on V1+1 , . . . , VH.
Naturally, the symptoms which are entirely unrelated to ozone do not
influence the WTP for ozone reductions; hence the bid remains
(24 repeated)
There remain J marginal utility terms to replace, and I first order
equations involving these terms. Thus the restriction I ≥ J remains valid,
but it must be reinterpreted: the number of ozone related averting
behaviors is at least as great as the number of ozone-related symptoms.
The simplicity of the first case above is a result of the separability
between the two classes of symptoms. This separability would not occur if
some inputs affected both ozone and non-ozone symptoms, as in the following
specification of the technology:
S j= sj(V1, ..., VI, VI+l, . . . , VH; α , β , δ ) j = 1, ..., J (33)
Sk = sk(VI+l, . . . , VH, vH+l, . . . , VN; α ) k = J + l, . . . ,K.
Equation (24) for WTP remains valid for this model, and the condition I ≥ J
still is sufficient to replace the marginal utility terms with market and
technological parameters. That is, if the number of averting behaviors
28
which affect only the ozone symptoms is greater than the number of these
symptoms, then only information on market and technological constraints is
required to estimate the bid. If I < J, however, there remains some hope
of solving for the relevant marginal utility terms. All the first order
conditions on the inputs may be regarded as a system of N equations in the
K unknowns Ul/ λ, . . . , UK/ λ. Thus if these first order conditions hold and
N ≥ K, the marginal utility terms appearing in the bid may be replaced with
market and technological parameters.
In summary, the consideration of two classes of symptoms, namely those
related and those unrelated to ozone, requires only a slight modification
of the conclusions of the previous section. All that is needed to estimate
the bid is information on the market and technological constraints facing
the individual, if (1) first order conditions hold, and one of the
following: (2) the number of. averting behaviors affecting only
ozone-related symptoms is at least as great as the number of ozone-related
symptoms, or (3) the total number of averting behaviors is at least as
great as the total number of symptoms.
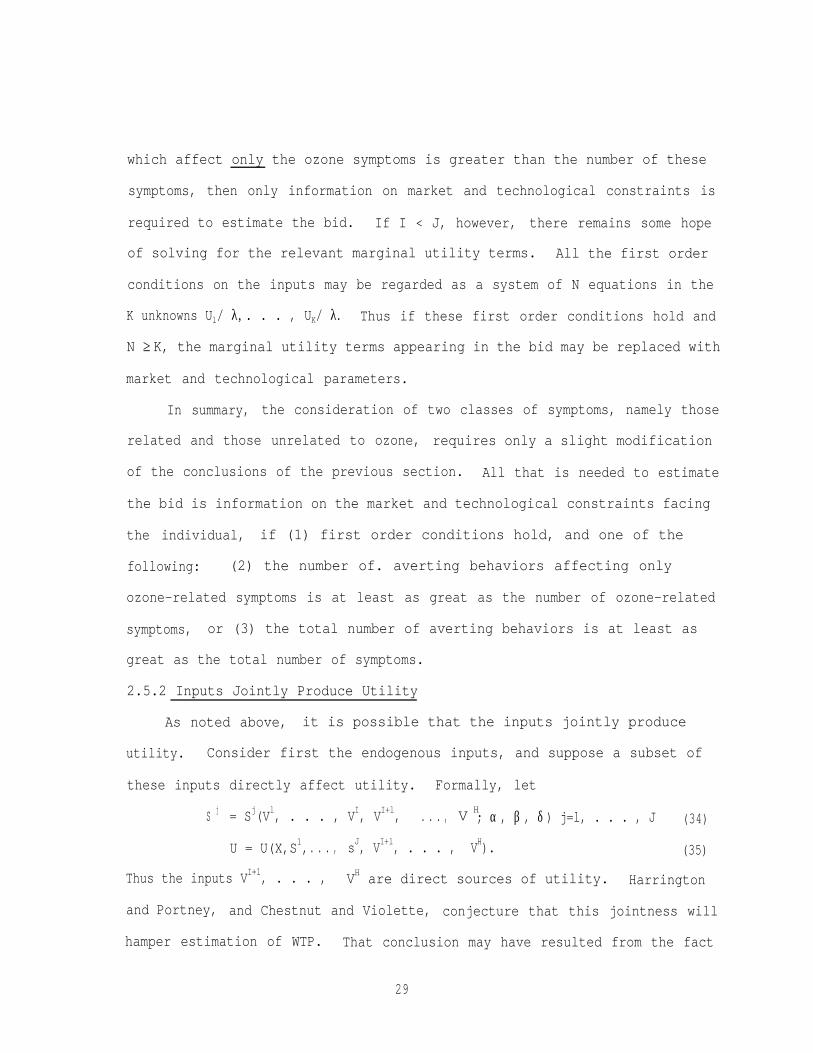
2.5.2 Inputs Jointly Produce Utility
As noted above, it is possible that the inputs jointly produce
utility. Consider first the endogenous inputs, and suppose a subset of
U = U(X,S1,
these inputs directly affect utility. Formally, let
S j = Sj(Vl, . . . , VI, VI+l, . . . , V H; α , β , δ ) j=l, . . . , J (34)
. . . ,
Thus the inputs VI+1, . . . ,
sJ, VI+l, . . . , VH). (35)
VH are direct sources of utility. Harrington
and Portney, and Chestnut and Violette, conjecture that this jointness will
hamper estimation of WTP. That conclusion may have resulted from the fact
29
that there was one averting behavior and one output in the model those
authors considered. In such a model, if the averting behavior entered the
utility function, it would in fact be impossible to eliminate the marginal
utility terms from the bid. In the more general system of equations (34)
and (35), however, this need not be the case.
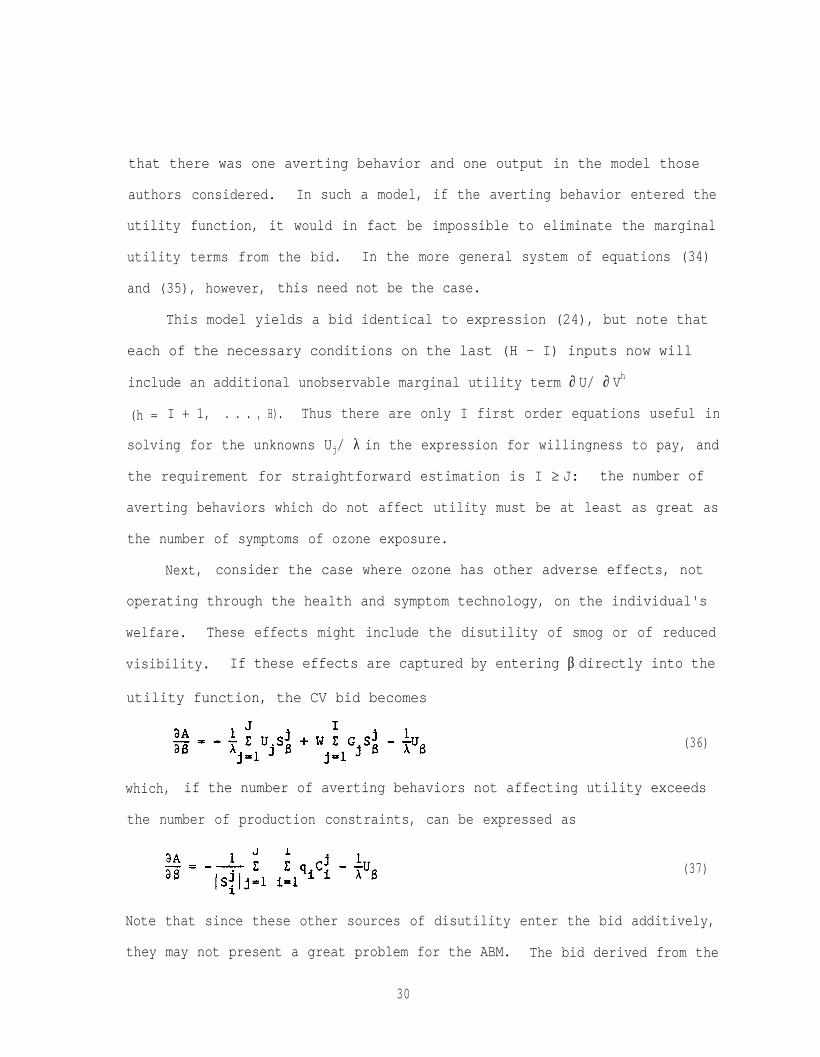
This model yields a bid identical to expression (24), but note that
each of the necessary conditions on the last (H - I) inputs now will
include an additional unobservable marginal utility term ∂ U/ ∂ Vh
(h = I + 1, . . . , H). Thus there are only I first order equations useful in
solving for the unknowns Uj/ λ in the expression for willingness to pay, and
the requirement for straightforward estimation is I ≥ J: the number of
averting behaviors which do not affect utility must be at least as great as
the number of symptoms of ozone exposure.
Next, consider the case where ozone has other adverse effects, not
operating through the health and symptom technology, on the individual's
welfare. These effects might include the disutility of smog or of reduced
visibility. If these effects are captured by entering β directly into the
utility function, the CV bid becomes
(36)
which, if the number of averting behaviors not affecting utility exceeds
the number of production constraints, can be expressed as
(37)
Note that since these other sources of disutility enter the bid additively,
they may not present a great problem for the ABM. The bid derived from the
30

ABM can be interpreted as the marginal value of the health benefits of
reduced ambient ozone, which may be added to other types of benefits to the
consumer. If, however, health effects were not separable from these other
effects of ozone, as would be the case if the perception of smog or reduced
visibility were an output which could be avoided in some of the same ways
that the health symptoms of ozone exposure are avoided, by staying indoors
or leaving town, for instance, then these outputs are produced jointly with
the health and symptom outputs of ozone. Ignoring these outputs amounts to
a misspecification of the model and of WTP, because the optimal choice of
averting inputs is not based solely on health considerations, as the model
would indicate.
2.5.3 Labor-Leisure Substitutions
For those who are able, to some extent, to choose their hours of work,
a possible averting behavior is a change in the allocation of time between
labor and leisure. For example, those who work in air conditioned or other
relatively pollution-free environments might choose to substitute labor for
leisure if ozone levels increased. Presumably, such substitutions would be
made in order to maximize utility and as a result, like all other optimal
responses to ozone, these effects would not appear in the bid. This can be
demonstrated directly by modifying the basic model to allow leisure time to
enter the utility function, or by making time an input into the production
functions; the derivation, however, is omitted.
2.6. CONCLUSIONS
This chapter began with a consideration of the nature of averting
behavior. It was found that a useful definition equates averting behaviors
with changes in choice variables in response to changes in pollution
31

levels. Next, existing averting behavior models were reviewed and
generalized to allow for multiple inputs and outputs. The purpose of the
chapter was to determine the conditions under which the WTP for reduced
ozone levels would be a function of market and technological parameters, so
that estimation of WTP would be relatively straightforward. These
conditions vary slightly according to the nature of the model, but they may
be summarized as follows. If the first order conditions on the health and
symptom inputs hold, and if the number of averting behaviors which affect
only ozone-related symptoms is at least as great as the number of health
and symptom outputs, then WTP will be a function only of market and
technological parameters. If the former number exceeds the latter, the
model contains additional information which may be used to increase the
efficiency of estimation or to test the model.
32

ENDNOTES TO CHAPTER 2
1. Actually Harrington and Portney define X as expenditures on, rather
than consumption of, other goods.
2. More specifically, there are
I( ) I!J = J!(I - J)!
ways to solve for the bid.
33

CHAPTER 3
DATA COLLECTION AND SAMPLING METHODS
3.1 SOURCE OF SUBJECTS
The population which serves as the source of subjects for this
research is the population studied by Detels et al. (1979, 1981) in the
Chronic Obstructive Respiratory Disease (CORD) study (see also, Rokaw et
al., 1980; and Tashkin et al., 1979). The principal and co-principal
investigators for this project have both participated in the CORD studies
since their inception in 1972; Dean Detels is a co-investigator in the
proposed study.
The CORD study includes approximately 15,000 persons, who were aged 7
and above, at the time of the first mobile lung function laboratory
determinations in the early 1970s. These individuals were residents of a
specific census tract in one of four communities in the Los Angeles area
which were selected because of historical exposure to different levels and
types of air pollution, because of their demographic similarity to each
other (median income, proportion home owners, median age, percent white,
etc.) and because of proximity to an air monitoring station of the South
Coast Air Quality Management District (SCAQMD). All residents of
households in the selected area, exclusive of children under 7 years of age
and individuals physically unable to climb the 10 steps to the laboratory,
were invited to participate in the study. About eighty percent of the
invited residents actually participated in the study.
34

Measurements, including a battery of lung function tests and a
detailed questionnaire on symptoms, smoking, residence and occupational
histories and demographic information, were made in a mobile lung function
laboratory which was located convenient to the population to be studied.
Approximately five years after the first set of measurements in each
community, a second round of measurements was performed. Measurements made
were the same, the questionnaire was modified to update information already
collected. A third visit was made to all communities except Glendora. In
this visit, limited measurements were made on study participants who were
available and willing to come to the mobile laboratory for the measurements
during the few weeks of the study. The four communities and information
about the CORD studies in each are given below.
Burbank (East San Fernando Valley); moderate oxidant pollution; 3,226persons studies in 1973; 2,733 of these in 1978, 1,084 in 1983.
Lancaster (Antelope Valley, edge-of Mohave Desert, higher altitudethan the rest) selected for the study because of "clean air,"Lancaster experienced a rise in oxidant air pollution that is onlyslightly lower than that of Burbank;. 4,584 persons studied in 1973,2,544 of these in 1979, 1,103 in 1982.
Long Beach (coastal community south of Los Angeles, oil drilling andrefineries); particulate and sulfur oxide pollution; 3,797 personsstudies i 1974, 1,828 of these in 1980 and 1,024 in 1983.
Glendora (East San Gabriel Valley); high levels of oxidant pollutionwith some sulfates; 3,858 persons studies in 1977, 2,117 of these in1982.
3.2 SELECTION OF COMMUNITY
Of the four CORD communities, two were selected for inclusion in the
proposed study: Burbank and Glendora. Glendora has much the higher
oxidant pollution levels, though this may be somewhat confounded by the
higher sulfate levels. The Glendora CORD population had its second round
35

of measurements more recently, in 1982. In addition, two other studies of
sensitive individuals (persons with CORD and self-identified pollution
responders") have been performed in Glendora in the last two years.
Burbank has more moderate levels of ozone pollution with less
contamination with sulfates. The second round of measurements was earlier,
in 1978, though the later restudy of available participants was done in
1983. Because the Burbank studies were started five years earlier, the
population is five years older. No additional studies of sensitive
individuals have been done by us.
A panel of scientists (see Appendix D of Gerking et al.) with
investigative experience in health effects of oxidant air pollution
recommended that Glendora be selected, primarily on the basis of the higher
levels of air pollution. The panel suggested that the Glendora pollution
levels offered more "criteria days" and more opportunity to observe more
noticeable health effects.
In the selection of the community, we are endeavoring to obtain
information about a problem that is national in scope, albeit a particular
problem in California. The levels of ozone pollution in Burbank are closer
to those found elsewhere in the country. The levels in Glendora are high
even for the South Coast Air Basin. Relative representativeness would be
sacrificed to obtain more-clearly observable differences.
The frequency of poor air quality in Glendora may also lead to
permanent accommodation on the part of residents, including indoor areas
for physical activity and recreation, thus minimizing the changes in
behavior one might expect in response to high levels of ozone. Residents
of both communities are studied, so that these questions can be addressed.
36

Therefore, with attention to the panel's recommendation, we propose to
use both the Glendora and the Burbank CORD population in this study.
Approximately 150 individuals from Glendora and approximately 100
individuals from Burbank ultimately will be included in the study. By
utilizing residents in both communities, the following advantages are
available:
1)
2)
3)
4)
Burbank levels of air pollution are closer to those possible inother areas of the U.S. outside California, while Glendora offersthe opportunity to study both more frequent and higher levels ofozone pollution.
Burbank levels of air pollution, and the number of exceedancedays, may have invoked less permanent accommodation; theexistence of such permanent accommodation can be betteridentified in Glendora.
The population in Burbank is less politically sensitized to thepresence and problem of air pollution; the averting behaviorsinduced by the politicization in Glendora can be explored.
Use of both communities will allow comparison of same day reportsof individuals at different levels of pollution, thereby avoidingthe compounding effect of time of year which itself could affecttypes of activities independent of pollution.
3.3 SAMPLING
Using the Burbank and Glendora CORD populations, individuals are being
selected for recruitment into the study. Selection is restricted to those
still living in the same census tract in the area, or, if they have moved,
in the same proximity to the air quality monitoring station.
Because of the confounding associated with smoking, only those
individuals who are non-smokers, or who are former smokers who have not
smoked for at least two years, are eligible to participate. It would be
interesting to determine the combined, perhaps synergistic, effects of
ozone exposure and cigarette smoking and perhaps the effect of ozone level
37

on cigarette smoking. However, the sample size proposed for this study is
not sufficiently large for this objective, given the number of important
variables associated with smoking such as number of years smoked, daily
amount of consumption, characteristics of cigarettes used, etc.
Subjects were identified as potentially eligible for recruitment if
they are presently between 25 and 59 years of age. Children will be
excluded as primary respondents because of the problems of interviewing
them on the phone. Age 25 was selected as the lowest level because lung
development is completed by that age, and individuals at that age are more
likely to be settled than younger adults. Age 59 has been selected as the
upper limit so as to restrict the sample to those drawn from the prime
working population.
Because of the economic nature of this study, one additional
eligibility criterion is imposed. All subjects will be household heads
working at least 1600 hours per year at a regular job. A wage rate can be
calculated for such workers from which a value of time can be computed.
That value of time is needed in order to implement the ABM approach
discussed in Section 2.1. The definition of a head of household was that
used in the CORD study: an adult male was considered the head of the
household of a nuclear (or extended) family, if one was present. An adult
female was considered to be the head of the household if an adult male was
not present. (The term "adult" did not include grown children of the
female head of household.)
Sampling was stratified by measures of sensitivity or vulnerability.
Approximately 60 percent of the sample (about 150 persons) will be selected
from the sensitive and vulnerable category, while the remainder of the
38

sample is randomly selected from individuals having normal respiratory
function. Two types of sensitive and vulnerable individuals are considered
in this study:
1) Individuals who regularly engage in outdoor occupational orrecreational activity which results in high minute ventilation(deep and fast breathing). Such individuals are expected to bemore vulnerable to possible adverse effects of air pollution.
2) Individuals who have obstructive respiratory disease (asthma,emphysema, and bronchitis) or who have impaired lung function(FEV less than 70 percent of expected).
The rationale for dividing the sensitive and vulnerable individuals into
these two categories is contained in Gerking et al. (1984, Appendix E).
Approximately 75 persons will be selected in each of these two categories.
Individuals in the first category will be identified using-the background
questionnaire (see Section 3.7). Individuals in the second category are
identified from previous CORD data. Every effort is being made to include
all known diseased or impaired CORD subjects living in Glendora and Burbank
in the study.
3.4 RECRUITMENT
Study participants were recruited, in order, from the sampling lists.
Recruiting for a particular group will be stopped when the desired number
of the group have agreed to participate.
The initial step in recruiting consisted of a letter from Dean Detels
as principal investigator of the CORD study, explaining the new study,
encouraging their participation and explaining that the individual would be
called in the next week regarding the new study.
The second step was a phone call. During this call, the study was
more fully explained, questions were answered, required eligibility
39

criteria were ascertained (non-smoking, still live in the area, working
full time) and agreement to participate was obtained. Following the
agreement, an in-person baseline, interview was scheduled.
Following recruitment, a letter was sent acknowledging the
participant's agreement, and describing the study and the terms of payment.
A copy of this letter, with a return envelope, was included for the subject
to sign, record his or her social security number for payment, and return.
If the copy was not returned by the time of the baseline interview, the
data collector obtained the signature at that time.
Recruitment of subjects will continue until the required group sizes
are completed. To reduce waiting time, recruitment can proceed
simultaneously on enough individuals to fill any specified group. However,
to avoid bias involved in recruiting the "easier" subjects, no one on a
randomized list, beyond the number needed for the group, may be recruited
until a refusal, ineligibility or transfer occurs among those within the
number needed. That is, if 30 persons are needed for a given group,
recruitment may proceed simultaneously on the first 30 persons on the
randomized list. Person number 31 may not be recruited until it is known
that one of the first 30 is not a participant.
Individuals definitely declining to participate on the first phone
call are not contacted further. Their identity is retained only to
preclude further contact in recruitment. Following recruitment, only a
deeply encoded identification number, demographic and other CORD variables,
and the fact of refusal is maintained. This file will be used solely to
characterize non-respondents and refusals. No cross-identification to the
40

CORD files will be possible without the equation of the deep encoding, to
which access is limited to the investigators only.
3.5 PAYMENT OF SUBJECTS
The number of contacts required with this panel of subjects
necessitates paying them if continued participation is to be assured. We
propose to, pay each individual the sum of $45.00 for the full course of
contacts. We anticipate about eight follow-up contacts in addition to the
background interview; hence this payment amounts to $5.00 per contact. If
the subject misses one or more contacts, $5.00 will be deducted from the
$45.00 for each contact missed.
3.6 CORD MEASURES
A great deal of information was collected on each of the potential
study subjects during their two or three contacts with CORD and the mobile
lung function laboratory. As explained above under selection and sampling,
certain of these measures and responses are being used to determine study
eligibility and subgrouping. These include age, sex, smoking -behavior,
physician diagnosed asthma, chronic bronchitis, or emphysema, reported
symptoms and FEVl as a percent of predicted FEVl.
Other CORD measures will be used to determine the frequency and
distribution of responses among these individuals. This information will
be used to estimate possible frequency and distribution in the study.
Also, these variables can be used to characterize those not selected,
refusals and non-respondents in comparison with those who do participate.
CORD data available will be reviewed. Those variables which are not
being repeated in the present study, especially physical measurement
41

including common lung function tests , will be incorporated in the baseline
file for the participants. Similarly, historic information on residence
and occupation and exposure information, such as fuels used in heating and
cooking, will be incorporated.
To the extent possible, transforms, scales and reclassified or reduced
variables will be used, where these will be equally well or better serve
the proposed study, thus protecting the primary cord data for further
analysis by COED investigators. Data collected in the current study which
is useful in the analysis or interpretation of COED data will be shared
with COED investigators.
3.7 BASELINE
Following recruitment, the background survey is administered in the
participant's home. The background survey (see Appendix A) is designed to
collect both baseline and follow-up type data, including: (1) the
respondents baseline health status, (2) typical and recent contacts with
the health care delivery system, (3) leisure-time activities, changes in
those activities, and a direct question about the respondent's averting
behaviors, (4) a checklist of symptoms, (5) a contingent valuation of those
symptoms which were experienced in the two days preceding the day of the
survey,, (6) home environment characteristics, (7) occupational
information, and (8) standard demographic data.
Health status data are collected by repeating the National Heart,
Lung, and Blood Institute symptom and respiratory disease questions. A
medical history is obtained of diseases and medications which may imply a
special sensitivity. Information is collected regarding typical usage of
42
health care facilities along with the associated money and time costs. In
addition, any recent contacts with the health care system are recorded.
Leisure activities and changes in those activities over the two days
preceding the survey data are covered in detail in an attempt to measure
the extent of averting behavior in response to ozone levels. The amount of
time spent outdoors and the number of trips outside the area are included
since changes in these variables also are likely averting behaviors.
Additionally, respondents are asked what, if anything, they do to avoid
exposure to air pollution. This question is included in case some
important averting. responses were overlooked in the design of the survey.
A list of 26 symptoms, including those which may result from ozone
exposure and some which may not, is checked to discover whether the
respondent has ever had these symptoms, and whether he has had them during
the past two days. For each symptom experienced in the past two days, a
contingent valuation question asks the maximum amount of money the
respondent would have been willing to pay to have avoided that symptom on
the day it was experienced.
Characteristics of the home environment include presence and use of
air conditioning, purifying, and filtering (these are also potential
averting responses to increased ozone levels), presence of ozone-producing
devices (ionizers), fuel used for cooking and heating, character and extent
of insulation, extent of traffic within one block of house, and use of air
conditioned cars.
Detailed occupational and demographic information are collected,
including income, education, occupation, industry and characteristics of
the work environment which may affect respiratory health and symptoms.
43

The baseline data collection instrument is included in Appendix A.
This instrument was developed based on experience in previous studies,
literature review, the health and ozone telephone conference mentioned
previously and reviews by experts on the ozone and health relationship as
well as by questionnaire experts. Additionally, the background survey was
pretested extensively in the field.
3.8 FOLLOW-UP
The follow-up survey, included as Appendix B, is designed to collect
at regular intervals much of the same type of information collected in the
baseline instrument. Information will be collected on the subject's
symptoms, work and leisure activities including travel and time spent
outdoors, illness, work loss, and medication used or medical visits. A
contingent valuation questions elicits information regarding willingness to
pay to avoid each symptom experienced during the two day period. In the
course of each interview, the subject will be asked his/her opinion of the
air quality for the day of the call and the previous day.
Each subject will be phoned twice within each calendar month during
the late summer and fall, and once each month thereafter until February,
1986. The calls will be approximately two weeks apart during autumn and
one month apart during the winter. A calling schedule will be computer
designed for each day, to maximize days with ozone exposure and to balance
weekday and weekend reports.
Data will be collected about the day of the call and the previous day.
It is anticipated that if the day before the previous day was a weekend
day, it will be better recalled by the subject than if it were another
weekday. This is because of the change of activity associated with weekend
44

days, which may be different from one another. However, data will always
be collected for the two day period; the day-of-the-week effect will be
accounted for in the analysis.
Data will be collected by study staff specifically trained to use the
instrument. Time of day of collection will range from late afternoon into
the evening and will be specifically negotiated with each individual. At
each contact the data collector will ask if the time is convenient. If it
is not, the data collector will arrange to call back, at another agreed
upon time. Weekend calls will be made on Saturdays during the day, for the
most part. A general idea of a convenient time for calls is obtained at
baseline; at each contact the data collector will first ascertain if the
time is convenient. If it is not the data collector will call back.
In order to complete the study with as little inconvenience to the
subjects as possible, thereby reducing the drop-but rate, we plan to have
the follow-up contact take approximately 20 minutes for data collection.
If the subject has a great deal to report, it may, of course, take longer
to complete. Our experience has been that a data collection contact that
is extended by the subject's information is not regarded as long by that
subject.
Because of the time limitation, standard update items, independent of
the air quality, may be asked only every other month. If a change has
occurred, the time of that change will be ascertained.
3.9 AIR POLLUTION MEASURES
Air quality measures presently are being obtained from two sources:
the monthly print out of daily maximum hourly and average hourly values of
ozone and other pollutant specific measures from the South Coast Air
45

Quality Measurement District and the full tape of measures from the
California Air Resources Board. The Los Angeles Times reports the levels
of three pollutants from stations around the country each day, showing
clean air standard level, and first and second stage alerts. The Azusa
station, within a mile of which our participants live, is located
between Pasadena and Riverside and, because of topography, is probably
worse than either. (Informal daily survey shows that this July and August,
despite 'unusually low temperatures, a large proportion of the days has
exceeded the clean air standard. First stage alerts have not been
uncommon.)
The pollution measure used will be the maximum hourly average for
pollutants measured on a continuous basis , and the most recent measurement
for those measured over a time period. This initial information will allow
planning for calls in the telephone follow-up for the evening and the next
day as well as providing an initial air quality input into the data file.
The pollution exposure data matched to the individuals in the sample will
take account of the differing locations where they live and work as well as
the relative amounts of time spent in each location.
Data tapes of air monitoring station measurements will be obtained as
they become available on a quarterly basis. These tapes include additional
information, are "cleaned" data and are, of course, computer readable.
Data from these tapes will be identical with published air quality data.
Cleaning and appropriate adjustment may result in some deviation from the
daily and monthly figures described above. These data tapes will be used
as the source of air pollution information in the major analysis.
46
While the primary focus of the present study is on ozone as a
pollutant, the free living population in any area-is exposed to other
pollutants at the same time. There may be a combination of effects from
these pollutants. It is, therefore, necessary to include other pollutants
in the analysis. All measured pollutants will be examined for inclusion,
which will be based on the inter-correlation of the pollutants in time and
the potential confounding resulting from similar health effects associated
with different pollutants.
3.10 DATA MANAGEMENT
After the data are collected, the data collection instruments will be
visually checked for completeness to identify any problems in a timely
manner, Any necessary coding and registering of responses will be
completed at that time. All forms will be key entered and will be 100
percent verified. Subsequent to key entry, records will be entered into
the mainframe computer where initial computer editing will be accomplished
including range and consistency checks.
Errors discovered through any of these procedures will be referred
back to the data collector, checked against the original instruments or
checked with the respondent as appropriate. Unresolved, unacceptable
values will be declared missing through error.
Newly collected data will be added to already collected data on the
same subjects through computer linkage programs. Thus, the initial data
file will include CORD and recruitment data; baseline data will be
concatenated with it, as will monthly follow-up data, etc. Following
linkage, consistency checks across time will be performed.
47

Subfiles of the main data tapes, including scales, transformation,
specifically limited numbers of data items or subsets of subjects, will be
created for analysis as needed.
A special subfile will be created and maintained for study management.
Subject contact will be managed by computer. Lists of subjects to be
contacted in a given time period, subjects overdue for contact, subjects
requiring contact on some particular type of day, etc. will be printed out.
This file will be separated from the main file and will include name,
address, phone number and other identifiers. These confidential data will
protected by a deeply encoded identification number, thus preventing
linkage of identifiers to personal data by unauthorized persons.
48

CHAPTER 4
A VERY PRELIMINARY ANALYSIS
Summarized here are some very preliminary results from the baseline
questionnaire. The baseline data collection effort, as of August 26, was
not quite complete in Glendora and was about to begin in Burbank. The
first follow-up questionnaires were administered during the last week in
August; however, no data from them are available for report here.
A word is in order about the total number of observations on which
each of the results tables is based, which disconcertingly changes from
table to table. This is because of the very preliminary state of the data,
and the different data management status of the baseline forms,
Information derived from field records of completions is the most complete;
information obtained by tallying completed forms is next; and information
from computer runs of temporary data sets is necessarily the least complete
(though probably the most interesting). All data are based on at least 120
questionnaires.
Table 1 shows the field status of the project as of August 26. As
shown, 136 baseline interviews had been completed and 13 additional
interviews have been scheduled. The number of persons refusing to
participate (13) in the study is quite low and is less than 10 percent of
the number of completed interviews. Among 124 respondents whose completed
questionnaires have been examined, all are Caucasian as is most of the
Glendora population. There are 12 female household heads in the group,
49

again similar to the distribution of household heads by gender in that
population.
As previously indicated, all persons in the Glendora CORD population
known to have asthma, bronchitis, or emphysema and/or have impaired lung
function (FEV, less than 70 percent of expected) were invited to
TABLE 1. STATUS OF RECRUITMENT AND COMPLETION OF BASELINEINTERVIEWS; GLENDORA, AUGUST 26, 1985
BASELINE INTERVIEWS NUMBER
COMPLETEDSCHEDULEDSTILL ATTEMPTING TO CONTACTREFUSED TO PARTICIPATEINELIGIBLE:
MOVED FROM AREARETIREDDECEASED
136132213
4732
participate in the study. At present, there are at least 28 such
individuals in the sample: 16 individuals with asthma, 1 with chronic
bronchitis, 2 with emphysema, 8 with asthma and bronchitis or emphysema,
and 1 with bronchitis and emphysema. All of these individuals were
identified using data from previous CORD studies. A few additional
individuals with diseased or otherwise impaired lung function may be
identified through the baseline interview. Such an identification has not
yet been completed as joint analysis of a number of questionnaire items
must be performed. In any event, every effort will continue to be made to
include individuals in this category in order that they represent 30
percent of the total sample. Additionally, a preliminary tally of the
leisure activities questions reveals that there are 39 persons who report
regularly exercising heavily or for long duration out of doors. Therefore,
50

since 28.6 percent of the current sample is composed of those who regularly
exercise heavily, no special steps apparently are-necessary to identify
persons in this category.
Of the 26 health symptoms considered in the baseline questionnaire,
not all can be linked to ozone exposure on the basis of medical evidence.
A panel of experts on the health effects of ozone (see Gerking et al.,
Appendix D) were asked to assess the likelihood that these symptoms were
associated with ozone exposure. These likelihoods are expressed in three
categories: (1) definitely associated (D), probably associated, (P), and
not associated (N). This classification scheme is applied to the list of
26 symptoms shown in Table 2. That table also shows frequency of reports
of each symptom as tabulated from the baseline questionnaires. The
symptoms are ordered by frequency of occurrence, rather than the order in
which they were asked. Eye irritation, as might be expected, is first,
headache is second and tiredness third. Of 124 completed baseline
questionnaires, 51 (or 41 percent) respondents reported having one or more
symptoms. Of course, not all of the symptoms are ozone specific. There
were 73 reports of symptoms regarded as definite among the 174 reports (by
51 persons) and 51 of the 174 reports involved symptoms regarded as
non-related.
51

TABLE 2. FREQUENCY OF OCCURRENCE OF SYMPTOMS;GLENDORA, AUGUST 26, 1985
RELATEDNESS TO OZONE* SYMPTOM FREQUENCY
(P)(D)(N)(D)(P)(N)(P)(D)(N)(D)(D)(D)(N)(D)(D)(N)(P)(P)(N)(D)(P)(N)(N)(P)(P)
1 Eye irritation 1715 Headache 1616 Tiredness 1413 Cough 129 Runny nose 123 Eyes sens. to br. 1t. 12
14 Phlegm 1124 Chest tight 95 Voice husky 96 Sinus pain 8
12 Out of breath 74 Irritated throat 72 Not see as well 7
23 Wheezing 611 Cannot breath deep 622 Ringing/ears 48 Dry nose 4
26 Swollen glands 319 Nausea 310 Pain w/deep breath 225 Fast heart beat 1
21 Pain in ears 120 Chills/Fever 118 Spaced-out 117 Dizziness 1
*D = DefiniteP = ProbableN = Not Related
52

REFERENCES
Becker, G. S. 1965. "A Theory of the Allocation of Time," Economic
Journal 75 (September): 493-517.
Courant, P. N. and R. C. Porter. 1981. "Averting Expenditure and the Cost
of Pollution," Journal of Environmental Economics and Management 8
(December): 321-329.
Cropper, M. L. 1981. "Measuring the Benefits from Reduced Morbidity,"
American Economic Review 71 (May): 235-240.
Detels, R., J. Sayre, A. Coulson, et al. 1981. "The UCLA Population
Studies of Chronic Obstructive Respiratory Disease IV. Respiratory
Effects of Long Term Exposure to Photochemical Oxidants . . ." Am Rev.
Respir Dis 124: 673-80.
Detels, R., S. Rokaw, A. Coulson, D. Tashkin, J. Sayre and F. Massey, Jr.
1979. "The UCLA Population Studies of Chronic Obstructive Respiratory
Disease I. Methodology," American Journal of Epidemiology 109: 33-58.
Gerking, S. and L. Stanley. 1986. "An Economic Analysis of Air Pollution
and Health: The. Case of St. Louis," Review of Economics and
Statistics (forthcoming).
Gerking, S., A. Coulson, W. Schulze, D. Tashkin, D. Anderson, M. Dickie,
and D. Brookshire. 1984. "Estimating Benefits of Reducing Community
Low-Level Ozone Exposure: A Feasibility Study," Experimental Methods
for Assessing Environmental Benefits, Volume 3, U.S. Environmental
Protection Agency, Washington, D.C.
53

Grossman, M. 1972. "On the Concept of Health Capital and the Demand for
Health," Journal of Political Economy 80 (March): 223-255.
Harford, J. D. 1984. 'Averting Behavior and the Benefits of Reduced
Soiling," Journal of Environmental Economics and Management 11
(September): 296-302.
Harrington, W. and P. R. Portney, 'Valuing the Benefits of Improved Human
Health," manuscript, Resources for the Future, Washington, D.C.
Loehman, E., S. Berg, A. Arroyo, R. Hedinger, J. Schwartz, M. Shaw, R.
Fahien, V. De, R. Fishe, D. Rio, W. Rossley, and A. Green. 1979.
"Distributional Analysis of Regional Benefits and Cost of Air Quality
Control," Journal of Environmental Economics and Management 67
(September): 222-243.
Pollack, R. A. and M. L. Wachter.
Production Function Approach
1975. 'The Relevance of the Household
and Its Implications for the Allocation
of Time," Journal of Political Economy 83 (April): 255-277.
Portney, P. and J. Mullahy. 1983. Ambient Ozone and Human Health: An
Epidemiological Analysis (Washington, D.C.: Resources for the
Future).
Rokaw, S., R. Detels, A. Coulson, et al. 1980. "The UCLA Population
Studies of Chronic Obstructive Respiratory Disease 3: Comparison of
Pulmonary Function in Three Communities Exposed to Photochemical
Oxidants," Chest 78: 252-262.
Silberberg, E. 1971. "The Le Chatelier Principle as a Corallary to a
Generalized Envelope Theorem," Journal of Economic Theory 3 (June):
146-155.
54

Silberberg, E. 1973. "A Revision of Comparative Statics Methodology in
Economics, or How to Do Comparative Statics-on the Back of an
Envelope,w Journal of Economic Theory 7 (February): 159-172.
Tashkin, D., R. Detels, and A. Coulson. 1979. "The UCLA Population
Studies of Chronic Obstructive Respiratory Disease. Determination of
Reliability and Estimation of Sensitivity," Environ Res 20: 403-424.
Watson, W. D. and J. A. Jaksch. 1982. "Air Pollution: Household Soiling
and Consumer Welfare Losses," Journal of Environmental Economics and
Management 9 (September); 248-262.
55

R.I.D.#:
APPENDIX A
BACKGROUND QUESTIONNAIRE
RESPONDENTSRESPONDENTS
RESPONDENTS
NAME:PHONE #: /
area codeADDRESS
CONFIDENTIAL
city zip codeINTERVIEWER: I.D.#:
DATE
1.
DAY TIME
AMPM
RESULT COMMENTS
2.
3.
4.
5.
6.
7.
8.
9.
10.
AMPM
AMPM
AMPM
AMPM
AMPM
AMPM
AMPM
AMPM
AMPM
11. AMPM
12. AMPM
56

Good morning (afternoon, evening). I'm ( ...) from theWe're conducting a survey for the , which deals with
(i) how air pollution might affect you
(ii) how you might change your daily activities to avoid exposureon bad days.
You may recall that your household received a (letter/phone call) aboutthis very important study. Please be assured that all information providedis confidential and your name will not be identified with the study.
57

First, I would like to ask you some questions about your health.
1. In general, would you say that your health is:
Excellent . . . . . . . . . . . 1Good . . . . . . . . . . . . . . 2Fair, or . . . . . . . . . . . . 3Poor? . . . . . . . . . . . . . 4
2. Have you ever been told by a doctor that you had asthma?
YES. . . ASK A. . . . . . . .lNO . . . SKIP TO Q3 . . . . . 2
A.
B.
C.
How old were you when you were first told that you had asthma?
RECORD AGE:
Have you taken medication for it during the past year?
YES . . . . . . . . . . . . . . 1NO . . . . . . . . . . . . . . . 2
When was your last asthma attack?
RECORD /MONTH YEAR
IF LAST ATTACK WITH THE PAST 2 YEARS . . . . . . . ASK D
IF LAST ATTACK 3 YEARS OR MORE . . . . . . . SKIP TO Q3
D. Do you know what brings on your attacks? PROBE
3. Have you ever been told by a doctor that you had chronic bronchitis?
YES ASK A . . . . . . . . . lNO . . . SKIP TO Q4 . . . . . . 2
A. How old were you when you were first told you had chronicbronchitis?
RECORD AGE:
58
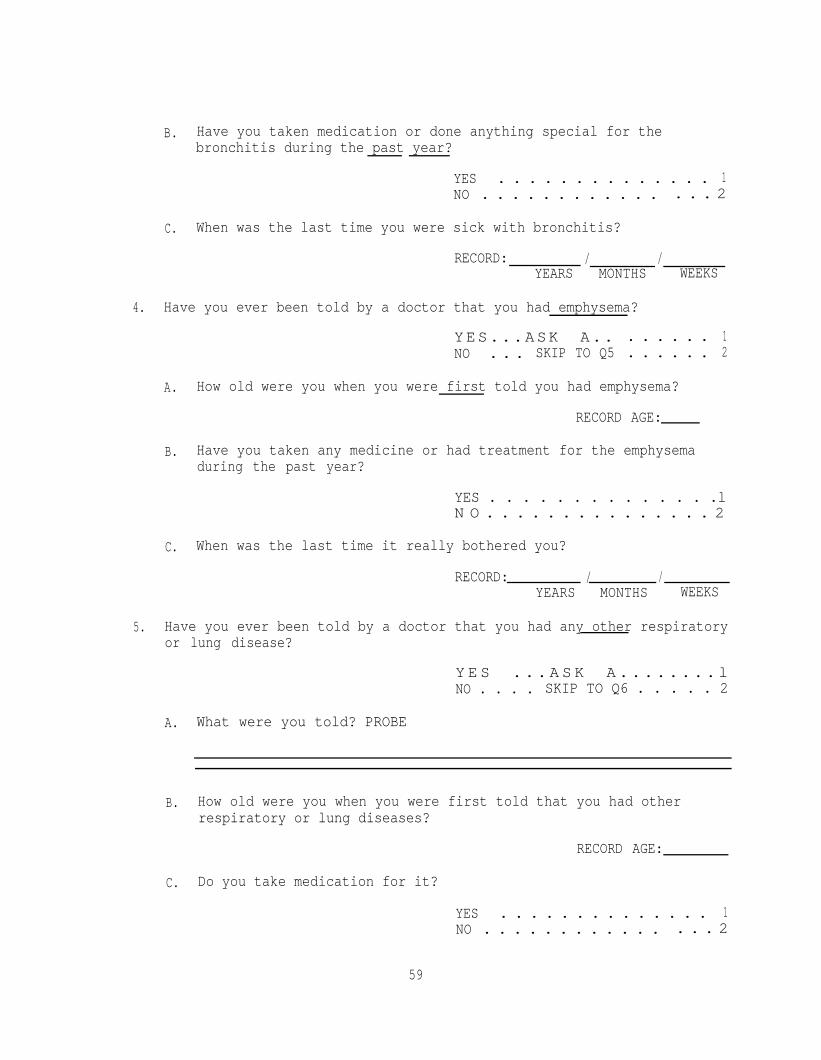
B. Have you taken medication or done anything special for thebronchitis during the past year?
YES . . . . . . . . . . . . . . 1NO . . . . . . . . . . . . . . . 2
C. When was the last time you were sick with bronchitis?
RECORD: / /YEARS MONTHS WEEKS
4. Have you ever been told by a doctor that you had emphysema?
YES...ASK A.. . . . . . . 1NO . . . SKIP TO Q5 . . . . . . 2
A. How old were you when you were first told you had emphysema?
RECORD AGE:
B. Have you taken any medicine or had treatment for the emphysemaduring the past year?
YES . . . . . . . . . . . . . .lN O . . . . . . . . . . . . . . . 2
C. When was the last time it really bothered you?
RECORD: / /YEARS MONTHS WEEKS
5. Have you ever been told by a doctor that you had any other respiratoryor lung disease?
Y E S . . . A S K A . . . . . . . . lNO . . . . SKIP TO Q6 . . . . . 2
A. What were you told? PROBE
B. How old were you when you were first told that you had otherrespiratory or lung diseases?
RECORD AGE:
C. Do you take medication for it?
YES . . . . . . . . . . . . . . 1NO . . . . . . . . . . . . . . . 2
59
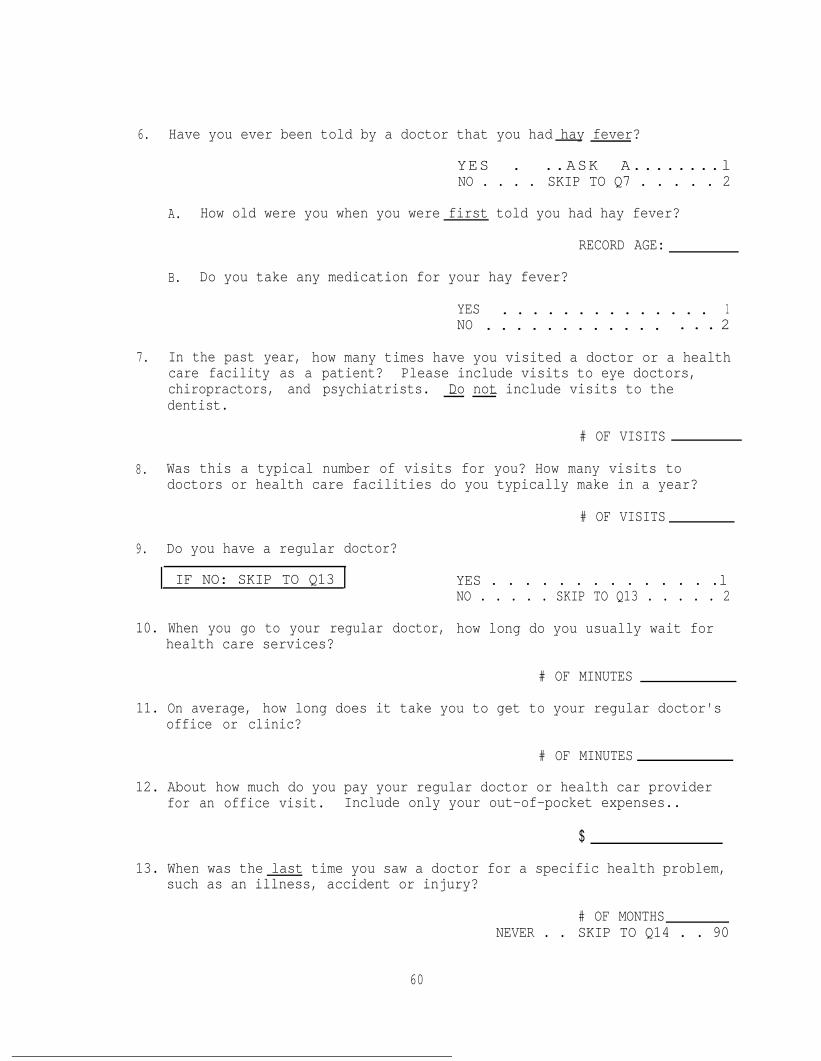
6. Have you ever been told by a doctor that you had hay fever?
YES . ..ASK A........lNO . . . . SKIP TO Q7 . . . . . 2
A. How old were you when you were first told you had hay fever?
RECORD AGE:
B. Do you take any medication for your hay fever?
YES . . . . . . . . . . . . . . 1NO . . . . . . . . . . . . . . . 2
7. In the past year, how many times have you visited a doctor or a healthcare facility as a patient? Please include visits to eye doctors,chiropractors, and psychiatrists. Do not include visits to the- -dentist.
# OF VISITS
8. Was this a typical number of visits for you? How many visits todoctors or health care facilities do you typically make in a year?
# OF VISITS
9. Do you have a regular doctor?
IF NO: SKIP TO Q13 YES . . . . . . . . . . . . . .lNO . . . . . SKIP TO Q13 . . . . . 2
10. When you go to your regular doctor, how long do you usually wait forhealth care services?
# OF MINUTES
11. On average, how long does it take you to get to your regular doctor'soffice or clinic?
# OF MINUTES
12. About how much do you pay your regular doctor or health car providerfor an office visit. Include only your out-of-pocket expenses..
$
13. When was the last time you saw a doctor for a specific health problem,such as an illness, accident or injury?
# OF MONTHSNEVER . . SKIP TO Q14 . . 90
60

14. During the last year, since , 1984, were you in the hospital as apatient overnight or longer? Do not include maternity, accident orinjury.
YES . . .ASK A . . . . . . . .lNO . . . SKIP TO Ql5 . . . . . 2
A. How many times, separated by at least one day, were you admitted toa hospital to stay overnight or longer, since , 1984. Again,do not include maternity, accident or injury.
B. What was the matter? RECORD UP TO THREE MENTIONS.
1.2.3.
Now some questions about your respiratory health.
A. What was the problem?
IF R SAW A DOCTOR, YESTERDAY OR DAY BEFORE YESTERDAY ASK:
(a) Where did you go? DOCTOR'S OFFICE . . . . . . . . 1EMERGENCY . . . . . . . . . . . 1HOSPITAL . . . . . . . . . . . . 2CALLED DOCTOR . . . . . . . . . 3
(b) How much time did it take to get this medical attention?
(c) What will be your out-of-pocket expense for this medicalattention?
$
RECORD #:
15. Do you usually cough first thing in the morning in bad weather?
YES . . . . . . . . . . . . . . 1NO . . . . . . . . . . . . . . . 2
61

16. Do you usually cough at other times during the day or night in badweather?
YES . . . . . . . . . . . . . .lN O . . . . . . . . . . . . . . . 2
17. Do you cough on most days for as much as 3 months of the year?
YES . . . . . . . . . . . . . . 1NO . . . . . . . . . . . . . . . 2
IF COUGH IS REPORTED (Q15 - Q17) . . . . ASK Q18
IF NO COUGH IS REPORTED (Ql5 - Q17) . . ASK Ql9
18. How long have you had the cough -- about how many years?
# YEARS
19. Do you usually bring up phlegm, sputum or mucous from your chest firstthing in the morning in bad weather?
YES . . . . . . . . . . . . . . 1NO . . . . . . . . . . . . . . . 2
20. Do you usually bring up phlegm, sputum or mucous from your chest atother times during the day or night in bad weather?
YES . . . . . . . . . . . . . . 1NO . . . . . . . . . . . . . . . . 2
21. Do you bring up phlegm, sputum or mucous from your chest on most daysfor as much as 3 months of the year?
YES . . . . . . . . . . . . . . 1NO . . . . . . . . . . . . . . . 2
IF "YES" TO ANY Ql9 - Q21 . . . . . ASK Q22IF "NO" TO ALL Q19 - Q21 . . . . . SKIP TO
INSTRUCTION BELOW Q22
22. How long have you raised phlegm, sputum or mucous -- about how manyyears?
# YEARS
62

IF COUGH OR PHLEGM (MUCOUS) REPORTED Ql5 - Q21 . . ASK Q23IF NEITHER REPORTED Ql5 - Q21 . . . . . . . . SKIP TO Q24
23. Does most of this coughing and/or phlegm come during one season of theyear?
YES...ASK A . . . . . . . .lNO . . . SKIP TO Q24 . . . . . 2
A. When? CODE ALL MENTIONS
S U M M E R . . . . . . . . . . . . . 1FALL . . . . . . . . . . . . . . 2WINTER . . . . . . . . . . . . . 3SPRING . . . . . . . . . . . . . 4ALL YEAR . . . . . . . . . . . . 5
24. In the past three years, have you had a period of increased cough andphlegm lasting for three weeks or more?- -
YES . . .ASK A . . . . . . . .1NO . . . SKIP TO Q25 . . . . . 2
A. Have you had more than one such three-week period?
YES . . . . . . . . . . . . . . 1NO . . . . . . . . . . . . . . . 2
25. Does your breathing ever sound wheezing or whistling?
YES . . .ASK A . . . . . . . .lNO . . . SKIP TO Q26 . . . . . 2
A. On how many days has this happened during the past year?
RECORD DAYS:DON'T KNOW . . . . . 98
26. Have you ever had attacks of shortness of breath with wheezing?
YES . . . . . . . . . . . . . . 1NO . . . . . . . . . . . . . . . 2
27. Are you troubled by shortness of breath when hurrying on level groundor walking up a slight hill?
YES . . .ASK A . . . . . . . . .lNO . . . SKIP TO Q28 . . . . . 2
63

A. Do you get short of breath walking with other people of your ownage on level ground?
YES . . . . . . . . . . . . . . 1NO . . . . . . . . . . . . . . . 2
B. Do you have to stop for breath when walking at your own pace onlevel ground?
YES . . . . . . . . . . . . . . 1NO . . . . . . . . . . . . . . . 2
28. Do you suddenly become short of breath when taking it easy (notexercising)?
YES . . . ASK A . . . . . . . .lNO . . . SKIP TO Q29 . . . . . 2
A. How many days did this happen during the past year?
RECORD DAYSDON'T KNOW . . . . . 98
29. During the past 3 years how much trouble have you had with illnessessuch as chest colds, bronchitis or pneumonia? Would you say:
A LOTSOME, OR . .
.. ASK A. . . . . .l
.ASK A. . . . . .2VERY LITTLE? . SKIP TO Q30 . . . 3
A. During the past 3 years, how often were you unable to do yourusual activities because of illness such as chest colds,bronchitis or pneumonia?
RECORD DAYS
Now I'd like to ask you about the things you do regularly in your leisuretime.
30. A. What were your regular leisure or non-work related activities inthe past month? list - (PROBE)
1.2.3.4.5.
(If more than 5, use the five that the respondent does most often)
64

Activity #1
B. About how many hours per week (including transportation) didyou ?
C. How many times a week did you ?
D. Where do you usually ?(What area or community)
For "AT HOME" code "1"For "GLENDORA" or "EAST SAN GABRIEL VALLEY" code "2"All others leave blank
E. What is the usual time of day when you do this activity ?
Morning . . . . . . 1 yes - 2 noAfternoon . . . . . 1 yes - 2 noEvening . . . . . . 1 yes - 2 noNight . . . . . . . 1 yes - 2 noNo particular time 1 yes - 2 no
F. What days of the week did you usually do this activity ?
Monday . . . . . . 1 yes - 2 noTuesday . . . . . . 1 yes - 2 noWednesday . . . . . 1 yes - 2 noThursday . . . . . 1 yes - 2 noFriday . . . . . . 1 yes - 2 noSaturday . . . . . 1 yes - 2 noSunday . . . . . . 1 yes - 2 no
G. What does it usually cost to do this activity (includingtransportation) per month?
each time?
H. How much of the time did you outdoors?
1 . . . . . . . . . Always2 . . . . . . . . . Most of the time3 . . . . . . . . . Half of the time4 . . . . . . . . . Some of the time5 . . . . . . . . . Never
(Interviewer - for questions I thru J record the response for "yesterday"in the appropriate column then repeat the questions for "day beforeyesterday".)
65

I. How many hours did you Yesterday Day BeforeYesterday/Day Before Yesterday? Yesterday
(Interviewer - if zero GO TO J)
i. What did it cost you toYesterday/Day Before Yesterday?
ii. Did you put significantly less effort than planned or usualinto Yesterday/Day Before Yesterday?
1 yes - 2 no 1 yes - 2 no
iii. Did you change the planned or usual time of day ofYesterday/Day Before Yesterday?
1 yes - 2 no 1 yes - 2 no
iv. Did you change the planned or usual location ofYesterday/Day Before Yesterday?
1 yes - 2 no 1 yes - 2 no
J. How many hours had you planned to Yesterday Day BeforeYesterday
Activity #2
B. About how many hours per week (including transportation) didyou ?
C. How many times a week did you ?
D. Where do you usually ?(What area or community)
For “AT HOME” code “1”For “GLENDORA” or “EAST SAN GABRIEL VALLEY” code “2”All others leave blank
E. What is the usual time of day when you do this activity ?
Morning . . . . . . 1 yes - 2 noAfternoon . . . . . 1 yes - 2 noEvening . . . . . . 1 yes - 2 noNight . . . . . . . 1 yes - 2 noNo particular time 1 yes - 2 no
66

F. What days of the week did you usually do this activity ?
Monday . . . . . . 1 yes - 2 noTuesday . . . . . . 1 yes - 2 noWednesday . . . . . . 1 yes - 2 noThursday . . . . . 1 yes - 2 noFriday . . . . . . 1 yes - 2 noSaturday . . . . . 1 yes - 2 noSunday . . . . . . 1 yes - 2 noNo particular day . 1 yes - 2 no
G. What does it usually cost to do this activity (includingtransportation) per month ?
each time ?
H. How much of the time did you outdoors?
1 . . . . . . . . . Always2 . . . . . . . . . Most of the time3 . . . . . . . . . Half of the time4 . . . . . . . . . Some of the time5 . . . . . . . . . Never
(Interviewer - for questions I thru J record the response for "yesterday"in the appropriate column then repeat the questions for "day beforeyesterday".)
I. How many hours did you
(Interviewer - if zero GO TO J)
Yesterday Day BeforeYesterday
i. What did it cost you toYesterday/Day Before Yesterday?
ii. Did you put significantly less effort than planned or usualinto Yesterday/Day Before Yesterday?
1 yes - 2 no 1 yes - 2 no
iii. Did you change the planned or usual time of day ofYesterday/Day Before Yesterday?
1 yes - 2 no 1 yes - 2 no
iv. Did you change the planned or usual location ofYesterday/Day Before Yesterday?
1 yes - 2 no 1 yes - 2 no
J. How many hours had you planned to Yesterday Day BeforeYesterday
67

Activity #3
B. About how many hours per week (including transportation) didyou ?
C. How many times a week did you ?
D. Where do you usually ?(What area or community)
For "AT HOME: code "1"For "GLENDORA" or "EAST SAN GABRIEL VALLEY" code "2"All others leave blank
E. What is the usual time of day when you did this activity ?
Morning . . . . . . I yes - 2 noAfternoon . . . . . 1 yes - 2 noEvening . . . . . . 1 yes - 2 noNight . . . . . . . 1 yes - 2 noNo particular time 1 yes - 2 no
F. What days of the week did you usually do this activity ?
Monday . . . . . . 1 yes - 2 noTuesday . . . . . . 1 yes - 2 noWednesday . . . . . 1 yes - 2 noThursday . . . . . 1 yes - 2 noFriday . . . . . . 1 yes - 2 noSaturday . . . . . 1 yes - 2 noSunday . . . . . . 1 yes - 2 noNo particular day . 1 yes - 2 no
G. What does it usually cost to do this activity (includingtransportation) per month ?
each time ?
H. How much of the time did you outdoors?
1 . . . . . . . . . Always2 . . . . . . . . . Most of the time3 . . . . . . . . . Half of the time4 . . . . . . . . . Some of the time5 . . . . . . . . . Never
(Interviewer - for questions I thru J record the response for "yesterday"in the appropriate column then repeat the questions for "day beforeyesterday".)
68

I. How many hours did you Yesterday Day BeforeYesterday/Day Before Yesterday? Yesterday
(Interviewer - if zero GO TO J)
i. What did it cost you toYesterday/Day Before Yesterday?
ii. Did you put significantly less effort than planned or usualinto Yesterday/Day Before Yesterday?
1 yes - 2 no 1 yes - 2 no
iii. Did you change the planned or usual time of day ofYesterday/Day Before Yesterday?
1 yes - 2 no 1 yes - 2 no
IV. Did you change the planned or usual location ofYesterday/Day Before Yesterday?
1 yes - 2 no 1 yes -2 no
J. How many hours had you planned to Yesterday Day BeforeYesterday
31. Regarding yesterday and the day before , were there any other majorchanges in the activities you had planned?
(If Yes) What were they?
YES . . . . . . . . . . . . 1NO . . . . . . . . . . . . . 2
32. Are there any activities that you do regularly most of the year but notin the summer (June-September)?
(If Yes) What?
YES . . . . . . . . . . . . 1NO . . . . . . . . . . . . 2
69

Why not in summer? Is it due to heat, humidity, smog or somethingother than weather?
33. A.
B.
C.
D.
Heat . . . . . . 1 yes - 2 noHumidity . . . . 1 yes - 2 noSmog . . . . . . 1 yes - 2 noOther . . . . . 1 yes - 2 no
How many hours do you spend outdoors on a typical
Workday hoursNonworkday hours
Did you spend the usual amount of time outside?
Yesterday Yes . . . . . . 1Day Before No . . ASK C . 2
How many hours did you spend outdoors?
YesterdayDay Before
hourshours
Did you stay in bed any more or less than usual yesterday?
More . . . . . . . . . . . 1Less . . . . . . . . . . . . 2No . . . . . . . . . . . . 3
(a) How much more (or less)?
(b) Why did you spend more (less) time in bed yesterday?
DAY BEFORE YESTERDAY? More . . . . . . . . . . . 1Less . . . . . . . . . . . 2No . . . . . . . . . . . . 3
(a) How much more (or less)?
(b) Why did you spend more (less) time in bed day before yesterday?
E. Did you take any more medication than usual?
Yesterday? YES . . . . . . . . . . . . 1NO . . . . . . . . . . . . 2
70

Day Before Yesterday? YES . . . . . . . . . . . . lNO . . . . . . . . . . . . 2
F. How many hours did you spend at work?
YESTERDAY HOURSDAY BEFORE HOURS
FOR EACH DAY NOT WORKED, ASK G
G. Did you make a recreation trip outside the area, such as to themountains, or to the beach or some other recreational area?
YES . . . ASK i and ii . . 1NO . . . SKIP TO Q34 . . . 2
i. Where did you go? Please name the community or area.
ii. How many nights were you away from home? NIGHTS
Now I would like to ask you some questions about symptoms you may have whenit's smoggy.
34. Do you have any symptoms when it's smoggy?
YES. . . ASK A. . . . . .lNODON'T KNOW
SKIP TO Q35 . . . 2. SKIP TO Q35 . 8
A. What symptoms do you have?
35. Were you at home yesterday? (More than 4 hours between 10-4)
1 yes - 2 no
A. Now, using a scale of l-10, 10 being the very best and 1 thevery worst, how would you rate the air quality outside yourhome yesterday?
RECORD #
36. Now I'd like to read you a list of symptoms other people sometimeshave. As I read each one, please tell me if you yesterday or the daybefore yesterday. READ A-Z. CODE IN APPROPRIATE COLUMN.
71
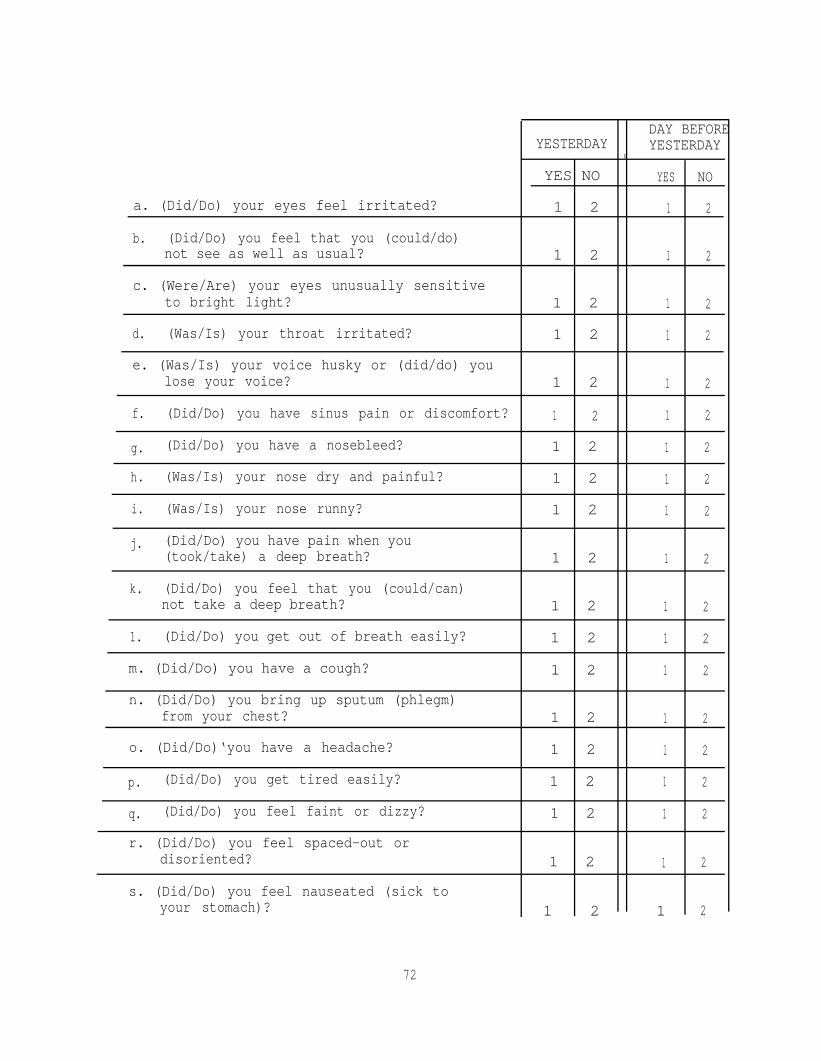
DAY BEFOREYESTERDAY YESTERDAY
I
YES NO YES
a. (Did/Do) your eyes feel irritated? 1 2 1
b. (Did/Do) you feel that you (could/do)not see as well as usual? 1 2 1
c. (Were/Are) your eyes unusually sensitiveto bright light? 1 2 1
d. (Was/Is) your throat irritated? 1 2 1
e. (Was/Is) your voice husky or (did/do) youlose your voice? 1 2 1
f. (Did/Do) you have sinus pain or discomfort? 1 2 1
g. (Did/Do) you have a nosebleed? 1 2 1
h. (Was/Is) your nose dry and painful? 1 2 1
i. (Was/Is) your nose runny? 1 2 1
j. (Did/Do) you have pain when you(took/take) a deep breath? 1 2 1
k. (Did/Do) you feel that you (could/can)not take a deep breath? 1 2 1
1. (Did/Do) you get out of breath easily? 1 2 1
m. (Did/Do) you have a cough? 1 2 1
n. (Did/Do) you bring up sputum (phlegm)from your chest? 1 2 1
o. (Did/Do)‘you have a headache? 1 2 1
p. (Did/Do) you get tired easily? 1 2 1
q. (Did/Do) you feel faint or dizzy? 1 2 1
r. (Did/Do) you feel spaced-out ordisoriented? 1 2 1
s. (Did/Do) you feel nauseated (sick toyour stomach)? 1 2 1
72
NO
2
2
2
2
2
2
2
2
2
2
2
2
2
2
2
2
2
2
2

t. (Did/Do) you have chills or fever?Which one ?
u. (Did/Do) you have pain in your ears?
v. (Did/Do) you have ringing in your ears?
w. (Did/Does) your breathing sound wheezing orwhistling?
x. (Did/Does) your chest feel tight?
y. (Did/Do) you feel that your heart was beatingvery fast at time when you were resting?
z. (Did/Do) you have swollen glands?
YESTERDAY
YES NO
1 2
1 2
1 2
1 2
1 2
1 2
1 2
DAY BEFOREYESTERDAY
YES NO
1 2
1 2
1 2
1 2
1 2
1 2
1 2
IF "YES" TO ANY SYMPTOM IN Q36 . . . ASK Q37
IF "NO" TO ALL SYMPTOMS IN Q36 . . . SKIP TO Q37
1 1 1 1NO
211YES
YES
22 2222211111
37. A. How much of the day did bother you? (Code all mentions)
111 1Morning .Letter of Symptom
. . . . . . . . . . 12 2 2
1 1Afternoon . . . . . . . . . . 1 1 1 1 1 1 1 1NO 2 2 22 2 2
1Evening .
2 2 2 2
1 1 1 1 1 1 12 2 2 2 2 2
22Night . .
YESNO
YES
2 2 2
2 2 2 2 2 2 2 2
1 1 1 1 1 1
B. During the time you hadconstant or on-and-off?
would you say it was
1111Letter of Symptom
Constant . . . . . . . . . . . .
2
1 1 1 1 1 1
2 22 2On-and-Off . . . . . . . . . . . 2 2 2 2 2
73

C. In general how heavily were you exerting yourself when you firstnoticed ?
Letter of SymptomA t r e s t . . . . . . . . . . . . . .
Lightly exerting yourself . . . . .
Moderately exerting yourself . . .
Heavily exerting yourself, or . . .
O t h e r . . . . . . . . . . . . . . .SPECIFY
Don't Know . . . . . . . . . . . .
READ SENTENCE BELOW FIRST
D. How much would you pay?
E. What do you think caused it?
Letter of SymptomWeather . . . . . . . . . . . . . .
Smog . . . . . . . . . . . . . . .
Both . . . . . . . . . . . . . . .
O t h e r . . . . . . . . . . . . . . .
RECORD LETTER
One way to find out how valuable better health is to you is to ask you howmuch you are willing to pay for it. Suppose you could have avoided thesymptom(s) you have experienced by the payment of a sum of money. Pleaselook at this card (HAND CARD Q6D).
Which sum of money most closely represents the maximum amount youwould have been willing to pay to have avoided (...) yesterday/daybefore yesterday? INSERT EACH SYMPTOM IN TURN FOR (...). When youhave decided, give me the letter next to the amount.
Did you answer $0.00 because you feel avoiding the symptom has no value toyou?
Y E S . . . . . . . . . . . . 1NO . . . . . . . . . . ..2
74

38. Did the air quality yesterday affect what you did?
PROBE
DAY BEFOREYESTERDAY YESTERDAY
A.LOT A LITTLE NO A LOT A LITTLE NO
1 2 3 1 2 3
39. As I mentioned at the beginning of the interview, we are interested inhow people change their activities when pollution is bad. When the airis smoggy, do you normally change your activities at all? For example,do you stay indoors more, or use air conditioning more? Do you travelto less polluted areas, like the beach? Do you buy or use anyproducts, or do anything at all to try to avoid air pollution or the- -symptoms of air pollution?
YES . . ASK A . . 1NO . . . . . . . 2
A. What do you do differently?
The next questions I have today are about your home.
40. How large is your house? (Number of bedrooms)(apt.)
41. Is your home insulated?
YES... ASK A . . . . . . . . lNO . . . SKIP TO Q42 . . . . . 2DON'T KNOW SKIP TO Q42 . . . . . 8
A. Is it insulated in:
The attic, or . . . . . . . . . 1the walls? . . . . . . . . . . . 2BOTH. . . . . . . . . . . . . . 3
75

B. Do you know what material was used?
YES . . . . . ASK A . . . . 1NO . . . . . SKIP TO Q42 . 2
a. What was it?
42. What fuel do you use for cooking? CODE ALL MENTIONS
GAS . . . . . . . . . . . . lELECTRICITY . . . . . . . . 2BOTTLED GAS . . . . . . . . 3OTHER . . . . . . . . . . . 4
SPECIFY
43. What fuel do you use for heating your home?
GAS . . . . . . . . . . . . lELECTRICITY . . . . . . . . 2BOTTLED GAS . . . . . . . . 3SOLAR HEAT . . . . . . . . 4OTHER . . . . . . . . . . . S
SPECIFY
44. Is your home air conditioned?
YES. . . ASK A. . . . . . lNO . . . SKIP TO Q45 . . . 2
A. Is it:
Central Air, or . . SKIP TO C . . . . 1Room by Room Air? . ASK B . . . . . . 2
B. How many units do you have?
RECORD
C. Is it:
Refrigerated, or . . . . . . . . . . 1Evaporative (swamp)? . . . . . . . . 2
D. How much do you use your air conditioner during the summer?
Almost all the time . . . . 1Usually . . . . . . . . . . 2Sometimes . . . . . . . . . 3Almost never . . . . . . . 4
76

E. Does your air conditioning system include some type of specialair purifyfng unit?
YES . . .ASK F . . . . . . . . . . .lNO SKIP TO Q45DON'T KNOW . SKIP TO Q45
2. . . . . . 3
F. What type of special air purifying unit do you have? (CODE ALLMENTIONS)
Electronic air purifier . . . . . . . 1High particulate filter . . . . . . . 2Charcoal filter . . . . . . . . . . . 3
Something else . . . . . . . . . . . 4- S P E C I F Y
Don't Know . . . . . . . . . . . . . 9
G. Is regular maintenance performed on your purifying system?
YES . . . . . . . . . . . . . . . . .lNO . . . . . . . . . . . . . . . . . 2
H. Did you obtain a tax deduction for the installation of your airpurifying system?
YES . . . . ASK a . . . . . . . . . . lNO . . . . . . . . . . . . . . . . . 2
a. Approximately, how much did this deduction reduce your taxes?
$
I. Can you operate your air purification system without runningyour air conditioner or heater?
YES. . . . ASK a . . . . . . . . . . lNO . . . . . . . . . . . . . . . . . 2
a. How often do you operate your purifying system without the airconditioner or heater?
RECORD
45. Do you have a portable air purifier?
YES . . . . ASK a . . . . . . . . . . lNO . . . . SKIP TO Q46 . . . . . . . 2
a. How often do you use it?
RECORD
77

46. Do you have an ionizer or air energizing machine?
YES . . . . ASK a . . . . . . . . . . lNO . . . . SKIP TO Q47 . . . . . . . 2DON'T KNOW . SKIP TO Q47 . . . . . . 8
a. How often do you use it?
RECORD
47. What kind of car do you usually drive?
MAKE
YEAR
A. About how many miles per gallon does this car get?
RECORD mpg
48. Is your car air conditioned?
YES . . . . ASK A . . . . . . . . . . lNO . . . . SKIP TO Q48B . . . . . . 2
A. How often do you use the air conditioning when driving in summer?
ALMOST ALL THE TIME . . . . . . . . . 1USUALLY . . . . . . . . . . . . . . . 2SOMETIMES . . . . . . . . . . . . . . 3ALMOST NEVER . . . . . . . . . . . . 4
B. About how many miles do you drive your car during a typical week?
RECORD
The last set of questions is about you and your job.
49. What is your date of birth?
50. Are you currently:M A R R I E D . . . . . . . . . . 1SEPARATED . . . . . . . . . 2DIVORCED 3WIDOWED, OR . . . . . . . . 4NEVER MARRIED, OR . . . . . 5SOMETHING ELSE? . . . . . . 6
SPECIFY
78

51. What is the highest grade in school you completed and received creditfor? CODE ONE
00 01 02 03 04 05 06 07 08 09 10 11 12
COLLEGE/OTHER POST HIGH SCHOOL SCHOOLING 13 14 15 16
POST GRADUATE SCHOOL 17 18 19 20 OR MORE
A. Have you had any trade, technical or vocational training?
YES . . . . . . . . . . . . lNO . . . . . . . . . . . . 2
B. ASK EVERYONE: What degrees or diplomas, if any, do you have?CODE HIGHEST DEGREE
High School Degree (Equivalent) . . 01Junior College Degree (A.A.) . . . . 02Bachelors Degree (B.A., B.S.) . . . 03Masters Degree (M.A., M.S.) . . . . 04Doctorate (Ph.D.) . . . . . . . . . 05Professional (M.D, J.D., D.D.S.,) . 06N o n e . . . . . . . . . . . . . . . . 9 0
Other . . . . . . . . . . . . . 96
52. What is your current employment status, are you:
Working full-time . . . . . . . . . . . . 1Working part-time . . . . . . . . . . . . 2Unemployed and looking for work . . . . . 3Unemployed and not looking for work . . . 4
53. Out next set of questions is about your job. If you have more thanone job, we only need to know about your
A. What kind of business or industry
RECORD
main job.
CIRCLE CORRECT CATEGORY
AGRICULTURE OR FORESTRY . . . . .MINING . . . . . . . . . . . . .CONSTRUCTION . . . . . . . . . .MANUFACTURING . . . . . . . . . .WHOLESALE OR RETAIL TRADE . . . .
do you work in?
RESPONSE
. . . . . . . . . . . . . . . 1
. . . . . . . . . . . . . . . 2
. . . . . . . . . . . . . . . 3
. . . . . . . . . . . . . . . 4
. . . . . . . . . . . . . . . 5TRANSPORTATION, COMMUNICATIONS, OR PUBLIC UTILITIES . . . . . . 6
79

FINANCE, INSURANCE, OR REAL ESTATE . . . . . . . . . . . . . . . 7SERVICES . . . . . . . . . . . . . . . . . . . . . . . . . . . . 8GOVERNMENT . . . . . . . . . . . . . . . . . . . . . . . . . . . 9OTHER . . . . . . . . . . . . . . . . . . . . . . . . . . . . . 10
- SPECIFY
B. What type of work do you do in your job?
RECORD RESPONSE
CIRCLE CORRECT CATEGORY
SERVICE WORKER (Food service workers, Cleaningservice workers, Dental assist-ants, Policemen) . . . . . . . 1
LABORER (Longshoremen, Constructionworkers, Loggers, Garbagecollectors) . . . . . . . . . . 2
TRANSPORTATION OPERATOR (Bus drivers, Taxicab drivers,Truck drivers, Railroad switchoperators) . . . . . . . . . . 3
EQUIPMENT OPERATOR (Textile workers, Drillers,Photographic processors,Smelters) . . . . . . . . . . . 4
CRAFT WORKER (Carpenters, Machinists, Bakers,Tailors, Repairmen,Mechanics) . . . . . . . . . . 5
CLERICAL WORKER (Cashiers, tellers, Secretaries,Receptionists, Telephoneoperators, Dispatchers) . . . . 6
SALES WORKER
MANAGER OR ADMINISTRATOR
PROFESSIONAL OR TECHNICAL
FARMWORKER
(Advertising agents, Real estateagents, Sales clerks, Salesrepresentatives, Vendors) . . . 7
(Bank officers, Purchasing agents,Restaurant managers, Schooladministrators) . . . . . . . . 8
(Accountants, Engineers,Physicians, Teachers,Entertainers) . . . . . . . . . 9
(Farmers, Farm laborers, FarmSupervisors) . . . . . . . . . 10
80
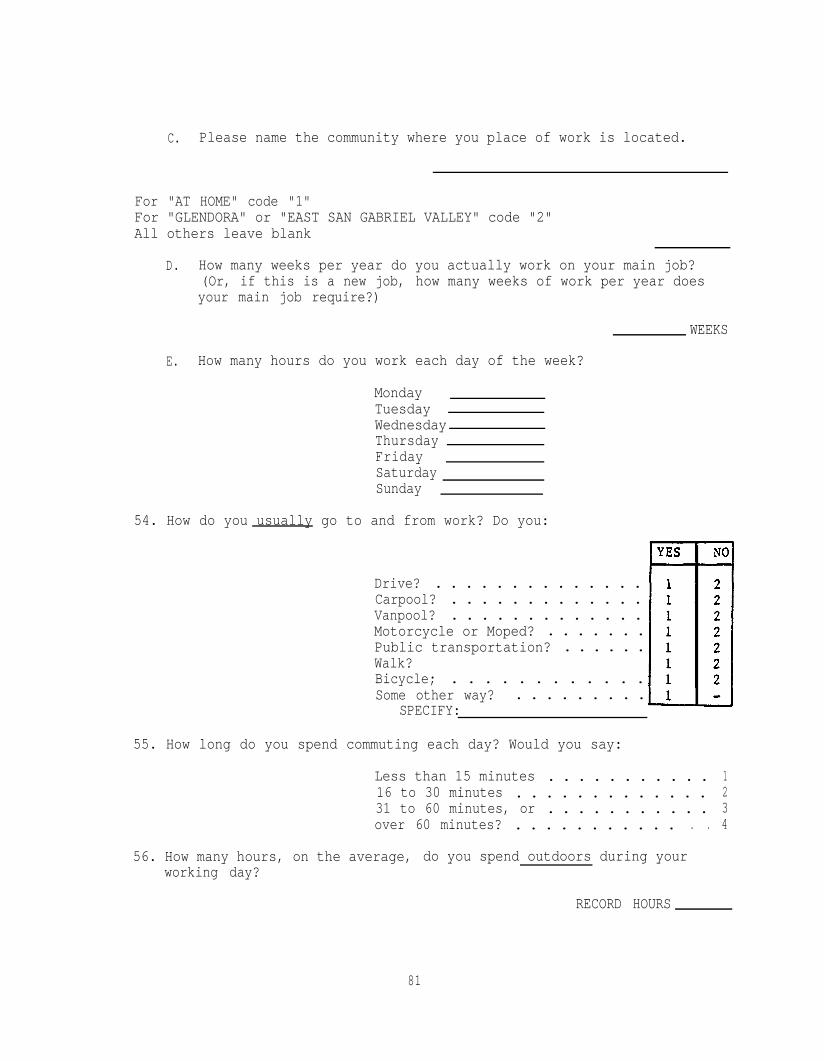
C. Please name the community where you place of work is located.
For "AT HOME" code "1"For "GLENDORA" or "EAST SAN GABRIEL VALLEY" code "2"All others leave blank
D. How many weeks per year do you actually work on your main job?(Or, if this is a new job, how many weeks of work per year doesyour main job require?)
WEEKS
E. How many hours do you work each day of the week?
MondayTuesdayWednesdayThursdayFridaySaturdaySunday
54. How do you usually go to and from work? Do you:
Drive? . . . . . . . . . . . . . .Carpool? . . . . . . . . . . . . .Vanpool? . . . . . . . . . . . . .Motorcycle or Moped? . . . . . . .Public transportation? . . . . . .Walk?Bicycle; . . . . . . . . . . . .Some other way? . . . . . . . . .
SPECIFY:
55. How long do you spend commuting each day? Would you say:
Less than 15 minutes . . . . . . . . . . . 116 to 30 minutes . . . . . . . . . . . . . 231 to 60 minutes, or . . . . . . . . . . . 3over 60 minutes? . . . . . . . . . . . . . 4
56. How many hours, on the average, do you spend outdoors during yourworking day?
RECORD HOURS
81

57. Do you travel during the day as part of your work?
YES . . . ASK A . . . . . . lNO . . . SKIP TO Q57 . . . 2
A. When you travel, do you use:
A car, . . . . . . . . . .lPublic transportation, or . 2W a l k ? . . . . . . . . . . . 3
Other . . . . . . . . . . . 4 S P E C I F Y
B. How long do you usually spend traveling during a working day?
RECORD
58. Is your place of work air conditioned?
YES . . . . . . . . . . . . lN O . . . . . . . . . . . . 2
59. Are you exposed to anything at work which affects your breathing?
YES . . . ASK A . . . . . . lNO . . . SKIP TO Q60 . . . 2
A. What are you exposed to?
82

>
60. How are paid?
1 HOURLY WAGE2 SALARY3 OTHER (i.e., Piece Work,.Commissions, Tips, etc.)
(IF SALARY OR OTHER) Please look at this card (HAND CARD Q5lFSAL)and tell me the letter of the income category that includes yourannual gross (i.e., before deductions and taxes) income from yourmain job.
RECORD LETTER
If you work more hours than average during some week, do you get paidanything at all for those hours?
1 YES2 NO
(IF YES) Which of the following best describes how you getpaid for those overtime hours?
1 EQUIVALENT TO STRAIGHT TIME HOURLY WAGE2 EQUIVALENT TO TIME AND A HALF3 EQUIVALENT TO DOUBLE TIME4 EQUIVALENT TO TRIPLE TIME
>
SKIP TO Q61
Approximately, how many hours of overtime do you workin an average week?
>
HOURS
'-(IF HOURLY) Please look at this card (HAND CARD Q5lFWAGE) and tell methe letter of the wage category that includes your hourly wage forregular or "straight" time work.
RECORD LETTER
Do you ever have the opportunity to work overtime on your main job?
1 YES .2 NO
(IF YES) Which of the following most closely describes yourhourly wage rate for those overtime hours?>
1 STRAIGHT TIME2 TIME AND A HALF3 DOUBLE TIME4 TRIPLE TIME
Approximately, how many hours of overtime do you work in anaverage week?
HOURS
83

CARD Q51FSAL
A.B.c.D.E.F.G.H.I.J.K.L.M.N.0.P.
Less than $6,000$ 6,000 - 6,999$ 7,000 - 7,999$ 8,000 - 8,999$ 9,000 - 9,999$10,000 - 10,999$11,000 - 11,999$12,000 - 12,999$13,000 - 13,999$14,000 - 14,999$15,000 - 17,499$17,500 - 19,999$20,000 - 22,499$22,500 - 24,999$25,000 - 27,499$27,500 - 29,999
Q.R.S.T.U.V.W.X.Y.Z.
$29,999 - 34,999$35,000 - 39,999$40,000 - 44,999$45,000 - 49,999$50,000 - 54,999$55,000 - 59,999$60,000 - 69,999$70,000 - 79,999$80,000 - 89,999$90,000 - 99,999+
84

A.B.C.D.E.F.G.H.I.J.K.L.M.N.0.
Q.
CARD Q5lFWAGE
Less than $3.00$ 3.00 - 3.49$ 3.50 - 3.99$ 4.00 - 4.49$ 4.50 - 4.99$ 5.00 - 5.49$ 5.50 - 5.99$ 6.00 - 6.49$ 6.50 - 6.99$ 7.00 - 7.49$ 7.50 - 7.99$ 8.00 - 8.49$ 8.50 - 8.99$ 9.00 - 9.49$ 9.50 - 9.99$10.00 - 10.49$10.50 - 10.99
R. $11.00 - 11.49S. $11.50 - 11.99T. $12.00 - 12.99U. $13.00 - 13.99V. $14.00 - 14.99W. $15.00 - 15.99X. $16.00 - 16.99Y. $17.00 - 17.99Z. $18.00 - 18.99AA. $19.00 - 19.99BB. $20.00 - 20.99CC. $21.00 - 21.99DD. $22.00 or more
85

61. A. Now, thinking about the members of this household, how many people,including yourself, received income from any source such as wages,salary, social security, pensions, welfare, or alimony during 1984?
RECORD # PERSONS
B. (HAND APPROPRIATE INCOME CARD - USE CARD #52B-2)Please look at this card and tell me the letter of the incomegroup that includes the total income for your entire family, inthis household, before taxes in 1984?
CARD #1:
A . . . . 0 1B . . . . 02C . . . . 0 3D . . . . 0 4E . . . . 0 5F . . . . 0 6G . . . . 0 7H . . . . 0 8I . . . . 0 9J . . . . l OK . . . . l lL . . . . 1 2M . . . . 1 3
N . . . . l 40 . . . . 1 5
Q . . .. 16. 17
R . . . . 1 8S . . . . 19T . . . . 2 0U . . . . 2 1V . . . . 2 2W . . . . 2 3X . . . . 2 4Y . . . . 2 5Z . . . . 2 6
P . . .
C. How many people, including yourself, are supported with thisincome?
RECORD #
86

CARD Q6D
A. $0.00 K. $5.00 V. $16.00 FF. $45.00 PP. $200.00
B. $ .50 L. $6.00 W. $18.00 GG. $50.00 QQ. $250.00
C. $1.00 M. $7.00 X. $20.00 HH. $60.00 RR. $300.00
D. $1.50 N. $8.00 Y. $22.00 II. $70.00 SS. $350.00
E. $2.00 0. $9.00 Z. $24.00 JJ. $80.00 TT. $400.00
F. $2.50 P. $10.00 AA. $26.00 KK. $90.00 UU. $450.00
G. $3.00 R. $11.00 BB. $28.00 LL. $100.00 VV. $500.00
H. $3.50 S. $12.00 CC. $30.00 MM. $125.00 XX. $1000.00
I. $4.00 T. $13.00 DD. $35.00 NN. $150.00 ZZ. Morethan
J. $4.50 U. $14.00 EE. $40.00 00. $175.00 $1000.00
87
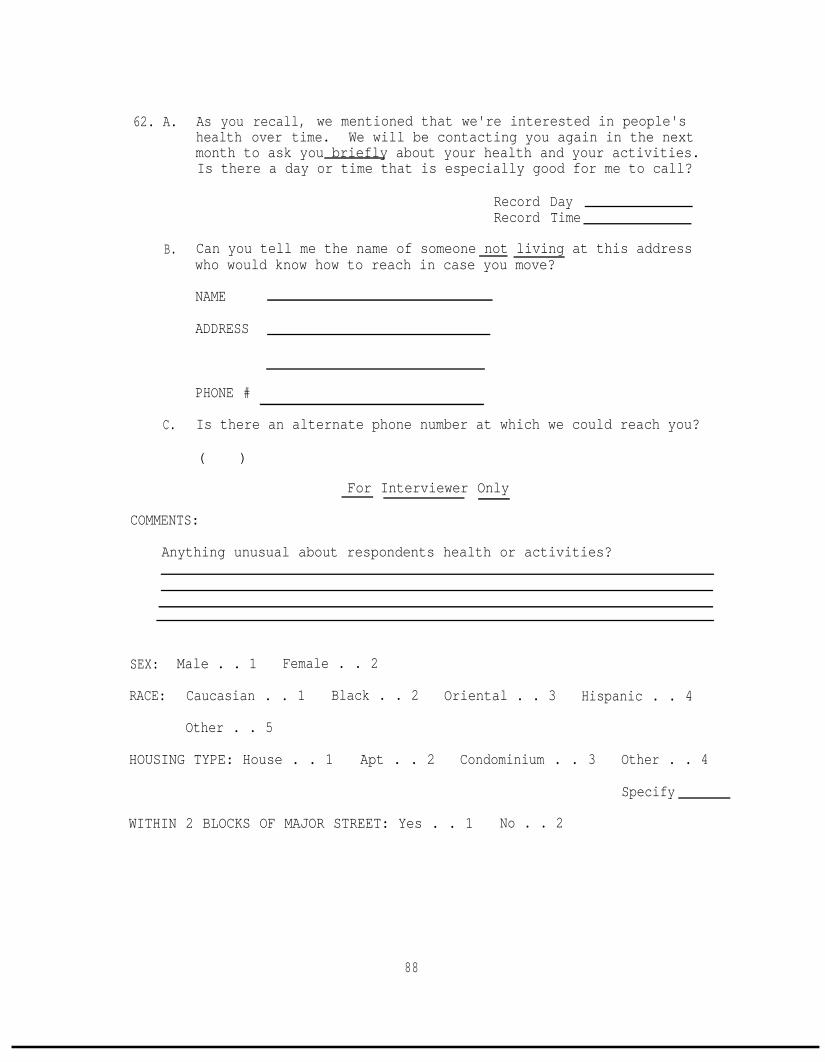
62. A. As you recall, we mentioned that we're interested in people'shealth over time. We will be contacting you again in the nextmonth to ask you briefly about your health and your activities.Is there a day or time that is especially good for me to call?
Record DayRecord Time
B. Can you tell me the name of someone not living at this addresswho would know how to reach in case you move?
NAME
ADDRESS
PHONE #
C. Is there an alternate phone number at which we could reach you?
( )
COMMENTS:
For Interviewer Only
Anything unusual about respondents health or activities?
SEX: Male . . 1 Female . . 2
RACE: Caucasian . . 1 Black . . 2 Oriental . . 3 Hispanic . . 4
Other . . 5
HOUSING TYPE: House . . 1 Apt . . 2 Condominium . . 3 Other . . 4
Specify
WITHIN 2 BLOCKS OF MAJOR STREET: Yes . . 1 No . . 2
88

APPENDIX B
FOLLOWUP QUESTIONNAIRE
I would like to know about changes in your life since (...) when welast talked. (INSERT DATE OF INTERVIEW FOR (...).)
1. Do you still live at (...)? (INSERT FULL ADDRESS FOR (...).)
YES . . . . . 1 GO TO Q2NO . . . . . 2 GO TO A
A. What is your new address?
/ STREET/
/ APT. #I#
CITY
B. When did you move? /DAY / MONTH /YEAR
C. How large is your house (apt.)? (number of bedrooms)
D. Is your home insulated? YES . . . . ASK a . . . . . lNODON'T KNOW
SKIP TO E . . . 2. SKIP TO E . . 8
a. Is it insulated in The attic, or . . . . . . . 1the walls? . . . . . . . . 2BOTH . . . . . . . . . . . 3
b. Do you know what material was used?
YES . . . . ASK (i) . . . . 1NO . . . SKIP TO E . . . . 2
(i)
E. What fuel
What was it?
do you use for cooking? CODE ALL MENTIONS
GAS . . . . . . . . . . . . lELECTRICITY . . . . . . . . 2BOTTLED GAS . . . . . . . . 3OTHER . . . . . . . . . . . 4
SPECIFY>
89

F. What fuel do you use for heating your home?
GAS. . . . . . . . . . . . lELECTRICITY . . . . . . . . 2BOTTLED GAS . . . . . . . . 3SOLARHEAT . . . . . . . . 4OTHER . . . . . . . . . . . 5
SPECIFY
G. Is your home air conditioned? YES . . . . . ASK a . . . . lNO . . . SKIP TO Q2 . . . 2
a. Is it: Central air, or . . . SKIP TO c . . . 1room by room air? . . ASK b . . . . . 2
b. How many units do you have? RECORD
c. Is it: Refrigerated, or . . . . . 1Evaporative (swamp)? . . . 2
d. How much do you use your air conditioner during the summer?
Almost all the time . . . . . . . . . 1Usually . . . . . . . . . . . . . . . 2Sometimes . . . . . . . . . . . . . . 3Almost never . . . . . . . . . . . . 4
e. Does your air conditioning system include some type ofspecial air purifying unit?
YES . . . . . . ASK f . . . . . . . . lNO SKIP TO Q2 . 2DON'T KNOW . . SKIP TO Q2 . . . . . . 3
f. What type of special air purifying unit do you have? (CODEALL MENTIONS)
Electronic air purifier . . . . . . . 1High particulate filter . . . . . . . 2Charcoal filter . . . . . . . . . . . . 3Something else . . . . . . . . . . . 4
SPECIFYDon't Know . . . . . . . . . . . . . 9
g. Is regular maintenance performed on your purifying system?
YES . . . . . . . . . 1NO . . . . . . . . . 2
90

h. Did you obtain a tax deduction for the installation of yourair purifying system?
YES . . . . ASK (i) . . . . 1NO . . . . . . . . . . . .2
(i) Approximately, how much did this deduction reduce yourtaxes? $
i. Can you operate your air purification system without runningyour air conditioner or heater?
YES . . . . ASK (i) . . . . 1NO . . . . . . . . . . . .2
(i) How often do you operate your purifying system withoutthe air conditioner or heater? RECORD
2. A. Since we talked last, have you either seen or talked with adoctor for any medical problem?
YES . . . . GO TO (i) . . . 1NO . . . . SKIP TO B . . . 2
(i) What was the problem?
(ii) Did you see or talk with a doctor yesterday or the daybefore yesterday?
YES NOYESTERDAY. . . . . . . . 1 2DAY BEFORE YESTERDAY . . 1 2
(iii) Where did you go? DAY BEFOREYESTERDAY YESTERDAY
Doctor's Office . . . 1 1Emergency . . . . . . 1 1Hospital . . . .Called Doctor . . . .
2 23 3
(iv) How much time did it take to get this medical attention?Please include time spent waiting to see the doctor andtime spent driving to his/her office.
MINUTES
(v) What is your out-of-pocket expense for this medicalattention?
$
91

B. Did you take any more medication than usual
YESTERDAY YES . . . . . . . lNO . . . . . . . 2
DAY BEFORE YES . . . . . . . 1N O . . . . . . . 2
IF ASTHMA-BRONCHITIS-EMPHYSEMA - LOW FEV - "ATHLETE"NOTED . . . ASK APPROPRIATE QUESTIONS IN Q3
IF NONE NOTED . . . . . . . . . . . . . . SKIP TO Q4
3. At the time of the first interview you mentioned that you (have/are)(asthma/bronchitis/emphysema/lung condition/athletic). I would likeyou to think about the last two days and tell me if:- -
A. Your asthma was: Much better than usual, . . . . 1Better than usual, . . . . . . 2The same as usual, . . . . . . 3N ot good as usual, or . . . 4Much worse than usual? . . . . 5
a. Did you take: More medication than usual, . . . 1Less medication than usual, or . 2About the same amount of medication? 3NO MEDICATION TAKEN . . . . . . . . 4
b. Did you get in touch with the doctor or doctor's officeabout your asthma?
YES . . . . ASK aa . . . . . . 1NO . . SKIP TO BOX BELOW aa . 2
aa. Did you: Talk on the phone, . . . . . . . . . 1Visit your doctor's office, . . . . 2Visit the emergency room, or . . . . 3Go to the hospital? . . . . . . . . 4
IF OTHER CONDITIONS . . . CONTINUE WITH APPROPRIATE QUESTIONS
IF NO OTHERS . . . . . . . . . . . . . . . . . . . SKIP TO Q4I
92

B. Thinking about the last two days was your chronic bronchitis:- -
a.
b.
C.
Much better than usual, . . . . 1Better than usual, . . . . . . 2The same as usual, . . . . . . 3Not as good as usual, or . . . 4Much worse than usual? . . . . 5
Did you cough or bring up:
More phlegm than usual, or . . 1Less phlegm than usual? . . . 2SAME AS USUAL . . . . . . . . 3
Was you sputum (phlegm):
More discolored than usual, . . 1Less discolored than usual, or 2The same as usual? . . . . . . 3
Did you get in touch with your doctor or doctor's officeabout your bronchitis?
YES . . . . ASK aa . . . . . . 1NO . . SKIP TO BOX BELOW aa . 2
aa. Did you: Talk on the phone, . . . . . . . . . 1Visit your doctor's office, . . . . 2Visit the emergency room, or . . . . 3Go to the hospital? . . . . . . . . 4
IF OTHER CONDITIONS . . . CONTINUE WITH APPROPRIATE QUESTIONS
IF NO OTHERS . . . . . . . . . . . . . . . . . . . SKIP TO Q4
C. Thinking about the last two days was your emphysema:- -
Much better than usual, . .Better than usual, . . . .The same as usual, . . . .Not as good as usual, or .Much worse than usual? . .
. . 1
. . 2
. . 3
. . 4
. . 5
a. During the last three days, when exerting yourself did youfeel:
More short of breath, or . . . 1Less short of breath? . . . . 2NEITHER . . . . . . . . . . . . 3
93

b. Did you get in touch with your doctor or doctor's officeabout your emphysema?
YES . . . . ASK aa . . . . . . 1NO . . SKIP TO BOX BELOW aa . 2
aa. Did you: Talk on the phone, . . . . . . . . . 1Visit your doctor's office, . . . . 2Visit the emergency room, or . . . . 3Go to the hospital? . . . . . . . . 4
IF OTHER CONDITIONS . . . CONTINUE WITH APPROPRIATE QUESTIONS
IF NO OTHERS . . . . . . . . . . . . . . . . . . . SKIP TO Q4I
C. Thinking of the last two days were your lungs:- -
More congested than usual, or . . . 1Less congested? . . . . . . . . . . 2
a. Did you get:
Out of breath more easily than usual, or . . . 1Less than usual? . . . . . . . . . . . . . . . 2
Now, I would like to ask you about the things you do regularly in yourleisure time.
4. A. What were your regular leisure or non-work related activities inthe past month? LIST - PROBE
5.4.
1.2.3.
(IF MORE THAN 5 USE THE FIVE THAT THE RESPONDENT DOES MOST OFTEN)
Activity #1
B. About how many hours per week (including transportation) did you?
C. How many times a week did you
D. Where do you usually (area or community)
FOR "AT HOME" CODE "1"
?
?
FOR "GLENDORA" OR EAST SAN GABRIEL VALLEY CODE "2"ALL OTHERS LEAVE BLANK
94

E. What is the usual time of day when you did this activity?
Morning . . . . . . . 1 YES - 2 NOAfternoon . . . . . . 1 YES - 2 NONight . . . . . . . . 1 YES - 2 NOno particular time . . 1 YES - 2 NO
F. What days of the week did you usually do this activity?
Monday . . . 1 YES - 2 NO Friday . . . . . . . 1 YES - 2 NOTuesday . . 1 YES - 2 NO Saturday . . . . . . 1 YES - 2 NO,Wednesday. . 1 YES - 2 NO Sunday . . . . . . . 1 YES - 2 NOThursday . . 1 YES - 2 NO No particular day . . 1 YES - 2 NO
G. What does it usually cost to do this activity (includingtransportation) per month? Each time?
$PER MONTHEACH TIME
H. How much of the time did you outdoors?
Always . . . . . . . . . . 1Most of the time . . . . . 2Half of the time . . . . . 3Some of the time . . . . . 4Never . . . . . . . . . . 5
(INTERVIEWER - FOR QUESTIONS"YESTERDAY" IN THE APPROPRIATEBEFORE YESTERDAY.")
I. How many hours did youyesterday/day before yesterday?
I THROUGH J RECORD THE RESPONSE FORCOLUMN THEN REPEAT THE QUESTIONS FOR "DAY
Day BeforeYesterday Yesterday
(INTERVIEWER
1.
ii.
iii.
iv.
- IF ZERO GO TO J)
What did it cost you toyesterday/day before yesterday?
Did you put significantly less effortthan planned or usual intoyesterday/day before yesterday? 1 YES-2 NO 1 YES-2 NO
Did you change the planned or usualtime of day ofyesterday/day before yesterday? 1 YES-Z NO 1 YES-2 NO
Did you change the planned or usuallocation ofyesterday/day before yesterday? 1 YES-2 NO 1 YES-2 NO
95

J. How many hours had you planned to
Day BeforeYesterday Yesterday
yesterday?yesterday/day before
Activity #2
B. About how many hours per week (including transportation) did you?
C. How many times a week did you ?
D. Where do you usually (area or community) ?
FOR "AT HOME" CODE "1"FOR "GLENDORA" OR EAST SAN GABRIEL VALLEY CODE "2"ALL OTHERS LEAVE BLANK
E.
F.
G.
H.
What is the usual time of day when you did this activity?
Morning . . . . . . . 1 YES - 2 NOAfternoon . . . . . . 1 YES - 2 NONight . . . . . . . . 1 YES - 2 NOno particular time . . 1 YES - 2 NO
What days of the week did you usually do this activity?
Monday . . . 1 YES - 2 NO Friday . . . . . . . 1 YES - 2 NOTuesday . . 1 YES - 2 NO Saturday . . . . . . 1 YES - 2 NOWednesday. . 1 YES - 2 NO Sunday . . . . . . . 1 YES - 2 NOThursday . . 1 YES - 2 NO No particular day . . 1 YES - 2 NO
What does it usually cost to do this activity (includingtransportation) per month? Each time?
$ PER MONTH$ EACH TIME
How much of the time did you outdoors?
Always . . . . . . . . . . 1Most of the time . . . . . 2Half of the time . . . . . 3Some of the time . . . . . 4Never . . . . . . . . . . 5
(INTERVIEWER - FOR QUESTIONS I THROUGH J RECORD THE RESPONSE FOR"YESTERDAY" IN THE APPROPRIATE COLUMN THEN REPEAT THE QUESTIONS FOR "DAYBEFORE YESTERDAY.")
96

Day BeforeYesterday Yesterday
I. How many hours did youyesterdav/dav before vesterdav?
(INTERVIEWER -
i.
ii.
iii.
iv.
IF ZERO GO TO J)
What did it cost you toyesterday/day before yesterday?
Did you put significantly less effortthan planned or usual intoyesterday/day before yesterday? 1 YES-2 NO 1 YES-2 NO
Did you change the planned or usualtime of day ofyesterday/day before yesterday? 1 YES-2 NO 1 YES-2 NO
Did you change the planned or usuallocation ofyesterday/day before yesterday? 1 YES-2 NO 1 YES-2 NO
Day BeforeYesterday Yesterday
J. How many hours had you planned toyesterday/day before
yesterday?
Activity #3
B. About how many hours per week (including transportation) did you?
C. How many times a week did you
D. Where do you usually (area or community)
FOR "AT HOME" CODE "1"
?
?
FOR "GLENDORA" OR EAST SAN GABRIEL VALLEY CODE "2"ALL OTHERS LEAVE BLANK
E. What is the usual time of day when you did this activity?
Morning . . . . . . . 1 YES - 2 NOAfternoon . . . . . . 1 YES - 2 NONight . . . . . . . . 1 YES - 2 NOno particular time . . 1 YES - 2 NO
97

F. What days of the week did you usually do this activity?
Monday . . . 1 YES - 2 NO Friday . . . . . . . 1 YES - 2 NOTuesday . . 1 YES - 2 NO Saturday . . . . . . 1 YES - 2 NOWednesday. . 1 YES - 2 NO Sunday . . . . . . . 1 YES - 2 NOThursday . . 1 YES - 2 NO No particular day . . 1 YES - 2 NO
G.
H.
What does it usually cost to do this activity (includingtransportation) per month? Each time?
$PER MONTHEACH TIME
How much of the time did you outdoors?
Always . . . . . . . . . . 1Most of the time . . . . . 2Half of the time . . . . . 3Some of the time . . . . . 4Never . . . . . . . . . . 5
(INTERVIEWER - FOR QUESTIONS I THROUGH J RECORD THE RESPONSE FOR"YESTERDAY" IN THE APPROPRIATE COLUMN THEN REPEAT THE QUESTIONS FOR "DAYBEFORE YESTERDAY.")
Day BeforeYesterday Yesterday
I. How many hours did youyesterday/day before yesterday?
(INTERVIEWER - IF ZERO GO TO J)
i. What did it cost you toyesterday/day before yesterday?
ii. Did you put significantly less effortthan planned or usual intoyesterday/day before yesterday?
iii. Did you change the planned or usualtime of day ofyesterday/day before yesterday?
iv. Did you change the planned or usuallocation ofyesterday/day before yesterday?
J. How many hours had you planned toyesterday/day before
yesterday?
1 YES-2 NO 1 YES-2 NO
1 YES-2 NO 1 YES-2 NO
1 YES-2 NO 1 YES-2 NO
Day BeforeYesterday Yesterday
98

5.
6.
Regarding yesterday and the day before were there any other majorchanges in the activities you have planned?
YES . . . . . . . . . . . . 1NO . . . . . . . . . . . . 2
(IF YES) What were they?
A. How many hours did you spend outdoors
YESTERDAYDAY BEFORE
hourshours
B. Did you stay in bed any more or less than usual yesterday?
MORE . . .LESS . . .NO . . .
DAY BEFOREYESTERDAY YESTERDAY
1 12 23 3
a. How much more (or less)? YesterdayDay Before
b. Why did you spend more (less) time in bed yesterday or theday before
C. How many hours did you spend at work
YESTERDAYDAY BEFORE
hourshours
FOR EACH DAY NOT WORKED, ASK D
D. Did you make a recreational trip outside the area, such as to themountains or to the beach or some other recreational area?
YES . . . . ASK i and ii . . . . 1NO . . . . SKIP TO Q7 . . . . . 2
i. Where did you go? Please name the community or area.
ii. How many nights were you away from home? NIGHTS
IF R WAS NOT AT WORK OR ON A RECREATIONAL TRIP YESTERDAY, ASK Q7
99

7. Were you at home yesterday? 1 YES 2 NO(More than 4 hours between 10-4)
Now, using a scale of l-10, 10 being the very best and 1 the veryworst, how would you rate the air quality outside your home yesterday?
RECORD #
8. As you know, we are interested in how people change their activitieswhen pollution is bad. When the air is smoggy, do you or othermember of your household change their activities in any way? Forexample, do you or other members of your household:
(i) Stay indoors more
(ii) Use air conditioning more
(iii) Travel to less polluted areas like the beach
(iv) Buy or use any products
(v) Do anything at all to avoid air pollution
What exactly do you do?
PROBE:
9. Now I'd like to read you a list of symptoms other people sometimeshave. As I read each one, please tell me if it bothered you yesterdayor the day before yesterday. READ a-z. CODE IN APPROPRIATE COLUMN
a. Did your eyes feel irritated?
b. Did you feel that you could not seeas well as usual?
C . Were your eyes unusually sensitive toto bright light?
d. Was your throat irritated?
100

11 DAY BEFOREYESTERDAY
Was your voice husky or did you loseyour voice?
Did you have sinus pain or discomfort?
Did you have a nosebleed?
Was your nose dry and painful?
Was your nose runny?
Did you have pain when you took a deepbreath?
Did you feel that you could not takea deep breath?
Did you get out of breath easily?
Did you have a cough?
Did you bring up sputum (phlegm) fromyour chest?
Did you have a headache?
Did you get tired easily?
Did you feel faint or dizzy? 1 2 1 2
Did you feel spaced-out ordisoriented? 1 2 1 2
Did you feel nauseated (sick to yourstomach)? 1 2 1 2
Did you have chills or fever? Whichone? 1 2 1 2
e.
f.
g.
h.
i.
j.
k.
1.
m.
n.
o.
p.
q.
r.
s.
t.
u.
v.
w.
x.
Did you have pain in your ears? 1 2 1 2
Did you have ringing in your ears? 1 2 1 2
Did breathing sound wheezing orwhistling 1 2 1 2
Did your chest feel tight? 1 2 1 2
101

DAY BEFOREYESTERDAY YESTERDAYYES NO YES NO
Did you feel that your heart was beatingvery fast at times when you wereresting? 1 2 1 2
Did you have swollen glands? 1 2 1 2,
y.
z.
10. A.
B.
C.
IF "YES" TO ANY SYMPTOM IN Q9 . . . . . ASK QlOIF "NO" TO ALL SYMPTOMS IN Q9 . . . SKIP TO QlO
How much of the day did(CODE ALL MENTIONS)
bother you?
LETTER OF SYMPTOM
Morning . . . . . . YESNO
Afternoon . . . . . YESNO
Evening . . . . . . YESNO
Night . . . . . . . YESNO
During the time you hador off-and-on?
would you say it was constant
LETTER OF SYMPTOM !
Constant . . . . . . . . 1 1 1 1 1 1 1 1 1 1 1 1 1Off-and-On . . . . . . . 2 2 2 2 2 2 2 2 2 2 2 2 2
In general how heavily were you exerting yourself when you firstnoticed ?
LETTER OF SYMPTOM
At rest . . . . . . . .Lightly exertingyourself . . . . . .
Moderately exertingyourself . . . . . .
Heavily exerting your-self, or . . . . . .
Other . . . . . . . . .Specify
Don't know . . . . . .
102

CARD QlOD
A. $O.OO
B. $0.50
C. $1.00
D. $1.50
E. $2.00
F. $2.50
G. $3.00
H. $3.50
I. $4.00
J. $4.50
K. $ 5.00
L. $ 6.00
M. $ 7.00
N. $ 8.00
P. $ 9.00
Q. $10.00
R. $11.00
S. $12.00
T. $13.00
U. $14.00
V. $16.00
W. $18.00
X. $20.00
Y. $22.00
Z. $24.00
AA. $26.00
BB. $28.00
CC. $30.00
DD. $35.00
EE. $40.00
FF.
GG.
HH.
II.
JJ.
KK.
LL.
MM.
NN.
00.
$ 45.00
$ 50.00
$ 60.00
$ 70.00
$ 80.00
$ 90.00
$100.00
$125.00
$150.00
$175.00
PP.
QQ.
RR.
SS.
TT.
UU.
VV.
XX.
YY.
$ 200.00
$ 250.00
$ 300.00
$ 350.00
$ 400.00
$ 450.00
$ 500.00
$1000.00
Morethan$1000.00
103
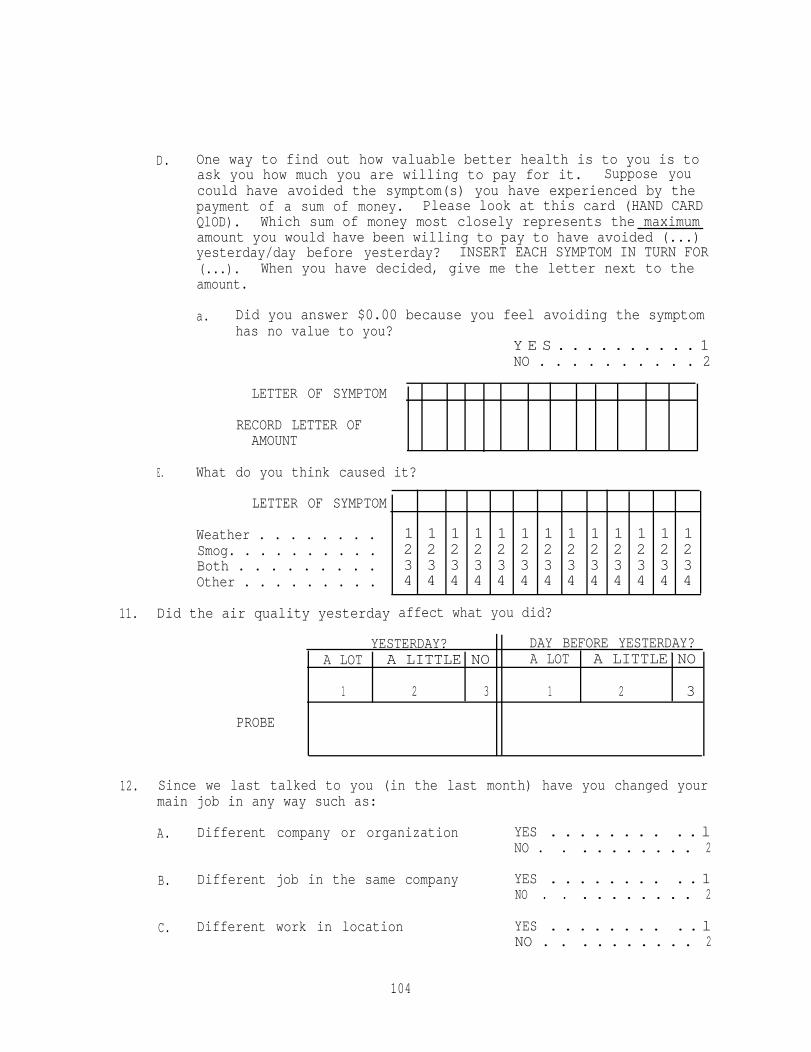
D. One way to find out how valuable better health is to you is toask you how much you are willing to pay for it. Suppose youcould have avoided the symptom(s) you have experienced by thepayment of a sum of money. Please look at this card (HAND CARDQlOD). Which sum of money most closely represents the maximumamount you would have been willing to pay to have avoided (...)yesterday/day before yesterday? INSERT EACH SYMPTOM IN TURN FOR(...). When you have decided, give me the letter next to theamount.
a. Did you answer $0.00 because you feel avoiding the symptomhas no value to you?
Y E S . . . . . . . . . . 1NO . . . . . . . . . . 2
LETTER OF SYMPTOM
RECORD LETTER OFAMOUNT
E. What do you think caused it?
LETTER OF SYMPTOM
Weather . . . . . . . . 1 1 1 1 1 1 1 1 1 1 1 1 1Smog. . . . . . . . . . 2 2 2 2 2 2 2 2 2 2 2 2 2Both . . . . . . . . . 3 3 3 3 3 3 3 3 3 3 3 3 3Other . . . . . . . . . 4 4 4 4 4 4 4 4 4 4 4 4 4
11. Did the air quality yesterday affect what you did?
YESTERDAY? DAY BEFORE YESTERDAY?A LOT A LITTLE NO A LOT A LITTLE NO
1 2 3 1 2 3
PROBE
12. Since we last talked to you (in the last month) have you changed yourmain job in any way such as:
A. Different company or organization YES . . . . . . . . . . lNO . . . . . . . . . . 2
B. Different job in the same company YES . . . . . . . . . . 1NO . . . . . . . . . . 2
C. Different work in location YES . . . . . . . . . . lNO . . . . . . . . . . 2
104

IF YES TO EITHER B OR C, GO TO D. OTHERWISE, GO TO Q13
D. What kind of business or industry do you now work in?
RECORD RESPONSE
CIRCLE CORRECT CATEGORY
>
Agriculture or Forestry . . . . . . . . . . . . . . . . . . . 1Mining . . . . . . . . . . . . . . . . . . . . . . . . . . . . . 2Construction . . . . . . . . . . . . . . . . . . . . . . . . 3Manufacturing . . . . . . . . . . . . . . . . . . . . . . . . 4Wholesale or Retail Trade . . . . . . . . . . . . . . . . . . 5Transportation, Communications, or Public Utilities . . . . . 6Finance, Insurance, or Real Estate . . . . . . . . . . . . . 7Services . . . . . . . . . . . . . . . . . . . . . . . . . . 8Government . . . . . . . . . . . . . . . . . . . . . . . . . 9O t h e r . . . . . . . . . . . . . . . . . . . . . . . . . . . . 1 0
Specify
E. What type of work do you now do in your main job?
RECORD RESPONSE
CIRCLE CORRECT CATEGORY
SERVICE WORKER
LABORER
TRANSPORTATION OPERATOR
EQUIPMENT OPERATOR
CRAFT WORKER
CLERICAL WORKER
SALES WORKER
(Food service workers, Cleaning serviceworkers, Dental assistants,Policemen) . . . . . . . . . . . . . 1(Longshoremen, Construction workers,Loggers, Garbage collectors) . . . . 2(Bus drivers, Taxicab drivers, Truckdrivers, Railroad switchoperators) . . . . . . . . . . . . . 3(Textile workers, Driller, Photo-graphic processors, Smelters) . . . 4(Carpenters, Machinists, Bakers,Tailors, Repairmen, Mechanics) . . . 5(Cashiers, Tellers, Secretaries,Receptionists, Telephone operators,Dispatchers) . . . . . . . . . . . . 6(Advertising agents, Real estate
agents, Sales clerks, Sales represen-tatives, Vendors) . . . . . . . . . 7
MANAGER OR ADMINISTRATION (Bank officers, Purchasing agents,Restaurant managers, Schooladministrators) . . . . . . . . . . 8
PROFESSIONAL OR TECHNICAL (Accountants, Engineers, Physicians,Teachers, Entertainers) . . . . . . 9
FARMWORKER (Farmers, Farm laborers, FarmSupervisors) . . . . . . . . . . . . lO
105
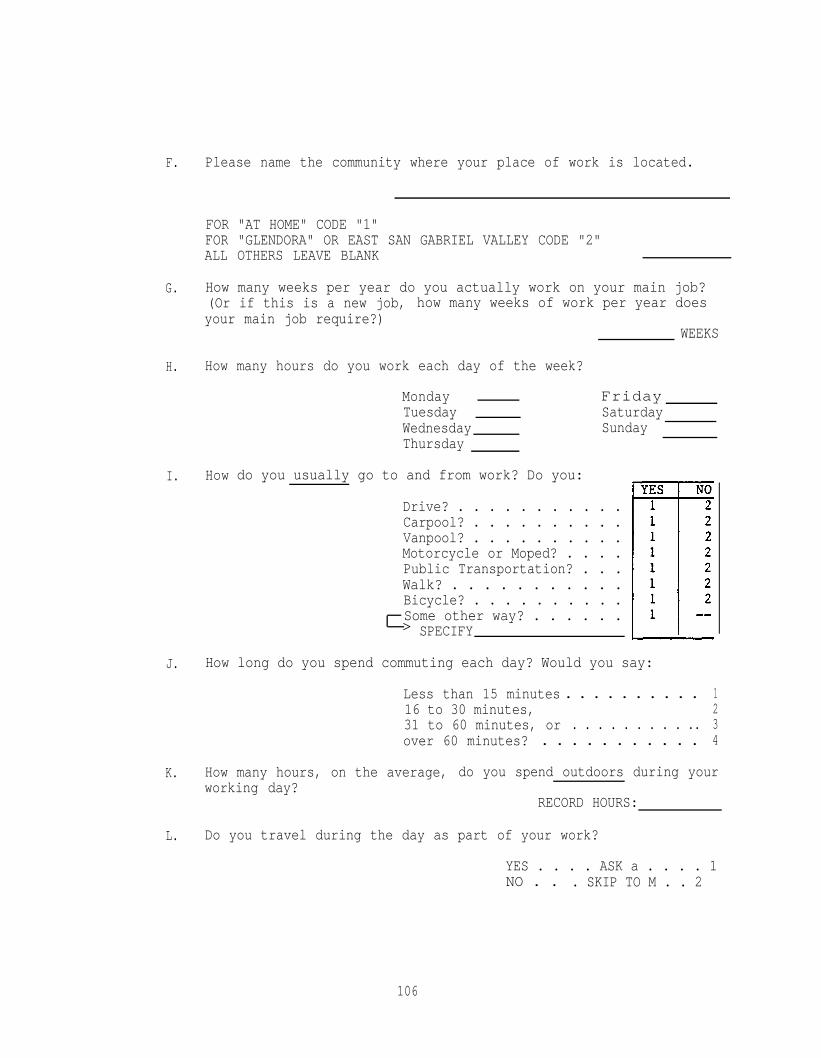
F.
G.
H.
I.
J. How long do you spend commuting each day? Would you say:
>
K.
L.
Please name the community where your place of work is located.
FOR "AT HOME" CODE "1"FOR "GLENDORA" OR EAST SAN GABRIEL VALLEY CODE "2"ALL OTHERS LEAVE BLANK
How many weeks per year do you actually work on your main job?(Or if this is a new job, how many weeks of work per year doesyour main job require?)
WEEKS
How many hours do you work each day of the week?
Monday FridayTuesday SaturdayWednesday SundayThursday
How do you usually go to and from work? Do you:
Drive? . . . . . . . . . . .Carpool? . . . . . . . . . .Vanpool? . . . . . . . . . .Motorcycle or Moped? . . . .Public Transportation? . . .Walk? . . . . . . . . . . .Bicycle? . . . . . . . . . .Some other way? . . . . . .
SPECIFY
Less than 15 minutes . . . . . . . . . . 116 to 30 minutes,31 to 60 minutes, or . . . . . . . . . ..
23
over 60 minutes? . . . . . . . . . . . 4
How many hours, on the average, do you spend outdoors during yourworking day?
RECORD HOURS:
Do you travel during the day as part of your work?
YES . . . . ASK a . . . . 1NO . . . SKIP TO M . . 2
106

a. When you travel, do you use:
A car, . . . . . . . . . . . . . . l Public transportation, or . . . . . . 2Walk? . . . . . . . . . . . . . . . .3OtherSPECIFY
. . . . . . . . . . . . ..4>
b. How long do you usually spend traveling during a workingday?
RECORDM. Is your place of work air conditioned?
YES . . . . . . . . . . . lN O . . . . . . . . . . . 2
N. Are you exposed to anything at work which affects your breathing?
YES . . . . ASK a . . . . 1NO . . . SKIP TO 0 . . . 2
a. What are you exposed to?
107

0. How are you paid?
>
>
- 1 HOURLY WAGE2 SALARY3 OTHER (i.e., Piece work, Commissions, Tips, etc.)
(IF SALARY OR OTHER) Please look at this card (HAND CARD Ql2SAL) andtell me the letter of the income category that includes your annualgross (i.e., before deductions and taxes) income from your main job.
RECORD LETTER
If you work more hours than average during some week, do you get paidanything at all for those hours?
1 YES2 NO
(IF YES) Which of the following best describes how you get paidfor those overtime hours?
1 EQUIVALENT TO STRAIGHT TIME HOURLY WAGE2 EQUIVALENT TO TIME AND A HALF3 EQUIVALENT TO DOUBLE TIME4 EQUIVALENT TO TRIPLE TIME
Approximately, how many hours of overtime do you work in anaverage week? HOURS
- (IF HOURLY) Please look at this card (HAND CARD Q12WAGE) and tellme the letter of the wage category that includes your hourly wagefor regular or "straight" time work.
RECORD LETTER
SKIP TO Q13
>
Do you ever have the opportunity to work overtime on your mainjob?
1 YES2 NO
(IF YES) Which of the following most closely describes yourhourly wage rate for those overtime hours?
>
1 STRAIGHT TIME2 TIME AND A HALF3 DOUBLE TIME4 TRIPLE TIME
Approximately, how many hours of overtime do you workin an average week HOURS
108

A.B.C.D.E.F.G.H.I.J.K.L.M.N.0.P.
CARD Q12SAL
Less than $6,000$ 6,000 - 6,999$ 7,000 - 7,999$ 8,000 - 8,999$ 9,000 - 9,999$10,000 - 10,999$11,000 - 11,999$12,000 - 12,999$13,000 - 13,999$14,000 - 14,999$15,000 - 17,499$17,500 - 19,999$20,000 - 22,499$22,500 - 24,999$25,000 - 27,499$27,500 - 29,999
Q. $29,999 - 34,999R. $35,000 - 39,999S. $40,000 - 44,999T. $45,000 - 49,999U. $50,000 - 54,999V. $55,000 - 59,999W. $60,000 - 69,999X. $70,000 - 79,999Y. $80,000 - 89,999Z. $90,000 - 99,999+
109

A.B.C.D.E.F.G.H.I.J.K.L.M.N.0.
Q.
CARD Ql2WAGE
Less than $3.00$ 3.00 - 3.49$ 3.50 - 3.99$ 4.00 - 4.49$ 4.50 - 4.99$ 5.00 - 5.49$ 5.50 - 5.99$ 6.00 - 6.49$ 6.50 - 6.99$ 7.00 - 7.49$ 7.50 - 7.99$ 8.00 - 8.49$ 8.50 - 8.99$ 9.00 - 9.49$ 9.50 - 9.99$10.00 - 10.49$10.50 - 10.99
R.S.T.U.V.W.X.Y.Z.AA.BB.CC.DD.
$11.00 - 11.49$11.50 - 11.99$12.00 - 12.99$13.00 - 13.99$14.00 - 14.99$15.00 - 15.99$16.00 - 16.99$17.00 - 17.99$18.00 - 18.99$19.00 - 19.99$20.00 - 20.99$21.00 - 21.99$22.00 or more
110

13. Have there been any other major changes in your life that you wouldlike to tell us about?
111