Embed Size (px)
Citation preview
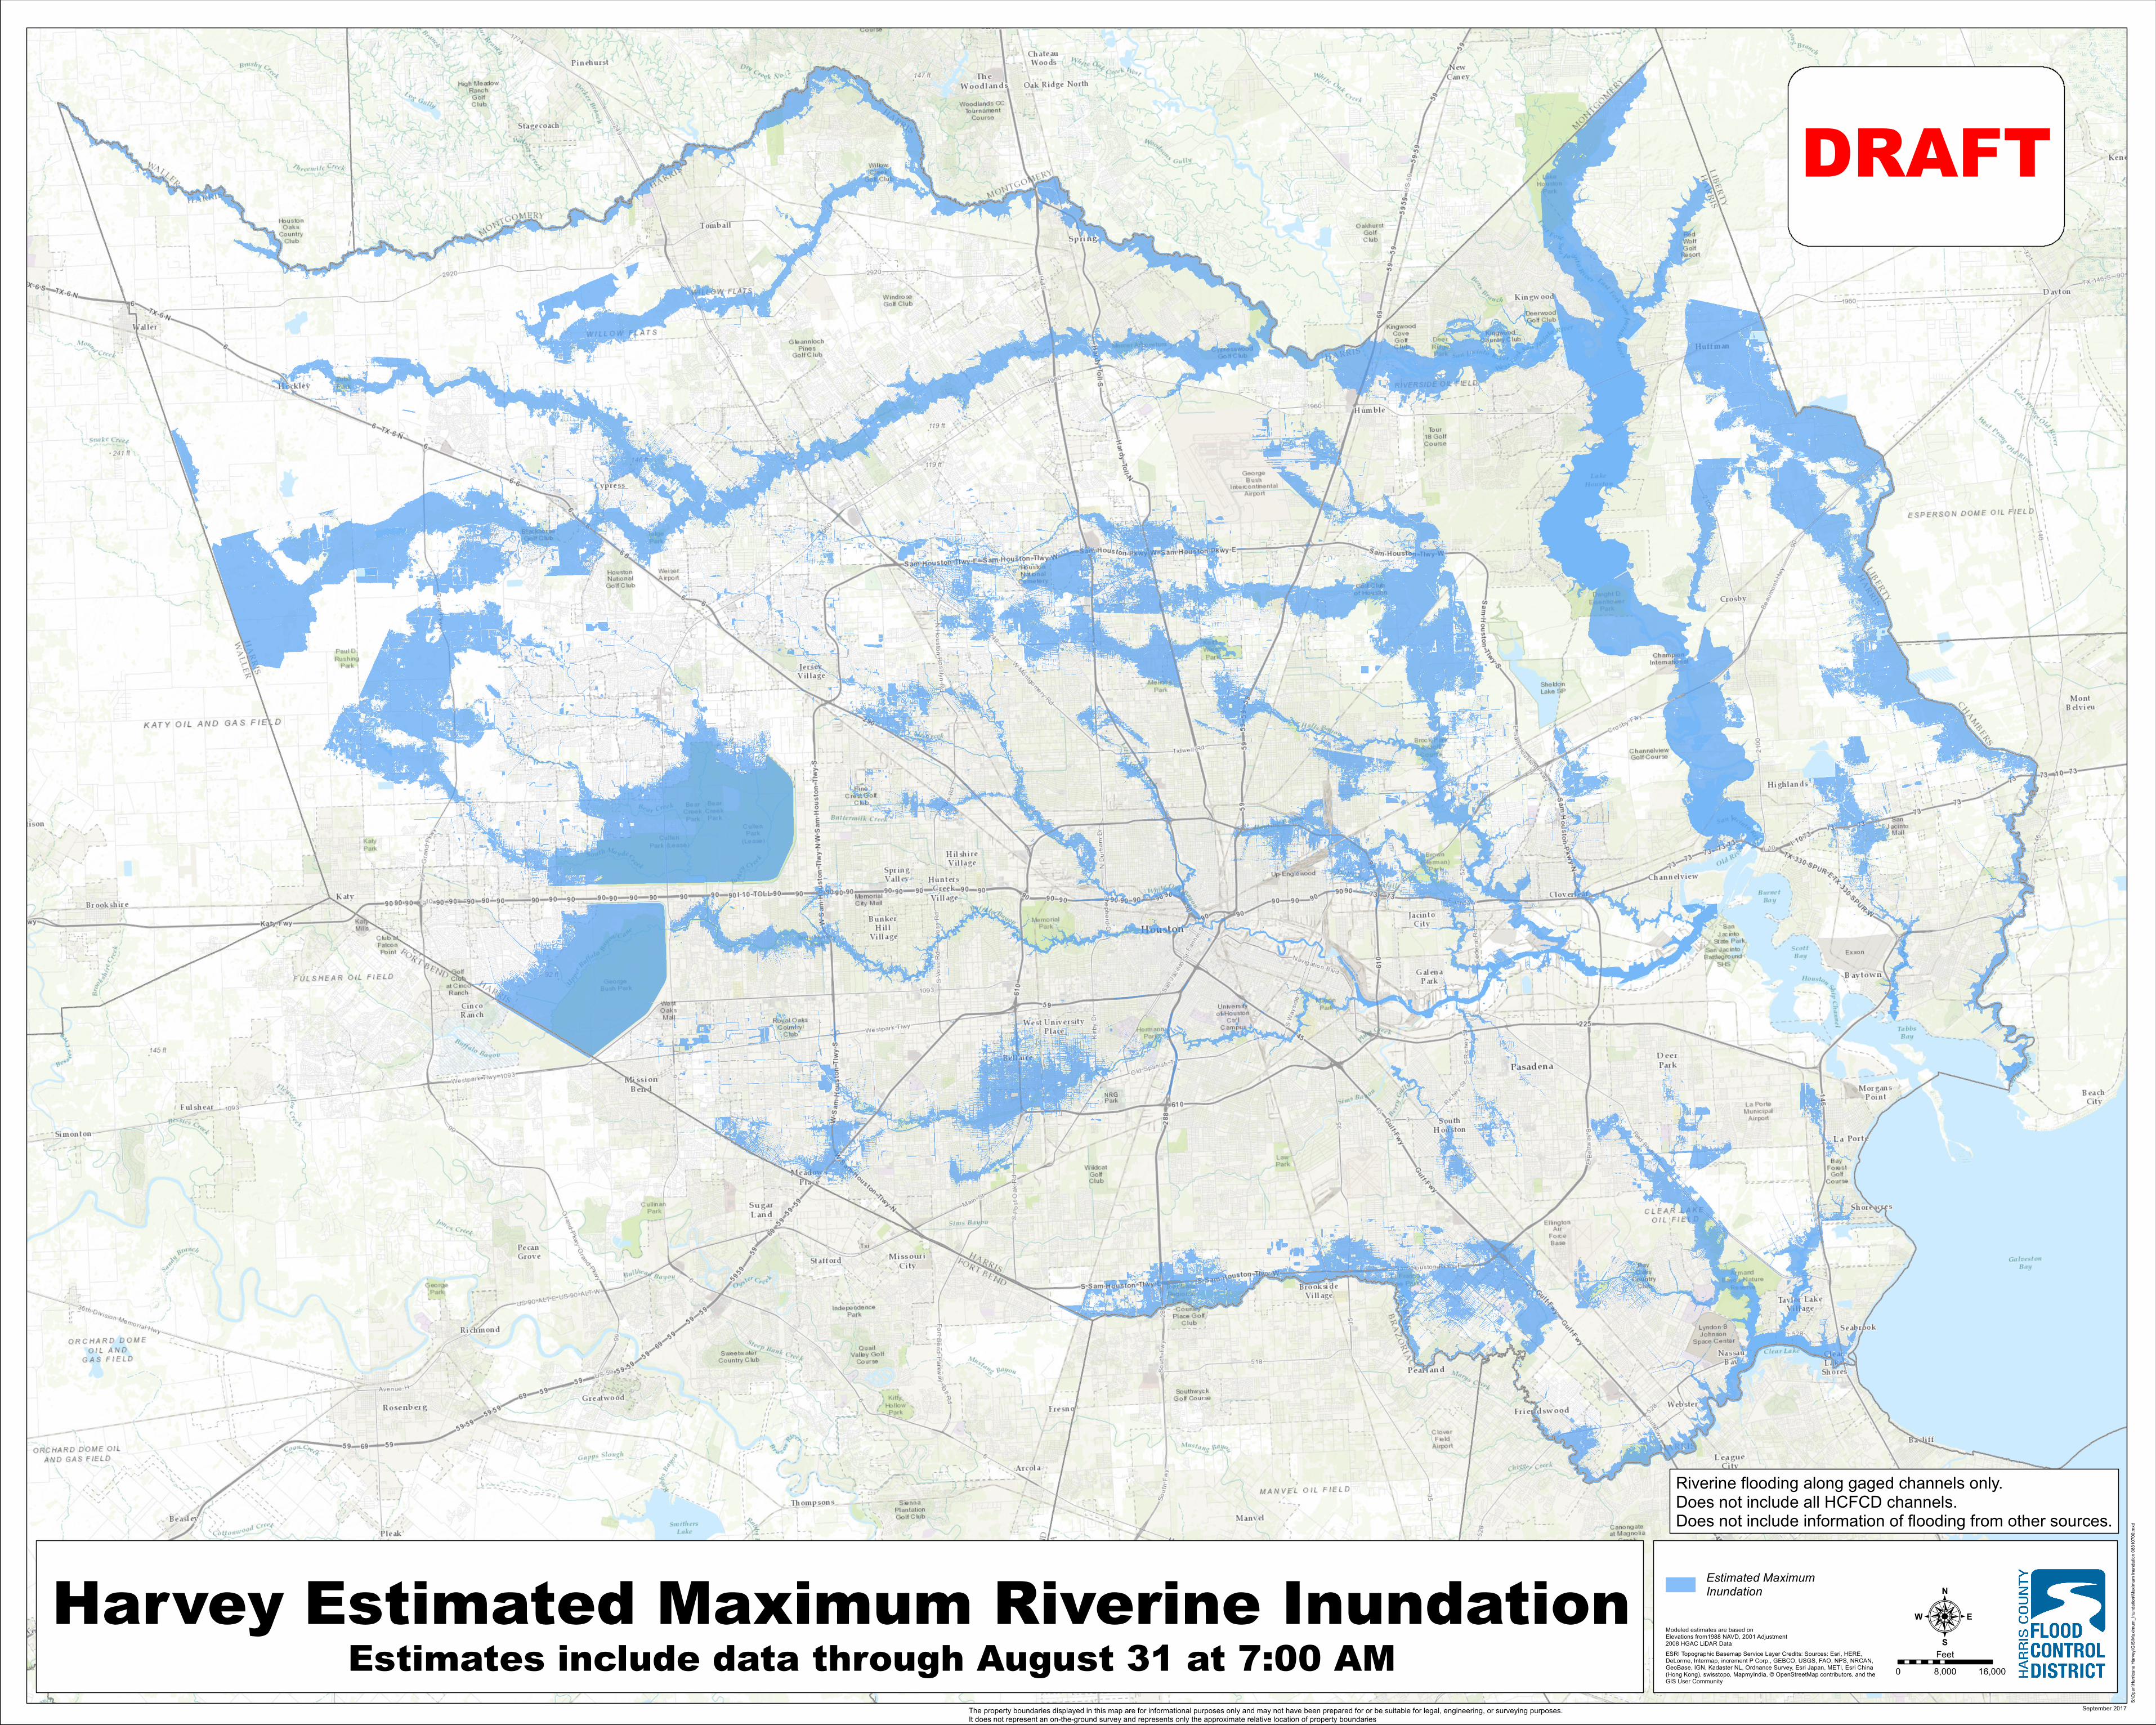
Harvey Estimated Maximum Riverine Inundation :
DRAFT
September 2017
S:\Op
en\H
urrica
ne H
arvey
\GIS
\Max
imum
_Inun
datio
n\Max
imum
Inun
datio
n 083
1070
0.mxd
Modeled estimates are based onElevations from1988 NAVD, 2001 Adjustment2008 HGAC LiDAR Data
The property boundaries displayed in this map are for informational purposes only and may not have been prepared for or be suitable for legal, engineering, or surveying purposes. It does not represent an on-the-ground survey and represents only the approximate relative location of property boundaries
Estimates include data through August 31 at 7:00 AM ESRI Topographic Basemap Service Layer Credits: Sources: Esri, HERE,DeLorme, Intermap, increment P Corp., GEBCO, USGS, FAO, NPS, NRCAN,GeoBase, IGN, Kadaster NL, Ordnance Survey, Esri Japan, METI, Esri China(Hong Kong), swisstopo, MapmyIndia, © OpenStreetMap contributors, and theGIS User Community
Estimated MaximumInundation
0 8,000 16,000Feet
Riverine flooding along gaged channels only.Does not include all HCFCD channels. Does not include information of flooding from other sources.