Embed Size (px)
Citation preview
Draft Final Report: DMU Hybrid Concept
Evaluation - Follow on Work DfTRG/0078/2007
Birmingham Research and Development Limited
Dr Stuart Hillmansen, Dr Clive Roberts
Dr Andrew McGordon, Dr Paul Jennings
www.railway.bham.ac.uk
March 10, 2009
1
Contents
1 Introduction 3
1.1 Objectives overview . . . . . . . . . . . . . . . . . . . . . . . . . 3
1.1.1 The scope of the model . . . . . . . . . . . . . . . . . . . 3
1.1.2 Scope of the study . . . . . . . . . . . . . . . . . . . . . . 4
1.1.3 Notable assumptions . . . . . . . . . . . . . . . . . . . . . 4
2 Modelling methodology 5
2.1 Vehicle modelling . . . . . . . . . . . . . . . . . . . . . . . . . . 5
2.1.1 Vehicles . . . . . . . . . . . . . . . . . . . . . . . . . . . 6
2.1.2 Routes . . . . . . . . . . . . . . . . . . . . . . . . . . . . 7
2.1.3 Vehicle journeys . . . . . . . . . . . . . . . . . . . . . . . 10
2.2 Hybrid propulsion system modelling . . . . . . . . . . . . . . . . . 14
2.3 Summary of vehicle propulsion model and control strategy . . . . . 15
3 Results 16
3.1 Fuel economy results . . . . . . . . . . . . . . . . . . . . . . . . . 16
3.1.1 Class 150 . . . . . . . . . . . . . . . . . . . . . . . . . . . 16
3.1.2 Pacer . . . . . . . . . . . . . . . . . . . . . . . . . . . . . 19
3.2 EV Operation - Welsh Valleys line . . . . . . . . . . . . . . . . . . 20
3.3 Plug in vehicle . . . . . . . . . . . . . . . . . . . . . . . . . . . . 21
3.4 Downsized engine . . . . . . . . . . . . . . . . . . . . . . . . . . 22
4 Discussion and economic analysis 23
4.1 Payback times . . . . . . . . . . . . . . . . . . . . . . . . . . . . 23
4.2 Vehicle mass . . . . . . . . . . . . . . . . . . . . . . . . . . . . . 23
4.3 Battery characteristics . . . . . . . . . . . . . . . . . . . . . . . . 24
4.4 Comparison of predictions with available data . . . . . . . . . . . . 25
4.5 Comparison of transport modes . . . . . . . . . . . . . . . . . . . 26
5 Summary of results and discussion 27
2
1 INTRODUCTION
1 Introduction
The UK railway network contains a number of routes which are served by diesel
multiple units (DMUs). On those routes which are lightly used, the case for electri-
fication may not be as strong. If in the future hybrid DMUs are to be deployed on
these routes, then there may be significant energy savings in comparison to more
conventional rolling stock. Hybrid vehicles have at least two on board sources of
energy which can be used to provide the tractive effort. The energy savings benefit
of hybrids originates from the capture and reuse of braking energy and the more
effective operation of the prime mover.
1.1 Objectives overview
This report details the work done under the contract DFTRF/0078/2007 which
aimed to demonstrate the technical feasibility of a hybrid concept for typical In-
ter/Inner Urban DMU trains. The work included identifying the likely costs and
benefits, including the reduction in harmful emissions. It also considered the effect
of optimizing the vehicle for a specific route, and then operating the vehicle on a
substantially different mission. The final model developed in the course of the work
is capable of assessing the viability of a range of hybrid configurations.
1.1.1 The scope of the model
The model was built upon the previous work commissioned by the DfT which
assessed the feasibility of hybrid traction for high speed trains [1]. The scope of
the current model included:
• Testing an optimum configuration of Hybrid DMU for each service type.
• Testing a general configuration able to operate over each of services specified.
• Account of the variation in hotel power due to seasonal effects.
• The amount of energy that can be recovered through regenerative braking.
• The required capacity for the energy storage devices.
• The key parameters of the energy storage devices including cost.
• The ability to perform a sizing exercise on all element of the propulsion system
and on the basic parameters for the train e.g. weight.
3
1.1 Objectives overview
• A method to determine the advantages that can be gained from better engine
management strategies made possible due to hybrid stock.
• The use of performance characteristics optimised for Hybrid DMU trains.
• The different energy demands for stationary, accelerating, coasting and de-
celerating vehicles and the effect of different driving techniques.
1.1.2 Scope of the study
The scope of the study considered:
• Routes in and around the Birmingham area.
• The Welsh Valleys lines.
• Typical stock types including class 150, Pacers, 153, 144.
• Performance characteristics to include that of existing modern stock e.g. 170s
or 172s.
• The amount of energy used by a DMU vehicle operating on the services
specified in this brief with typical loading factors.
• Energy values for a whole day’s operation including movements to and from
the depot and other empty coaching stock (ECS) moves for each service.
• Effects of energy management techniques including a constant charge strat-
egy (no net loss or gain over the day) and a battery discharge strategy (gradual
reduction in charge over the day supported by a night time charging cycle).
1.1.3 Notable assumptions
• The effect of driver style on energy consumption and hybridisation benefit
is significant. This study used a driver style which made maximum use of
electric regenerative braking. This has the effect of limiting the maximum
high speed deceleration rate (since braking is in effect constant power), and
therefore the journey time when operating in this mode is longer.
• The control strategy was tuned to achieve a constant overall state of charge.
The vehicles were modelled over typical duty cycles which represented a full
day of passenger service. The control strategy, when the vehicles are stabled
4
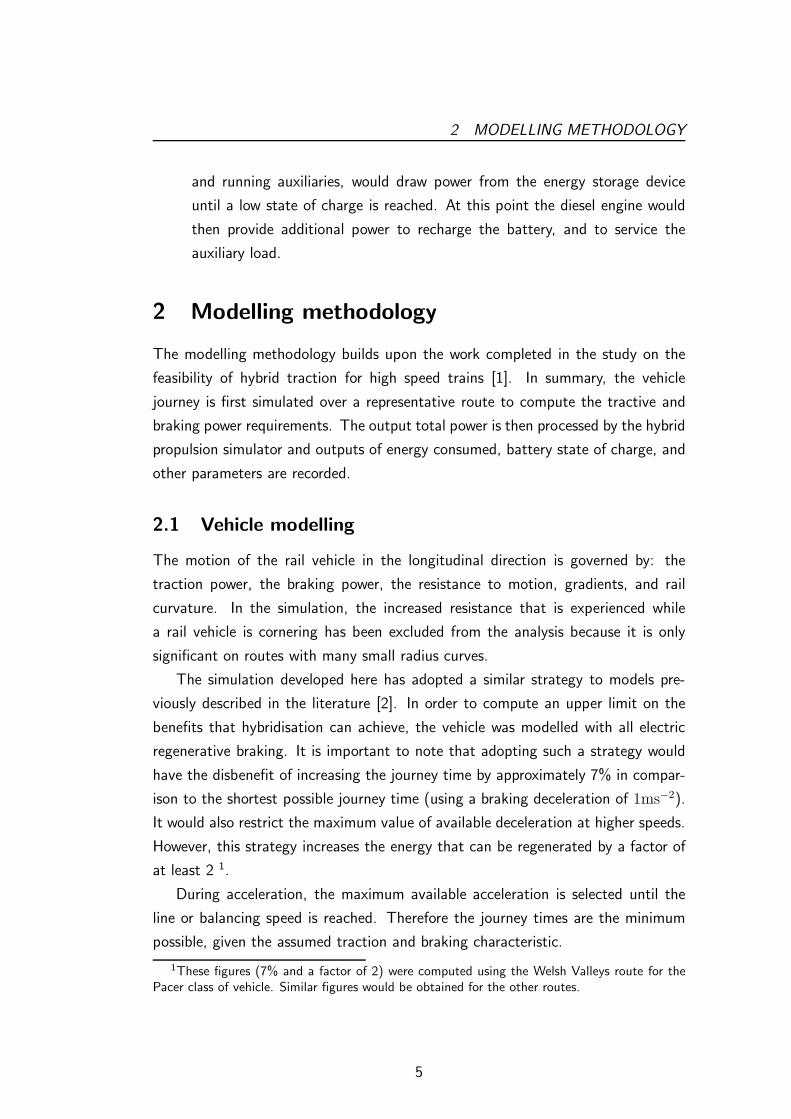
2 MODELLING METHODOLOGY
and running auxiliaries, would draw power from the energy storage device
until a low state of charge is reached. At this point the diesel engine would
then provide additional power to recharge the battery, and to service the
auxiliary load.
2 Modelling methodology
The modelling methodology builds upon the work completed in the study on the
feasibility of hybrid traction for high speed trains [1]. In summary, the vehicle
journey is first simulated over a representative route to compute the tractive and
braking power requirements. The output total power is then processed by the hybrid
propulsion simulator and outputs of energy consumed, battery state of charge, and
other parameters are recorded.
2.1 Vehicle modelling
The motion of the rail vehicle in the longitudinal direction is governed by: the
traction power, the braking power, the resistance to motion, gradients, and rail
curvature. In the simulation, the increased resistance that is experienced while
a rail vehicle is cornering has been excluded from the analysis because it is only
significant on routes with many small radius curves.
The simulation developed here has adopted a similar strategy to models pre-
viously described in the literature [2]. In order to compute an upper limit on the
benefits that hybridisation can achieve, the vehicle was modelled with all electric
regenerative braking. It is important to note that adopting such a strategy would
have the disbenefit of increasing the journey time by approximately 7% in compar-
ison to the shortest possible journey time (using a braking deceleration of 1ms−2).
It would also restrict the maximum value of available deceleration at higher speeds.
However, this strategy increases the energy that can be regenerated by a factor of
at least 2 1.
During acceleration, the maximum available acceleration is selected until the
line or balancing speed is reached. Therefore the journey times are the minimum
possible, given the assumed traction and braking characteristic.
1These figures (7% and a factor of 2) were computed using the Welsh Valleys route for thePacer class of vehicle. Similar figures would be obtained for the other routes.
5

2.1 Vehicle modelling
2.1.1 Vehicles
Two vehicles have been modelled. Their physical characteristics have been mod-
elled using representative data for the Class 150 and Pacer series of vehicles. Input
data was obtained from Angel Trains, the literature, and other sources. The trac-
tion characteristics were modified to simulate the type of traction that would be
available with a modern inverter driven vehicle. Because of this assumption in our
analysis, comparison of the results with actual data from these vehicles needs to
be made cautiously. The hybrid propulsion simulator is based on an electric se-
ries configuration, and therefore, issues such as the efficiency curve of the torque
converter do not need to be considered in this study. Table 1 shows the vehicle
parameters used to represent each class of vehicle. The tractive effort and resis-
tance to motion are shown in figure 1. The analysis in this work is broadly based
on existing diesel electric multiple unit (DEMU) configurations as shown in figure
2. Figure 2 also shows the necessary changes required to convert a DEMU into one
which contains an energy storage device interposed between the prime mover and
traction drive. It should be noted that the latest generation of traction drives are
inherently regenerative, and therefore bi-directional flow is possible.
Parameter Two coach Class 150 Two coach PacerDavis parameters:C 2.09 kN 1.35 kN
B 0.00983 kN/ms−1 0.00640 kN/ms−1
A 0.00651 kN/m2s−2 0.00422 kN/m
2s−2
Total mass 76.4 tonnes 49.5tonnesRotation allowance 8% 8%Power at rails 374 kW 233 kWMaximum speed 120 km/h 120 km/hMaximum traction force 40.5 kN 26.2 kNMaximum braking rate 0.49 ms−2 0.49 ms−2
Number of seats 124 121Number of coaches 2 2Dwell time 30 seconds 30 secondsTerminal station turnaround time 15 minutes 15 minutes
Table 1: Vehicle parameters.
6

2.1 Vehicle modelling
0 5 10 15 20 25 300
10
20
30
40
velocity (ms−1)
forc
es (
kN)
tractionresistanceacceleration
0 5 10 15 20 25 300
5
10
15
20
25
velocity (ms−1)
forc
es (
kN)
tractionresistanceacceleration
Figure 1: Tractive and resistive characteristics for the Class 150 (upper figure)and Pacer (lower figure) vehicles. The resistance is for level tangent track. Theavailable force for acceleration is also shown.
Vehicle motion validation A comparison was made with typical journeys on
both routes with GPS recorded position data. Data was captured using a portable
GPS logging system and later processed to aid comparison with the data produced
from the simulator for that particular journey. The comparison is illustrated in figure
3 which plots vehicle velocity against position. The simulator used a proportional
driver controller to achieve the best reasonable fit to the recorded data.
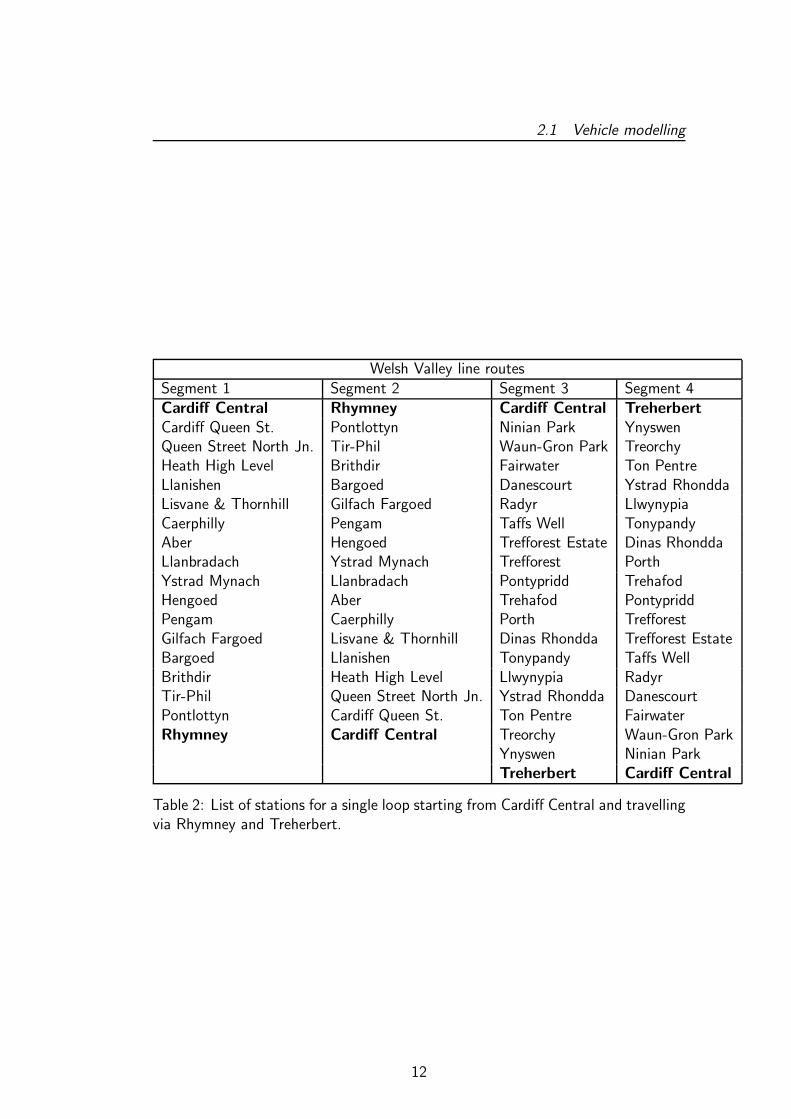
2.1.2 Routes
Two routes have been modelled in detail. The Welsh Valleys route begins at Cardiff
Central and then travels to Rhymney, back to Cardiff Central, then to Treherbet
and back to Cardiff. The full details of the stations on the route are shown in table
2. For the whole day cycle, this pattern was repeated 2 times.
7

2.1 Vehicle modelling
Figure 2: DEMU typical traction drive schematic: upper figure - conventionalDEMU system, lower figure - hybrid configuration with energy storage.
8

2.1 Vehicle modelling
0 5 10 15 20 25 30 35 400
10
20
30Stratford Upon Avon − Moor Street (Class 150)
distance (km)
velo
city
(m
s−1 )
GPS velocity Simulated velocity
0 2 4 6 8 10 12 140
5
10
15
20
25Trehafod − Treherbert (Pacer)
distance (km)
velo
city
(m
s−1 )
GPS velocity Simulated velocity
Figure 3: Comparison between simulated and GPS recorded position data for alimited section of the considered duty cycles.
9
2.1 Vehicle modelling
A similar approach was adopted for the Birmingham services. The trains began
their journey at Tyseley and travelled to Worcester Shrub Hill via Birmingham. On
the return the vehicle travelled through Birmingham and onto Stratford upon Avon.
The full details of the stations on the route are shown in table 3. For the whole
day cycle, this pattern was repeated 3 times.
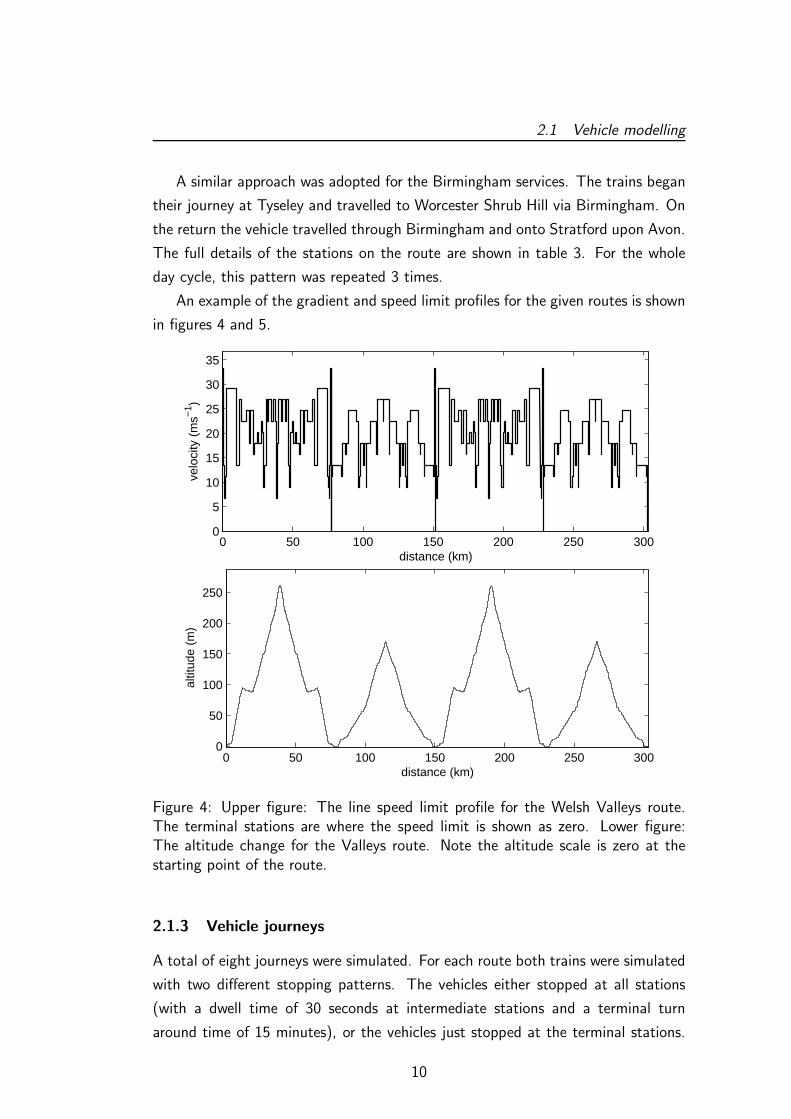
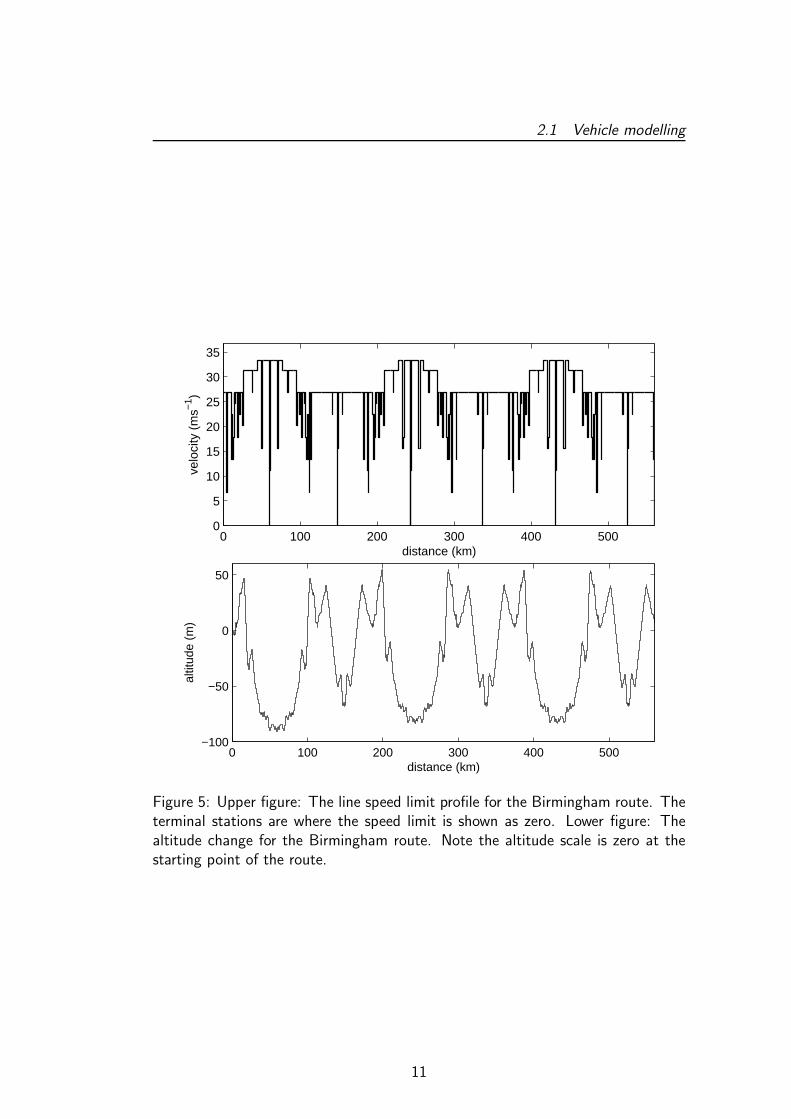
An example of the gradient and speed limit profiles for the given routes is shown
in figures 4 and 5.
0 50 100 150 200 250 3000
5
10
15
20
25
30
35
distance (km)
velo
city
(m
s−1 )
0 50 100 150 200 250 3000
50
100
150
200
250
distance (km)
altit
ude
(m)
Figure 4: Upper figure: The line speed limit profile for the Welsh Valleys route.The terminal stations are where the speed limit is shown as zero. Lower figure:The altitude change for the Valleys route. Note the altitude scale is zero at thestarting point of the route.
2.1.3 Vehicle journeys
A total of eight journeys were simulated. For each route both trains were simulated
with two different stopping patterns. The vehicles either stopped at all stations
(with a dwell time of 30 seconds at intermediate stations and a terminal turn
around time of 15 minutes), or the vehicles just stopped at the terminal stations.
10
2.1 Vehicle modelling
0 100 200 300 400 5000
5
10
15
20
25
30
35
distance (km)
velo
city
(m
s−1 )
0 100 200 300 400 500−100
−50
0
50
distance (km)
altit
ude
(m)
Figure 5: Upper figure: The line speed limit profile for the Birmingham route. Theterminal stations are where the speed limit is shown as zero. Lower figure: Thealtitude change for the Birmingham route. Note the altitude scale is zero at thestarting point of the route.
11
2.1 Vehicle modelling
Welsh Valley line routesSegment 1 Segment 2 Segment 3 Segment 4Cardiff Central Rhymney Cardiff Central Treherbert
Cardiff Queen St. Pontlottyn Ninian Park YnyswenQueen Street North Jn. Tir-Phil Waun-Gron Park TreorchyHeath High Level Brithdir Fairwater Ton PentreLlanishen Bargoed Danescourt Ystrad RhonddaLisvane & Thornhill Gilfach Fargoed Radyr LlwynypiaCaerphilly Pengam Taffs Well TonypandyAber Hengoed Trefforest Estate Dinas RhonddaLlanbradach Ystrad Mynach Trefforest PorthYstrad Mynach Llanbradach Pontypridd TrehafodHengoed Aber Trehafod PontypriddPengam Caerphilly Porth TrefforestGilfach Fargoed Lisvane & Thornhill Dinas Rhondda Trefforest EstateBargoed Llanishen Tonypandy Taffs WellBrithdir Heath High Level Llwynypia RadyrTir-Phil Queen Street North Jn. Ystrad Rhondda DanescourtPontlottyn Cardiff Queen St. Ton Pentre FairwaterRhymney Cardiff Central Treorchy Waun-Gron Park
Ynyswen Ninian ParkTreherbert Cardiff Central
Table 2: List of stations for a single loop starting from Cardiff Central and travellingvia Rhymney and Treherbert.
12

2.1 Vehicle modelling
Birmingham routesSegment 1 Segment 2 Segment 3Tyseley Birmingham Moore Street Worcester Shurb HillSmall Heath Birmngham Snow Hill Droitwich SpaBordesley Jewellery Quarter Regional Boundary
The Hawthorns HartleburySmethwick Galton Bridge KidderminsterLangley Green BlakedownRowley Regis HagleyOld Hill Stourbridge JunctionCradley Heath LyeLye Cradley HeathStourbridge Junction Old HillHagley Rowley RegisBlakedown Langley GreenKidderminster Smethwick Galton BridgeHartlebury The HawthornsRegional Boundary Jewellery QuarterDroitwich Spa Birmingham Snow Hill
Segment 3 Segment 4Birmingham Moore Street Stratford upon AvonBordesley WilmcoteSmall Heath Wootton WawenTyseley Henley in ArdenSpring Road DanzeyHall Green Wood EndYardley Wood the LakesShirley EarlswoodWhitlocks End WythallWythall Whitlocks EndEarlswood Shirleythe Lakes Yardley WoodWood End Hall GreenDanzey Spring RoadHenley in Arden TyseleyWootton WawenWilmcote
Table 3: List of stations for a single loop starting from Tyseley to BirminghamSnow Hill via Worcester Shurb Hill and Stratford upon Avon.
13

2.2 Hybrid propulsion system modelling
This second stopping pattern generates a duty cycle which is less favourable for
hybrids because there is less braking, and the mean power is greater. Duty cycles
such as this must be considered since the vehicle may be requested to undertake
such a journey in empty coaching stock movements.
2.2 Hybrid propulsion system modelling
The University Of Warwick through the ‘Premium Automotive Research and Devel-
opment (PARD) programme’ has developed a modelling structure to accommodate
the simulation of a wide range of hybrid vehicle powertrain architectures. In this
package of work, expertise generated in developing the modelling structure has been
used to generate a hybrid vehicle model to predict fuel consumption benefits of a
hybrid rail vehicle compared to conventional vehicles.
The structure of the model is as shown in figure 6. The model is a Matlab/Simulink R©
based simulation using the Stateflow toolbox to generate the hybrid supervisory
control.
Figure 6: Schematic of the model structure employed.
The power demands are calculated using the Birmingham rail simulator, and this
is used to provide the input to the Simulink model. Due to the constraints of the
component data available (primarily aimed at heavy duty automotive applications)
the power demand for the train was suitably scaled to allow the component data
already held by the PARD team to be used in the model. The consumption data
were then scaled up to provide meaningful results. The 2 coach Pacer vehicle
was modelled with two automotive diesel engines, and the 2 coach Class 150 was
modelled with 3 of the same automotive diesel engines.
This power demand is fed through to the Traction Motor block which modifies
this power demand by the efficiency of the motor. A constant value of 80% efficiency
was used for the traction motor. This is a conservative estimation and is likely to
be higher in reality. In addition a constant auxiliary load of 8.5 kW per engine
was added to the traction demand. The auxiliary load is representative of the peak
14

2.3 Summary of vehicle propulsion model and control strategy
loads that occur in the summer and winter. In more benign weather conditions, the
auxiliary loads are usually lower.
For a hybrid vehicle there is a choice of how to generate the electrical power
to satisfy the traction motor demand: Engine Gen-Set and battery. The purpose
of the controller is to satisfy the power demand of the traction motor as efficiently
as possible, according to a set of user defined rules. For the conventional case the
Gen-Set is used as the only source of power.
The Gen-Set block contains the engine map data with outputs of grams of fuel
used per second for inputs of torque and speed. In addition the engine torque
request from the supervisory controller is divided by the efficiency of the generator
(assumed to be a constant 95%). The engine map data is for a conventional bus
engine, and so is not necessarily representative of a rail diesel engine. Nevertheless,
it has a comparable power rating as would be necessary for light DMU duty.
The function of the battery block is to calculate the evolution of the battery
State of Charge (SoC) in response to the power demands made on the battery
by the supervisory controller. The data used is from a large Nickel Metal Hydride
(NiMH) chemistry battery pack. Typically NiMH batteries have a relatively narrow
band of allowed SoC swing in order to maintain a reasonable battery life. Both
vehicles were modelled with a 90 Ah NiMH battery per engine.
2.3 Summary of vehicle propulsion model and control strat-
egy
Vehicle Maximum power at wheels Engines used in hybrid simulationClass 150 374 kW 3 × 171 kW diesel engine = 513 kWPacer 234 kW 2 × 171 kW diesel engine = 342 kW
Table 4: Vehicle parameters.
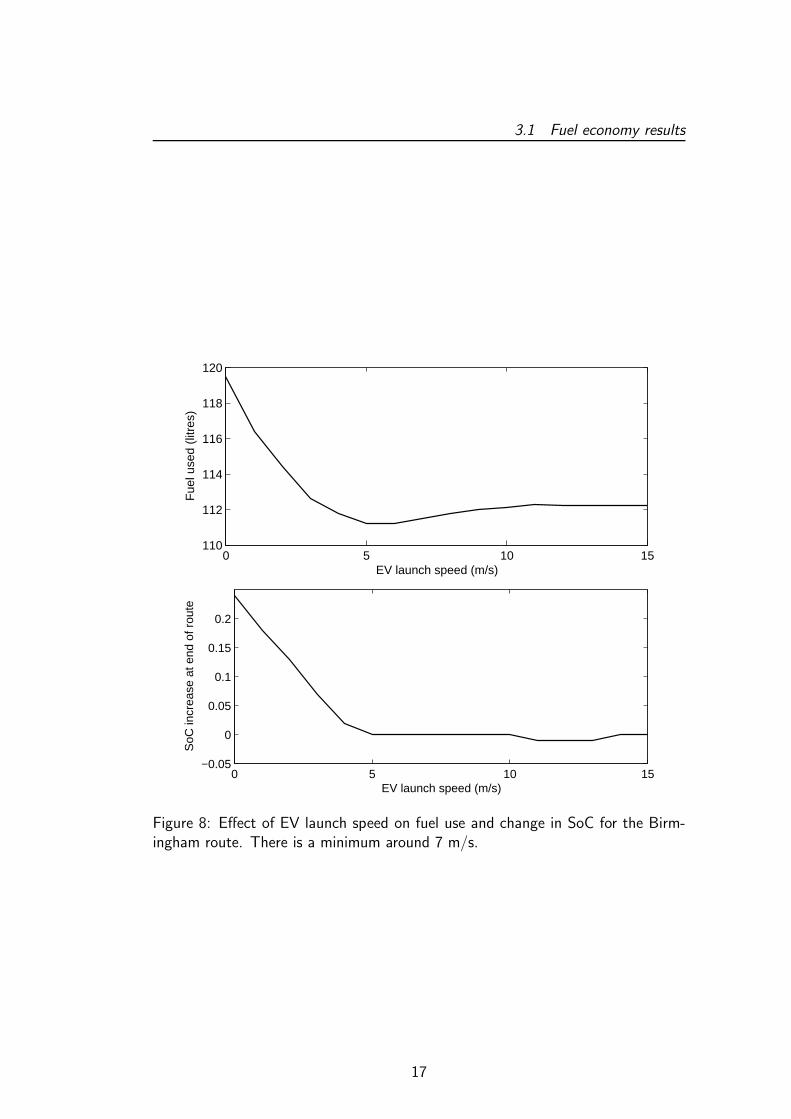
The hybrid control strategy attempts to operate the engine as efficiently as
possible, at its optimum operating point, which is the point of maximum operating
efficiency (figure 7). In addition, the strategy permits electric vehicle (engine off)
launch up to 7 m/s (approximately 15 mph), SoC permitting. This speed was
chosen as initial work showed that this gave the minimum fuel use and good control
of SoC, as shown in figure 8. The engines used in the simulation are shown in table
4.
If the SoC is below the minimum condition specified in the controller, the engine
starts as soon as a positive power is demanded of the vehicle. When the vehicle is
15

3 RESULTS
Figure 7: Schematic of engine map used in simulation.
stationary or braking the engine is switched off, not idled. In these conditions the
auxiliary loads are serviced electrically.
3 Results
3.1 Fuel economy results
3.1.1 Class 150
Table 5 shows the fuel use and CO2 emissions for the Class 150 over both of
the routes. Partly due to the difference in gradients, speed limits and the power
demands over the two routes, the fuel used and the benefit of hybridisation differ
considerably. The purpose of simulating an express route was to determine if the
selected hybrid configuration can complete the route at line speed, and without
a detrimental effect on the battery state of charge. The results suggest that the
vehicle configuration is suited to this duty cycle, but with limited benefit in the
hybrid configuration. In line with expectations, the benefit of hybridisation is greater
for those routes which have the realistic stopping patterns. The calculated benefit
16
3.1 Fuel economy results
0 5 10 15110
112
114
116
118
120
EV launch speed (m/s)
Fue
l use
d (li
tres
)
0 5 10 15−0.05
0
0.05
0.1
0.15
0.2
EV launch speed (m/s)
SoC
incr
ease
at e
nd o
f rou
te
Figure 8: Effect of EV launch speed on fuel use and change in SoC for the Birm-ingham route. There is a minimum around 7 m/s.
17

3.1 Fuel economy results
of approximately 20% is satisfactory considering the component models used and
the routes considered.
Drive Fuel Fuel Conv Hybrid ∆
Cycle Used Used Conv Hybrid CO2 CO2 SoC Benefit(Conv)ℓ (Hybrid)ℓ ℓ/100seat-km ℓ/100seat-km g/seat km g/seat km
VS 351.5 287.2 0.84 0.69 22.7 18.5 0 18%VE 235.1 241.5 0.56 0.58 15.2 15.6 0.3 -BS 679.6 502.9 0.88 0.65 23.7 17.5 -0.03 26%BE 478 441.5 0.62 0.57 16.7 15.4 0.02 8%
Table 5: Class 150 Hybrid Results: key VS - Valleys stopping; VE - Valleys express;BS- Birmingham stopping; BE - Birmingham express.
0 100 200 300 400 500 600
−400
−200
0
200
400
time (s)
Pow
er (
kW)
Battery powerEngine powerPower at wheels
Figure 9: Power for Class 150 over the first 600 seconds of the Welsh Valleys route.
Figure 9 shows an example of the power split during the first 600 seconds of the
Welsh Valleys route for the Class 150. The hybrid supervisory controller determines
the relative proportions of engine and battery power. During these cycles, the state
of charge in the battery evolves. This is shown in figures 10 and 11 for the Welsh
Valleys and Birmingham stopping services with Class 150 rolling stock. The plots
also shown the altitude of each route.
In both cases the engine is kept off whilst the vehicle is stationary at the respec-
tive termini stations. This means that the auxiliary loads are serviced electrically.
The SoC evolution shows that the control strategy allows a relatively narrow SoC
variation, of the order of 30%, which is consistent with the approach taken by
Toyota in their Prius hybrid cars.
In figures 10 and 11 it can be seen that the SoC shows some correlation with
altitude. Note the altitude is inverted in the plots in order for the correlation to
be more easily seen. For the Welsh Valleys route the minimum SoC is found to be
18

3.1 Fuel economy results
at the stations at the heads of the two valleys, at the highest altitudes. The SoC
recovers to between 80% from 50% from Treherbert to Cardiff, but only recovers to
between 60% from 50% from Rhymney to Cardiff, possibly reflecting the gradient
properties and line speeds of the two valleys. The route from Rhymney to Cardiff
has a greater altitude change but a more demanding drive cycle in terms of line
speed, whereas the route from Treherbert to Cardiff has a lower overall altitude
change, but also lower line speed limits. For the West Midlands route the effect of
geography is more complex. The journey from Worcester to Stratford shows that
the SoC behaves as expected from pure gradient considerations. The final part
of the journey from Birmingham to Worcester although downhill does not show a
marked increase in SoC; in fact the opposite trend can be seen. This effect can be
attributed to the speeds attained by the vehicle over this part of the route, which
features driving at 120 km/h which is the maximum on this route.
0 50 100 150 200 250 3000.4
0.5
0.6
0.7
0.8
distance (km)
Sta
te o
f Cha
rge
0 50 100 150 200 250 300−300
−200
−100
0
100
− A
ltitu
de (
m)
Figure 10: Altitude and SoC profile for Welsh Valleys route. Note the altitude isinverted to aid comparison with the SoC variation.
3.1.2 Pacer
This section presents the results for the Pacer vehicle. The overall results are
shown in table 6, which details the fuel use together with other computed data.
Four simulations were completed using the Pacer vehicle model. Because of the
similarity of the routes, the overall behaviour of the vehicle was very similar to
that modelled in the case of the Class 150. There are similar changes in SoC
and the journey times are comparable. The Pacer actually performs very well. It
is significantly lighter than the Class 150, but has the same capacity and similar
19
3.2 EV Operation - Welsh Valleys line
0 50 100 150 200 250 300 350 400 450 500 5500.1
0.2
0.3
0.4
0.5
distance (km)
Sta
te o
f Cha
rge
0 50 100 150 200 250 300 350 400 450 500 550−100
−50
0
50
100
− A
ltitu
de (
m)
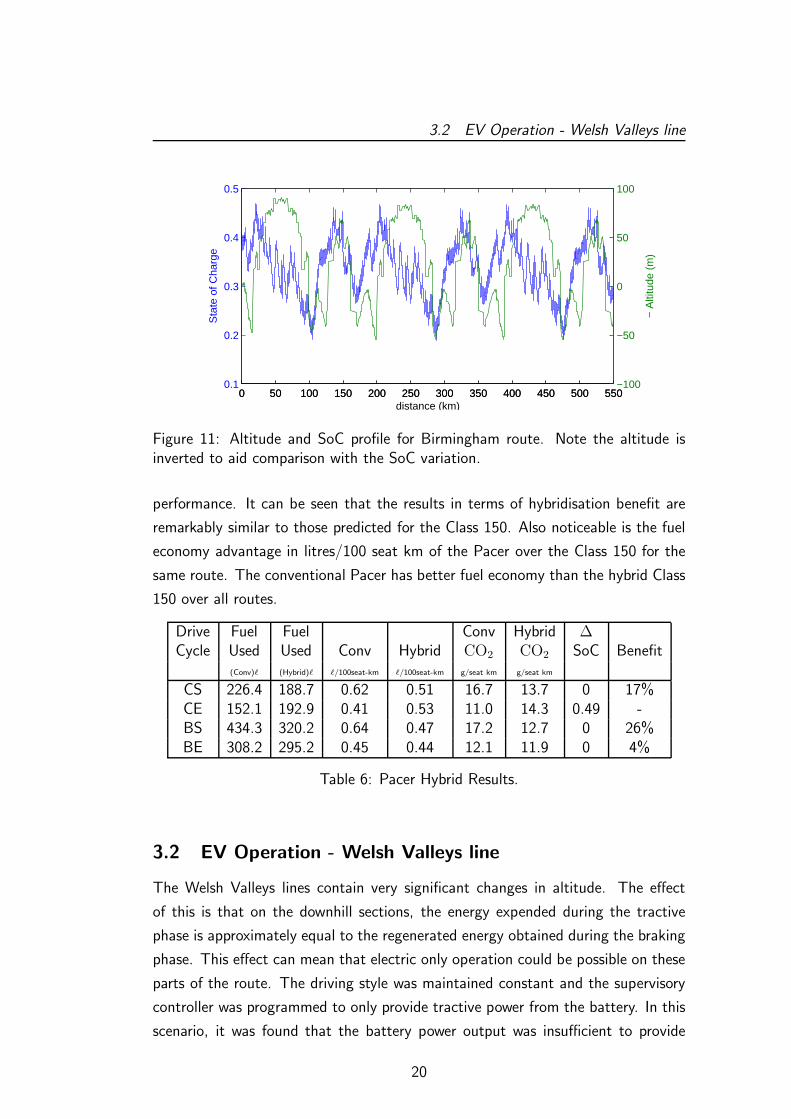
Figure 11: Altitude and SoC profile for Birmingham route. Note the altitude isinverted to aid comparison with the SoC variation.
performance. It can be seen that the results in terms of hybridisation benefit are
remarkably similar to those predicted for the Class 150. Also noticeable is the fuel
economy advantage in litres/100 seat km of the Pacer over the Class 150 for the
same route. The conventional Pacer has better fuel economy than the hybrid Class
150 over all routes.
Drive Fuel Fuel Conv Hybrid ∆
Cycle Used Used Conv Hybrid CO2 CO2 SoC Benefit(Conv)ℓ (Hybrid)ℓ ℓ/100seat-km ℓ/100seat-km g/seat km g/seat km
CS 226.4 188.7 0.62 0.51 16.7 13.7 0 17%CE 152.1 192.9 0.41 0.53 11.0 14.3 0.49 -BS 434.3 320.2 0.64 0.47 17.2 12.7 0 26%BE 308.2 295.2 0.45 0.44 12.1 11.9 0 4%
Table 6: Pacer Hybrid Results.
3.2 EV Operation - Welsh Valleys line
The Welsh Valleys lines contain very significant changes in altitude. The effect
of this is that on the downhill sections, the energy expended during the tractive
phase is approximately equal to the regenerated energy obtained during the braking
phase. This effect can mean that electric only operation could be possible on these
parts of the route. The driving style was maintained constant and the supervisory
controller was programmed to only provide tractive power from the battery. In this
scenario, it was found that the battery power output was insufficient to provide
20

3.3 Plug in vehicle
the demanded acceleration. However, the control strategy was altered to allow the
battery to provide up to 100 kW of power from Trehafod to Cardiff, which means
that the majority of driving can be accomplished in electric only mode. The SoC
evolution for the last return journey from Cardiff, figure 12, highlights the SoC
change in the last 50 minutes of the drive cycle.
0 1000 2000 3000 4000 5000 6000 7000 8000 90000
0.5
1
time (s)
Sta
te o
f Cha
rge
0 1000 2000 3000 4000 5000 6000 7000 8000 90000
20
40
spee
d (m
/s)
Figure 12: SoC Evolution over the last part of Welsh Valleys route in EnhancedHybrid Mode.
In order to achieve true electric only driving along the valley from Treherbert to
Cardiff, a battery pack per vehicle of 250Ah was required, almost three times the
proposed pack size. Electric only driving can be accomplished if the battery SoC at
Treherbert is 95%, which would necessitate further alteration of the control strategy
to achieve this, since typically the SoC at Treherbert is only 50%. If electric only
driving is accomplished, the final SoC is 10%, which is a dramatic swing in SoC
which would probably need a different battery chemistry to be able to repeatedly
cope with these discharges, or alternatively a still larger battery pack. It should be
noted, that it may be possible to drive in an effective EV mode at reduced power.
This is likely to lead to longer journey times.
3.3 Plug in vehicle
Although true electric-vehicle driving has not been realised with the current drive
cycle the effect of plugging the vehicle in to a shore supply has a positive effect on
the fuel consumption over the Welsh Valleys route. The fuel usage is now down to
269.2 ℓ, from 287.2 ℓ, leading to a benefit of 23% compared to the conventional
vehicle. On the Birmingham route, the benefits of plugging in the vehicle are less
21

3.4 Downsized engine
clear, partly due to the demands on the vehicle, and there is less scope for electric-
only driving on the Birmingham route. The last 13 minutes of the drive cycle were
accomplished in enhanced electric mode using electrical energy more aggressively
than the base hybrid vehicle. For this route and this strategy the fuel used reduced
to 497.6 ℓ from 502.9 ℓ, and the benefit of the hybrid increases to 27%.
3.4 Downsized engine
One of the potential benefits of hybridising an automotive vehicle is that there
is scope for downsizing the internal combustion engine. Previous work [1] has
shown that this is less possible for rail vehicles which use a significant proportion
of their maximum installed power at high speeds, whereas automotive vehicles use
maximum power only for acceleration in normal usage. However an investigation
into the possibility of downsizing was conducted for the Class 150 vehicle over the
Welsh Valleys route. The optimum installed engine power was found to be 465
kW. This compares with 513 kW in the initial simulations. The fuel consumption
differences are highlighted in the table below in table 7.
Installed engine power and Fuel used (ℓ) Benefit compared tovehicle type 513 kW conventional vehicle
513 kW Conventional 351.5 -513 kW Hybrid 287.2 18%
465 kW Conventional 349.1 1%465 kW Hybrid 277.7 21%
Table 7: Fuel consumption for 10% downsized engine over Welsh Valley route.
From table 7 it is evident that downsizing the engine on the hybrid vehicle has
a more positive impact on fuel consumption than downsizing the engine on the
conventional vehicle. The downsized hybrid vehicle was then simulated over the
Birmingham route, but was unable to meet the drive cycle without fully discharging
the battery. Due to the engine being used to recharge the battery pack for a
greater proportion of the journey (including terminus stops) the fuel use for the
downsized hybrid was greater than for the full engine sized hybrid. This illustrates
the difficulty with hybridising vehicles for rail applications. The recommendation in
this case must be to keep the original installed engine power on the vehicle rather
than seek to downsize the engines, if there is a possibility that the vehicle could be
used on both routes.
22

4 DISCUSSION AND ECONOMIC ANALYSIS
4 Discussion and economic analysis
4.1 Payback times
The fuel price assumed in this study was 70p/ℓ. The fuel assumed was conventional
road diesel rather than rail diesel fuel. The battery cost was estimated based on
three figures: Prius NiMH packs, generic NiMH and Li-Ion packs. The Class 150
requires three of the 32kWh packs at the following costs :
• £108k NiMh Prius packs
• £19.5k generic NiMH packs
• £36k generic Li-Ion packs.
The train on the Welsh Valleys route covers 303 kms per day, the train on
Birmingham route covers 560 kms per day. The days for payback are shown in
table 8. This has been calculated by equating the benefit of the fuel saved with the
capital cost of the battery. No net present value type analysis has been undertaken
and consideration other factors, such as maintenance costs, logistical issues, safety,
battery embedded energy, recycling cost and energy, must be taken into account in
a whole life cycle analysis.
Battery TypeDays for Payback
Cardiff BirminghamPrius NiMH 2400 871
Generic NiMH 433 157Generic Li-Ion 800 290
Table 8: Approximate payback times for different battery technologies on the tworoutes.
By assuming a battery lifetime of approximately 1000 cycles, then the lifetime
in service is 250 days for Welsh Valleys route, 333 for Birmingham. Therefore
according to table 8 the Birmingham route offers the best prospect for return on
investment in hybrid technology.
4.2 Vehicle mass
The vehicle mass in each of the simulations was kept constant. The mass of
the hybrid vehicle may be between 1260 and 1890 kg greater than the equivalent
conventional vehicle (for the two coach train). This is a relatively small percentage
23

4.3 Battery characteristics
of the overall vehicle mass, and therefore the effect of this increase in mass was
not investigated in detail since it is likely to have a marginal effect on the overall
energy consumption.
4.3 Battery characteristics
NiMH battery packs have a power density range of 100-1000 W/kg and energy
density range of 60-80Wh/kg [3]. The battery pack size used was of 32 kWh
capacity which gives approximately 630 kg for a pack mass; with approximately 15%
of the mass being pack infrastructure, with an associated volume of approximately
185 litres. The total useful mass of 530 kg would give a power rating of between
53 and 530 kW depending on the pack construction. The battery power demand
of the Class 150 peaks at approximately 125 kW, which indicates that the battery
pack requires a power density of more than 250 W/kg. This is towards the lower
end of the range quoted above. This agreed with the data from the Toyota Prius
NiMH pack which has a capacity of 1.3 kWh, and a maximum power rating of
20kW; scaling this pack for capacity gives a peak power capability of approximately
500 kW.
The same source of information gives Lithium Ion battery packs as 300-1000
W/kg and 120-140Wh/kg which are approximately twice as energy dense as NiMH
cells.
The battery lifetime has been assumed to be 1000 cycles to determine the
payback period. This number varies significantly depending on the source of the
data, the definition of lifetime and the usage patterns. Schmitz has quoted a 20%
loss of power at 2,300 cycles at 80% depth of discharge, 4,900 cycles at 50% depth
of discharge, and more than 1,000,000 cycles at 2.5% depth of discharge.
Toyota has issued the following statement about battery life of its NiMH battery
packs : “. . . The Prius battery has been designed to maximise battery life. In part
this is done by keeping the battery at an optimum charge level - never fully draining
it and never fully recharging it. As a result, the Prius battery leads a pretty easy life.
We have lab data showing the equivalent of 180,000 miles with no deterioration
and expect it to last the life of the vehicle. . . Since the car went on sale in 2000,
Toyota has not replaced a single battery for wear and tear”.
It should be noted here that battery lifetime is not defined universally. For
example, battery life can be defined as “number of cycles possible until battery
capacity falls to 90% of the initial value”. This is very different from “number of
cycles to battery failure”. It should also be noted that a battery with only 90% of
24

4.4 Comparison of predictions with available data
initial usable capacity may be useful for many more cycles. This further complicates
the consideration of hybrid and electric vehicles as it is not possible to clearly de-
fine the expected lifetime of one of the most expensive traction components. The
efficiency of the battery as a storage device may also change during its lifetime,
meaning that the potential benefits of hybridisation may diminish with the life of
the battery. Li-Ion batteries have a greater tolerance of wider state of charge fluc-
tuations. A123’s Li-Ion cells have been lifetime tested at 100% depth of discharge
to give 2,300 cycles for 10% loss of initial capacity.
In order to get a more accurate estimate of battery lifetimes, it is necessary
to perform testing of the batteries over the expected drive cycles. This is because
the lifetime is dependent on many different parameters. The battery management
system for the two chemistries is also different. For the NiMH chemistry it is
considered sufficient to include just battery pack level management; for Lithium-
Ion cells, cell level management is necessary. Battery costs are also notoriously
volatile. Nickel costs peaked in May 2007 at 27,500/ton. The price at December
2008 was 6,600/ton. This will have a large impact on the price of NiMH batteries.
For Lithium-Ion chemistries, the lithium metal is not the dominant cost factor;
the separator between the anode and cathode is the most expensive element of
this battery type. This separator is unlikely to reduce considerably in price in the
immediate future.
4.4 Comparison of predictions with available data
The results presented in this report can be compared to the available measured data.
Information is available for the Class 156 Super Sprinter [Energy Report Final.pdf]
which can be compared to the results presented for the Class 150 Sprinter. The
Class 156 Super Sprinter emits 14.2 g/seat km, compared to the non-hybrid Class
150 of 23.2 g/seat km. However, the data for the Class 156 is for services that
have a top speed of 90 km/h, whereas over the routes simulated the Class 150
achieves 120 km/h. This is one of the reasons why there is a discrepancy in CO2
emission figures between these two very similar vehicles. The aerodynamic term
for rail vehicles is more important than the rolling resistance term at higher speeds.
The 30 km/h difference in speeds is expected to lead to approximately one quarter
more demand at the higher speed compared to the lower speed. Data from [4]
indicate that the Class 221 Voyager has 35 g/seat km, and the Class 170 Turbostar
emits 24 g/seat km. Direct comparison with these services is difficult due to the
radially different duty cycles that they are subjected to.
25
4.5 Comparison of transport modes
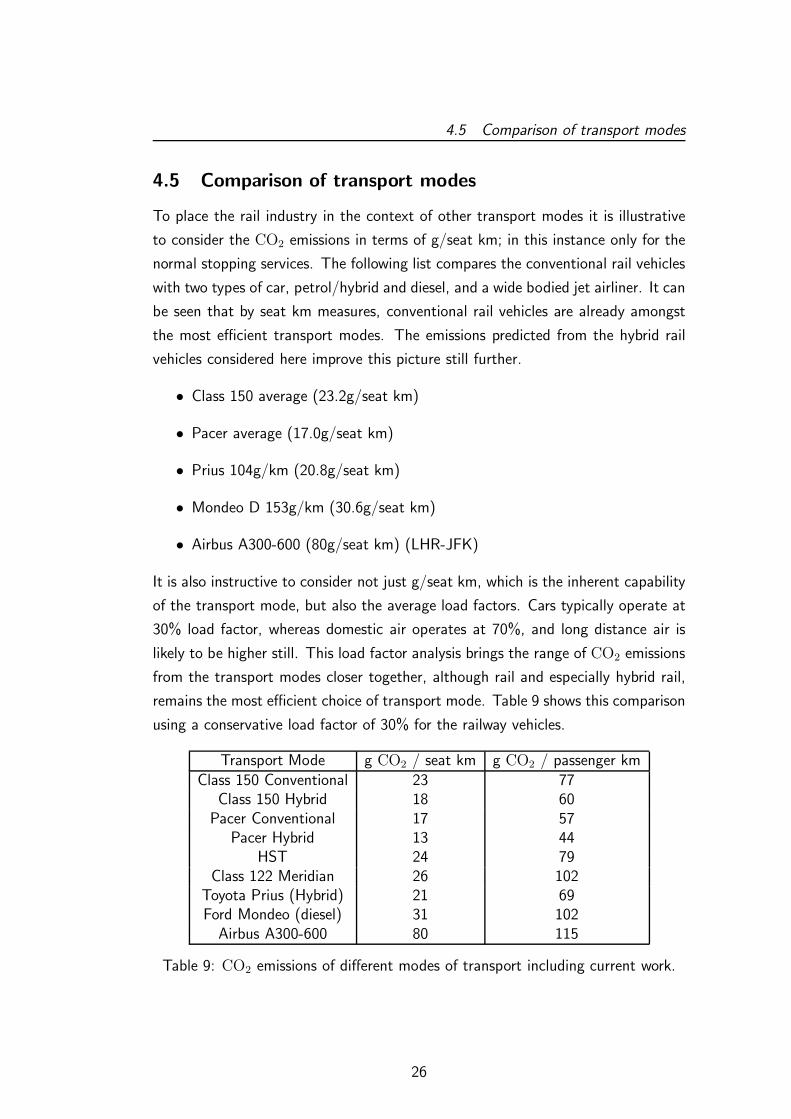
4.5 Comparison of transport modes
To place the rail industry in the context of other transport modes it is illustrative
to consider the CO2 emissions in terms of g/seat km; in this instance only for the
normal stopping services. The following list compares the conventional rail vehicles
with two types of car, petrol/hybrid and diesel, and a wide bodied jet airliner. It can
be seen that by seat km measures, conventional rail vehicles are already amongst
the most efficient transport modes. The emissions predicted from the hybrid rail
vehicles considered here improve this picture still further.
• Class 150 average (23.2g/seat km)
• Pacer average (17.0g/seat km)
• Prius 104g/km (20.8g/seat km)
• Mondeo D 153g/km (30.6g/seat km)
• Airbus A300-600 (80g/seat km) (LHR-JFK)
It is also instructive to consider not just g/seat km, which is the inherent capability
of the transport mode, but also the average load factors. Cars typically operate at
30% load factor, whereas domestic air operates at 70%, and long distance air is
likely to be higher still. This load factor analysis brings the range of CO2 emissions
from the transport modes closer together, although rail and especially hybrid rail,
remains the most efficient choice of transport mode. Table 9 shows this comparison
using a conservative load factor of 30% for the railway vehicles.
Transport Mode g CO2 / seat km g CO2 / passenger kmClass 150 Conventional 23 77
Class 150 Hybrid 18 60Pacer Conventional 17 57
Pacer Hybrid 13 44HST 24 79
Class 122 Meridian 26 102Toyota Prius (Hybrid) 21 69Ford Mondeo (diesel) 31 102
Airbus A300-600 80 115
Table 9: CO2 emissions of different modes of transport including current work.
26

5 SUMMARY OF RESULTS AND DISCUSSION
5 Summary of results and discussion
A model of a hybrid train with distributed traction has been generated using existing
component libraries (derived from heavy duty automotive applications), and a hybrid
supervisory control strategy generated. The model has been developed in a modular
manner in order to allow for future evaluation of alternative hybrid railway vehicle
designs. This includes standard series hybrids, and with minor modifications, dual
mode and fuel cell powered vehicles. The model has been applied to DMU type
vehicles running on routes in the Welsh Valleys, and routes around the Birmingham
area. The results from this study are based on the hybrid DEMU architecture as
shown in figure 2.
In order to undertake this study, a number of key assumptions have been made:
1. The vehicles modelled were based on 2 coach Class 150 and Pacer type
vehicles.
2. The hybrid architecture was based on a series configuration with a diesel
prime mover. A number of different configurations and supervisory control
strategies were used to explore the feasibility of the hybrid vehicle.
3. The vehicle was driven over simulate routes which included routes around the
Welsh Valleys and the routes around Birmingham. Actual speed limit profiles
and gradients were used. The trains ran on clear routes with no signalling
conflicts.
4. A 30 second dwell time and 15 minute turn around time was used at terminal
stations.
5. The mass of the vehicle for both conventional drive train and hybrid was
assumed to be the same. Although in the hybrid case there is additional
mass due to the battery packs, there are likely to be mass savings in key
components such as engine downsizing, fuel tank size, and braking resistor
reduction.
6. The battery was based on a set of NiMH battery packs.
The key findings of the study are:
1. The work has demonstrated the viability of hybridising either a Pacer or Class
150 commuter train, for both routes. Fuel consumption benefits of up to 25%
27

5 SUMMARY OF RESULTS AND DISCUSSION
can be realised by hybridisation, with the Welsh Valleys route offering slightly
more benefit than the West Midlands route.
2. Downsizing the engine on the Class 150 leads to a slight increase in fuel
saving over the Welsh Valleys route, but cannot be recommended for the West
Midlands route. The recommendation must be to retain future flexibility in
train route allocation that the hybrid vehicle retains the full sized engine of
the conventional vehicle.
3. An electric launch speed of approximately 20 km/h offers the best balance of
usable electric vehicle launch speed, fuel consumption savings and control of
battery state of charge. There is further scope within the modelling structure
to consider more specific electric only driving range requirements.
4. A 90Ah NiMH battery pack was chosen for the simulations. Different sized
packs were investigated but due to the nature of the vehicle, route and control
strategy these different sized packs offered little extra in terms of fuel savings.
The main impact of different sized packs was a difference in SoC swing over
the route, with smaller packs having greater SoC swings. Smaller packs of a
different chemistry, for example, Lithium Ion, which offer better performance
over wider SoC swings may be attractive in this case.
5. The effect of battery pack mass on the vehicle performance was not included.
The marginal effect of mass increase in hybrid trains is lower than conventional
trains. This may have an impact on performance and/or passenger numbers
able to be carried.
6. The full sized hybrids (no engine downsizing) on both routes were able to
drive the auxiliary loads handled electrically at the terminal stations.
7. The West Midlands route offers the greatest potential for fuel savings through
hybridisation.
8. The Welsh Valleys route offers the best potential for electric only driving.
9. The West Midlands route appears to offer a suitable return on investment
considering fuel and battery costs alone. The energy savings calculated in
this study have not attempted to account for the embedded energy contained
in the battery due to fabrication and delivery, and decommissioning. A full
energy audit of this process should be conducted as part of further investiga-
tions.
28

REFERENCES REFERENCES
10. No thermal modelling is used for any of the traction components including
the battery. Accounting for this would lead to lower predicted benefits from
the hybrid technology.
11. Hybridising the Class 150 vehicle allows the emissions performance to ap-
proach that of the Pacer non-hybrid. This is analogous to the situation in
the automotive sector where hybridisation allows a vehicle to move down a
segment in terms of CO2 emissions performance.
12. Although the plug-in vehicles offer slightly greater fuel savings than the non-
plug-in hybrid, the CO2 savings will not be as great due to the CO2 associated
with grid electricity.
References
[1] Hillmansen S, Roberts C, McGordon A, and Jennings P. Final report: Concept
validation for hybrid trains contract reference no: Dftrg/0078/2007. Birming-
ham Research and Development Limited, 2008.
[2] Hillmansen S and Roberts C. Energy storage devices in hybrid railway vehicles: a
kinematic analysis. Proc. IMechE Part F: J. Rail and Rapid Transit, 221(1):135–
143, 2007.
[3] Schmitz C, Koehler U, and Blanchard P. Johnson controls - saft advanced power
solution. in Proceedings of the 19th International AVL Engine and Environment
Conference Sept 6th-7th Graz, Austria, 2007.
[4] Kemp R. T618 - traction energy metrics. Rail Safety and Standards Board,
2007.
29