Embed Size (px)
Citation preview
DRAFT FINAL
QUALITY ASSURANCE PROJECT PLAN
VOLUME 1
Gowanus Canal Superfund Site
Remedial Investigation and Feasibility Study – Phase 3
Brooklyn, New York
Prepared for:
U.S. ENVIRONMENTAL PROTECTION AGENCY
Prepared under:
Contract No. EP-W-09-009
Work Assignment WA No. 013-RICO-02ZP /
June 15, 2010
NONDISCLOSURE STATEMENT
This document has been prepared for the U.S. Environmental Protection Agency Region 2. The material contained herein is not
to be disclosed to, discussed with, or made available to any persons for any reason without the prior expressed approval of a
responsible official of the U.S. Environmental Protection Agency Region 2.
Title: Gowanus Canal RI/FS
Revision Number: 1
Revision Date: June 15, 2010
Page 2 of 83
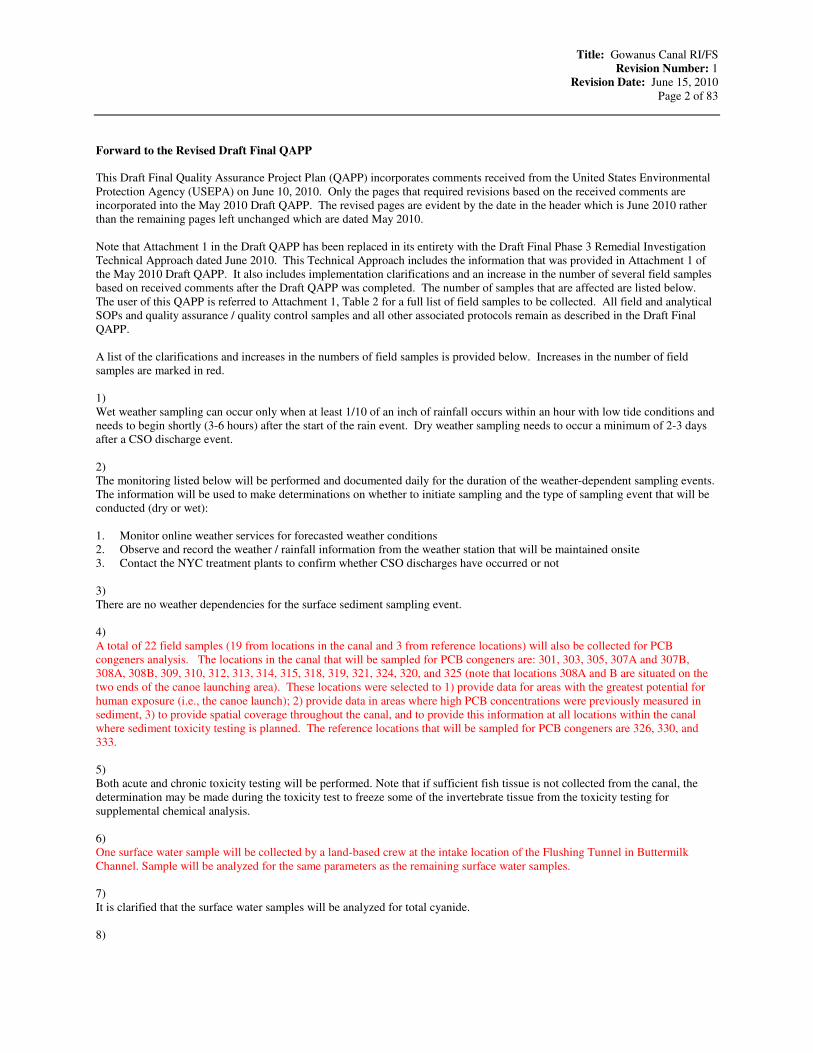
Forward to the Revised Draft Final QAPP
This Draft Final Quality Assurance Project Plan (QAPP) incorporates comments received from the United States Environmental
Protection Agency (USEPA) on June 10, 2010. Only the pages that required revisions based on the received comments are
incorporated into the May 2010 Draft QAPP. The revised pages are evident by the date in the header which is June 2010 rather
than the remaining pages left unchanged which are dated May 2010.
Note that Attachment 1 in the Draft QAPP has been replaced in its entirety with the Draft Final Phase 3 Remedial Investigation
Technical Approach dated June 2010. This Technical Approach includes the information that was provided in Attachment 1 of
the May 2010 Draft QAPP. It also includes implementation clarifications and an increase in the number of several field samples
based on received comments after the Draft QAPP was completed. The number of samples that are affected are listed below.
The user of this QAPP is referred to Attachment 1, Table 2 for a full list of field samples to be collected. All field and analytical
SOPs and quality assurance / quality control samples and all other associated protocols remain as described in the Draft Final
QAPP.
A list of the clarifications and increases in the numbers of field samples is provided below. Increases in the number of field
samples are marked in red.
1)
Wet weather sampling can occur only when at least 1/10 of an inch of rainfall occurs within an hour with low tide conditions and
needs to begin shortly (3-6 hours) after the start of the rain event. Dry weather sampling needs to occur a minimum of 2-3 days
after a CSO discharge event.
2)
The monitoring listed below will be performed and documented daily for the duration of the weather-dependent sampling events.
The information will be used to make determinations on whether to initiate sampling and the type of sampling event that will be
conducted (dry or wet):
1. Monitor online weather services for forecasted weather conditions
2. Observe and record the weather / rainfall information from the weather station that will be maintained onsite
3. Contact the NYC treatment plants to confirm whether CSO discharges have occurred or not
3)
There are no weather dependencies for the surface sediment sampling event.
4)
A total of 22 field samples (19 from locations in the canal and 3 from reference locations) will also be collected for PCB
congeners analysis. The locations in the canal that will be sampled for PCB congeners are: 301, 303, 305, 307A and 307B,
308A, 308B, 309, 310, 312, 313, 314, 315, 318, 319, 321, 324, 320, and 325 (note that locations 308A and B are situated on the
two ends of the canoe launching area). These locations were selected to 1) provide data for areas with the greatest potential for
human exposure (i.e., the canoe launch); 2) provide data in areas where high PCB concentrations were previously measured in
sediment, 3) to provide spatial coverage throughout the canal, and to provide this information at all locations within the canal
where sediment toxicity testing is planned. The reference locations that will be sampled for PCB congeners are 326, 330, and
333.
5)
Both acute and chronic toxicity testing will be performed. Note that if sufficient fish tissue is not collected from the canal, the
determination may be made during the toxicity test to freeze some of the invertebrate tissue from the toxicity testing for
supplemental chemical analysis.
6)
One surface water sample will be collected by a land-based crew at the intake location of the Flushing Tunnel in Buttermilk
Channel. Sample will be analyzed for the same parameters as the remaining surface water samples.
7)
It is clarified that the surface water samples will be analyzed for total cyanide.
8)

Title: Gowanus Canal RI/FS
Revision Number: 1
Revision Date: June 15, 2010
Page 3 of 83
Mummichug and blue crab traps will be initially set at locations where sediment samples for toxicity testing and PCB congeners
were collected within each reach.
9)
During the air sampling events, wind direction will be recorded at the Bond Street weather station to document their placement
relative to the canal during the sampling event.
10)
Backflow or inflow from the Gowanus Canal is typically prevented by tide gates. The CSO sampling locations will be selected at
or immediately upstream of regulator chambers where backflow is expected to be prevented (not in the outfall pipes). Salinity
and/or conductivity will be monitored during sampling to verify and document that no saline water is present at the location at the
time of sampling.
11)
There is no longer a requirement to conduct the dry weather CSO sampling event first. CSO sampling may begin with a wet
weather event. This will allow sampling to begin with whatever event is feasible based on weather conditions (rather than the
initial plan to begin with dry weather sampling in order to assess sampling conditions). A traffic control subcontractor will
provide required traffic control in accordance with Federal Department of Transportation requirements. Wet events must be
spaced at least a week apart.
12)
Water samples at two locations (dry and the 1st wet weather event from RH0034 Gowanus Pump Station and OH 007 2nd Avenue
Pump Station sampling locations): Alkalinity, Ammonia, Calcium, Chlorides, Iron – Total, Iron – Dissolved, Magnesium,
Manganese – Total, Manganese – Dissolved, Aluminum, Nitrates, TKN, Organic Carbon – dissolved, Organic Carbon – Total,
Potassium, Phosphate, Total Hardness, Silica, Sodium, Sulfates, Total Dissolved solids (TDS), Total Suspended Solids (TSS),
and a field test for Ferrous (+II) Iron.
13)
The continuous water level monitoring event will be performed 1st in order to determine the significance of tidal influences on
groundwater and therefore, whether the synoptic water level monitoring events should be performed over durations shorter than 3
hours.

Title: Gowanus Canal RI/FS
Revision Number: 1 Revision Date: May 17, 2010
Page 2 of 83
This page intentionally left blank.

Title: Gowanus Canal RI/FS
Revision Number: 1 Revision Date: May 17, 2010
Page 3 of 83
TABLE OF CONTENTS
Introduction ..................................................................................................................................................... 4
QAPP Worksheet #1. Title and Approval Page ............................................................................................................................ 5
QAPP Worksheet #2. QAPP Identifying Information .................................................................................................................. 7
QAPP Worksheet #3. Distribution List ....................................................................................................................................... 12
QAPP Worksheet #4. Project Personnel Sign-Off Sheet ............................................................................................................ 14
QAPP Worksheet #5. Project Organizational Chart.................................................................................................................... 17
QAPP Worksheet #6. Communication Pathways ....................................................................................................................... 19
QAPP Worksheet #7. Personnel Responsibilities and Qualification Table ................................................................................. 24
QAPP Worksheet #8. Special Personnel Training Requirements Table ..................................................................................... 28
QAPP Worksheet #9. Project Scoping Session Participants Sheet ............................................................................................. 29
QAPP Worksheet #10. Problem Definition .................................................................................................................................. 31
QAPP Worksheet #11. Project Quality Objectives/Systematic Planning Process Statements ...................................................... 34
QAPP Worksheet #12. Measurement Performance Criteria Table ............................................................................................... 44
QAPP Worksheet #13. Secondary Data Criteria and Limitations Table ....................................................................................... 45
QAPP Worksheet #14. Summary of Project Tasks ....................................................................................................................... 46
QAPP Worksheet #15. Reference Limits and Evaluation Table ................................................................................................... 50
QAPP Worksheet #16. Project Schedule Timeline Table ............................................................................................................. 51
QAPP Worksheet #17. Sampling Design and Rationale ............................................................................................................... 53
QAPP Worksheet #18. Sampling Locations and Methods/SOP Requirements Table .................................................................. 55
QAPP Worksheet #19. Analytical SOP Requirements Table ....................................................................................................... 61
QAPP Worksheet #20. Field Quality Control Sample Summary Table ........................................................................................ 62
QAPP Worksheet #21. Project Sampling SOP References Table ................................................................................................. 63
QAPP Worksheet #22. Field Equipment Calibration, Maintenance, Testing, and Inspection Table ............................................ 65
QAPP Worksheet #23. Analytical SOP References Table ............................................................................................................ 67
QAPP Worksheet #24. Analytical Instrument Calibration Table .................................................................................................. 68
QAPP Worksheet #25. Analytical Instrument and Equipment Maintenance, Testing, and Inspection Table ............................... 69
QAPP Worksheet #26. Sample Handling System ......................................................................................................................... 70
QAPP Worksheet #27. Sample Custody Requirements ................................................................................................................ 71
QAPP Worksheet #28. QC Samples Table ................................................................................................................................... 73
QAPP Worksheet #29. Project Documents and Records Table .................................................................................................... 74
QAPP Worksheet #30. Analytical Services Table ........................................................................................................................ 75
QAPP Worksheet #31. Planned Project Assessments Table ......................................................................................................... 76
QAPP Worksheet #32. Assessment Findings and Corrective Action Responses .......................................................................... 77
QAPP Worksheet #33. QA Management Reports Table .............................................................................................................. 78
QAPP Worksheet #34. Verification (Step I) Process Table .......................................................................................................... 79
QAPP Worksheet #35. Validation (Steps IIa and IIb) Process Table ........................................................................................... 80
QAPP Worksheet #36. Validation (Steps IIa and IIb) Summary Table ........................................................................................ 81
QAPP Worksheet #37. Usability Assessment ............................................................................................................................... 82
Attachments Attachment 1 Sampling Support Information
Attachment 2 Laboratory Standard Operating Procedures
Attachment 3 Field Standard Operating Procedures
Title: Gowanus Canal RI/FS
Revision Number: 1 Revision Date: May 17, 2010
Page 4 of 83
INTRODUCTION
This Uniform Federal Policy Quality Assurance Project Plan (UFP QAPP) is prepared for the United States Environmental
Protection Agency (USEPA) Region 2 by Henningson, Durham & Richardson Architecture & Engineering, P.C. in association with
HDR Engineering, Inc. (HDR) and CH2M HILL.
This UFP QAPP presents the sampling objectives, scope and procedures to support the completion of the Remedial Investigation
(RI) activities within the Gowanus Canal Superfund Site, Brooklyn, New York.
This UFP QAPP is prepared under EPA Region 2 RAC II Contract Number EP-W-09-009, Work Assignment Number
013-RICO-02ZP. It includes worksheets that detail various aspects of the investigation process and that will serve as guidelines for
the field and laboratory work.
This UFP QAPP also includes the standard operating procedures (SOPs) for the field sampling activities and the Site Management
Plan (SMP), which describes how operations will be managed at the site. A Health and Safety Plan (HSP), which describes the
health and safety procedures to be used at the site and includes the Community Air Monitoring Plan (CAMP) required by New York
State, have been submitted under separate cover.
Implementation of the UFP QAPP will support that the environmental data collected at the site are scientifically sound, of known
and documented quality, and suitable for their intended uses. The laboratory information cited in this document is specific to the
protocols for the Contract Laboratory Program (CLP), USEPA 2 Division of Environmental Science and Assessment (DESA), and
the identified laboratory subcontractors. Figures and a summary table of the sampling locations are included as Attachment 1,
site-specific laboratory standard operating procedures (SOPs) as Attachment 2, and field SOPs as Attachment 3.
This Phase 3 UFP QAPP covers the surface sediment, surface water, and tissue sample collection activities within the canal, as well
as air sampling activities along the banks and adjacent to the canal. Also included is collecting samples from the New York City
Combined Sewer Overflow (CSO) collection system and the installation of soil borings and monitoring wells with associated
sampling of soils and groundwater. The UFP QAPP will be updated as subsequent sampling activities necessary to meet the
identified project objectives are identified.

Title: Gowanus Canal RI/FS
Revision Number: 1 Revision Date: May 17, 2010
Page 6 of 83
Document Control Numbering System: GCRA-## - to be completed after Phase 3 QAPP is finalized.
Title: Gowanus Canal RI/FS
Revision Number: 1 Revision Date: May 17, 2010
Page 7 of 83
QAPP Worksheet #2
(UFP-QAPP Section 2.2.4)
QAPP Identifying Information
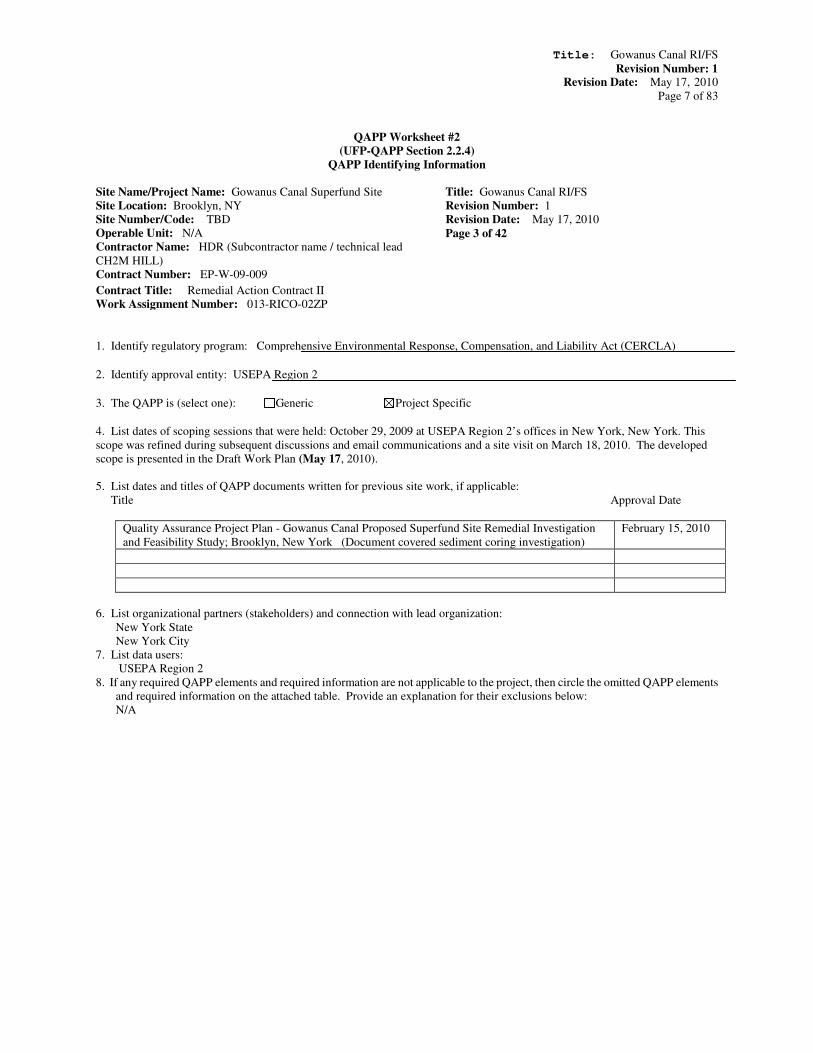
Site Name/Project Name: Gowanus Canal Superfund Site Title: Gowanus Canal RI/FS
Site Location: Brooklyn, NY Revision Number: 1
Site Number/Code: TBD Revision Date: May 17, 2010
Operable Unit: N/A Page 3 of 42 Contractor Name: HDR (Subcontractor name / technical lead
CH2M HILL)
Contract Number: EP-W-09-009
Contract Title: Remedial Action Contract II Work Assignment Number: 013-RICO-02ZP
1. Identify regulatory program: Comprehensive Environmental Response, Compensation, and Liability Act (CERCLA)
2. Identify approval entity: USEPA Region 2
3. The QAPP is (select one): Generic Project Specific
4. List dates of scoping sessions that were held: October 29, 2009 at USEPA Region 2’s offices in New York, New York. This
scope was refined during subsequent discussions and email communications and a site visit on March 18, 2010. The developed
scope is presented in the Draft Work Plan (May 17, 2010).
5. List dates and titles of QAPP documents written for previous site work, if applicable:
Title Approval Date
Quality Assurance Project Plan - Gowanus Canal Proposed Superfund Site Remedial Investigation
and Feasibility Study; Brooklyn, New York (Document covered sediment coring investigation)
February 15, 2010
6. List organizational partners (stakeholders) and connection with lead organization:
New York State
New York City
7. List data users:
USEPA Region 2
8. If any required QAPP elements and required information are not applicable to the project, then circle the omitted QAPP elements
and required information on the attached table. Provide an explanation for their exclusions below:
N/A
Title: Gowanus Canal RI/FS
Revision Number: 1 Revision Date: May 17, 2010
Page 8 of 83
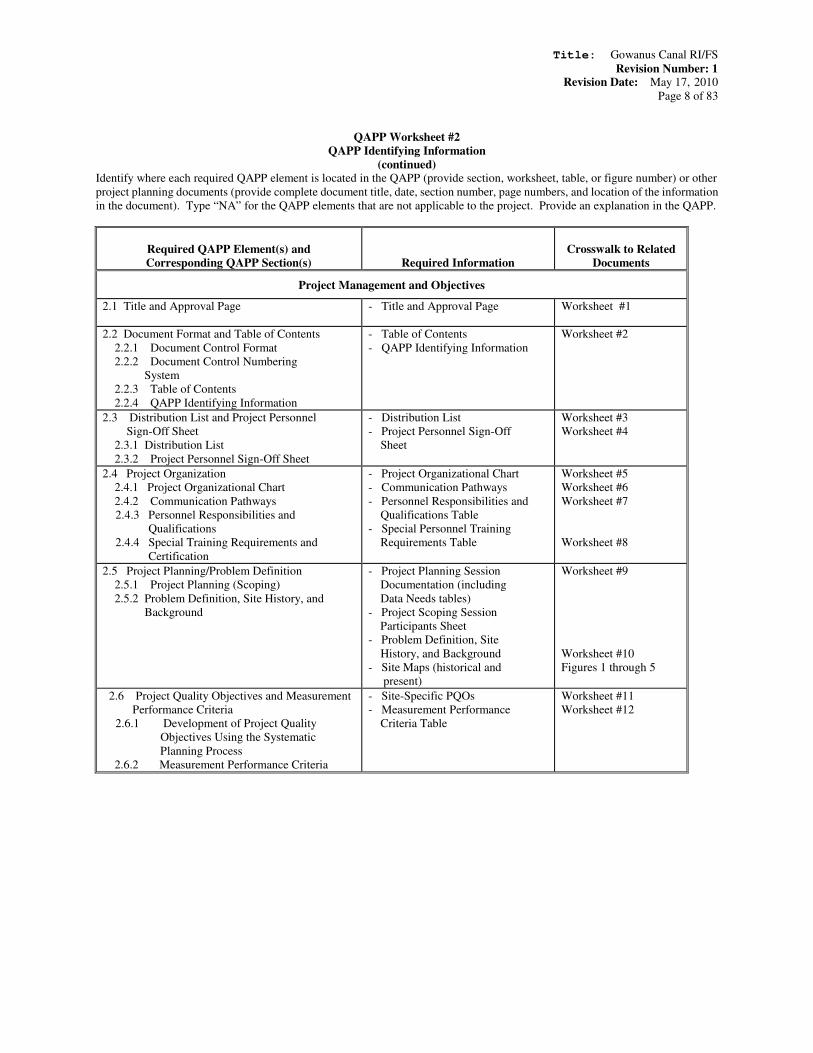
QAPP Worksheet #2
QAPP Identifying Information
(continued) Identify where each required QAPP element is located in the QAPP (provide section, worksheet, table, or figure number) or other
project planning documents (provide complete document title, date, section number, page numbers, and location of the information
in the document). Type “NA” for the QAPP elements that are not applicable to the project. Provide an explanation in the QAPP.
Required QAPP Element(s) and
Corresponding QAPP Section(s)
Required Information
Crosswalk to Related
Documents
Project Management and Objectives
2.1 Title and Approval Page - Title and Approval Page Worksheet #1
2.2 Document Format and Table of Contents
2.2.1 Document Control Format
2.2.2 Document Control Numbering
System
2.2.3 Table of Contents
2.2.4 QAPP Identifying Information
- Table of Contents
- QAPP Identifying Information
Worksheet #2
2.3 Distribution List and Project Personnel
Sign-Off Sheet
2.3.1 Distribution List
2.3.2 Project Personnel Sign-Off Sheet
- Distribution List
- Project Personnel Sign-Off
Sheet
Worksheet #3
Worksheet #4
2.4 Project Organization
2.4.1 Project Organizational Chart
2.4.2 Communication Pathways
2.4.3 Personnel Responsibilities and
Qualifications
2.4.4 Special Training Requirements and
Certification
- Project Organizational Chart
- Communication Pathways
- Personnel Responsibilities and
Qualifications Table
- Special Personnel Training
Requirements Table
Worksheet #5
Worksheet #6
Worksheet #7
Worksheet #8
2.5 Project Planning/Problem Definition
2.5.1 Project Planning (Scoping)
2.5.2 Problem Definition, Site History, and
Background
- Project Planning Session
Documentation (including
Data Needs tables)
- Project Scoping Session
Participants Sheet
- Problem Definition, Site
History, and Background
- Site Maps (historical and
present)
Worksheet #9
Worksheet #10
Figures 1 through 5
2.6 Project Quality Objectives and Measurement
Performance Criteria
2.6.1 Development of Project Quality
Objectives Using the Systematic
Planning Process
2.6.2 Measurement Performance Criteria
- Site-Specific PQOs
- Measurement Performance
Criteria Table
Worksheet #11
Worksheet #12
Title: Gowanus Canal RI/FS
Revision Number: 1 Revision Date: May 17, 2010
Page 9 of 83
QAPP Worksheet #2
QAPP Identifying Information
(continued)
Required QAPP Element(s) and
Corresponding QAPP Section(s)
Required Information
Crosswalk to
Related Documents
2.7 Secondary Data Evaluation - Sources of Secondary Data
and Information
- Secondary Data Criteria and
Limitations Table
Worksheet #13
2.8 Project Overview and Schedule
2.8.1 Project Overview
2.8.2 Project Schedule
- Summary of Project Tasks
- Reference Limits and
Evaluation Table
- Project Schedule/Timeline
Table
Worksheet #14
Worksheet #15
Worksheet #16
Measurement/Data Acquisition
3.1 Sampling Tasks
3.1.1 Sampling Process Design and Rationale
3.1.2 Sampling Procedures and Requirements
3.1.2.1 Sampling Collection Procedures
3.1.2.2 Sample Containers, Volume, and
Preservation
3.1.2.3 Equipment/Sample Containers
Cleaning and Decontamination
Procedures
3.1.2.3 Field Equipment Calibration,
Maintenance, Testing, and Inspection
Procedures
3.1.2.4 Supply Inspection and Acceptance
Procedures
3.1.2.6 Field Documentation Procedures
- Sampling Design and
Rationale
- Sample Location Map
- Sampling Locations and
Methods/SOP Requirements
Table
- Analytical Methods/SOP
Requirements Table
- Field Quality Control Sample
Summary Table
- Sampling SOPs
- Project Sampling SOP
References
Table
- Field Equipment Calibration,
Maintenance, Testing, and
Inspection Table
Worksheet #17
Worksheet #18
Worksheet #19
Worksheet #20
Worksheet #21
Worksheet #22
3.2 Analytical Tasks
3.2.1 Analytical SOPs
3.2.2 Analytical Instrument Calibration
Procedures
3.2.3 Analytical Instrument and Equipment
Maintenance, Testing, and Inspection
Procedures
3.2.4 Analytical Supply Inspection and
Acceptance Procedures
- Analytical SOPs
- Analytical SOP References
Table
- Analytical Instrument
Calibration Table
- Analytical Instrument and
Equipment Maintenance,
Testing, and Inspection Table
Worksheet #23
Worksheet #24
Worksheet #25
Title: Gowanus Canal RI/FS
Revision Number: 1 Revision Date: May 17, 2010
Page 10 of 83
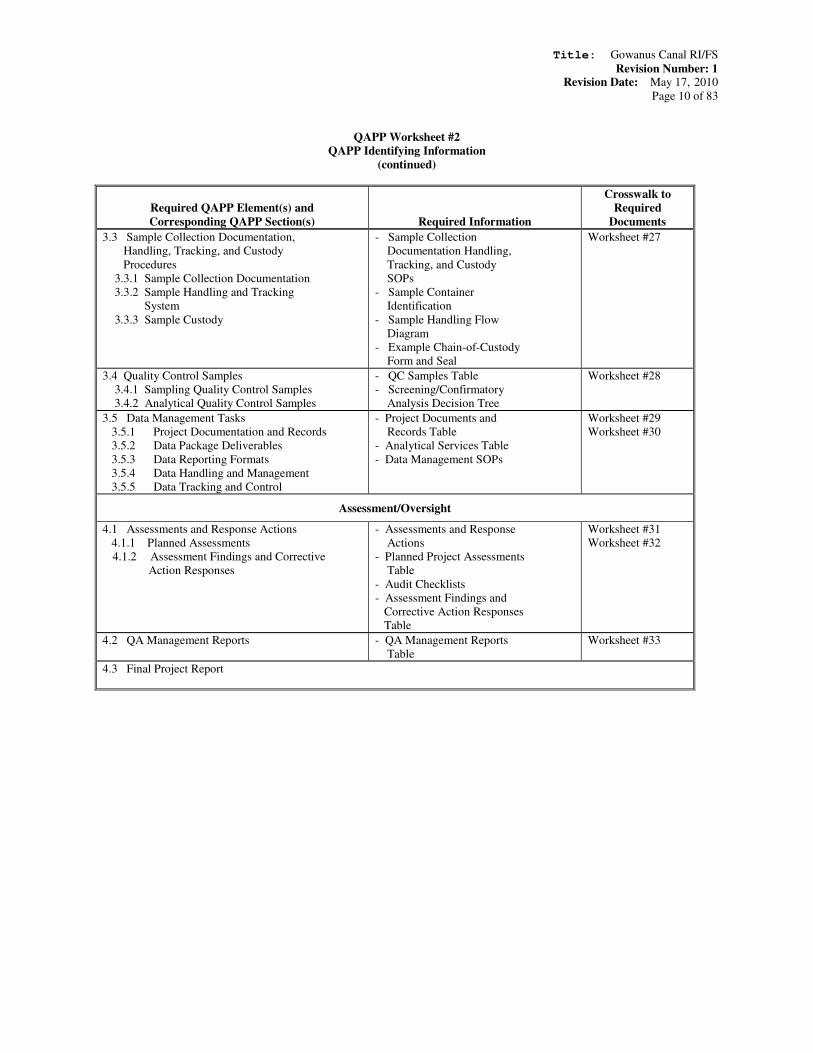
QAPP Worksheet #2
QAPP Identifying Information
(continued)
Required QAPP Element(s) and
Corresponding QAPP Section(s)
Required Information
Crosswalk to
Required
Documents
3.3 Sample Collection Documentation,
Handling, Tracking, and Custody
Procedures
3.3.1 Sample Collection Documentation
3.3.2 Sample Handling and Tracking
System
3.3.3 Sample Custody
- Sample Collection
Documentation Handling,
Tracking, and Custody
SOPs
- Sample Container
Identification
- Sample Handling Flow
Diagram
- Example Chain-of-Custody
Form and Seal
Worksheet #27
3.4 Quality Control Samples
3.4.1 Sampling Quality Control Samples
3.4.2 Analytical Quality Control Samples
- QC Samples Table
- Screening/Confirmatory
Analysis Decision Tree
Worksheet #28
3.5 Data Management Tasks
3.5.1 Project Documentation and Records
3.5.2 Data Package Deliverables
3.5.3 Data Reporting Formats
3.5.4 Data Handling and Management
3.5.5 Data Tracking and Control
- Project Documents and
Records Table
- Analytical Services Table
- Data Management SOPs
Worksheet #29
Worksheet #30
Assessment/Oversight
4.1 Assessments and Response Actions
4.1.1 Planned Assessments
4.1.2 Assessment Findings and Corrective
Action Responses
- Assessments and Response
Actions
- Planned Project Assessments
Table
- Audit Checklists
- Assessment Findings and
Corrective Action Responses
Table
Worksheet #31
Worksheet #32
4.2 QA Management Reports - QA Management Reports
Table
Worksheet #33
4.3 Final Project Report
Title: Gowanus Canal RI/FS
Revision Number: 1 Revision Date: May 17, 2010
Page 11 of 83
QAPP Worksheet #2
QAPP Identifying Information
(continued)
Required QAPP Element(s) and
Corresponding QAPP Section(s)
Required Information Crosswalk to Related Documents
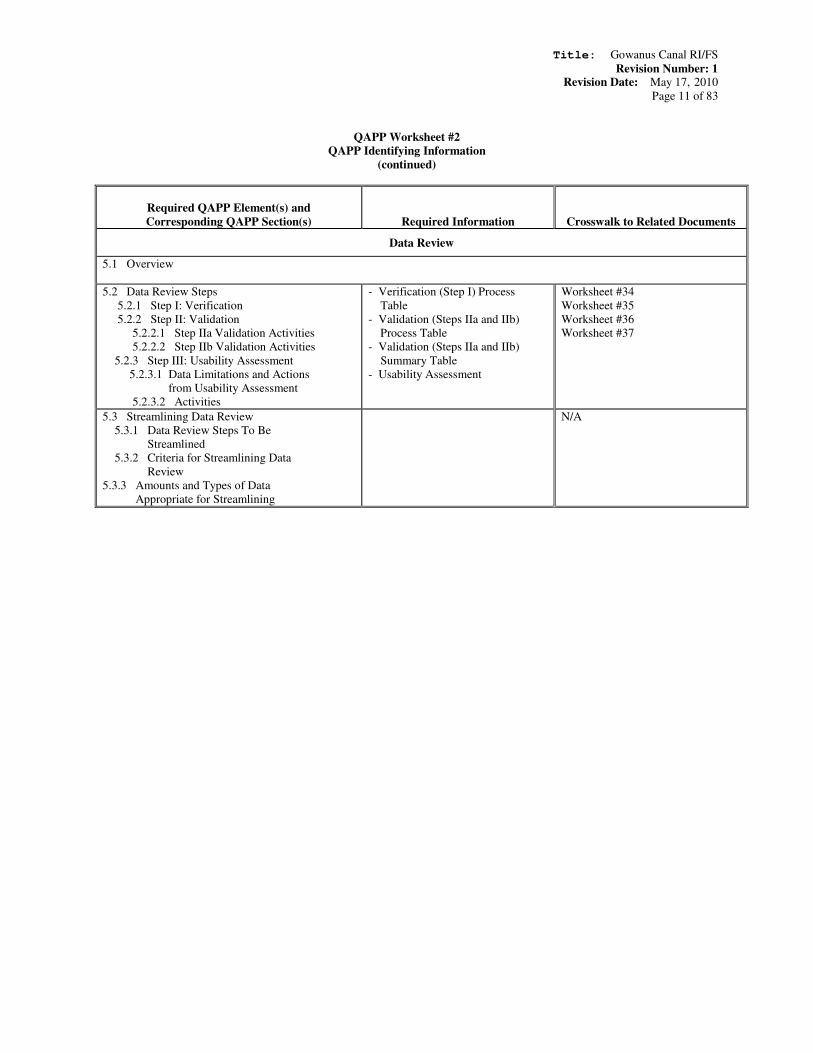
Data Review
5.1 Overview
5.2 Data Review Steps
5.2.1 Step I: Verification
5.2.2 Step II: Validation
5.2.2.1 Step IIa Validation Activities
5.2.2.2 Step IIb Validation Activities
5.2.3 Step III: Usability Assessment
5.2.3.1 Data Limitations and Actions
from Usability Assessment
5.2.3.2 Activities
- Verification (Step I) Process
Table
- Validation (Steps IIa and IIb)
Process Table
- Validation (Steps IIa and IIb)
Summary Table
- Usability Assessment
Worksheet #34
Worksheet #35
Worksheet #36
Worksheet #37
5.3 Streamlining Data Review
5.3.1 Data Review Steps To Be
Streamlined
5.3.2 Criteria for Streamlining Data
Review
5.3.3 Amounts and Types of Data
Appropriate for Streamlining
N/A
Title: Gowanus Canal RI/FS
Revision Number: 1 Revision Date: May 17, 2010
Page 12 of 83
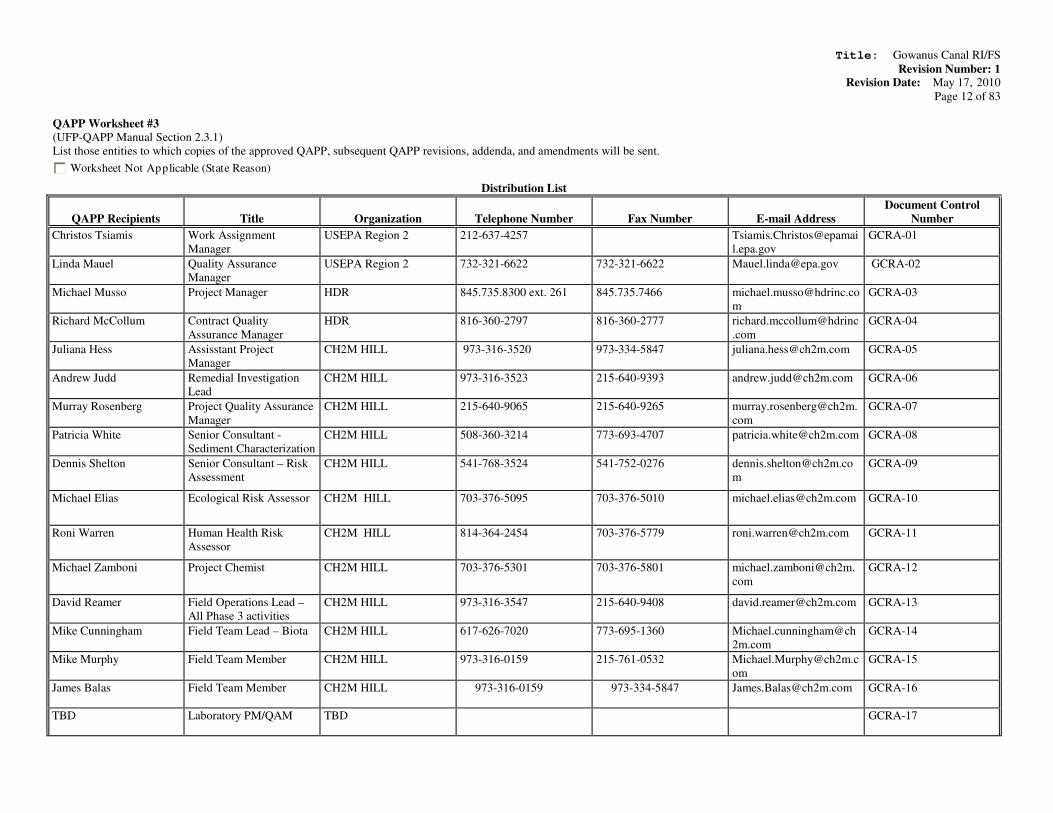
QAPP Worksheet #3
(UFP-QAPP Manual Section 2.3.1)
List those entities to which copies of the approved QAPP, subsequent QAPP revisions, addenda, and amendments will be sent.
Worksheet Not Applicable (State Reason)
Distribution List
QAPP Recipients
Title
Organization
Telephone Number
Fax Number
E-mail Address
Document Control
Number
Christos Tsiamis Work Assignment
Manager
USEPA Region 2 212-637-4257 Tsiamis.Christos@epamai
l.epa.gov
GCRA-01
Linda Mauel Quality Assurance
Manager
USEPA Region 2 732-321-6622 732-321-6622 [email protected] GCRA-02
Michael Musso Project Manager HDR 845.735.8300 ext. 261 845.735.7466 [email protected]
m
GCRA-03
Richard McCollum Contract Quality
Assurance Manager
HDR 816-360-2797 816-360-2777 richard.mccollum@hdrinc
.com
GCRA-04
Juliana Hess Assisstant Project
Manager
CH2M HILL 973-316-3520 973-334-5847 [email protected] GCRA-05
Andrew Judd Remedial Investigation
Lead
CH2M HILL 973-316-3523 215-640-9393 [email protected] GCRA-06
Murray Rosenberg Project Quality Assurance
Manager
CH2M HILL 215-640-9065 215-640-9265 murray.rosenberg@ch2m.
com
GCRA-07
Patricia White Senior Consultant -
Sediment Characterization
CH2M HILL 508-360-3214 773-693-4707 [email protected] GCRA-08
Dennis Shelton Senior Consultant – Risk
Assessment
CH2M HILL 541-768-3524 541-752-0276 [email protected]
m
GCRA-09
Michael Elias Ecological Risk Assessor CH2M HILL 703-376-5095 703-376-5010 [email protected] GCRA-10
Roni Warren Human Health Risk
Assessor
CH2M HILL 814-364-2454 703-376-5779 [email protected] GCRA-11
Michael Zamboni Project Chemist CH2M HILL 703-376-5301 703-376-5801 michael.zamboni@ch2m.
com
GCRA-12
David Reamer Field Operations Lead –
All Phase 3 activities
CH2M HILL 973-316-3547 215-640-9408 [email protected] GCRA-13
Mike Cunningham Field Team Lead – Biota CH2M HILL 617-626-7020 773-695-1360 Michael.cunningham@ch
2m.com
GCRA-14
Mike Murphy Field Team Member CH2M HILL 973-316-0159 215-761-0532 [email protected]
om
GCRA-15
James Balas Field Team Member CH2M HILL 973-316-0159 973-334-5847 [email protected] GCRA-16
TBD Laboratory PM/QAM TBD GCRA-17

Title: Gowanus Canal RI/FS
Revision Number: 1 Revision Date: May 17, 2010
Page 13 of 83
Distribution List
QAPP Recipients
Title
Organization
Telephone Number
Fax Number
E-mail Address
Document Control
Number
Monica Calabria Data Manager CH2M HILL 973-316-9300 x43510 215-640-9377 [email protected]
om
GCRA-18
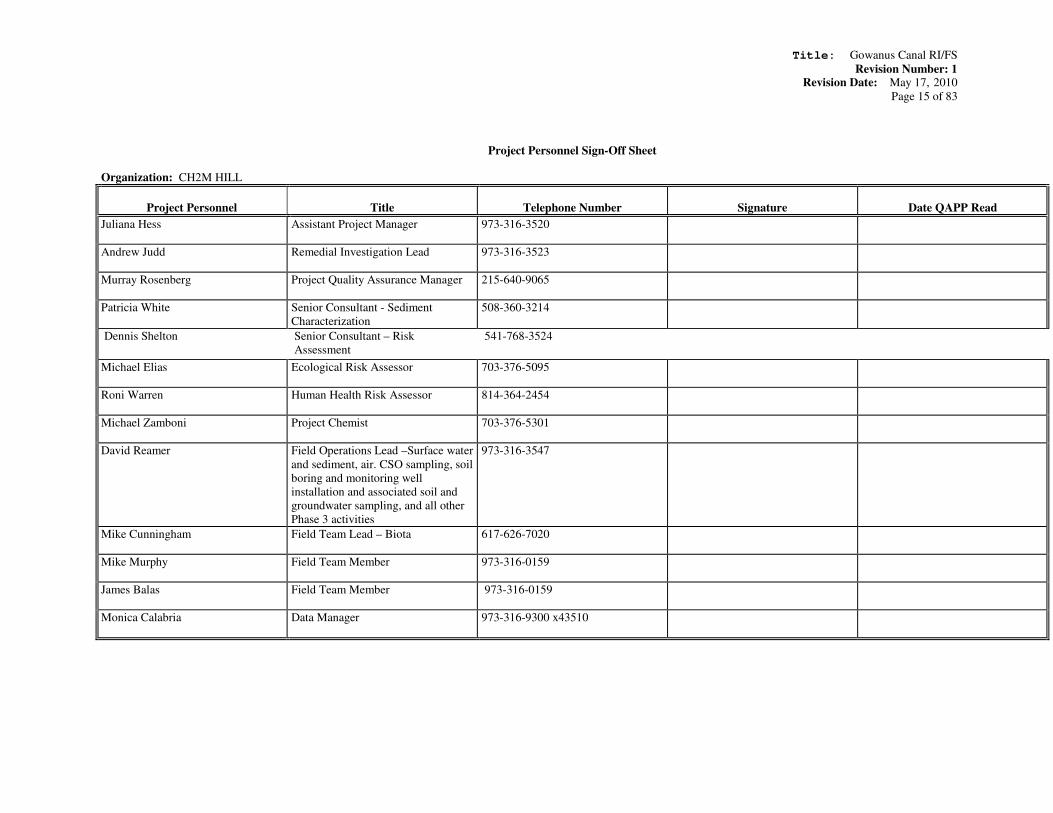
QAPP Worksheet #4 (UFP-QAPP Manual Section 2.3.2)
Have copies of this form signed by key project personnel from each organization to indicate that they have read the applicable sections of the QAPP and will perform the tasks as
described. Ask each organization to forward signed sheets to the central project file.
Worksheet Not Applicable (State Reason)
Project Personnel Sign-Off Sheet
Organization: USEPA Region 2
Project Personnel Title Telephone Number Signature Date QAPP Read
Christos Tsiamis USEPA 2 Work Assignment Manager 212-637-4257
Title: Gowanus Canal RI/FS
Revision Number: 1 Revision Date: May 17, 2010
Page 14 of 83
Project Personnel Sign-Off Sheet
Organization: HDR
Project Personnel Title Telephone Number Signature Date QAPP Read
Michael Musso Project Manager 845.735.8300 ext. 261
Richard McCollum Contract Quality Assurance Manager 816-360-2797
Title: Gowanus Canal RI/FS
Revision Number: 1 Revision Date: May 17, 2010
Page 15 of 83
Project Personnel Sign-Off Sheet
Organization: CH2M HILL
Project Personnel Title Telephone Number Signature Date QAPP Read
Juliana Hess Assistant Project Manager 973-316-3520
Andrew Judd Remedial Investigation Lead 973-316-3523
Murray Rosenberg Project Quality Assurance Manager 215-640-9065
Patricia White Senior Consultant - Sediment
Characterization
508-360-3214
Dennis Shelton Senior Consultant – Risk
Assessment
541-768-3524
Michael Elias Ecological Risk Assessor 703-376-5095
Roni Warren Human Health Risk Assessor 814-364-2454
Michael Zamboni Project Chemist 703-376-5301
David Reamer Field Operations Lead –Surface water
and sediment, air. CSO sampling, soil
boring and monitoring well
installation and associated soil and
groundwater sampling, and all other
Phase 3 activities
973-316-3547
Mike Cunningham Field Team Lead – Biota 617-626-7020
Mike Murphy Field Team Member 973-316-0159
James Balas Field Team Member 973-316-0159
Monica Calabria Data Manager 973-316-9300 x43510

QAPP Worksheet #5 (UFP-QAPP Manual Section 2.4.1)
Identify reporting relationships between all organizations involved in the project, including the lead organization and all contractor and subcontractor organizations. Identify the
organizations providing field sampling, on-site and off-site analysis, and data review services, including the names and telephone numbers of all project managers, project team
members, and/or project contacts for each organization.
Worksheet Not Applicable (State Reason)
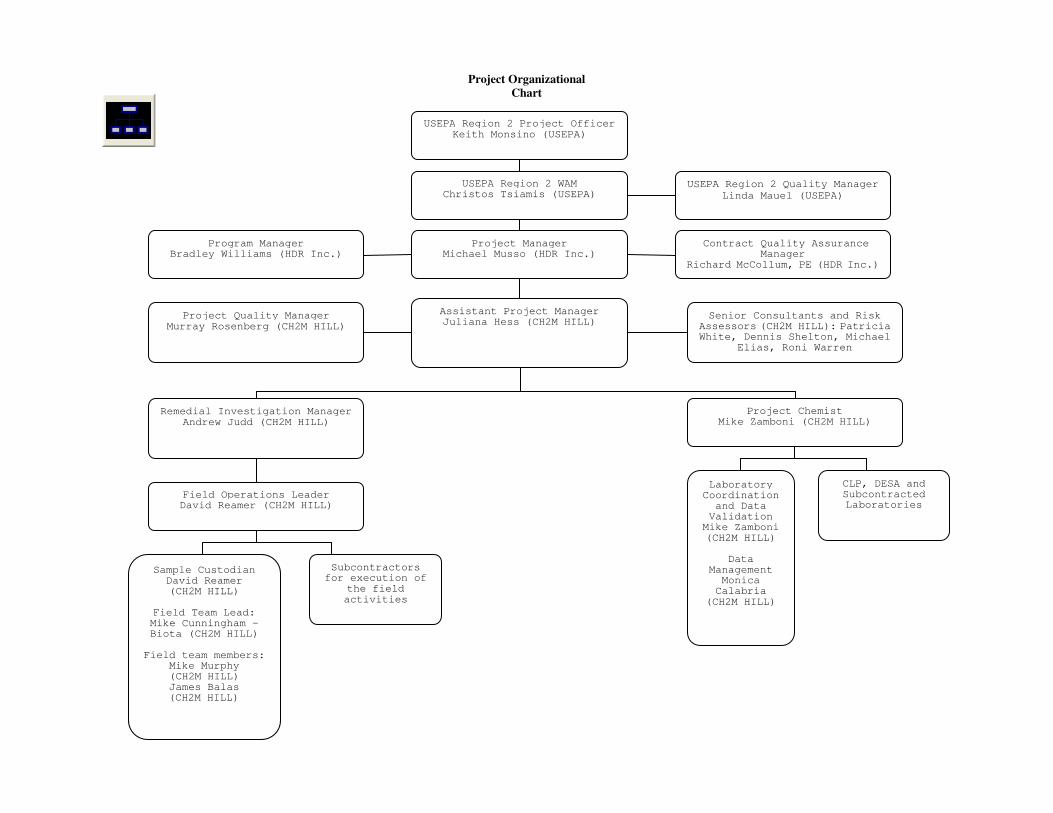
Project Organizational
Chart
USEPA Region 2 Project Officer Keith Monsino (USEPA)
USEPA Region 2 WAM Christos Tsiamis (USEPA)
USEPA Region 2 Quality Manager
Linda Mauel (USEPA)
Project Manager Michael Musso (HDR Inc.)
Program Manager Bradley Williams (HDR Inc.)
Assistant Project Manager Juliana Hess (CH2M HILL)
Project Quality Manager Murray Rosenberg (CH2M HILL)
Senior Consultants and Risk Assessors (CH2M HILL): Patricia White, Dennis Shelton, Michael
Elias, Roni Warren
Project Chemist Mike Zamboni (CH2M HILL)
Remedial Investigation Manager Andrew Judd (CH2M HILL)
Field Operations Leader David Reamer (CH2M HILL)
Sample Custodian David Reamer (CH2M HILL)
Field Team Lead: Mike Cunningham – Biota (CH2M HILL)
Field team members:
Mike Murphy (CH2M HILL) James Balas
(CH2M HILL)
Subcontractors for execution of
the field activities
Laboratory Coordination and Data Validation Mike Zamboni (CH2M HILL)
Data
Management Monica Calabria
(CH2M HILL)
CLP, DESA and Subcontracted Laboratories
Contract Quality Assurance Manager
Richard McCollum, PE (HDR Inc.)

Title: Gowanus Canal RI/FS
Revision Number: 1 Revision Date: May 17, 2010
Page 19 of 83
QAPP Worksheet #6 (UFP-QAPP Manual Section 2.4.2)
Describe the communication pathways and modes of communication that will be used during the project, after the QAPP has been approved. Describe the procedures for soliciting
and/or obtaining approval between project personnel, between different contractors, and between samplers and laboratory staff. Describe the procedure that will be followed when
any project activity originally documented in an approved QAPP requires real-time modifications to achieve project goals or a QAPP amendment is required. Describe the procedures
for stopping work and identify who is responsible.
Worksheet Not Applicable (State Reason)
Communication Pathways
Communication Drivers
Responsible Entity
Name
Phone Number
Procedure (Timing, Pathways, etc.)
Communication with USEPA
Region 2 (lead agency)
USEPA Region 2 Work Assignment Manager
(WAM)
Christos Tsiamis 212-637-4257 Primary point of contact for USEPA including
for contractors, stakeholder agencies, and the
community/public; can delegate communication
to other internal or external points of contact.
Contractor management of all
phases and primary point of contact
to USEPA
Project Manager (PM) and Assistant Project
Manager (APM)
Michael Musso
Juliana Hess
845.735.8300 ext. 261
973-316-3520
Primary point of contact to USEPA WAM for all
site activities. PM / APM directs all internal
communications and activities. PM may
delegate technical leadership for subcontractor
management to APM and appropriate task leads
as needed. PM retains all communications
related to contractual issues.
Communications related to decisions that
deviate from the planned program will be by
phone, followed with e-mail to document
decisions and actions.
Contract Quality Assurance Contract Quality Assurance Manager Richard McCollum 816-360-2797 Communicates issues related to overall contract
quality control and provides QA direction and
corrections to the PM/APM.
Communications will be by phone, followed
with e-mail to document decisions and actions
Status of field activities and overall
technical management of
subcontractors delivering field
support
Remedial Investigation Lead Andy Judd 973-316-3523 Primary point of contact to USEPA WAM for
daily statusing of field activities.
Field decisions that deviate from the planned
sampling program and directions to
subcontractors that may affect scope and cost
will be immediately communicated via phone to
PM / APM and followed with e-mail to
document decisions and actions.
Title: Gowanus Canal RI/FS
Revision Number: 1 Revision Date: May 17, 2010
Page 20 of 83
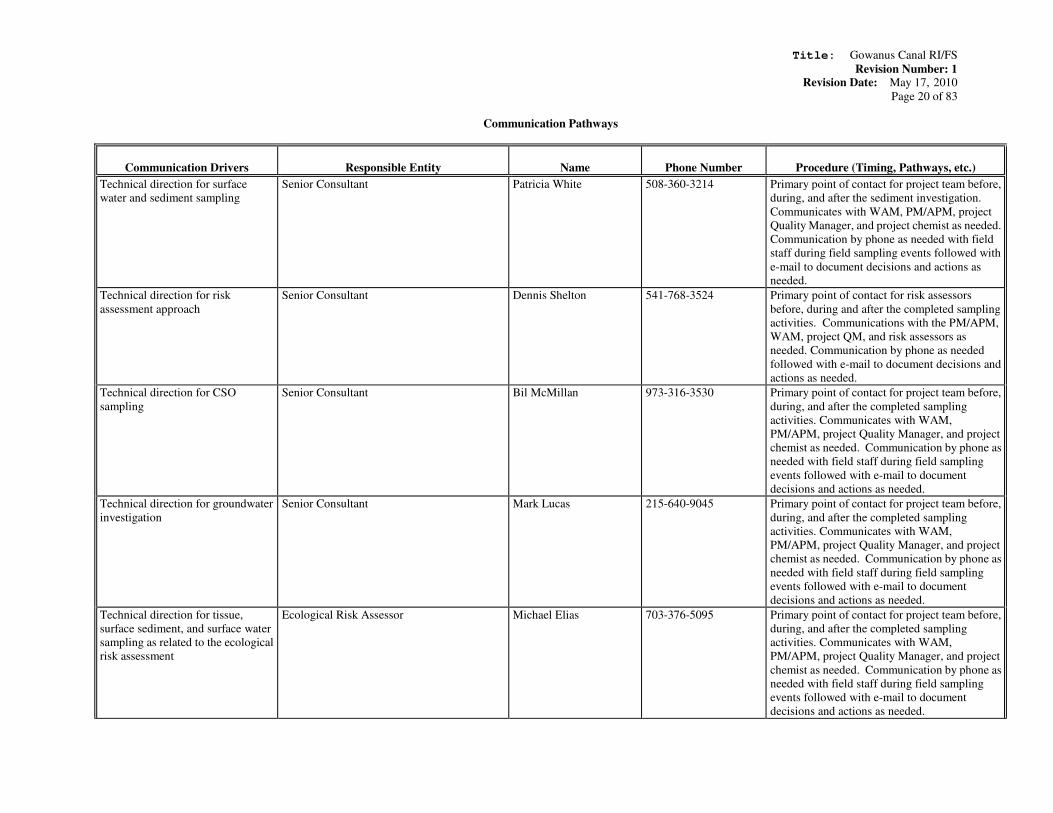
Communication Pathways
Communication Drivers
Responsible Entity
Name
Phone Number
Procedure (Timing, Pathways, etc.)
Technical direction for surface
water and sediment sampling
Senior Consultant Patricia White 508-360-3214 Primary point of contact for project team before,
during, and after the sediment investigation.
Communicates with WAM, PM/APM, project
Quality Manager, and project chemist as needed.
Communication by phone as needed with field
staff during field sampling events followed with
e-mail to document decisions and actions as
needed.
Technical direction for risk
assessment approach
Senior Consultant Dennis Shelton 541-768-3524 Primary point of contact for risk assessors
before, during and after the completed sampling
activities. Communications with the PM/APM,
WAM, project QM, and risk assessors as
needed. Communication by phone as needed
followed with e-mail to document decisions and
actions as needed.
Technical direction for CSO
sampling
Senior Consultant Bil McMillan 973-316-3530 Primary point of contact for project team before,
during, and after the completed sampling
activities. Communicates with WAM,
PM/APM, project Quality Manager, and project
chemist as needed. Communication by phone as
needed with field staff during field sampling
events followed with e-mail to document
decisions and actions as needed.
Technical direction for groundwater
investigation
Senior Consultant Mark Lucas 215-640-9045 Primary point of contact for project team before,
during, and after the completed sampling
activities. Communicates with WAM,
PM/APM, project Quality Manager, and project
chemist as needed. Communication by phone as
needed with field staff during field sampling
events followed with e-mail to document
decisions and actions as needed.
Technical direction for tissue,
surface sediment, and surface water
sampling as related to the ecological
risk assessment
Ecological Risk Assessor Michael Elias 703-376-5095 Primary point of contact for project team before,
during, and after the completed sampling
activities. Communicates with WAM,
PM/APM, project Quality Manager, and project
chemist as needed. Communication by phone as
needed with field staff during field sampling
events followed with e-mail to document
decisions and actions as needed.
Title: Gowanus Canal RI/FS
Revision Number: 1 Revision Date: May 17, 2010
Page 21 of 83
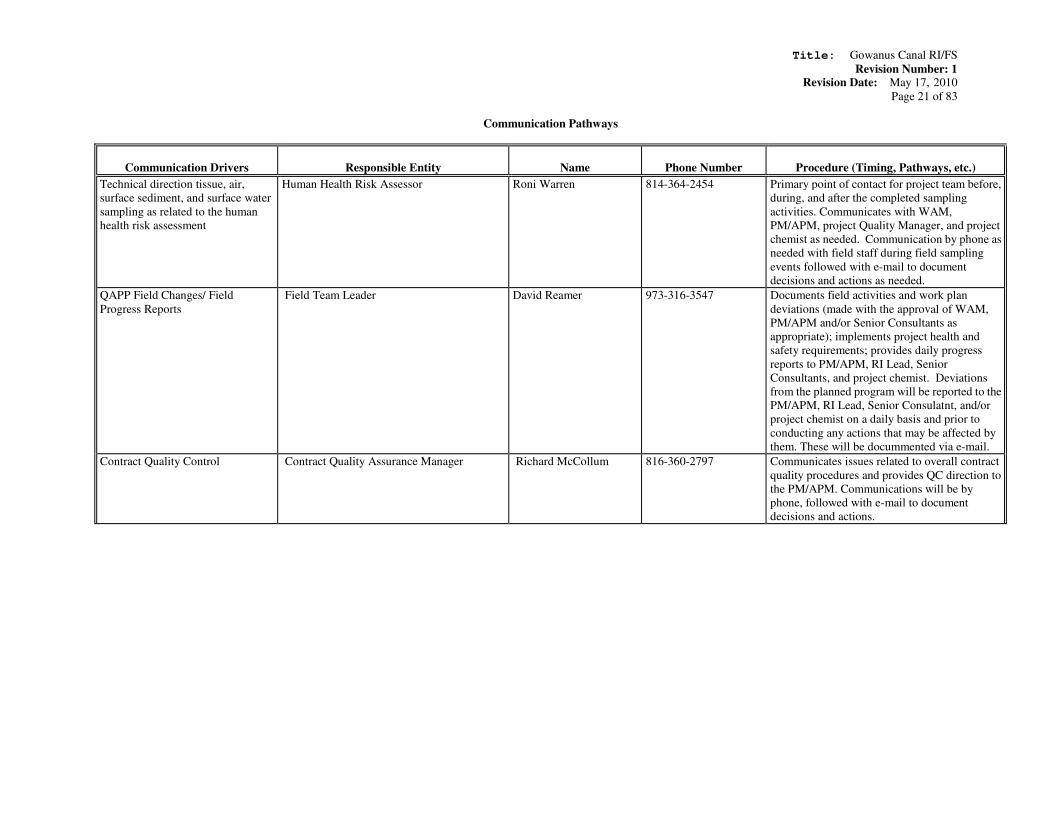
Communication Pathways
Communication Drivers
Responsible Entity
Name
Phone Number
Procedure (Timing, Pathways, etc.)
Technical direction tissue, air,
surface sediment, and surface water
sampling as related to the human
health risk assessment
Human Health Risk Assessor Roni Warren 814-364-2454 Primary point of contact for project team before,
during, and after the completed sampling
activities. Communicates with WAM,
PM/APM, project Quality Manager, and project
chemist as needed. Communication by phone as
needed with field staff during field sampling
events followed with e-mail to document
decisions and actions as needed.
QAPP Field Changes/ Field
Progress Reports
Field Team Leader David Reamer
973-316-3547 Documents field activities and work plan
deviations (made with the approval of WAM,
PM/APM and/or Senior Consultants as
appropriate); implements project health and
safety requirements; provides daily progress
reports to PM/APM, RI Lead, Senior
Consultants, and project chemist. Deviations
from the planned program will be reported to the
PM/APM, RI Lead, Senior Consulatnt, and/or
project chemist on a daily basis and prior to
conducting any actions that may be affected by
them. These will be docummented via e-mail.
Contract Quality Control Contract Quality Assurance Manager Richard McCollum 816-360-2797 Communicates issues related to overall contract
quality procedures and provides QC direction to
the PM/APM. Communications will be by
phone, followed with e-mail to document
decisions and actions.
Title: Gowanus Canal RI/FS
Revision Number: 1 Revision Date: May 17, 2010
Page 22 of 83
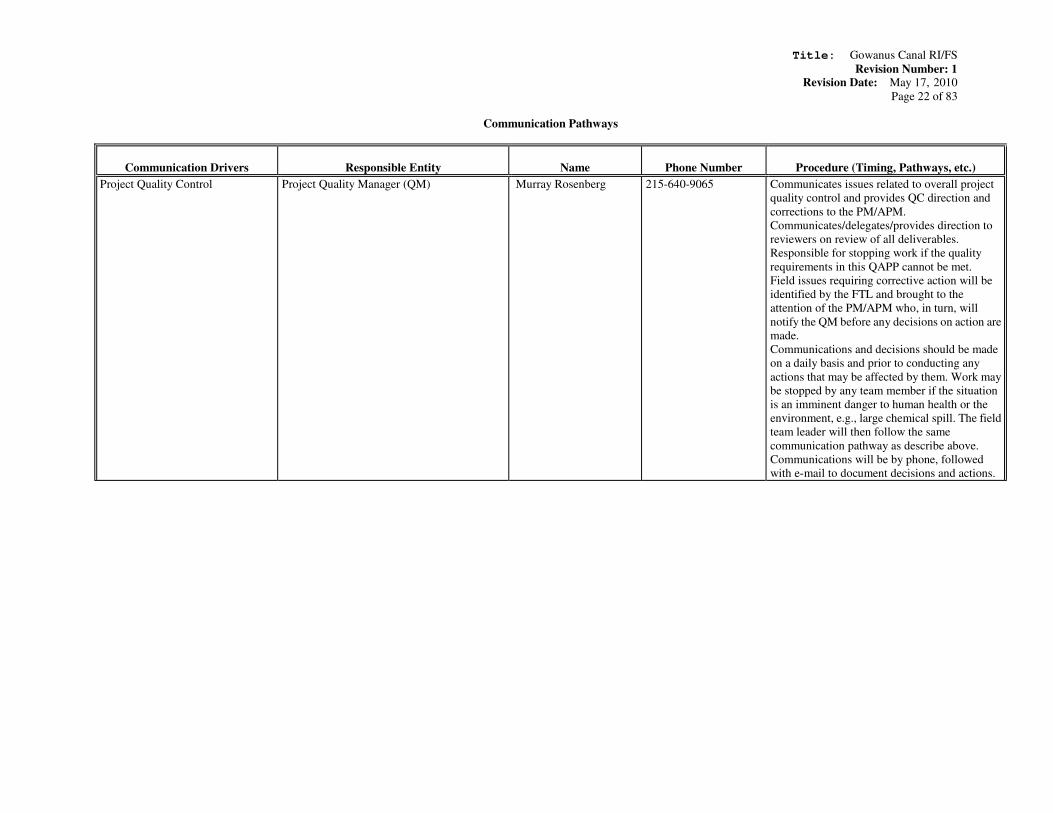
Communication Pathways
Communication Drivers
Responsible Entity
Name
Phone Number
Procedure (Timing, Pathways, etc.)
Project Quality Control Project Quality Manager (QM) Murray Rosenberg 215-640-9065 Communicates issues related to overall project
quality control and provides QC direction and
corrections to the PM/APM.
Communicates/delegates/provides direction to
reviewers on review of all deliverables.
Responsible for stopping work if the quality
requirements in this QAPP cannot be met.
Field issues requiring corrective action will be
identified by the FTL and brought to the
attention of the PM/APM who, in turn, will
notify the QM before any decisions on action are
made.
Communications and decisions should be made
on a daily basis and prior to conducting any
actions that may be affected by them. Work may
be stopped by any team member if the situation
is an imminent danger to human health or the
environment, e.g., large chemical spill. The field
team leader will then follow the same
communication pathway as describe above.
Communications will be by phone, followed
with e-mail to document decisions and actions.
Title: Gowanus Canal RI/FS
Revision Number: 1 Revision Date: May 17, 2010
Page 23 of 83
Communication Pathways
Communication Drivers
Responsible Entity
Name
Phone Number
Procedure (Timing, Pathways, etc.)
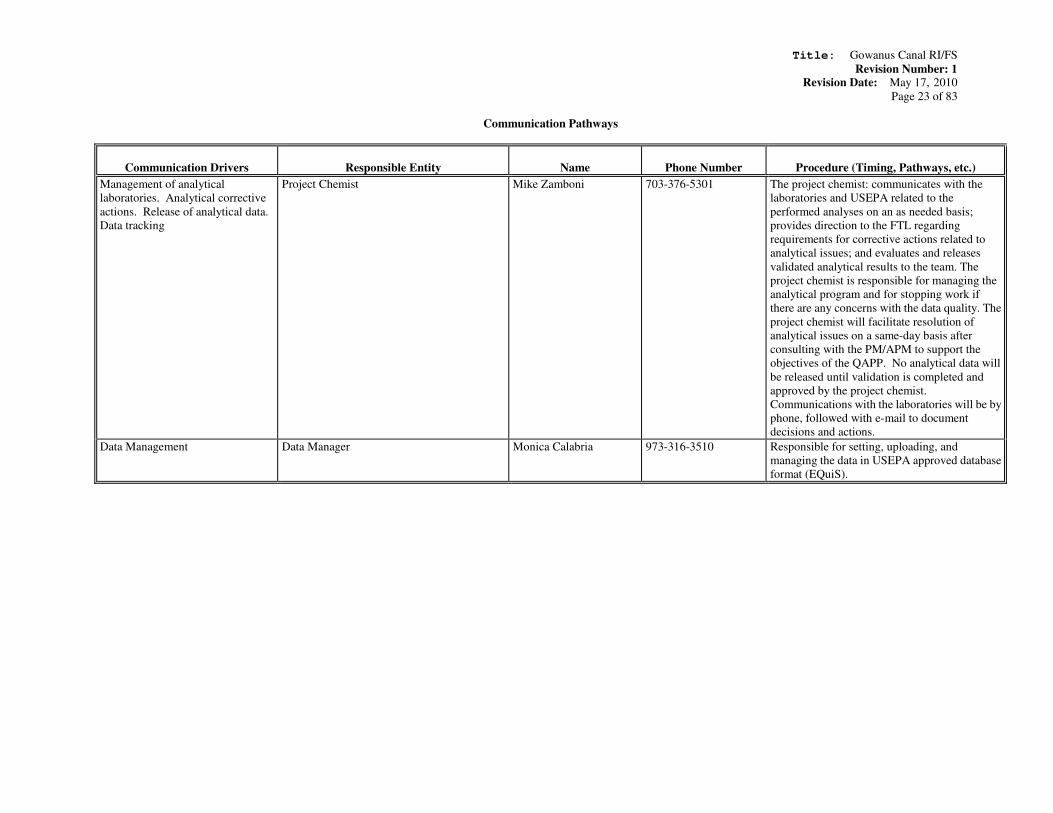
Management of analytical
laboratories. Analytical corrective
actions. Release of analytical data.
Data tracking
Project Chemist Mike Zamboni 703-376-5301 The project chemist: communicates with the
laboratories and USEPA related to the
performed analyses on an as needed basis;
provides direction to the FTL regarding
requirements for corrective actions related to
analytical issues; and evaluates and releases
validated analytical results to the team. The
project chemist is responsible for managing the
analytical program and for stopping work if
there are any concerns with the data quality. The
project chemist will facilitate resolution of
analytical issues on a same-day basis after
consulting with the PM/APM to support the
objectives of the QAPP. No analytical data will
be released until validation is completed and
approved by the project chemist.
Communications with the laboratories will be by
phone, followed with e-mail to document
decisions and actions.
Data Management Data Manager Monica Calabria 973-316-3510 Responsible for setting, uploading, and
managing the data in USEPA approved database
format (EQuiS).
Title: Gowanus Canal RI/FS
Revision Number: 1 Revision Date: May 17, 2010
Page 24 of 83
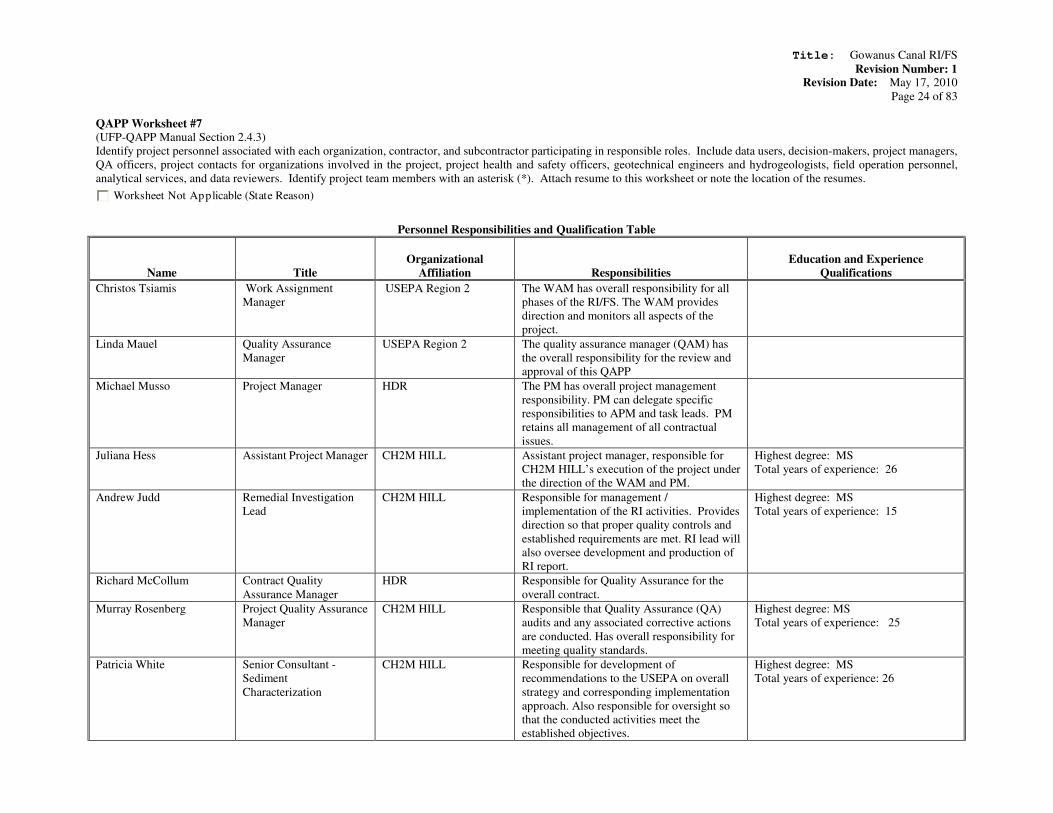
QAPP Worksheet #7
(UFP-QAPP Manual Section 2.4.3)
Identify project personnel associated with each organization, contractor, and subcontractor participating in responsible roles. Include data users, decision-makers, project managers,
QA officers, project contacts for organizations involved in the project, project health and safety officers, geotechnical engineers and hydrogeologists, field operation personnel,
analytical services, and data reviewers. Identify project team members with an asterisk (*). Attach resume to this worksheet or note the location of the resumes.
Worksheet Not Applicable (State Reason)
Personnel Responsibilities and Qualification Table
Name
Title
Organizational
Affiliation
Responsibilities
Education and Experience
Qualifications
Christos Tsiamis Work Assignment
Manager
USEPA Region 2 The WAM has overall responsibility for all
phases of the RI/FS. The WAM provides
direction and monitors all aspects of the
project.
Linda Mauel Quality Assurance
Manager
USEPA Region 2 The quality assurance manager (QAM) has
the overall responsibility for the review and
approval of this QAPP
Michael Musso Project Manager HDR The PM has overall project management
responsibility. PM can delegate specific
responsibilities to APM and task leads. PM
retains all management of all contractual
issues.
Juliana Hess Assistant Project Manager CH2M HILL Assistant project manager, responsible for
CH2M HILL’s execution of the project under
the direction of the WAM and PM.
Highest degree: MS
Total years of experience: 26
Andrew Judd Remedial Investigation
Lead
CH2M HILL Responsible for management /
implementation of the RI activities. Provides
direction so that proper quality controls and
established requirements are met. RI lead will
also oversee development and production of
RI report.
Highest degree: MS
Total years of experience: 15
Richard McCollum Contract Quality
Assurance Manager
HDR Responsible for Quality Assurance for the
overall contract.
Murray Rosenberg Project Quality Assurance
Manager
CH2M HILL Responsible that Quality Assurance (QA)
audits and any associated corrective actions
are conducted. Has overall responsibility for
meeting quality standards.
Highest degree: MS
Total years of experience: 25
Patricia White Senior Consultant -
Sediment
Characterization
CH2M HILL Responsible for development of
recommendations to the USEPA on overall
strategy and corresponding implementation
approach. Also responsible for oversight so
that the conducted activities meet the
established objectives.
Highest degree: MS
Total years of experience: 26
Title: Gowanus Canal RI/FS
Revision Number: 1 Revision Date: May 17, 2010
Page 25 of 83
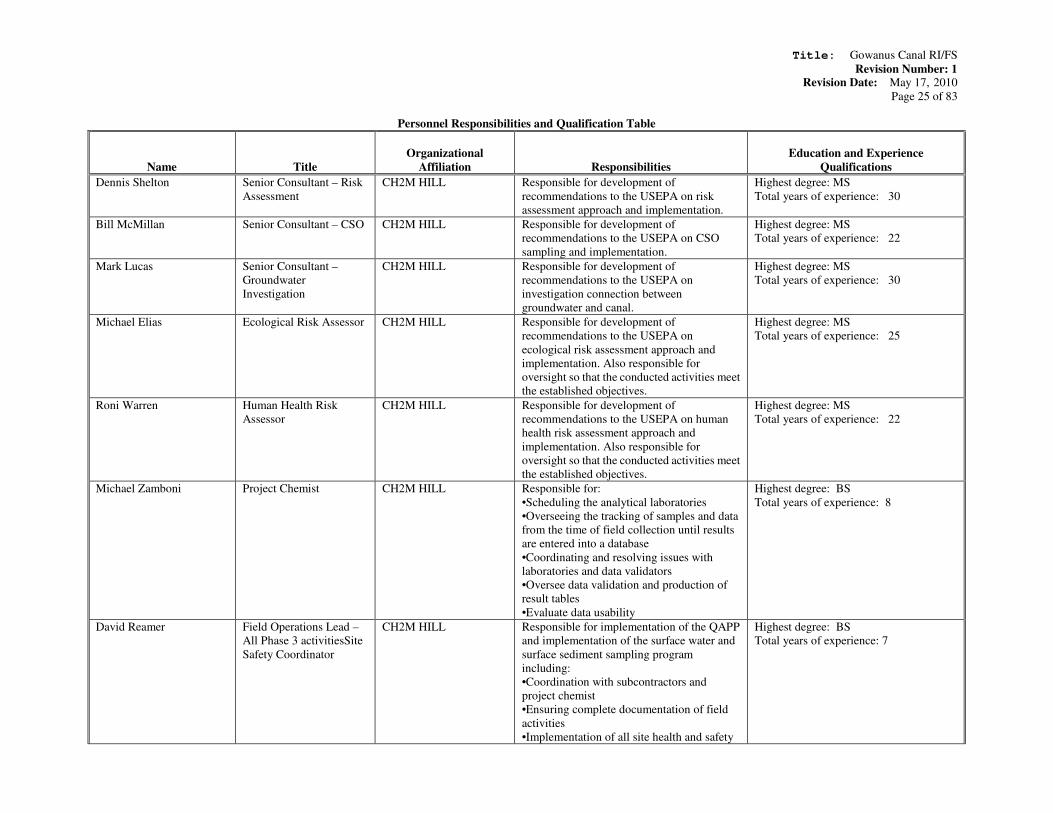
Personnel Responsibilities and Qualification Table
Name
Title
Organizational
Affiliation
Responsibilities
Education and Experience
Qualifications
Dennis Shelton Senior Consultant – Risk
Assessment
CH2M HILL Responsible for development of
recommendations to the USEPA on risk
assessment approach and implementation.
Highest degree: MS
Total years of experience: 30
Bill McMillan Senior Consultant – CSO CH2M HILL Responsible for development of
recommendations to the USEPA on CSO
sampling and implementation.
Highest degree: MS
Total years of experience: 22
Mark Lucas Senior Consultant –
Groundwater
Investigation
CH2M HILL Responsible for development of
recommendations to the USEPA on
investigation connection between
groundwater and canal.
Highest degree: MS
Total years of experience: 30
Michael Elias Ecological Risk Assessor CH2M HILL Responsible for development of
recommendations to the USEPA on
ecological risk assessment approach and
implementation. Also responsible for
oversight so that the conducted activities meet
the established objectives.
Highest degree: MS
Total years of experience: 25
Roni Warren Human Health Risk
Assessor
CH2M HILL Responsible for development of
recommendations to the USEPA on human
health risk assessment approach and
implementation. Also responsible for
oversight so that the conducted activities meet
the established objectives.
Highest degree: MS
Total years of experience: 22
Michael Zamboni Project Chemist CH2M HILL Responsible for:
•Scheduling the analytical laboratories
•Overseeing the tracking of samples and data
from the time of field collection until results
are entered into a database
•Coordinating and resolving issues with
laboratories and data validators
•Oversee data validation and production of
result tables
•Evaluate data usability
Highest degree: BS
Total years of experience: 8
David Reamer Field Operations Lead –
All Phase 3 activitiesSite
Safety Coordinator
CH2M HILL Responsible for implementation of the QAPP
and implementation of the surface water and
surface sediment sampling program
including:
•Coordination with subcontractors and
project chemist
•Ensuring complete documentation of field
activities
•Implementation of all site health and safety
Highest degree: BS
Total years of experience: 7
Title: Gowanus Canal RI/FS
Revision Number: 1 Revision Date: May 17, 2010
Page 26 of 83
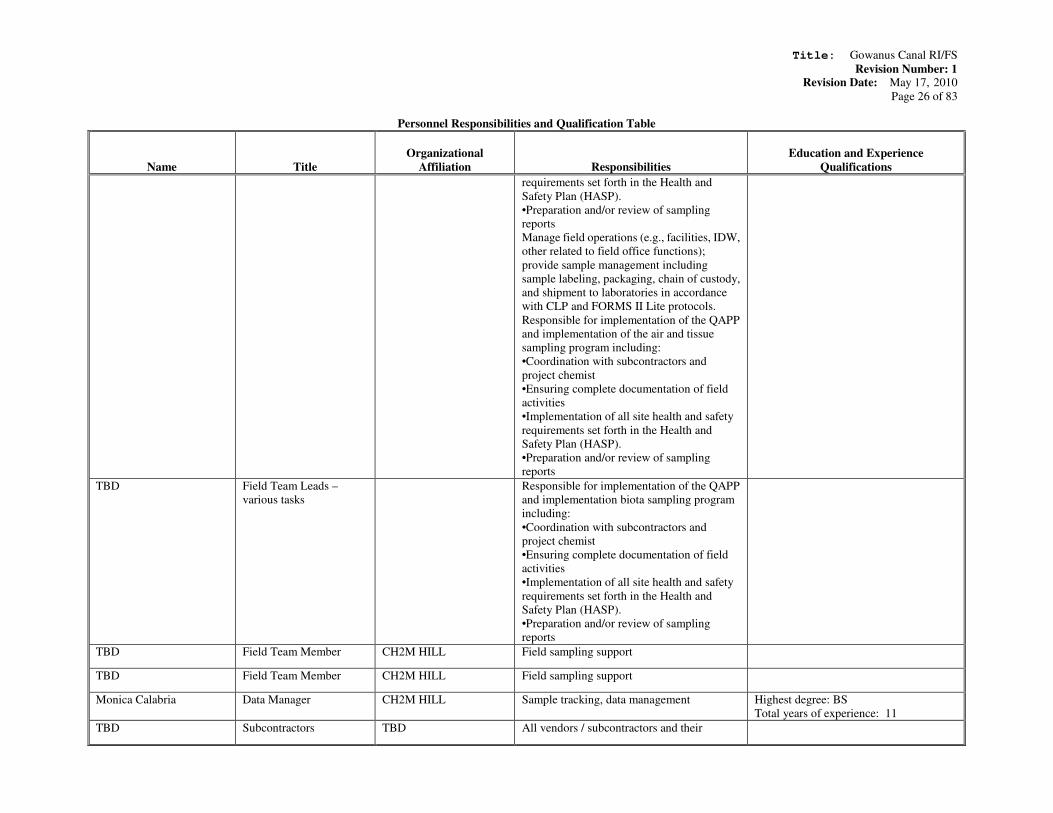
Personnel Responsibilities and Qualification Table
Name
Title
Organizational
Affiliation
Responsibilities
Education and Experience
Qualifications
requirements set forth in the Health and
Safety Plan (HASP).
•Preparation and/or review of sampling
reports
Manage field operations (e.g., facilities, IDW,
other related to field office functions);
provide sample management including
sample labeling, packaging, chain of custody,
and shipment to laboratories in accordance
with CLP and FORMS II Lite protocols.
Responsible for implementation of the QAPP
and implementation of the air and tissue
sampling program including:
•Coordination with subcontractors and
project chemist
•Ensuring complete documentation of field
activities
•Implementation of all site health and safety
requirements set forth in the Health and
Safety Plan (HASP).
•Preparation and/or review of sampling
reports
TBD Field Team Leads –
various tasks
Responsible for implementation of the QAPP
and implementation biota sampling program
including:
•Coordination with subcontractors and
project chemist
•Ensuring complete documentation of field
activities
•Implementation of all site health and safety
requirements set forth in the Health and
Safety Plan (HASP).
•Preparation and/or review of sampling
reports
TBD Field Team Member CH2M HILL Field sampling support
TBD Field Team Member CH2M HILL Field sampling support
Monica Calabria Data Manager CH2M HILL Sample tracking, data management Highest degree: BS
Total years of experience: 11
TBD Subcontractors TBD All vendors / subcontractors and their
Title: Gowanus Canal RI/FS
Revision Number: 1 Revision Date: May 17, 2010
Page 27 of 83
Personnel Responsibilities and Qualification Table
Name
Title
Organizational
Affiliation
Responsibilities
Education and Experience
Qualifications
respective responsibilities will be listed in this
table upon awards.
Title: Gowanus Canal RI/FS
Revision Number: 1 Revision Date: May 17, 2010
Page 28 of 83
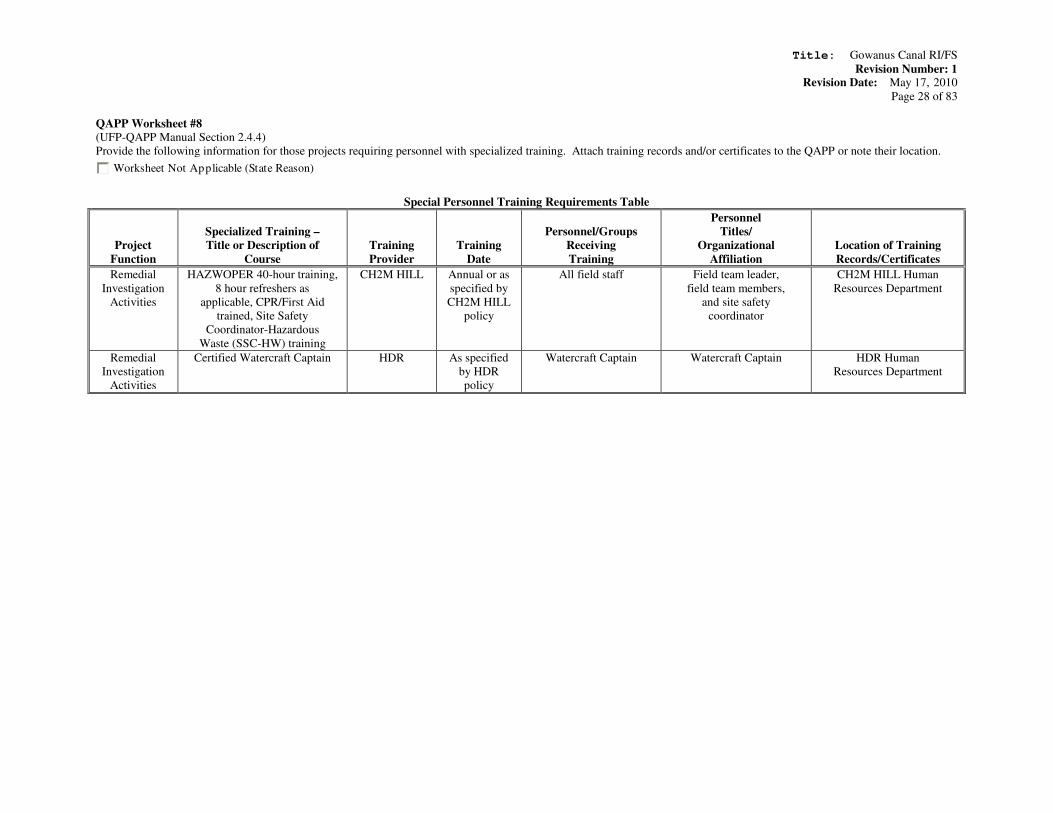
QAPP Worksheet #8
(UFP-QAPP Manual Section 2.4.4)
Provide the following information for those projects requiring personnel with specialized training. Attach training records and/or certificates to the QAPP or note their location.
Worksheet Not Applicable (State Reason)
Special Personnel Training Requirements Table
Project
Function
Specialized Training –
Title or Description of
Course
Training
Provider
Training
Date
Personnel/Groups
Receiving
Training
Personnel
Titles/
Organizational
Affiliation
Location of Training
Records/Certificates
Remedial
Investigation
Activities
HAZWOPER 40-hour training,
8 hour refreshers as
applicable, CPR/First Aid
trained, Site Safety
Coordinator-Hazardous
Waste (SSC-HW) training
CH2M HILL Annual or as
specified by
CH2M HILL
policy
All field staff Field team leader,
field team members,
and site safety
coordinator
CH2M HILL Human
Resources Department
Remedial
Investigation
Activities
Certified Watercraft Captain HDR As specified
by HDR
policy
Watercraft Captain Watercraft Captain
HDR Human
Resources Department
Title: Gowanus Canal RI/FS
Revision Number: 1 Revision Date: May 17, 2010
Page 29 of 83
QAPP Worksheet #9
(UFP-QAPP Manual Section 2.5.1)
Complete this worksheet for each project scoping session held. Identify project team members who are responsible for planning the
project.
Worksheet Not Applicable (State Reason)
Project Scoping Session Participants Sheet
Project Name: Gowanus Canal Proposed Superfund Site
RI/FS
Projected Date(s) of Sampling: May through August 2010
Project Manager: Juliana Hess
Site Name: Gowanus Canal
Site Location: Brooklyn, NY
Date of Session: October 29, 2009
Scoping Session Purpose: Project scope was outlined in the RI planning discussion on October 29, 2009 and refined in
subsequent teleconferences, a follow-up meeting on March 10, 2010, a site visit to refine sampling locations on May 18,
2010, and email communications.
Name
Title
Affiliation
Phone #
E-mail Address
Project Role
Christos Tsiamis Work
Assignment
Manager
USEPA Region
2
212-637-4257 Tsiamis.Christos
@epamail.epa.go
v
USEPA
Michael Musso Project Manager HDR 845.735.8300 ext.
261
michael.musso@h
drinc.com
Contractor Project Manager
Juliana Hess Assisstant Project
Manager
CH2M HILL 973-316-3520 juliana.hess@ch2
m.com
Contractor Assistant Project
Manager
Andrew Judd Remedial
Investigation Lead
CH2M HILL 973-316-3523 andrew.judd@ch2
m.com
Contractor Remedial
Investigation Lead
Patricia White Senior Technical
Consultant -
Sediment
Characterization
CH2M HILL 508-360-3214 patricia.white
@ch2m.com
Contractor Senior Technical
Consultant – Sediment
Characterization
Comments/Decisions: Please see below
Action Items: Please see below
Consensus Decisions: Consensus was reached on the objectives and scope described below.
The following objectives were established for the RI activities:
• Collect the information necessary for developing, evaluating, and selecting a remedy to eliminate, reduce, or manage the risks
to human health and the environment associated with the site
• Develop the informational foundation needed to reach this end goal expeditiously so that a well-supported Record of Decision
(ROD) can be developed.
To allow rapid progress, a phased delivery of the needed RI activities was planned – the first phase consisted of a bathymetry
survey; the second phase included sediment coring in the canal and associated supporting tasks; and this phase encompasses the
foolowing tasks in support of the human health and ecological risk assessments (HHRA and ERA, respectively) and to evaluate
contributions to the canal from CSOs and groundwater:
• Surface sediment
• Surface water
• Fish and shellfish tissue
• CSO Water and sediment
• Soil boring installation and sampling
• Monitoring well installation and sampling
• Synoptic water levels measurements
• Continuous water level monitoring
• Air

Title: Gowanus Canal RI/FS
Revision Number: 1 Revision Date: May 17, 2010
Page 30 of 83
• The scope for the Phase 3 activities was developed during several meetings, conference calls, and a site visit. During the site
visit, the locations of the planned surface water and sediment locations within the canal were observed relative to areas of
exposed sediment and shallow water (to confirm areas with potentially complete exposure pathways). In addition, the team
observed and finalized the locations of the ambient air samples. The individual sampling locations and the rational for
inclusion in the sampling plan are tabulated in Attachment 1 to this QAPP. Attachment 1 also contains maps illustrating the
selected sampling locations (the tissue samples will be collected based on the reach of the canal, and are not necessarily
associated with a single point).
Title: Gowanus Canal RI/FS
Revision Number: 1 Revision Date: May 17, 2010
Page 31 of 83
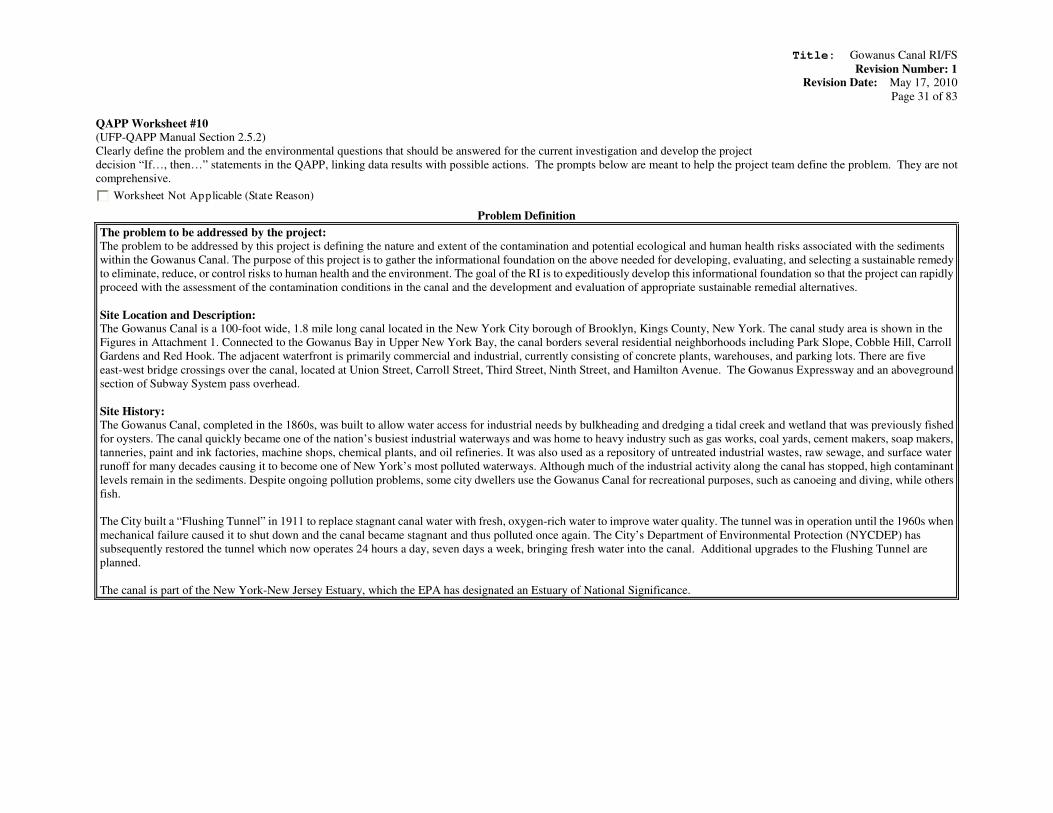
QAPP Worksheet #10
(UFP-QAPP Manual Section 2.5.2)
Clearly define the problem and the environmental questions that should be answered for the current investigation and develop the project
decision “If…, then…” statements in the QAPP, linking data results with possible actions. The prompts below are meant to help the project team define the problem. They are not
comprehensive.
Worksheet Not Applicable (State Reason)
Problem Definition
The problem to be addressed by the project:
The problem to be addressed by this project is defining the nature and extent of the contamination and potential ecological and human health risks associated with the sediments
within the Gowanus Canal. The purpose of this project is to gather the informational foundation on the above needed for developing, evaluating, and selecting a sustainable remedy
to eliminate, reduce, or control risks to human health and the environment. The goal of the RI is to expeditiously develop this informational foundation so that the project can rapidly
proceed with the assessment of the contamination conditions in the canal and the development and evaluation of appropriate sustainable remedial alternatives.
Site Location and Description: The Gowanus Canal is a 100-foot wide, 1.8 mile long canal located in the New York City borough of Brooklyn, Kings County, New York. The canal study area is shown in the
Figures in Attachment 1. Connected to the Gowanus Bay in Upper New York Bay, the canal borders several residential neighborhoods including Park Slope, Cobble Hill, Carroll
Gardens and Red Hook. The adjacent waterfront is primarily commercial and industrial, currently consisting of concrete plants, warehouses, and parking lots. There are five
east-west bridge crossings over the canal, located at Union Street, Carroll Street, Third Street, Ninth Street, and Hamilton Avenue. The Gowanus Expressway and an aboveground
section of Subway System pass overhead.
Site History:
The Gowanus Canal, completed in the 1860s, was built to allow water access for industrial needs by bulkheading and dredging a tidal creek and wetland that was previously fished
for oysters. The canal quickly became one of the nation’s busiest industrial waterways and was home to heavy industry such as gas works, coal yards, cement makers, soap makers,
tanneries, paint and ink factories, machine shops, chemical plants, and oil refineries. It was also used as a repository of untreated industrial wastes, raw sewage, and surface water
runoff for many decades causing it to become one of New York’s most polluted waterways. Although much of the industrial activity along the canal has stopped, high contaminant
levels remain in the sediments. Despite ongoing pollution problems, some city dwellers use the Gowanus Canal for recreational purposes, such as canoeing and diving, while others
fish.
The City built a “Flushing Tunnel” in 1911 to replace stagnant canal water with fresh, oxygen-rich water to improve water quality. The tunnel was in operation until the 1960s when
mechanical failure caused it to shut down and the canal became stagnant and thus polluted once again. The City’s Department of Environmental Protection (NYCDEP) has
subsequently restored the tunnel which now operates 24 hours a day, seven days a week, bringing fresh water into the canal. Additional upgrades to the Flushing Tunnel are
planned.
The canal is part of the New York-New Jersey Estuary, which the EPA has designated an Estuary of National Significance.
Title: Gowanus Canal RI/FS
Revision Number: 1 Revision Date: May 17, 2010
Page 32 of 83
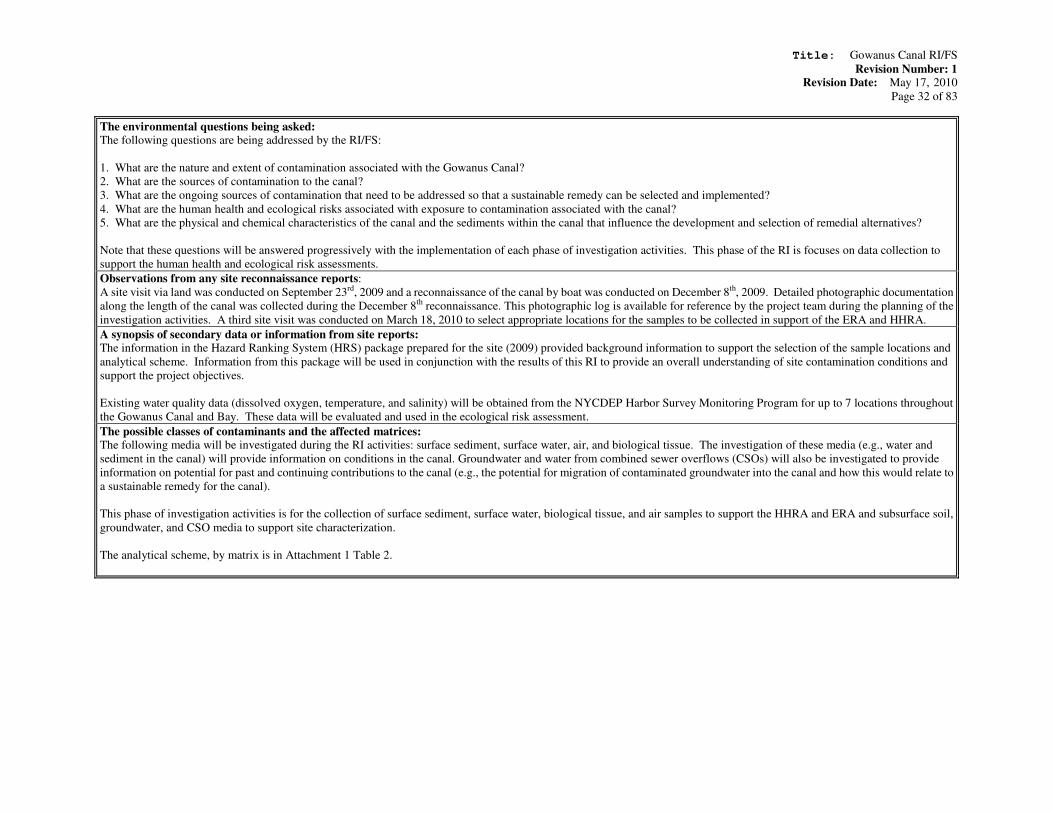
The environmental questions being asked: The following questions are being addressed by the RI/FS:
1. What are the nature and extent of contamination associated with the Gowanus Canal?
2. What are the sources of contamination to the canal?
3. What are the ongoing sources of contamination that need to be addressed so that a sustainable remedy can be selected and implemented?
4. What are the human health and ecological risks associated with exposure to contamination associated with the canal?
5. What are the physical and chemical characteristics of the canal and the sediments within the canal that influence the development and selection of remedial alternatives?
Note that these questions will be answered progressively with the implementation of each phase of investigation activities. This phase of the RI is focuses on data collection to
support the human health and ecological risk assessments.
Observations from any site reconnaissance reports:
A site visit via land was conducted on September 23rd, 2009 and a reconnaissance of the canal by boat was conducted on December 8th, 2009. Detailed photographic documentation
along the length of the canal was collected during the December 8th reconnaissance. This photographic log is available for reference by the project team during the planning of the
investigation activities. A third site visit was conducted on March 18, 2010 to select appropriate locations for the samples to be collected in support of the ERA and HHRA.
A synopsis of secondary data or information from site reports: The information in the Hazard Ranking System (HRS) package prepared for the site (2009) provided background information to support the selection of the sample locations and
analytical scheme. Information from this package will be used in conjunction with the results of this RI to provide an overall understanding of site contamination conditions and
support the project objectives.
Existing water quality data (dissolved oxygen, temperature, and salinity) will be obtained from the NYCDEP Harbor Survey Monitoring Program for up to 7 locations throughout
the Gowanus Canal and Bay. These data will be evaluated and used in the ecological risk assessment.
The possible classes of contaminants and the affected matrices: The following media will be investigated during the RI activities: surface sediment, surface water, air, and biological tissue. The investigation of these media (e.g., water and
sediment in the canal) will provide information on conditions in the canal. Groundwater and water from combined sewer overflows (CSOs) will also be investigated to provide
information on potential for past and continuing contributions to the canal (e.g., the potential for migration of contaminated groundwater into the canal and how this would relate to
a sustainable remedy for the canal).
This phase of investigation activities is for the collection of surface sediment, surface water, biological tissue, and air samples to support the HHRA and ERA and subsurface soil,
groundwater, and CSO media to support site characterization.
The analytical scheme, by matrix is in Attachment 1 Table 2.

Title: Gowanus Canal RI/FS
Revision Number: 1 Revision Date: May 17, 2010
Page 33 of 83
The rationale for inclusion of chemical and nonchemical analyses: The selected analyses for sediment and surface water are based on the information presented in the HRS package and the use history of the canal and are needed to assess chemical
contamination in the canal and the physical characteristics of the sediments (grain size analysis and TOC) or surface water (total suspended solids). The geochemistry analyses in
select groundwater and canal surface water locations were selected based on standard water chemistry indicators that can be used to differentiate groundwater from surface water
genesis and accounting for brackish tidally influenced surface waters.
The analyses of biological tissue samples are based on the constituents known to be bioaccumulative.
The analyses of air samples are based on the constituents known to be present in surface water and shallow sediments (0-3 feet) based on information presented in the HRS package.
These analyses were selected because in several areas of the canal, the sediments are exposed during periods within the tidal cycle, thus potentially allowing contaminant migration
to ambient air.
The analyses of CSO, subsurface soil, and groundwater samples are selected to be consistent with the analyses of media from the canal (surface water and sediment in the canal).
Information concerning various environmental indicators:
N/A
Project decision conditions (“If..., then...” statements): The investigation activities will allow for the determination of the potential risks to human or ecological health due to the media associated with the canal sampled as part of this
phase of RI activities (sediment, surface water, biological tissue, or air).
If contaminant concentrations in the investigated media are above the identified standards / screening levels, and are found to pose potentially unacceptable risk to human health or
the environment, then a determination will be made on whether additional investigations are needed or whether there is sufficient information to formulate remedial action
objectives, develop and evaluate remedial alternatives and support the ROD for a selected remedy.
Note that extra samples will be collected in 8 oz jars for archiving for potential future analysis from all surface sediment samples.
If soil, groundwater, and CSO sampling identify potential past and ongoing sources of contamination to canal, then it would be necessary to evaluate whether further investigation
is needed to characterize these sources or whether there is sufficient information to develop a source control plan that would support a sustainable remedy.
Title: Gowanus Canal RI/FS
Revision Number: 1 Revision Date: May 17, 2010
Page 34 of 83
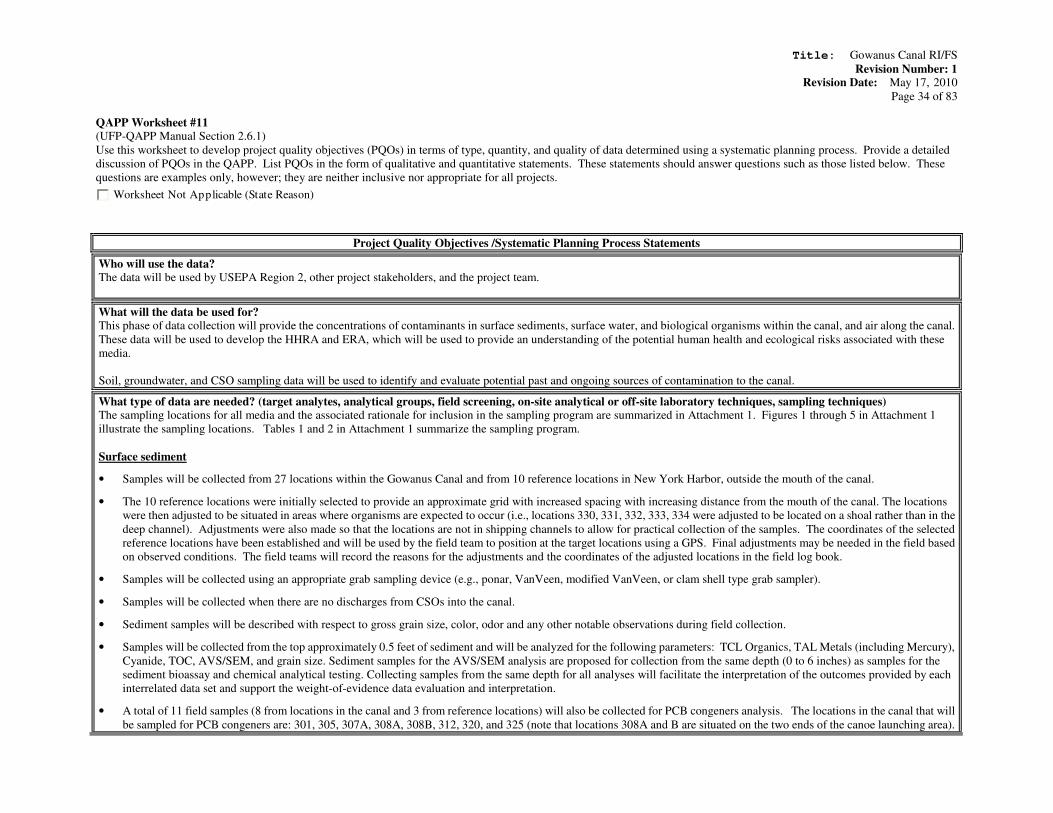
QAPP Worksheet #11 (UFP-QAPP Manual Section 2.6.1)
Use this worksheet to develop project quality objectives (PQOs) in terms of type, quantity, and quality of data determined using a systematic planning process. Provide a detailed
discussion of PQOs in the QAPP. List PQOs in the form of qualitative and quantitative statements. These statements should answer questions such as those listed below. These
questions are examples only, however; they are neither inclusive nor appropriate for all projects.
Worksheet Not Applicable (State Reason)
Project Quality Objectives /Systematic Planning Process Statements
Who will use the data? The data will be used by USEPA Region 2, other project stakeholders, and the project team.
What will the data be used for? This phase of data collection will provide the concentrations of contaminants in surface sediments, surface water, and biological organisms within the canal, and air along the canal.
These data will be used to develop the HHRA and ERA, which will be used to provide an understanding of the potential human health and ecological risks associated with these
media.
Soil, groundwater, and CSO sampling data will be used to identify and evaluate potential past and ongoing sources of contamination to the canal.
What type of data are needed? (target analytes, analytical groups, field screening, on-site analytical or off-site laboratory techniques, sampling techniques) The sampling locations for all media and the associated rationale for inclusion in the sampling program are summarized in Attachment 1. Figures 1 through 5 in Attachment 1
illustrate the sampling locations. Tables 1 and 2 in Attachment 1 summarize the sampling program.
Surface sediment
• Samples will be collected from 27 locations within the Gowanus Canal and from 10 reference locations in New York Harbor, outside the mouth of the canal.
• The 10 reference locations were initially selected to provide an approximate grid with increased spacing with increasing distance from the mouth of the canal. The locations
were then adjusted to be situated in areas where organisms are expected to occur (i.e., locations 330, 331, 332, 333, 334 were adjusted to be located on a shoal rather than in the
deep channel). Adjustments were also made so that the locations are not in shipping channels to allow for practical collection of the samples. The coordinates of the selected
reference locations have been established and will be used by the field team to position at the target locations using a GPS. Final adjustments may be needed in the field based
on observed conditions. The field teams will record the reasons for the adjustments and the coordinates of the adjusted locations in the field log book.
• Samples will be collected using an appropriate grab sampling device (e.g., ponar, VanVeen, modified VanVeen, or clam shell type grab sampler).
• Samples will be collected when there are no discharges from CSOs into the canal.
• Sediment samples will be described with respect to gross grain size, color, odor and any other notable observations during field collection.
• Samples will be collected from the top approximately 0.5 feet of sediment and will be analyzed for the following parameters: TCL Organics, TAL Metals (including Mercury),
Cyanide, TOC, AVS/SEM, and grain size. Sediment samples for the AVS/SEM analysis are proposed for collection from the same depth (0 to 6 inches) as samples for the
sediment bioassay and chemical analytical testing. Collecting samples from the same depth for all analyses will facilitate the interpretation of the outcomes provided by each
interrelated data set and support the weight-of-evidence data evaluation and interpretation.
• A total of 11 field samples (8 from locations in the canal and 3 from reference locations) will also be collected for PCB congeners analysis. The locations in the canal that will
be sampled for PCB congeners are: 301, 305, 307A, 308A, 308B, 312, 320, and 325 (note that locations 308A and B are situated on the two ends of the canoe launching area).
Title: Gowanus Canal RI/FS
Revision Number: 1 Revision Date: May 17, 2010
Page 35 of 83
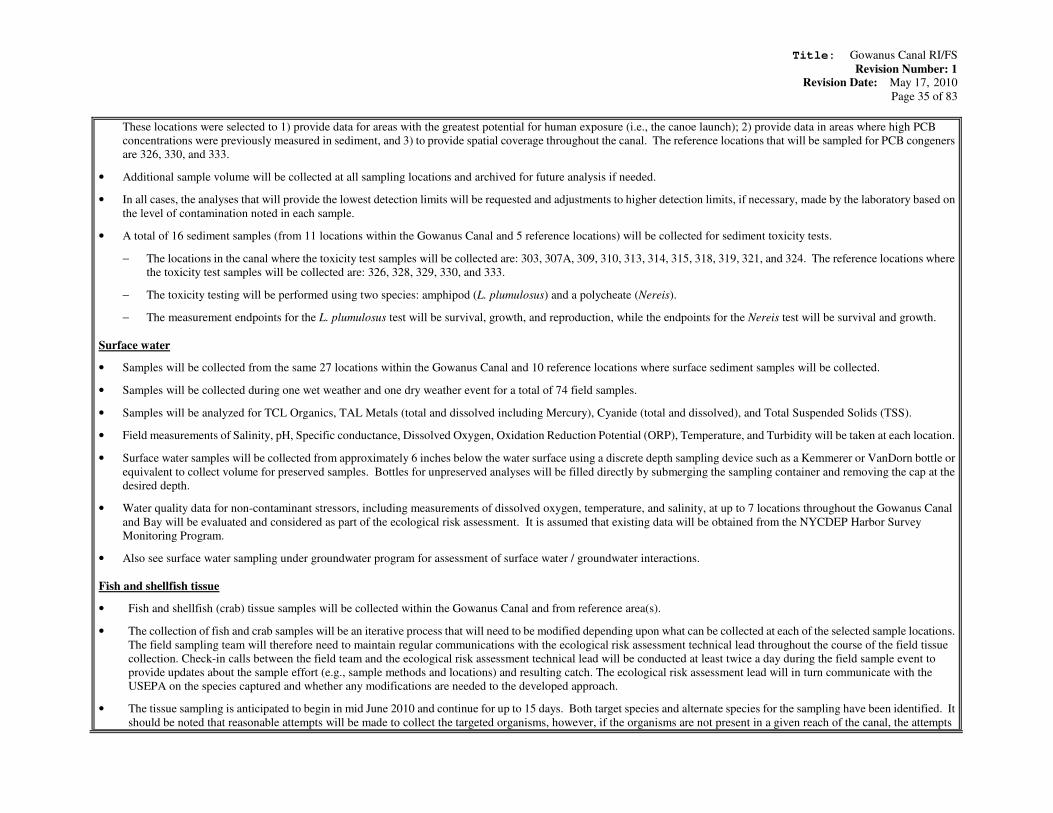
These locations were selected to 1) provide data for areas with the greatest potential for human exposure (i.e., the canoe launch); 2) provide data in areas where high PCB
concentrations were previously measured in sediment, and 3) to provide spatial coverage throughout the canal. The reference locations that will be sampled for PCB congeners
are 326, 330, and 333.
• Additional sample volume will be collected at all sampling locations and archived for future analysis if needed.
• In all cases, the analyses that will provide the lowest detection limits will be requested and adjustments to higher detection limits, if necessary, made by the laboratory based on
the level of contamination noted in each sample.
• A total of 16 sediment samples (from 11 locations within the Gowanus Canal and 5 reference locations) will be collected for sediment toxicity tests.
− The locations in the canal where the toxicity test samples will be collected are: 303, 307A, 309, 310, 313, 314, 315, 318, 319, 321, and 324. The reference locations where
the toxicity test samples will be collected are: 326, 328, 329, 330, and 333.
− The toxicity testing will be performed using two species: amphipod (L. plumulosus) and a polycheate (Nereis).
− The measurement endpoints for the L. plumulosus test will be survival, growth, and reproduction, while the endpoints for the Nereis test will be survival and growth.
Surface water
• Samples will be collected from the same 27 locations within the Gowanus Canal and 10 reference locations where surface sediment samples will be collected.
• Samples will be collected during one wet weather and one dry weather event for a total of 74 field samples.
• Samples will be analyzed for TCL Organics, TAL Metals (total and dissolved including Mercury), Cyanide (total and dissolved), and Total Suspended Solids (TSS).
• Field measurements of Salinity, pH, Specific conductance, Dissolved Oxygen, Oxidation Reduction Potential (ORP), Temperature, and Turbidity will be taken at each location.
• Surface water samples will be collected from approximately 6 inches below the water surface using a discrete depth sampling device such as a Kemmerer or VanDorn bottle or
equivalent to collect volume for preserved samples. Bottles for unpreserved analyses will be filled directly by submerging the sampling container and removing the cap at the
desired depth.
• Water quality data for non-contaminant stressors, including measurements of dissolved oxygen, temperature, and salinity, at up to 7 locations throughout the Gowanus Canal
and Bay will be evaluated and considered as part of the ecological risk assessment. It is assumed that existing data will be obtained from the NYCDEP Harbor Survey
Monitoring Program.
• Also see surface water sampling under groundwater program for assessment of surface water / groundwater interactions.
Fish and shellfish tissue
• Fish and shellfish (crab) tissue samples will be collected within the Gowanus Canal and from reference area(s).
• The collection of fish and crab samples will be an iterative process that will need to be modified depending upon what can be collected at each of the selected sample locations.
The field sampling team will therefore need to maintain regular communications with the ecological risk assessment technical lead throughout the course of the field tissue
collection. Check-in calls between the field team and the ecological risk assessment technical lead will be conducted at least twice a day during the field sample event to
provide updates about the sample effort (e.g., sample methods and locations) and resulting catch. The ecological risk assessment lead will in turn communicate with the
USEPA on the species captured and whether any modifications are needed to the developed approach.
• The tissue sampling is anticipated to begin in mid June 2010 and continue for up to 15 days. Both target species and alternate species for the sampling have been identified. It
should be noted that reasonable attempts will be made to collect the targeted organisms, however, if the organisms are not present in a given reach of the canal, the attempts
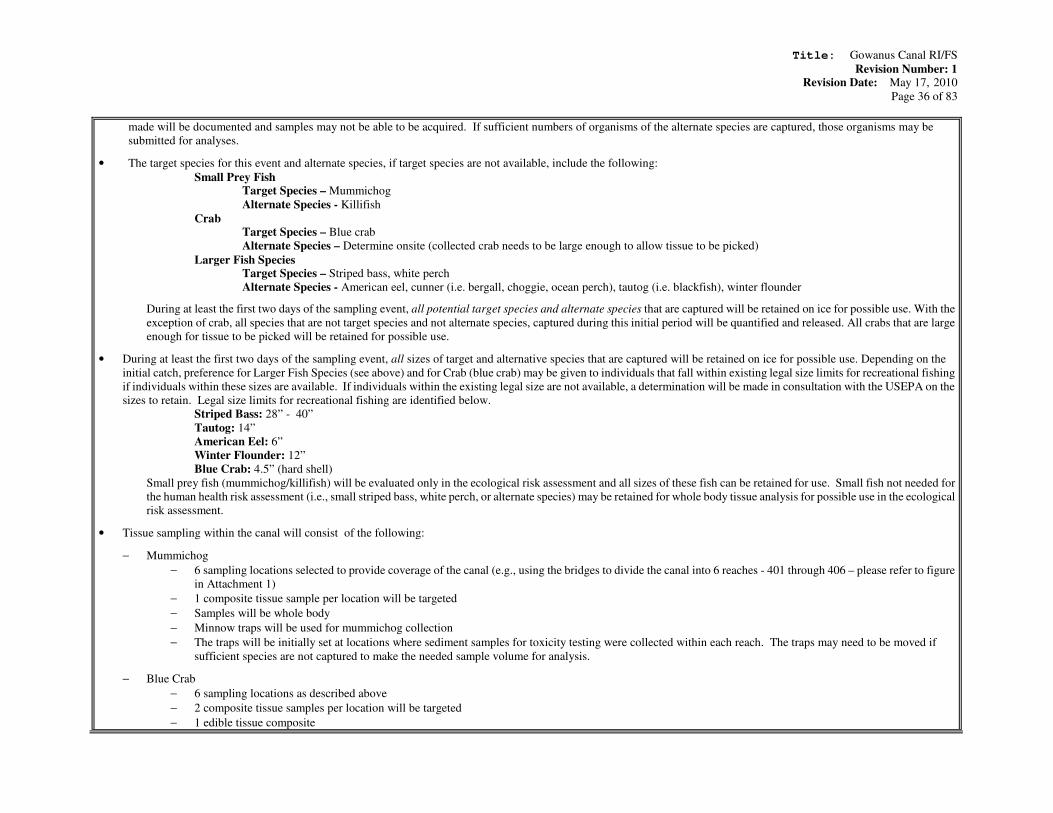
Title: Gowanus Canal RI/FS
Revision Number: 1 Revision Date: May 17, 2010
Page 36 of 83
made will be documented and samples may not be able to be acquired. If sufficient numbers of organisms of the alternate species are captured, those organisms may be
submitted for analyses.
• The target species for this event and alternate species, if target species are not available, include the following:
Small Prey Fish Target Species – Mummichog
Alternate Species - Killifish
Crab Target Species – Blue crab
Alternate Species – Determine onsite (collected crab needs to be large enough to allow tissue to be picked)
Larger Fish Species Target Species – Striped bass, white perch
Alternate Species - American eel, cunner (i.e. bergall, choggie, ocean perch), tautog (i.e. blackfish), winter flounder
During at least the first two days of the sampling event, all potential target species and alternate species that are captured will be retained on ice for possible use. With the
exception of crab, all species that are not target species and not alternate species, captured during this initial period will be quantified and released. All crabs that are large
enough for tissue to be picked will be retained for possible use.
• During at least the first two days of the sampling event, all sizes of target and alternative species that are captured will be retained on ice for possible use. Depending on the
initial catch, preference for Larger Fish Species (see above) and for Crab (blue crab) may be given to individuals that fall within existing legal size limits for recreational fishing
if individuals within these sizes are available. If individuals within the existing legal size are not available, a determination will be made in consultation with the USEPA on the
sizes to retain. Legal size limits for recreational fishing are identified below.
Striped Bass: 28” - 40”
Tautog: 14”
American Eel: 6”
Winter Flounder: 12”
Blue Crab: 4.5” (hard shell)
Small prey fish (mummichog/killifish) will be evaluated only in the ecological risk assessment and all sizes of these fish can be retained for use. Small fish not needed for
the human health risk assessment (i.e., small striped bass, white perch, or alternate species) may be retained for whole body tissue analysis for possible use in the ecological
risk assessment.
• Tissue sampling within the canal will consist of the following:
− Mummichog
− 6 sampling locations selected to provide coverage of the canal (e.g., using the bridges to divide the canal into 6 reaches - 401 through 406 – please refer to figure
in Attachment 1)
− 1 composite tissue sample per location will be targeted
− Samples will be whole body
− Minnow traps will be used for mummichog collection
− The traps will be initially set at locations where sediment samples for toxicity testing were collected within each reach. The traps may need to be moved if
sufficient species are not captured to make the needed sample volume for analysis.
− Blue Crab
− 6 sampling locations as described above
− 2 composite tissue samples per location will be targeted
− 1 edible tissue composite
Title: Gowanus Canal RI/FS
Revision Number: 1 Revision Date: May 17, 2010
Page 37 of 83
− 1 hepatopancreas tissue composite
− Crab pots will be used for blue crab collection
− The pots will be initially set at locations where sediment samples for toxicity testing were collected within each reach. The traps may need to be moved if
sufficient species are not captured to make the needed sample volume for analysis.
− Striped Bass and White Perch
− Fish will be caught along the length of the canal where ever found
− For each species, target is 6 composite fillet tissue samples and 6 composite samples of the rest of the carcass (total of 12 samples for each species)
− Fillet data will be used in HHRA, and fillet plus carcass data will be combined to represent whole fish concentrations
− The larger sport fish will be collected using fyke or hoop nets, seines or gill nets, or angling. The collection of sport fish may require a combination of all three
sampling methods in order to collect sufficient organisms.
− Reference samples for each tissue type, will be collected from 5 reference sites situated at the mouth of the Gowanus Canal and into the Gowanus Bay. The general area
where the reference tissue samples will be collected is referred to reach 407. All of the selected reference surface water and sediment samples are situated within reach 407.
− The reference sites for the mummichog and blue crab within reach 407 will be initially set at locations 326, 328, 329, 330, and 333 where reference sediment
samples for toxicity testing are planned. From there, the traps / pots may need to be moved to other locations within reach 407 if sufficient species are not
captured at the initial locations to make the needed sample volume for analysis.
− The reference samples for the larger fish will be obtained in the general area of reach 407 where the surface water and sediment reference samples are situated.
The analytical scheme for the tissue samples is identified below. The targeted list of analytes was selected based on the constituents detected in shallow sediments (0-3’) during the
previous investigations that are also known to be bioaccumulative. The target analyte list for the air samples is provided in Attachment 1. If insufficient tissue mass for all chemical
analyses is recovered after attempting various recovery schemes, then analyses will be performed in the order shown below. PAHs, PCBs and metals are expected to be the primary
constituents of concern based on review of existing data. PAHs will be analyzed in crab tissue only because PAHs do not bioaccumulate in fish. If insufficient tissue mass is
available for both PCBs and metals analysis, then a final decision about analytical parameters will be made in consultation with EPA.
− Blue crab:
1. PAHs (TCL-SVOCs)
2. PCB congeners and TAL metals (including mercury)
3. Pesticides (TCL-Pest)
− Mummichog, striped bass, and white perch:
1. PCB congeners and TAL metals (including mercury)
2. Pesticides (TCL-Pest)
− All samples will be analyzed for percent moisture and lipid content
The target analyte list for tissue samples is provided in Attachment 1.
Ambient air
• Air samples will be collected from 10 locations along the canal and from 3 background locations (Figure 4). The background locations were placed upwind from the canal
based on predominant wind direction. The locations will be finalized following site reconnaissance to accommodate location logistics considerations.
• Two rounds are planned – one before and one after the start of the canal oxygenation system being installed by New York City. Air sampling will occur 2-3 days following a
rain event.
• At each location along the canal, two samples are planned – one at canoe level and one at street level. The samplers at the canoe level and some of the samples at the street
Title: Gowanus Canal RI/FS
Revision Number: 1 Revision Date: May 17, 2010
Page 38 of 83
level will need to be installed from the water.
• A total of 46 field air samples will be collected.
Samples will be 24-hour composite samples. All samples will be analyzed for VOCs and PAHs. One sample collected at street level (location 506 at the street level) will be
analyzed for PCBs. Samples for VOC analysis will be collected using Summa canisters. Samples for analyses for PAHs will be collected using low-volume samplers. The sample
for PCB analysis will be collected using high-volume sampler and was selected at a location where it can be secured and an electrical drop line provided for the operation of the
sampler.
The target analyte list for the air samples is provided in Attachment 1.
Combined Sewer Overflows (CSOs) to the Canal - water and sediment
• Water and sediment samples will be collected from the following 10 CSOs discharging to the canal:
RH-031Bond-Lorraine Sewer relief at Lorraine and Smith Streets
RH-0034 Gowanus Pump Station
RH-033 Regulator R-25 at Nevins and Douglass Streets
RH-035 Bond-Lorraine Sewer relief at Bond and 4th Streets
RH-037 Regulator R-23 at Nevins and Sackett Streets
RH-036 Regulator R-22 at Nevins and President Streets
RH-038 Regulator R-24 at Nevins and Degraw Streets
OH-005 3rd Avenue sewer relief at 3rd Ave. and Carroll St.
OH-006 3rd Avenue sewer relief at 3rd Ave. and 19th St.
OH-007 2nd Avenue Pump Station at 3rd Ave. and 7th St.
A map of the CSO sampling locations will be prepared and superimposed on a map showing the CSO discharge points into the canal after the final sampling points are selected.
• Water samples will be collected during one dry and three wet weather events for a total of 40 field samples. Wet weather sampling will occur only when at least 1/10 of an inch
of rainfall occurs with low tide conditions and will begin shortly (3-6 hours) after the start of the rain event. Dry weather sampling will occur a minimum of 2-3 days after a rain
event. At one location (the Gowanus Pump Station), the sample will be collected using an auto sampling device. At the remaining nine locations, grab samples will be collected
from manholes where regulators/relieve valves are located upstream of the CSO discharge into the canal. Samples from these manholes are expected not to include backflow
(tidal intrusion) from the canal and represent the flow discharging through the CSOs into the canal. The dry weather event will be conducted first and used to assess sampling
protocols. The CSO has sanitary and street runoff components. Dry weather sampling will indicate whether there are sanitary sources of contaminants in the CSO discharges
that may be contributing to conditions in the canal.. The dry weather sampling event will include the collection of both water and sediment samples. Wet weather samples will
be used to assess the combined flow discharging through the CSOs into the canal. The wet weather sampling events will include the collection of water samples.
• A field reconnaissance site visit will be performed at the start of the field activities to verify sampling locations and conditions and make arrangements for dry and wet weather
sampling. This will require entering the Gowanus Pump Station to identify a suitable location for the installation of an automatic sampler with a flow or hydrostatic sensor that
will trigger sampling when a wet weather event begins. The field team will also inspect monitoring locations in the streets around the canal to verify manhole or regulator
access locations, and suitability for sampling.
• The following analyses are planned:
Water samples - TCL Organics, TAL Metals (total and dissolved including Mercury), Cyanide (total only), and TSS. Field measurements of Salinity, pH, Specific conductance,
Dissolved Oxygen, Oxidation Reduction Potential (ORP), Temperature, and Turbidity will be taken at each location.
Sediment samples - TCL Organics, TAL Metals (including Mercury), Cyanide, TOC and grain size. Sediment samples will be described with respect to gross grain size, color,
Title: Gowanus Canal RI/FS
Revision Number: 1 Revision Date: May 17, 2010
Page 39 of 83
odor and any other notable observations during field collection. Sediment samples will be composites of the sediments that are brought to the surface (except for the sample for
VOC analysis which will be collected from the area of highest PID response or evidence of contamination based on visual observations of the sediments brought to the surface).
Soil borings and monitoring wells
Note that 66 monitoring wells are planned along the canal. This QAPP is for the installation of 15 nested monitoring well pairs (30 monitoring wells). The remaining monitoring wells
will be installed by other entities.
The monitoring well pairs will include a shallow and an intermediate well extending to depths of approximately 20 and 50 feet, respectively bgs, installed in one large diameter
borehole. The shallow wells will be screened 10 feet across the water table and the intermediate wells will have 5-foot screens at depths corresponding to 5 feet below the elevation of
native sediments at the bottom of the Canal near the location of each monitoring well pair. The calculated depths of the screens of the intermediate monitoring wells are provided in
Attachment 1.Installation is planned using the RotaSonic drilling method. Soil cores will be collected and logged. Soil boring installation and well construction are described in the
SOPs.
Continuous soil sampling will be performed at the soil borings installed for eight of the 12 well pairs (locations to be sampled will be selected after consultation with the US EPA).
The samples for all but the VOC analyses will be composited over 5-foot intervals or a total of 10 soil samples will be collected from each soil boring location targeted for sampling.
The samples for VOC analysis will be collected before collecting the samples for the remaining analyses. TerraCore samplers will be used to collect grab samples from the section of
each 5-foot interval with the highest PID reading or with visual indication of contamination. If uniform conditions are observed over the 5-foot interval, then the VOC sample will be
collected from the middle of the interval.
Composite samples for the remaining analyses (TCL Organics, TAL Metals including Mercury, and Cyanide) will be collected as composites over each discrete 5-foot interval over
the entire depth of the soil boring.
Note that a sample volume will be collected in an 8 oz jar for archiving for future analysis.
Groundwater
One round of groundwater samples will be collected from all monitoring wells for the following analyses:
− Samples from all wells for TCL Organics and TAL Metals (total and dissolved including Mercury), and Cyanide (total only).
− Samples from 8 of the monitoring well pairs (16 wells) (and surface water from the adjacent canal, 5 locations) for the following water quality parameters: Alkalinity,
Ammonia, Calcium, Chlorides, Iron – Total, Iron – Dissolved, Magnesium, Manganese – Total, Manganese – Dissolved, Aluminum, Nitrates, TKN, Organic Carbon –
dissolved, Organic Carbon – Total, Potassium, Phosphate, Total Hardness, Silica, Sodium, Sulfates, Total Dissolved solids (TDS), and Total Suspended Solids (TSS). The
samples from the canal will be collected from the land and will target the 6 inches of water above the bottom of the canal. The samples will be collected during dry weather
and during low tide as close as possible to the end of the groundwater sampling event.
− The monitoring well pairs (shallow and intermediate) that will be sampled for water quality parameters (listed in the order of occurrence from the head to the mouth of the
canal and also identified in Attachment 1) are: 3, 4, 11, 12, 15, 16, 37, and 39. These locations were selected to provide full coverage of the length of the canal for assessing
groundwater contributions to the canal. The locations of surface water in the canal that will be sampled will be near monitoring well locations 3, 11, 15, 37, and 39.
− Field measurements of the following water quality parameters will also be collected during groundwater sampling and from the surface water sampling locations: Salinity,
pH, Specific conductance, Dissolved Oxygen, Oxidation Reduction Potential (ORP), Temperature, and Turbidity. In addition, field measurement of Ferrous (+II) Iron will
be conducted in the 8 monitoring well pairs and surface water samples sampled for water quality parameters.
Title: Gowanus Canal RI/FS
Revision Number: 1 Revision Date: May 17, 2010
Page 40 of 83
− Water quality analyses will characterize the chemistry of canal water and groundwater across the breadth of the site including cation/anions composition,
oxidation/reduction potential, the presence of nutrients, biological activity, and native acidity. In concert with the evaluation of water levels, these analyses can help
determine the bulk and spatial, contribution of groundwater to the canal. A suite of tools will be utilized including ternary diagrams, water quality mapping, phase diagrams,
and geochemical modeling to evaluate the water quality data
− The sampling will be performed a minimum of two weeks following installation and development of the new monitoring wells. Sampling will be performed using
submersible pumps following USEPA’s low-flow groundwater sampling procedures.
• Six rounds of monthly synoptic water elevation surveys. Measurements will be collected in installed monitoring wells and from the staff gauge reference points in the canal.
Each of the six synoptic surveys will be completed within a 3-hour period to minimize tidal influences. Monthly events will be scheduled such that measurements are collected
during different stages of tidal cycles.
• Continuous water elevation data logging will be performed in 22 wells (shallow and intermediate) spatially distributed across the study area and at 6 locations within the canal
(plus one barometric transducer) to evaluate tidal influences on the groundwater / surface water system. The monitoring well pairs where the continuous monitoring will be
performed were selected to provide full coverage of the length of the canal and include the following monitoring wells listed in the order of their occurrence from the head to the
mouth of the canal: 33, 3, 4, 25, 26, 20, 21, 13, 14, 15, and 16.
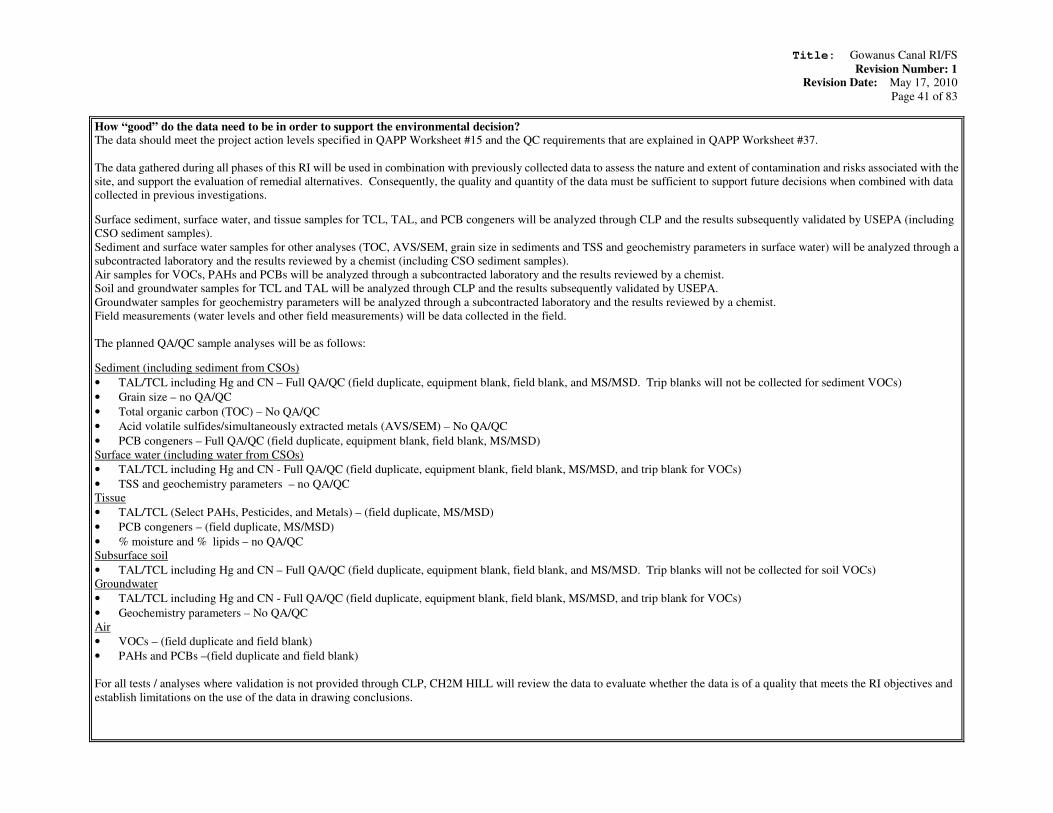
Title: Gowanus Canal RI/FS
Revision Number: 1 Revision Date: May 17, 2010
Page 41 of 83
How “good” do the data need to be in order to support the environmental decision? The data should meet the project action levels specified in QAPP Worksheet #15 and the QC requirements that are explained in QAPP Worksheet #37.
The data gathered during all phases of this RI will be used in combination with previously collected data to assess the nature and extent of contamination and risks associated with the
site, and support the evaluation of remedial alternatives. Consequently, the quality and quantity of the data must be sufficient to support future decisions when combined with data
collected in previous investigations.
Surface sediment, surface water, and tissue samples for TCL, TAL, and PCB congeners will be analyzed through CLP and the results subsequently validated by USEPA (including
CSO sediment samples).
Sediment and surface water samples for other analyses (TOC, AVS/SEM, grain size in sediments and TSS and geochemistry parameters in surface water) will be analyzed through a
subcontracted laboratory and the results reviewed by a chemist (including CSO sediment samples).
Air samples for VOCs, PAHs and PCBs will be analyzed through a subcontracted laboratory and the results reviewed by a chemist.
Soil and groundwater samples for TCL and TAL will be analyzed through CLP and the results subsequently validated by USEPA.
Groundwater samples for geochemistry parameters will be analyzed through a subcontracted laboratory and the results reviewed by a chemist.
Field measurements (water levels and other field measurements) will be data collected in the field.
The planned QA/QC sample analyses will be as follows:
Sediment (including sediment from CSOs)
• TAL/TCL including Hg and CN – Full QA/QC (field duplicate, equipment blank, field blank, and MS/MSD. Trip blanks will not be collected for sediment VOCs)
• Grain size – no QA/QC
• Total organic carbon (TOC) – No QA/QC
• Acid volatile sulfides/simultaneously extracted metals (AVS/SEM) – No QA/QC
• PCB congeners – Full QA/QC (field duplicate, equipment blank, field blank, MS/MSD)
Surface water (including water from CSOs)
• TAL/TCL including Hg and CN - Full QA/QC (field duplicate, equipment blank, field blank, MS/MSD, and trip blank for VOCs)
• TSS and geochemistry parameters – no QA/QC
Tissue
• TAL/TCL (Select PAHs, Pesticides, and Metals) – (field duplicate, MS/MSD)
• PCB congeners – (field duplicate, MS/MSD)
• % moisture and % lipids – no QA/QC
Subsurface soil
• TAL/TCL including Hg and CN – Full QA/QC (field duplicate, equipment blank, field blank, and MS/MSD. Trip blanks will not be collected for soil VOCs)
Groundwater
• TAL/TCL including Hg and CN - Full QA/QC (field duplicate, equipment blank, field blank, MS/MSD, and trip blank for VOCs)
• Geochemistry parameters – No QA/QC
Air
• VOCs – (field duplicate and field blank)
• PAHs and PCBs –(field duplicate and field blank)
For all tests / analyses where validation is not provided through CLP, CH2M HILL will review the data to evaluate whether the data is of a quality that meets the RI objectives and
establish limitations on the use of the data in drawing conclusions.
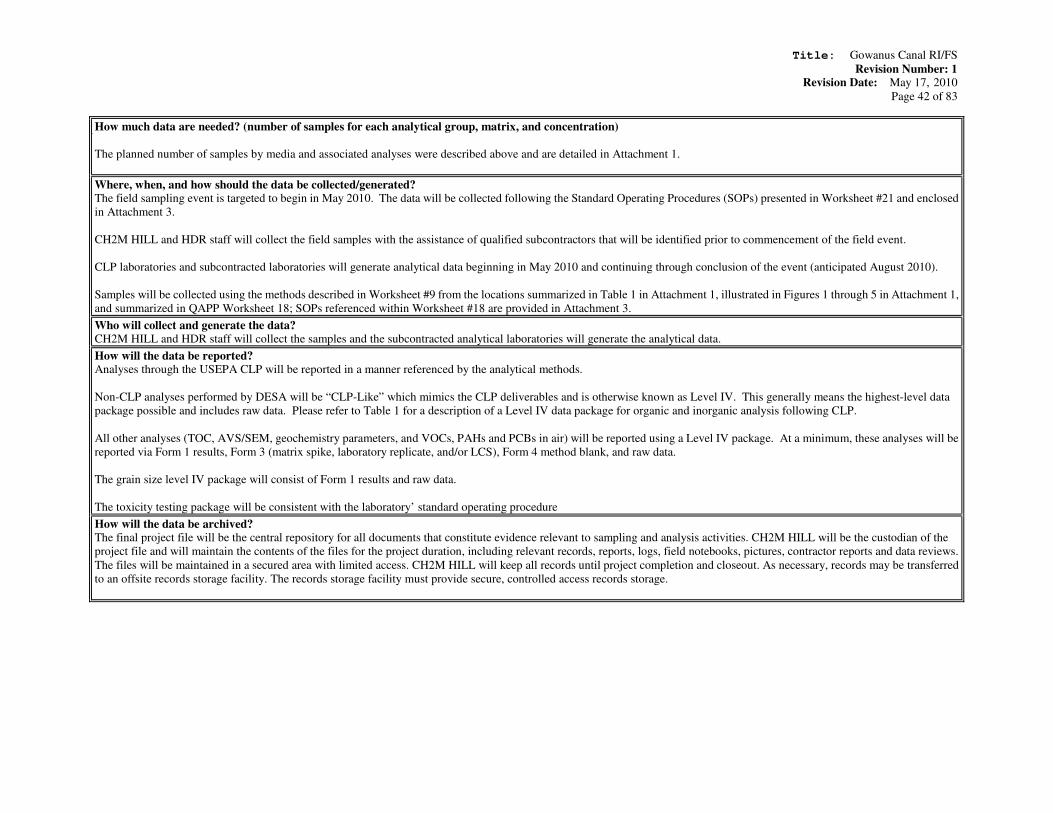
Title: Gowanus Canal RI/FS
Revision Number: 1 Revision Date: May 17, 2010
Page 42 of 83
How much data are needed? (number of samples for each analytical group, matrix, and concentration)
The planned number of samples by media and associated analyses were described above and are detailed in Attachment 1.
Where, when, and how should the data be collected/generated? The field sampling event is targeted to begin in May 2010. The data will be collected following the Standard Operating Procedures (SOPs) presented in Worksheet #21 and enclosed
in Attachment 3.
CH2M HILL and HDR staff will collect the field samples with the assistance of qualified subcontractors that will be identified prior to commencement of the field event.
CLP laboratories and subcontracted laboratories will generate analytical data beginning in May 2010 and continuing through conclusion of the event (anticipated August 2010).
Samples will be collected using the methods described in Worksheet #9 from the locations summarized in Table 1 in Attachment 1, illustrated in Figures 1 through 5 in Attachment 1,
and summarized in QAPP Worksheet 18; SOPs referenced within Worksheet #18 are provided in Attachment 3.
Who will collect and generate the data? CH2M HILL and HDR staff will collect the samples and the subcontracted analytical laboratories will generate the analytical data.
How will the data be reported? Analyses through the USEPA CLP will be reported in a manner referenced by the analytical methods.
Non-CLP analyses performed by DESA will be “CLP-Like” which mimics the CLP deliverables and is otherwise known as Level IV. This generally means the highest-level data
package possible and includes raw data. Please refer to Table 1 for a description of a Level IV data package for organic and inorganic analysis following CLP.
All other analyses (TOC, AVS/SEM, geochemistry parameters, and VOCs, PAHs and PCBs in air) will be reported using a Level IV package. At a minimum, these analyses will be
reported via Form 1 results, Form 3 (matrix spike, laboratory replicate, and/or LCS), Form 4 method blank, and raw data.
The grain size level IV package will consist of Form 1 results and raw data.
The toxicity testing package will be consistent with the laboratory’ standard operating procedure
How will the data be archived? The final project file will be the central repository for all documents that constitute evidence relevant to sampling and analysis activities. CH2M HILL will be the custodian of the
project file and will maintain the contents of the files for the project duration, including relevant records, reports, logs, field notebooks, pictures, contractor reports and data reviews.
The files will be maintained in a secured area with limited access. CH2M HILL will keep all records until project completion and closeout. As necessary, records may be transferred
to an offsite records storage facility. The records storage facility must provide secure, controlled access records storage.
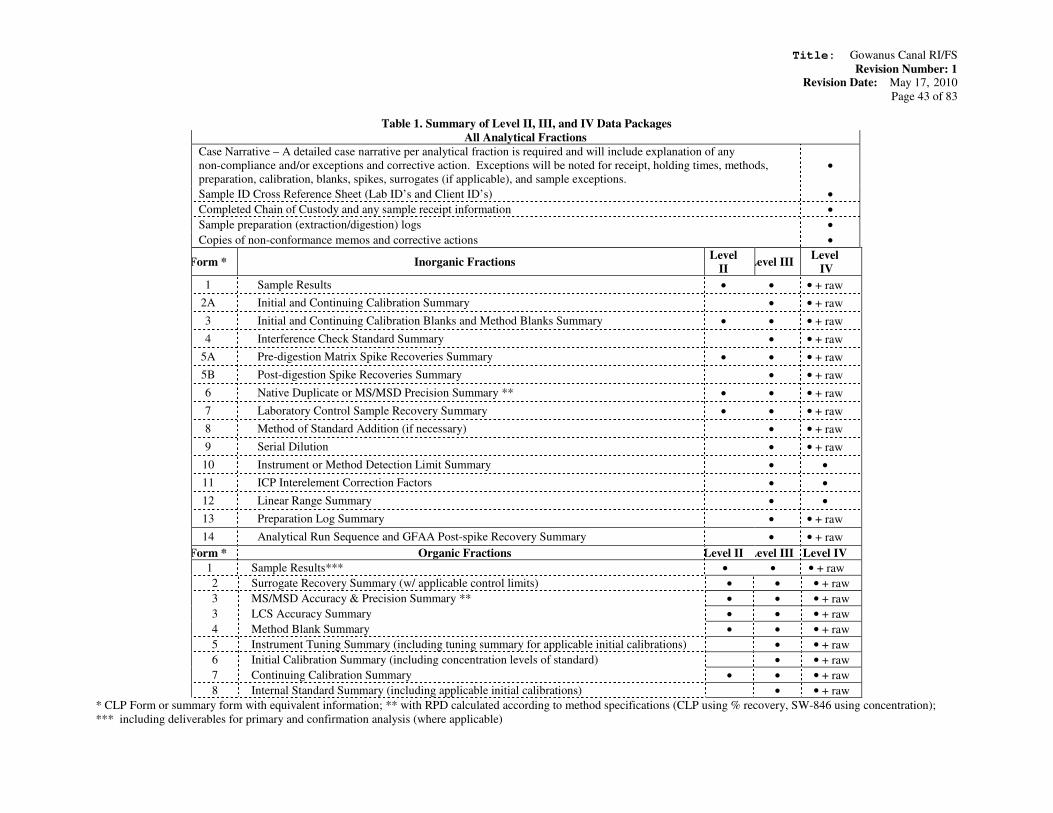
Title: Gowanus Canal RI/FS
Revision Number: 1 Revision Date: May 17, 2010
Page 43 of 83
Table 1. Summary of Level II, III, and IV Data Packages
All Analytical Fractions
Case Narrative – A detailed case narrative per analytical fraction is required and will include explanation of any
non-compliance and/or exceptions and corrective action. Exceptions will be noted for receipt, holding times, methods,
preparation, calibration, blanks, spikes, surrogates (if applicable), and sample exceptions. •
Sample ID Cross Reference Sheet (Lab ID’s and Client ID’s) •
Completed Chain of Custody and any sample receipt information •
Sample preparation (extraction/digestion) logs •
Copies of non-conformance memos and corrective actions •
Form * Inorganic Fractions Level
II Level III
Level
IV
1 Sample Results • • • + raw
2A Initial and Continuing Calibration Summary • • + raw
3 Initial and Continuing Calibration Blanks and Method Blanks Summary • • • + raw
4 Interference Check Standard Summary • • + raw
5A Pre-digestion Matrix Spike Recoveries Summary • • • + raw
5B Post-digestion Spike Recoveries Summary • • + raw
6 Native Duplicate or MS/MSD Precision Summary ** • • • + raw
7 Laboratory Control Sample Recovery Summary • • • + raw
8 Method of Standard Addition (if necessary) • • + raw
9 Serial Dilution • • + raw
10 Instrument or Method Detection Limit Summary • •
11 ICP Interelement Correction Factors • •
12 Linear Range Summary • •
13 Preparation Log Summary • • + raw
14 Analytical Run Sequence and GFAA Post-spike Recovery Summary • • + raw
Form * Organic Fractions Level II Level III Level IV
1 Sample Results*** • • • + raw
2 Surrogate Recovery Summary (w/ applicable control limits) • • • + raw
3 MS/MSD Accuracy & Precision Summary ** • • • + raw
3 LCS Accuracy Summary • • • + raw
4 Method Blank Summary • • • + raw
5 Instrument Tuning Summary (including tuning summary for applicable initial calibrations) • • + raw
6 Initial Calibration Summary (including concentration levels of standard) • • + raw
7 Continuing Calibration Summary • • • + raw
8 Internal Standard Summary (including applicable initial calibrations) • • + raw
* CLP Form or summary form with equivalent information; ** with RPD calculated according to method specifications (CLP using % recovery, SW-846 using concentration);
*** including deliverables for primary and confirmation analysis (where applicable)
Title: Gowanus Canal RI/FS
Revision Number: 1 Revision Date: May 17, 2010
Page 44 of 83
QAPP Worksheet #12
(UFP-QAPP Manual Section 2.6.2)
Complete this worksheet for each matrix, analytical group, and concentration level. Identify the data quality indicators (DQIs), measurement performance criteria (MPC), and QC
sample and/or activity used to assess the measurement performance for both the sampling and analytical measurement systems. Use additional worksheets if necessary. If MPC for
a specific DQI vary within an analytical parameter, i.e., MPC are analyte-specific, then provide analyte-specific MPC on an additional worksheet.
Worksheet Not Applicable (State Reason)

QAPP Worksheet #12-1
(UFP-QAPP Manual Section 2.6.2)
Measurement Performance Criteria Table
Matrix4 SD, CSD, SB, GW,
CSW, SW, AQ
Analytical Group1 VOA
Concentration Level
Low Soil, Low
Water, Trace Water,
Trace Water by SIM
Sampling Procedure2
Analytical
Method/SOP3
Data Quality
Indicators (DQIs)Measurement Performance Criteria
QC Sample and/or Activity Used to Assess
Measurement Performance
QC Sample Assesses Error for
Sampling (S), Analytical (A)
or both (S&A)
Contamination Same as Method BlankField Blanks (Equipment Rinseate Blank,
Ambient Field Blank, Trip Blank)S
PrecisionShould meet RPD criteria of 35% for SD, CSD, and SB
Should meet RPD criteria of 25% for GW, CSW, and SWField Duplicate S&A
Contamination/Bias
Must meet all internal standard and DMC criteria. All target
compounds < CRQL except methylene chloride, acetone, and
2-butanone which must be < 2 times the CRQL
Method Blank A
Contamination Same as Method Blank Instrument Blank A
AccuracyMust meet all DMC criteria as specified by EPA CLP
SOM01.2Deuterated Monitoring Compounds (DMC) A
Precision/Accuracy
Must be analyzed within holding time. Must meet relative
RT criteria as specified by EPA CLP SOM01.2. Should meet
advisory %R and RPD criteria as specified by EPA CLP
SOM01.2.
Matrix Spike/Matrix Spike Duplicate S&A
Representativeness 2-6°C Temperature Blank S
Representativeness Qualitative
Documentation that approved sampling
procedures and quality control procedures
were followed. Documentation that analytical
method requirements were met.
S&A
Completeness >90% of results not rejected by data validator Calculation of percent completeness. S&A
1If information varies within an analytical group, separate by individual analyte.
2Reference number from QAPP Worksheet #21 (see Section 3.1.2).
3Reference number from QAPP Worksheet #23 (see Section 3.2). NA: SOPs are kept on file at the CLP laboratory that will perform the analysis.
EPA CLP SOM01.2
/ NA3
SOP-16, SOP-17, SOP-19,
SOP-20, SOP-24, SOP-28
4SD = Sediment (Low Soil); CSD = CSO Sediment (Low Soil); SB = Subsurface Soil (Low Soil); GW = Groundwater (Trace Water, Trace Water by SIM); CSW = CSO Surface Water (Trace
Water, Trace Water by SIM); SW = Surface Water (Trace Water, Trace Water by SIM); AQ = Aqueous (Low Water)
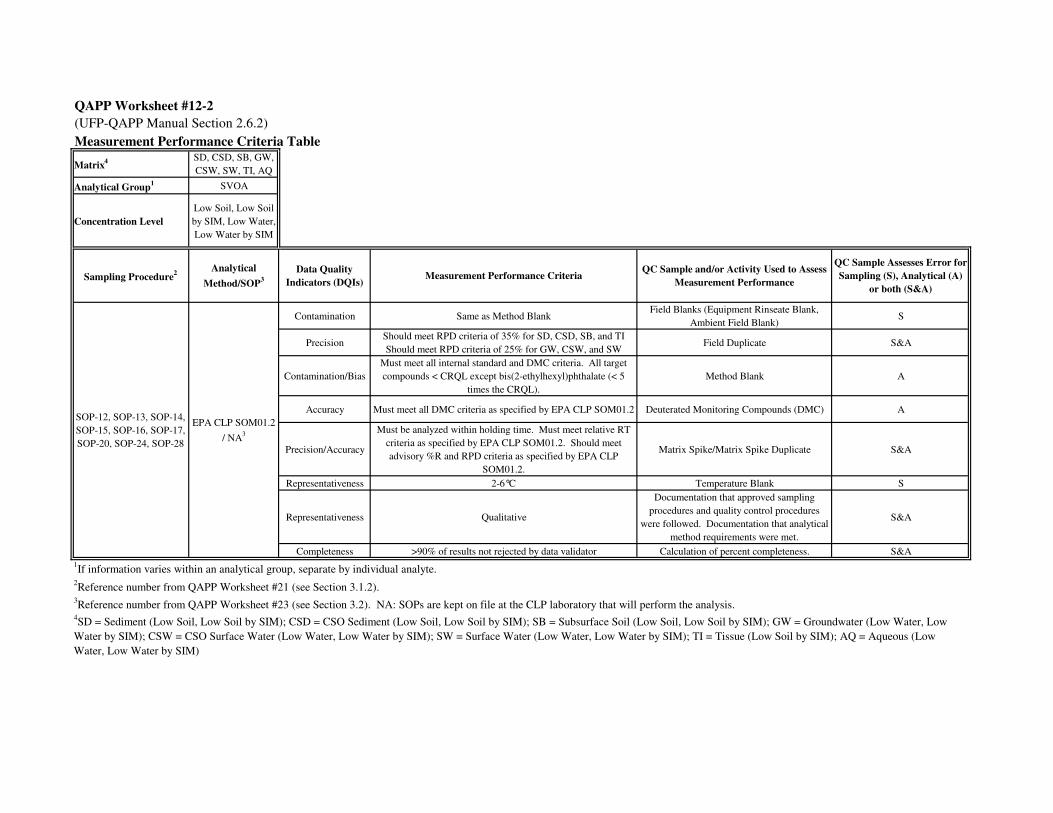
QAPP Worksheet #12-2
(UFP-QAPP Manual Section 2.6.2)
Measurement Performance Criteria Table
Matrix4 SD, CSD, SB, GW,
CSW, SW, TI, AQ
Analytical Group1 SVOA
Concentration Level
Low Soil, Low Soil
by SIM, Low Water,
Low Water by SIM
Sampling Procedure2
Analytical
Method/SOP3
Data Quality
Indicators (DQIs)Measurement Performance Criteria
QC Sample and/or Activity Used to Assess
Measurement Performance
QC Sample Assesses Error for
Sampling (S), Analytical (A)
or both (S&A)
Contamination Same as Method BlankField Blanks (Equipment Rinseate Blank,
Ambient Field Blank)S
PrecisionShould meet RPD criteria of 35% for SD, CSD, SB, and TI
Should meet RPD criteria of 25% for GW, CSW, and SWField Duplicate S&A
Contamination/Bias
Must meet all internal standard and DMC criteria. All target
compounds < CRQL except bis(2-ethylhexyl)phthalate (< 5
times the CRQL).
Method Blank A
Accuracy Must meet all DMC criteria as specified by EPA CLP SOM01.2 Deuterated Monitoring Compounds (DMC) A
Precision/Accuracy
Must be analyzed within holding time. Must meet relative RT
criteria as specified by EPA CLP SOM01.2. Should meet
advisory %R and RPD criteria as specified by EPA CLP
SOM01.2.
Matrix Spike/Matrix Spike Duplicate S&A
Representativeness 2-6°C Temperature Blank S
Representativeness Qualitative
Documentation that approved sampling
procedures and quality control procedures
were followed. Documentation that analytical
method requirements were met.
S&A
Completeness >90% of results not rejected by data validator Calculation of percent completeness. S&A
1If information varies within an analytical group, separate by individual analyte.
2Reference number from QAPP Worksheet #21 (see Section 3.1.2).
3Reference number from QAPP Worksheet #23 (see Section 3.2). NA: SOPs are kept on file at the CLP laboratory that will perform the analysis.
EPA CLP SOM01.2
/ NA3
SOP-12, SOP-13, SOP-14,
SOP-15, SOP-16, SOP-17,
SOP-20, SOP-24, SOP-28
4SD = Sediment (Low Soil, Low Soil by SIM); CSD = CSO Sediment (Low Soil, Low Soil by SIM); SB = Subsurface Soil (Low Soil, Low Soil by SIM); GW = Groundwater (Low Water, Low
Water by SIM); CSW = CSO Surface Water (Low Water, Low Water by SIM); SW = Surface Water (Low Water, Low Water by SIM); TI = Tissue (Low Soil by SIM); AQ = Aqueous (Low
Water, Low Water by SIM)

QAPP Worksheet #12-3
(UFP-QAPP Manual Section 2.6.2)
Measurement Performance Criteria Table
Matrix4
SD, CSD, SB,
GW, CSW, SW,
TI, AQ
Analytical Group1 PEST
Concentration Level Soil, Water
Sampling Procedure2
Analytical
Method/SOP3
Data Quality
Indicators (DQIs)Measurement Performance Criteria
QC Sample and/or Activity Used to Assess
Measurement Performance
QC Sample Assesses Error for
Sampling (S), Analytical (A)
or both (S&A)
Contamination Same as Method BlankField Blanks (Equipment Rinseate Blank,
Ambient Field Blank)S
PrecisionShould meet RPD criteria of 35% for SD, CSD, SB, and TI
Should meet RPD criteria of 25% for GW, CSW, and SWField Duplicate S&A
Contamination/BiasMust meet surrogate recovery criteria of 30-150%. Surrogates
must fall within RT windows. All target compounds < CRQL.Method Blank, Sulfur Cleanup Blank A
Contamination/BiasSurrogates must fall within RT windows. All target compounds
< CRQL.Instrument Blank A
AccuracyMust meet surrogate recovery criteria of 30-150%. Surrogates
must fall within RT windows.Surrogates A
Precision/Accuracy
Must be analyzed within holding time. Surrogates must fall
within RT windows. Should meet advisory %R and RPD criteria
as specified by EPA CLP SOM01.2.
Matrix Spike/Matrix Spike Duplicate S&A
Accuracy
Must meet surrogate recovery criteria of 30-150%. Surrogates
must fall within RT windows. Must meet %R criteria as
specified by EPA CLP SOM01.2.
Laboratory Control Sample A
Representativeness 2-6°C Temperature Blank S
Representativeness Qualitative
Documentation that approved sampling
procedures and quality control procedures
were followed. Documentation that analytical
method requirements were met.
S&A
Completeness >90% of results not rejected by data validator Calculation of percent completeness. S&A
1If information varies within an analytical group, separate by individual analyte.
2Reference number from QAPP Worksheet #21 (see Section 3.1.2).
3Reference number from QAPP Worksheet #23 (see Section 3.2). NA: SOPs are kept on file at the CLP laboratory that will perform the analysis.
EPA CLP
SOM01.2 / NA3
SOP-12, SOP-13, SOP-14,
SOP-15, SOP-16, SOP-17,
SOP-20, SOP-24, SOP-28
4SD = Sediment (Soil); CSD = CSO Sediment (Soil); SB = Subsurface Soil (Soil); GW = Groundwater (Water); CSW = CSO Surface Water (Water); SW = Surface Water (Water); TI = Tissue
(Soil); AQ = Aqueous (Water)
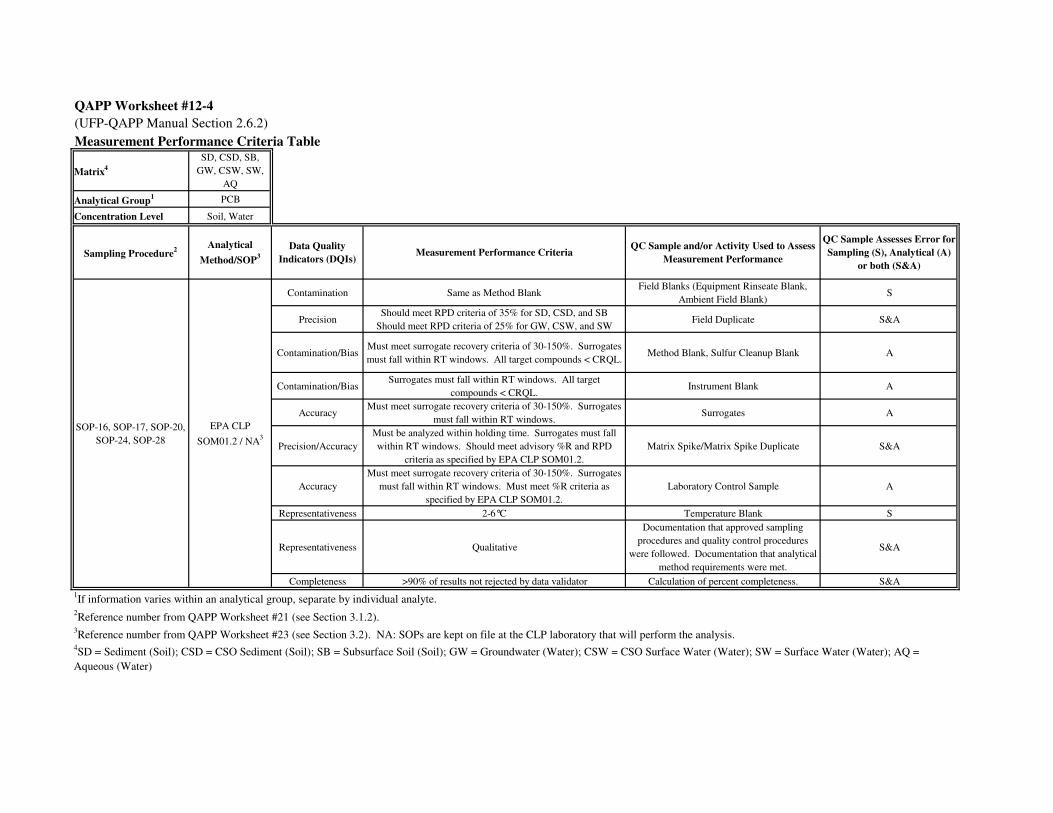
QAPP Worksheet #12-4
(UFP-QAPP Manual Section 2.6.2)
Measurement Performance Criteria Table
Matrix4
SD, CSD, SB,
GW, CSW, SW,
AQ
Analytical Group1 PCB
Concentration Level Soil, Water
Sampling Procedure2
Analytical
Method/SOP3
Data Quality
Indicators (DQIs)Measurement Performance Criteria
QC Sample and/or Activity Used to Assess
Measurement Performance
QC Sample Assesses Error for
Sampling (S), Analytical (A)
or both (S&A)
Contamination Same as Method BlankField Blanks (Equipment Rinseate Blank,
Ambient Field Blank)S
PrecisionShould meet RPD criteria of 35% for SD, CSD, and SB
Should meet RPD criteria of 25% for GW, CSW, and SWField Duplicate S&A
Contamination/BiasMust meet surrogate recovery criteria of 30-150%. Surrogates
must fall within RT windows. All target compounds < CRQL.Method Blank, Sulfur Cleanup Blank A
Contamination/BiasSurrogates must fall within RT windows. All target
compounds < CRQL.Instrument Blank A
AccuracyMust meet surrogate recovery criteria of 30-150%. Surrogates
must fall within RT windows.Surrogates A
Precision/Accuracy
Must be analyzed within holding time. Surrogates must fall
within RT windows. Should meet advisory %R and RPD
criteria as specified by EPA CLP SOM01.2.
Matrix Spike/Matrix Spike Duplicate S&A
Accuracy
Must meet surrogate recovery criteria of 30-150%. Surrogates
must fall within RT windows. Must meet %R criteria as
specified by EPA CLP SOM01.2.
Laboratory Control Sample A
Representativeness 2-6°C Temperature Blank S
Representativeness Qualitative
Documentation that approved sampling
procedures and quality control procedures
were followed. Documentation that analytical
method requirements were met.
S&A
Completeness >90% of results not rejected by data validator Calculation of percent completeness. S&A
1If information varies within an analytical group, separate by individual analyte.
2Reference number from QAPP Worksheet #21 (see Section 3.1.2).
3Reference number from QAPP Worksheet #23 (see Section 3.2). NA: SOPs are kept on file at the CLP laboratory that will perform the analysis.
EPA CLP
SOM01.2 / NA3
SOP-16, SOP-17, SOP-20,
SOP-24, SOP-28
4SD = Sediment (Soil); CSD = CSO Sediment (Soil); SB = Subsurface Soil (Soil); GW = Groundwater (Water); CSW = CSO Surface Water (Water); SW = Surface Water (Water); AQ =
Aqueous (Water)
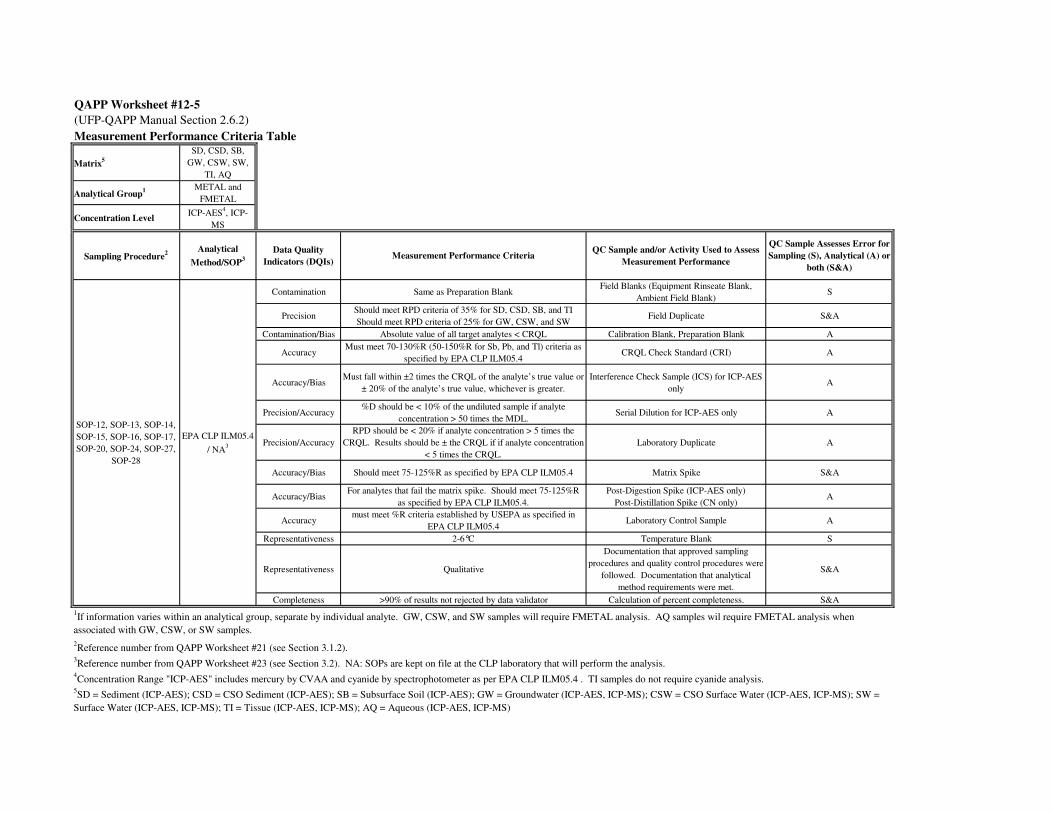
QAPP Worksheet #12-5
(UFP-QAPP Manual Section 2.6.2)
Measurement Performance Criteria Table
Matrix5
SD, CSD, SB,
GW, CSW, SW,
TI, AQ
Analytical Group1 METAL and
FMETAL
Concentration LevelICP-AES
4, ICP-
MS
Sampling Procedure2
Analytical
Method/SOP3
Data Quality
Indicators (DQIs)Measurement Performance Criteria
QC Sample and/or Activity Used to Assess
Measurement Performance
QC Sample Assesses Error for
Sampling (S), Analytical (A) or
both (S&A)
Contamination Same as Preparation BlankField Blanks (Equipment Rinseate Blank,
Ambient Field Blank)S
PrecisionShould meet RPD criteria of 35% for SD, CSD, SB, and TI
Should meet RPD criteria of 25% for GW, CSW, and SWField Duplicate S&A
Contamination/Bias Absolute value of all target analytes < CRQL Calibration Blank, Preparation Blank A
AccuracyMust meet 70-130%R (50-150%R for Sb, Pb, and Tl) criteria as
specified by EPA CLP ILM05.4CRQL Check Standard (CRI) A
Accuracy/BiasMust fall within ±2 times the CRQL of the analyte’s true value or
± 20% of the analyte’s true value, whichever is greater.
Interference Check Sample (ICS) for ICP-AES
onlyA
Precision/Accuracy%D should be < 10% of the undiluted sample if analyte
concentration > 50 times the MDL.Serial Dilution for ICP-AES only A
Precision/Accuracy
RPD should be < 20% if analyte concentration > 5 times the
CRQL. Results should be ± the CRQL if if analyte concentration
< 5 times the CRQL.
Laboratory Duplicate A
Accuracy/Bias Should meet 75-125%R as specified by EPA CLP ILM05.4 Matrix Spike S&A
Accuracy/BiasFor analytes that fail the matrix spike. Should meet 75-125%R
as specified by EPA CLP ILM05.4.
Post-Digestion Spike (ICP-AES only)
Post-Distillation Spike (CN only)A
Accuracymust meet %R criteria established by USEPA as specified in
EPA CLP ILM05.4Laboratory Control Sample A
Representativeness 2-6°C Temperature Blank S
Representativeness Qualitative
Documentation that approved sampling
procedures and quality control procedures were
followed. Documentation that analytical
method requirements were met.
S&A
Completeness >90% of results not rejected by data validator Calculation of percent completeness. S&A
2Reference number from QAPP Worksheet #21 (see Section 3.1.2).
3Reference number from QAPP Worksheet #23 (see Section 3.2). NA: SOPs are kept on file at the CLP laboratory that will perform the analysis.
4Concentration Range "ICP-AES" includes mercury by CVAA and cyanide by spectrophotometer as per EPA CLP ILM05.4 . TI samples do not require cyanide analysis.
EPA CLP ILM05.4
/ NA3
SOP-12, SOP-13, SOP-14,
SOP-15, SOP-16, SOP-17,
SOP-20, SOP-24, SOP-27,
SOP-28
5SD = Sediment (ICP-AES); CSD = CSO Sediment (ICP-AES); SB = Subsurface Soil (ICP-AES); GW = Groundwater (ICP-AES, ICP-MS); CSW = CSO Surface Water (ICP-AES, ICP-MS); SW =
Surface Water (ICP-AES, ICP-MS); TI = Tissue (ICP-AES, ICP-MS); AQ = Aqueous (ICP-AES, ICP-MS)
1If information varies within an analytical group, separate by individual analyte. GW, CSW, and SW samples will require FMETAL analysis. AQ samples wil require FMETAL analysis when
associated with GW, CSW, or SW samples.
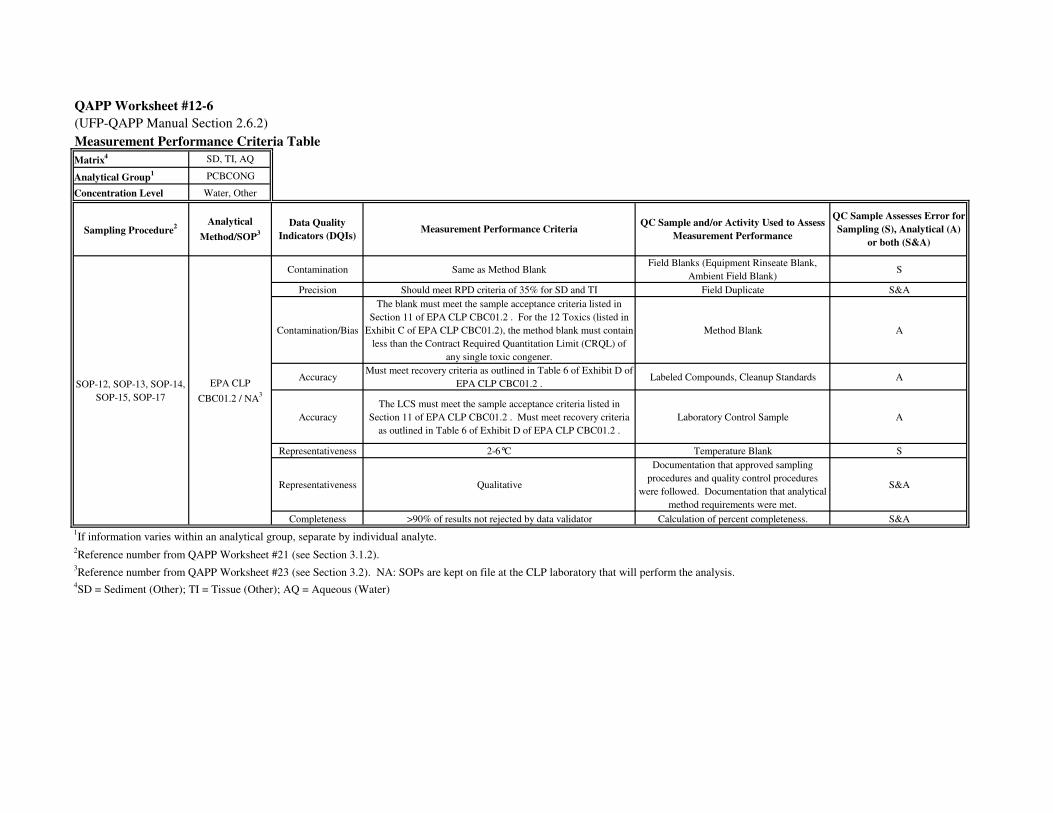
QAPP Worksheet #12-6
(UFP-QAPP Manual Section 2.6.2)
Measurement Performance Criteria Table
Matrix4 SD, TI, AQ
Analytical Group1 PCBCONG
Concentration Level Water, Other
Sampling Procedure2
Analytical
Method/SOP3
Data Quality
Indicators (DQIs)Measurement Performance Criteria
QC Sample and/or Activity Used to Assess
Measurement Performance
QC Sample Assesses Error for
Sampling (S), Analytical (A)
or both (S&A)
Contamination Same as Method BlankField Blanks (Equipment Rinseate Blank,
Ambient Field Blank)S
Precision Should meet RPD criteria of 35% for SD and TI Field Duplicate S&A
Contamination/Bias
The blank must meet the sample acceptance criteria listed in
Section 11 of EPA CLP CBC01.2 . For the 12 Toxics (listed in
Exhibit C of EPA CLP CBC01.2), the method blank must contain
less than the Contract Required Quantitation Limit (CRQL) of
any single toxic congener.
Method Blank A
AccuracyMust meet recovery criteria as outlined in Table 6 of Exhibit D of
EPA CLP CBC01.2 .Labeled Compounds, Cleanup Standards A
Accuracy
The LCS must meet the sample acceptance criteria listed in
Section 11 of EPA CLP CBC01.2 . Must meet recovery criteria
as outlined in Table 6 of Exhibit D of EPA CLP CBC01.2 .
Laboratory Control Sample A
Representativeness 2-6°C Temperature Blank S
Representativeness Qualitative
Documentation that approved sampling
procedures and quality control procedures
were followed. Documentation that analytical
method requirements were met.
S&A
Completeness >90% of results not rejected by data validator Calculation of percent completeness. S&A
1If information varies within an analytical group, separate by individual analyte.
2Reference number from QAPP Worksheet #21 (see Section 3.1.2).
3Reference number from QAPP Worksheet #23 (see Section 3.2). NA: SOPs are kept on file at the CLP laboratory that will perform the analysis.
SOP-12, SOP-13, SOP-14,
SOP-15, SOP-17
EPA CLP
CBC01.2 / NA3
4SD = Sediment (Other); TI = Tissue (Other); AQ = Aqueous (Water)

QAPP Worksheet #12-7
(UFP-QAPP Manual Section 2.6.2)
Measurement Performance Criteria Table
Matrix5 SD
Analytical Group1 WCHEM
Concentration Level Low
Sampling Procedure2
Analytical
Method/SOP3
Data Quality
Indicators (DQIs)Measurement Performance Criteria
QC Sample and/or Activity Used to Assess
Measurement Performance
QC Sample Assesses Error for
Sampling (S), Analytical (A)
or both (S&A)
Contamination/Bias TOC < QL Method Blank A
Accuracy Should meet 75-125 %R Matrix Spike4 S&A
Accuracy Must meet 75-125 %R Laboratory Control Sample A
Precision Should meet < 20% RPD. Laboratory Replicate A
Representativeness 2-6°C Temperature Blank S
Representativeness Qualitative
Documentation that approved sampling
procedures and quality control procedures
were followed. Documentation that analytical
method requirements were met.
S&A
Completeness>90% of results not rejected during internal data
validationCalculation of percent completeness. S&A
1If information varies within an analytical group, separate by individual analyte.
2Reference number from QAPP Worksheet #21 (see Section 3.1.2).
3Reference number from QAPP Worksheet #23 (see Section 3.2).
4MS will not be submitted for TOC. MPC are provided in the event that the laboratory provides an MS.
SOP-17Lloyd Kahn / LAB-
01
5SD = Sediment (Total Organic Carbon)

QAPP Worksheet #12-8
(UFP-QAPP Manual Section 2.6.2)
Measurement Performance Criteria Table
Matrix5 SD
Analytical Group1 GRAINSIZE
Concentration Level N/A
Sampling Procedure2
Analytical
Method/SOP3
Data Quality
Indicators (DQIs)Measurement Performance Criteria
QC Sample and/or Activity Used to Assess
Measurement Performance
QC Sample Assesses Error for
Sampling (S), Analytical (A)
or both (S&A)
Representativeness 2-6°C Temperature Blank4 S
Representativeness Qualitative
Documentation that approved sampling
procedures and quality control procedures
were followed. Documentation that analytical
method requirements were met.
S&A
Completeness>90% of results not rejected during internal data
validationCalculation of percent completeness. S&A
1If information varies within an analytical group, separate by individual analyte.
2Reference number from QAPP Worksheet #21 (see Section 3.1.2).
3Reference number from QAPP Worksheet #23 (see Section 3.2).
4Cooling is not necessary for GRAINSIZE but samples may be cooled to 4°C.
ASTM D4464 /
LAB-02SOP-17
5SD = Sediment (Grain Size)
QAPP Worksheet #12-9
(UFP-QAPP Manual Section 2.6.2)
Measurement Performance Criteria Table
Matrix5 SD
Analytical Group1 AVSSEM
Concentration Level Medium
Sampling Procedure2
Analytical
Method/SOP3
Data Quality
Indicators (DQIs)Measurement Performance Criteria
QC Sample and/or Activity Used to Assess
Measurement Performance
QC Sample Assesses Error for
Sampling (S), Analytical (A) or
both (S&A)
Contamination/Bias Target analytes < QL Method Blank A
Precision/Accuracy Should meet ≤ 20% RPD. Laboratory Duplicate A
Accuracy/Bias Should meet 85-115 %R Matrix Spike4 S&A
Accuracy Must meet 85-115 %R Laboratory Control Sample A
Representativeness 2-6°C Temperature Blank S
Representativeness Qualitative
Documentation that approved sampling
procedures and quality control procedures
were followed. Documentation that analytical
method requirements were met.
S&A
Completeness >90% of results not rejected during internal data validation Calculation of percent completeness. S&A
2Reference number from QAPP Worksheet #21 (see Section 3.1.2).
3Reference number from QAPP Worksheet #23 (see Section 3.2). NA: SOPs are kept on file at the CLP laboratory that will perform the analysis.
4MS will not be submitted for AVSSEM. MPC are provided in the event that the laboratory provides an MS.
SOP-17EPA 821_R-91-
100 / LAB-03
1If information varies within an analytical group, separate by individual analyte.
5SD = Sediment (AVS/SEM)
QAPP Worksheet #12-10
(UFP-QAPP Manual Section 2.6.2)
Measurement Performance Criteria Table
Matrix5 GW, CSW, SW
Analytical Group1 WCHEM
Concentration Level Medium
Sampling Procedure2
Analytical
Method/SOP3
Data Quality
Indicators (DQIs)Measurement Performance Criteria
QC Sample and/or Activity Used to Assess
Measurement Performance
QC Sample Assesses Error for
Sampling (S), Analytical (A) or
both (S&A)
Contamination/Bias TSS < QL Method Blank A
Accuracy Must meet %R limits as specified by manufacturer. Laboratory Control Sample A
Precision Must meet < 5% RPD if results are > 5X QL. Laboratory Replicate A
Contamination/Bias Alkalinity < QL Method Blank A
Accuracy Must meet 85-115 %R Laboratory Control Sample A
Precision Must meet < 20% RPD if results are > 5X QL. Laboratory Replicate A
Contamination/Bias
Targets < MDL. If any targets are detected in the
method blank, any related sample detects must be >
10X the concentration in the blank.
Method Blank A
Accuracy Must meet 90-110 %R Laboratory Control Sample A
Precision Should meet < 20% RPD. Laboratory Replicate A
Accuracy Should meet 90-110% R Matrix Spike4 S&A
SM2340B / LAB-
09Various
All analytical QC requirements must be met for SW-
846 6010B as per LAB-04.Various S&A
Contamination/Bias TKN < QL Method Blank A
Accuracy Must meet 85-115 %R Laboratory Control Sample A
Precision Should meet < 20% RPD. Laboratory Replicate A
Precision/Accuracy Should meet 80-120%R and < 20% RPD Matrix Spike and Matrix Spike Duplicate4 S&A
Contamination/Bias TOC or DOC < QL Method Blank A
Accuracy Must meet 85-115 %R Laboratory Control Sample A
Precision Should meet < 20% RPD. Laboratory Replicate A
Accuracy Should meet 85-115%R Matrix Spike4 S&A
Contamination/Bias TDS < QL Method Blank A
Accuracy Must meet %R limits as specified by manufacturer. Laboratory Control Sample A
Precision Must meet < 5% RPD if results are > 5X QL. Laboratory Replicate A
Contamination/Bias Ammonia < QL Method Blank A
Accuracy Must meet 85-115 %R Laboratory Control Sample A
Precision Should meet < 20% RPD. Laboratory Replicate A
Precision/Accuracy Should meet 85-115%R and < 20% RPD Matrix Spike and Matrix Spike Duplicate4 S&A
Contamination/Bias Silicon < QL Method Blank A
Precision/Accuracy 5X dilution within ±10% of sample result Serial Dilution A
Precision RPD should be < 20% Laboratory Replicate A
Precision/Accuracy Should meet 80-120%R and < 20% RPD Matrix Spike and Matrix Spike Duplicate4 S&A
Accuracy Must meet 80-120%R Laboratory Control Sample A
Representativeness 2-6°C Temperature Blank S
Representativeness Qualitative
Documentation that approved sampling
procedures and quality control procedures
were followed. Documentation that analytical
method requirements were met.
S&A
Completeness>90% of results not rejected during internal data
validationCalculation of percent completeness. S&A
1If information varies within an analytical group, separate by individual analyte.
2Reference number from QAPP Worksheet #21 (see Section 3.1.2).
3Reference number from QAPP Worksheet #23 (see Section 3.2).
4MS will not be submitted for WCHEM. MPC are provided in the event that the laboratory provides an MS.
All methods listed
above
5GW = Groundwater (TSS, Alkalinity, Cl, NO3, SO4, PO4, Hardness, TKN, TOC, DOC, TDS, Ammonia, Silica); CSW = CSO Surface Water (TSS); SW = Surface Water (TSS)
SM2540D / LAB-
06
SM2320B / LAB-
07
EPA 300.0 / LAB-
08
SM4500-Norg C /
LAB-10
SW-846 9060 /
LAB-11
SM2540C / LAB-
12
SM4500-NH3 B +
C / LAB-13
SW-846 6010B /
LAB-04
SOP-16, SOP-24, SOP-28

QAPP Worksheet #12-11
(UFP-QAPP Manual Section 2.6.2)
Measurement Performance Criteria Table
Matrix4 TI
Analytical Group1 WCHEM
Concentration Level Low
Sampling Procedure2
Analytical
Method/SOP3
Data Quality
Indicators (DQIs)Measurement Performance Criteria
QC Sample and/or Activity Used to Assess
Measurement Performance
QC Sample Assesses Error for
Sampling (S), Analytical (A)
or both (S&A)
Contamination/Bias % Lipids <0.1% in Method blank Method Blank A
Precision Should meet < 25% RPD. Laboratory Replicate A
Representativeness 2-6°C Temperature Blank S
Representativeness Qualitative
Documentation that approved sampling
procedures and quality control procedures
were followed. Documentation that analytical
method requirements were met.
S&A
Completeness>90% of results not rejected during internal data
validationCalculation of percent completeness. S&A
1If information varies within an analytical group, separate by individual analyte.
2Reference number from QAPP Worksheet #21 (see Section 3.1.2).
3Reference number from QAPP Worksheet #23 (see Section 3.2).
SOP-12, SOP-13, SOP-14,
SOP-15
BR-EX-016 / LAB-
14
4TI = Tissue (% Lipids)
QAPP Worksheet #12-12
(UFP-QAPP Manual Section 2.6.2)
Measurement Performance Criteria Table
Matrix4 AR
Analytical Group1 VOA
Concentration Level Medium, Low-Level
Sampling Procedure2
Analytical
Method/SOP3
Data Quality
Indicators (DQIs)Measurement Performance Criteria
QC Sample and/or Activity Used to Assess
Measurement Performance
QC Sample Assesses Error for
Sampling (S), Analytical (A)
or both (S&A)
Contamination Same as Method Blank Field Blanks (Ambient Field Blank) S
Precision Should meet RPD criteria of 35% for AR Field Duplicate S&A
Contamination/Bias No target analytes detected > QL Method Blank A
Accuracy±40% area response from last acceptable calibration. RT
±0.33 min (20 seconds) from last acceptable calibration.Internal Standards A
Precision ≤25%RPD Laboratory Replicate A
Accuracy 70-130%R Laboratory Control Sample (LCS) A
Precision/Accuracy 70-130%R and ≤25%RPD Laboratory Control Sample Duplicate (LCSD) A
Contamination Same as Method Blank Field Blanks (Ambient Field Blank) S
Precision Should meet RPD criteria of 35% for AR Field Duplicate S&A
Contamination/Bias No target analytes detected > QL Method Blank A
Accuracy±40% area response from last acceptable calibration. RT
±0.33 min (20 seconds) from last acceptable calibration.Internal Standards A
Precision ≤25%RPD Laboratory Replicate A
Accuracy 70-130%R Laboratory Control Sample (LCS) A
Representativeness 2-6°C Temperature Blank S
Representativeness Qualitative
Documentation that approved sampling
procedures and quality control procedures were
followed. Documentation that analytical method
requirements were met.
S&A
Completeness >90% of results not rejected by data validator Calculation of percent completeness. S&A
1If information varies within an analytical group, separate by individual analyte.
2Reference number from QAPP Worksheet #21 (see Section 3.1.2).
3Reference number from QAPP Worksheet #23 (see Section 3.2).
4AR = Air (TO-15 VOA (medium and Low-Level))
SOP-11a
All methods listed
above
TO-15 / LAB-15
TO-15 / LAB-16
QAPP Worksheet #12-13
(UFP-QAPP Manual Section 2.6.2)
Measurement Performance Criteria Table
Matrix4 AR
Analytical Group1 SVOA
Concentration Level SIM
Sampling Procedure2
Analytical
Method/SOP3
Data Quality
Indicators (DQIs)Measurement Performance Criteria
QC Sample and/or Activity Used to Assess
Measurement Performance
QC Sample Assesses Error for
Sampling (S), Analytical (A)
or both (S&A)
Contamination Same as Method Blank Field Blanks (Ambient Field Blank) S
Precision Should meet RPD criteria of 35% for AR Field Duplicate S&A
Contamination/BiasAll target compounds < QL except naphthalene (common
laboratory contaminant for air matrices)Method Blank A
Accuracy
25-150%R for the following deuterated monitoring compounds:
Naphthalene-d8; Acenaphthene-d10; Phenanthrene-d10;
Chrysene-d12; Fluorene-d10; Acenaphthylene-d8;
Benzo(a)anthracene-d12; Benzo(a)pyrene-d12;
Benzo(b)fluoranthene-d12; Benzo(g,h,i)perylene-d12;
Benzo(k)fluoranthene-d12; Dibenzo(a,h)anthracene-d14;
Fluoranthene-d10; Indeno(1,2,3-cd)pyrene-d12; and Pyrene-
d10
Deuterated Monitoring Compounds A
Precision Same as LCSD except %RPD control limits do not apply. Laboratory Control Sample (LCS) S&A
Precision/Accuracy
Acenaphthene: 70-138%R, <15%RPD
Acenaphthylene: 71-132%R, <16%RPD
Anthracene: 97-136%R, <15%RPD
Benzo(a)anthracene: 49-150%R, <15%RPD
Benzo(b)fluoranthene: 44-148%R, <15%RPD
Benzo(k)fluoranthene: 66-142%R, <23%RPD
Benzo(g,h,i)perylene: 54-144%R, <16%RPD
Benzo(a)pyrene: 52-148%R, <15%RPD
Chrysene: 53-142%R, <15%RPD
Dibenzo(a,h)anthracene: 49-125%R, <18%RPD
Fluoranthene: 59-135%R, <15%RPD
Fluorene: 68-129%R, <15%RPD
Indeno(1,2,3-cd)pyrene: 69-140%R, <20%RPD
Naphthalene: 60-161%R, <42%RPD
Phenanthrene: 68-137%R, <15%RPD
Pyrene: 64-136%R, <15%RPD
Laboratory Control Sample Duplicate (LCSD) S&A
Representativeness 2-6°C Temperature Blank S
Representativeness Qualitative
Documentation that approved sampling
procedures and quality control procedures were
followed. Documentation that analytical method
requirements were met.
S&A
Completeness >90% of results not rejected by data validator Calculation of percent completeness. S&A
1If information varies within an analytical group, separate by individual analyte.
2Reference number from QAPP Worksheet #21 (see Section 3.1.2).
3Reference number from QAPP Worksheet #23 (see Section 3.2).
SOP-11bTO-13A_SIM / LAB-
17, LAB-18
4AR = Air (SIM PAHs)
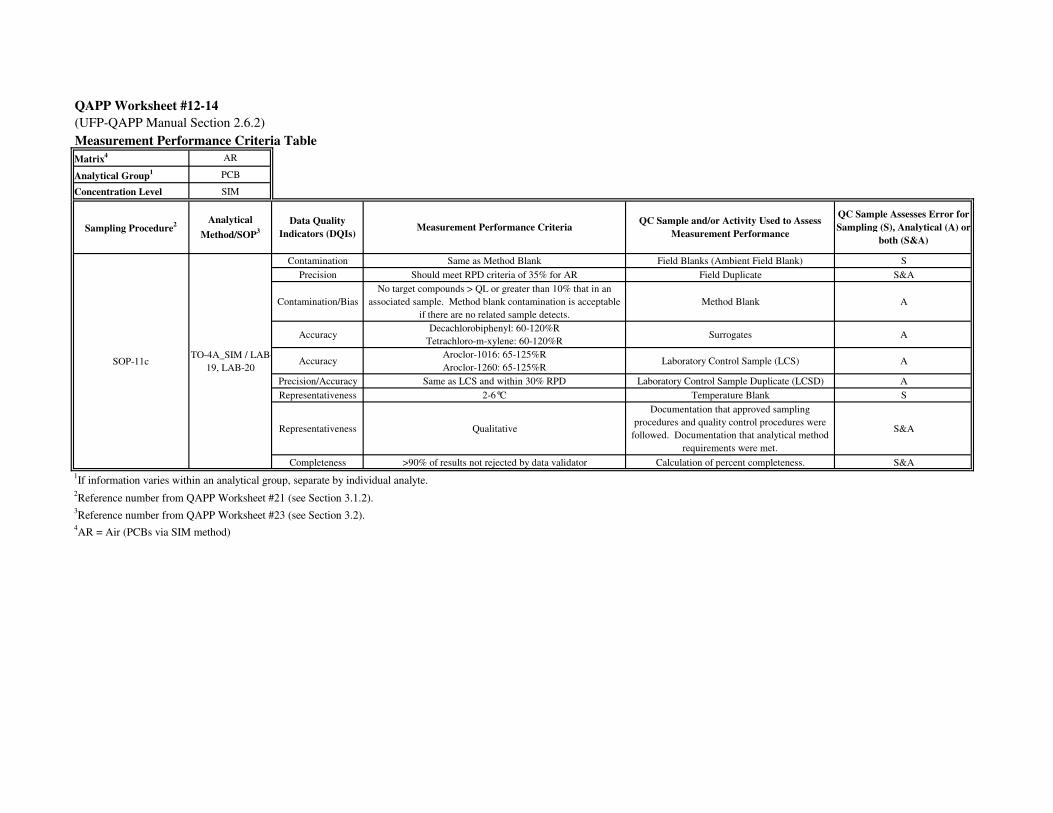
QAPP Worksheet #12-14
(UFP-QAPP Manual Section 2.6.2)
Measurement Performance Criteria Table
Matrix4 AR
Analytical Group1 PCB
Concentration Level SIM
Sampling Procedure2
Analytical
Method/SOP3
Data Quality
Indicators (DQIs)Measurement Performance Criteria
QC Sample and/or Activity Used to Assess
Measurement Performance
QC Sample Assesses Error for
Sampling (S), Analytical (A) or
both (S&A)
Contamination Same as Method Blank Field Blanks (Ambient Field Blank) S
Precision Should meet RPD criteria of 35% for AR Field Duplicate S&A
Contamination/Bias
No target compounds > QL or greater than 10% that in an
associated sample. Method blank contamination is acceptable
if there are no related sample detects.
Method Blank A
AccuracyDecachlorobiphenyl: 60-120%R
Tetrachloro-m-xylene: 60-120%RSurrogates A
AccuracyAroclor-1016: 65-125%R
Aroclor-1260: 65-125%RLaboratory Control Sample (LCS) A
Precision/Accuracy Same as LCS and within 30% RPD Laboratory Control Sample Duplicate (LCSD) A
Representativeness 2-6°C Temperature Blank S
Representativeness Qualitative
Documentation that approved sampling
procedures and quality control procedures were
followed. Documentation that analytical method
requirements were met.
S&A
Completeness >90% of results not rejected by data validator Calculation of percent completeness. S&A
1If information varies within an analytical group, separate by individual analyte.
2Reference number from QAPP Worksheet #21 (see Section 3.1.2).
3Reference number from QAPP Worksheet #23 (see Section 3.2).
SOP-11cTO-4A_SIM / LAB-
19, LAB-20
4AR = Air (PCBs via SIM method)
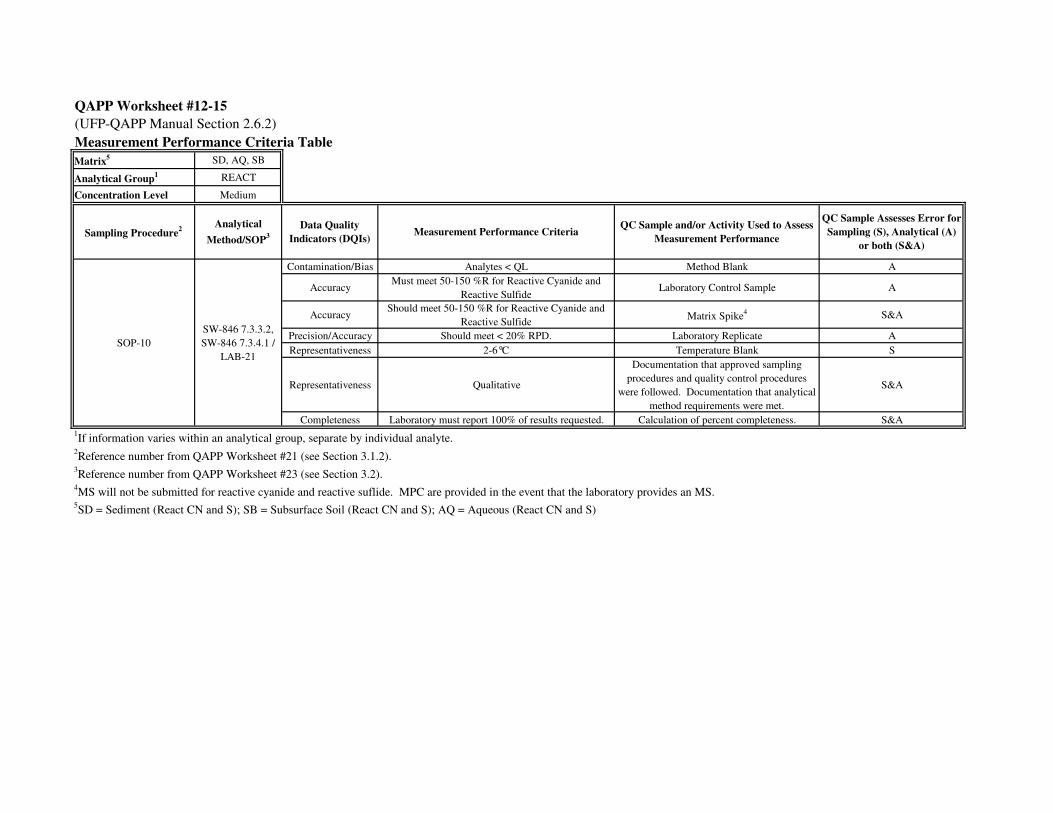
QAPP Worksheet #12-15
(UFP-QAPP Manual Section 2.6.2)
Measurement Performance Criteria Table
Matrix5 SD, AQ, SB
Analytical Group1 REACT
Concentration Level Medium
Sampling Procedure2
Analytical
Method/SOP3
Data Quality
Indicators (DQIs)Measurement Performance Criteria
QC Sample and/or Activity Used to Assess
Measurement Performance
QC Sample Assesses Error for
Sampling (S), Analytical (A)
or both (S&A)
Contamination/Bias Analytes < QL Method Blank A
AccuracyMust meet 50-150 %R for Reactive Cyanide and
Reactive SulfideLaboratory Control Sample A
AccuracyShould meet 50-150 %R for Reactive Cyanide and
Reactive SulfideMatrix Spike
4 S&A
Precision/Accuracy Should meet < 20% RPD. Laboratory Replicate A
Representativeness 2-6°C Temperature Blank S
Representativeness Qualitative
Documentation that approved sampling
procedures and quality control procedures
were followed. Documentation that analytical
method requirements were met.
S&A
Completeness Laboratory must report 100% of results requested. Calculation of percent completeness. S&A
1If information varies within an analytical group, separate by individual analyte.
2Reference number from QAPP Worksheet #21 (see Section 3.1.2).
3Reference number from QAPP Worksheet #23 (see Section 3.2).
4MS will not be submitted for reactive cyanide and reactive suflide. MPC are provided in the event that the laboratory provides an MS.
SW-846 7.3.3.2,
SW-846 7.3.4.1 /
LAB-21
SOP-10
5SD = Sediment (React CN and S); SB = Subsurface Soil (React CN and S); AQ = Aqueous (React CN and S)
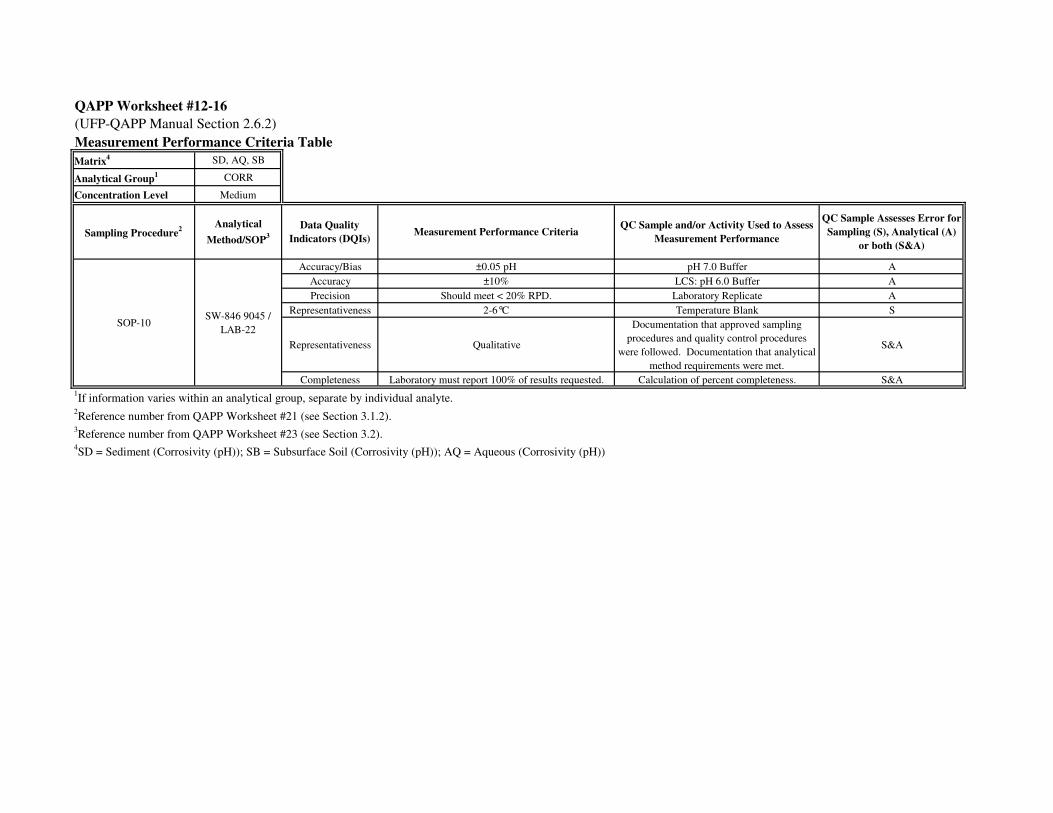
QAPP Worksheet #12-16
(UFP-QAPP Manual Section 2.6.2)
Measurement Performance Criteria Table
Matrix4 SD, AQ, SB
Analytical Group1 CORR
Concentration Level Medium
Sampling Procedure2
Analytical
Method/SOP3
Data Quality
Indicators (DQIs)Measurement Performance Criteria
QC Sample and/or Activity Used to Assess
Measurement Performance
QC Sample Assesses Error for
Sampling (S), Analytical (A)
or both (S&A)
Accuracy/Bias ±0.05 pH pH 7.0 Buffer A
Accuracy ±10% LCS: pH 6.0 Buffer A
Precision Should meet < 20% RPD. Laboratory Replicate A
Representativeness 2-6°C Temperature Blank S
Representativeness Qualitative
Documentation that approved sampling
procedures and quality control procedures
were followed. Documentation that analytical
method requirements were met.
S&A
Completeness Laboratory must report 100% of results requested. Calculation of percent completeness. S&A
1If information varies within an analytical group, separate by individual analyte.
2Reference number from QAPP Worksheet #21 (see Section 3.1.2).
3Reference number from QAPP Worksheet #23 (see Section 3.2).
SW-846 9045 /
LAB-22SOP-10
4SD = Sediment (Corrosivity (pH)); SB = Subsurface Soil (Corrosivity (pH)); AQ = Aqueous (Corrosivity (pH))

QAPP Worksheet #12-17
(UFP-QAPP Manual Section 2.6.2)
Measurement Performance Criteria Table
Matrix4 SD, AQ, SB
Analytical Group1 IGN
Concentration Level Medium
Sampling Procedure2
Analytical
Method/SOP3
Data Quality
Indicators (DQIs)Measurement Performance Criteria
QC Sample and/or Activity Used to Assess
Measurement Performance
QC Sample Assesses Error for
Sampling (S), Analytical (A)
or both (S&A)
Accuracy/Bias,
Contamination> 200°F Method Blank A
Precision RPD ≤ 20% Laboratory Replicate A
Accuracy 81 + 5°F Laboratory Control Sample (p-Xylene) A
Representativeness 2-6°C Temperature Blank S
Representativeness Qualitative
Documentation that approved sampling
procedures and quality control procedures
were followed. Documentation that analytical
method requirements were met.
S&A
Completeness Laboratory must report 100% of results requested. Calculation of percent completeness. S&A
1If information varies within an analytical group, separate by individual analyte.
2Reference number from QAPP Worksheet #21 (see Section 3.1.2).
3Reference number from QAPP Worksheet #23 (see Section 3.2).
Pensky Martens /
LAB-23, LAB-24SOP-10
4SD = Sediment (Ignitability); SB = Subsurface Soil (Ignitability); AQ = Aqueous (Ignitability)
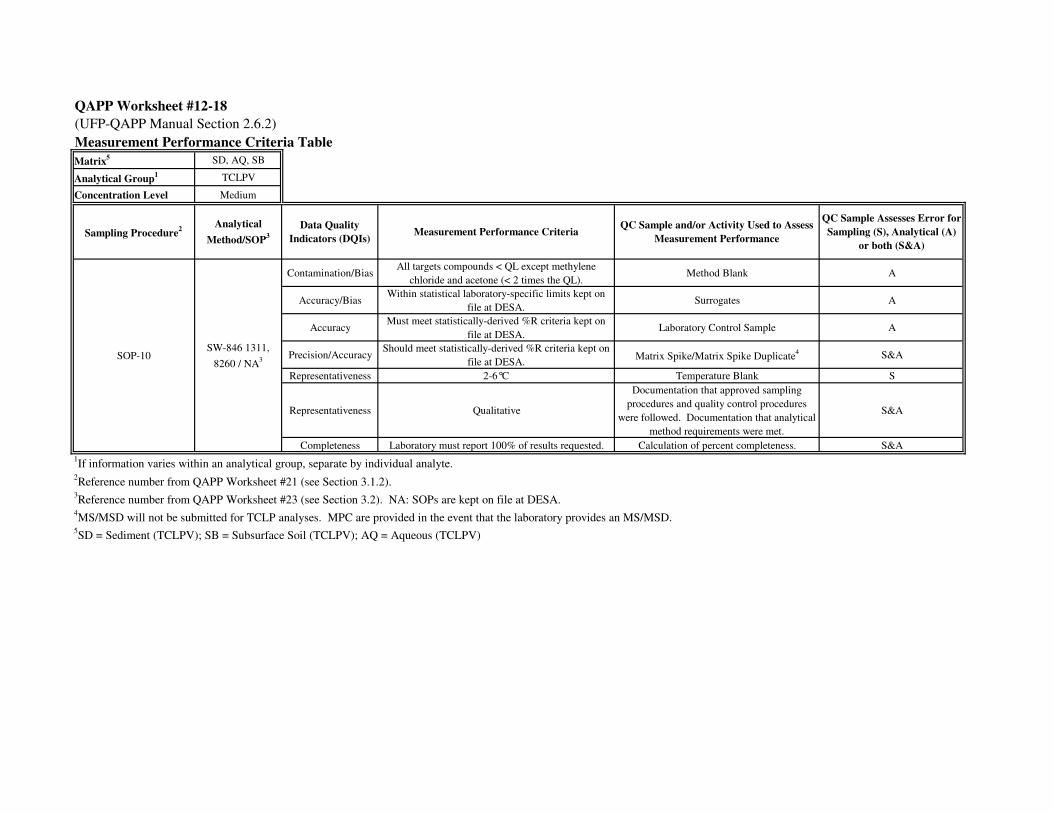
QAPP Worksheet #12-18
(UFP-QAPP Manual Section 2.6.2)
Measurement Performance Criteria Table
Matrix5 SD, AQ, SB
Analytical Group1 TCLPV
Concentration Level Medium
Sampling Procedure2
Analytical
Method/SOP3
Data Quality
Indicators (DQIs)Measurement Performance Criteria
QC Sample and/or Activity Used to Assess
Measurement Performance
QC Sample Assesses Error for
Sampling (S), Analytical (A)
or both (S&A)
Contamination/BiasAll targets compounds < QL except methylene
chloride and acetone (< 2 times the QL).Method Blank A
Accuracy/BiasWithin statistical laboratory-specific limits kept on
file at DESA.Surrogates A
AccuracyMust meet statistically-derived %R criteria kept on
file at DESA.Laboratory Control Sample A
Precision/AccuracyShould meet statistically-derived %R criteria kept on
file at DESA.Matrix Spike/Matrix Spike Duplicate
4 S&A
Representativeness 2-6°C Temperature Blank S
Representativeness Qualitative
Documentation that approved sampling
procedures and quality control procedures
were followed. Documentation that analytical
method requirements were met.
S&A
Completeness Laboratory must report 100% of results requested. Calculation of percent completeness. S&A
1If information varies within an analytical group, separate by individual analyte.
2Reference number from QAPP Worksheet #21 (see Section 3.1.2).
3Reference number from QAPP Worksheet #23 (see Section 3.2). NA: SOPs are kept on file at DESA.
4MS/MSD will not be submitted for TCLP analyses. MPC are provided in the event that the laboratory provides an MS/MSD.
SW-846 1311,
8260 / NA3SOP-10
5SD = Sediment (TCLPV); SB = Subsurface Soil (TCLPV); AQ = Aqueous (TCLPV)
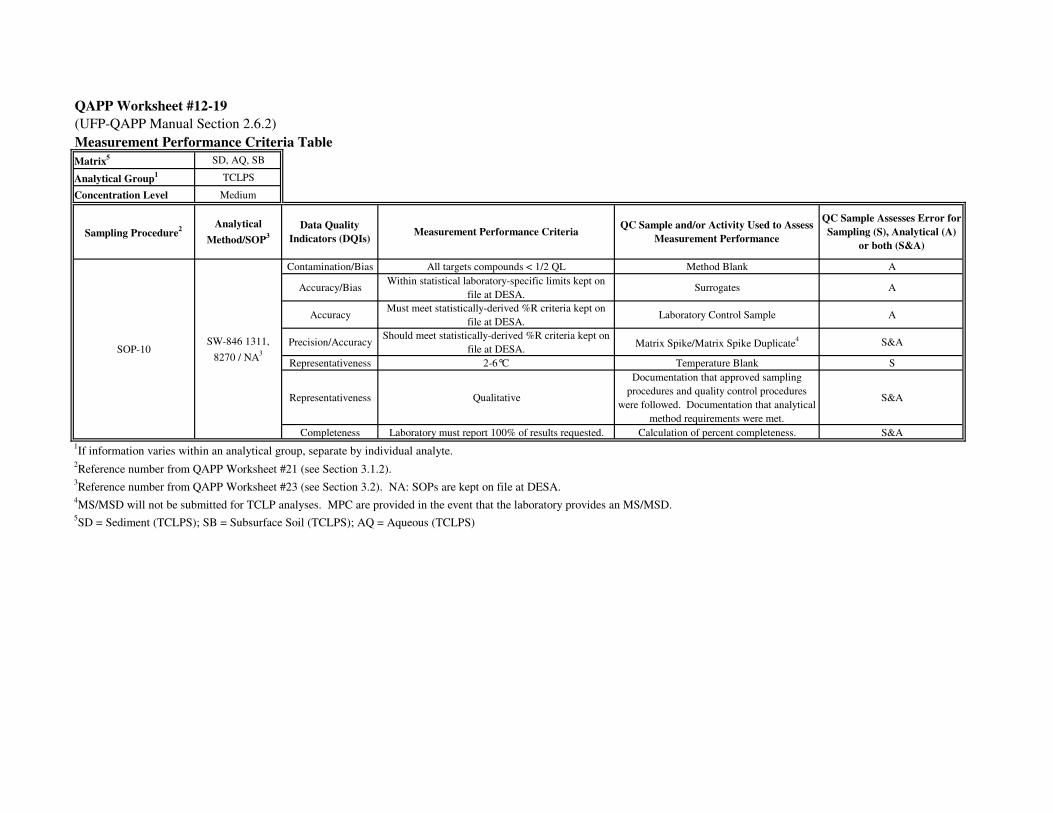
QAPP Worksheet #12-19
(UFP-QAPP Manual Section 2.6.2)
Measurement Performance Criteria Table
Matrix5 SD, AQ, SB
Analytical Group1 TCLPS
Concentration Level Medium
Sampling Procedure2
Analytical
Method/SOP3
Data Quality
Indicators (DQIs)Measurement Performance Criteria
QC Sample and/or Activity Used to Assess
Measurement Performance
QC Sample Assesses Error for
Sampling (S), Analytical (A)
or both (S&A)
Contamination/Bias All targets compounds < 1/2 QL Method Blank A
Accuracy/BiasWithin statistical laboratory-specific limits kept on
file at DESA.Surrogates A
AccuracyMust meet statistically-derived %R criteria kept on
file at DESA.Laboratory Control Sample A
Precision/AccuracyShould meet statistically-derived %R criteria kept on
file at DESA.Matrix Spike/Matrix Spike Duplicate
4 S&A
Representativeness 2-6°C Temperature Blank S
Representativeness Qualitative
Documentation that approved sampling
procedures and quality control procedures
were followed. Documentation that analytical
method requirements were met.
S&A
Completeness Laboratory must report 100% of results requested. Calculation of percent completeness. S&A
1If information varies within an analytical group, separate by individual analyte.
2Reference number from QAPP Worksheet #21 (see Section 3.1.2).
3Reference number from QAPP Worksheet #23 (see Section 3.2). NA: SOPs are kept on file at DESA.
4MS/MSD will not be submitted for TCLP analyses. MPC are provided in the event that the laboratory provides an MS/MSD.
SW-846 1311,
8270 / NA3SOP-10
5SD = Sediment (TCLPS); SB = Subsurface Soil (TCLPS); AQ = Aqueous (TCLPS)
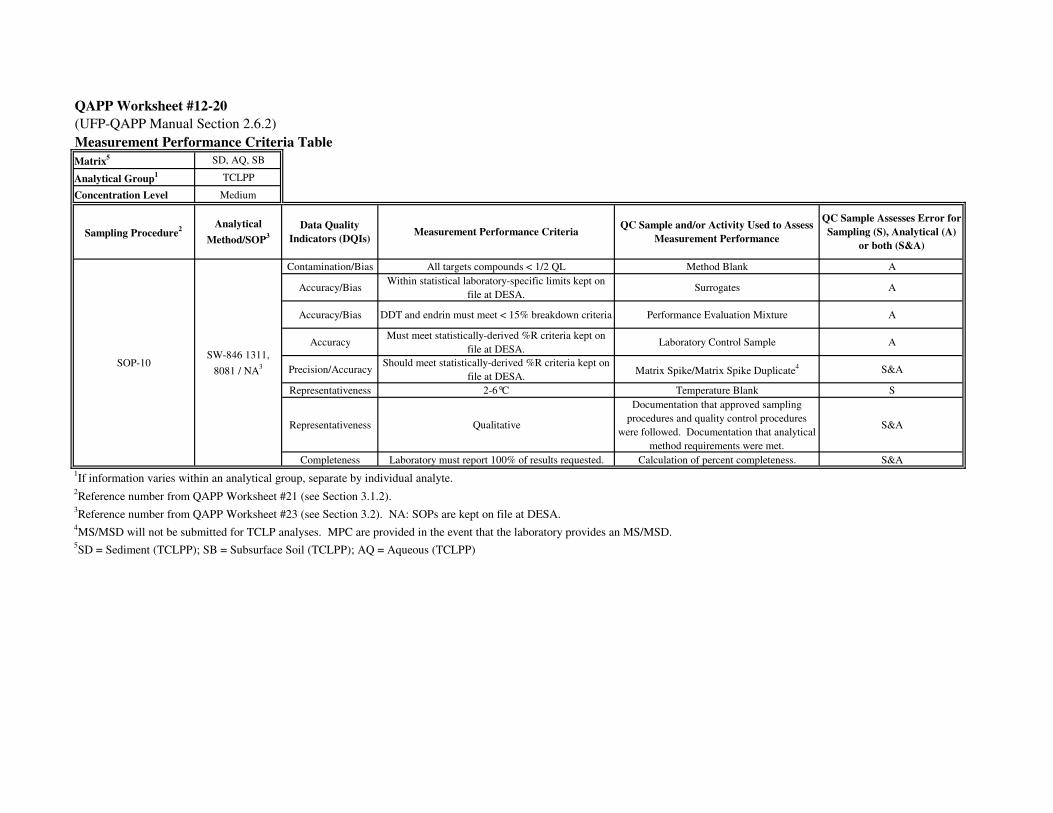
QAPP Worksheet #12-20
(UFP-QAPP Manual Section 2.6.2)
Measurement Performance Criteria Table
Matrix5 SD, AQ, SB
Analytical Group1 TCLPP
Concentration Level Medium
Sampling Procedure2
Analytical
Method/SOP3
Data Quality
Indicators (DQIs)Measurement Performance Criteria
QC Sample and/or Activity Used to Assess
Measurement Performance
QC Sample Assesses Error for
Sampling (S), Analytical (A)
or both (S&A)
Contamination/Bias All targets compounds < 1/2 QL Method Blank A
Accuracy/BiasWithin statistical laboratory-specific limits kept on
file at DESA.Surrogates A
Accuracy/Bias DDT and endrin must meet < 15% breakdown criteria Performance Evaluation Mixture A
AccuracyMust meet statistically-derived %R criteria kept on
file at DESA.Laboratory Control Sample A
Precision/AccuracyShould meet statistically-derived %R criteria kept on
file at DESA.Matrix Spike/Matrix Spike Duplicate
4 S&A
Representativeness 2-6°C Temperature Blank S
Representativeness Qualitative
Documentation that approved sampling
procedures and quality control procedures
were followed. Documentation that analytical
method requirements were met.
S&A
Completeness Laboratory must report 100% of results requested. Calculation of percent completeness. S&A
1If information varies within an analytical group, separate by individual analyte.
2Reference number from QAPP Worksheet #21 (see Section 3.1.2).
3Reference number from QAPP Worksheet #23 (see Section 3.2). NA: SOPs are kept on file at DESA.
4MS/MSD will not be submitted for TCLP analyses. MPC are provided in the event that the laboratory provides an MS/MSD.
SW-846 1311,
8081 / NA3SOP-10
5SD = Sediment (TCLPP); SB = Subsurface Soil (TCLPP); AQ = Aqueous (TCLPP)

QAPP Worksheet #12-21
(UFP-QAPP Manual Section 2.6.2)
Measurement Performance Criteria Table
Matrix5 SD, AQ, SB
Analytical Group1 TCLPH
Concentration Level Medium
Sampling Procedure2
Analytical
Method/SOP3
Data Quality
Indicators (DQIs)Measurement Performance Criteria
QC Sample and/or Activity Used to Assess
Measurement Performance
QC Sample Assesses Error for
Sampling (S), Analytical (A)
or both (S&A)
Contamination/Bias All targets compounds < 1/2 QL Method Blank A
AccuracyWithin statistical laboratory-specific limits kept on
file at DESA.Surrogates A
AccuracyMust meet statistically-derived %R criteria kept on
file at DESA.Laboratory Control Sample A
Precision/AccuracyShould meet statistically-derived %R criteria kept on
file at DESA.Matrix Spike/Matrix Spike Duplicate
4 S&A
Representativeness 2-6°C Temperature Blank S
Representativeness Qualitative
Documentation that approved sampling
procedures and quality control procedures
were followed. Documentation that analytical
method requirements were met.
S&A
Completeness Laboratory must report 100% of results requested. Calculation of percent completeness. S&A
1If information varies within an analytical group, separate by individual analyte.
2Reference number from QAPP Worksheet #21 (see Section 3.1.2).
3Reference number from QAPP Worksheet #23 (see Section 3.2). NA: SOPs are kept on file at DESA.
4MS/MSD will not be submitted for TCLP analyses. MPC are provided in the event that the laboratory provides an MS/MSD.
SW-846 1311,
8151 / NA3SOP-10
5SD = Sediment (TCLPH); SB = Subsurface Soil (TCLPH); AQ = Aqueous (TCLPH)

QAPP Worksheet #12-22
(UFP-QAPP Manual Section 2.6.2)
Measurement Performance Criteria Table
Matrix5 SD, AQ, SB
Analytical Group1 TCLPM
Concentration Level Medium
Sampling Procedure2
Analytical
Method/SOP3
Data Quality
Indicators (DQIs)Measurement Performance Criteria
QC Sample and/or Activity Used to Assess
Measurement Performance
QC Sample Assesses Error for
Sampling (S), Analytical (A)
or both (S&A)
Contamination/BiasAbsolute value of all targets compounds < 1/2 QL
Absolute value of Hg < MDLCalibration Blank, Preparation Blank A
Accuracy Must meet 70-130%R Reporting Level Standard (CRI) A
Precision/Accuracy%D should be < 10% of the undiluted sample if
analyte concentration > 10 times the MDL.Serial Dilution for ICP-AES only A
PrecisionRPD should be < 20% if analyte concentration >
MDL.Laboratory Replicate A
Precision/Accuracy Should meet 80-120%R and < 20% RPD Matrix Spike/Matrix Spike Duplicate4 S&A
Accuracy Must meet 80-120%R Laboratory Control Sample A
Representativeness 2-6°C Temperature Blank S
Representativeness Qualitative
Documentation that approved sampling
procedures and quality control procedures
were followed. Documentation that analytical
method requirements were met.
S&A
Completeness Laboratory must report 100% of results requested. Calculation of percent completeness. S&A
1If information varies within an analytical group, separate by individual analyte.
2Reference number from QAPP Worksheet #21 (see Section 3.1.2).
3Reference number from QAPP Worksheet #23 (see Section 3.2). NA: SOPs are kept on file at DESA.
4MS/MSD will not be submitted for TCLP analyses. MPC are provided in the event that the laboratory provides an MS/MSD.
SW-846 1311,
6010, 7470 / NA3SOP-10
5SD = Sediment (TCLPM); SB = Subsurface Soil (TCLPM); AQ = Aqueous (TCLPM)
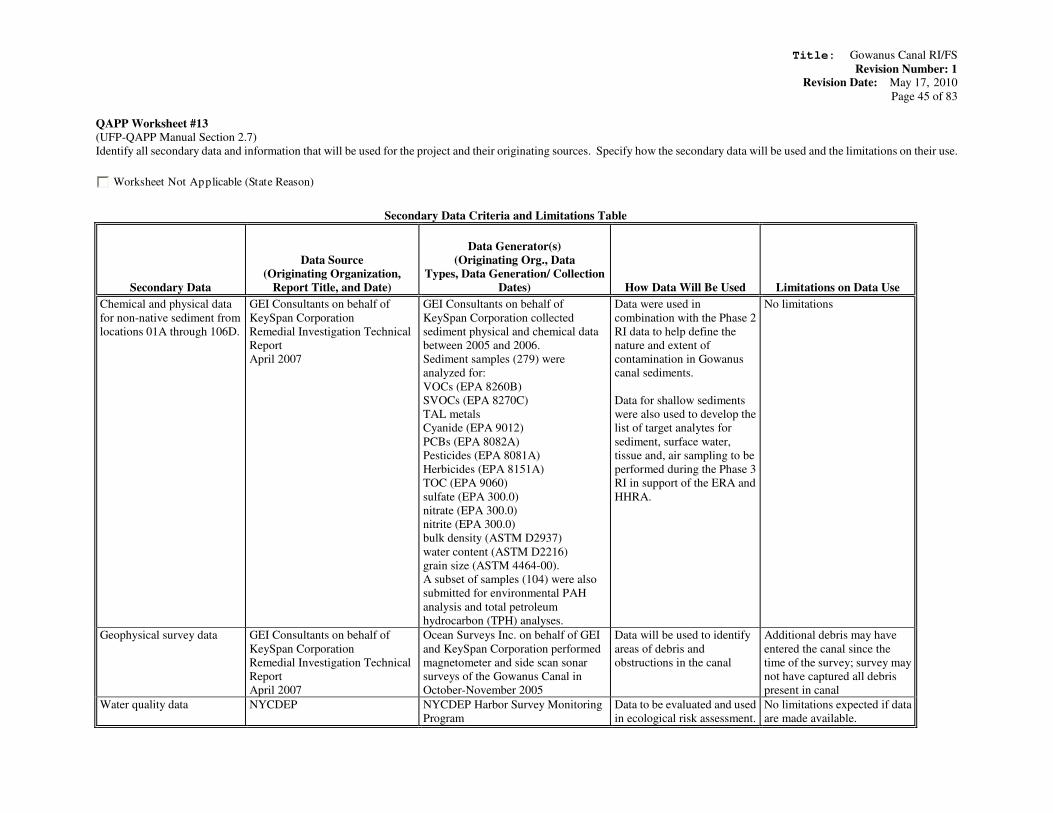
Title: Gowanus Canal RI/FS
Revision Number: 1 Revision Date: May 17, 2010
Page 45 of 83
QAPP Worksheet #13
(UFP-QAPP Manual Section 2.7)
Identify all secondary data and information that will be used for the project and their originating sources. Specify how the secondary data will be used and the limitations on their use.
Worksheet Not Applicable (State Reason)
Secondary Data Criteria and Limitations Table
Secondary Data
Data Source
(Originating Organization,
Report Title, and Date)
Data Generator(s)
(Originating Org., Data
Types, Data Generation/ Collection
Dates)
How Data Will Be Used
Limitations on Data Use
Chemical and physical data
for non-native sediment from
locations 01A through 106D.
GEI Consultants on behalf of
KeySpan Corporation
Remedial Investigation Technical
Report
April 2007
GEI Consultants on behalf of
KeySpan Corporation collected
sediment physical and chemical data
between 2005 and 2006.
Sediment samples (279) were
analyzed for:
VOCs (EPA 8260B)
SVOCs (EPA 8270C)
TAL metals
Cyanide (EPA 9012)
PCBs (EPA 8082A)
Pesticides (EPA 8081A)
Herbicides (EPA 8151A)
TOC (EPA 9060)
sulfate (EPA 300.0)
nitrate (EPA 300.0)
nitrite (EPA 300.0)
bulk density (ASTM D2937)
water content (ASTM D2216)
grain size (ASTM 4464-00).
A subset of samples (104) were also
submitted for environmental PAH
analysis and total petroleum
hydrocarbon (TPH) analyses.
Data were used in
combination with the Phase 2
RI data to help define the
nature and extent of
contamination in Gowanus
canal sediments.
Data for shallow sediments
were also used to develop the
list of target analytes for
sediment, surface water,
tissue and, air sampling to be
performed during the Phase 3
RI in support of the ERA and
HHRA.
No limitations
Geophysical survey data GEI Consultants on behalf of
KeySpan Corporation
Remedial Investigation Technical
Report
April 2007
Ocean Surveys Inc. on behalf of GEI
and KeySpan Corporation performed
magnetometer and side scan sonar
surveys of the Gowanus Canal in
October-November 2005
Data will be used to identify
areas of debris and
obstructions in the canal
Additional debris may have
entered the canal since the
time of the survey; survey may
not have captured all debris
present in canal
Water quality data NYCDEP NYCDEP Harbor Survey Monitoring
Program
Data to be evaluated and used
in ecological risk assessment.
No limitations expected if data
are made available.
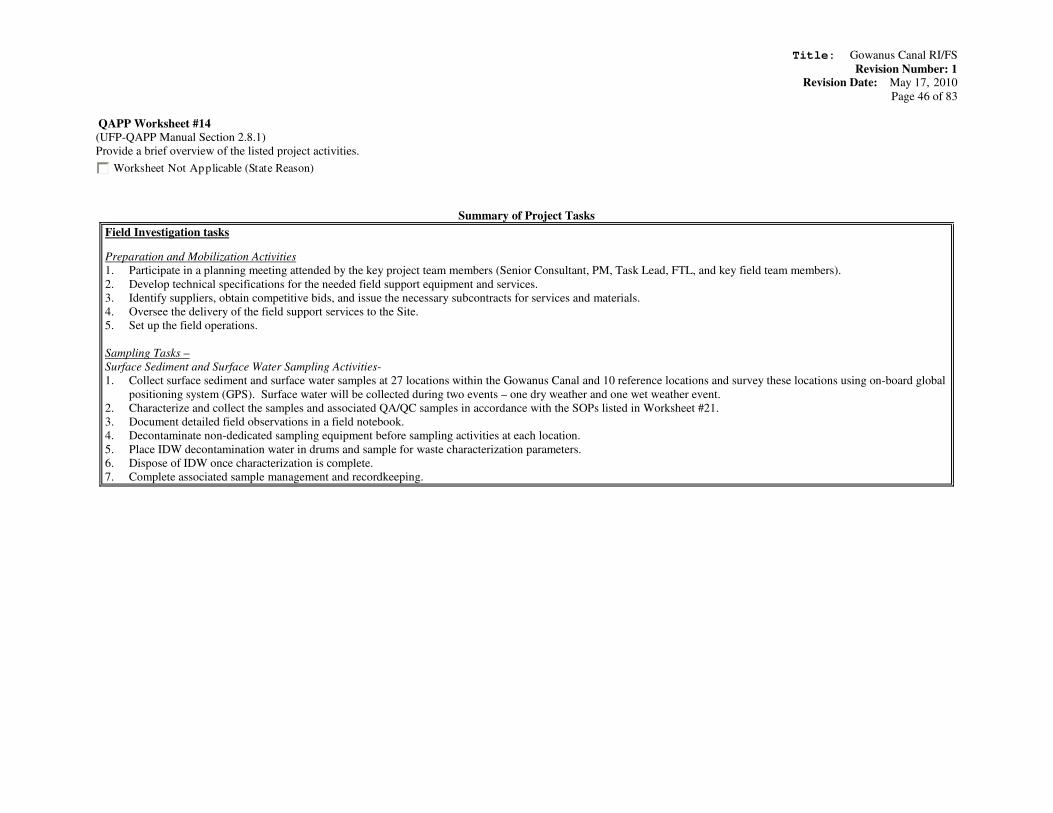
Title: Gowanus Canal RI/FS
Revision Number: 1 Revision Date: May 17, 2010
Page 46 of 83
QAPP Worksheet #14
(UFP-QAPP Manual Section 2.8.1)
Provide a brief overview of the listed project activities.
Worksheet Not Applicable (State Reason)
Summary of Project Tasks
Field Investigation tasks
Preparation and Mobilization Activities
1. Participate in a planning meeting attended by the key project team members (Senior Consultant, PM, Task Lead, FTL, and key field team members).
2. Develop technical specifications for the needed field support equipment and services.
3. Identify suppliers, obtain competitive bids, and issue the necessary subcontracts for services and materials.
4. Oversee the delivery of the field support services to the Site.
5. Set up the field operations.
Sampling Tasks –
Surface Sediment and Surface Water Sampling Activities-
1. Collect surface sediment and surface water samples at 27 locations within the Gowanus Canal and 10 reference locations and survey these locations using on-board global
positioning system (GPS). Surface water will be collected during two events – one dry weather and one wet weather event.
2. Characterize and collect the samples and associated QA/QC samples in accordance with the SOPs listed in Worksheet #21.
3. Document detailed field observations in a field notebook.
4. Decontaminate non-dedicated sampling equipment before sampling activities at each location.
5. Place IDW decontamination water in drums and sample for waste characterization parameters.
6. Dispose of IDW once characterization is complete.
7. Complete associated sample management and recordkeeping.
Title: Gowanus Canal RI/FS
Revision Number: 1 Revision Date: May 17, 2010
Page 47 of 83
Field Investigation tasks (continued)
Biological Tissue Sampling Activities-
1. Acquire all appropriate permits for biota collections.
2. Collect tissue samples (mummichog, white perch, striped bass, and blue crab) from the six reaches of the Gowanus Canal and from designated 5 reference locations and note
the collection locations appropriately (e.g., survey point locations of minnow traps or crab pots using on-board global positioning system [GPS]).
3. Characterize and collect the samples and associated QA/QC samples in accordance with the SOPs listed in Worksheet #21.
4. Document detailed field observations in a field notebook.
5. Decontaminate non-dedicated sampling equipment before sampling activities at each location.
6. Place IDW decontamination water in drums and sample for waste characterization parameters.
7. Dispose of IDW once characterization is complete.
8. Complete associated sample management and recordkeeping
CSO Sampling Activities
1. Collect water and sediment samples from 10 CSOs discharging to the canal.
o Water samples will be collected during one dry and three wet weather events. At one location (the Gowanus Pump Station), the sample will be collected using a
composite sampling device. At the remaining nine locations, grab samples will be collected from manholes where regulators/relieve valves are located upstream of the
CSO discharge into the canal.
o Sediment samples will be collected during one dry weather event.
2. Characterize and collect the samples and associated QA/QC samples in accordance with the SOPs listed in Worksheet #21.
3. Document detailed field observations in a field notebook.
4. Decontaminate non-dedicated sampling equipment before sampling activities at each location.
5. Place IDW decontamination water in drums and sample for waste characterization parameters.
6. Dispose of IDW once characterization is complete.
7. Complete associated sample management and recordkeeping.
Installation of soil borings and monitoring wells
1. Install 15 soil borings to situate 15 nested monitoring well pairs.
2. Collect soil samples from the soil borings in 8 of the 12 well pairs (locations to be samples will be selected after consultation with the US EPA.
3. Characterize and collect the samples and associated QA/QC samples in accordance with the SOPs listed in Worksheet #21.
4. Document detailed field observations in a field notebook.
5. Decontaminate non-dedicated sampling equipment before sampling activities at each location.
6. Place IDW decontamination water in drums and sample for waste characterization parameters.
7. Dispose of IDW once characterization is complete.
8. Complete associated sample management and recordkeeping.
Title: Gowanus Canal RI/FS
Revision Number: 1 Revision Date: May 17, 2010
Page 48 of 83
Groundwater sampling
1. Collect groundwater samples from the 30 monitoring wells (and if needed from the remaining monitoring wells installed by other entities at the site up to 66 monitoring
wells).
2. Collect the samples and associated QA/QC samples in accordance with the SOPs listed in Worksheet #21.
3. Document detailed field observations in a field notebook.
4. Decontaminate non-dedicated sampling equipment before sampling activities at each location.
5. Place IDW decontamination water in drums and sample for waste characterization parameters.
6. Dispose of IDW once characterization is complete.
7. Complete associated sample management and recordkeeping.
Water level measurements
1. Collect 6 rounds of synoptic water levels measurements.
2. Collect 1 week of continuous water level information in the canal and from monitoring wells selected to provide full coverage of the length of the canal.
Air Sampling Activities-
1. Collect air samples from the 10 locations along the Gowanus Canal and from the 3 inland locations selected based on considerations of predominant wind direction. Survey
the locations using a hand-held global positioning system [GPS]). Air samples will be collected during two events – one before and one after the start of NYC’s canal aeration
system. Note that at all locations along the canal, two samples will be collected during each event – one at the street level and one at the canoe level.
2. Collect the samples and associated QA/QC samples in accordance with the SOPs listed in Worksheet #21.
3. Document detailed field observations in a field notebook.
4. Complete associated sample management and recordkeeping
Demobilization
This subtask includes demobilizing equipment and facilities from the site at the end of the field activities. The project files will be removed from the field office, brought to the
CH2M HILL office in Parsippany, New Jersey, and organized for subsequent project phases.
Analysis Tasks:
1. The analytical laboratories will process and analyze the collected surface water, surface sediment, biolotical tissue, air samples, subsurface soil and groundwater for the
parameters in Worksheet 18.
Quality Control Tasks: 1.Follow SOPs for field and laboratory activities to ensure activities are performed consistently and meet established quality goals.
2. Use and complete all field forms to ensure consistency and completeness of the collected information.
3. Collect required QC samples as described on Worksheet #28.
Laboratory and field sampling SOPs are provided in Attachments 2 and 3, respectively.
Secondary Data: Information in the HRS package (in particular, data generated during previous investigations of the canal, April 2007) will be used in to aid in the determination of the nature and
extent of contamination in the Gowanus Canal.
Water quality data from the NYCDEP Harbor Survey Monitoring Program will be evaluated and used in the ecological risk assessment.
Data Management Tasks: Chemical constituent data will be uploaded into a project database management system (DMS) and archived in the project files.
A data management SOP is provided in Attachment 3.
Data validation for analyses through CLP will be provided through USEPA Region 2. For all tests / analyses not performed through the CLP, CH2M HILL will review the data
to evaluate whether the data is of a quality that meets the RI objectives and establish limitations on the use of the data in drawing conclusions. Data validation is described in
Worksheets #34 through #36.
Title: Gowanus Canal RI/FS
Revision Number: 1 Revision Date: May 17, 2010
Page 49 of 83
Documentation and Records:
Field observations and analytical results will be documented in the Ecological and Human Health Risk Assessments, which will be included in the Remedial Investigation Report.
Assessment/Audit Tasks:
See Worksheets #31 and #32
Data Review Tasks: Perform a data usability assessment as per Worksheet #37.

Title: Gowanus Canal RI/FS
Revision Number: 1 Revision Date: May 17, 2010
Page 50 of 83
QAPP Worksheet #15
(UFP-QAPP Manual Section 2.8.1)
Complete this worksheet for each matrix, analytical group, and concentration level. Identify the target analytes/contaminants of concern and project-required action limits. Next,
determine the quantitation limits (QLs) that must be met to achieve the project quality objectives. Finally, list the published and achievable detection and quantitation limits for each
analyte.
Worksheet Not Applicable (State Reason)
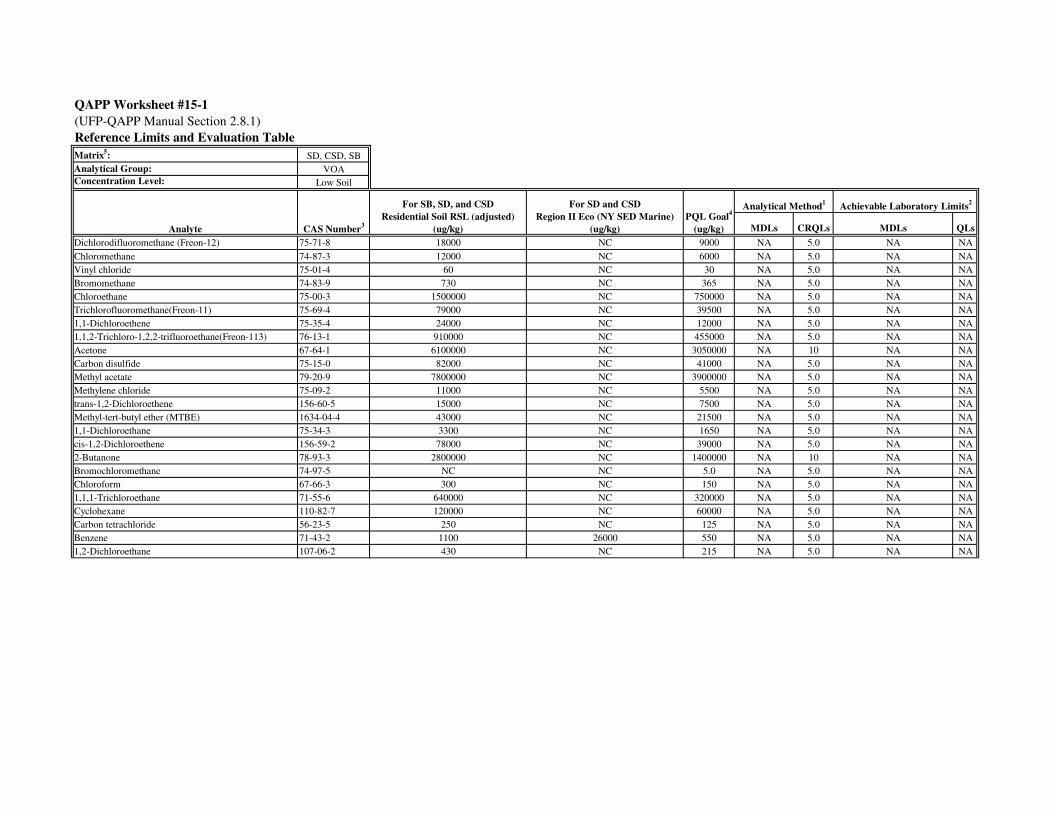
QAPP Worksheet #15-1
(UFP-QAPP Manual Section 2.8.1)
Reference Limits and Evaluation Table
Matrix5: SD, CSD, SB
Analytical Group: VOA
Concentration Level: Low Soil
MDLs CRQLs MDLs QLs
Dichlorodifluoromethane (Freon-12) 75-71-8 18000 NC 9000 NA 5.0 NA NA
Chloromethane 74-87-3 12000 NC 6000 NA 5.0 NA NA
Vinyl chloride 75-01-4 60 NC 30 NA 5.0 NA NA
Bromomethane 74-83-9 730 NC 365 NA 5.0 NA NA
Chloroethane 75-00-3 1500000 NC 750000 NA 5.0 NA NA
Trichlorofluoromethane(Freon-11) 75-69-4 79000 NC 39500 NA 5.0 NA NA
1,1-Dichloroethene 75-35-4 24000 NC 12000 NA 5.0 NA NA
1,1,2-Trichloro-1,2,2-trifluoroethane(Freon-113) 76-13-1 910000 NC 455000 NA 5.0 NA NA
Acetone 67-64-1 6100000 NC 3050000 NA 10 NA NA
Carbon disulfide 75-15-0 82000 NC 41000 NA 5.0 NA NA
Methyl acetate 79-20-9 7800000 NC 3900000 NA 5.0 NA NA
Methylene chloride 75-09-2 11000 NC 5500 NA 5.0 NA NA
trans-1,2-Dichloroethene 156-60-5 15000 NC 7500 NA 5.0 NA NA
Methyl-tert-butyl ether (MTBE) 1634-04-4 43000 NC 21500 NA 5.0 NA NA
1,1-Dichloroethane 75-34-3 3300 NC 1650 NA 5.0 NA NA
cis-1,2-Dichloroethene 156-59-2 78000 NC 39000 NA 5.0 NA NA
2-Butanone 78-93-3 2800000 NC 1400000 NA 10 NA NA
Bromochloromethane 74-97-5 NC NC 5.0 NA 5.0 NA NA
Chloroform 67-66-3 300 NC 150 NA 5.0 NA NA
1,1,1-Trichloroethane 71-55-6 640000 NC 320000 NA 5.0 NA NA
Cyclohexane 110-82-7 120000 NC 60000 NA 5.0 NA NA
Carbon tetrachloride 56-23-5 250 NC 125 NA 5.0 NA NA
Benzene 71-43-2 1100 26000 550 NA 5.0 NA NA
1,2-Dichloroethane 107-06-2 430 NC 215 NA 5.0 NA NA
For SD and CSD
Region II Eco (NY SED Marine)
(ug/kg)
Achievable Laboratory Limits2
Analytical Method1
CAS Number3
Analyte
PQL Goal4
(ug/kg)
For SB, SD, and CSD
Residential Soil RSL (adjusted)
(ug/kg)
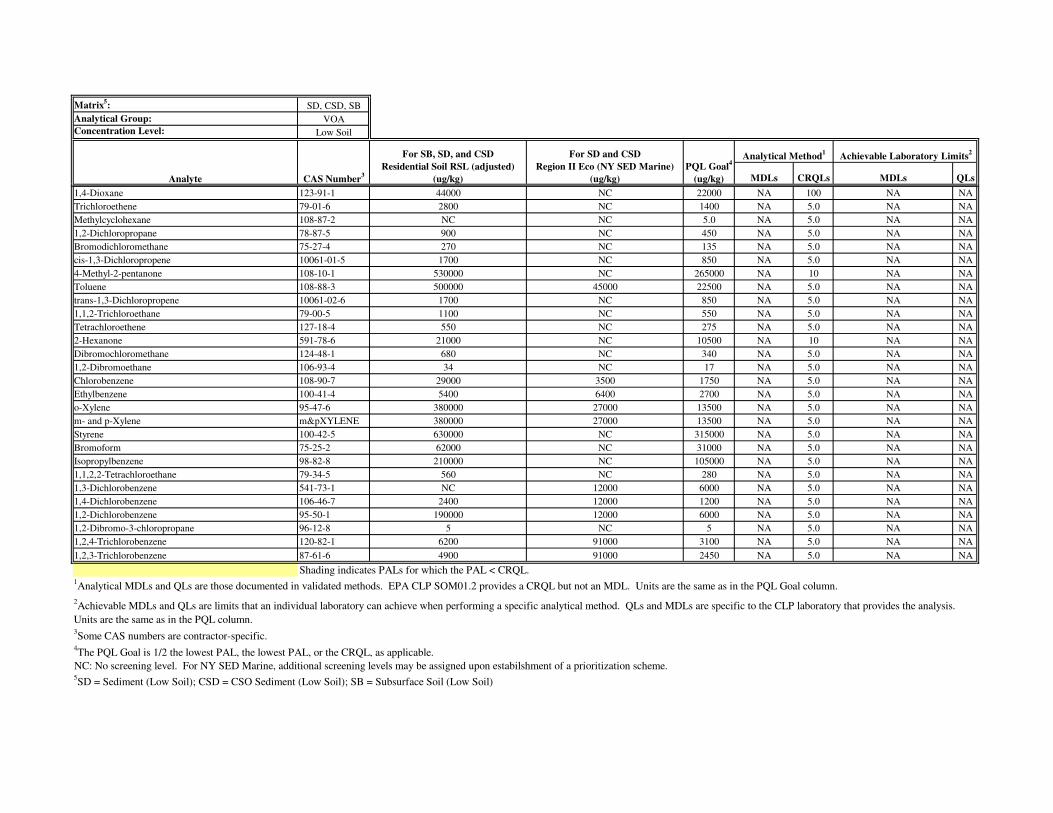
Matrix5: SD, CSD, SB
Analytical Group: VOA
Concentration Level: Low Soil
MDLs CRQLs MDLs QLs
For SD and CSD
Region II Eco (NY SED Marine)
(ug/kg)
Achievable Laboratory Limits2
Analytical Method1
CAS Number3
Analyte
PQL Goal4
(ug/kg)
For SB, SD, and CSD
Residential Soil RSL (adjusted)
(ug/kg)
1,4-Dioxane 123-91-1 44000 NC 22000 NA 100 NA NA
Trichloroethene 79-01-6 2800 NC 1400 NA 5.0 NA NA
Methylcyclohexane 108-87-2 NC NC 5.0 NA 5.0 NA NA
1,2-Dichloropropane 78-87-5 900 NC 450 NA 5.0 NA NA
Bromodichloromethane 75-27-4 270 NC 135 NA 5.0 NA NA
cis-1,3-Dichloropropene 10061-01-5 1700 NC 850 NA 5.0 NA NA
4-Methyl-2-pentanone 108-10-1 530000 NC 265000 NA 10 NA NA
Toluene 108-88-3 500000 45000 22500 NA 5.0 NA NA
trans-1,3-Dichloropropene 10061-02-6 1700 NC 850 NA 5.0 NA NA
1,1,2-Trichloroethane 79-00-5 1100 NC 550 NA 5.0 NA NA
Tetrachloroethene 127-18-4 550 NC 275 NA 5.0 NA NA
2-Hexanone 591-78-6 21000 NC 10500 NA 10 NA NA
Dibromochloromethane 124-48-1 680 NC 340 NA 5.0 NA NA
1,2-Dibromoethane 106-93-4 34 NC 17 NA 5.0 NA NA
Chlorobenzene 108-90-7 29000 3500 1750 NA 5.0 NA NA
Ethylbenzene 100-41-4 5400 6400 2700 NA 5.0 NA NA
o-Xylene 95-47-6 380000 27000 13500 NA 5.0 NA NA
m- and p-Xylene m&pXYLENE 380000 27000 13500 NA 5.0 NA NA
Styrene 100-42-5 630000 NC 315000 NA 5.0 NA NA
Bromoform 75-25-2 62000 NC 31000 NA 5.0 NA NA
Isopropylbenzene 98-82-8 210000 NC 105000 NA 5.0 NA NA
1,1,2,2-Tetrachloroethane 79-34-5 560 NC 280 NA 5.0 NA NA
1,3-Dichlorobenzene 541-73-1 NC 12000 6000 NA 5.0 NA NA
1,4-Dichlorobenzene 106-46-7 2400 12000 1200 NA 5.0 NA NA
1,2-Dichlorobenzene 95-50-1 190000 12000 6000 NA 5.0 NA NA
1,2-Dibromo-3-chloropropane 96-12-8 5 NC 5 NA 5.0 NA NA
1,2,4-Trichlorobenzene 120-82-1 6200 91000 3100 NA 5.0 NA NA
1,2,3-Trichlorobenzene 87-61-6 4900 91000 2450 NA 5.0 NA NA
Shading indicates PALs for which the PAL < CRQL.
3Some CAS numbers are contractor-specific.
4The PQL Goal is 1/2 the lowest PAL, the lowest PAL, or the CRQL, as applicable.
NC: No screening level. For NY SED Marine, additional screening levels may be assigned upon estabilshment of a prioritization scheme.5SD = Sediment (Low Soil); CSD = CSO Sediment (Low Soil); SB = Subsurface Soil (Low Soil)
2Achievable MDLs and QLs are limits that an individual laboratory can achieve when performing a specific analytical method. QLs and MDLs are specific to the CLP laboratory that provides the analysis.
Units are the same as in the PQL column.
1Analytical MDLs and QLs are those documented in validated methods. EPA CLP SOM01.2 provides a CRQL but not an MDL. Units are the same as in the PQL Goal column.
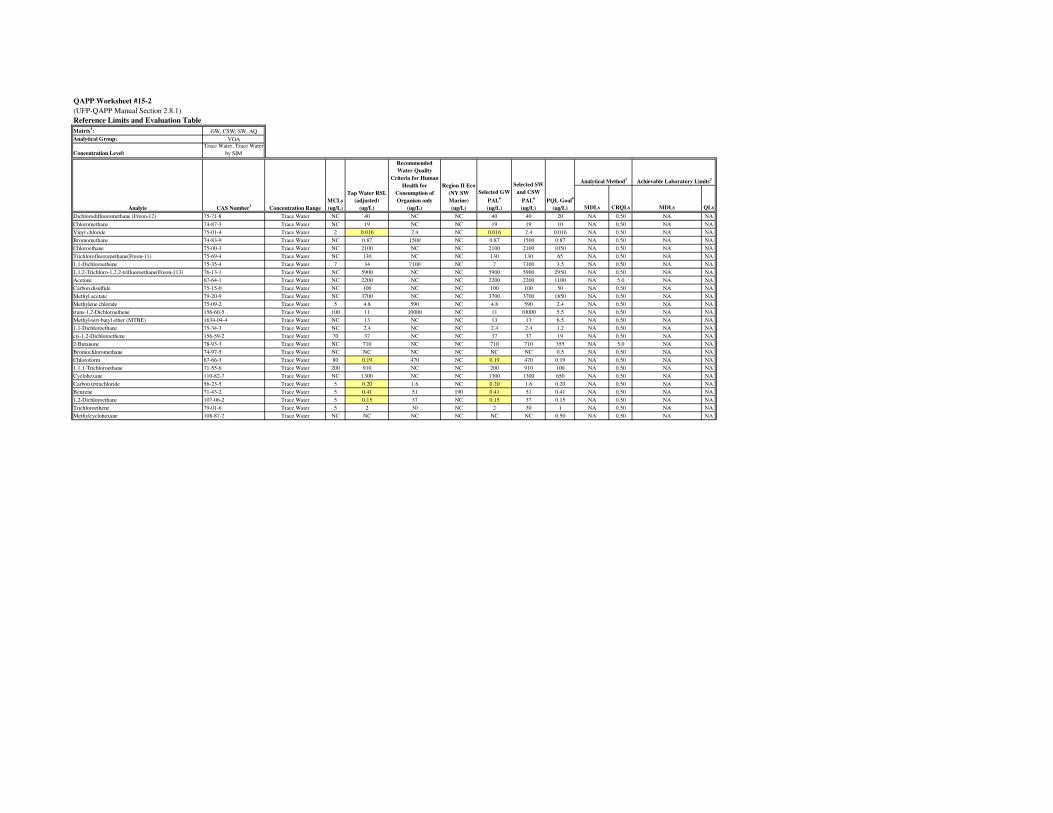
QAPP Worksheet #15-2
(UFP-QAPP Manual Section 2.8.1)
Reference Limits and Evaluation Table
Matrix5: GW, CSW, SW, AQ
Analytical Group: VOA
Concentration Level:
Trace Water, Trace Water
by SIM
MDLs CRQLs MDLs QLs
Dichlorodifluoromethane (Freon-12) 75-71-8 Trace Water NC 40 NC NC 40 40 20 NA 0.50 NA NA
Chloromethane 74-87-3 Trace Water NC 19 NC NC 19 19 10 NA 0.50 NA NA
Vinyl chloride 75-01-4 Trace Water 2 0.016 2.4 NC 0.016 2.4 0.016 NA 0.50 NA NA
Bromomethane 74-83-9 Trace Water NC 0.87 1500 NC 0.87 1500 0.87 NA 0.50 NA NA
Chloroethane 75-00-3 Trace Water NC 2100 NC NC 2100 2100 1050 NA 0.50 NA NA
Trichlorofluoromethane(Freon-11) 75-69-4 Trace Water NC 130 NC NC 130 130 65 NA 0.50 NA NA
1,1-Dichloroethene 75-35-4 Trace Water 7 34 7100 NC 7 7100 3.5 NA 0.50 NA NA
1,1,2-Trichloro-1,2,2-trifluoroethane(Freon-113) 76-13-1 Trace Water NC 5900 NC NC 5900 5900 2950 NA 0.50 NA NA
Acetone 67-64-1 Trace Water NC 2200 NC NC 2200 2200 1100 NA 5.0 NA NA
Carbon disulfide 75-15-0 Trace Water NC 100 NC NC 100 100 50 NA 0.50 NA NA
Methyl acetate 79-20-9 Trace Water NC 3700 NC NC 3700 3700 1850 NA 0.50 NA NA
Methylene chloride 75-09-2 Trace Water 5 4.8 590 NC 4.8 590 2.4 NA 0.50 NA NA
trans-1,2-Dichloroethene 156-60-5 Trace Water 100 11 10000 NC 11 10000 5.5 NA 0.50 NA NA
Methyl-tert-butyl ether (MTBE) 1634-04-4 Trace Water NC 13 NC NC 13 13 6.5 NA 0.50 NA NA
1,1-Dichloroethane 75-34-3 Trace Water NC 2.4 NC NC 2.4 2.4 1.2 NA 0.50 NA NA
cis-1,2-Dichloroethene 156-59-2 Trace Water 70 37 NC NC 37 37 19 NA 0.50 NA NA
2-Butanone 78-93-3 Trace Water NC 710 NC NC 710 710 355 NA 5.0 NA NA
Bromochloromethane 74-97-5 Trace Water NC NC NC NC NC NC 0.5 NA 0.50 NA NA
Chloroform 67-66-3 Trace Water 80 0.19 470 NC 0.19 470 0.19 NA 0.50 NA NA
1,1,1-Trichloroethane 71-55-6 Trace Water 200 910 NC NC 200 910 100 NA 0.50 NA NA
Cyclohexane 110-82-7 Trace Water NC 1300 NC NC 1300 1300 650 NA 0.50 NA NA
Carbon tetrachloride 56-23-5 Trace Water 5 0.20 1.6 NC 0.20 1.6 0.20 NA 0.50 NA NA
Benzene 71-43-2 Trace Water 5 0.41 51 190 0.41 51 0.41 NA 0.50 NA NA
1,2-Dichloroethane 107-06-2 Trace Water 5 0.15 37 NC 0.15 37 0.15 NA 0.50 NA NA
Trichloroethene 79-01-6 Trace Water 5 2 30 NC 2 30 1 NA 0.50 NA NA
Methylcyclohexane 108-87-2 Trace Water NC NC NC NC NC NC 0.50 NA 0.50 NA NA
Concentration Range
National
Recommended
Water Quality
Criteria for Human
Health for
Consumption of
Organism only
(ug/L)Analyte CAS Number3
Selected GW
PAL6
(ug/L)
Selected SW
and CSW
PAL6
(ug/L)
PQL Goal4
(ug/L)
Analytical Method1
MCLs
(ug/L)
Tap Water RSL
(adjusted)
(ug/L)
Region II Eco
(NY SW
Marine)
(ug/L)
Achievable Laboratory Limits2

Matrix5: GW, CSW, SW, AQ
Analytical Group: VOA
Concentration Level:
Trace Water, Trace Water
by SIM
MDLs CRQLs MDLs QLsConcentration Range
National
Recommended
Water Quality
Criteria for Human
Health for
Consumption of
Organism only
(ug/L)Analyte CAS Number3
Selected GW
PAL6
(ug/L)
Selected SW
and CSW
PAL6
(ug/L)
PQL Goal4
(ug/L)
Analytical Method1
MCLs
(ug/L)
Tap Water RSL
(adjusted)
(ug/L)
Region II Eco
(NY SW
Marine)
(ug/L)
Achievable Laboratory Limits2
1,2-Dichloropropane 78-87-5 Trace Water 5 0.39 15 NC 0.39 15 0.39 NA 0.50 NA NA
Bromodichloromethane 75-27-4 Trace Water 80 0.12 17 NC 0.12 17 0.12 NA 0.50 NA NA
cis-1,3-Dichloropropene 10061-01-5 Trace Water NC 0.43 21 NC 0.43 21 0.43 NA 0.50 NA NA
4-Methyl-2-pentanone 108-10-1 Trace Water NC 200 NC NC 200 200 100 NA 5.0 NA NA
Toluene 108-88-3 Trace Water 1000 230 15000 92 230 92 46 NA 0.50 NA NA
trans-1,3-Dichloropropene 10061-02-6 Trace Water NC 0.43 21 NC 0.43 21 0.43 NA 0.50 NA NA
1,1,2-Trichloroethane 79-00-5 Trace Water 5 0.24 16 NC 0.24 16 0.24 NA 0.50 NA NA
Tetrachloroethene 127-18-4 Trace Water 5 0.11 3.3 NC 0.11 3.3 0.11 NA 0.50 NA NA
2-Hexanone 591-78-6 Trace Water NC 4.7 NC NC 4.7 4.7 4.7 NA 5.0 NA NA
Dibromochloromethane 124-48-1 Trace Water 80 0.15 13 NC 0.15 13 0.15 NA 0.50 NA NA
1,2-Dibromoethane 106-93-4 Trace Water by SIM 0.05 0.0065 NC NC 0.0065 0.0065 0.0065 NA 0.050 NA NA
Chlorobenzene 108-90-7 Trace Water 100 9.1 1600 5 9.1 5 2.5 NA 0.50 NA NA
Ethylbenzene 100-41-4 Trace Water 700 1.5 2100 4.5 1.5 4.5 0.75 NA 0.50 NA NA
o-Xylene 95-47-6 Trace Water 10000 120 NC 19 120 19 9.5 NA 0.50 NA NA
m- and p-Xylene m&pXYLENE Trace Water 10000 NC NC 19 10000 19 9.5 NA 0.50 NA NA
Styrene 100-42-5 Trace Water 100 160 NC NC 100 160 50 NA 0.50 NA NA
Bromoform 75-25-2 Trace Water 80 8.5 140 NC 8.5 140 4.3 NA 0.50 NA NA
Isopropylbenzene 98-82-8 Trace Water NC 68 NC NC 68 68 34 NA 0.50 NA NA
1,1,2,2-Tetrachloroethane 79-34-5 Trace Water NC 0.067 4 NC 0.067 4 0.067 NA 0.50 NA NA
1,3-Dichlorobenzene 541-73-1 Trace Water NC NC 960 5 NC 5 2.5 NA 0.50 NA NA
1,4-Dichlorobenzene 106-46-7 Trace Water 75 0.43 190 5 0.43 5 0.43 NA 0.50 NA NA
1,2-Dichlorobenzene 95-50-1 Trace Water 600 37 1300 5 37 5 2.5 NA 0.50 NA NA
1,2-Dibromo-3-chloropropane 96-12-8 Trace Water by SIM 0.2 0.00032 NC NC 0.00032 0.00032 0.00032 NA 0.050 NA NA
1,2,4-Trichlorobenzene 120-82-1 Trace Water 70 0.41 70 5 0.41 5 0.41 NA 0.50 NA NA
1,2,3-Trichlorobenzene 87-61-6 Trace Water NC 2.9 NC 5 2.9 2.9 1.5 NA 0.50 NA NA
Shading indicates PALs for which the PAL < CRQL.
3Some CAS numbers are contractor-specific.
4The PQL Goal is 1/2 the lowest PAL, the lowest PAL, or the CRQL, as applicable.
NC: No screening level. For NY SW Marine, additional screening levels may be assigned upon estabilshment of a prioritization scheme.
6The selected GW PAL is the lesser of MCLs or Tap Water RSLs (adjusted). The selected SW and CSW PAL is the lesser of Region II Eco (NY SW Marine) or [Tap Water RSLs (adjusted) if no 'National Recommended Water Quality Criteria for
Human Health for Consumption of Organism only' limit].
1Analytical MDLs and QLs are those documented in validated methods. EPA CLP SOM01.2 provides a CRQL but not an MDL. Units are the same as in the PQL Goal column.
2Achievable MDLs and QLs are limits that an individual laboratory can achieve when performing a specific analytical method. QLs and MDLs are specific to the CLP laboratory that provides the analysis. Units are the same as in the PQL column.
5GW = Groundwater (Trace Water, Trace Water by SIM); CSW = CSO Surface Water (Trace Water, Trace Water by SIM); SW = Surface Water (Trace Water, Trace Water by SIM); AQ = Aqueous (Low Water or Trace Water, Trace Water by SIM).
Aqueous blanks will be analyzed via the same concentration range as the samples they are associated with.
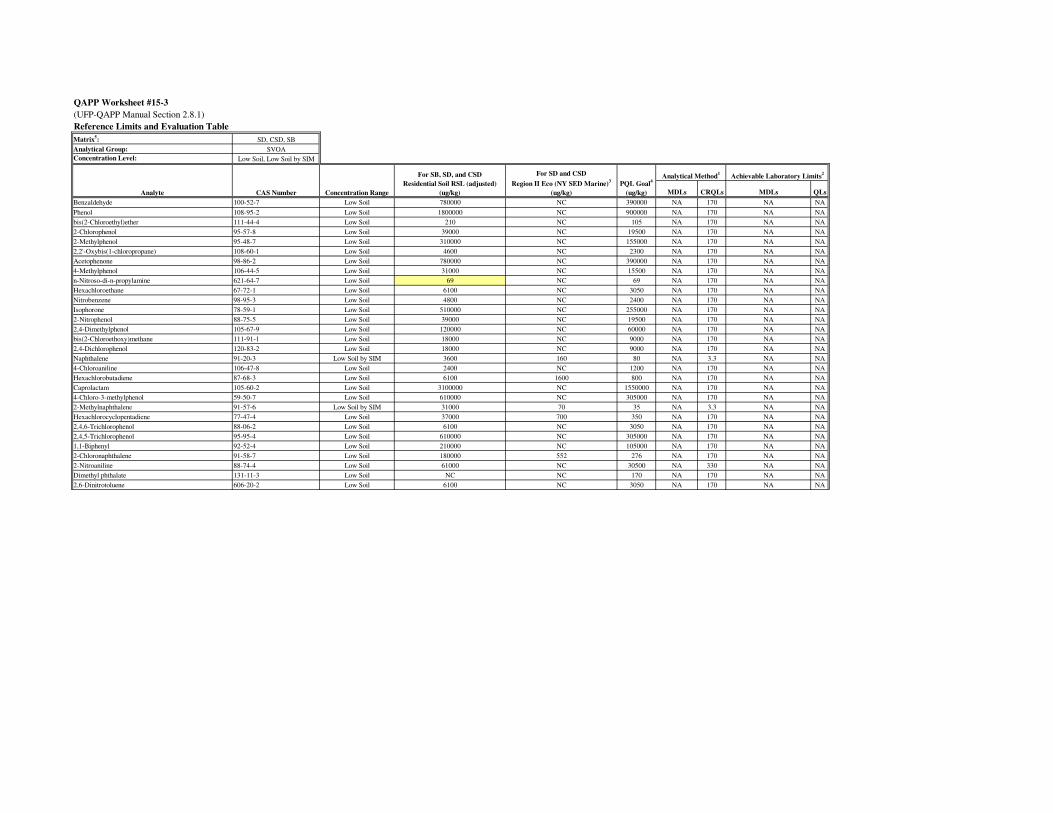
QAPP Worksheet #15-3
(UFP-QAPP Manual Section 2.8.1)
Reference Limits and Evaluation Table
Matrix5: SD, CSD, SB
Analytical Group: SVOA
Concentration Level: Low Soil, Low Soil by SIM
MDLs CRQLs MDLs QLs
Benzaldehyde 100-52-7 Low Soil 780000 NC 390000 NA 170 NA NA
Phenol 108-95-2 Low Soil 1800000 NC 900000 NA 170 NA NA
bis(2-Chloroethyl)ether 111-44-4 Low Soil 210 NC 105 NA 170 NA NA
2-Chlorophenol 95-57-8 Low Soil 39000 NC 19500 NA 170 NA NA
2-Methylphenol 95-48-7 Low Soil 310000 NC 155000 NA 170 NA NA
2,2'-Oxybis(1-chloropropane) 108-60-1 Low Soil 4600 NC 2300 NA 170 NA NA
Acetophenone 98-86-2 Low Soil 780000 NC 390000 NA 170 NA NA
4-Methylphenol 106-44-5 Low Soil 31000 NC 15500 NA 170 NA NA
n-Nitroso-di-n-propylamine 621-64-7 Low Soil 69 NC 69 NA 170 NA NA
Hexachloroethane 67-72-1 Low Soil 6100 NC 3050 NA 170 NA NA
Nitrobenzene 98-95-3 Low Soil 4800 NC 2400 NA 170 NA NA
Isophorone 78-59-1 Low Soil 510000 NC 255000 NA 170 NA NA
2-Nitrophenol 88-75-5 Low Soil 39000 NC 19500 NA 170 NA NA
2,4-Dimethylphenol 105-67-9 Low Soil 120000 NC 60000 NA 170 NA NA
bis(2-Chloroethoxy)methane 111-91-1 Low Soil 18000 NC 9000 NA 170 NA NA
2,4-Dichlorophenol 120-83-2 Low Soil 18000 NC 9000 NA 170 NA NA
Naphthalene 91-20-3 Low Soil by SIM 3600 160 80 NA 3.3 NA NA
4-Chloroaniline 106-47-8 Low Soil 2400 NC 1200 NA 170 NA NA
Hexachlorobutadiene 87-68-3 Low Soil 6100 1600 800 NA 170 NA NA
Caprolactam 105-60-2 Low Soil 3100000 NC 1550000 NA 170 NA NA
4-Chloro-3-methylphenol 59-50-7 Low Soil 610000 NC 305000 NA 170 NA NA
2-Methylnaphthalene 91-57-6 Low Soil by SIM 31000 70 35 NA 3.3 NA NA
Hexachlorocyclopentadiene 77-47-4 Low Soil 37000 700 350 NA 170 NA NA
2,4,6-Trichlorophenol 88-06-2 Low Soil 6100 NC 3050 NA 170 NA NA
2,4,5-Trichlorophenol 95-95-4 Low Soil 610000 NC 305000 NA 170 NA NA
1,1-Biphenyl 92-52-4 Low Soil 210000 NC 105000 NA 170 NA NA
2-Chloronaphthalene 91-58-7 Low Soil 180000 552 276 NA 170 NA NA
2-Nitroaniline 88-74-4 Low Soil 61000 NC 30500 NA 330 NA NA
Dimethyl phthalate 131-11-3 Low Soil NC NC 170 NA 170 NA NA
2,6-Dinitrotoluene 606-20-2 Low Soil 6100 NC 3050 NA 170 NA NA
Analyte
For SB, SD, and CSD
Residential Soil RSL (adjusted)
(ug/kg)Concentration Range
For SD and CSD
Region II Eco (NY SED Marine)3
(ug/kg)
PQL Goal4
(ug/kg)
Achievable Laboratory Limits2
Analytical Method1
CAS Number
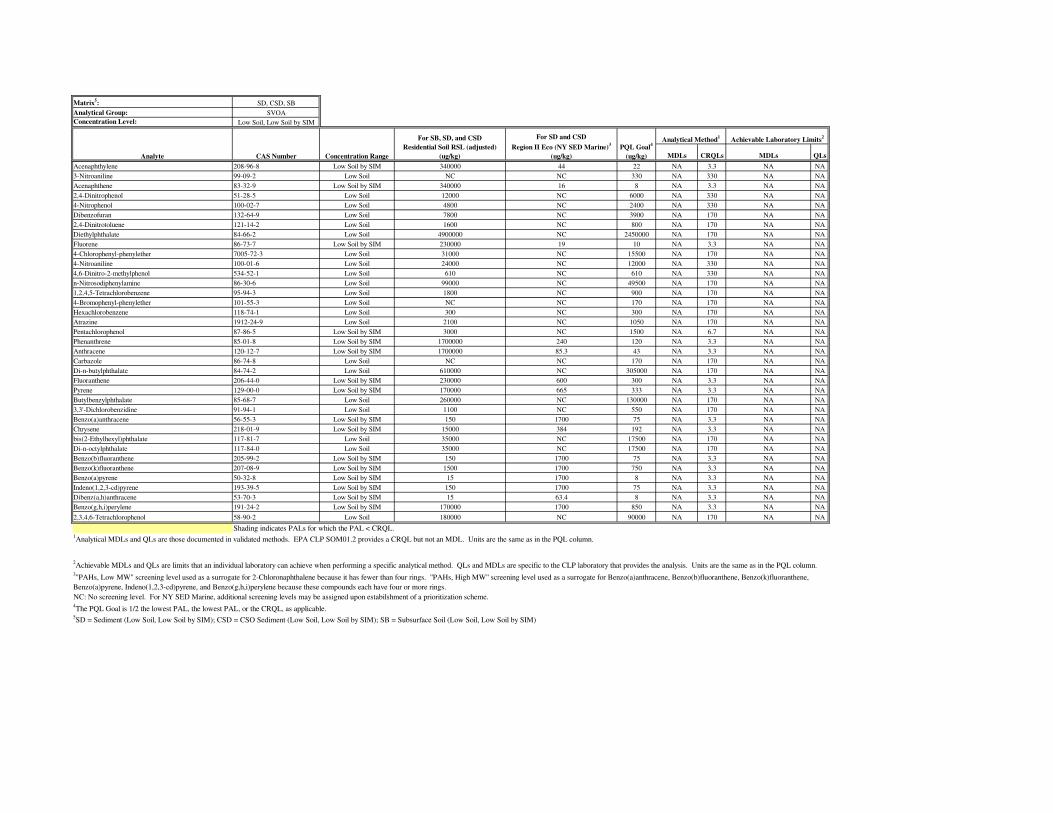
Matrix5: SD, CSD, SB
Analytical Group: SVOA
Concentration Level: Low Soil, Low Soil by SIM
MDLs CRQLs MDLs QLsAnalyte
For SB, SD, and CSD
Residential Soil RSL (adjusted)
(ug/kg)Concentration Range
For SD and CSD
Region II Eco (NY SED Marine)3
(ug/kg)
PQL Goal4
(ug/kg)
Achievable Laboratory Limits2
Analytical Method1
CAS Number
Acenaphthylene 208-96-8 Low Soil by SIM 340000 44 22 NA 3.3 NA NA
3-Nitroaniline 99-09-2 Low Soil NC NC 330 NA 330 NA NA
Acenaphthene 83-32-9 Low Soil by SIM 340000 16 8 NA 3.3 NA NA
2,4-Dinitrophenol 51-28-5 Low Soil 12000 NC 6000 NA 330 NA NA
4-Nitrophenol 100-02-7 Low Soil 4800 NC 2400 NA 330 NA NA
Dibenzofuran 132-64-9 Low Soil 7800 NC 3900 NA 170 NA NA
2,4-Dinitrotoluene 121-14-2 Low Soil 1600 NC 800 NA 170 NA NA
Diethylphthalate 84-66-2 Low Soil 4900000 NC 2450000 NA 170 NA NA
Fluorene 86-73-7 Low Soil by SIM 230000 19 10 NA 3.3 NA NA
4-Chlorophenyl-phenylether 7005-72-3 Low Soil 31000 NC 15500 NA 170 NA NA
4-Nitroaniline 100-01-6 Low Soil 24000 NC 12000 NA 330 NA NA
4,6-Dinitro-2-methylphenol 534-52-1 Low Soil 610 NC 610 NA 330 NA NA
n-Nitrosodiphenylamine 86-30-6 Low Soil 99000 NC 49500 NA 170 NA NA
1,2,4,5-Tetrachlorobenzene 95-94-3 Low Soil 1800 NC 900 NA 170 NA NA
4-Bromophenyl-phenylether 101-55-3 Low Soil NC NC 170 NA 170 NA NA
Hexachlorobenzene 118-74-1 Low Soil 300 NC 300 NA 170 NA NA
Atrazine 1912-24-9 Low Soil 2100 NC 1050 NA 170 NA NA
Pentachlorophenol 87-86-5 Low Soil by SIM 3000 NC 1500 NA 6.7 NA NA
Phenanthrene 85-01-8 Low Soil by SIM 1700000 240 120 NA 3.3 NA NA
Anthracene 120-12-7 Low Soil by SIM 1700000 85.3 43 NA 3.3 NA NA
Carbazole 86-74-8 Low Soil NC NC 170 NA 170 NA NA
Di-n-butylphthalate 84-74-2 Low Soil 610000 NC 305000 NA 170 NA NA
Fluoranthene 206-44-0 Low Soil by SIM 230000 600 300 NA 3.3 NA NA
Pyrene 129-00-0 Low Soil by SIM 170000 665 333 NA 3.3 NA NA
Butylbenzylphthalate 85-68-7 Low Soil 260000 NC 130000 NA 170 NA NA
3,3'-Dichlorobenzidine 91-94-1 Low Soil 1100 NC 550 NA 170 NA NA
Benzo(a)anthracene 56-55-3 Low Soil by SIM 150 1700 75 NA 3.3 NA NA
Chrysene 218-01-9 Low Soil by SIM 15000 384 192 NA 3.3 NA NA
bis(2-Ethylhexyl)phthalate 117-81-7 Low Soil 35000 NC 17500 NA 170 NA NA
Di-n-octylphthalate 117-84-0 Low Soil 35000 NC 17500 NA 170 NA NA
Benzo(b)fluoranthene 205-99-2 Low Soil by SIM 150 1700 75 NA 3.3 NA NA
Benzo(k)fluoranthene 207-08-9 Low Soil by SIM 1500 1700 750 NA 3.3 NA NA
Benzo(a)pyrene 50-32-8 Low Soil by SIM 15 1700 8 NA 3.3 NA NA
Indeno(1,2,3-cd)pyrene 193-39-5 Low Soil by SIM 150 1700 75 NA 3.3 NA NA
Dibenz(a,h)anthracene 53-70-3 Low Soil by SIM 15 63.4 8 NA 3.3 NA NA
Benzo(g,h,i)perylene 191-24-2 Low Soil by SIM 170000 1700 850 NA 3.3 NA NA
2,3,4,6-Tetrachlorophenol 58-90-2 Low Soil 180000 NC 90000 NA 170 NA NA
Shading indicates PALs for which the PAL < CRQL.
NC: No screening level. For NY SED Marine, additional screening levels may be assigned upon estabilshment of a prioritization scheme.
5SD = Sediment (Low Soil, Low Soil by SIM); CSD = CSO Sediment (Low Soil, Low Soil by SIM); SB = Subsurface Soil (Low Soil, Low Soil by SIM)
4The PQL Goal is 1/2 the lowest PAL, the lowest PAL, or the CRQL, as applicable.
2Achievable MDLs and QLs are limits that an individual laboratory can achieve when performing a specific analytical method. QLs and MDLs are specific to the CLP laboratory that provides the analysis. Units are the same as in the PQL column.
1Analytical MDLs and QLs are those documented in validated methods. EPA CLP SOM01.2 provides a CRQL but not an MDL. Units are the same as in the PQL column.
3"PAHs, Low MW" screening level used as a surrogate for 2-Chloronaphthalene because it has fewer than four rings. "PAHs, High MW" screening level used as a surrogate for Benzo(a)anthracene, Benzo(b)fluoranthene, Benzo(k)fluoranthene,
Benzo(a)pyrene, Indeno(1,2,3-cd)pyrene, and Benzo(g,h,i)perylene because these compounds each have four or more rings.
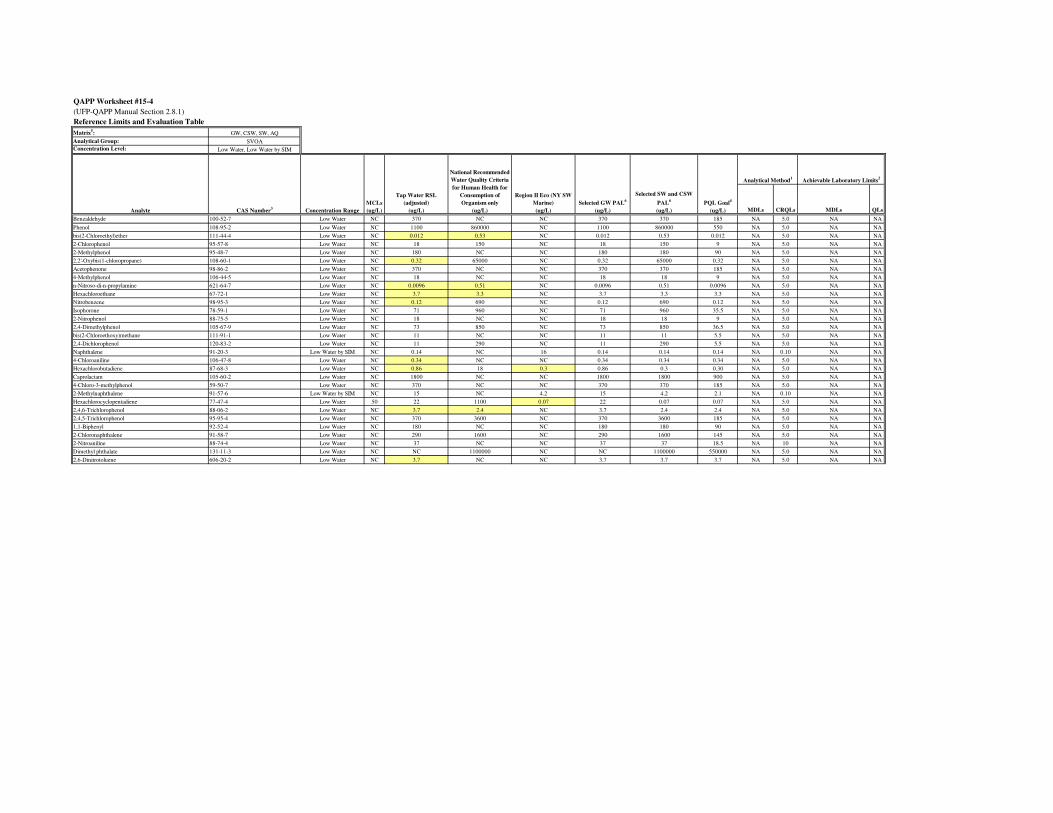
QAPP Worksheet #15-4
(UFP-QAPP Manual Section 2.8.1)
Reference Limits and Evaluation Table
Matrix5: GW, CSW, SW, AQ
Analytical Group: SVOA
Concentration Level: Low Water, Low Water by SIM
MDLs CRQLs MDLs QLs
Benzaldehyde 100-52-7 Low Water NC 370 NC NC 370 370 185 NA 5.0 NA NA
Phenol 108-95-2 Low Water NC 1100 860000 NC 1100 860000 550 NA 5.0 NA NA
bis(2-Chloroethyl)ether 111-44-4 Low Water NC 0.012 0.53 NC 0.012 0.53 0.012 NA 5.0 NA NA
2-Chlorophenol 95-57-8 Low Water NC 18 150 NC 18 150 9 NA 5.0 NA NA
2-Methylphenol 95-48-7 Low Water NC 180 NC NC 180 180 90 NA 5.0 NA NA
2,2'-Oxybis(1-chloropropane) 108-60-1 Low Water NC 0.32 65000 NC 0.32 65000 0.32 NA 5.0 NA NA
Acetophenone 98-86-2 Low Water NC 370 NC NC 370 370 185 NA 5.0 NA NA
4-Methylphenol 106-44-5 Low Water NC 18 NC NC 18 18 9 NA 5.0 NA NA
n-Nitroso-di-n-propylamine 621-64-7 Low Water NC 0.0096 0.51 NC 0.0096 0.51 0.0096 NA 5.0 NA NA
Hexachloroethane 67-72-1 Low Water NC 3.7 3.3 NC 3.7 3.3 3.3 NA 5.0 NA NA
Nitrobenzene 98-95-3 Low Water NC 0.12 690 NC 0.12 690 0.12 NA 5.0 NA NA
Isophorone 78-59-1 Low Water NC 71 960 NC 71 960 35.5 NA 5.0 NA NA
2-Nitrophenol 88-75-5 Low Water NC 18 NC NC 18 18 9 NA 5.0 NA NA
2,4-Dimethylphenol 105-67-9 Low Water NC 73 850 NC 73 850 36.5 NA 5.0 NA NA
bis(2-Chloroethoxy)methane 111-91-1 Low Water NC 11 NC NC 11 11 5.5 NA 5.0 NA NA
2,4-Dichlorophenol 120-83-2 Low Water NC 11 290 NC 11 290 5.5 NA 5.0 NA NA
Naphthalene 91-20-3 Low Water by SIM NC 0.14 NC 16 0.14 0.14 0.14 NA 0.10 NA NA
4-Chloroaniline 106-47-8 Low Water NC 0.34 NC NC 0.34 0.34 0.34 NA 5.0 NA NA
Hexachlorobutadiene 87-68-3 Low Water NC 0.86 18 0.3 0.86 0.3 0.30 NA 5.0 NA NA
Caprolactam 105-60-2 Low Water NC 1800 NC NC 1800 1800 900 NA 5.0 NA NA
4-Chloro-3-methylphenol 59-50-7 Low Water NC 370 NC NC 370 370 185 NA 5.0 NA NA
2-Methylnaphthalene 91-57-6 Low Water by SIM NC 15 NC 4.2 15 4.2 2.1 NA 0.10 NA NA
Hexachlorocyclopentadiene 77-47-4 Low Water 50 22 1100 0.07 22 0.07 0.07 NA 5.0 NA NA
2,4,6-Trichlorophenol 88-06-2 Low Water NC 3.7 2.4 NC 3.7 2.4 2.4 NA 5.0 NA NA
2,4,5-Trichlorophenol 95-95-4 Low Water NC 370 3600 NC 370 3600 185 NA 5.0 NA NA
1,1-Biphenyl 92-52-4 Low Water NC 180 NC NC 180 180 90 NA 5.0 NA NA
2-Chloronaphthalene 91-58-7 Low Water NC 290 1600 NC 290 1600 145 NA 5.0 NA NA
2-Nitroaniline 88-74-4 Low Water NC 37 NC NC 37 37 18.5 NA 10 NA NA
Dimethyl phthalate 131-11-3 Low Water NC NC 1100000 NC NC 1100000 550000 NA 5.0 NA NA
2,6-Dinitrotoluene 606-20-2 Low Water NC 3.7 NC NC 3.7 3.7 3.7 NA 5.0 NA NA
Selected SW and CSW
PAL6
(ug/L)
PQL Goal4
(ug/L)
MCLs
(ug/L)
Tap Water RSL
(adjusted)
(ug/L)
National Recommended
Water Quality Criteria
for Human Health for
Consumption of
Organism only
(ug/L)
Region II Eco (NY SW
Marine)
(ug/L)
Analytical Method1
Achievable Laboratory Limits2
Analyte CAS Number3
Concentration Range
Selected GW PAL6
(ug/L)

Matrix5: GW, CSW, SW, AQ
Analytical Group: SVOA
Concentration Level: Low Water, Low Water by SIM
MDLs CRQLs MDLs QLs
Selected SW and CSW
PAL6
(ug/L)
PQL Goal4
(ug/L)
MCLs
(ug/L)
Tap Water RSL
(adjusted)
(ug/L)
National Recommended
Water Quality Criteria
for Human Health for
Consumption of
Organism only
(ug/L)
Region II Eco (NY SW
Marine)
(ug/L)
Analytical Method1
Achievable Laboratory Limits2
Analyte CAS Number3
Concentration Range
Selected GW PAL6
(ug/L)
Acenaphthylene 208-96-8 Low Water by SIM NC 220 NC NC 220 220 110 NA 0.10 NA NA
3-Nitroaniline 99-09-2 Low Water NC NC NC NC NC NC 10 NA 10 NA NA
Acenaphthene 83-32-9 Low Water by SIM NC 220 990 6.6 220 6.6 3.3 NA 0.10 NA NA
2,4-Dinitrophenol 51-28-5 Low Water NC 7.3 5300 NC 7.3 5300 7.3 NA 10 NA NA
4-Nitrophenol 100-02-7 Low Water NC 0.12 NC NC 0.12 0.12 0.12 NA 10 NA NA
Dibenzofuran 132-64-9 Low Water NC 3.7 NC NC 3.7 3.7 3.7 NA 5.0 NA NA
2,4-Dinitrotoluene 121-14-2 Low Water NC 0.22 3.4 NC 0.22 3.4 0.22 NA 5.0 NA NA
Diethylphthalate 84-66-2 Low Water NC 2900 44000 NC 2900 44000 1450 NA 5.0 NA NA
Fluorene 86-73-7 Low Water by SIM NC 150 5300 2.5 150 2.5 1.25 NA 0.10 NA NA
4-Chlorophenyl-phenylether 7005-72-3 Low Water NC 18 NC NC 18 18 9 NA 5.0 NA NA
4-Nitroaniline 100-01-6 Low Water NC 3.4 NC NC 3.4 3.4 3.4 NA 10 NA NA
4,6-Dinitro-2-methylphenol 534-52-1 Low Water NC 0.37 280 NC 0.37 280 0.37 NA 10 NA NA
n-Nitrosodiphenylamine 86-30-6 Low Water NC 14 6 NC 14 6 6.0 NA 5.0 NA NA
1,2,4,5-Tetrachlorobenzene 95-94-3 Low Water NC 1.1 1.1 NC 1.1 1.1 1.1 NA 5.0 NA NA
4-Bromophenyl-phenylether 101-55-3 Low Water NC NC NC NC NC NC 5.0 NA 5.0 NA NA
Hexachlorobenzene 118-74-1 Low Water 1 0.042 0.00029 NC 0.042 0.00029 0.00029 NA 5.0 NA NA
Atrazine 1912-24-9 Low Water 3 0.29 NC NC 0.29 0.29 0.29 NA 5.0 NA NA
Pentachlorophenol 87-86-5 Low Water by SIM 1 0.56 3 7.9 0.56 3 0.28 NA 0.20 NA NA
Phenanthrene 85-01-8 Low Water by SIM NC 1100 NC 1.5 1100 1.5 0.75 NA 0.10 NA NA
Anthracene 120-12-7 Low Water by SIM NC 1100 40000 NC 1100 40000 550 NA 0.10 NA NA
Carbazole 86-74-8 Low Water NC NC NC NC NC NC 5.0 NA 5.0 NA NA
Di-n-butylphthalate 84-74-2 Low Water NC 370 4500 NC 370 4500 185 NA 5.0 NA NA
Fluoranthene 206-44-0 Low Water by SIM NC 150 140 NC 150 140 70 NA 0.10 NA NA
Pyrene 129-00-0 Low Water by SIM NC 110 4000 NC 110 4000 55 NA 0.10 NA NA
Butylbenzylphthalate 85-68-7 Low Water NC 35 1900 NC 35 1900 17.5 NA 5.0 NA NA
3,3'-Dichlorobenzidine 91-94-1 Low Water NC 0.15 0.028 NC 0.15 0.028 0.028 NA 5.0 NA NA
Benzo(a)anthracene 56-55-3 Low Water by SIM NC 0.03 0.018 NC 0.030 0.018 0.018 NA 0.10 NA NA
Chrysene 218-01-9 Low Water by SIM NC 3 0.018 NC 3.0 0.018 0.018 NA 0.10 NA NA
bis(2-Ethylhexyl)phthalate 117-81-7 Low Water 6 4.8 2.2 NC 4.8 2.2 2.2 NA 5.0 NA NA
Di-n-octylphthalate 117-84-0 Low Water NC 4.8 NC NC 4.8 4.8 4.8 NA 5.0 NA NA
Benzo(b)fluoranthene 205-99-2 Low Water by SIM NC 0.03 0.018 NC 0.030 0.018 0.018 NA 0.10 NA NA
Benzo(k)fluoranthene 207-08-9 Low Water by SIM NC 0.3 0.018 NC 0.30 0.018 0.018 NA 0.10 NA NA
Benzo(a)pyrene 50-32-8 Low Water by SIM 0.2 0.003 0.018 NC 0.0030 0.018 0.0030 NA 0.10 NA NA
Indeno(1,2,3-cd)pyrene 193-39-5 Low Water by SIM NC 0.03 0.018 NC 0.030 0.018 0.018 NA 0.10 NA NA
Dibenz(a,h)anthracene 53-70-3 Low Water by SIM NC 0.003 0.018 NC 0.0030 0.018 0.0030 NA 0.10 NA NA
Benzo(g,h,i)perylene 191-24-2 Low Water by SIM NC 110 NC NC 110 110 55 NA 0.10 NA NA
2,3,4,6-Tetrachlorophenol 58-90-2 Low Water NC 110 NC NC 110 110 55 NA 5.0 NA NA
Shading indicates PALs for which the PAL < CRQL.
NC: No screening level. For NY SW Marine, additional screening levels may be assigned upon estabilshment of a prioritization scheme.4The PQL Goal is 1/2 the lowest PAL, the lowest PAL, or the CRQL, as applicable.
5GW = Groundwater (Low Water, Low Water by SIM); CSW = CSO Surface Water (Low Water, Low Water by SIM); SW = Surface Water (Low Water, Low Water by SIM); AQ = Aqueous (Low Water or Low Water, Low Water by SIM). Aqueous blanks will be analyzed via the same concentration range as the
samples they are associated with.
6The selected GW PAL is the lesser of MCLs or Tap Water RSLs (adjusted). The selected SW and CSW PAL is the lesser of Region II Eco (NY SW Marine) or [Tap Water RSLs (adjusted) if no 'National Recommended Water Quality Criteria for Human Health for Consumption of Organism only' limit].
1Analytical MDLs and QLs are those documented in validated methods. EPA CLP SOM01.2 provides a CRQL but not an MDL. Units are the same as in the PQL column.
2Achievable MDLs and QLs are limits that an individual laboratory can achieve when performing a specific analytical method. QLs and MDLs are specific to the CLP laboratory that provides the analysis. Units are the same as in the PQL column.
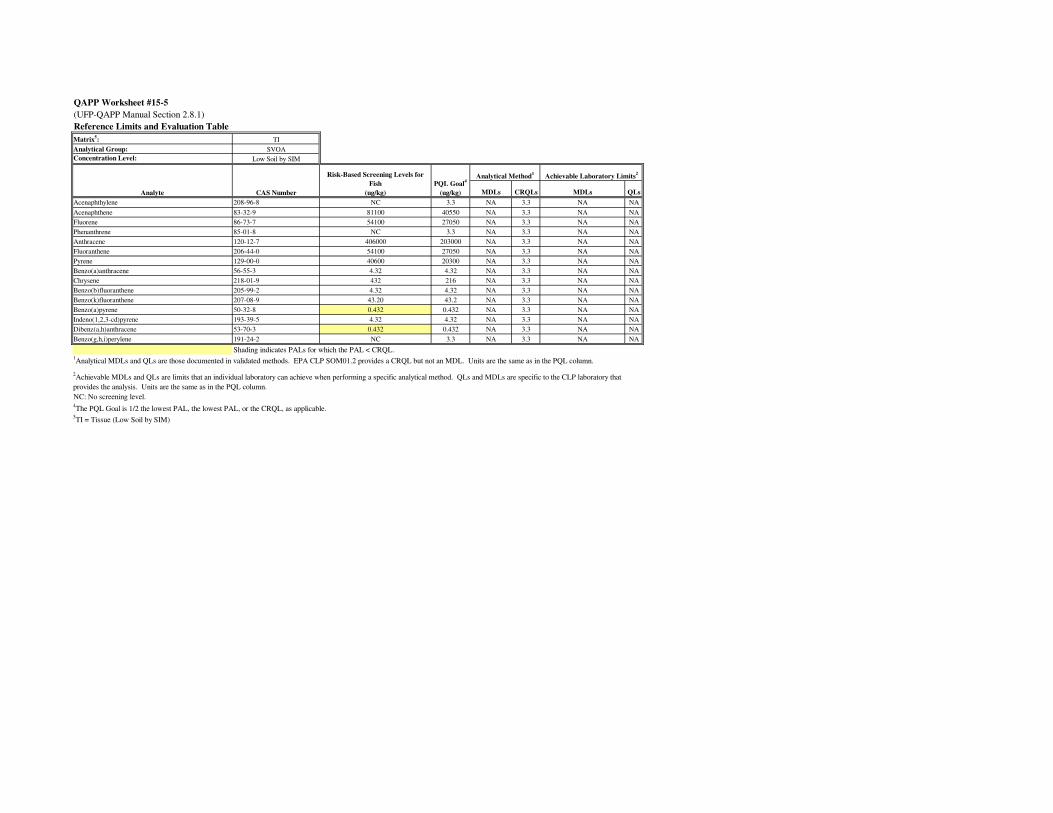
QAPP Worksheet #15-5
(UFP-QAPP Manual Section 2.8.1)
Reference Limits and Evaluation Table
Matrix5: TI
Analytical Group: SVOA
Concentration Level: Low Soil by SIM
MDLs CRQLs MDLs QLs
Acenaphthylene 208-96-8 NC 3.3 NA 3.3 NA NA
Acenaphthene 83-32-9 81100 40550 NA 3.3 NA NA
Fluorene 86-73-7 54100 27050 NA 3.3 NA NA
Phenanthrene 85-01-8 NC 3.3 NA 3.3 NA NA
Anthracene 120-12-7 406000 203000 NA 3.3 NA NA
Fluoranthene 206-44-0 54100 27050 NA 3.3 NA NA
Pyrene 129-00-0 40600 20300 NA 3.3 NA NA
Benzo(a)anthracene 56-55-3 4.32 4.32 NA 3.3 NA NA
Chrysene 218-01-9 432 216 NA 3.3 NA NA
Benzo(b)fluoranthene 205-99-2 4.32 4.32 NA 3.3 NA NA
Benzo(k)fluoranthene 207-08-9 43.20 43.2 NA 3.3 NA NA
Benzo(a)pyrene 50-32-8 0.432 0.432 NA 3.3 NA NA
Indeno(1,2,3-cd)pyrene 193-39-5 4.32 4.32 NA 3.3 NA NA
Dibenz(a,h)anthracene 53-70-3 0.432 0.432 NA 3.3 NA NA
Benzo(g,h,i)perylene 191-24-2 NC 3.3 NA 3.3 NA NA
Shading indicates PALs for which the PAL < CRQL.
NC: No screening level.
Risk-Based Screening Levels for
Fish
(ug/kg)
PQL Goal4
(ug/kg)
5TI = Tissue (Low Soil by SIM)
Analytical Method1
Achievable Laboratory Limits2
1Analytical MDLs and QLs are those documented in validated methods. EPA CLP SOM01.2 provides a CRQL but not an MDL. Units are the same as in the PQL column.
2Achievable MDLs and QLs are limits that an individual laboratory can achieve when performing a specific analytical method. QLs and MDLs are specific to the CLP laboratory that
provides the analysis. Units are the same as in the PQL column.
4The PQL Goal is 1/2 the lowest PAL, the lowest PAL, or the CRQL, as applicable.
Analyte CAS Number

QAPP Worksheet #15-6
(UFP-QAPP Manual Section 2.8.1)
Reference Limits and Evaluation Table
Matrix5: SD, CSD, SB
Analytical Group: PEST
Concentration Level: Soil
MDLs CRQLs MDLs QLs
alpha-BHC 319-84-6 77 30 15 NA 1.7 NA NA
beta-BHC 319-85-7 270 30 15 NA 1.7 NA NA
delta-BHC 319-86-8 270 30 15 NA 1.7 NA NA
gamma-BHC (Lindane) 58-89-9 520 30 15 NA 1.7 NA NA
Heptachlor 76-44-8 110 90 45 NA 1.7 NA NA
Aldrin 309-00-2 29 NC 15 NA 1.7 NA NA
Heptachlor epoxide 1024-57-3 53 90 27 NA 1.7 NA NA
Endosulfan I 959-98-8 37000 4 2 NA 1.7 NA NA
Dieldrin 60-57-1 30 17000 15 NA 3.3 NA NA
4,4'-DDE 72-55-9 1400 2.2 2.2 NA 3.3 NA NA
Endrin 72-20-8 1800 730 365 NA 3.3 NA NA
Endosulfan II 33213-65-9 37000 4 4 NA 3.3 NA NA
4,4'-DDD 72-54-8 2000 1.58 1.58 NA 3.3 NA NA
Endosulfan sulfate 1031-07-8 37000 4 4 NA 3.3 NA NA
4,4'-DDT 50-29-3 1700 1.58 1.58 NA 3.3 NA NA
Methoxychlor 72-43-5 31000 600 300 NA 17 NA NA
Endrin ketone 53494-70-5 1800 730 365 NA 3.3 NA NA
Endrin aldehyde 7421-93-4 1800 730 365 NA 3.3 NA NA
alpha-Chlordane 5103-71-9 1600 2 2 NA 1.7 NA NA
gamma-Chlordane 5103-74-2 1600 2 2 NA 1.7 NA NA
Toxaphene 8001-35-2 440 10 10 NA 170 NA NA
Shading indicates PALs for which the PAL < CRQL.
NC: No screening level. For NY SED Marine, additional screening levels may be assigned upon estabilshment of a prioritization scheme.
5SD = Sediment (Soil); CSD = CSO Sediment (Soil); SB = Subsurface Soil (Soil)
4The PQL Goal is 1/2 the lowest PAL, the lowest PAL, or the CRQL, as applicable.
3"BHC" screening level used as a surrogate for alpha-, beta-, delta-, and gamma-BHC (Lindane). "Chlordane" screening level used as a surrogate for alpha- and gamma-Chlordane. "DDT, Total" used as a
surrogate for 4,4'-DDD. "Endosulfan (alpha and beta)" screening level used as a surrogate for Endosulfan Sulfate. "Endrin" screening level used as a surrogate for Endrin Ketone and Endrin Aldehyde.
PQL Goal4
(ug/kg)
2Achievable MDLs and QLs are limits that an individual laboratory can achieve when performing a specific analytical method. QLs and MDLs are specific to the CLP laboratory that provides the analysis.
Units are the same as in the PQL column.
1Analytical MDLs and QLs are those documented in validated methods. EPA CLP SOM01.2 provides a CRQL but not an MDL. Units are the same as in the PQL column.
Achievable Laboratory Limits2
Analytical Method1
CAS NumberAnalyte
For SB, SD, and CSD
Residential Soil RSL (adjusted)
(ug/kg)
For SD and CSD
Region II Eco (NY SED Marine)3
(ug/kg)
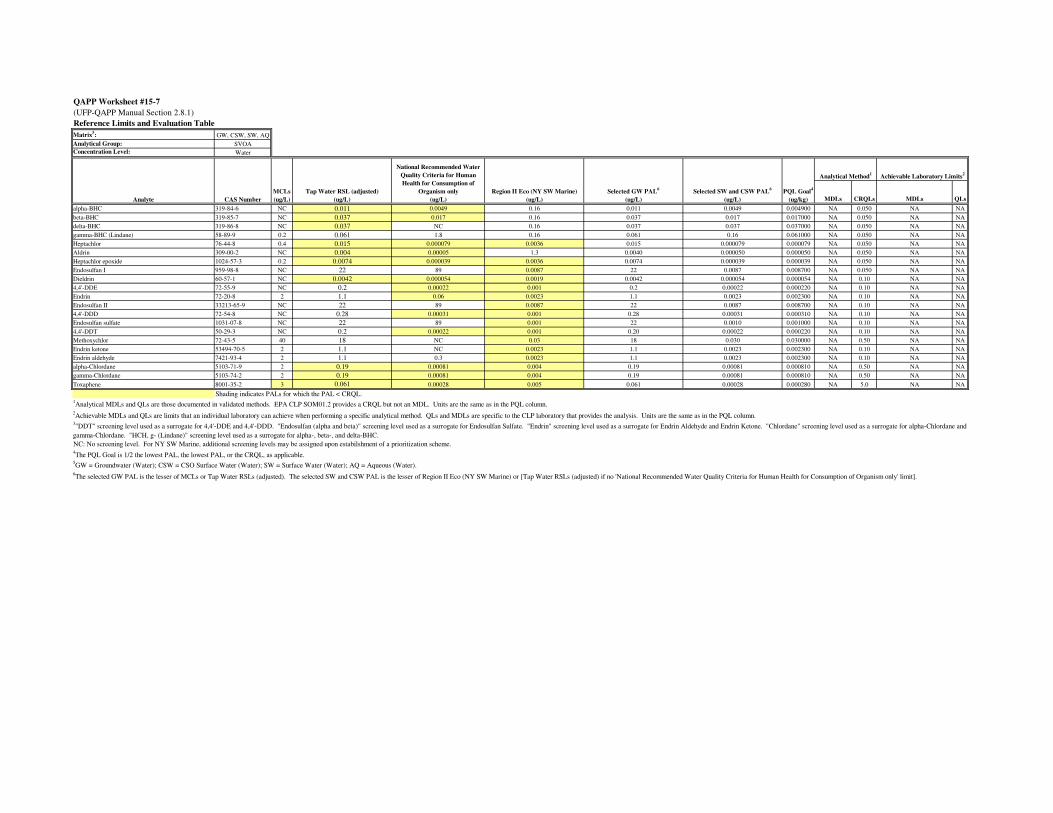
QAPP Worksheet #15-7
(UFP-QAPP Manual Section 2.8.1)
Reference Limits and Evaluation Table
Matrix5: GW, CSW, SW, AQ
Analytical Group: SVOA
Concentration Level: Water
MDLs CRQLs MDLs QLs
alpha-BHC 319-84-6 NC 0.011 0.0049 0.16 0.011 0.0049 0.004900 NA 0.050 NA NA
beta-BHC 319-85-7 NC 0.037 0.017 0.16 0.037 0.017 0.017000 NA 0.050 NA NA
delta-BHC 319-86-8 NC 0.037 NC 0.16 0.037 0.037 0.037000 NA 0.050 NA NA
gamma-BHC (Lindane) 58-89-9 0.2 0.061 1.8 0.16 0.061 0.16 0.061000 NA 0.050 NA NA
Heptachlor 76-44-8 0.4 0.015 0.000079 0.0036 0.015 0.000079 0.000079 NA 0.050 NA NA
Aldrin 309-00-2 NC 0.004 0.00005 1.3 0.0040 0.000050 0.000050 NA 0.050 NA NA
Heptachlor epoxide 1024-57-3 0.2 0.0074 0.000039 0.0036 0.0074 0.000039 0.000039 NA 0.050 NA NA
Endosulfan I 959-98-8 NC 22 89 0.0087 22 0.0087 0.008700 NA 0.050 NA NA
Dieldrin 60-57-1 NC 0.0042 0.000054 0.0019 0.0042 0.000054 0.000054 NA 0.10 NA NA
4,4'-DDE 72-55-9 NC 0.2 0.00022 0.001 0.2 0.00022 0.000220 NA 0.10 NA NA
Endrin 72-20-8 2 1.1 0.06 0.0023 1.1 0.0023 0.002300 NA 0.10 NA NA
Endosulfan II 33213-65-9 NC 22 89 0.0087 22 0.0087 0.008700 NA 0.10 NA NA
4,4'-DDD 72-54-8 NC 0.28 0.00031 0.001 0.28 0.00031 0.000310 NA 0.10 NA NA
Endosulfan sulfate 1031-07-8 NC 22 89 0.001 22 0.0010 0.001000 NA 0.10 NA NA
4,4'-DDT 50-29-3 NC 0.2 0.00022 0.001 0.20 0.00022 0.000220 NA 0.10 NA NA
Methoxychlor 72-43-5 40 18 NC 0.03 18 0.030 0.030000 NA 0.50 NA NA
Endrin ketone 53494-70-5 2 1.1 NC 0.0023 1.1 0.0023 0.002300 NA 0.10 NA NA
Endrin aldehyde 7421-93-4 2 1.1 0.3 0.0023 1.1 0.0023 0.002300 NA 0.10 NA NA
alpha-Chlordane 5103-71-9 2 0.19 0.00081 0.004 0.19 0.00081 0.000810 NA 0.50 NA NA
gamma-Chlordane 5103-74-2 2 0.19 0.00081 0.004 0.19 0.00081 0.000810 NA 0.50 NA NA
Toxaphene 8001-35-2 3 0.061 0.00028 0.005 0.061 0.00028 0.000280 NA 5.0 NA NA
Shading indicates PALs for which the PAL < CRQL.
NC: No screening level. For NY SW Marine, additional screening levels may be assigned upon estabilshment of a prioritization scheme.
5GW = Groundwater (Water); CSW = CSO Surface Water (Water); SW = Surface Water (Water); AQ = Aqueous (Water).
6The selected GW PAL is the lesser of MCLs or Tap Water RSLs (adjusted). The selected SW and CSW PAL is the lesser of Region II Eco (NY SW Marine) or [Tap Water RSLs (adjusted) if no 'National Recommended Water Quality Criteria for Human Health for Consumption of Organism only' limit].
Achievable Laboratory Limits2
1Analytical MDLs and QLs are those documented in validated methods. EPA CLP SOM01.2 provides a CRQL but not an MDL. Units are the same as in the PQL column.
2Achievable MDLs and QLs are limits that an individual laboratory can achieve when performing a specific analytical method. QLs and MDLs are specific to the CLP laboratory that provides the analysis. Units are the same as in the PQL column.
3"DDT" screening level used as a surrogate for 4,4'-DDE and 4,4'-DDD. "Endosulfan (alpha and beta)" screening level used as a surrogate for Endosulfan Sulfate. "Endrin" screening level used as a surrogate for Endrin Aldehyde and Endrin Ketone. "Chlordane" screening level used as a surrogate for alpha-Chlordane and
gamma-Chlordane. "HCH, g- (Lindane)" screening level used as a surrogate for alpha-, beta-, and delta-BHC.
4The PQL Goal is 1/2 the lowest PAL, the lowest PAL, or the CRQL, as applicable.
Tap Water RSL (adjusted)
(ug/L)
National Recommended Water
Quality Criteria for Human
Health for Consumption of
Organism only
(ug/L)
Region II Eco (NY SW Marine)
(ug/L)
Analytical Method1
Selected GW PAL6
(ug/L)Analyte CAS Number
MCLs
(ug/L)
Selected SW and CSW PAL6
(ug/L)
PQL Goal4
(ug/kg)
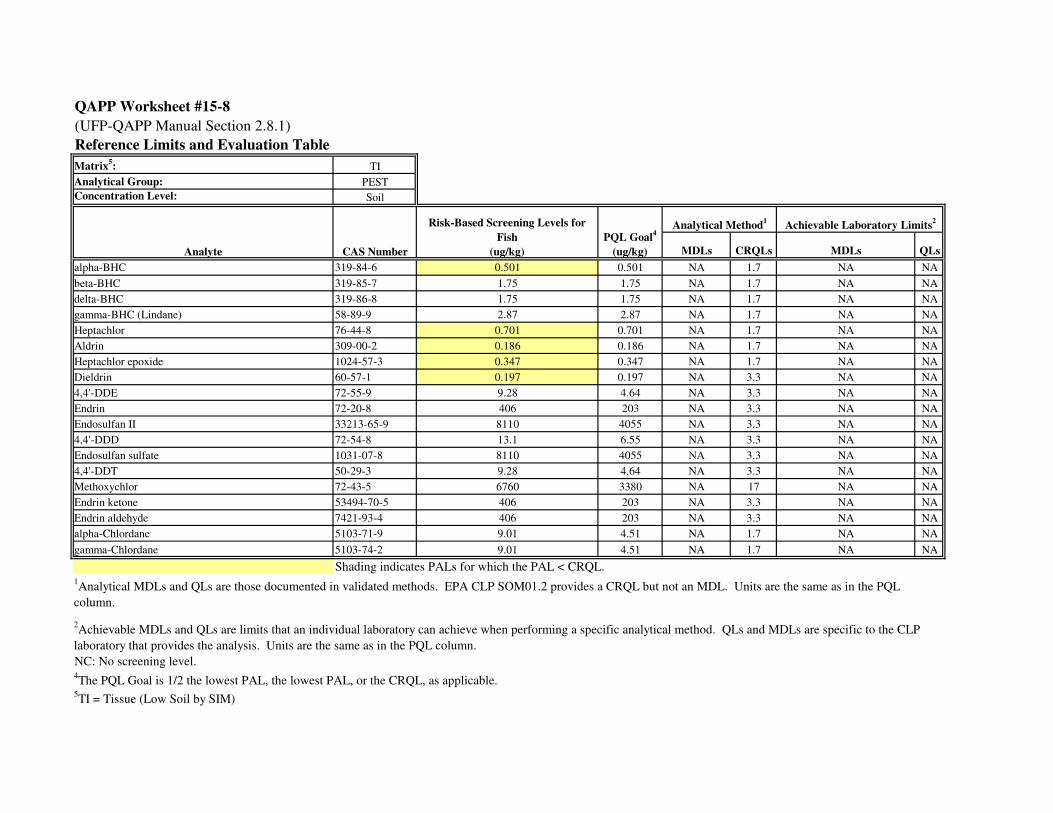
QAPP Worksheet #15-8
(UFP-QAPP Manual Section 2.8.1)
Reference Limits and Evaluation Table
Matrix5: TI
Analytical Group: PEST
Concentration Level: Soil
MDLs CRQLs MDLs QLs
alpha-BHC 319-84-6 0.501 0.501 NA 1.7 NA NA
beta-BHC 319-85-7 1.75 1.75 NA 1.7 NA NA
delta-BHC 319-86-8 1.75 1.75 NA 1.7 NA NA
gamma-BHC (Lindane) 58-89-9 2.87 2.87 NA 1.7 NA NA
Heptachlor 76-44-8 0.701 0.701 NA 1.7 NA NA
Aldrin 309-00-2 0.186 0.186 NA 1.7 NA NA
Heptachlor epoxide 1024-57-3 0.347 0.347 NA 1.7 NA NA
Dieldrin 60-57-1 0.197 0.197 NA 3.3 NA NA
4,4'-DDE 72-55-9 9.28 4.64 NA 3.3 NA NA
Endrin 72-20-8 406 203 NA 3.3 NA NA
Endosulfan II 33213-65-9 8110 4055 NA 3.3 NA NA
4,4'-DDD 72-54-8 13.1 6.55 NA 3.3 NA NA
Endosulfan sulfate 1031-07-8 8110 4055 NA 3.3 NA NA
4,4'-DDT 50-29-3 9.28 4.64 NA 3.3 NA NA
Methoxychlor 72-43-5 6760 3380 NA 17 NA NA
Endrin ketone 53494-70-5 406 203 NA 3.3 NA NA
Endrin aldehyde 7421-93-4 406 203 NA 3.3 NA NA
alpha-Chlordane 5103-71-9 9.01 4.51 NA 1.7 NA NA
gamma-Chlordane 5103-74-2 9.01 4.51 NA 1.7 NA NA
Shading indicates PALs for which the PAL < CRQL.
NC: No screening level.
Achievable Laboratory Limits2
1Analytical MDLs and QLs are those documented in validated methods. EPA CLP SOM01.2 provides a CRQL but not an MDL. Units are the same as in the PQL
column.
2Achievable MDLs and QLs are limits that an individual laboratory can achieve when performing a specific analytical method. QLs and MDLs are specific to the CLP
laboratory that provides the analysis. Units are the same as in the PQL column.
4The PQL Goal is 1/2 the lowest PAL, the lowest PAL, or the CRQL, as applicable.
5TI = Tissue (Low Soil by SIM)
Analyte CAS Number
Risk-Based Screening Levels for
Fish
(ug/kg)
PQL Goal4
(ug/kg)
Analytical Method1

QAPP Worksheet #15-9
(UFP-QAPP Manual Section 2.8.1)
Reference Limits and Evaluation Table
Matrix5: SD, CSD, SB
Analytical Group: PCB
Concentration Level: Soil
MDLs CRQLs MDLs QLs
Aroclor-1016 12674-11-2 390 3.2 3.2 NA 33 NA NA
Aroclor-1221 11104-28-2 140 3.2 3.2 NA 33 NA NA
Aroclor-1232 11141-16-5 140 3.2 3.2 NA 33 NA NA
Aroclor-1242 53469-21-9 220 3.2 3.2 NA 33 NA NA
Aroclor-1248 12672-29-6 220 3.2 3.2 NA 33 NA NA
Aroclor-1254 11097-69-1 110 3.2 3.2 NA 33 NA NA
Aroclor-1260 11096-82-5 220 3.2 3.2 NA 33 NA NA
Aroclor-1262 37384-23-5 NC 3.2 3.2 NA 33 NA NA
Aroclor-1268 11100-14-4 NC 3.2 3.2 NA 33 NA NA
Shading indicates PALs for which the PAL < CRQL.
NC: No screening level. For NY SED Marine, additional screening levels may be assigned upon estabilshment of a prioritization scheme.
For SD and CSD
Region II Eco (NY SED Marine)3
(ug/kg)
4The PQL Goal is 1/2 the lowest PAL, the lowest PAL, or the CRQL, as applicable.
5SD = Sediment (Soil); CSD = CSO Sediment (Soil); SB = Subsurface Soil (Soil)
3"PCB's (total)" screening level, divided by nine, used as a surrogate for each Aroclor. This is only for purposes of calculating the PQL Goal.
2Achievable MDLs and QLs are limits that an individual laboratory can achieve when performing a specific analytical method. QLs and MDLs are specific to the CLP laboratory that provides the analysis. Units are
the same as in the PQL column.
1Analytical MDLs and QLs are those documented in validated methods. EPA CLP SOM01.2 provides a CRQL but not an MDL. Units are the same as in the PQL column.
Achievable Laboratory Limits2
Analytical Method1
CAS NumberAnalyte
PQL Goal4
(ug/kg)
For SB, SD, and CSD
Residential Soil RSL (adjusted)
(ug/kg)

QAPP Worksheet #15-10
(UFP-QAPP Manual Section 2.8.1)
Reference Limits and Evaluation Table
Matrix5: GW, CSW, SW, AQ
Analytical Group: PCB
Concentration Level: Water
MDLs CRQLs MDLs QLs
Aroclor-1016 12674-11-2 0.5 0.26 0.000064 0.0033 0.26 0.000064 0.000064 NA 1.0 NA NA
Aroclor-1221 11104-28-2 0.5 0.0068 0.000064 0.0033 0.0068 0.000064 0.000064 NA 1.0 NA NA
Aroclor-1232 11141-16-5 0.5 0.0068 0.000064 0.0033 0.0068 0.000064 0.000064 NA 1.0 NA NA
Aroclor-1242 53469-21-9 0.5 0.034 0.000064 0.0033 0.034 0.000064 0.000064 NA 1.0 NA NA
Aroclor-1248 12672-29-6 0.5 0.034 0.000064 0.0033 0.034 0.000064 0.000064 NA 1.0 NA NA
Aroclor-1254 11097-69-1 0.5 0.034 0.000064 0.0033 0.034 0.000064 0.000064 NA 1.0 NA NA
Aroclor-1260 11096-82-5 0.5 0.034 0.000064 0.0033 0.034 0.000064 0.000064 NA 1.0 NA NA
Aroclor-1262 37384-23-5 0.5 NC 0.000064 0.0033 0.50 0.000064 0.000064 NA 1.0 NA NA
Aroclor-1268 11100-14-4 0.5 NC 0.000064 0.0033 0.50 0.000064 0.000064 NA 1.0 NA NA
Shading indicates PALs for which the PAL < CRQL.
NC: No screening level. For NY SW Marine, additional screening levels may be assigned upon estabilshment of a prioritization scheme.
6The selected GW PAL is the lesser of MCLs or Tap Water RSLs (adjusted). The selected SW and CSW PAL is the lesser of Region II Eco (NY SW Marine) or [Tap Water RSLs (adjusted) if no 'National Recommended Water Quality Criteria for Human Health for Consumption of Organism only' limit].
Tap Water RSL (adjusted)
(ug/L)
National Recommended Water
Quality Criteria for Human Health
for Consumption of Organism only
(ug/L)
Region II Eco (NY SW Marine)
(ug/L)
Selected GW PAL6
(ug/L)
Achievable Laboratory Limits2
1Analytical MDLs and QLs are those documented in validated methods. EPA CLP SOM01.2 provides a CRQL but not an MDL. Units are the same as in the PQL column.
2Achievable MDLs and QLs are limits that an individual laboratory can achieve when performing a specific analytical method. QLs and MDLs are specific to the CLP laboratory that provides the analysis. Units are the same as in the PQL column.
3"PCB's (total)" screening level, divided by nine, used as a surrogate for each Aroclor. This is only for purposes of calculating the PQL Goal.
4The PQL Goal is 1/2 the lowest PAL, the lowest PAL, or the CRQL, as applicable.
5GW = Groundwater (Water); CSW = CSO Surface Water (Water); SW = Surface Water (Water); AQ = Aqueous (Water).
Analyte CAS Number
MCLs
(ug/L)
Selected SW and CSW PAL6
(ug/L)
PQL Goal4
(ug/kg)
Analytical Method1
QAPP Worksheet #15-11
(UFP-QAPP Manual Section 2.8.1)
Reference Limits and Evaluation Table
Matrix5: SD
Analytical Group: PCBCONG
Concentration Level: Other
MDLs CRQLs MDLs QLs
2-Chlorobiphenyl (1) 2051-60-7 NC NC 2.0 NA 2.0 NA NA
3-Chlorobiphenyl (2) 2051-61-8 NC NC 2.0 NA 2.0 NA NA
4-Chlorobiphenyl (3) 2051-62-9 NC NC 2.0 NA 2.0 NA NA
2,2'-Dichlorobiphenyl (4) 13029-08-8 NC NC 2.0 NA 2.0 NA NA
2,3-Dichlorobiphenyl (5) 16605-91-7 NC NC 2.0 NA 2.0 NA NA
2,3'-Dichlorobiphenyl (6) 25569-80-6 NC NC 2.0 NA 2.0 NA NA
2,4-Dichlorobiphenyl (7) 33284-50-3 NC NC 2.0 NA 2.0 NA NA
2,4'-Dichlorobiphenyl (8) 34883-43-7 NC NC 2.0 NA 2.0 NA NA
2,5-Dichlorobiphenyl (9) 34883-39-1 NC NC 2.0 NA 2.0 NA NA
2,6-Dichlorobiphenyl (10) 33146-45-1 NC NC 2.0 NA 2.0 NA NA
3,3'-Dichlorobiphenyl (11) 2050-67-1 NC NC 2.0 NA 2.0 NA NA
3,4-Dichlorobiphenyl (12) 2974-92-7 NC NC 2.0 NA 2.0 NA NA
3,4'-Dichlorobiphenyl (13) 2974-90-5 NC NC 2.0 NA 2.0 NA NA
3,5-Dichlorobiphenyl (14) 34883-41-5 NC NC 2.0 NA 2.0 NA NA
4,4'-Dichlorobiphenyl (15) 2050-68-2 NC NC 2.0 NA 2.0 NA NA
2,2',3-Trichlorobiphenyl (16) 38444-78-9 NC NC 2.0 NA 2.0 NA NA
2,2',4-Trichlorobiphenyl (17) 37680-66-3 NC NC 2.0 NA 2.0 NA NA
2,2',5-Trichlorobiphenyl (18) 37680-65-2 NC NC 2.0 NA 2.0 NA NA
2,2',6-Trichlorobiphenyl (19) 38444-73-4 NC NC 2.0 NA 2.0 NA NA
2,3,3'-Trichlorobiphenyl (20) 38444-84-7 NC NC 2.0 NA 2.0 NA NA
2,3,4-Trichlorobiphenyl (21) 55702-46-0 NC NC 2.0 NA 2.0 NA NA
2,3,4'-Trichlorobiphenyl (22) 38444-85-8 NC NC 2.0 NA 2.0 NA NA
2,3,5-Trichlorobiphenyl (23) 55720-44-0 NC NC 2.0 NA 2.0 NA NA
2,3,6-Trichlorobiphenyl (24) 55702-45-9 NC NC 2.0 NA 2.0 NA NA
2,3',4-Trichlorobiphenyl (25) 55712-37-3 NC NC 2.0 NA 2.0 NA NA
2,3',5-Trichlorobiphenyl (26) 38444-81-4 NC NC 2.0 NA 2.0 NA NA
2,3',6-Trichlorobiphenyl (27) 38444-76-7 NC NC 2.0 NA 2.0 NA NA
2,4,4'-Trichlorobiphenyl (28) 7012-37-5 NC NC 2.0 NA 2.0 NA NA
2,4,5-Trichlorobiphenyl (29) 15862-07-4 NC NC 2.0 NA 2.0 NA NA
2,4,6-Trichlorobiphenyl (30) 35693-92-6 NC NC 2.0 NA 2.0 NA NA
2,4',5-Trichlorobiphenyl (31) 16606-02-3 NC NC 2.0 NA 2.0 NA NA
2,4',6-Trichlorobiphenyl (32) 38444-77-8 NC NC 2.0 NA 2.0 NA NA
2,3',4'-Trichlorobiphenyl (33) 38444-86-9 NC NC 2.0 NA 2.0 NA NA
2,3',5'-Trichlorobiphenyl (34) 37680-68-5 NC NC 2.0 NA 2.0 NA NA
3,3',4-Trichlorobiphenyl (35) 37680-69-6 NC NC 2.0 NA 2.0 NA NA
3,3',5-Trichlorobiphenyl (36) 38444-87-0 NC NC 2.0 NA 2.0 NA NA
3,4,4'-Trichlorobiphenyl (37) 38444-90-5 NC NC 2.0 NA 2.0 NA NA
3,4,5-Trichlorobiphenyl (38) 53555-66-1 NC NC 2.0 NA 2.0 NA NA
3,4',5-Trichlorobiphenyl (39) 38444-88-1 NC NC 2.0 NA 2.0 NA NA
2,2',3,3'-Tetrachlorobiphenyl (40) 38444-93-8 NC NC 2.0 NA 2.0 NA NA
2,2',3,4-Tetrachlorobiphenyl (41) 52663-59-9 NC NC 2.0 NA 2.0 NA NA
2,2',3,4'-Tetrachlorobiphenyl (42) 36559-22-5 NC NC 2.0 NA 2.0 NA NA
2,2',3,5-Tetrachlorobiphenyl (43) 70362-46-8 NC NC 2.0 NA 2.0 NA NA
2,2',3,5'-Tetrachlorobiphenyl (44) 41464-39-5 NC NC 2.0 NA 2.0 NA NA
2,2',3,6-Tetrachlorobiphenyl (45) 70362-45-7 NC NC 2.0 NA 2.0 NA NA
2,2',3,6'-Tetrachlorobiphenyl (46) 41464-47-5 NC NC 2.0 NA 2.0 NA NA
2,2',4,4'-Tetrachlorobiphenyl (47) 2437-79-8 NC NC 2.0 NA 2.0 NA NA
2,2',4,5-Tetrachlorobiphenyl (48) 70362-47-9 NC NC 2.0 NA 2.0 NA NA
2,2',4,5'-Tetrachlorobiphenyl (49) 41464-40-8 NC NC 2.0 NA 2.0 NA NA
2,2',4,6-Tetrachlorobiphenyl (50) 62796-65-0 NC NC 2.0 NA 2.0 NA NA
2,2',4,6'-Tetrachlorobiphenyl (51) 68194-04-7 NC NC 2.0 NA 2.0 NA NA
2,2',5,5'-Tetrachlorobiphenyl (52) 35693-99-3 NC NC 2.0 NA 2.0 NA NA
2,2',5,6'-Tetrachlorobiphenyl (53) 41464-41-9 NC NC 2.0 NA 2.0 NA NA
Analytical Method1
Achievable Laboratory Limits2
Analyte6
CAS Number
For SB, SD, and CSD
Residential Soil RSL (adjusted)
(ng/kg)
For SD and CSD
Region II Eco (NY SED Marine)
(ng/kg)
PQL Goal4
(ng/kg)

Matrix5: SD
Analytical Group: PCBCONG
Concentration Level: Other
MDLs CRQLs MDLs QLs
Analytical Method1
Achievable Laboratory Limits2
Analyte6
CAS Number
For SB, SD, and CSD
Residential Soil RSL (adjusted)
(ng/kg)
For SD and CSD
Region II Eco (NY SED Marine)
(ng/kg)
PQL Goal4
(ng/kg)
2,2',6,6'-Tetrachlorobiphenyl (54) 15968-05-5 NC NC 2.0 NA 2.0 NA NA
2,3,3',4-Tetrachlorobiphenyl (55) 74338-24-2 NC NC 2.0 NA 2.0 NA NA
2,3,3',4'-Tetrachlorobiphenyl (56) 41464-43-1 NC NC 2.0 NA 2.0 NA NA
2,3,3',5-Tetrachlorobiphenyl (57) 70424-67-8 NC NC 2.0 NA 2.0 NA NA
2,3,3',5'-Tetrachlorobiphenyl (58) 41464-49-7 NC NC 2.0 NA 2.0 NA NA
2,3,3',6-Tetrachlorobiphenyl (59) 74472-33-6 NC NC 2.0 NA 2.0 NA NA
2,3,4,4'-Tetrachlorobiphenyl (60) 33025-41-1 NC NC 2.0 NA 2.0 NA NA
2,3,4,5-Tetrachlorobiphenyl (61) 33284-53-6 NC NC 2.0 NA 2.0 NA NA
2,3,4,6-Tetrachlorobiphenyl (62) 54230-22-7 NC NC 2.0 NA 2.0 NA NA
2,3,4',5-Tetrachlorobiphenyl (63) 74472-34-7 NC NC 2.0 NA 2.0 NA NA
2,3,4',6-Tetrachlorobiphenyl (64) 52663-58-8 NC NC 2.0 NA 2.0 NA NA
2,3,5,6-Tetrachlorobiphenyl (65) 33284-54-7 NC NC 2.0 NA 2.0 NA NA
2,3',4,4'-Tetrachlorobiphenyl (66) 32598-10-0 NC NC 2.0 NA 2.0 NA NA
2,3',4,5-Tetrachlorobiphenyl (67) 73575-53-8 NC NC 2.0 NA 2.0 NA NA
2,3',4,5'-Tetrachlorobiphenyl (68) 73575-52-7 NC NC 2.0 NA 2.0 NA NA
2,3',4,6-Tetrachlorobiphenyl (69) 60233-24-1 NC NC 2.0 NA 2.0 NA NA
2,3',4',5-Tetrachlorobiphenyl (70) 32598-11-1 NC NC 2.0 NA 2.0 NA NA
2,3',4',6-Tetrachlorobiphenyl (71) 41464-46-4 NC NC 2.0 NA 2.0 NA NA
2,3',5,5'-Tetrachlorobiphenyl (72) 41464-42-0 NC NC 2.0 NA 2.0 NA NA
2,3',5',6-Tetrachlorobiphenyl (73) 74338-23-1 NC NC 2.0 NA 2.0 NA NA
2,4,4',5-Tetrachlorobiphenyl (74) 32690-93-0 NC NC 2.0 NA 2.0 NA NA
2,4,4',6-Tetrachlorobiphenyl (75) 32598-12-2 NC NC 2.0 NA 2.0 NA NA
2,3',4',5'-Tetrachlorobiphenyl (76) 70362-48-0 NC NC 2.0 NA 2.0 NA NA
3,3',4,4'-Tetrachlorobiphenyl (77) 32598-13-3 34000 NC 17000 NA 2.0 NA NA
3,3',4,5-Tetrachlorobiphenyl (78) 70362-49-1 NC NC 2.0 NA 2.0 NA NA
3,3',4,5'-Tetrachlorobiphenyl (79) 41464-48-6 NC NC 2.0 NA 2.0 NA NA
3,3',5,5'-Tetrachlorobiphenyl (80) 33284-52-5 NC NC 2.0 NA 2.0 NA NA
3,4,4',5-Tetrachlorobiphenyl (81) 70362-50-4 34000 NC 17000 NA 2.0 NA NA
2,2',3,3',4-Pentachlorobiphenyl (82) 52663-62-4 NC NC 2.0 NA 2.0 NA NA
2,2',3,3',5-Pentachlorobiphenyl (83) 60145-20-2 NC NC 2.0 NA 2.0 NA NA
2,2',3,3',6-Pentachlorobiphenyl (84) 52663-60-2 NC NC 2.0 NA 2.0 NA NA
2,2',3,4,4'-Pentachlorobiphenyl (85) 65510-45-4 NC NC 2.0 NA 2.0 NA NA
2,2',3,4,5-Pentachlorobiphenyl (86) 55312-69-1 NC NC 2.0 NA 2.0 NA NA
2,2',3,4,5'-Pentachlorobiphenyl (87) 38380-02-8 NC NC 2.0 NA 2.0 NA NA
2,2',3,4,6-Pentachlorobiphenyl (88) 55215-17-3 NC NC 2.0 NA 2.0 NA NA
2,2',3,4,6'-Pentachlorobiphenyl (89) 73575-57-2 NC NC 2.0 NA 2.0 NA NA
2,2',3,4',5-Pentachlorobiphenyl (90) 68194-07-0 NC NC 2.0 NA 2.0 NA NA
2,2',3,4',6-Pentachlorobiphenyl (91) 68194-05-8 NC NC 2.0 NA 2.0 NA NA
2,2',3,5,5'-Pentachlorobiphenyl (92) 52663-61-3 NC NC 2.0 NA 2.0 NA NA
2,2',3,5,6-Pentachlorobiphenyl (93) 73575-56-1 NC NC 2.0 NA 2.0 NA NA
2,2',3,5,6'-Pentachlorobiphenyl (94) 73575-55-0 NC NC 2.0 NA 2.0 NA NA
2,2',3,5',6-Pentachlorobiphenyl (95) 38379-99-6 NC NC 2.0 NA 2.0 NA NA
2,2',3,6,6'-Pentachlorobiphenyl (96) 73575-54-9 NC NC 2.0 NA 2.0 NA NA
2,2',3,4',5'-Pentachlorobiphenyl (97) 41464-51-1 NC NC 2.0 NA 2.0 NA NA
2,2',3,4',6'-Pentachlorobiphenyl (98) 60233-25-2 NC NC 2.0 NA 2.0 NA NA
2,2',4,4',5-Pentachlorobiphenyl (99) 38380-01-7 NC NC 2.0 NA 2.0 NA NA
2,2',4,4',6-Pentachlorobiphenyl (100) 39485-83-1 NC NC 2.0 NA 2.0 NA NA
2,2',4,5,5'-Pentachlorobiphenyl (101) 37680-73-2 NC NC 2.0 NA 2.0 NA NA
2,2',4,5,6'-Pentachlorobiphenyl (102) 68194-06-9 NC NC 2.0 NA 2.0 NA NA
2,2',4,5',6-Pentachlorobiphenyl (103) 60145-21-3 NC NC 2.0 NA 2.0 NA NA
2,2',4,6,6'-Pentachlorobiphenyl (104) 56558-16-8 NC NC 2.0 NA 2.0 NA NA
2,3,3',4,4'-Pentachlorobiphenyl (105) 32598-14-4 34000 NC 17000 NA 2.0 NA NA
2,3,3',4,5-Pentachlorobiphenyl (106) 70424-69-0 NC NC 2.0 NA 2.0 NA NA
2,3,3',4',5-Pentachlorobiphenyl (107) 70424-68-9 NC NC 2.0 NA 2.0 NA NA
2,3,3',4,5'-Pentachlorobiphenyl (108) 70362-41-3 NC NC 2.0 NA 2.0 NA NA
2,3,3',4,6-Pentachlorobiphenyl (109) 74472-35-8 NC NC 2.0 NA 2.0 NA NA
2,3,3',4',6-Pentachlorobiphenyl (110) 38380-03-9 NC NC 2.0 NA 2.0 NA NA
Matrix5: SD
Analytical Group: PCBCONG
Concentration Level: Other
MDLs CRQLs MDLs QLs
Analytical Method1
Achievable Laboratory Limits2
Analyte6
CAS Number
For SB, SD, and CSD
Residential Soil RSL (adjusted)
(ng/kg)
For SD and CSD
Region II Eco (NY SED Marine)
(ng/kg)
PQL Goal4
(ng/kg)
2,3,3',5,5'-Pentachlorobiphenyl (111) 39635-32-0 NC NC 2.0 NA 2.0 NA NA
2,3,3',5,6-Pentachlorobiphenyl (112) 74472-36-9 NC NC 2.0 NA 2.0 NA NA
2,3,3',5',6-Pentachlorobiphenyl (113) 68194-10-5 NC NC 2.0 NA 2.0 NA NA
2,3,4,4',5-Pentachlorobiphenyl (114) 74472-37-0 680 NC 340 NA 2.0 NA NA
2,3,4,4',6-Pentachlorobiphenyl (115) 74472-38-1 NC NC 2.0 NA 2.0 NA NA
2,3,4,5,6-Pentachlorobiphenyl (116) 18259-05-7 NC NC 2.0 NA 2.0 NA NA
2,3,4',5,6-Pentachlorobiphenyl (117) 68194-11-6 NC NC 2.0 NA 2.0 NA NA
2,3',4,4',5-Pentachlorobiphenyl (118) 31508-00-6 34000 NC 17000 NA 2.0 NA NA
2,3',4,4',6-Pentachlorobiphenyl (119) 56558-17-9 NC NC 2.0 NA 2.0 NA NA
2,3',4,5,5'-Pentachlorobiphenyl (120) 68194-12-7 NC NC 2.0 NA 2.0 NA NA
2,3',4,5',6-Pentachlorobiphenyl (121) 56558-18-0 NC NC 2.0 NA 2.0 NA NA
2,3,3',4',5'-Pentachlorobiphenyl (122) 76842-07-4 NC NC 2.0 NA 2.0 NA NA
2,3',4,4',5'-Pentachlorobiphenyl (123) 65510-44-3 34000 NC 17000 NA 2.0 NA NA
2,3',4',5,5'-Pentachlorobiphenyl (124) 70424-70-3 NC NC 2.0 NA 2.0 NA NA
2,3',4',5',6-Pentachlorobiphenyl (125) 74472-39-2 NC NC 2.0 NA 2.0 NA NA
3,3',4,4',5-Pentachlorobiphenyl (126) 57465-28-8 34 NC 17 NA 2.0 NA NA
3,3',4,5,5'-Pentachlorobiphenyl (127) 39635-33-1 NC NC 2.0 NA 2.0 NA NA
2,2',3,3',4,4'-Hexachlorobiphenyl (128) 38380-07-3 NC NC 2.0 NA 2.0 NA NA
2,2',3,3',4,5-Hexachlorobiphenyl (129) 55215-18-4 NC NC 2.0 NA 2.0 NA NA
2,2',3,3',4,5'-Hexachlorobiphenyl (130) 52663-66-8 NC NC 2.0 NA 2.0 NA NA
2,2',3,3',4,6-Hexachlorobiphenyl (131) 61798-70-7 NC NC 2.0 NA 2.0 NA NA
2,2',3,3',4,6'-Hexachlorobiphenyl (132) 38380-05-1 NC NC 2.0 NA 2.0 NA NA
2,2',3,3',5,5'-Hexachlorobiphenyl (133) 35694-04-3 NC NC 2.0 NA 2.0 NA NA
2,2',3,3',5,6-Hexachlorobiphenyl (134) 52704-70-8 NC NC 2.0 NA 2.0 NA NA
2,2',3,3',5,6'-Hexachlorobiphenyl (135) 52744-13-5 NC NC 2.0 NA 2.0 NA NA
2,2',3,3',6,6'-Hexachlorobiphenyl (136) 38411-22-2 NC NC 2.0 NA 2.0 NA NA
2,2',3,4,4',5-Hexachlorobiphenyl (137) 35694-06-5 NC NC 2.0 NA 2.0 NA NA
2,2',3,4,4',5'-Hexachlorobiphenyl (138) 35065-28-2 NC NC 2.0 NA 2.0 NA NA
2,2',3,4,4',6-Hexachlorobiphenyl (139) 56030-56-9 NC NC 2.0 NA 2.0 NA NA
2,2',3,4,4',6'-Hexachlorobiphenyl (140) 59291-64-4 NC NC 2.0 NA 2.0 NA NA
2,2',3,4,5,5'-Hexachlorobiphenyl (141) 52712-04-6 NC NC 2.0 NA 2.0 NA NA
2,2',3,4,5,6-Hexachlorobiphenyl (142) 41411-61-4 NC NC 2.0 NA 2.0 NA NA
2,2',3,4,5,6'-Hexachlorobiphenyl (143) 68194-15-0 NC NC 2.0 NA 2.0 NA NA
2,2',3,4,5',6-Hexachlorobiphenyl (144) 68194-14-9 NC NC 2.0 NA 2.0 NA NA
2,2',3,4,6,6'-Hexachlorobiphenyl (145) 74472-40-5 NC NC 2.0 NA 2.0 NA NA
2,2',3,4',5,5'-Hexachlorobiphenyl (146) 51908-16-8 NC NC 2.0 NA 2.0 NA NA
2,2',3,4',5,6-Hexachlorobiphenyl (147) 68194-13-8 NC NC 2.0 NA 2.0 NA NA
2,2',3,4',5,6'-Hexachlorobiphenyl (148) 74472-41-6 NC NC 2.0 NA 2.0 NA NA
2,2',3,4',5',6-Hexachlorobiphenyl (149) 38380-04-0 NC NC 2.0 NA 2.0 NA NA
2,2',3,4',6,6'-Hexachlorobiphenyl (150) 68194-08-1 NC NC 2.0 NA 2.0 NA NA
2,2',3,5,5',6-Hexachlorobiphenyl (151) 52663-63-5 NC NC 2.0 NA 2.0 NA NA
2,2',3,5,6,6'-Hexachlorobiphenyl (152) 68194-09-2 NC NC 2.0 NA 2.0 NA NA
2,2',4,4',5,5'-Hexachlorobiphenyl (153) 35065-27-1 NC NC 2.0 NA 2.0 NA NA
2,2',4,4',5,6'-Hexachlorobiphenyl (154) 60145-22-4 NC NC 2.0 NA 2.0 NA NA
2,2',4,4',6,6'-Hexachlorobiphenyl (155) 33979-03-2 NC NC 2.0 NA 2.0 NA NA
2,3,3',4,4',5-Hexachlorobiphenyl (156) 38380-08-4 6800 NC 3400 NA 2.0 NA NA
2,3,3',4,4',5'-Hexachlorobiphenyl (157) 69782-90-7 6800 NC 3400 NA 2.0 NA NA
2,3,3',4,4',6-Hexachlorobiphenyl (158) 74472-42-7 NC NC 2.0 NA 2.0 NA NA
2,3,3',4,5,5'-Hexachlorobiphenyl (159) 39635-35-3 NC NC 2.0 NA 2.0 NA NA
2,3,3',4,5,6-Hexachlorobiphenyl (160) 41411-62-5 NC NC 2.0 NA 2.0 NA NA
2,3,3',4,5',6-Hexachlorobiphenyl (161) 74472-43-8 NC NC 2.0 NA 2.0 NA NA
2,3,3',4',5,5'-Hexachlorobiphenyl (162) 39635-34-2 NC NC 2.0 NA 2.0 NA NA
2,3,3',4',5,6-Hexachlorobiphenyl (163) 74472-44-9 NC NC 2.0 NA 2.0 NA NA
2,3,3',4',5',6-Hexachlorobiphenyl (164) 74472-45-0 NC NC 2.0 NA 2.0 NA NA
2,3,3',5,5',6-Hexachlorobiphenyl (165) 74472-46-1 NC NC 2.0 NA 2.0 NA NA
2,3,4,4',5,6-Hexachlorobiphenyl (166) 41411-63-6 NC NC 2.0 NA 2.0 NA NA
2,3',4,4',5,5'-Hexachlorobiphenyl (167) 52663-72-6 340000 NC 170000 NA 2.0 NA NA
Matrix5: SD
Analytical Group: PCBCONG
Concentration Level: Other
MDLs CRQLs MDLs QLs
Analytical Method1
Achievable Laboratory Limits2
Analyte6
CAS Number
For SB, SD, and CSD
Residential Soil RSL (adjusted)
(ng/kg)
For SD and CSD
Region II Eco (NY SED Marine)
(ng/kg)
PQL Goal4
(ng/kg)
2,3',4,4',5',6-Hexachlorobiphenyl (168) 59291-65-5 NC NC 2.0 NA 2.0 NA NA
3,3',4,4',5,5'-Hexachlorobiphenyl (169) 32774-16-6 340 NC 170 NA 2.0 NA NA
2,2',3,3',4,4',5-Heptachlorobiphenyl (170) 35065-30-6 NC NC 2.0 NA 2.0 NA NA
2,2',3,3',4,4',6-Heptachlorobiphenyl (171) 52663-71-5 NC NC 2.0 NA 2.0 NA NA
2,2',3,3',4,5,5'-Heptachlorobiphenyl (172) 52663-74-8 NC NC 2.0 NA 2.0 NA NA
2,2',3,3',4,5,6-Heptachlorobiphenyl (173) 68194-16-1 NC NC 2.0 NA 2.0 NA NA
2,2',3,3',4,5,6'-Heptachlorobiphenyl (174) 38411-25-5 NC NC 2.0 NA 2.0 NA NA
2,2',3,3',4,5',6-Heptachlorobiphenyl (175) 40186-70-7 NC NC 2.0 NA 2.0 NA NA
2,2',3,3',4,6,6'-Heptachlorobiphenyl (176) 52663-65-7 NC NC 2.0 NA 2.0 NA NA
2,2',3,3',4,5',6'-Heptachlorobiphenyl (177) 52663-70-4 NC NC 2.0 NA 2.0 NA NA

Matrix5: SD
Analytical Group: PCBCONG
Concentration Level: Other
MDLs CRQLs MDLs QLs
Analytical Method1
Achievable Laboratory Limits2
Analyte6
CAS Number
For SB, SD, and CSD
Residential Soil RSL (adjusted)
(ng/kg)
For SD and CSD
Region II Eco (NY SED Marine)
(ng/kg)
PQL Goal4
(ng/kg)
2,2',3,3',5,5',6-Heptachlorobiphenyl (178) 52663-67-9 NC NC 2.0 NA 2.0 NA NA
2,2',3,3',5,6,6'-Heptachlorobiphenyl (179) 52663-64-6 NC NC 2.0 NA 2.0 NA NA
2,2',3,4,4',5,5'-Heptachlorobiphenyl (180) 35065-29-3 NC NC 2.0 NA 2.0 NA NA
2,2',3,4,4',5,6-Heptachlorobiphenyl (181) 74472-47-2 NC NC 2.0 NA 2.0 NA NA
2,2',3,4,4',5,6'-Heptachlorobiphenyl (182) 60145-23-5 NC NC 2.0 NA 2.0 NA NA
2,2',3,4,4',5',6-Heptachlorobiphenyl (183) 52663-69-1 NC NC 2.0 NA 2.0 NA NA
2,2',3,4,4',6,6'-Heptachlorobiphenyl (184) 74472-48-3 NC NC 2.0 NA 2.0 NA NA
2,2',3,4,5,5',6-Heptachlorobiphenyl (185) 52712-05-7 NC NC 2.0 NA 2.0 NA NA
2,2',3,4,5,6,6'-Heptachlorobiphenyl (186) 74472-49-4 NC NC 2.0 NA 2.0 NA NA
2,2',3,4',5,5',6-Heptachlorobiphenyl (187) 52663-68-0 NC NC 2.0 NA 2.0 NA NA
2,2',3,4',5,6,6'-Heptachlorobiphenyl (188) 74487-85-7 NC NC 2.0 NA 2.0 NA NA
2,3,3',4,4',5,5'-Heptachlorobiphenyl (189) 39635-31-9 34000 NC 17000 NA 2.0 NA NA
2,3,3',4,4',5,6-Heptachlorobiphenyl (190) 41411-64-7 NC NC 2.0 NA 2.0 NA NA
2,3,3',4,4',5',6-Heptachlorobiphenyl (191) 74472-50-7 NC NC 2.0 NA 2.0 NA NA
2,3,3',4,5,5',6-Heptachlorobiphenyl (192) 74472-51-8 NC NC 2.0 NA 2.0 NA NA
2,3,3',4',5,5',6-Heptachlorobiphenyl (193) 69782-91-8 NC NC 2.0 NA 2.0 NA NA
2,2',3,3',4,4',5,5'-Octachlorobiphenyl (194) 35694-08-7 NC NC 2.0 NA 2.0 NA NA
2,2',3,3',4,4',5,6-Octachlorobiphenyl (195) 52663-78-2 NC NC 2.0 NA 2.0 NA NA
2,2',3,3',4,4',5,6'-Octachlorobiphenyl (196) 42740-50-1 NC NC 2.0 NA 2.0 NA NA
2,2',3,3',4,4',6,6'-Octachlorobiphenyl (197) 33091-17-7 NC NC 2.0 NA 2.0 NA NA
2,2',3,3',4,5,5',6-Octachlorobiphenyl (198) 68194-17-2 NC NC 2.0 NA 2.0 NA NA
2,2',3,3',4,5,5',6'-Octachlorobiphenyl (199) 52663-75-9 NC NC 2.0 NA 2.0 NA NA
2,2',3,3',4,5,6,6'-Octachlorobiphenyl (200) 52663-73-7 NC NC 2.0 NA 2.0 NA NA
2,2',3,3',4,5',6,6'-Octachlorobiphenyl (201) 40186-71-8 NC NC 2.0 NA 2.0 NA NA
2,2',3,3',5,5',6,6'-Octachlorobiphenyl (202) 2136-99-4 NC NC 2.0 NA 2.0 NA NA
2,2',3,4,4',5,5',6-Octachlorobiphenyl (203) 52663-76-0 NC NC 2.0 NA 2.0 NA NA
2,2',3,4,4',5,6,6'-Octachlorobiphenyl (204) 74472-52-9 NC NC 2.0 NA 2.0 NA NA
2,3,3',4,4',5,5',6-Octachlorobiphenyl (205) 74472-53-0 NC NC 2.0 NA 2.0 NA NA
2,2',3,3',4,4',5,5',6-Nonachlorobiphenyl (206) 40186-72-9 NC NC 2.0 NA 2.0 NA NA
2,2',3,3',4,4',5,6,6'-Nonachlorobiphenyl (207) 52663-79-3 NC NC 2.0 NA 2.0 NA NA
2,2',3,3',4,5,5',6,6'-Nonachlorobiphenyl (208) 52663-77-1 NC NC 2.0 NA 2.0 NA NA
Decachlorobiphenyl (209) 2051-24-3 NC NC NA NA NA NA NA
Total Monochlorobiphenyls 27323-18-8 NC NC NA NA NA NA NA
Total Dichlorobiphenyls 25512-42-9 NC NC NA NA NA NA NA
Total Trichlorobiphenyls 25323-68-6 NC NC NA NA NA NA NA
Total Tetrachlorobiphenyls 26914-33-0 NC NC NA NA NA NA NA
Total Pentachlorobiphenyls 25429-29-2 NC NC NA NA NA NA NA
Total Hexachlorobiphenyls 26601-64-9 NC NC NA NA NA NA NA
Total Heptachlorobiphenyls 28655-71-2 NC NC NA NA NA NA NA
Total Octachlorobiphenyls 31472-83-0 NC NC NA NA NA NA NA
Total Nonachlorobiphenyls 53742-07-7 NC NC NA NA NA NA NA
Shading indicates PALs for which the PAL < CRQL.
NC: No screening level. Note that there is a NY SED Marine screening level of 0.0227 mg/kg for "PCBs Total". This corresponds to 22700 ng/kg.
5SD = Sediment (Other)
6Due to co-elutions, the PCBCONG compound list is laboratory-specific. All 209 congeners shall be reported, even though some may co-elute.
1Analytical MDLs and QLs are those documented in validated methods. EPA CLP CBC01.2 provides a CRQL but not an MDL. Units are the same as in the PQL column.
2Achievable MDLs and QLs are limits that an individual laboratory can achieve when performing a specific analytical method. QLs and MDLs are specific to the CLP laboratory that provides the analysis. Units are the same
as in the PQL column.
4The PQL Goal is 1/2 the lowest PAL, the lowest PAL, or the CRQL, as applicable.
QAPP Worksheet #15-12
(UFP-QAPP Manual Section 2.8.1)
Reference Limits and Evaluation Table
Matrix3: AQ
Analytical Group: PCBCONG
Concentration Level: Water
MDLs
CRQLs
(pg/L) MDLs QLs
2-Chlorobiphenyl (1) 2051-60-7 NA 20 NA NA
3-Chlorobiphenyl (2) 2051-61-8 NA 20 NA NA
4-Chlorobiphenyl (3) 2051-62-9 NA 20 NA NA
2,2'-Dichlorobiphenyl (4) 13029-08-8 NA 20 NA NA
2,3-Dichlorobiphenyl (5) 16605-91-7 NA 20 NA NA
2,3'-Dichlorobiphenyl (6) 25569-80-6 NA 20 NA NA
2,4-Dichlorobiphenyl (7) 33284-50-3 NA 20 NA NA
2,4'-Dichlorobiphenyl (8) 34883-43-7 NA 20 NA NA
2,5-Dichlorobiphenyl (9) 34883-39-1 NA 20 NA NA
2,6-Dichlorobiphenyl (10) 33146-45-1 NA 20 NA NA
3,3'-Dichlorobiphenyl (11) 2050-67-1 NA 20 NA NA
3,4-Dichlorobiphenyl (12) 2974-92-7 NA 20 NA NA
3,4'-Dichlorobiphenyl (13) 2974-90-5 NA 20 NA NA
3,5-Dichlorobiphenyl (14) 34883-41-5 NA 20 NA NA
4,4'-Dichlorobiphenyl (15) 2050-68-2 NA 20 NA NA
2,2',3-Trichlorobiphenyl (16) 38444-78-9 NA 20 NA NA
2,2',4-Trichlorobiphenyl (17) 37680-66-3 NA 20 NA NA
2,2',5-Trichlorobiphenyl (18) 37680-65-2 NA 20 NA NA
2,2',6-Trichlorobiphenyl (19) 38444-73-4 NA 20 NA NA
2,3,3'-Trichlorobiphenyl (20) 38444-84-7 NA 20 NA NA
2,3,4-Trichlorobiphenyl (21) 55702-46-0 NA 20 NA NA
2,3,4'-Trichlorobiphenyl (22) 38444-85-8 NA 20 NA NA
2,3,5-Trichlorobiphenyl (23) 55720-44-0 NA 20 NA NA
2,3,6-Trichlorobiphenyl (24) 55702-45-9 NA 20 NA NA
2,3',4-Trichlorobiphenyl (25) 55712-37-3 NA 20 NA NA
2,3',5-Trichlorobiphenyl (26) 38444-81-4 NA 20 NA NA
2,3',6-Trichlorobiphenyl (27) 38444-76-7 NA 20 NA NA
2,4,4'-Trichlorobiphenyl (28) 7012-37-5 NA 20 NA NA
2,4,5-Trichlorobiphenyl (29) 15862-07-4 NA 20 NA NA
2,4,6-Trichlorobiphenyl (30) 35693-92-6 NA 20 NA NA
2,4',5-Trichlorobiphenyl (31) 16606-02-3 NA 20 NA NA
2,4',6-Trichlorobiphenyl (32) 38444-77-8 NA 20 NA NA
2,3',4'-Trichlorobiphenyl (33) 38444-86-9 NA 20 NA NA
2,3',5'-Trichlorobiphenyl (34) 37680-68-5 NA 20 NA NA
3,3',4-Trichlorobiphenyl (35) 37680-69-6 NA 20 NA NA
3,3',5-Trichlorobiphenyl (36) 38444-87-0 NA 20 NA NA
3,4,4'-Trichlorobiphenyl (37) 38444-90-5 NA 20 NA NA
3,4,5-Trichlorobiphenyl (38) 53555-66-1 NA 20 NA NA
3,4',5-Trichlorobiphenyl (39) 38444-88-1 NA 20 NA NA
2,2',3,3'-Tetrachlorobiphenyl (40) 38444-93-8 NA 20 NA NA
2,2',3,4-Tetrachlorobiphenyl (41) 52663-59-9 NA 20 NA NA
2,2',3,4'-Tetrachlorobiphenyl (42) 36559-22-5 NA 20 NA NA
2,2',3,5-Tetrachlorobiphenyl (43) 70362-46-8 NA 20 NA NA
2,2',3,5'-Tetrachlorobiphenyl (44) 41464-39-5 NA 20 NA NA
2,2',3,6-Tetrachlorobiphenyl (45) 70362-45-7 NA 20 NA NA
2,2',3,6'-Tetrachlorobiphenyl (46) 41464-47-5 NA 20 NA NA
2,2',4,4'-Tetrachlorobiphenyl (47) 2437-79-8 NA 20 NA NA
2,2',4,5-Tetrachlorobiphenyl (48) 70362-47-9 NA 20 NA NA
2,2',4,5'-Tetrachlorobiphenyl (49) 41464-40-8 NA 20 NA NA
2,2',4,6-Tetrachlorobiphenyl (50) 62796-65-0 NA 20 NA NA
2,2',4,6'-Tetrachlorobiphenyl (51) 68194-04-7 NA 20 NA NA
2,2',5,5'-Tetrachlorobiphenyl (52) 35693-99-3 NA 20 NA NA
2,2',5,6'-Tetrachlorobiphenyl (53) 41464-41-9 NA 20 NA NA
Achievable Laboratory Limits2
Analyte4
CAS Number
Analytical Method1
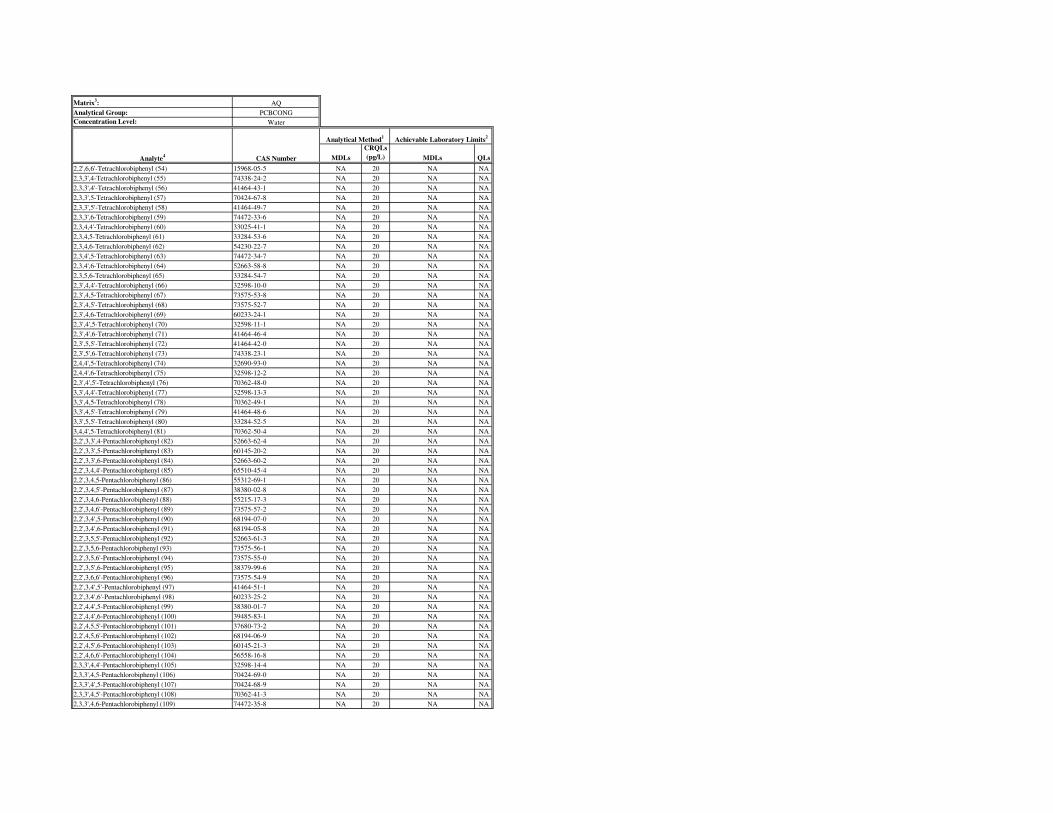
Matrix3: AQ
Analytical Group: PCBCONG
Concentration Level: Water
MDLs
CRQLs
(pg/L) MDLs QLs
Achievable Laboratory Limits2
Analyte4
CAS Number
Analytical Method1
2,2',6,6'-Tetrachlorobiphenyl (54) 15968-05-5 NA 20 NA NA
2,3,3',4-Tetrachlorobiphenyl (55) 74338-24-2 NA 20 NA NA
2,3,3',4'-Tetrachlorobiphenyl (56) 41464-43-1 NA 20 NA NA
2,3,3',5-Tetrachlorobiphenyl (57) 70424-67-8 NA 20 NA NA
2,3,3',5'-Tetrachlorobiphenyl (58) 41464-49-7 NA 20 NA NA
2,3,3',6-Tetrachlorobiphenyl (59) 74472-33-6 NA 20 NA NA
2,3,4,4'-Tetrachlorobiphenyl (60) 33025-41-1 NA 20 NA NA
2,3,4,5-Tetrachlorobiphenyl (61) 33284-53-6 NA 20 NA NA
2,3,4,6-Tetrachlorobiphenyl (62) 54230-22-7 NA 20 NA NA
2,3,4',5-Tetrachlorobiphenyl (63) 74472-34-7 NA 20 NA NA
2,3,4',6-Tetrachlorobiphenyl (64) 52663-58-8 NA 20 NA NA
2,3,5,6-Tetrachlorobiphenyl (65) 33284-54-7 NA 20 NA NA
2,3',4,4'-Tetrachlorobiphenyl (66) 32598-10-0 NA 20 NA NA
2,3',4,5-Tetrachlorobiphenyl (67) 73575-53-8 NA 20 NA NA
2,3',4,5'-Tetrachlorobiphenyl (68) 73575-52-7 NA 20 NA NA
2,3',4,6-Tetrachlorobiphenyl (69) 60233-24-1 NA 20 NA NA
2,3',4',5-Tetrachlorobiphenyl (70) 32598-11-1 NA 20 NA NA
2,3',4',6-Tetrachlorobiphenyl (71) 41464-46-4 NA 20 NA NA
2,3',5,5'-Tetrachlorobiphenyl (72) 41464-42-0 NA 20 NA NA
2,3',5',6-Tetrachlorobiphenyl (73) 74338-23-1 NA 20 NA NA
2,4,4',5-Tetrachlorobiphenyl (74) 32690-93-0 NA 20 NA NA
2,4,4',6-Tetrachlorobiphenyl (75) 32598-12-2 NA 20 NA NA
2,3',4',5'-Tetrachlorobiphenyl (76) 70362-48-0 NA 20 NA NA
3,3',4,4'-Tetrachlorobiphenyl (77) 32598-13-3 NA 20 NA NA
3,3',4,5-Tetrachlorobiphenyl (78) 70362-49-1 NA 20 NA NA
3,3',4,5'-Tetrachlorobiphenyl (79) 41464-48-6 NA 20 NA NA
3,3',5,5'-Tetrachlorobiphenyl (80) 33284-52-5 NA 20 NA NA
3,4,4',5-Tetrachlorobiphenyl (81) 70362-50-4 NA 20 NA NA
2,2',3,3',4-Pentachlorobiphenyl (82) 52663-62-4 NA 20 NA NA
2,2',3,3',5-Pentachlorobiphenyl (83) 60145-20-2 NA 20 NA NA
2,2',3,3',6-Pentachlorobiphenyl (84) 52663-60-2 NA 20 NA NA
2,2',3,4,4'-Pentachlorobiphenyl (85) 65510-45-4 NA 20 NA NA
2,2',3,4,5-Pentachlorobiphenyl (86) 55312-69-1 NA 20 NA NA
2,2',3,4,5'-Pentachlorobiphenyl (87) 38380-02-8 NA 20 NA NA
2,2',3,4,6-Pentachlorobiphenyl (88) 55215-17-3 NA 20 NA NA
2,2',3,4,6'-Pentachlorobiphenyl (89) 73575-57-2 NA 20 NA NA
2,2',3,4',5-Pentachlorobiphenyl (90) 68194-07-0 NA 20 NA NA
2,2',3,4',6-Pentachlorobiphenyl (91) 68194-05-8 NA 20 NA NA
2,2',3,5,5'-Pentachlorobiphenyl (92) 52663-61-3 NA 20 NA NA
2,2',3,5,6-Pentachlorobiphenyl (93) 73575-56-1 NA 20 NA NA
2,2',3,5,6'-Pentachlorobiphenyl (94) 73575-55-0 NA 20 NA NA
2,2',3,5',6-Pentachlorobiphenyl (95) 38379-99-6 NA 20 NA NA
2,2',3,6,6'-Pentachlorobiphenyl (96) 73575-54-9 NA 20 NA NA
2,2',3,4',5'-Pentachlorobiphenyl (97) 41464-51-1 NA 20 NA NA
2,2',3,4',6'-Pentachlorobiphenyl (98) 60233-25-2 NA 20 NA NA
2,2',4,4',5-Pentachlorobiphenyl (99) 38380-01-7 NA 20 NA NA
2,2',4,4',6-Pentachlorobiphenyl (100) 39485-83-1 NA 20 NA NA
2,2',4,5,5'-Pentachlorobiphenyl (101) 37680-73-2 NA 20 NA NA
2,2',4,5,6'-Pentachlorobiphenyl (102) 68194-06-9 NA 20 NA NA
2,2',4,5',6-Pentachlorobiphenyl (103) 60145-21-3 NA 20 NA NA
2,2',4,6,6'-Pentachlorobiphenyl (104) 56558-16-8 NA 20 NA NA
2,3,3',4,4'-Pentachlorobiphenyl (105) 32598-14-4 NA 20 NA NA
2,3,3',4,5-Pentachlorobiphenyl (106) 70424-69-0 NA 20 NA NA
2,3,3',4',5-Pentachlorobiphenyl (107) 70424-68-9 NA 20 NA NA
2,3,3',4,5'-Pentachlorobiphenyl (108) 70362-41-3 NA 20 NA NA
2,3,3',4,6-Pentachlorobiphenyl (109) 74472-35-8 NA 20 NA NA

Matrix3: AQ
Analytical Group: PCBCONG
Concentration Level: Water
MDLs
CRQLs
(pg/L) MDLs QLs
Achievable Laboratory Limits2
Analyte4
CAS Number
Analytical Method1
2,3,3',4',6-Pentachlorobiphenyl (110) 38380-03-9 NA 20 NA NA
2,3,3',5,5'-Pentachlorobiphenyl (111) 39635-32-0 NA 20 NA NA
2,3,3',5,6-Pentachlorobiphenyl (112) 74472-36-9 NA 20 NA NA
2,3,3',5',6-Pentachlorobiphenyl (113) 68194-10-5 NA 20 NA NA
2,3,4,4',5-Pentachlorobiphenyl (114) 74472-37-0 NA 20 NA NA
2,3,4,4',6-Pentachlorobiphenyl (115) 74472-38-1 NA 20 NA NA
2,3,4,5,6-Pentachlorobiphenyl (116) 18259-05-7 NA 20 NA NA
2,3,4',5,6-Pentachlorobiphenyl (117) 68194-11-6 NA 20 NA NA
2,3',4,4',5-Pentachlorobiphenyl (118) 31508-00-6 NA 20 NA NA
2,3',4,4',6-Pentachlorobiphenyl (119) 56558-17-9 NA 20 NA NA
2,3',4,5,5'-Pentachlorobiphenyl (120) 68194-12-7 NA 20 NA NA
2,3',4,5',6-Pentachlorobiphenyl (121) 56558-18-0 NA 20 NA NA
2,3,3',4',5'-Pentachlorobiphenyl (122) 76842-07-4 NA 20 NA NA
2,3',4,4',5'-Pentachlorobiphenyl (123) 65510-44-3 NA 20 NA NA
2,3',4',5,5'-Pentachlorobiphenyl (124) 70424-70-3 NA 20 NA NA
2,3',4',5',6-Pentachlorobiphenyl (125) 74472-39-2 NA 20 NA NA
3,3',4,4',5-Pentachlorobiphenyl (126) 57465-28-8 NA 20 NA NA
3,3',4,5,5'-Pentachlorobiphenyl (127) 39635-33-1 NA 20 NA NA
2,2',3,3',4,4'-Hexachlorobiphenyl (128) 38380-07-3 NA 20 NA NA
2,2',3,3',4,5-Hexachlorobiphenyl (129) 55215-18-4 NA 20 NA NA
2,2',3,3',4,5'-Hexachlorobiphenyl (130) 52663-66-8 NA 20 NA NA
2,2',3,3',4,6-Hexachlorobiphenyl (131) 61798-70-7 NA 20 NA NA
2,2',3,3',4,6'-Hexachlorobiphenyl (132) 38380-05-1 NA 20 NA NA
2,2',3,3',5,5'-Hexachlorobiphenyl (133) 35694-04-3 NA 20 NA NA
2,2',3,3',5,6-Hexachlorobiphenyl (134) 52704-70-8 NA 20 NA NA
2,2',3,3',5,6'-Hexachlorobiphenyl (135) 52744-13-5 NA 20 NA NA
2,2',3,3',6,6'-Hexachlorobiphenyl (136) 38411-22-2 NA 20 NA NA
2,2',3,4,4',5-Hexachlorobiphenyl (137) 35694-06-5 NA 20 NA NA
2,2',3,4,4',5'-Hexachlorobiphenyl (138) 35065-28-2 NA 20 NA NA
2,2',3,4,4',6-Hexachlorobiphenyl (139) 56030-56-9 NA 20 NA NA
2,2',3,4,4',6'-Hexachlorobiphenyl (140) 59291-64-4 NA 20 NA NA
2,2',3,4,5,5'-Hexachlorobiphenyl (141) 52712-04-6 NA 20 NA NA
2,2',3,4,5,6-Hexachlorobiphenyl (142) 41411-61-4 NA 20 NA NA
2,2',3,4,5,6'-Hexachlorobiphenyl (143) 68194-15-0 NA 20 NA NA
2,2',3,4,5',6-Hexachlorobiphenyl (144) 68194-14-9 NA 20 NA NA
2,2',3,4,6,6'-Hexachlorobiphenyl (145) 74472-40-5 NA 20 NA NA
2,2',3,4',5,5'-Hexachlorobiphenyl (146) 51908-16-8 NA 20 NA NA
2,2',3,4',5,6-Hexachlorobiphenyl (147) 68194-13-8 NA 20 NA NA
2,2',3,4',5,6'-Hexachlorobiphenyl (148) 74472-41-6 NA 20 NA NA
2,2',3,4',5',6-Hexachlorobiphenyl (149) 38380-04-0 NA 20 NA NA
2,2',3,4',6,6'-Hexachlorobiphenyl (150) 68194-08-1 NA 20 NA NA
2,2',3,5,5',6-Hexachlorobiphenyl (151) 52663-63-5 NA 20 NA NA
2,2',3,5,6,6'-Hexachlorobiphenyl (152) 68194-09-2 NA 20 NA NA
2,2',4,4',5,5'-Hexachlorobiphenyl (153) 35065-27-1 NA 20 NA NA
2,2',4,4',5,6'-Hexachlorobiphenyl (154) 60145-22-4 NA 20 NA NA
2,2',4,4',6,6'-Hexachlorobiphenyl (155) 33979-03-2 NA 20 NA NA
2,3,3',4,4',5-Hexachlorobiphenyl (156) 38380-08-4 NA 20 NA NA
2,3,3',4,4',5'-Hexachlorobiphenyl (157) 69782-90-7 NA 20 NA NA
2,3,3',4,4',6-Hexachlorobiphenyl (158) 74472-42-7 NA 20 NA NA
2,3,3',4,5,5'-Hexachlorobiphenyl (159) 39635-35-3 NA 20 NA NA
2,3,3',4,5,6-Hexachlorobiphenyl (160) 41411-62-5 NA 20 NA NA
2,3,3',4,5',6-Hexachlorobiphenyl (161) 74472-43-8 NA 20 NA NA
2,3,3',4',5,5'-Hexachlorobiphenyl (162) 39635-34-2 NA 20 NA NA
2,3,3',4',5,6-Hexachlorobiphenyl (163) 74472-44-9 NA 20 NA NA
2,3,3',4',5',6-Hexachlorobiphenyl (164) 74472-45-0 NA 20 NA NA
2,3,3',5,5',6-Hexachlorobiphenyl (165) 74472-46-1 NA 20 NA NA

Matrix3: AQ
Analytical Group: PCBCONG
Concentration Level: Water
MDLs
CRQLs
(pg/L) MDLs QLs
Achievable Laboratory Limits2
Analyte4
CAS Number
Analytical Method1
2,3,4,4',5,6-Hexachlorobiphenyl (166) 41411-63-6 NA 20 NA NA
2,3',4,4',5,5'-Hexachlorobiphenyl (167) 52663-72-6 NA 20 NA NA
2,3',4,4',5',6-Hexachlorobiphenyl (168) 59291-65-5 NA 20 NA NA
3,3',4,4',5,5'-Hexachlorobiphenyl (169) 32774-16-6 NA 20 NA NA
2,2',3,3',4,4',5-Heptachlorobiphenyl (170) 35065-30-6 NA 20 NA NA
2,2',3,3',4,4',6-Heptachlorobiphenyl (171) 52663-71-5 NA 20 NA NA
2,2',3,3',4,5,5'-Heptachlorobiphenyl (172) 52663-74-8 NA 20 NA NA
2,2',3,3',4,5,6-Heptachlorobiphenyl (173) 68194-16-1 NA 20 NA NA
2,2',3,3',4,5,6'-Heptachlorobiphenyl (174) 38411-25-5 NA 20 NA NA
2,2',3,3',4,5',6-Heptachlorobiphenyl (175) 40186-70-7 NA 20 NA NA
2,2',3,3',4,6,6'-Heptachlorobiphenyl (176) 52663-65-7 NA 20 NA NA
2,2',3,3',4,5',6'-Heptachlorobiphenyl (177) 52663-70-4 NA 20 NA NA
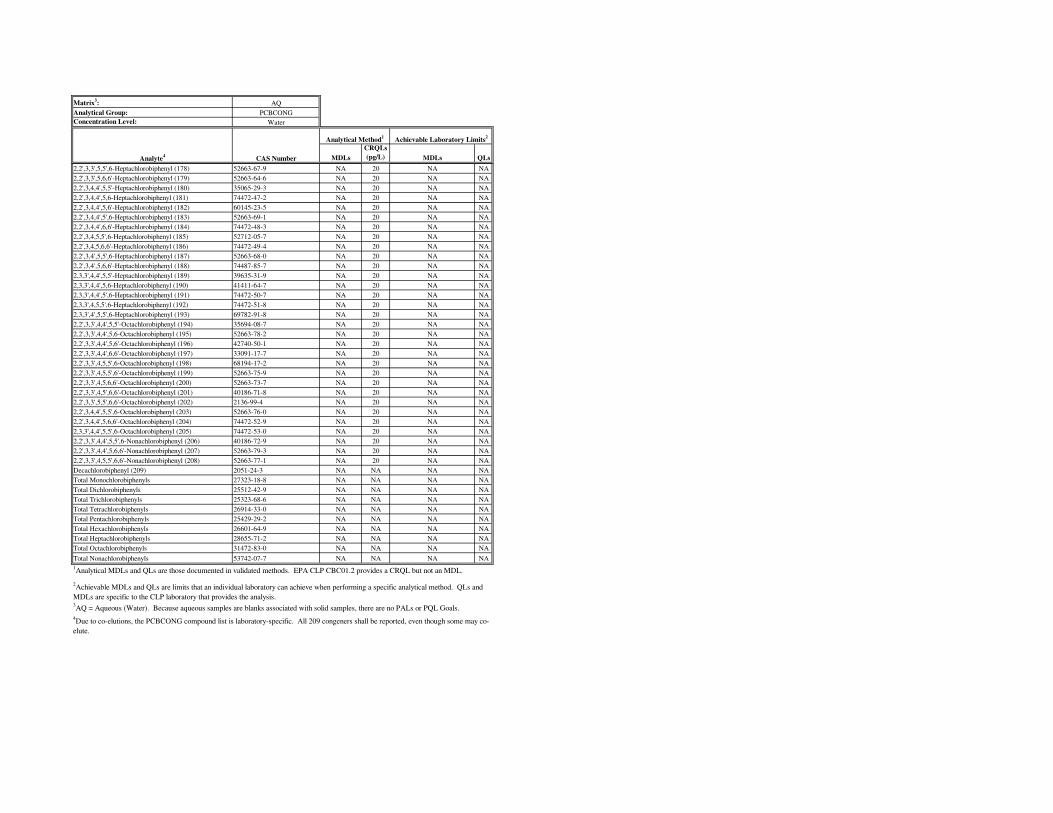
Matrix3: AQ
Analytical Group: PCBCONG
Concentration Level: Water
MDLs
CRQLs
(pg/L) MDLs QLs
Achievable Laboratory Limits2
Analyte4
CAS Number
Analytical Method1
2,2',3,3',5,5',6-Heptachlorobiphenyl (178) 52663-67-9 NA 20 NA NA
2,2',3,3',5,6,6'-Heptachlorobiphenyl (179) 52663-64-6 NA 20 NA NA
2,2',3,4,4',5,5'-Heptachlorobiphenyl (180) 35065-29-3 NA 20 NA NA
2,2',3,4,4',5,6-Heptachlorobiphenyl (181) 74472-47-2 NA 20 NA NA
2,2',3,4,4',5,6'-Heptachlorobiphenyl (182) 60145-23-5 NA 20 NA NA
2,2',3,4,4',5',6-Heptachlorobiphenyl (183) 52663-69-1 NA 20 NA NA
2,2',3,4,4',6,6'-Heptachlorobiphenyl (184) 74472-48-3 NA 20 NA NA
2,2',3,4,5,5',6-Heptachlorobiphenyl (185) 52712-05-7 NA 20 NA NA
2,2',3,4,5,6,6'-Heptachlorobiphenyl (186) 74472-49-4 NA 20 NA NA
2,2',3,4',5,5',6-Heptachlorobiphenyl (187) 52663-68-0 NA 20 NA NA
2,2',3,4',5,6,6'-Heptachlorobiphenyl (188) 74487-85-7 NA 20 NA NA
2,3,3',4,4',5,5'-Heptachlorobiphenyl (189) 39635-31-9 NA 20 NA NA
2,3,3',4,4',5,6-Heptachlorobiphenyl (190) 41411-64-7 NA 20 NA NA
2,3,3',4,4',5',6-Heptachlorobiphenyl (191) 74472-50-7 NA 20 NA NA
2,3,3',4,5,5',6-Heptachlorobiphenyl (192) 74472-51-8 NA 20 NA NA
2,3,3',4',5,5',6-Heptachlorobiphenyl (193) 69782-91-8 NA 20 NA NA
2,2',3,3',4,4',5,5'-Octachlorobiphenyl (194) 35694-08-7 NA 20 NA NA
2,2',3,3',4,4',5,6-Octachlorobiphenyl (195) 52663-78-2 NA 20 NA NA
2,2',3,3',4,4',5,6'-Octachlorobiphenyl (196) 42740-50-1 NA 20 NA NA
2,2',3,3',4,4',6,6'-Octachlorobiphenyl (197) 33091-17-7 NA 20 NA NA
2,2',3,3',4,5,5',6-Octachlorobiphenyl (198) 68194-17-2 NA 20 NA NA
2,2',3,3',4,5,5',6'-Octachlorobiphenyl (199) 52663-75-9 NA 20 NA NA
2,2',3,3',4,5,6,6'-Octachlorobiphenyl (200) 52663-73-7 NA 20 NA NA
2,2',3,3',4,5',6,6'-Octachlorobiphenyl (201) 40186-71-8 NA 20 NA NA
2,2',3,3',5,5',6,6'-Octachlorobiphenyl (202) 2136-99-4 NA 20 NA NA
2,2',3,4,4',5,5',6-Octachlorobiphenyl (203) 52663-76-0 NA 20 NA NA
2,2',3,4,4',5,6,6'-Octachlorobiphenyl (204) 74472-52-9 NA 20 NA NA
2,3,3',4,4',5,5',6-Octachlorobiphenyl (205) 74472-53-0 NA 20 NA NA
2,2',3,3',4,4',5,5',6-Nonachlorobiphenyl (206) 40186-72-9 NA 20 NA NA
2,2',3,3',4,4',5,6,6'-Nonachlorobiphenyl (207) 52663-79-3 NA 20 NA NA
2,2',3,3',4,5,5',6,6'-Nonachlorobiphenyl (208) 52663-77-1 NA 20 NA NA
Decachlorobiphenyl (209) 2051-24-3 NA NA NA NA
Total Monochlorobiphenyls 27323-18-8 NA NA NA NA
Total Dichlorobiphenyls 25512-42-9 NA NA NA NA
Total Trichlorobiphenyls 25323-68-6 NA NA NA NA
Total Tetrachlorobiphenyls 26914-33-0 NA NA NA NA
Total Pentachlorobiphenyls 25429-29-2 NA NA NA NA
Total Hexachlorobiphenyls 26601-64-9 NA NA NA NA
Total Heptachlorobiphenyls 28655-71-2 NA NA NA NA
Total Octachlorobiphenyls 31472-83-0 NA NA NA NA
Total Nonachlorobiphenyls 53742-07-7 NA NA NA NA
1Analytical MDLs and QLs are those documented in validated methods. EPA CLP CBC01.2 provides a CRQL but not an MDL.
2Achievable MDLs and QLs are limits that an individual laboratory can achieve when performing a specific analytical method. QLs and
MDLs are specific to the CLP laboratory that provides the analysis.
4Due to co-elutions, the PCBCONG compound list is laboratory-specific. All 209 congeners shall be reported, even though some may co-
elute.
3AQ = Aqueous (Water). Because aqueous samples are blanks associated with solid samples, there are no PALs or PQL Goals.

QAPP Worksheet #15-13
(UFP-QAPP Manual Section 2.8.1)
Reference Limits and Evaluation Table
Matrix5: TI
Analytical Group: PCBCONG
Concentration Level: Other
MDLs CRQLs MDLs QLs
2-Chlorobiphenyl (1) 2051-60-7 NC 2.0 NA 2.0 NA NA
3-Chlorobiphenyl (2) 2051-61-8 NC 2.0 NA 2.0 NA NA
4-Chlorobiphenyl (3) 2051-62-9 NC 2.0 NA 2.0 NA NA
2,2'-Dichlorobiphenyl (4) 13029-08-8 NC 2.0 NA 2.0 NA NA
2,3-Dichlorobiphenyl (5) 16605-91-7 NC 2.0 NA 2.0 NA NA
2,3'-Dichlorobiphenyl (6) 25569-80-6 NC 2.0 NA 2.0 NA NA
2,4-Dichlorobiphenyl (7) 33284-50-3 NC 2.0 NA 2.0 NA NA
2,4'-Dichlorobiphenyl (8) 34883-43-7 NC 2.0 NA 2.0 NA NA
2,5-Dichlorobiphenyl (9) 34883-39-1 NC 2.0 NA 2.0 NA NA
2,6-Dichlorobiphenyl (10) 33146-45-1 NC 2.0 NA 2.0 NA NA
3,3'-Dichlorobiphenyl (11) 2050-67-1 NC 2.0 NA 2.0 NA NA
3,4-Dichlorobiphenyl (12) 2974-92-7 NC 2.0 NA 2.0 NA NA
3,4'-Dichlorobiphenyl (13) 2974-90-5 NC 2.0 NA 2.0 NA NA
3,5-Dichlorobiphenyl (14) 34883-41-5 NC 2.0 NA 2.0 NA NA
4,4'-Dichlorobiphenyl (15) 2050-68-2 NC 2.0 NA 2.0 NA NA
2,2',3-Trichlorobiphenyl (16) 38444-78-9 NC 2.0 NA 2.0 NA NA
2,2',4-Trichlorobiphenyl (17) 37680-66-3 NC 2.0 NA 2.0 NA NA
2,2',5-Trichlorobiphenyl (18) 37680-65-2 NC 2.0 NA 2.0 NA NA
2,2',6-Trichlorobiphenyl (19) 38444-73-4 NC 2.0 NA 2.0 NA NA
2,3,3'-Trichlorobiphenyl (20) 38444-84-7 NC 2.0 NA 2.0 NA NA
2,3,4-Trichlorobiphenyl (21) 55702-46-0 NC 2.0 NA 2.0 NA NA
2,3,4'-Trichlorobiphenyl (22) 38444-85-8 NC 2.0 NA 2.0 NA NA
2,3,5-Trichlorobiphenyl (23) 55720-44-0 NC 2.0 NA 2.0 NA NA
2,3,6-Trichlorobiphenyl (24) 55702-45-9 NC 2.0 NA 2.0 NA NA
2,3',4-Trichlorobiphenyl (25) 55712-37-3 NC 2.0 NA 2.0 NA NA
2,3',5-Trichlorobiphenyl (26) 38444-81-4 NC 2.0 NA 2.0 NA NA
2,3',6-Trichlorobiphenyl (27) 38444-76-7 NC 2.0 NA 2.0 NA NA
2,4,4'-Trichlorobiphenyl (28) 7012-37-5 NC 2.0 NA 2.0 NA NA
2,4,5-Trichlorobiphenyl (29) 15862-07-4 NC 2.0 NA 2.0 NA NA
2,4,6-Trichlorobiphenyl (30) 35693-92-6 NC 2.0 NA 2.0 NA NA
2,4',5-Trichlorobiphenyl (31) 16606-02-3 NC 2.0 NA 2.0 NA NA
2,4',6-Trichlorobiphenyl (32) 38444-77-8 NC 2.0 NA 2.0 NA NA
2,3',4'-Trichlorobiphenyl (33) 38444-86-9 NC 2.0 NA 2.0 NA NA
2,3',5'-Trichlorobiphenyl (34) 37680-68-5 NC 2.0 NA 2.0 NA NA
3,3',4-Trichlorobiphenyl (35) 37680-69-6 NC 2.0 NA 2.0 NA NA
3,3',5-Trichlorobiphenyl (36) 38444-87-0 NC 2.0 NA 2.0 NA NA
3,4,4'-Trichlorobiphenyl (37) 38444-90-5 NC 2.0 NA 2.0 NA NA
3,4,5-Trichlorobiphenyl (38) 53555-66-1 NC 2.0 NA 2.0 NA NA
3,4',5-Trichlorobiphenyl (39) 38444-88-1 NC 2.0 NA 2.0 NA NA
2,2',3,3'-Tetrachlorobiphenyl (40) 38444-93-8 NC 2.0 NA 2.0 NA NA
2,2',3,4-Tetrachlorobiphenyl (41) 52663-59-9 NC 2.0 NA 2.0 NA NA
2,2',3,4'-Tetrachlorobiphenyl (42) 36559-22-5 NC 2.0 NA 2.0 NA NA
2,2',3,5-Tetrachlorobiphenyl (43) 70362-46-8 NC 2.0 NA 2.0 NA NA
2,2',3,5'-Tetrachlorobiphenyl (44) 41464-39-5 NC 2.0 NA 2.0 NA NA
2,2',3,6-Tetrachlorobiphenyl (45) 70362-45-7 NC 2.0 NA 2.0 NA NA
2,2',3,6'-Tetrachlorobiphenyl (46) 41464-47-5 NC 2.0 NA 2.0 NA NA
2,2',4,4'-Tetrachlorobiphenyl (47) 2437-79-8 NC 2.0 NA 2.0 NA NA
2,2',4,5-Tetrachlorobiphenyl (48) 70362-47-9 NC 2.0 NA 2.0 NA NA
2,2',4,5'-Tetrachlorobiphenyl (49) 41464-40-8 NC 2.0 NA 2.0 NA NA
2,2',4,6-Tetrachlorobiphenyl (50) 62796-65-0 NC 2.0 NA 2.0 NA NA
2,2',4,6'-Tetrachlorobiphenyl (51) 68194-04-7 NC 2.0 NA 2.0 NA NA
2,2',5,5'-Tetrachlorobiphenyl (52) 35693-99-3 NC 2.0 NA 2.0 NA NA
2,2',5,6'-Tetrachlorobiphenyl (53) 41464-41-9 NC 2.0 NA 2.0 NA NA
Analyte6
CAS Number
Risk-Based Screening Levels for
Fish
(ng/kg)
PQL Goal4
(ng/kg)
Analytical Method1
Achievable Laboratory Limits2
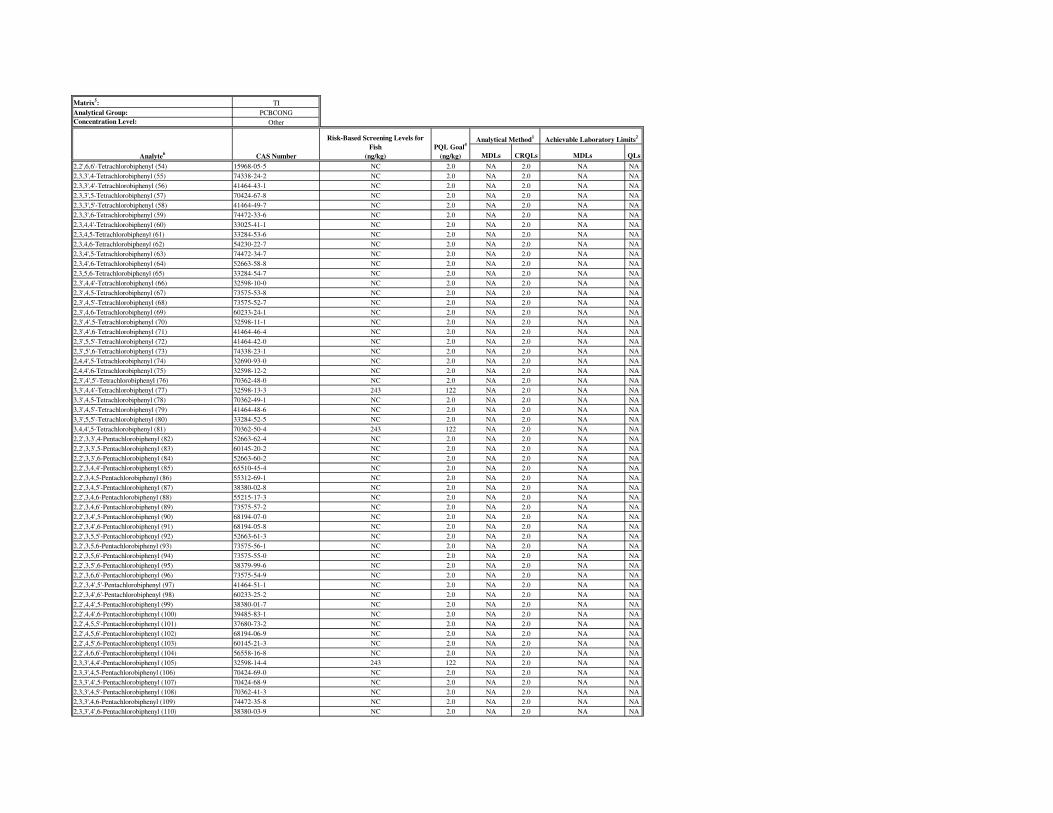
Matrix5: TI
Analytical Group: PCBCONG
Concentration Level: Other
MDLs CRQLs MDLs QLsAnalyte6
CAS Number
Risk-Based Screening Levels for
Fish
(ng/kg)
PQL Goal4
(ng/kg)
Analytical Method1
Achievable Laboratory Limits2
2,2',6,6'-Tetrachlorobiphenyl (54) 15968-05-5 NC 2.0 NA 2.0 NA NA
2,3,3',4-Tetrachlorobiphenyl (55) 74338-24-2 NC 2.0 NA 2.0 NA NA
2,3,3',4'-Tetrachlorobiphenyl (56) 41464-43-1 NC 2.0 NA 2.0 NA NA
2,3,3',5-Tetrachlorobiphenyl (57) 70424-67-8 NC 2.0 NA 2.0 NA NA
2,3,3',5'-Tetrachlorobiphenyl (58) 41464-49-7 NC 2.0 NA 2.0 NA NA
2,3,3',6-Tetrachlorobiphenyl (59) 74472-33-6 NC 2.0 NA 2.0 NA NA
2,3,4,4'-Tetrachlorobiphenyl (60) 33025-41-1 NC 2.0 NA 2.0 NA NA
2,3,4,5-Tetrachlorobiphenyl (61) 33284-53-6 NC 2.0 NA 2.0 NA NA
2,3,4,6-Tetrachlorobiphenyl (62) 54230-22-7 NC 2.0 NA 2.0 NA NA
2,3,4',5-Tetrachlorobiphenyl (63) 74472-34-7 NC 2.0 NA 2.0 NA NA
2,3,4',6-Tetrachlorobiphenyl (64) 52663-58-8 NC 2.0 NA 2.0 NA NA
2,3,5,6-Tetrachlorobiphenyl (65) 33284-54-7 NC 2.0 NA 2.0 NA NA
2,3',4,4'-Tetrachlorobiphenyl (66) 32598-10-0 NC 2.0 NA 2.0 NA NA
2,3',4,5-Tetrachlorobiphenyl (67) 73575-53-8 NC 2.0 NA 2.0 NA NA
2,3',4,5'-Tetrachlorobiphenyl (68) 73575-52-7 NC 2.0 NA 2.0 NA NA
2,3',4,6-Tetrachlorobiphenyl (69) 60233-24-1 NC 2.0 NA 2.0 NA NA
2,3',4',5-Tetrachlorobiphenyl (70) 32598-11-1 NC 2.0 NA 2.0 NA NA
2,3',4',6-Tetrachlorobiphenyl (71) 41464-46-4 NC 2.0 NA 2.0 NA NA
2,3',5,5'-Tetrachlorobiphenyl (72) 41464-42-0 NC 2.0 NA 2.0 NA NA
2,3',5',6-Tetrachlorobiphenyl (73) 74338-23-1 NC 2.0 NA 2.0 NA NA
2,4,4',5-Tetrachlorobiphenyl (74) 32690-93-0 NC 2.0 NA 2.0 NA NA
2,4,4',6-Tetrachlorobiphenyl (75) 32598-12-2 NC 2.0 NA 2.0 NA NA
2,3',4',5'-Tetrachlorobiphenyl (76) 70362-48-0 NC 2.0 NA 2.0 NA NA
3,3',4,4'-Tetrachlorobiphenyl (77) 32598-13-3 243 122 NA 2.0 NA NA
3,3',4,5-Tetrachlorobiphenyl (78) 70362-49-1 NC 2.0 NA 2.0 NA NA
3,3',4,5'-Tetrachlorobiphenyl (79) 41464-48-6 NC 2.0 NA 2.0 NA NA
3,3',5,5'-Tetrachlorobiphenyl (80) 33284-52-5 NC 2.0 NA 2.0 NA NA
3,4,4',5-Tetrachlorobiphenyl (81) 70362-50-4 243 122 NA 2.0 NA NA
2,2',3,3',4-Pentachlorobiphenyl (82) 52663-62-4 NC 2.0 NA 2.0 NA NA
2,2',3,3',5-Pentachlorobiphenyl (83) 60145-20-2 NC 2.0 NA 2.0 NA NA
2,2',3,3',6-Pentachlorobiphenyl (84) 52663-60-2 NC 2.0 NA 2.0 NA NA
2,2',3,4,4'-Pentachlorobiphenyl (85) 65510-45-4 NC 2.0 NA 2.0 NA NA
2,2',3,4,5-Pentachlorobiphenyl (86) 55312-69-1 NC 2.0 NA 2.0 NA NA
2,2',3,4,5'-Pentachlorobiphenyl (87) 38380-02-8 NC 2.0 NA 2.0 NA NA
2,2',3,4,6-Pentachlorobiphenyl (88) 55215-17-3 NC 2.0 NA 2.0 NA NA
2,2',3,4,6'-Pentachlorobiphenyl (89) 73575-57-2 NC 2.0 NA 2.0 NA NA
2,2',3,4',5-Pentachlorobiphenyl (90) 68194-07-0 NC 2.0 NA 2.0 NA NA
2,2',3,4',6-Pentachlorobiphenyl (91) 68194-05-8 NC 2.0 NA 2.0 NA NA
2,2',3,5,5'-Pentachlorobiphenyl (92) 52663-61-3 NC 2.0 NA 2.0 NA NA
2,2',3,5,6-Pentachlorobiphenyl (93) 73575-56-1 NC 2.0 NA 2.0 NA NA
2,2',3,5,6'-Pentachlorobiphenyl (94) 73575-55-0 NC 2.0 NA 2.0 NA NA
2,2',3,5',6-Pentachlorobiphenyl (95) 38379-99-6 NC 2.0 NA 2.0 NA NA
2,2',3,6,6'-Pentachlorobiphenyl (96) 73575-54-9 NC 2.0 NA 2.0 NA NA
2,2',3,4',5'-Pentachlorobiphenyl (97) 41464-51-1 NC 2.0 NA 2.0 NA NA
2,2',3,4',6'-Pentachlorobiphenyl (98) 60233-25-2 NC 2.0 NA 2.0 NA NA
2,2',4,4',5-Pentachlorobiphenyl (99) 38380-01-7 NC 2.0 NA 2.0 NA NA
2,2',4,4',6-Pentachlorobiphenyl (100) 39485-83-1 NC 2.0 NA 2.0 NA NA
2,2',4,5,5'-Pentachlorobiphenyl (101) 37680-73-2 NC 2.0 NA 2.0 NA NA
2,2',4,5,6'-Pentachlorobiphenyl (102) 68194-06-9 NC 2.0 NA 2.0 NA NA
2,2',4,5',6-Pentachlorobiphenyl (103) 60145-21-3 NC 2.0 NA 2.0 NA NA
2,2',4,6,6'-Pentachlorobiphenyl (104) 56558-16-8 NC 2.0 NA 2.0 NA NA
2,3,3',4,4'-Pentachlorobiphenyl (105) 32598-14-4 243 122 NA 2.0 NA NA
2,3,3',4,5-Pentachlorobiphenyl (106) 70424-69-0 NC 2.0 NA 2.0 NA NA
2,3,3',4',5-Pentachlorobiphenyl (107) 70424-68-9 NC 2.0 NA 2.0 NA NA
2,3,3',4,5'-Pentachlorobiphenyl (108) 70362-41-3 NC 2.0 NA 2.0 NA NA
2,3,3',4,6-Pentachlorobiphenyl (109) 74472-35-8 NC 2.0 NA 2.0 NA NA
2,3,3',4',6-Pentachlorobiphenyl (110) 38380-03-9 NC 2.0 NA 2.0 NA NA

Matrix5: TI
Analytical Group: PCBCONG
Concentration Level: Other
MDLs CRQLs MDLs QLsAnalyte6
CAS Number
Risk-Based Screening Levels for
Fish
(ng/kg)
PQL Goal4
(ng/kg)
Analytical Method1
Achievable Laboratory Limits2
2,3,3',5,5'-Pentachlorobiphenyl (111) 39635-32-0 NC 2.0 NA 2.0 NA NA
2,3,3',5,6-Pentachlorobiphenyl (112) 74472-36-9 NC 2.0 NA 2.0 NA NA
2,3,3',5',6-Pentachlorobiphenyl (113) 68194-10-5 NC 2.0 NA 2.0 NA NA
2,3,4,4',5-Pentachlorobiphenyl (114) 74472-37-0 4.85 2.43 NA 2.0 NA NA
2,3,4,4',6-Pentachlorobiphenyl (115) 74472-38-1 NC 2.0 NA 2.0 NA NA
2,3,4,5,6-Pentachlorobiphenyl (116) 18259-05-7 NC 2.0 NA 2.0 NA NA
2,3,4',5,6-Pentachlorobiphenyl (117) 68194-11-6 NC 2.0 NA 2.0 NA NA
2,3',4,4',5-Pentachlorobiphenyl (118) 31508-00-6 243 122 NA 2.0 NA NA
2,3',4,4',6-Pentachlorobiphenyl (119) 56558-17-9 NC 2.0 NA 2.0 NA NA
2,3',4,5,5'-Pentachlorobiphenyl (120) 68194-12-7 NC 2.0 NA 2.0 NA NA
2,3',4,5',6-Pentachlorobiphenyl (121) 56558-18-0 NC 2.0 NA 2.0 NA NA
2,3,3',4',5'-Pentachlorobiphenyl (122) 76842-07-4 NC 2.0 NA 2.0 NA NA
2,3',4,4',5'-Pentachlorobiphenyl (123) 65510-44-3 243 122 NA 2.0 NA NA
2,3',4',5,5'-Pentachlorobiphenyl (124) 70424-70-3 NC 2.0 NA 2.0 NA NA
2,3',4',5',6-Pentachlorobiphenyl (125) 74472-39-2 NC 2.0 NA 2.0 NA NA
3,3',4,4',5-Pentachlorobiphenyl (126) 57465-28-8 NC 2.0 NA 2.0 NA NA
3,3',4,5,5'-Pentachlorobiphenyl (127) 39635-33-1 NC 2.0 NA 2.0 NA NA
2,2',3,3',4,4'-Hexachlorobiphenyl (128) 38380-07-3 NC 2.0 NA 2.0 NA NA
2,2',3,3',4,5-Hexachlorobiphenyl (129) 55215-18-4 NC 2.0 NA 2.0 NA NA
2,2',3,3',4,5'-Hexachlorobiphenyl (130) 52663-66-8 NC 2.0 NA 2.0 NA NA
2,2',3,3',4,6-Hexachlorobiphenyl (131) 61798-70-7 NC 2.0 NA 2.0 NA NA
2,2',3,3',4,6'-Hexachlorobiphenyl (132) 38380-05-1 NC 2.0 NA 2.0 NA NA
2,2',3,3',5,5'-Hexachlorobiphenyl (133) 35694-04-3 NC 2.0 NA 2.0 NA NA
2,2',3,3',5,6-Hexachlorobiphenyl (134) 52704-70-8 NC 2.0 NA 2.0 NA NA
2,2',3,3',5,6'-Hexachlorobiphenyl (135) 52744-13-5 NC 2.0 NA 2.0 NA NA
2,2',3,3',6,6'-Hexachlorobiphenyl (136) 38411-22-2 NC 2.0 NA 2.0 NA NA
2,2',3,4,4',5-Hexachlorobiphenyl (137) 35694-06-5 NC 2.0 NA 2.0 NA NA
2,2',3,4,4',5'-Hexachlorobiphenyl (138) 35065-28-2 NC 2.0 NA 2.0 NA NA
2,2',3,4,4',6-Hexachlorobiphenyl (139) 56030-56-9 NC 2.0 NA 2.0 NA NA
2,2',3,4,4',6'-Hexachlorobiphenyl (140) 59291-64-4 NC 2.0 NA 2.0 NA NA
2,2',3,4,5,5'-Hexachlorobiphenyl (141) 52712-04-6 NC 2.0 NA 2.0 NA NA
2,2',3,4,5,6-Hexachlorobiphenyl (142) 41411-61-4 NC 2.0 NA 2.0 NA NA
2,2',3,4,5,6'-Hexachlorobiphenyl (143) 68194-15-0 NC 2.0 NA 2.0 NA NA
2,2',3,4,5',6-Hexachlorobiphenyl (144) 68194-14-9 NC 2.0 NA 2.0 NA NA
2,2',3,4,6,6'-Hexachlorobiphenyl (145) 74472-40-5 NC 2.0 NA 2.0 NA NA
2,2',3,4',5,5'-Hexachlorobiphenyl (146) 51908-16-8 NC 2.0 NA 2.0 NA NA
2,2',3,4',5,6-Hexachlorobiphenyl (147) 68194-13-8 NC 2.0 NA 2.0 NA NA
2,2',3,4',5,6'-Hexachlorobiphenyl (148) 74472-41-6 NC 2.0 NA 2.0 NA NA
2,2',3,4',5',6-Hexachlorobiphenyl (149) 38380-04-0 NC 2.0 NA 2.0 NA NA
2,2',3,4',6,6'-Hexachlorobiphenyl (150) 68194-08-1 NC 2.0 NA 2.0 NA NA
2,2',3,5,5',6-Hexachlorobiphenyl (151) 52663-63-5 NC 2.0 NA 2.0 NA NA
2,2',3,5,6,6'-Hexachlorobiphenyl (152) 68194-09-2 NC 2.0 NA 2.0 NA NA
2,2',4,4',5,5'-Hexachlorobiphenyl (153) 35065-27-1 NC 2.0 NA 2.0 NA NA
2,2',4,4',5,6'-Hexachlorobiphenyl (154) 60145-22-4 NC 2.0 NA 2.0 NA NA
2,2',4,4',6,6'-Hexachlorobiphenyl (155) 33979-03-2 NC 2.0 NA 2.0 NA NA
2,3,3',4,4',5-Hexachlorobiphenyl (156) 38380-08-4 48.5 24.25 NA 2.0 NA NA
2,3,3',4,4',5'-Hexachlorobiphenyl (157) 69782-90-7 48.5 24.25 NA 2.0 NA NA
2,3,3',4,4',6-Hexachlorobiphenyl (158) 74472-42-7 NC 2.0 NA 2.0 NA NA
2,3,3',4,5,5'-Hexachlorobiphenyl (159) 39635-35-3 NC 2.0 NA 2.0 NA NA
2,3,3',4,5,6-Hexachlorobiphenyl (160) 41411-62-5 NC 2.0 NA 2.0 NA NA
2,3,3',4,5',6-Hexachlorobiphenyl (161) 74472-43-8 NC 2.0 NA 2.0 NA NA
2,3,3',4',5,5'-Hexachlorobiphenyl (162) 39635-34-2 NC 2.0 NA 2.0 NA NA
2,3,3',4',5,6-Hexachlorobiphenyl (163) 74472-44-9 NC 2.0 NA 2.0 NA NA
2,3,3',4',5',6-Hexachlorobiphenyl (164) 74472-45-0 NC 2.0 NA 2.0 NA NA
2,3,3',5,5',6-Hexachlorobiphenyl (165) 74472-46-1 NC 2.0 NA 2.0 NA NA
2,3,4,4',5,6-Hexachlorobiphenyl (166) 41411-63-6 NC 2.0 NA 2.0 NA NA
2,3',4,4',5,5'-Hexachlorobiphenyl (167) 52663-72-6 2430 1215 NA 2.0 NA NA
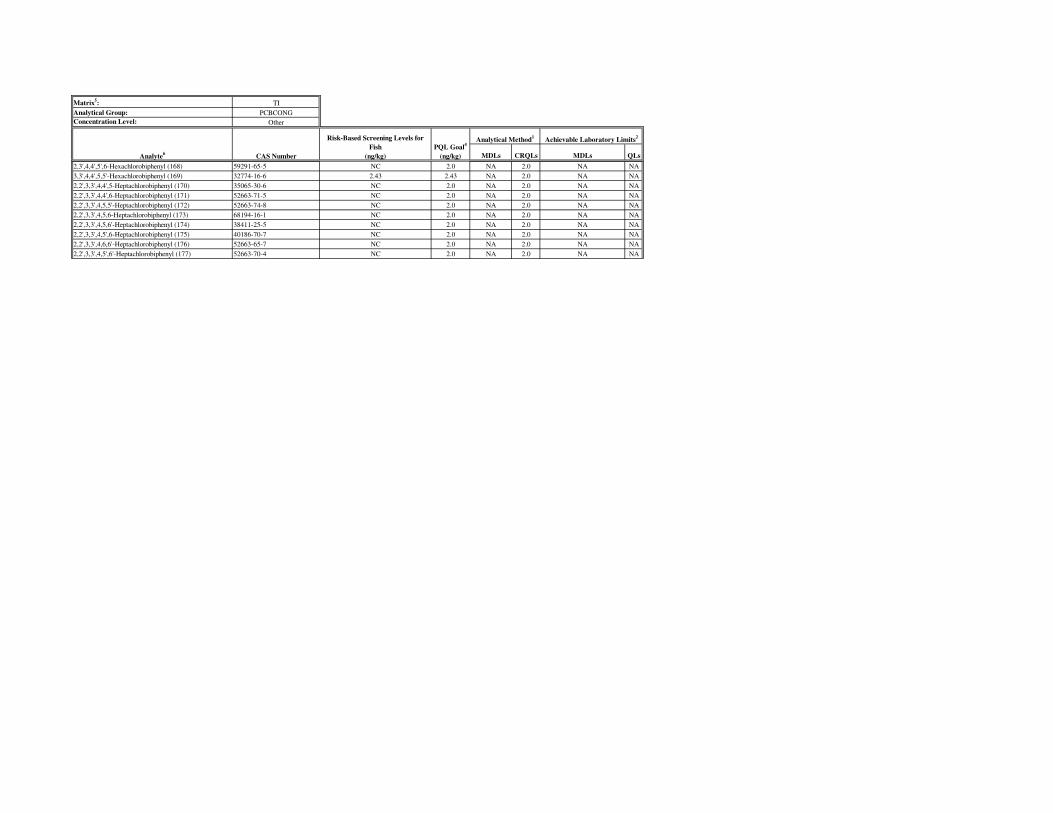
Matrix5: TI
Analytical Group: PCBCONG
Concentration Level: Other
MDLs CRQLs MDLs QLsAnalyte6
CAS Number
Risk-Based Screening Levels for
Fish
(ng/kg)
PQL Goal4
(ng/kg)
Analytical Method1
Achievable Laboratory Limits2
2,3',4,4',5',6-Hexachlorobiphenyl (168) 59291-65-5 NC 2.0 NA 2.0 NA NA
3,3',4,4',5,5'-Hexachlorobiphenyl (169) 32774-16-6 2.43 2.43 NA 2.0 NA NA
2,2',3,3',4,4',5-Heptachlorobiphenyl (170) 35065-30-6 NC 2.0 NA 2.0 NA NA
2,2',3,3',4,4',6-Heptachlorobiphenyl (171) 52663-71-5 NC 2.0 NA 2.0 NA NA
2,2',3,3',4,5,5'-Heptachlorobiphenyl (172) 52663-74-8 NC 2.0 NA 2.0 NA NA
2,2',3,3',4,5,6-Heptachlorobiphenyl (173) 68194-16-1 NC 2.0 NA 2.0 NA NA
2,2',3,3',4,5,6'-Heptachlorobiphenyl (174) 38411-25-5 NC 2.0 NA 2.0 NA NA
2,2',3,3',4,5',6-Heptachlorobiphenyl (175) 40186-70-7 NC 2.0 NA 2.0 NA NA
2,2',3,3',4,6,6'-Heptachlorobiphenyl (176) 52663-65-7 NC 2.0 NA 2.0 NA NA
2,2',3,3',4,5',6'-Heptachlorobiphenyl (177) 52663-70-4 NC 2.0 NA 2.0 NA NA
Matrix5: TI
Analytical Group: PCBCONG
Concentration Level: Other
MDLs CRQLs MDLs QLsAnalyte6
CAS Number
Risk-Based Screening Levels for
Fish
(ng/kg)
PQL Goal4
(ng/kg)
Analytical Method1
Achievable Laboratory Limits2
2,2',3,3',5,5',6-Heptachlorobiphenyl (178) 52663-67-9 NC 2.0 NA 2.0 NA NA
2,2',3,3',5,6,6'-Heptachlorobiphenyl (179) 52663-64-6 NC 2.0 NA 2.0 NA NA
2,2',3,4,4',5,5'-Heptachlorobiphenyl (180) 35065-29-3 NC 2.0 NA 2.0 NA NA
2,2',3,4,4',5,6-Heptachlorobiphenyl (181) 74472-47-2 NC 2.0 NA 2.0 NA NA
2,2',3,4,4',5,6'-Heptachlorobiphenyl (182) 60145-23-5 NC 2.0 NA 2.0 NA NA
2,2',3,4,4',5',6-Heptachlorobiphenyl (183) 52663-69-1 NC 2.0 NA 2.0 NA NA
2,2',3,4,4',6,6'-Heptachlorobiphenyl (184) 74472-48-3 NC 2.0 NA 2.0 NA NA
2,2',3,4,5,5',6-Heptachlorobiphenyl (185) 52712-05-7 NC 2.0 NA 2.0 NA NA
2,2',3,4,5,6,6'-Heptachlorobiphenyl (186) 74472-49-4 NC 2.0 NA 2.0 NA NA
2,2',3,4',5,5',6-Heptachlorobiphenyl (187) 52663-68-0 NC 2.0 NA 2.0 NA NA
2,2',3,4',5,6,6'-Heptachlorobiphenyl (188) 74487-85-7 NC 2.0 NA 2.0 NA NA
2,3,3',4,4',5,5'-Heptachlorobiphenyl (189) 39635-31-9 243 122 NA 2.0 NA NA
2,3,3',4,4',5,6-Heptachlorobiphenyl (190) 41411-64-7 NC 2.0 NA 2.0 NA NA
2,3,3',4,4',5',6-Heptachlorobiphenyl (191) 74472-50-7 NC 2.0 NA 2.0 NA NA
2,3,3',4,5,5',6-Heptachlorobiphenyl (192) 74472-51-8 NC 2.0 NA 2.0 NA NA
2,3,3',4',5,5',6-Heptachlorobiphenyl (193) 69782-91-8 NC 2.0 NA 2.0 NA NA
2,2',3,3',4,4',5,5'-Octachlorobiphenyl (194) 35694-08-7 NC 2.0 NA 2.0 NA NA
2,2',3,3',4,4',5,6-Octachlorobiphenyl (195) 52663-78-2 NC 2.0 NA 2.0 NA NA
2,2',3,3',4,4',5,6'-Octachlorobiphenyl (196) 42740-50-1 NC 2.0 NA 2.0 NA NA
2,2',3,3',4,4',6,6'-Octachlorobiphenyl (197) 33091-17-7 NC 2.0 NA 2.0 NA NA
2,2',3,3',4,5,5',6-Octachlorobiphenyl (198) 68194-17-2 NC 2.0 NA 2.0 NA NA
2,2',3,3',4,5,5',6'-Octachlorobiphenyl (199) 52663-75-9 NC 2.0 NA 2.0 NA NA
2,2',3,3',4,5,6,6'-Octachlorobiphenyl (200) 52663-73-7 NC 2.0 NA 2.0 NA NA
2,2',3,3',4,5',6,6'-Octachlorobiphenyl (201) 40186-71-8 NC 2.0 NA 2.0 NA NA
2,2',3,3',5,5',6,6'-Octachlorobiphenyl (202) 2136-99-4 NC 2.0 NA 2.0 NA NA
2,2',3,4,4',5,5',6-Octachlorobiphenyl (203) 52663-76-0 NC 2.0 NA 2.0 NA NA
2,2',3,4,4',5,6,6'-Octachlorobiphenyl (204) 74472-52-9 NC 2.0 NA 2.0 NA NA
2,3,3',4,4',5,5',6-Octachlorobiphenyl (205) 74472-53-0 NC 2.0 NA 2.0 NA NA
2,2',3,3',4,4',5,5',6-Nonachlorobiphenyl (206) 40186-72-9 NC 2.0 NA 2.0 NA NA
2,2',3,3',4,4',5,6,6'-Nonachlorobiphenyl (207) 52663-79-3 NC 2.0 NA 2.0 NA NA
2,2',3,3',4,5,5',6,6'-Nonachlorobiphenyl (208) 52663-77-1 NC 2.0 NA 2.0 NA NA
Decachlorobiphenyl (209) 2051-24-3 NC NA NA NA NA NA
Total Monochlorobiphenyls 27323-18-8 NC NA NA NA NA NA
Total Dichlorobiphenyls 25512-42-9 NC NA NA NA NA NA
Total Trichlorobiphenyls 25323-68-6 NC NA NA NA NA NA
Total Tetrachlorobiphenyls 26914-33-0 NC NA NA NA NA NA
Total Pentachlorobiphenyls 25429-29-2 NC NA NA NA NA NA
Total Hexachlorobiphenyls 26601-64-9 NC NA NA NA NA NA
Total Heptachlorobiphenyls 28655-71-2 NC NA NA NA NA NA
Total Octachlorobiphenyls 31472-83-0 NC NA NA NA NA NA
Total Nonachlorobiphenyls 53742-07-7 NC NA NA NA NA NA
Shading indicates PALs for which the PAL < CRQL.
NC: No screening level.4The PQL Goal is 1/2 the lowest PAL, the lowest PAL, or the CRQL, as applicable.
5TI = Tissue (Other)
6Due to co-elutions, the PCBCONG compound list is laboratory-specific. All 209 congeners shall be reported, even though some may co-elute.
1Analytical MDLs and QLs are those documented in validated methods. EPA CLP CBC01.2 provides a CRQL but not an MDL. Units are the same as in the PQL column.
2Achievable MDLs and QLs are limits that an individual laboratory can achieve when performing a specific analytical method. QLs and MDLs are specific to the CLP laboratory that
provides the analysis. Units are the same as in the PQL column.
QAPP Worksheet #15-14
(UFP-QAPP Manual Section 2.8.1)
Reference Limits and Evaluation Table
Matrix5: SD, CSD, SB
Analytical Group: METAL
Concentration Level: ICP-AES3
MDLs CRQLs MDLs QLs
Aluminum 7429-90-5 7700 NC 3850 NA 20 NA NA
Antimony 7440-36-0 3.1 NC 3.1 NA 6 NA NA
Arsenic 7440-38-2 0.39 8.2 0.39 NA 1 NA NA
Barium 7440-39-3 1500 NC 750 NA 20 NA NA
Beryllium 7440-41-7 16 NC 8.0 NA 0.5 NA NA
Cadmium 7440-43-9 7 1.2 0.6 NA 0.5 NA NA
Calcium 7440-70-2 NC NC 500 NA 500 NA NA
Chromium 7440-47-3 0.29 81 0.29 NA 1 NA NA
Cobalt 7440-48-4 2.3 NC 2.3 NA 5 NA NA
Copper 7440-50-8 310 34 17 NA 2.5 NA NA
Iron 7439-89-6 5500 NC 2750 NA 10 NA NA
Lead 7439-92-1 400 46.7 23 NA 1 NA NA
Magnesium 7439-95-4 NC NC 500 NA 500 NA NA
Manganese 7439-96-5 180 NC 90 NA 1.5 NA NA
Mercury 7439-97-6 2.4 0.15 0.15 NA 0.1 NA NA
Nickel 7440-02-0 160 20.9 10.5 NA 4 NA NA
Potassium 7440-09-7 NC NC 500 NA 500 NA NA
Selenium 7782-49-2 39 NC 19.5 NA 3.5 NA NA
Silver 7440-22-4 39 1 1 NA 1 NA NA
Sodium 7440-23-5 NC NC 500 NA 500 NA NA
Thallium 7440-28-0 NC NC 2.5 NA 2.5 NA NA
Vanadium 7440-62-2 39 NC 20 NA 5 NA NA
Zinc 7440-66-6 2400 150 75 NA 6 NA NA
Cyanide 57-12-5 160 NC 80 NA 2.5 NA NA
Shading indicates PALs for which the PAL < CRQL.
3Concentration Range "ICP-AES" includes mercury by CVAA and cyanide by spectrophotometer as per EPA CLP ILM05.4 .
NC: No screening level. Note that calcium, magnesium, potassium, and sodium are nutrients.
CAS NumberAnalyte
PQL Goal4
(ug/kg)
For SB, SD, and CSD
Residential Soil RSL (adjusted)
(mg/kg)
For SD and CSD
Region II Eco (NY SED Marine)3
(mg/kg)
5SD = Sediment (ICP-AES); CSD = CSO Sediment (ICP-AES); SB = Subsurface Soil (ICP-AES)
4The PQL Goal is 1/2 the lowest PAL, the lowest PAL, or the CRQL, as applicable.
2Achievable MDLs and QLs are limits that an individual laboratory can achieve when performing a specific analytical method. QLs and MDLs are specific to the CLP laboratory that provides the analysis.
Units are the same as in the PQL column.
1Analytical MDLs and QLs are those documented in validated methods. EPA CLP ILM05.4 provides a CRQL but not an MDL. Units are the same as in the PQL column.
Achievable Laboratory Limits2
Analytical Method1
QAPP Worksheet #15-15
(UFP-QAPP Manual Section 2.8.1)
Reference Limits and Evaluation Table
Matrix5:
GW, CSW,
SW, AQ
Analytical Group:
METAL and
FMETAL7
Concentration Level:
ICP-AES3 and
ICP-MS
MDLs CRQLs MDLs QLs
Aluminum 7429-90-5 ICP-AES NC 3700 NC NC 3700 3700 1850 NA 200 NA NA
Antimony 7440-36-0 ICP-MS 6 1.5 640 NC 1.5 640 1.5 NA 2 NA NA
Arsenic 7440-38-2 ICP-MS 10 0.045 0.14 36 0.045 0.14 0.045 NA 1 NA NA
Barium 7440-39-3 ICP-MS 2000 730 NC NC 730 730 365 NA 10 NA NA
Beryllium 7440-41-7 ICP-MS 4 7.3 NC NC 4 7.3 2 NA 1 NA NA
Cadmium 7440-43-9 ICP-MS 5 1.8 NC 7.7 1.8 1.8 0.90 NA 1 NA NA
Calcium 7440-70-2 ICP-AES NC NC NC NC NC NC 5000 NA 5000 NA NA
Chromium 7440-47-3 ICP-MS 100 0.043 NC 50 0.043 0.043 0.043 NA 2 NA NA
Cobalt 7440-48-4 ICP-MS NC 1.1 NC NC 1.1 1.1 0.55 NA 1 NA NA
Copper 7440-50-8 ICP-MS 1300 150 NC 3.4 150 3.4 1.7 NA 2 NA NA
Iron 7439-89-6 ICP-AES NC 2600 NC NC 2600 2600 1300 NA 100 NA NA
Lead 7439-92-1 ICP-MS 15 NC NC 8 15 8 4 NA 1 NA NA
Magnesium 7439-95-4 ICP-AES NC NC NC NC NC NC 5000 NA 5000 NA NA
Manganese 7439-96-5 ICP-MS NC 88 100 NC 88 100 44 NA 1 NA NA
Mercury 7439-97-6 ICP-AES 2 1.1 NC 0.94 1.1 0.94 0.47 NA 0.2 NA NA
Nickel 7440-02-0 ICP-MS NC 73 4600 8.2 73 8.2 4.1 NA 1 NA NA
Potassium 7440-09-7 ICP-AES NC NC NC NC NC NC 5000 NA 5000 NA NA
Selenium 7782-49-2 ICP-MS 50 18 4200 71 18 71 9 NA 5 NA NA
Silver 7440-22-4 ICP-MS NC 18 NC 1.9 18 1.9 0.95 NA 1 NA NA
Sodium 7440-23-5 ICP-AES NC NC NC NC NC NC 5000 NA 5000 NA NA
Thallium 7440-28-0 ICP-MS 2 NC 0.47 NC 2 0.47 0.47 NA 1 NA NA
Vanadium 7440-62-2 ICP-MS NC 18 NC NC 18 18 9 NA 1 NA NA
Zinc 7440-66-6 ICP-MS NC 1100 26000 66 1100 66 33 NA 2 NA NA
Cyanide7 57-12-5 ICP-AES 200 73 140 1 73 1 1 NA 10 NA NA
Shading indicates PALs for which the PAL < CRQL.
3Concentration Range "ICP-AES" includes mercury by CVAA and cyanide by spectrophotometer as per EPA CLP ILM05.4 .
NC: No screening level. Note that calcium, magnesium, potassium, and sodium are nutrients.
7Cyanide is not part of the FMETAL group. Aqueous blanks associated with solid samples will not be analyzed for FMETAL.
5GW = Groundwater (ICP-AES and ICP-MS); CSW = CSO Surface Water (ICP-AES and ICP-MS); SW = Surface Water (ICP-AES and ICP-MS); AQ = Aqueous (ICP-AES or ICP-AES and ICP-MS). Aqueous blanks will be analyzed via the same concentration
range as the samples they are associated with.
6The selected GW PAL is the lesser of MCLs or Tap Water RSLs (adjusted). The selected SW and CSW PAL is the lesser of Region II Eco (NY SW Marine) or [Tap Water RSLs (adjusted) if no 'National Recommended Water Quality Criteria for Human Health for
Consumption of Organism only' limit].
4The PQL Goal is 1/2 the lowest PAL, the lowest PAL, or the CRQL, as applicable.
Achievable Laboratory Limits2
1Analytical MDLs and QLs are those documented in validated methods. EPA CLP ILM05.4 provides a CRQL but not an MDL. Units are the same as in the PQL column.
2Achievable MDLs and QLs are limits that an individual laboratory can achieve when performing a specific analytical method. QLs and MDLs are specific to the CLP laboratory that provides the analysis. Units are the same as in the PQL column.
Concentration
Range3
MCLs
(ug/L)
Tap Water RSL
(adjusted)
(ug/L)
National Recommended
Water Quality Criteria for
Human Health for
Consumption of Organism
only
(ug/L)
Analytical Method1
Region II Eco
(NY SW
Marine)
(ug/L)Analyte CAS Number
Selected GW PAL6
(ug/L)
Selected SW and CSW PAL6
(ug/L)
PQL Goal4
(ug/L)
QAPP Worksheet #15-16
(UFP-QAPP Manual Section 2.8.1)
Reference Limits and Evaluation Table
Matrix5: TI
Analytical Group: METAL
Concentration Level: ICP-AES3
MDLs CRQLs MDLs QLs
Arsenic 7440-38-2 0.0021 0.0021 NA 1 NA NA
Cadmium 7440-43-9 1.35 0.68 NA 0.5 NA NA
Chromium 7440-47-3 0.00631 0.00631 NA 1 NA NA
Copper 7440-50-8 54.1 27 NA 2.5 NA NA
Lead 7439-92-1 0.000135 0.000135 NA 1 NA NA
Mercury 7439-97-6 0.406 0.20 NA 0.1 NA NA
Nickel 7440-02-0 27 13.5 NA 4 NA NA
Selenium 7782-49-2 6.76 6.76 NA 3.5 NA NA
Silver 7440-22-4 6.76 3.4 NA 1 NA NA
Zinc 7440-66-6 406 203 NA 6 NA NA
Shading indicates PALs for which the PAL < CRQL.
3Concentration Range "ICP-AES" includes mercury by CVAA.
NC: No screening level. Note that calcium, magnesium, potassium, and sodium are nutrients.
2Achievable MDLs and QLs are limits that an individual laboratory can achieve when performing a specific analytical method. QLs and MDLs are specific to the
CLP laboratory that provides the analysis. Units are the same as in the PQL column.
5TI = Tissue (ICP-AES)
6Hexavalent Chromium used as a surrogate for chromium. Tetraethyl lead used as a surrogate for lead. Mercury, inorganic salts used as a surrogate for mercury.
Analyte CAS Number
Risk-Based Screening Levels for
Fish6
(mg/kg)
PQL Goal4
(mg/kg)
Analytical Method1
Achievable Laboratory Limits2
4The PQL Goal is 1/2 the lowest PAL, the lowest PAL, or the CRQL, as applicable.
1Analytical MDLs and QLs are those documented in validated methods. EPA CLP ILM05.4 provides a CRQL but not an MDL. Units are the same as in the PQL
column.
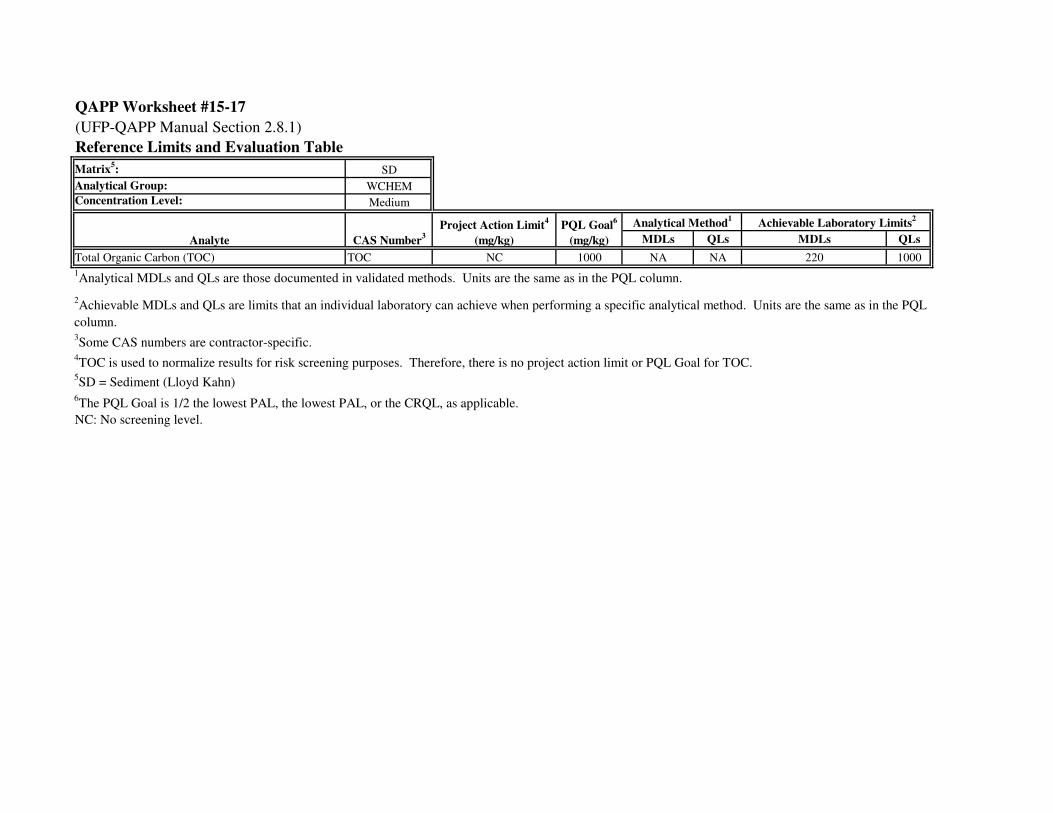
QAPP Worksheet #15-17
(UFP-QAPP Manual Section 2.8.1)
Reference Limits and Evaluation Table
Matrix5: SD
Analytical Group: WCHEM
Concentration Level: Medium
MDLs QLs MDLs QLs
Total Organic Carbon (TOC) TOC NC 1000 NA NA 220 1000
3Some CAS numbers are contractor-specific.
NC: No screening level.
Analyte
PQL Goal6
(mg/kg)
Project Action Limit4
(mg/kg)
5SD = Sediment (Lloyd Kahn)
6The PQL Goal is 1/2 the lowest PAL, the lowest PAL, or the CRQL, as applicable.
4TOC is used to normalize results for risk screening purposes. Therefore, there is no project action limit or PQL Goal for TOC.
2Achievable MDLs and QLs are limits that an individual laboratory can achieve when performing a specific analytical method. Units are the same as in the PQL
column.
1Analytical MDLs and QLs are those documented in validated methods. Units are the same as in the PQL column.
Achievable Laboratory Limits2
Analytical Method1
CAS Number3
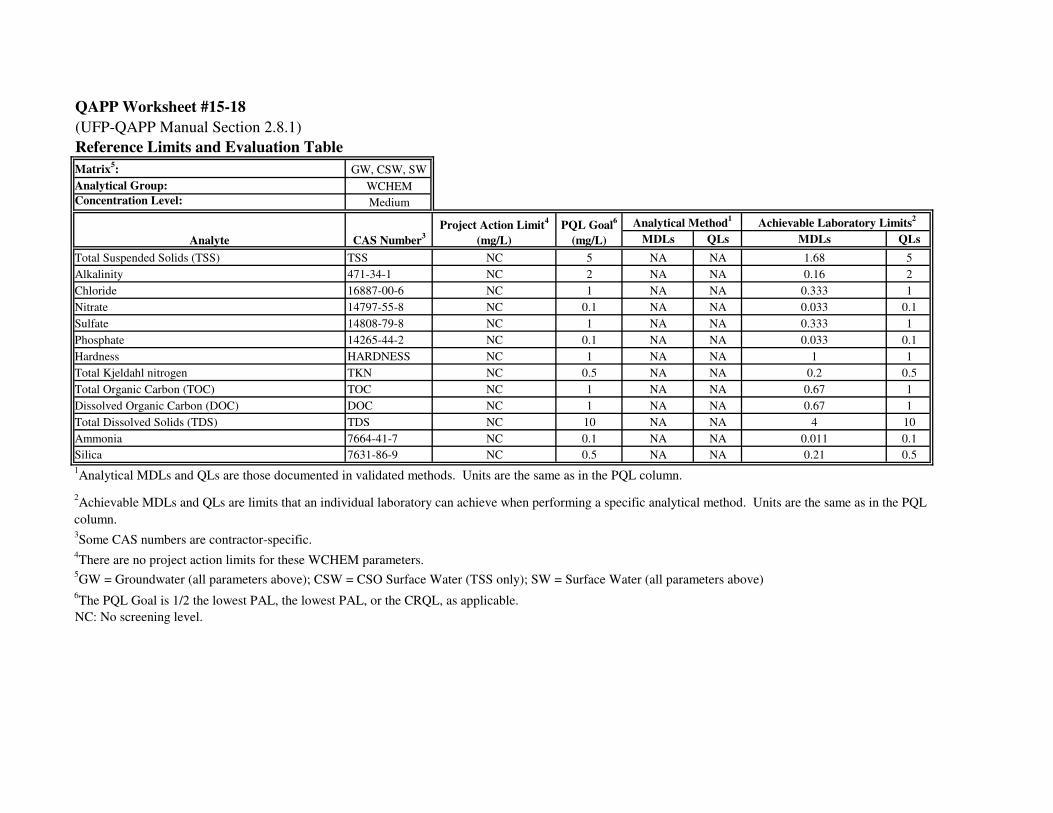
QAPP Worksheet #15-18
(UFP-QAPP Manual Section 2.8.1)
Reference Limits and Evaluation Table
Matrix5: GW, CSW, SW
Analytical Group: WCHEM
Concentration Level: Medium
MDLs QLs MDLs QLs
Total Suspended Solids (TSS) TSS NC 5 NA NA 1.68 5
Alkalinity 471-34-1 NC 2 NA NA 0.16 2
Chloride 16887-00-6 NC 1 NA NA 0.333 1
Nitrate 14797-55-8 NC 0.1 NA NA 0.033 0.1
Sulfate 14808-79-8 NC 1 NA NA 0.333 1
Phosphate 14265-44-2 NC 0.1 NA NA 0.033 0.1
Hardness HARDNESS NC 1 NA NA 1 1
Total Kjeldahl nitrogen TKN NC 0.5 NA NA 0.2 0.5
Total Organic Carbon (TOC) TOC NC 1 NA NA 0.67 1
Dissolved Organic Carbon (DOC) DOC NC 1 NA NA 0.67 1
Total Dissolved Solids (TDS) TDS NC 10 NA NA 4 10
Ammonia 7664-41-7 NC 0.1 NA NA 0.011 0.1
Silica 7631-86-9 NC 0.5 NA NA 0.21 0.5
3Some CAS numbers are contractor-specific.
NC: No screening level.
6The PQL Goal is 1/2 the lowest PAL, the lowest PAL, or the CRQL, as applicable.
Analyte CAS Number3
Project Action Limit4
(mg/L)
PQL Goal6
(mg/L)
Analytical Method1
Achievable Laboratory Limits2
1Analytical MDLs and QLs are those documented in validated methods. Units are the same as in the PQL column.
2Achievable MDLs and QLs are limits that an individual laboratory can achieve when performing a specific analytical method. Units are the same as in the PQL
column.
4There are no project action limits for these WCHEM parameters.
5GW = Groundwater (all parameters above); CSW = CSO Surface Water (TSS only); SW = Surface Water (all parameters above)
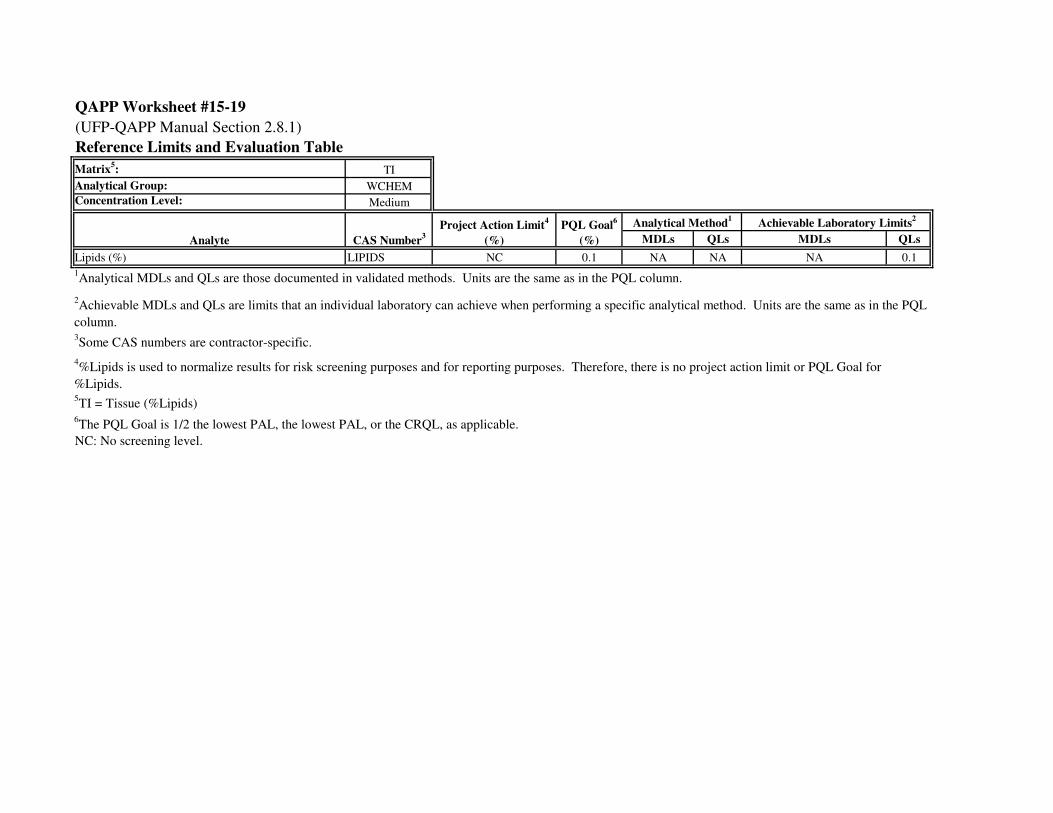
QAPP Worksheet #15-19
(UFP-QAPP Manual Section 2.8.1)
Reference Limits and Evaluation Table
Matrix5: TI
Analytical Group: WCHEM
Concentration Level: Medium
MDLs QLs MDLs QLs
Lipids (%) LIPIDS NC 0.1 NA NA NA 0.1
3Some CAS numbers are contractor-specific.
NC: No screening level.
6The PQL Goal is 1/2 the lowest PAL, the lowest PAL, or the CRQL, as applicable.
Analyte CAS Number3
Project Action Limit4
(%)
PQL Goal6
(%)
Analytical Method1
Achievable Laboratory Limits2
1Analytical MDLs and QLs are those documented in validated methods. Units are the same as in the PQL column.
2Achievable MDLs and QLs are limits that an individual laboratory can achieve when performing a specific analytical method. Units are the same as in the PQL
column.
4%Lipids is used to normalize results for risk screening purposes and for reporting purposes. Therefore, there is no project action limit or PQL Goal for
%Lipids.5TI = Tissue (%Lipids)
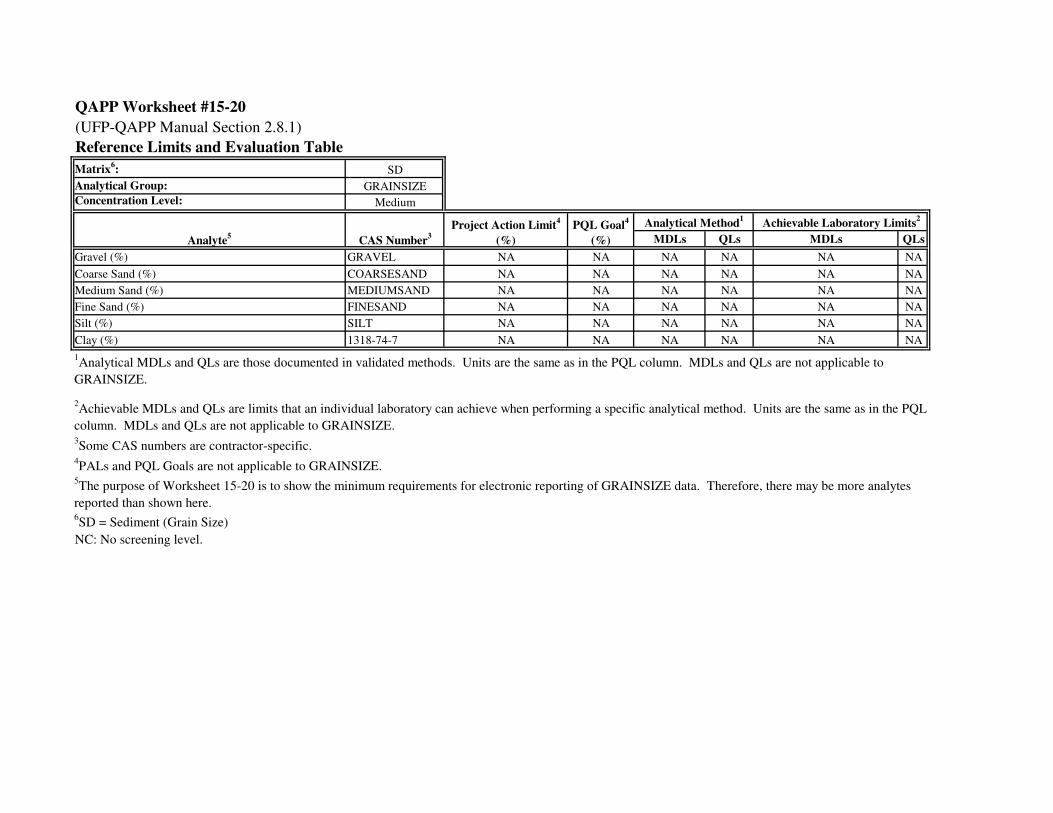
QAPP Worksheet #15-20
(UFP-QAPP Manual Section 2.8.1)
Reference Limits and Evaluation Table
Matrix6: SD
Analytical Group: GRAINSIZE
Concentration Level: Medium
MDLs QLs MDLs QLs
Gravel (%) GRAVEL NA NA NA NA NA NA
Coarse Sand (%) COARSESAND NA NA NA NA NA NA
Medium Sand (%) MEDIUMSAND NA NA NA NA NA NA
Fine Sand (%) FINESAND NA NA NA NA NA NA
Silt (%) SILT NA NA NA NA NA NA
Clay (%) 1318-74-7 NA NA NA NA NA NA
3Some CAS numbers are contractor-specific.
NC: No screening level.
Analyte5
PQL Goal4
(%)
Project Action Limit4
(%)
6SD = Sediment (Grain Size)
5The purpose of Worksheet 15-20 is to show the minimum requirements for electronic reporting of GRAINSIZE data. Therefore, there may be more analytes
reported than shown here.
4PALs and PQL Goals are not applicable to GRAINSIZE.
2Achievable MDLs and QLs are limits that an individual laboratory can achieve when performing a specific analytical method. Units are the same as in the PQL
column. MDLs and QLs are not applicable to GRAINSIZE.
1Analytical MDLs and QLs are those documented in validated methods. Units are the same as in the PQL column. MDLs and QLs are not applicable to
GRAINSIZE.
Achievable Laboratory Limits2
Analytical Method1
CAS Number3
QAPP Worksheet #15-21
(UFP-QAPP Manual Section 2.8.1)
Reference Limits and Evaluation Table
Matrix6: SD
Analytical Group: AVSSEM
Concentration Level: Medium
MDLs QLs MDLs QLs
Acid volatile sulfide ACIDSO2 NC 1 NA NA 0.47 0.5
Cadmium 7440-43-9 NC 0.11 NA NA 0.0002 0.11
Copper 7440-50-8 NC 0.1 NA NA 0.0012 0.098
Lead 7439-92-1 NC 0.0 NA NA 0.0011 0.012
Mercury 7439-97-6 NC 0.000 NA NA 0.00012 0.00012
Nickel 7440-02-0 NC 0.2 NA NA 0.0014 0.17
Zinc 7440-66-6 NC 0.1 NA NA 0.076 0.09
Silver 7440-22-4 NC 0.0 NA NA 0.00025 0.023
NC: No screening level.
PQL Goal3
(uMol/g)
Analytical Method1
Achievable Laboratory Limits2
1Analytical MDLs and QLs are those documented in validated methods. Units are the same as in the PQL column.
2Achievable MDLs and QLs are limits that an individual laboratory can achieve when performing a specific analytical method. Units are the same as in the PQL
column.
4PALs and PQL Goals are not applicable to AVSSEM.
6SD = Sediment (AVS/SEM)
3The PQL Goal is 1/2 the lowest PAL, the lowest PAL, or the CRQL, as applicable.
Analyte5
CAS Number
Project Action Limit4
(uMole/g)
QAPP Worksheet #15-22
(UFP-QAPP Manual Section 2.8.1)
Reference Limits and Evaluation Table
Matrix5: AR
Analytical Group: VOA
Concentration Level:
Medium, Low-
Level
MDLs QLs MDLs QLs
Acetone 67-64-1 Medium NC 32200 16100 NA NA 0.99 12
Benzene 71-43-2 Low-Level 0.312 31.3 0.156 NA NA 0.0011 0.03
Bromodichloromethane 75-27-4 Low-Level 0.0658 NC 0.0658 NA NA 0.0025 0.070
Bromoform 75-25-2 Low-Level 2.21 NC 1.11 NA NA 0.0041 0.1
Carbon Disulfide 75-15-0 Medium NC 730 365 NA NA 0.009 1.6
Chloroform 67-66-3 Low-Level 0.106 102 0.0530 NA NA 0.0033 0.05
Chlorobenzene 108-90-7 Medium NC 52.1 26.1 NA NA 0.011 0.92
Chloromethane 74-87-3 Medium NC 93.9 47.0 NA NA 0.021 1.03
Dibromochloromethane 124-48-1 Low-Level 0.0901 NC 0.0901 NA NA 0.0015 0.1
Ethylbenzene 100-41-4 Low-Level 0.973 1040 0.487 NA NA 0.0037 0.04
Methylene Chloride 75-09-2 Low-Level 5.18 1090 2.59 NA NA 0.012 0.69
Methyl-tert-butyl ether (MTBE) 1634-04-4 Low-Level 9.36 3130 4.68 NA NA 0.0058 0.04
2-Butanone 78-93-3 Medium NC 5210 2605 NA NA 0.033 1.5
Styrene 100-42-5 Medium NC 1040 520 NA NA 0.0086 0.85
Toluene 108-88-3 Low-Level NC 5210 2605 NA NA 0.0045 0.04
Trichloroethylene 79-01-6 Low-Level 1.22 NC 0.610 NA NA 0.0035 0.05
Xylene, total 1330-20-7 Low-Level NC 104 52 NA NA 0.0046 0.09
Shading indicates PALs for which the PAL < CRQL.
4The PQL Goal is 1/2 the lowest PAL, the lowest PAL, or the CRQL, as applicable.
NC: No screening level.
AR AL2 (NC)
(ug/m3)
PQL Goal4
(ug/m3)
Analytical Method1
Achievable Laboratory Limits2
1Analytical MDLs and QLs are those documented in validated methods. Units are the same as in the PQL Goal column.
2Achievable MDLs and QLs are limits that an individual laboratory can achieve when performing a specific analytical method. Units are the same as in the PQL column.
5AR = Air (Medium, Low-Level)
Concentration
LevelAnalyte CAS Number
AR AL1 (C)
(ug/m3)
QAPP Worksheet #15-23
(UFP-QAPP Manual Section 2.8.1)
Reference Limits and Evaluation Table
Matrix5: AR
Analytical Group: SVOA
Concentration Level: SIM
MDLs QLs MDLs QLs
Acenaphthene 83-32-9 NC NC 0.069 NA NA 0.00173 0.069
Anthracene 120-12-7 NC NC 0.069 NA NA 0.00125 0.069
Benz[a]anthracene 56-55-3 0.00873 NC 0.00873 NA NA 0.000967 0.069
Benzo[a]pyrene 50-32-8 0.000873 NC 0.000873 NA NA 0.00125 0.069
Benzo[b]fluoranthene 205-99-2 0.00873 NC 0.00873 NA NA 0.00158 0.069
Benzo[k]fluoranthene 207-08-9 0.00873 NC 0.00873 NA NA 0.00135 0.069
Chrysene 218-01-9 0.0873 NC 0.0873 NA NA 0.00404 0.069
Dibenz[a,h]anthracene 53-70-3 0.0008 NC 0.000800 NA NA 0.00189 0.069
Fluoranthene 206-44-0 NC NC 0.069 NA NA 0.000993 0.069
Fluorene 86-73-7 NC NC 0.069 NA NA 0.00277 0.069
Indeno[1,2,3-cd]pyrene 193-39-5 0.00873 NC 0.00873 NA NA 0.00129 0.069
Naphthalene 91-20-3 0.0716 3.13 0.0716 NA NA 0.0123 0.139
Pyrene 129-00-0 NC NC 0.069 NA NA 0.00123 0.069
Acenaphthylene 208-96-8 NC NC 0.069 NA NA 0.00131 0.069
Phenanthrene 85-01-8 NC NC 0.069 NA NA 0.00321 0.069
Benzo(g,h,i) perylene 191-24-2 NC NC 0.069 NA NA 0.00186 0.069
Shading indicates PALs for which the PAL < CRQL.
4The PQL Goal is 1/2 the lowest PAL, the lowest PAL, or the CRQL, as applicable.
NC: No screening level.
Analytical Method1
Achievable Laboratory Limits2
1Analytical MDLs and QLs are those documented in validated methods. Units are the same as in the PQL Goal column.
2Achievable MDLs and QLs are limits that an individual laboratory can achieve when performing a specific analytical method. Units are the same as in the PQL column.
Achievable laboratory QLs for AR SVOAs assume 7.2m3 of air (5LPM for 24 hrs).
5AR = Air (PAHs)
Analyte CAS Number
AR AL1 (C)
(ug/m3)
AR AL2 (NC)
(ug/m3)
PQL Goal4
(ug/m3)
QAPP Worksheet #15-24
(UFP-QAPP Manual Section 2.8.1)
Reference Limits and Evaluation Table
Matrix5: AR
Analytical Group: PCB
Concentration Level: SIM
MDLs QLs MDLs QLs
Aroclor 1016 12674-11-2 0.122 NC 0.061 NA NA 0.000024 0.0014
Aroclor 1221 11104-28-2 0.00426 NC 0.0021 NA NA 0.000061 0.0014
Aroclor 1232 11141-16-5 0.00426 NC 0.0021 NA NA 0.000033 0.0014
Aroclor 1242 53469-21-9 0.00426 NC 0.0021 NA NA 0.000028 0.0014
Aroclor 1248 12672-29-6 0.00426 NC 0.0021 NA NA 0.000028 0.0014
Aroclor 1254 11097-69-1 0.00426 NC 0.0021 NA NA 0.000020 0.0014
Aroclor 1260 11096-82-5 0.00426 NC 0.0021 NA NA 0.000020 0.0014
Shading indicates PALs for which the PAL < CRQL.
4The PQL Goal is 1/2 the lowest PAL, the lowest PAL, or the CRQL, as applicable.
NC: No screening level.
Achievable Laboratory Limits2
1Analytical MDLs and QLs are those documented in validated methods. Units are the same as in the PQL Goal column.
2Achievable MDLs and QLs are limits that an individual laboratory can achieve when performing a specific analytical method. Units are the same as in the PQL column.
Achievable laboratory QLs for AR PCBs assume 360m3 of air (250LPM for 24 hrs).
5AR = Air (Typical PCBs)
Analyte CAS Number
AR AL1 (C)
(ug/m3)
AR AL2 (NC)
(ug/m3)
PQL Goal4
(ug/m3)
Analytical Method1
QAPP Worksheet #15-25
(UFP-QAPP Manual Section 2.8.1)
Reference Limits and Evaluation Table
Matrix4: SD, SB, AQ
Analytical Group: REACT
Concentration Level: Medium
MDLs QLs MDLs QLs
Reactive cyanide REACT-CN 250 125 NA NA NA 0.5
Reactive sulfide REACT-S 500 250 NA NA 12.26 20
Shading indicates PALs for which the PAL < CRQL.
3Some CAS numbers are contractor-specific.
4SD = Sediment (Reactive CN, S); SB = Subsurface Soil (Reactive CN, S); AQ = Aqueous (Reactive CN, S)
5The PQL Goal is 1/2 the lowest PAL, the lowest PAL, or the QL, as applicable.
2Achievable MDLs and QLs are limits that an individual laboratory can achieve when performing a specific analytical method. Units are the same as in the PQL
column.
1Analytical MDLs and QLs are those documented in validated methods. Units are the same as in the PQL column.
Achievable Laboratory Limits2
Analytical Method1
CAS Number3
Analyte
PQL Goal5
(mg/kg or mg/L)
40 CFR 261.23
(mg/kg)
QAPP Worksheet #15-26
(UFP-QAPP Manual Section 2.8.1)
Reference Limits and Evaluation Table
Matrix4: SD, SB, AQ
Analytical Group: CORR
Concentration Level: Medium
MDLs QLs MDLs QLs
Corrosivity (pH Units) CORR 2.5 < pH < 12.5 NA NA NA NA NA
Shading indicates PALs for which the PAL < CRQL.
3Some CAS numbers are contractor-specific.
4SD = Sediment (Corrosivity (pH)); SB = Subsurface Soil (Corrosivity (pH)); AQ = Aqueous (Corrosivity (pH))
5The PQL Goal is 1/2 the lowest PAL, the lowest PAL, or the QL, as applicable.
1Analytical MDLs and QLs are those documented in validated methods. Units are the same as in the PQL column. MDLs and QLs are not applicable to
CORR.
2Achievable MDLs and QLs are limits that an individual laboratory can achieve when performing a specific analytical method. Units are the same as in the
PQL column. MDLs and QLs are not applicable to CORR.
Achievable Laboratory Limits2
Analytical Method1
CAS Number3
Analyte
PQL Goal5
(PH)
40 CFR 261.22
(PH)
QAPP Worksheet #15-27
(UFP-QAPP Manual Section 2.8.1)
Reference Limits and Evaluation Table
Matrix4: SD, SB, AQ
Analytical Group: IGN
Concentration Level: Medium
MDLs QLs MDLs QLs
Ignitability IGN 140 NA NA NA NA NA
Shading indicates PALs for which the PAL < CRQL.
3Some CAS numbers are contractor-specific.
4SD = Sediment (Ignitability); SB = Subsurface Soil (Ignitability); AQ = Aqueous (Ignitability)
5The PQL Goal is 1/2 the lowest PAL, the lowest PAL, or the QL, as applicable.
1Analytical MDLs and QLs are those documented in validated methods. Units are the same as in the PQL column. MDLs and QLs are not applicable to
IGN.
2Achievable MDLs and QLs are limits that an individual laboratory can achieve when performing a specific analytical method. Units are the same as in the
PQL column. MDLs and QLs are not applicable to IGN.
Achievable Laboratory Limits2
Analytical Method1
CAS Number3
Analyte
PQL Goal
(DEG_F)
40 CFR 261.21
(DEG_F)

QAPP Worksheet #15-28
(UFP-QAPP Manual Section 2.8.1)
Reference Limits and Evaluation Table
Matrix4: SD, SB, AQ
Analytical Group: TCLPV
Concentration Level: Medium
MDLs QLs MDLs QLs
1,1-Dichloroethene 75-35-4 0.7 0.35 NA NA NA NA
1,2-Dichloroethane 107-06-2 0.5 0.25 NA NA NA NA
1,4-Dichlorobenzene 106-46-7 7.5 3.75 NA NA NA NA
2-Butanone 78-93-3 200 100 NA NA NA NA
Benzene 71-43-2 0.5 0.25 NA NA NA NA
Carbon tetrachloride 56-23-5 0.5 0.25 NA NA NA NA
Chlorobenzene 108-90-7 100 50 NA NA NA NA
Chloroform 67-66-3 6 3 NA NA NA NA
Tetrachloroethene 127-18-4 0.7 0.35 NA NA NA NA
Trichloroethene 79-01-6 0.5 0.25 NA NA NA NA
Vinyl chloride 75-01-4 0.2 0.1 NA NA NA NA
Shading indicates PALs for which the PAL < CRQL.
4SD = Sediment (TCLPV); SB = Subsurface Soil (TCLPV); AQ = Aqueous (TCLPV)
5The PQL Goal is 1/2 the lowest PAL, the lowest PAL, or the QL, as applicable.
2Achievable MDLs and QLs are limits that an individual laboratory can achieve when performing a specific analytical method. Units are the same as in the
PQL column. NA: DESA QLs and MDLs were not available at time of preparation of this UFP-QAPP.
1Analytical MDLs and QLs are those documented in validated methods. Units are the same as in the PQL column.
Achievable Laboratory Limits2
Analytical Method1
CAS NumberAnalyte
PQL Goal5
(mg/L)
40 CFR 261.24
(mg/L)
QAPP Worksheet #15-29
(UFP-QAPP Manual Section 2.8.1)
Reference Limits and Evaluation Table
Matrix4: SD, SB, AQ
Analytical Group: TCLPS
Concentration Level: Medium
MDLs QLs MDLs QLs
2,4,5-Trichlorophenol 95-95-4 400 200 NA NA NA NA
2,4,6-Trichlorophenol 88-06-2 2 1 NA NA NA NA
2,4-Dinitrotoluene 121-14-2 0.13 0.065 NA NA NA NA
2-Methylphenol 95-48-7 200 100 NA NA NA NA
3- and 4-Methylphenol m&pCRESOL 200 100 NA NA NA NA
Hexachlorobenzene 118-74-1 0.13 0.065 NA NA NA NA
Hexachlorobutadiene 87-68-3 0.5 0.25 NA NA NA NA
Hexachloroethane 67-72-1 3 1.5 NA NA NA NA
Nitrobenzene 98-95-3 2 1 NA NA NA NA
Pentachlorophenol 87-86-5 100 50 NA NA NA NA
Pyridine 110-86-1 5 2.5 NA NA NA NA
Shading indicates PALs for which the PAL < CRQL.
3Some CAS numbers are contractor-specific.
4SD = Sediment (TCLPS); SB = Subsurface Soil (TCLPS); AQ = Aqueous (TCLPS)
5The PQL Goal is 1/2 the lowest PAL, the lowest PAL, or the QL, as applicable.
2Achievable MDLs and QLs are limits that an individual laboratory can achieve when performing a specific analytical method. Units are the same as in the
PQL column. NA: DESA QLs and MDLs were not available at time of preparation of this UFP-QAPP.
1Analytical MDLs and QLs are those documented in validated methods. Units are the same as in the PQL column.
Achievable Laboratory Limits2
Analytical Method1
CAS Number3
Analyte
PQL Goal
(mg/L)
40 CFR 261.24
(mg/L)
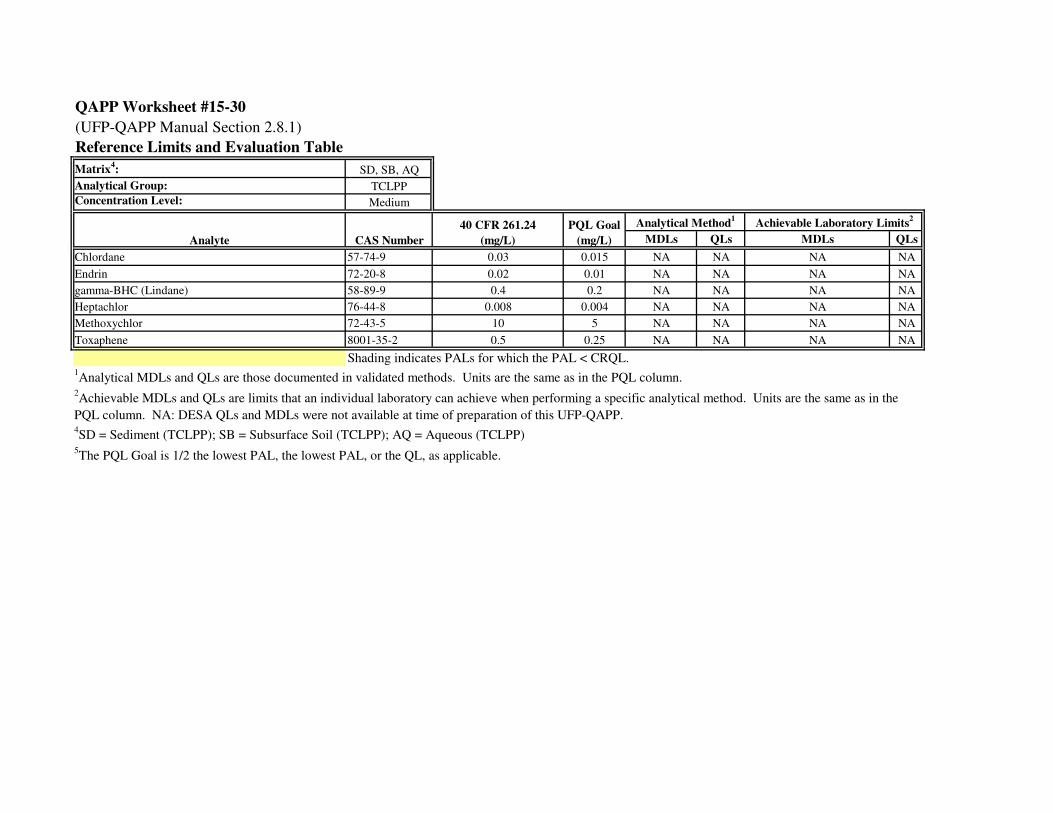
QAPP Worksheet #15-30
(UFP-QAPP Manual Section 2.8.1)
Reference Limits and Evaluation Table
Matrix4: SD, SB, AQ
Analytical Group: TCLPP
Concentration Level: Medium
MDLs QLs MDLs QLs
Chlordane 57-74-9 0.03 0.015 NA NA NA NA
Endrin 72-20-8 0.02 0.01 NA NA NA NA
gamma-BHC (Lindane) 58-89-9 0.4 0.2 NA NA NA NA
Heptachlor 76-44-8 0.008 0.004 NA NA NA NA
Methoxychlor 72-43-5 10 5 NA NA NA NA
Toxaphene 8001-35-2 0.5 0.25 NA NA NA NA
Shading indicates PALs for which the PAL < CRQL.
4SD = Sediment (TCLPP); SB = Subsurface Soil (TCLPP); AQ = Aqueous (TCLPP)
5The PQL Goal is 1/2 the lowest PAL, the lowest PAL, or the QL, as applicable.
2Achievable MDLs and QLs are limits that an individual laboratory can achieve when performing a specific analytical method. Units are the same as in the
PQL column. NA: DESA QLs and MDLs were not available at time of preparation of this UFP-QAPP.
1Analytical MDLs and QLs are those documented in validated methods. Units are the same as in the PQL column.
Achievable Laboratory Limits2
Analytical Method1
CAS NumberAnalyte
PQL Goal
(mg/L)
40 CFR 261.24
(mg/L)
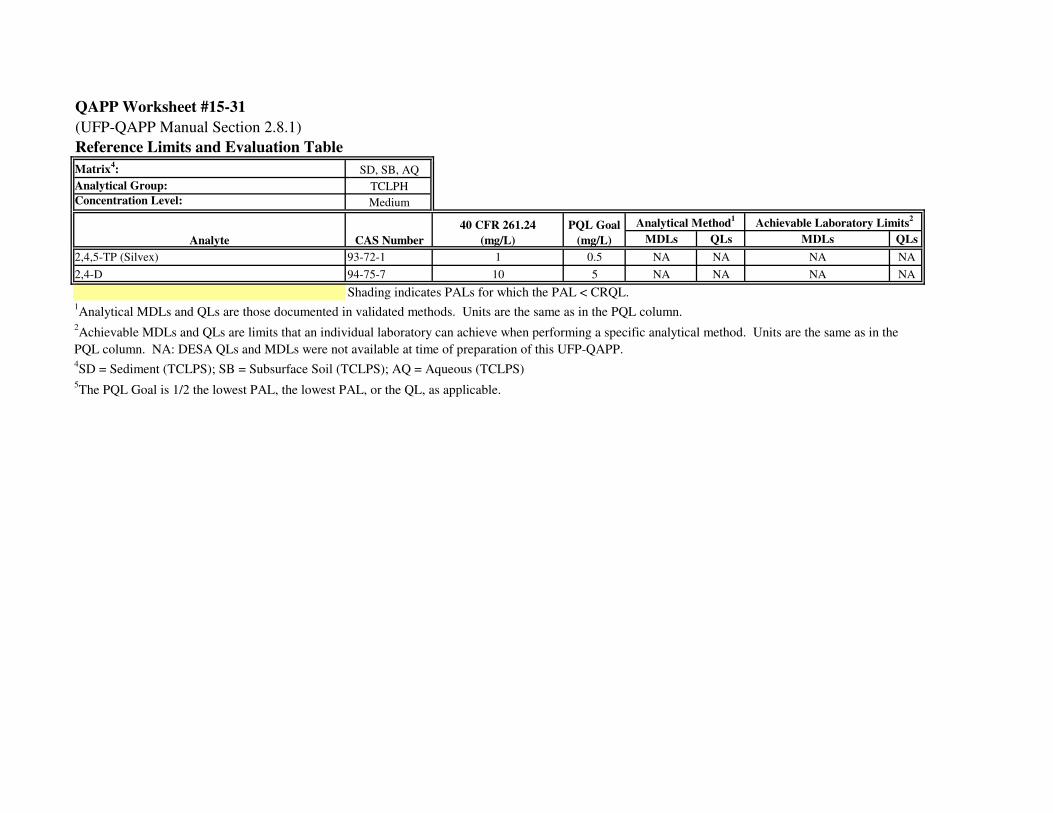
QAPP Worksheet #15-31
(UFP-QAPP Manual Section 2.8.1)
Reference Limits and Evaluation Table
Matrix4: SD, SB, AQ
Analytical Group: TCLPH
Concentration Level: Medium
MDLs QLs MDLs QLs
2,4,5-TP (Silvex) 93-72-1 1 0.5 NA NA NA NA
2,4-D 94-75-7 10 5 NA NA NA NA
Shading indicates PALs for which the PAL < CRQL.
4SD = Sediment (TCLPS); SB = Subsurface Soil (TCLPS); AQ = Aqueous (TCLPS)
5The PQL Goal is 1/2 the lowest PAL, the lowest PAL, or the QL, as applicable.
1Analytical MDLs and QLs are those documented in validated methods. Units are the same as in the PQL column.
2Achievable MDLs and QLs are limits that an individual laboratory can achieve when performing a specific analytical method. Units are the same as in the
PQL column. NA: DESA QLs and MDLs were not available at time of preparation of this UFP-QAPP.
Achievable Laboratory Limits2
Analytical Method1
CAS NumberAnalyte
PQL Goal
(mg/L)
40 CFR 261.24
(mg/L)
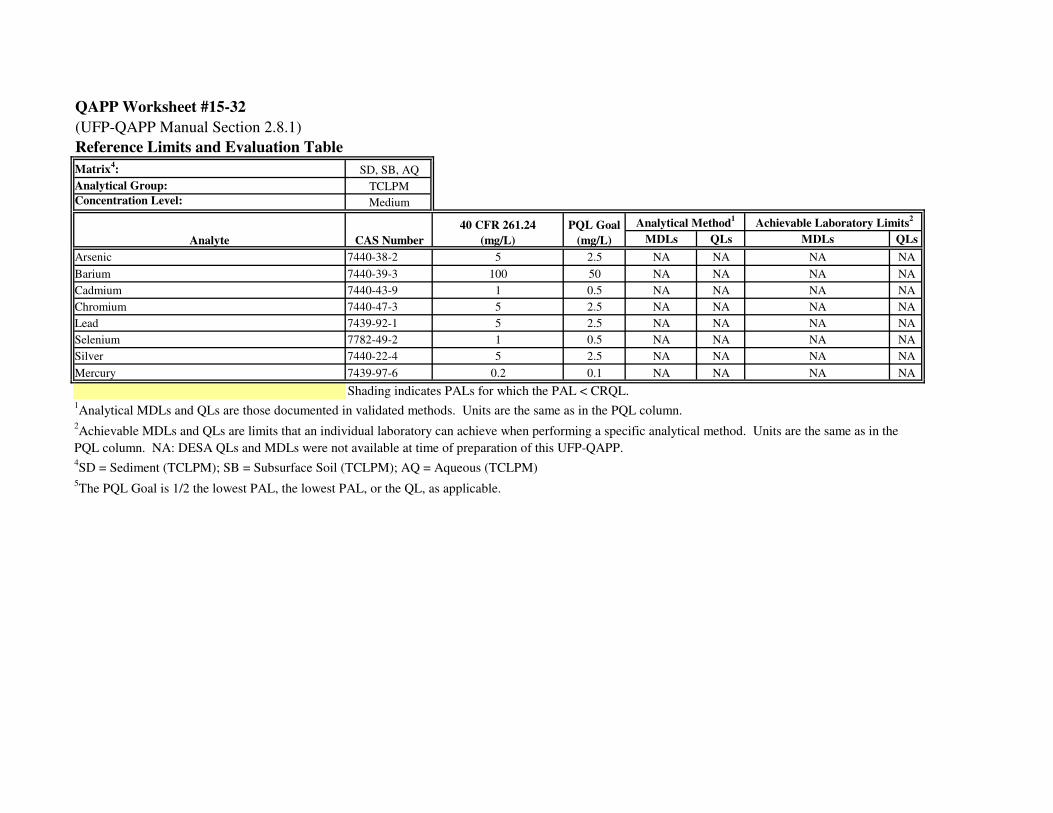
QAPP Worksheet #15-32
(UFP-QAPP Manual Section 2.8.1)
Reference Limits and Evaluation Table
Matrix4: SD, SB, AQ
Analytical Group: TCLPM
Concentration Level: Medium
MDLs QLs MDLs QLs
Arsenic 7440-38-2 5 2.5 NA NA NA NA
Barium 7440-39-3 100 50 NA NA NA NA
Cadmium 7440-43-9 1 0.5 NA NA NA NA
Chromium 7440-47-3 5 2.5 NA NA NA NA
Lead 7439-92-1 5 2.5 NA NA NA NA
Selenium 7782-49-2 1 0.5 NA NA NA NA
Silver 7440-22-4 5 2.5 NA NA NA NA
Mercury 7439-97-6 0.2 0.1 NA NA NA NA
Shading indicates PALs for which the PAL < CRQL.
4SD = Sediment (TCLPM); SB = Subsurface Soil (TCLPM); AQ = Aqueous (TCLPM)
5The PQL Goal is 1/2 the lowest PAL, the lowest PAL, or the QL, as applicable.
1Analytical MDLs and QLs are those documented in validated methods. Units are the same as in the PQL column.
2Achievable MDLs and QLs are limits that an individual laboratory can achieve when performing a specific analytical method. Units are the same as in the
PQL column. NA: DESA QLs and MDLs were not available at time of preparation of this UFP-QAPP.
Achievable Laboratory Limits2
Analytical Method1
CAS NumberAnalyte
PQL Goal
(mg/L)
40 CFR 261.24
(mg/L)
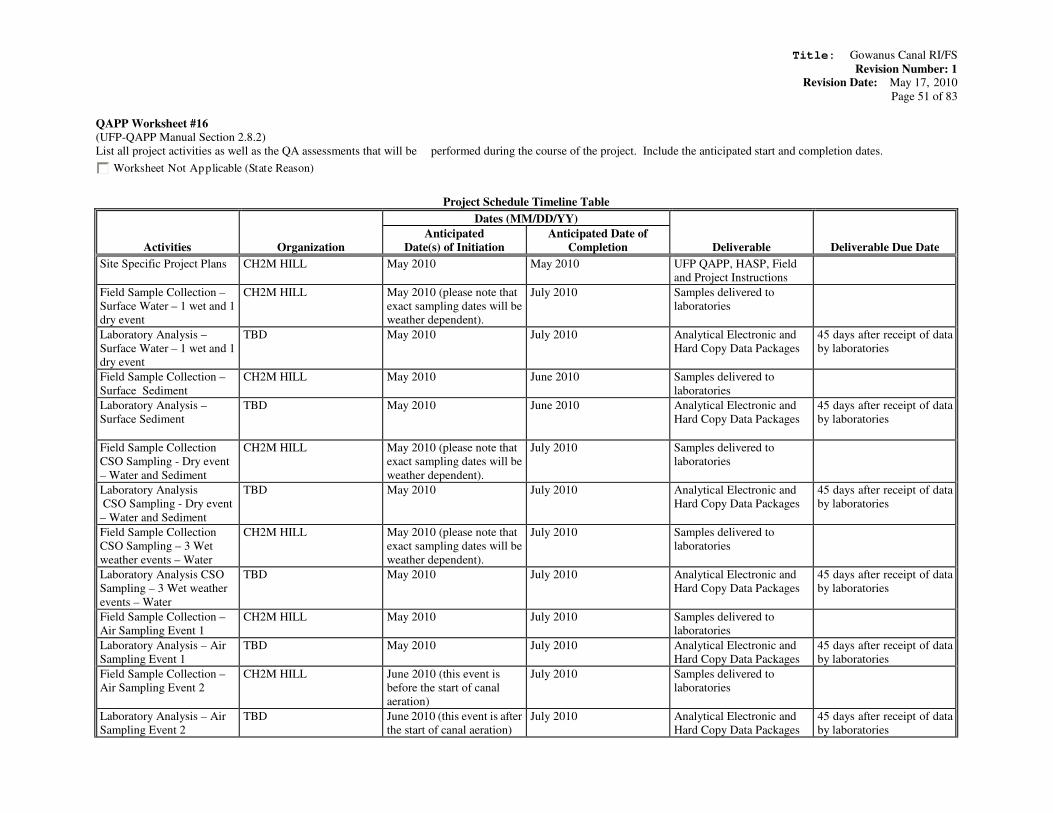
Title: Gowanus Canal RI/FS
Revision Number: 1 Revision Date: May 17, 2010
Page 51 of 83
QAPP Worksheet #16
(UFP-QAPP Manual Section 2.8.2)
List all project activities as well as the QA assessments that will be performed during the course of the project. Include the anticipated start and completion dates.
Worksheet Not Applicable (State Reason)
Project Schedule Timeline Table
Dates (MM/DD/YY)
Activities Organization
Anticipated
Date(s) of Initiation
Anticipated Date of
Completion Deliverable Deliverable Due Date
Site Specific Project Plans CH2M HILL May 2010 May 2010 UFP QAPP, HASP, Field
and Project Instructions
Field Sample Collection –
Surface Water – 1 wet and 1
dry event
CH2M HILL May 2010 (please note that
exact sampling dates will be
weather dependent).
July 2010 Samples delivered to
laboratories
Laboratory Analysis –
Surface Water – 1 wet and 1
dry event
TBD May 2010 July 2010 Analytical Electronic and
Hard Copy Data Packages
45 days after receipt of data
by laboratories
Field Sample Collection –
Surface Sediment
CH2M HILL May 2010 June 2010 Samples delivered to
laboratories
Laboratory Analysis –
Surface Sediment
TBD May 2010 June 2010 Analytical Electronic and
Hard Copy Data Packages
45 days after receipt of data
by laboratories
Field Sample Collection
CSO Sampling - Dry event
– Water and Sediment
CH2M HILL May 2010 (please note that
exact sampling dates will be
weather dependent).
July 2010 Samples delivered to
laboratories
Laboratory Analysis
CSO Sampling - Dry event
– Water and Sediment
TBD May 2010 July 2010 Analytical Electronic and
Hard Copy Data Packages
45 days after receipt of data
by laboratories
Field Sample Collection
CSO Sampling – 3 Wet
weather events – Water
CH2M HILL May 2010 (please note that
exact sampling dates will be
weather dependent).
July 2010 Samples delivered to
laboratories
Laboratory Analysis CSO
Sampling – 3 Wet weather
events – Water
TBD May 2010 July 2010 Analytical Electronic and
Hard Copy Data Packages
45 days after receipt of data
by laboratories
Field Sample Collection –
Air Sampling Event 1
CH2M HILL May 2010 July 2010 Samples delivered to
laboratories
Laboratory Analysis – Air
Sampling Event 1
TBD May 2010 July 2010 Analytical Electronic and
Hard Copy Data Packages
45 days after receipt of data
by laboratories
Field Sample Collection –
Air Sampling Event 2
CH2M HILL June 2010 (this event is
before the start of canal
aeration)
July 2010 Samples delivered to
laboratories
Laboratory Analysis – Air
Sampling Event 2
TBD June 2010 (this event is after
the start of canal aeration)
July 2010 Analytical Electronic and
Hard Copy Data Packages
45 days after receipt of data
by laboratories
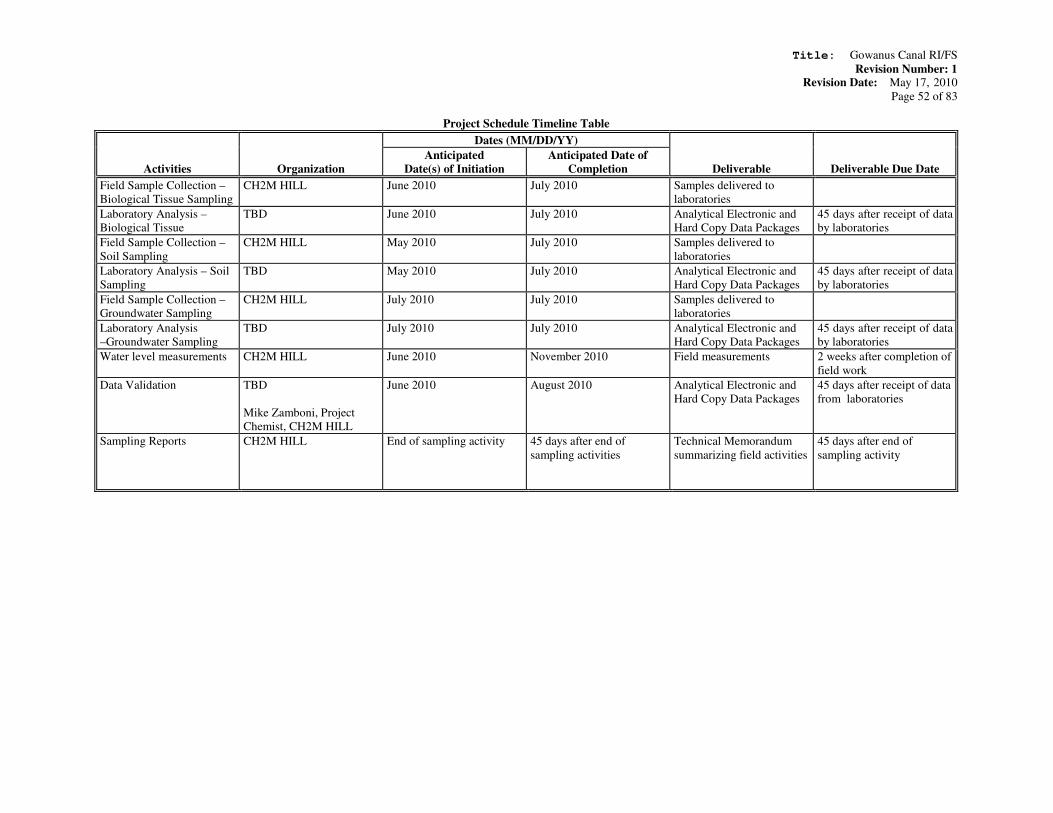
Title: Gowanus Canal RI/FS
Revision Number: 1 Revision Date: May 17, 2010
Page 52 of 83
Project Schedule Timeline Table
Dates (MM/DD/YY)
Activities Organization
Anticipated
Date(s) of Initiation
Anticipated Date of
Completion Deliverable Deliverable Due Date
Field Sample Collection –
Biological Tissue Sampling
CH2M HILL June 2010 July 2010 Samples delivered to
laboratories
Laboratory Analysis –
Biological Tissue
TBD June 2010 July 2010 Analytical Electronic and
Hard Copy Data Packages
45 days after receipt of data
by laboratories
Field Sample Collection –
Soil Sampling
CH2M HILL May 2010 July 2010 Samples delivered to
laboratories
Laboratory Analysis – Soil
Sampling
TBD May 2010 July 2010 Analytical Electronic and
Hard Copy Data Packages
45 days after receipt of data
by laboratories
Field Sample Collection –
Groundwater Sampling
CH2M HILL July 2010 July 2010 Samples delivered to
laboratories
Laboratory Analysis
–Groundwater Sampling
TBD July 2010 July 2010 Analytical Electronic and
Hard Copy Data Packages
45 days after receipt of data
by laboratories
Water level measurements CH2M HILL June 2010 November 2010 Field measurements 2 weeks after completion of
field work
Data Validation TBD
Mike Zamboni, Project
Chemist, CH2M HILL
June 2010 August 2010 Analytical Electronic and
Hard Copy Data Packages
45 days after receipt of data
from laboratories
Sampling Reports CH2M HILL End of sampling activity 45 days after end of
sampling activities
Technical Memorandum
summarizing field activities
45 days after end of
sampling activity
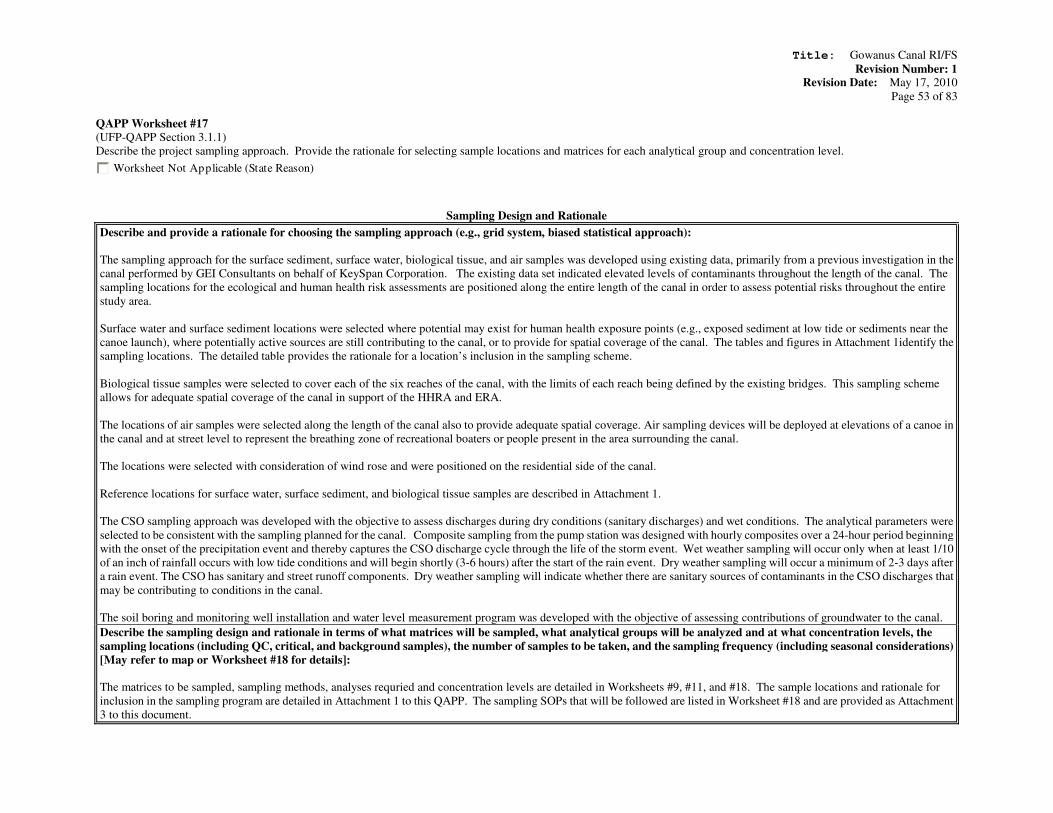
Title: Gowanus Canal RI/FS
Revision Number: 1 Revision Date: May 17, 2010
Page 53 of 83
QAPP Worksheet #17
(UFP-QAPP Section 3.1.1)
Describe the project sampling approach. Provide the rationale for selecting sample locations and matrices for each analytical group and concentration level.
Worksheet Not Applicable (State Reason)
Sampling Design and Rationale
Describe and provide a rationale for choosing the sampling approach (e.g., grid system, biased statistical approach):
The sampling approach for the surface sediment, surface water, biological tissue, and air samples was developed using existing data, primarily from a previous investigation in the
canal performed by GEI Consultants on behalf of KeySpan Corporation. The existing data set indicated elevated levels of contaminants throughout the length of the canal. The
sampling locations for the ecological and human health risk assessments are positioned along the entire length of the canal in order to assess potential risks throughout the entire
study area.
Surface water and surface sediment locations were selected where potential may exist for human health exposure points (e.g., exposed sediment at low tide or sediments near the
canoe launch), where potentially active sources are still contributing to the canal, or to provide for spatial coverage of the canal. The tables and figures in Attachment 1identify the
sampling locations. The detailed table provides the rationale for a location’s inclusion in the sampling scheme.
Biological tissue samples were selected to cover each of the six reaches of the canal, with the limits of each reach being defined by the existing bridges. This sampling scheme
allows for adequate spatial coverage of the canal in support of the HHRA and ERA.
The locations of air samples were selected along the length of the canal also to provide adequate spatial coverage. Air sampling devices will be deployed at elevations of a canoe in
the canal and at street level to represent the breathing zone of recreational boaters or people present in the area surrounding the canal.
The locations were selected with consideration of wind rose and were positioned on the residential side of the canal.
Reference locations for surface water, surface sediment, and biological tissue samples are described in Attachment 1.
The CSO sampling approach was developed with the objective to assess discharges during dry conditions (sanitary discharges) and wet conditions. The analytical parameters were
selected to be consistent with the sampling planned for the canal. Composite sampling from the pump station was designed with hourly composites over a 24-hour period beginning
with the onset of the precipitation event and thereby captures the CSO discharge cycle through the life of the storm event. Wet weather sampling will occur only when at least 1/10
of an inch of rainfall occurs with low tide conditions and will begin shortly (3-6 hours) after the start of the rain event. Dry weather sampling will occur a minimum of 2-3 days after
a rain event. The CSO has sanitary and street runoff components. Dry weather sampling will indicate whether there are sanitary sources of contaminants in the CSO discharges that
may be contributing to conditions in the canal.
The soil boring and monitoring well installation and water level measurement program was developed with the objective of assessing contributions of groundwater to the canal.
Describe the sampling design and rationale in terms of what matrices will be sampled, what analytical groups will be analyzed and at what concentration levels, the
sampling locations (including QC, critical, and background samples), the number of samples to be taken, and the sampling frequency (including seasonal considerations)
[May refer to map or Worksheet #18 for details]:
The matrices to be sampled, sampling methods, analyses requried and concentration levels are detailed in Worksheets #9, #11, and #18. The sample locations and rationale for
inclusion in the sampling program are detailed in Attachment 1 to this QAPP. The sampling SOPs that will be followed are listed in Worksheet #18 and are provided as Attachment
3 to this document.
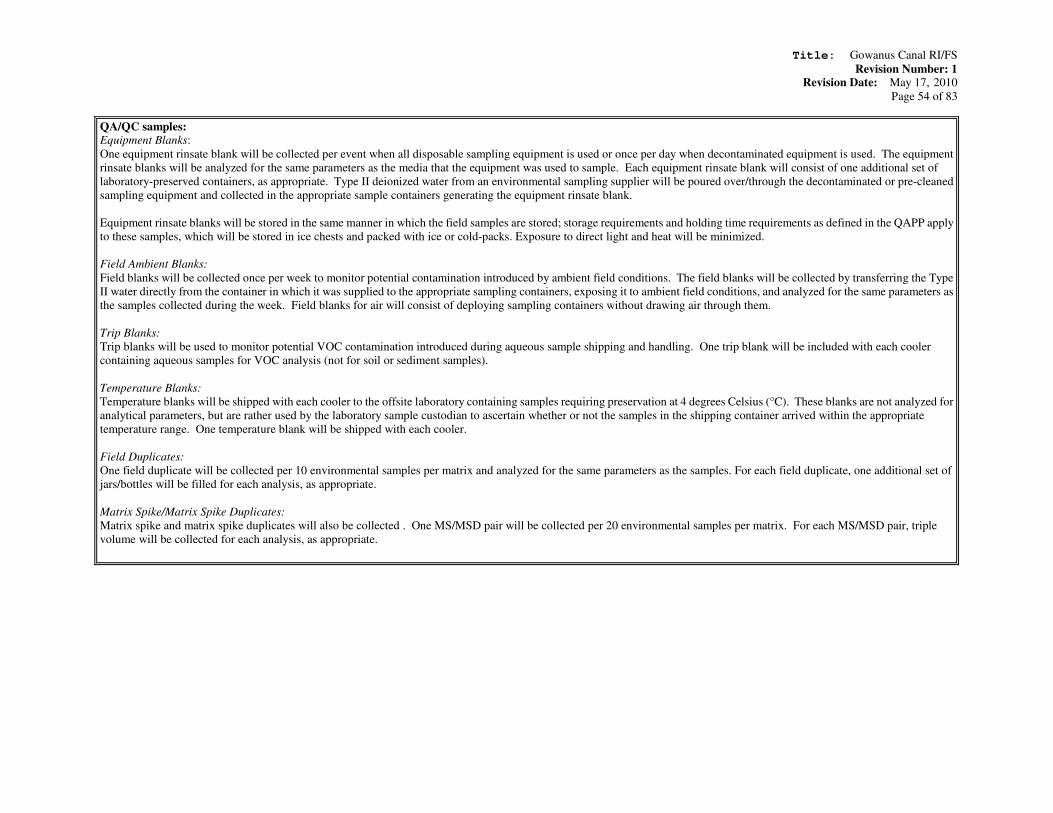
Title: Gowanus Canal RI/FS
Revision Number: 1 Revision Date: May 17, 2010
Page 54 of 83
QA/QC samples: Equipment Blanks:
One equipment rinsate blank will be collected per event when all disposable sampling equipment is used or once per day when decontaminated equipment is used. The equipment
rinsate blanks will be analyzed for the same parameters as the media that the equipment was used to sample. Each equipment rinsate blank will consist of one additional set of
laboratory-preserved containers, as appropriate. Type II deionized water from an environmental sampling supplier will be poured over/through the decontaminated or pre-cleaned
sampling equipment and collected in the appropriate sample containers generating the equipment rinsate blank.
Equipment rinsate blanks will be stored in the same manner in which the field samples are stored; storage requirements and holding time requirements as defined in the QAPP apply
to these samples, which will be stored in ice chests and packed with ice or cold-packs. Exposure to direct light and heat will be minimized.
Field Ambient Blanks:
Field blanks will be collected once per week to monitor potential contamination introduced by ambient field conditions. The field blanks will be collected by transferring the Type
II water directly from the container in which it was supplied to the appropriate sampling containers, exposing it to ambient field conditions, and analyzed for the same parameters as
the samples collected during the week. Field blanks for air will consist of deploying sampling containers without drawing air through them.
Trip Blanks:
Trip blanks will be used to monitor potential VOC contamination introduced during aqueous sample shipping and handling. One trip blank will be included with each cooler
containing aqueous samples for VOC analysis (not for soil or sediment samples).
Temperature Blanks:
Temperature blanks will be shipped with each cooler to the offsite laboratory containing samples requiring preservation at 4 degrees Celsius (°C). These blanks are not analyzed for
analytical parameters, but are rather used by the laboratory sample custodian to ascertain whether or not the samples in the shipping container arrived within the appropriate
temperature range. One temperature blank will be shipped with each cooler.
Field Duplicates:
One field duplicate will be collected per 10 environmental samples per matrix and analyzed for the same parameters as the samples. For each field duplicate, one additional set of
jars/bottles will be filled for each analysis, as appropriate.
Matrix Spike/Matrix Spike Duplicates:
Matrix spike and matrix spike duplicates will also be collected . One MS/MSD pair will be collected per 20 environmental samples per matrix. For each MS/MSD pair, triple
volume will be collected for each analysis, as appropriate.
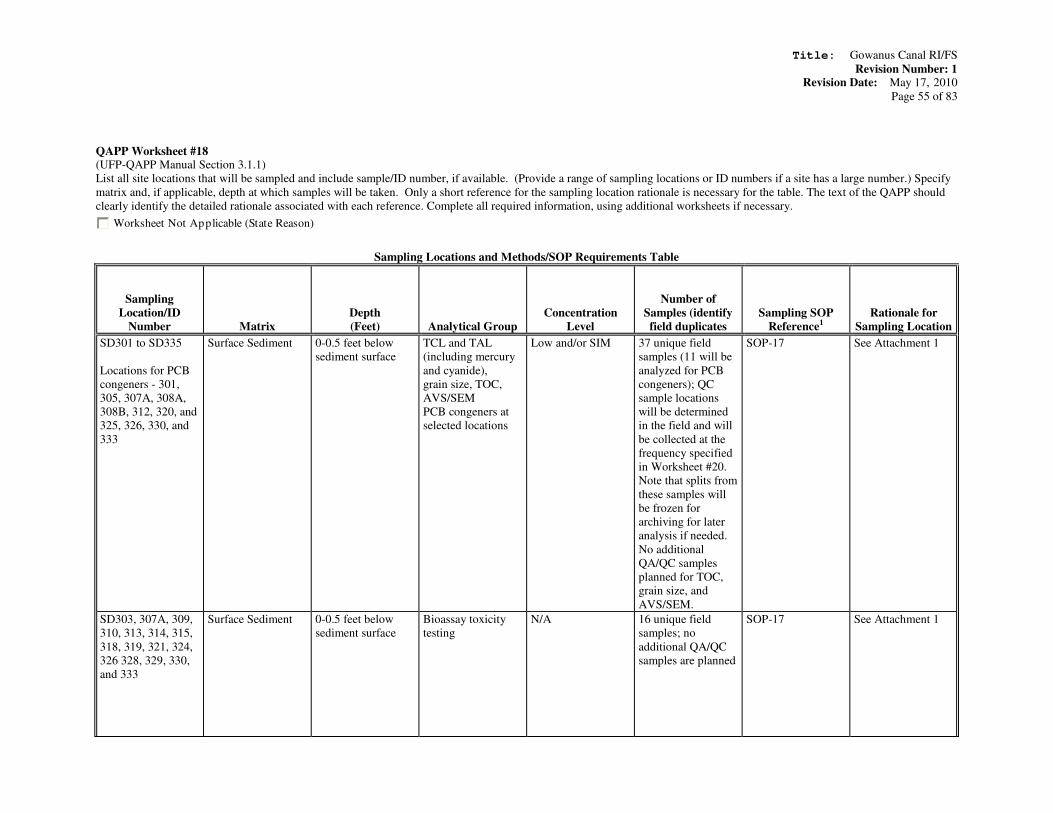
Title: Gowanus Canal RI/FS
Revision Number: 1 Revision Date: May 17, 2010
Page 55 of 83
QAPP Worksheet #18 (UFP-QAPP Manual Section 3.1.1)
List all site locations that will be sampled and include sample/ID number, if available. (Provide a range of sampling locations or ID numbers if a site has a large number.) Specify
matrix and, if applicable, depth at which samples will be taken. Only a short reference for the sampling location rationale is necessary for the table. The text of the QAPP should
clearly identify the detailed rationale associated with each reference. Complete all required information, using additional worksheets if necessary.
Worksheet Not Applicable (State Reason)
Sampling Locations and Methods/SOP Requirements Table
Sampling
Location/ID
Number
Matrix
Depth
(Feet) Analytical Group
Concentration
Level
Number of
Samples (identify
field duplicates
Sampling SOP
Reference1
Rationale for
Sampling Location
SD301 to SD335
Locations for PCB
congeners - 301,
305, 307A, 308A,
308B, 312, 320, and
325, 326, 330, and
333
Surface Sediment 0-0.5 feet below
sediment surface
TCL and TAL
(including mercury
and cyanide),
grain size, TOC,
AVS/SEM
PCB congeners at
selected locations
Low and/or SIM 37 unique field
samples (11 will be
analyzed for PCB
congeners); QC
sample locations
will be determined
in the field and will
be collected at the
frequency specified
in Worksheet #20.
Note that splits from
these samples will
be frozen for
archiving for later
analysis if needed.
No additional
QA/QC samples
planned for TOC,
grain size, and
AVS/SEM.
SOP-17 See Attachment 1
SD303, 307A, 309,
310, 313, 314, 315,
318, 319, 321, 324,
326 328, 329, 330,
and 333
Surface Sediment 0-0.5 feet below
sediment surface
Bioassay toxicity
testing
N/A 16 unique field
samples; no
additional QA/QC
samples are planned
SOP-17 See Attachment 1
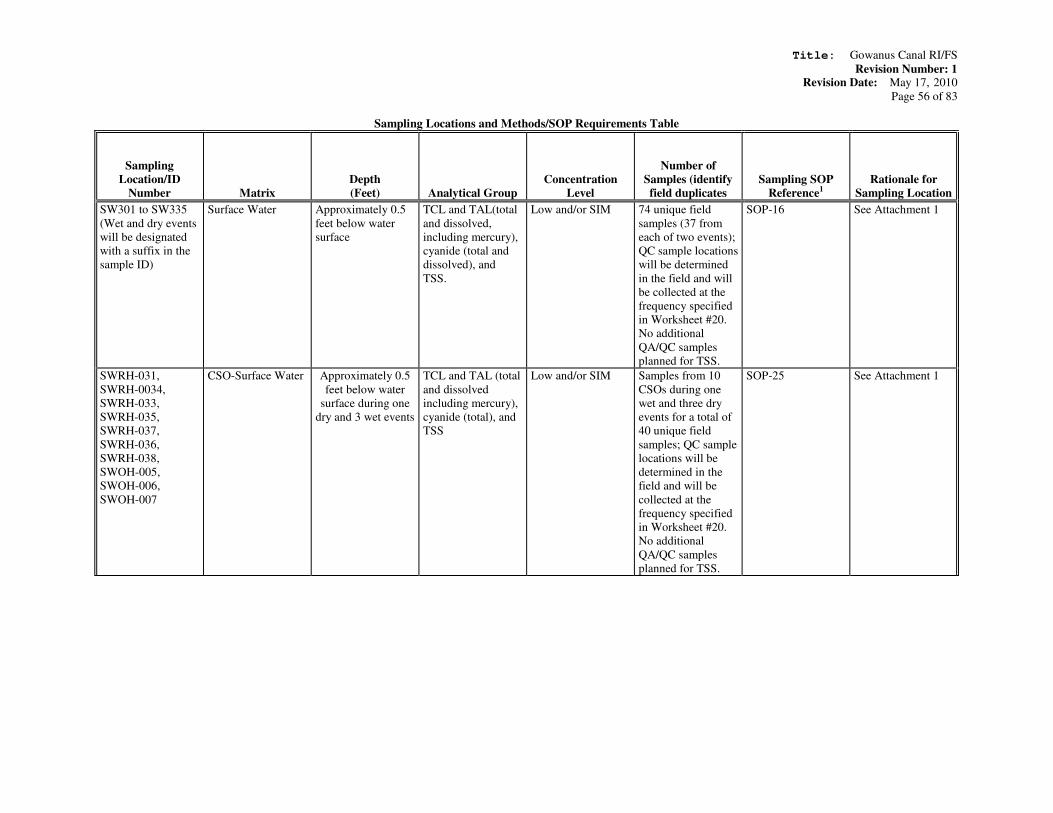
Title: Gowanus Canal RI/FS
Revision Number: 1 Revision Date: May 17, 2010
Page 56 of 83
Sampling Locations and Methods/SOP Requirements Table
Sampling
Location/ID
Number
Matrix
Depth
(Feet) Analytical Group
Concentration
Level
Number of
Samples (identify
field duplicates
Sampling SOP
Reference1
Rationale for
Sampling Location
SW301 to SW335
(Wet and dry events
will be designated
with a suffix in the
sample ID)
Surface Water Approximately 0.5
feet below water
surface
TCL and TAL(total
and dissolved,
including mercury),
cyanide (total and
dissolved), and
TSS.
Low and/or SIM 74 unique field
samples (37 from
each of two events);
QC sample locations
will be determined
in the field and will
be collected at the
frequency specified
in Worksheet #20.
No additional
QA/QC samples
planned for TSS.
SOP-16 See Attachment 1
SWRH-031,
SWRH-0034,
SWRH-033,
SWRH-035,
SWRH-037,
SWRH-036,
SWRH-038,
SWOH-005,
SWOH-006,
SWOH-007
CSO-Surface Water Approximately 0.5
feet below water
surface during one
dry and 3 wet events
TCL and TAL (total
and dissolved
including mercury),
cyanide (total), and
TSS
Low and/or SIM Samples from 10
CSOs during one
wet and three dry
events for a total of
40 unique field
samples; QC sample
locations will be
determined in the
field and will be
collected at the
frequency specified
in Worksheet #20.
No additional
QA/QC samples
planned for TSS.
SOP-25 See Attachment 1

Title: Gowanus Canal RI/FS
Revision Number: 1 Revision Date: May 17, 2010
Page 57 of 83
Sampling Locations and Methods/SOP Requirements Table
Sampling
Location/ID
Number
Matrix
Depth
(Feet) Analytical Group
Concentration
Level
Number of
Samples (identify
field duplicates
Sampling SOP
Reference1
Rationale for
Sampling Location
SDRH-031,
SDRH-0034,
SDRH-033,
SDRH-035,
SDRH-037,
SDRH-036,
SDRH-038,
SDOH-005,
SDOH-006,
SDOH-007
CSO-Surface
sediment
0-0.5 feet below
sediment surface or
from whenever
available
TCL and TAL
(including mercury
and cyanide), TOC,
and grain size.
Low and/or SIM Samples from 10
CSOs during one
dry event for a total
of 10 unique field
samples; QC sample
locations will be
determined in the
field and will be
collected at the
frequency specified
in Worksheet #20.
No additional
QA/QC samples
planned for TOC
and grain size.
SOP-25 See Attachment 1
TI401-TI407A
through E (species
will be designated in
sample IDs)
Biological Tissue –
Blue Crab
(Shellfish)
NA TCL
(Bioaccumulative
PAHs and
pesticides), TAL,
PCB congeners, and
lipid content
Low and/or SIM Approximately 22
unique field
samples; QC sample
locations will be
determined in the
field and will be
collected at the
frequency specified
in Worksheet #20.
No additional
QA/QC planned for
% lipids.
SOP-14 See Attachment 1
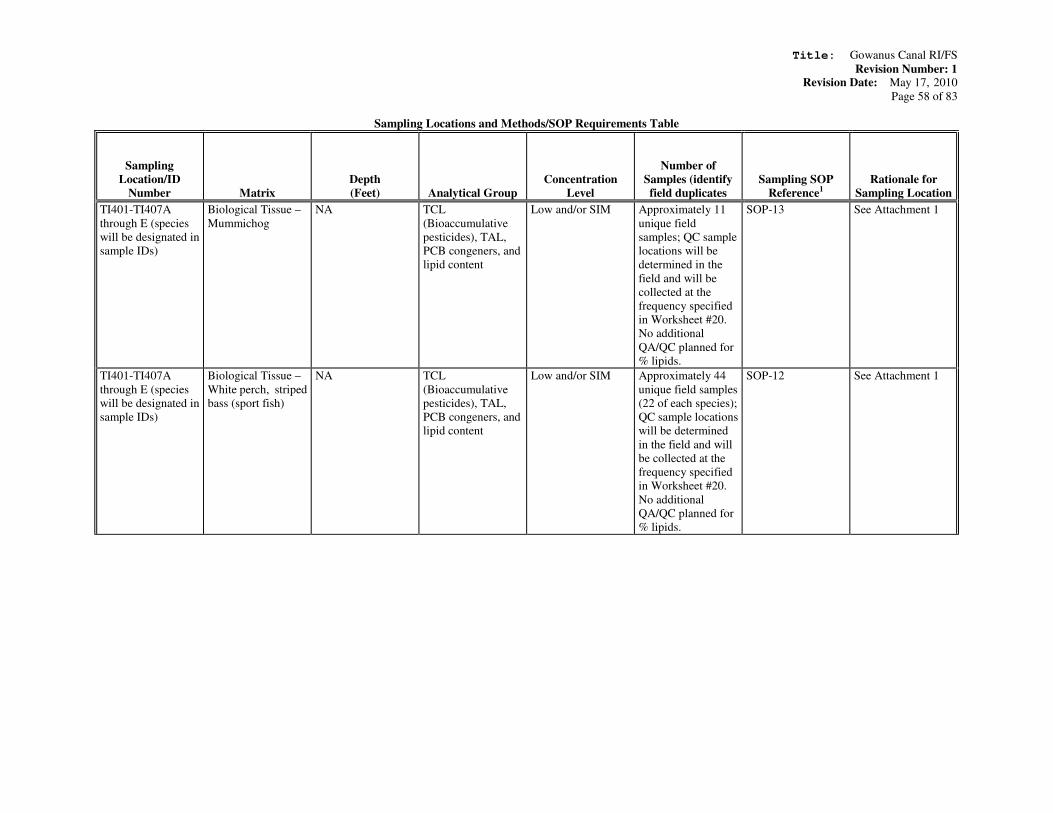
Title: Gowanus Canal RI/FS
Revision Number: 1 Revision Date: May 17, 2010
Page 58 of 83
Sampling Locations and Methods/SOP Requirements Table
Sampling
Location/ID
Number
Matrix
Depth
(Feet) Analytical Group
Concentration
Level
Number of
Samples (identify
field duplicates
Sampling SOP
Reference1
Rationale for
Sampling Location
TI401-TI407A
through E (species
will be designated in
sample IDs)
Biological Tissue –
Mummichog
NA TCL
(Bioaccumulative
pesticides), TAL,
PCB congeners, and
lipid content
Low and/or SIM Approximately 11
unique field
samples; QC sample
locations will be
determined in the
field and will be
collected at the
frequency specified
in Worksheet #20.
No additional
QA/QC planned for
% lipids.
SOP-13 See Attachment 1
TI401-TI407A
through E (species
will be designated in
sample IDs)
Biological Tissue –
White perch, striped
bass (sport fish)
NA TCL
(Bioaccumulative
pesticides), TAL,
PCB congeners, and
lipid content
Low and/or SIM Approximately 44
unique field samples
(22 of each species);
QC sample locations
will be determined
in the field and will
be collected at the
frequency specified
in Worksheet #20.
No additional
QA/QC planned for
% lipids.
SOP-12
See Attachment 1
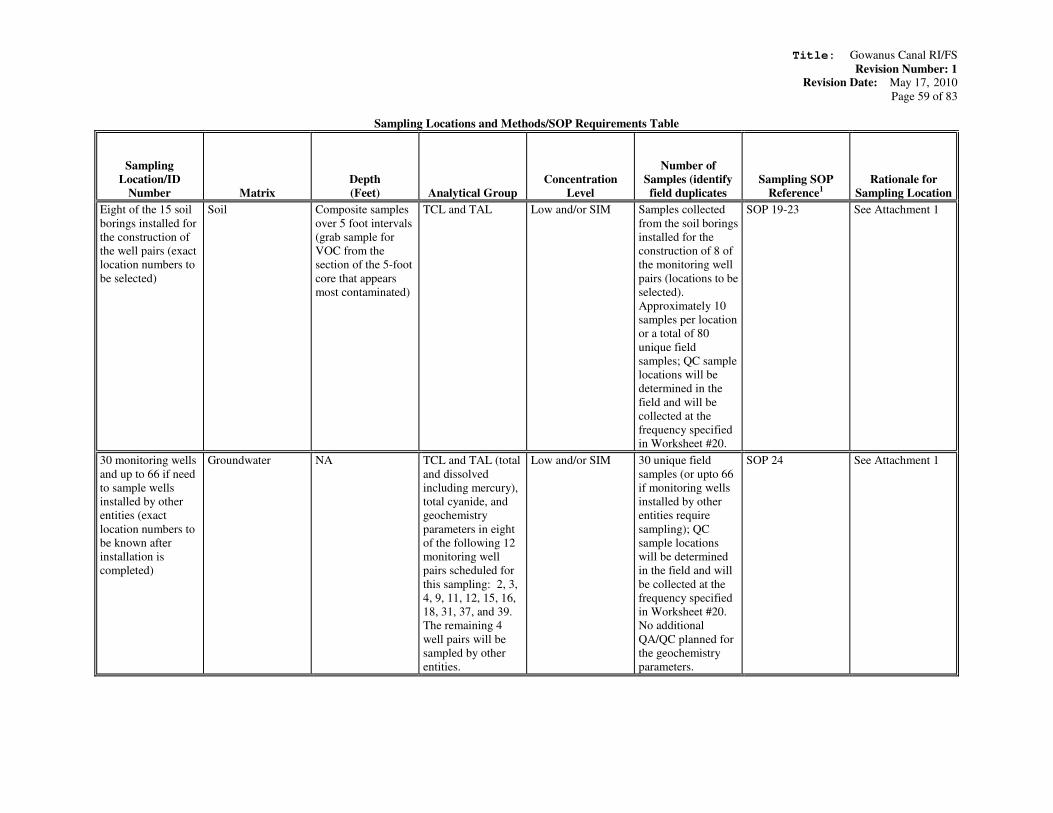
Title: Gowanus Canal RI/FS
Revision Number: 1 Revision Date: May 17, 2010
Page 59 of 83
Sampling Locations and Methods/SOP Requirements Table
Sampling
Location/ID
Number
Matrix
Depth
(Feet) Analytical Group
Concentration
Level
Number of
Samples (identify
field duplicates
Sampling SOP
Reference1
Rationale for
Sampling Location
Eight of the 15 soil
borings installed for
the construction of
the well pairs (exact
location numbers to
be selected)
Soil Composite samples
over 5 foot intervals
(grab sample for
VOC from the
section of the 5-foot
core that appears
most contaminated)
TCL and TAL Low and/or SIM Samples collected
from the soil borings
installed for the
construction of 8 of
the monitoring well
pairs (locations to be
selected).
Approximately 10
samples per location
or a total of 80
unique field
samples; QC sample
locations will be
determined in the
field and will be
collected at the
frequency specified
in Worksheet #20.
SOP 19-23 See Attachment 1
30 monitoring wells
and up to 66 if need
to sample wells
installed by other
entities (exact
location numbers to
be known after
installation is
completed)
Groundwater NA TCL and TAL (total
and dissolved
including mercury),
total cyanide, and
geochemistry
parameters in eight
of the following 12
monitoring well
pairs scheduled for
this sampling: 2, 3,
4, 9, 11, 12, 15, 16,
18, 31, 37, and 39.
The remaining 4
well pairs will be
sampled by other
entities.
Low and/or SIM 30 unique field
samples (or upto 66
if monitoring wells
installed by other
entities require
sampling); QC
sample locations
will be determined
in the field and will
be collected at the
frequency specified
in Worksheet #20.
No additional
QA/QC planned for
the geochemistry
parameters.
SOP 24 See Attachment 1
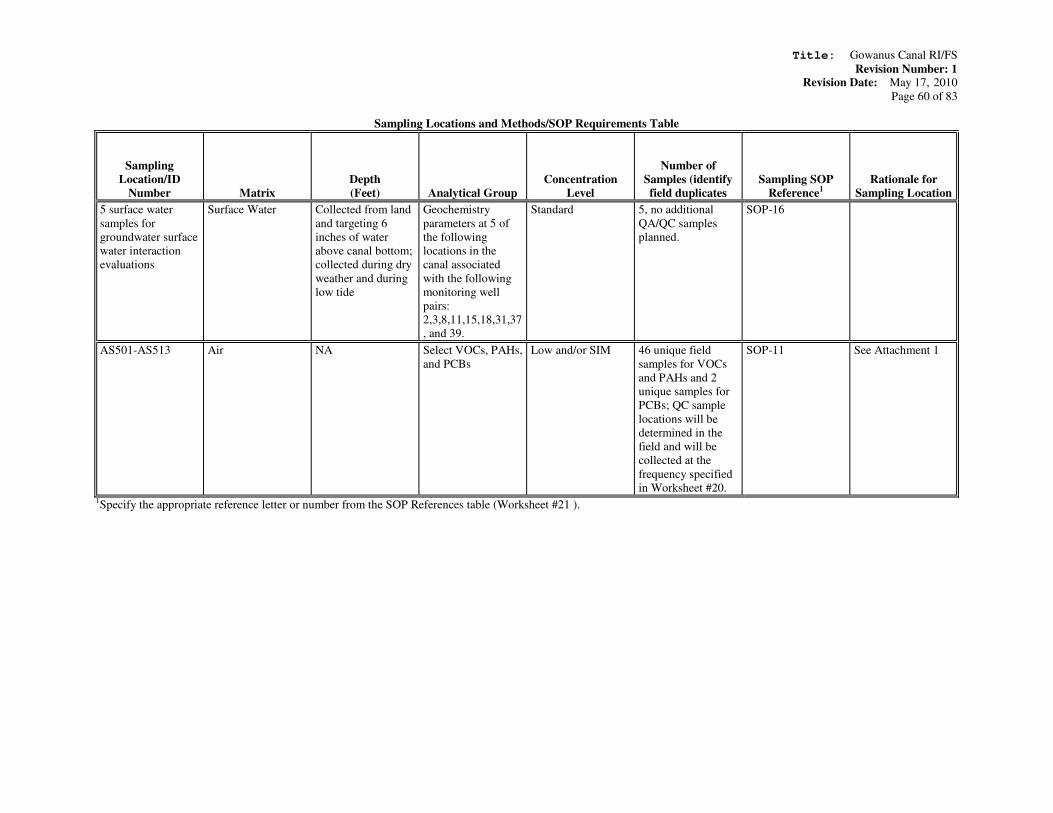
Title: Gowanus Canal RI/FS
Revision Number: 1 Revision Date: May 17, 2010
Page 60 of 83
Sampling Locations and Methods/SOP Requirements Table
Sampling
Location/ID
Number
Matrix
Depth
(Feet) Analytical Group
Concentration
Level
Number of
Samples (identify
field duplicates
Sampling SOP
Reference1
Rationale for
Sampling Location
5 surface water
samples for
groundwater surface
water interaction
evaluations
Surface Water Collected from land
and targeting 6
inches of water
above canal bottom;
collected during dry
weather and during
low tide
Geochemistry
parameters at 5 of
the following
locations in the
canal associated
with the following
monitoring well
pairs:
2,3,8,11,15,18,31,37
, and 39.
Standard 5, no additional
QA/QC samples
planned.
SOP-16
AS501-AS513 Air NA Select VOCs, PAHs,
and PCBs
Low and/or SIM 46 unique field
samples for VOCs
and PAHs and 2
unique samples for
PCBs; QC sample
locations will be
determined in the
field and will be
collected at the
frequency specified
in Worksheet #20.
SOP-11 See Attachment 1
1Specify the appropriate reference letter or number from the SOP References table (Worksheet #21 ).
Title: Gowanus Canal RI/FS
Revision Number: 1 Revision Date: May 17, 2010
Page 61 of 83
QAPP Worksheet #19
(UFP-QAPP Manual Section 3.1.1)
For each matrix, analytical group, and concentration level, list the analytical and preparation method/SOP and associated sample volume, container specifications, preservation
requirements, and maximum holding time.
Worksheet Not Applicable (State Reason)
QAPP Worksheet #19
(UFP-QAPP Manual Section 3.1.1)
Analytical SOP Requirements Table
Matrix5
Analytical
Group
Concentration
Level
Analytical and Preparation
Method / SOP Reference1
Sample
Volume3
Containers
(number, size,
and type)10
Preservation
Requirements
(chemical,
temperature,
light protected)
Maximum Holding
Time
(preparation /
analysis)
Low Soil 5g
three, 40mL,
preweighed VOA
vial w/ stir bar
cool to 4°C
48 hours to freeze or
otherwise process at
laboratory, 14 days
to analyze
NA (% Solids) NAone, 40mL, VOA
vial
minimal
headspace, cool
to 4°C
NA
Low Soil
Low Soil by SIM
PEST Soil EPA CLP SOM01.2 / NA2 30g
one, 8oz, wide-
mouth jarcool to 4°C
14 days to extract,
40 days to analyze
PCB Soil EPA CLP SOM01.2 / NA2 30g
one, 8oz, wide-
mouth jarcool to 4°C
14 days to extract,
40 days to analyze
1g + 0.2g
for Hg
6 months, 28 days
for Hg
1g for CN 14 days for CN
PCBCONG Other EPA CLP CBC01.2 / NA2 10g
one, 8oz, amber
wide-mouth jarcool to 4°C
35 days to extract, 1
year to analyze
SD NA: Archive NA: Archive NA: Archive for one year NA
one, 8oz, wide-
mouth jar, some
headspace (to
prevent breakage
upon freezing)
cool to 4°C
(freeze to -15°C
upon receipt)
NA
SD, CSD, SB
cool to 4°Cone, 8oz, wide-
mouth jarEPA CLP ILM05.4 / NA
2ICP-AES
4 for soilMETAL
EPA CLP SOM01.2 / NA2VOA
14 days to extract,
40 days to analyze
protect from
litght, cool to
4°C
one, 8oz, amber
wide-mouth jar30gEPA CLP SOM01.2 / NA
2SVOA
1 of 4

QAPP Worksheet #19
(UFP-QAPP Manual Section 3.1.1)
Analytical SOP Requirements Table
Matrix5
Analytical
Group
Concentration
Level
Analytical and Preparation
Method / SOP Reference1
Sample
Volume3
Containers
(number, size,
and type)10
Preservation
Requirements
(chemical,
temperature,
light protected)
Maximum Holding
Time
(preparation /
analysis)
WCHEM Medium Lloyd Kahn / LAB-01 10.0mgone, 4oz, wide-
mouth jarcool to 4°C 14 days
GRAINSIZE Medium ASTM D4464 / LAB-02 50gshare with 4oz
TOC jarnone
8 NA
AVSSEM MediumEPA 821_R-91-100 / LAB-
03, LAB-04, LAB-0510g
one, 4oz, wide-
mouth jar
fill completely,
cool to 4°C14 days
Trace Water by
SIM
Trace Water
Low Water by
SIM
Low Water
PEST Water EPA CLP SOM01.2 / NA2 1L
two, 1L, amber
bottlecool to 4°C
7 days to extract, 40
days to analyze
PCB Water EPA CLP SOM01.2 / NA2 1L
two, 1L, amber
bottlecool to 4°C
7 days to extract, 40
days to analyze
ICP-AES4 for
water
ICP-MS for water
METALICP-AES
4 for
water
one, 1L, HDPE
bottle
NaOH to pH >
12, cool to 4°C14 days for CN
AQ PCBCONG Water EPA CLP CBC01.2 / NA2 1L
two, 1L, amber
bottlecool to 4°C
35 days to extract, 1
year to analyze
CSW WCHEM Medium SM2540D / LAB-06 100mLone, 500mL,
HDPEcool to 4°C 7 days
SD
14 days to analyzeHCl to pH < 2,
cool to 4°C
five, 40mL, VOA
vial (only four for
trip blank)
40mLEPA CLP SOM01.2 / NA2VOA
7 days to extract, 40
days to analyzecool to 4°C
two, 1L, amber
bottle1LEPA CLP SOM01.2 / NA
2SVOA
METAL,
FMETAL1LEPA CLP ILM05.4 / NA
2
6 months, 28 days
for Hg
HNO3 to pH < 2,
cool to 4°C
two, 1L, HDPE
bottle
GW, SW,
CSW, AQ
2 of 4
QAPP Worksheet #19
(UFP-QAPP Manual Section 3.1.1)
Analytical SOP Requirements Table
Matrix5
Analytical
Group
Concentration
Level
Analytical and Preparation
Method / SOP Reference1
Sample
Volume3
Containers
(number, size,
and type)10
Preservation
Requirements
(chemical,
temperature,
light protected)
Maximum Holding
Time
(preparation /
analysis)
SM2540D / LAB-06 100mL cool to 4°C 7 days
SM2540C / LAB-12 100mL cool to 4°C 7 days
SM2320B / LAB-07 100mLone, 500mL,
HDPEcool to 4°C 14 days
EPA 300.0 / LAB-08 100mLone, 500mL,
HDPEcool to 4°C
28 days for Cl and
SO4; 48 hours for
NO3 and PO4
SM2340B / LAB-09
SW-846 6010B / LAB-04
SM4500-Norg C / LAB-10 50mL 28 days
SM4500-NH3 B + C / LAB-
1350mL 28 days
24mLone, 125mL,
HDPE
HCl to pH < 2,
cool to 4°C28 days
24mLone, 125mL,
HDPE
HCl to pH < 2,
cool to 4°C28 days
SVOA Low Soil by SIM EPA CLP SOM01.2 / NA2 30g cool to 4°C
14 days to extract,
40 days to analyze
PEST Soil EPA CLP SOM01.2 / NA2 30g cool to 4°C
14 days to extract,
40 days to analyze
1g + 0.2g
for Hg
6 months, 28 days
for Hg
1g for CN 14 days for CN
PCBCONG Other EPA CLP CBC01.2 / NA2 10g cool to 4°C
35 days to extract, 1
year to analyze
WCHEM Medium BR-EX-016 / LAB-14 TBD
one, 2oz, wide-
mount jar (if not
analyzed by CLP)
cool to 4°C N/A
VOA Medium TO-15 / LAB-15
VOA Low-Level TO-15 / LAB-16
SVOA SIMTO-13A_SIM / LAB-17,
LAB-18N/A
One of PUF/XAD
Cartridgecool to 4°C
7 days to extract, 30
days to analyze
PCB SIMTO-4A_SIM / LAB-19, LAB-
20N/A
One of PUF
Cartridgecool to 4°C
7 days to extract, 30
days to analyze
6 months
one, 500mL,
HDPE
MediumWCHEMGW, SW
one, 500mL,
HDPE
H2SO4 to pH < 2,
cool to 4°C
100mL
SW-846 9060 / LAB-11
one, 250mL,
HDPE
HNO3 to pH < 2,
cool to 4°C
EPA CLP ILM05.4 / NA2 cool to 4°C
Wrapped in
aluminum foil
AR
one, 6L Summa
CanisterN/A 30 daysN/A
TI
METAL ICP-AES4 for soil
3 of 4
QAPP Worksheet #19
(UFP-QAPP Manual Section 3.1.1)
Analytical SOP Requirements Table
Matrix5
Analytical
Group
Concentration
Level
Analytical and Preparation
Method / SOP Reference1
Sample
Volume3
Containers
(number, size,
and type)10
Preservation
Requirements
(chemical,
temperature,
light protected)
Maximum Holding
Time
(preparation /
analysis)
TCLPV Medium SW-846 1311, 8260 / NA6 200g
two, 4oz, wide-
mouth jarcool to 4°C
14 days to leach, 14
days to analyze
TCLPS Medium SW-846 1311, 8270 / NA6 250g
one, 8oz, wide-
mouth jarcool to 4°C
14 days to leach, 7
days to extract, 40
days to analyze
TCLPP Medium SW-846 1311, 8081 / NA6 250g
one, 8oz, wide-
mouth jarcool to 4°C
14 days to leach, 7
days to extract, 40
days to analyze
TCLPH Medium SW-846 1311, 8151 / NA6 250g
one, 8oz, wide-
mouth jarcool to 4°C
14 days to leach, 7
days to extract, 40
days to analyze
TCLPM MediumSW-846 1311, 6010, 7470 /
NA6 250g
one, 8oz, wide-
mouth jarcool to 4°C
6 months (28 days
for Hg) to leach, 6
months (28 days for
Hg) to analyze
REACT MediumSW-846 7.3.3.2, SW-846
7.3.4.1 / LAB-2130g
CORR Medium SW-846 9045 / LAB-22 20g
IGN MediumPensky Martens / LAB-23,
LAB-24NA
REACT MediumSW-846 7.3.3.2, SW-846
7.3.4.1 / LAB-2130g
14 days for S2-
7 days for CN
CORR Medium SW-846 9045 / LAB-06 20g ASAP
IGN Medium Pensky Martens / LAB-07 NA 14 days
1Specify the appropriate reference letter or number from the Analytical SOP References table (Worksheet #23).
2NA: SOPs are kept on file at the CLP laboratory that will perform the analysis.
4Concentration Range "ICP-AES" includes mercury by CVAA and cyanide by spectrophotometer as per EPA CLP ILM05.4 .
6NA: SOPs are kept on file at DESA.
8Cooling is not necessary for GRAINSIZE but samples may be cooled to 4°C.
VOA: 18 dry vials plus one %Solids vial. Three %Solids vials are not needed.
10Additional volume for MS/MSD will be collected for all analyses except for archive samples, WCHEM analyses, TCLP & RCI
analyses. Triple volume is required for MS/MSD samples with the following exceptions:
14 days for S2-
7 days for CNcool to 4°C
one, 8oz, wide-
mouth jar
cool to 4°Cone, 500mL,
HDPE
5SD = Sediment; CSD = CSO Sediment; SB = Subsurface Soil; SW = Surface Water; CSW = CSO Surface Water; GW =
Groundwater; AQ = Aquelus; AR = Air; TI = Tissue
3Bottles are filled to capacity. The sample volume given is the minimum required for analysis. For tissue samples, the minimum
volumes shown are those referenced by the respective methods. Actualy minimum volumes needed may be less and are addressed in
the prioritization scheme.
SD
AQ
SB, SD
4 of 4
Title: Gowanus Canal RI/FS
Revision Number: 1 Revision Date: May 17, 2010
Page 62 of 83
QAPP Worksheet #20
(UFP-QAPP Manual Section 3.1.1)
Summarize by matrix, analytical group, and concentration level the number of field QC samples that will be collected and sent to the laboratory.
Worksheet Not Applicable (State Reason)
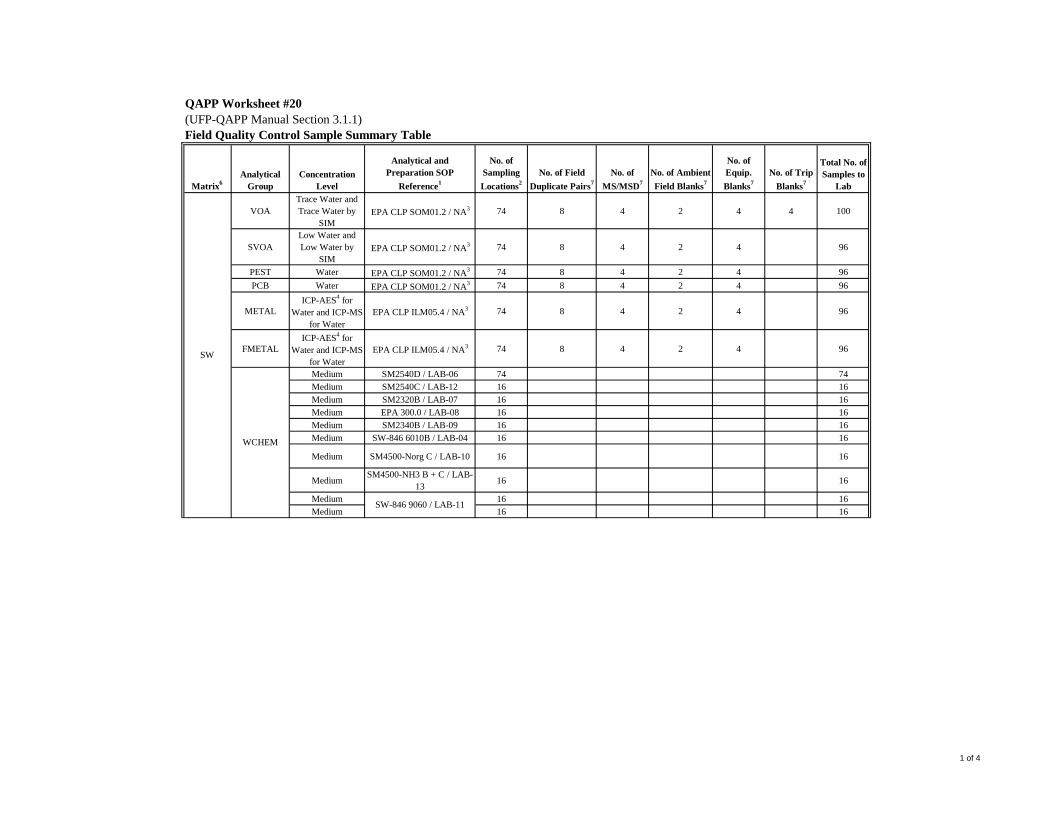
QAPP Worksheet #20
(UFP-QAPP Manual Section 3.1.1)
Field Quality Control Sample Summary Table
Matrix6
Analytical
Group
Concentration
Level
Analytical and
Preparation SOP
Reference1
No. of
Sampling
Locations2
No. of Field
Duplicate Pairs7
No. of
MS/MSD7
No. of Ambient
Field Blanks7
No. of
Equip.
Blanks7
No. of Trip
Blanks7
Total No. of
Samples to
Lab
VOA
Trace Water and
Trace Water by
SIM
EPA CLP SOM01.2 / NA3 74 8 4 2 4 4 100
SVOA
Low Water and
Low Water by
SIM
EPA CLP SOM01.2 / NA3 74 8 4 2 4 96
PEST Water EPA CLP SOM01.2 / NA3 74 8 4 2 4 96
PCB Water EPA CLP SOM01.2 / NA3 74 8 4 2 4 96
METAL
ICP-AES4 for
Water and ICP-MS
for Water
EPA CLP ILM05.4 / NA3 74 8 4 2 4 96
FMETAL
ICP-AES4 for
Water and ICP-MS
for Water
EPA CLP ILM05.4 / NA3 74 8 4 2 4 96
Medium SM2540D / LAB-06 74 74
Medium SM2540C / LAB-12 16 16
Medium SM2320B / LAB-07 16 16
Medium EPA 300.0 / LAB-08 16 16
Medium SM2340B / LAB-09 16 16
Medium SW-846 6010B / LAB-04 16 16
Medium SM4500-Norg C / LAB-10 16 16
MediumSM4500-NH3 B + C / LAB-
1316 16
Medium 16 16
Medium 16 16SW-846 9060 / LAB-11
SW
WCHEM
1 of 4
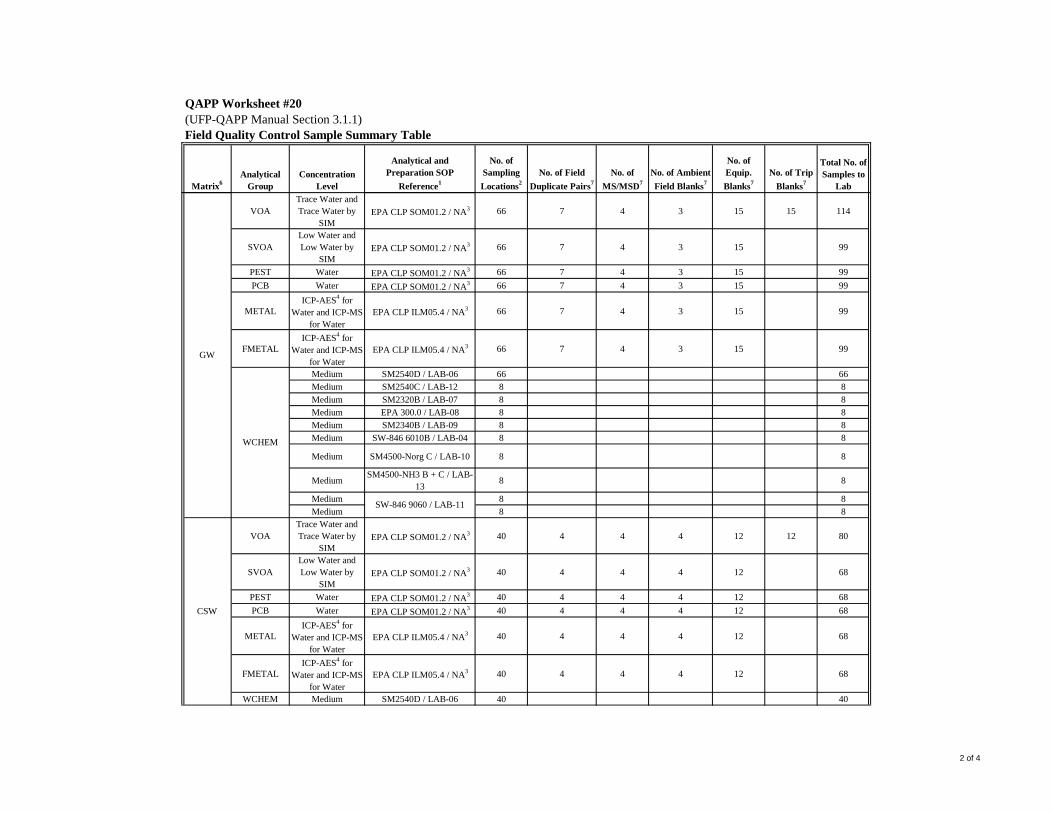
QAPP Worksheet #20
(UFP-QAPP Manual Section 3.1.1)
Field Quality Control Sample Summary Table
Matrix6
Analytical
Group
Concentration
Level
Analytical and
Preparation SOP
Reference1
No. of
Sampling
Locations2
No. of Field
Duplicate Pairs7
No. of
MS/MSD7
No. of Ambient
Field Blanks7
No. of
Equip.
Blanks7
No. of Trip
Blanks7
Total No. of
Samples to
Lab
VOA
Trace Water and
Trace Water by
SIM
EPA CLP SOM01.2 / NA3 66 7 4 3 15 15 114
SVOA
Low Water and
Low Water by
SIM
EPA CLP SOM01.2 / NA3 66 7 4 3 15 99
PEST Water EPA CLP SOM01.2 / NA3 66 7 4 3 15 99
PCB Water EPA CLP SOM01.2 / NA3 66 7 4 3 15 99
METAL
ICP-AES4 for
Water and ICP-MS
for Water
EPA CLP ILM05.4 / NA3 66 7 4 3 15 99
FMETAL
ICP-AES4 for
Water and ICP-MS
for Water
EPA CLP ILM05.4 / NA3 66 7 4 3 15 99
Medium SM2540D / LAB-06 66 66
Medium SM2540C / LAB-12 8 8
Medium SM2320B / LAB-07 8 8
Medium EPA 300.0 / LAB-08 8 8
Medium SM2340B / LAB-09 8 8
Medium SW-846 6010B / LAB-04 8 8
Medium SM4500-Norg C / LAB-10 8 8
MediumSM4500-NH3 B + C / LAB-
138 8
Medium 8 8
Medium 8 8
VOA
Trace Water and
Trace Water by
SIM
EPA CLP SOM01.2 / NA3 40 4 4 4 12 12 80
SVOA
Low Water and
Low Water by
SIM
EPA CLP SOM01.2 / NA3 40 4 4 4 12 68
PEST Water EPA CLP SOM01.2 / NA3 40 4 4 4 12 68
PCB Water EPA CLP SOM01.2 / NA3 40 4 4 4 12 68
METAL
ICP-AES4 for
Water and ICP-MS
for Water
EPA CLP ILM05.4 / NA3 40 4 4 4 12 68
FMETAL
ICP-AES4 for
Water and ICP-MS
for Water
EPA CLP ILM05.4 / NA3 40 4 4 4 12 68
WCHEM Medium SM2540D / LAB-06 40 40
CSW
GW
WCHEM
SW-846 9060 / LAB-11
2 of 4
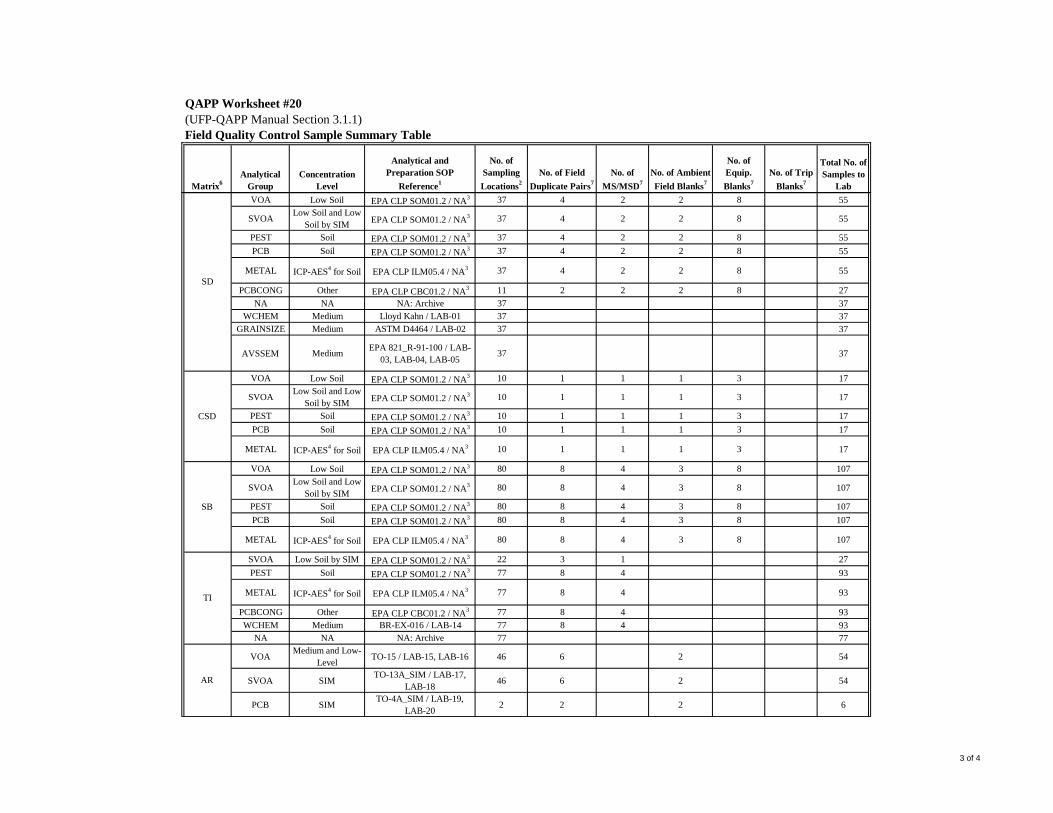
QAPP Worksheet #20
(UFP-QAPP Manual Section 3.1.1)
Field Quality Control Sample Summary Table
Matrix6
Analytical
Group
Concentration
Level
Analytical and
Preparation SOP
Reference1
No. of
Sampling
Locations2
No. of Field
Duplicate Pairs7
No. of
MS/MSD7
No. of Ambient
Field Blanks7
No. of
Equip.
Blanks7
No. of Trip
Blanks7
Total No. of
Samples to
Lab
VOA Low Soil EPA CLP SOM01.2 / NA3 37 4 2 2 8 55
SVOALow Soil and Low
Soil by SIMEPA CLP SOM01.2 / NA
3 37 4 2 2 8 55
PEST Soil EPA CLP SOM01.2 / NA3 37 4 2 2 8 55
PCB Soil EPA CLP SOM01.2 / NA3 37 4 2 2 8 55
METAL ICP-AES4 for Soil EPA CLP ILM05.4 / NA
3 37 4 2 2 8 55
PCBCONG Other EPA CLP CBC01.2 / NA3 11 2 2 2 8 27
NA NA NA: Archive 37 37
WCHEM Medium Lloyd Kahn / LAB-01 37 37
GRAINSIZE Medium ASTM D4464 / LAB-02 37 37
AVSSEM MediumEPA 821_R-91-100 / LAB-
03, LAB-04, LAB-0537 37
VOA Low Soil EPA CLP SOM01.2 / NA3 10 1 1 1 3 17
SVOALow Soil and Low
Soil by SIMEPA CLP SOM01.2 / NA
3 10 1 1 1 3 17
PEST Soil EPA CLP SOM01.2 / NA3 10 1 1 1 3 17
PCB Soil EPA CLP SOM01.2 / NA3 10 1 1 1 3 17
METAL ICP-AES4 for Soil EPA CLP ILM05.4 / NA
3 10 1 1 1 3 17
VOA Low Soil EPA CLP SOM01.2 / NA3 80 8 4 3 8 107
SVOALow Soil and Low
Soil by SIMEPA CLP SOM01.2 / NA
3 80 8 4 3 8 107
PEST Soil EPA CLP SOM01.2 / NA3 80 8 4 3 8 107
PCB Soil EPA CLP SOM01.2 / NA3 80 8 4 3 8 107
METAL ICP-AES4 for Soil EPA CLP ILM05.4 / NA
3 80 8 4 3 8 107
SVOA Low Soil by SIM EPA CLP SOM01.2 / NA3 22 3 1 27
PEST Soil EPA CLP SOM01.2 / NA3 77 8 4 93
METAL ICP-AES4 for Soil EPA CLP ILM05.4 / NA
3 77 8 4 93
PCBCONG Other EPA CLP CBC01.2 / NA3 77 8 4 93
WCHEM Medium BR-EX-016 / LAB-14 77 8 4 93
NA NA NA: Archive 77 77
VOAMedium and Low-
LevelTO-15 / LAB-15, LAB-16 46 6 2 54
SVOA SIMTO-13A_SIM / LAB-17,
LAB-1846 6 2 54
PCB SIMTO-4A_SIM / LAB-19,
LAB-202 2 2 6
SD
CSD
SB
TI
AR
3 of 4
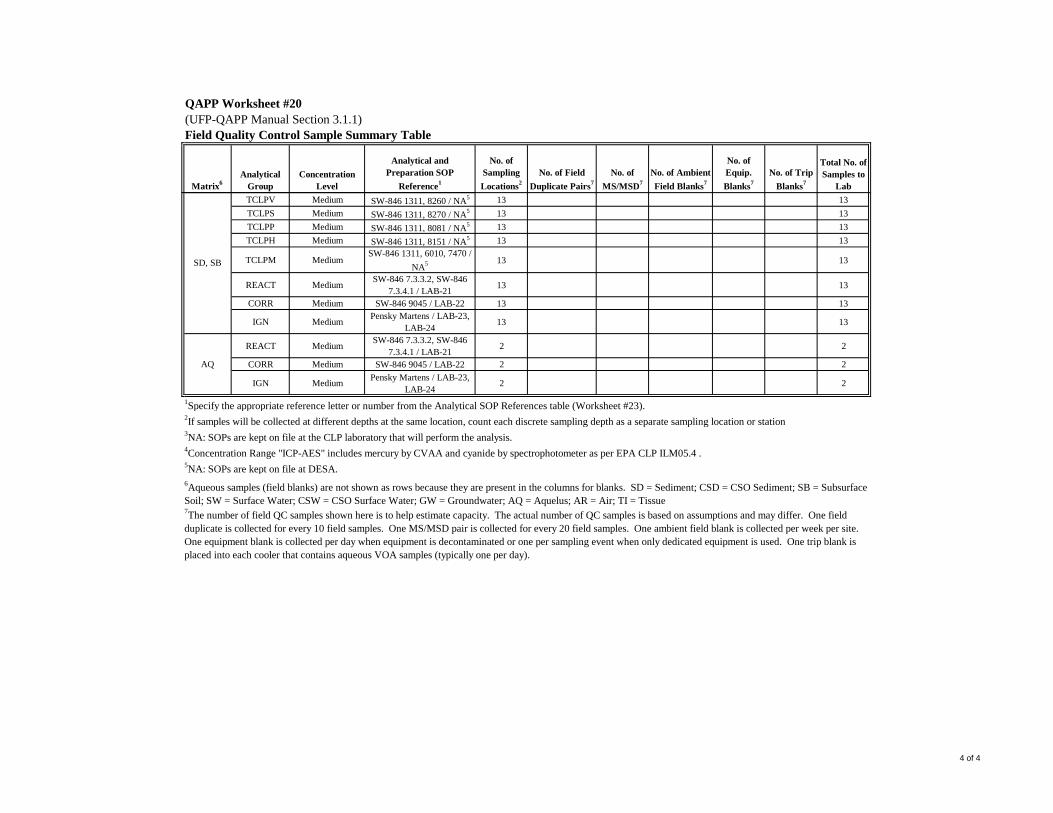
QAPP Worksheet #20
(UFP-QAPP Manual Section 3.1.1)
Field Quality Control Sample Summary Table
Matrix6
Analytical
Group
Concentration
Level
Analytical and
Preparation SOP
Reference1
No. of
Sampling
Locations2
No. of Field
Duplicate Pairs7
No. of
MS/MSD7
No. of Ambient
Field Blanks7
No. of
Equip.
Blanks7
No. of Trip
Blanks7
Total No. of
Samples to
Lab
TCLPV Medium SW-846 1311, 8260 / NA5 13 13
TCLPS Medium SW-846 1311, 8270 / NA5 13 13
TCLPP Medium SW-846 1311, 8081 / NA5 13 13
TCLPH Medium SW-846 1311, 8151 / NA5 13 13
TCLPM MediumSW-846 1311, 6010, 7470 /
NA5 13 13
REACT MediumSW-846 7.3.3.2, SW-846
7.3.4.1 / LAB-2113 13
CORR Medium SW-846 9045 / LAB-22 13 13
IGN MediumPensky Martens / LAB-23,
LAB-2413 13
REACT MediumSW-846 7.3.3.2, SW-846
7.3.4.1 / LAB-212 2
CORR Medium SW-846 9045 / LAB-22 2 2
IGN MediumPensky Martens / LAB-23,
LAB-242 2
1Specify the appropriate reference letter or number from the Analytical SOP References table (Worksheet #23).
2If samples will be collected at different depths at the same location, count each discrete sampling depth as a separate sampling location or station
3NA: SOPs are kept on file at the CLP laboratory that will perform the analysis.
4Concentration Range "ICP-AES" includes mercury by CVAA and cyanide by spectrophotometer as per EPA CLP ILM05.4 .
5NA: SOPs are kept on file at DESA.
7The number of field QC samples shown here is to help estimate capacity. The actual number of QC samples is based on assumptions and may differ. One field
duplicate is collected for every 10 field samples. One MS/MSD pair is collected for every 20 field samples. One ambient field blank is collected per week per site.
One equipment blank is collected per day when equipment is decontaminated or one per sampling event when only dedicated equipment is used. One trip blank is
placed into each cooler that contains aqueous VOA samples (typically one per day).
6Aqueous samples (field blanks) are not shown as rows because they are present in the columns for blanks. SD = Sediment; CSD = CSO Sediment; SB = Subsurface
Soil; SW = Surface Water; CSW = CSO Surface Water; GW = Groundwater; AQ = Aquelus; AR = Air; TI = Tissue
AQ
SD, SB
4 of 4
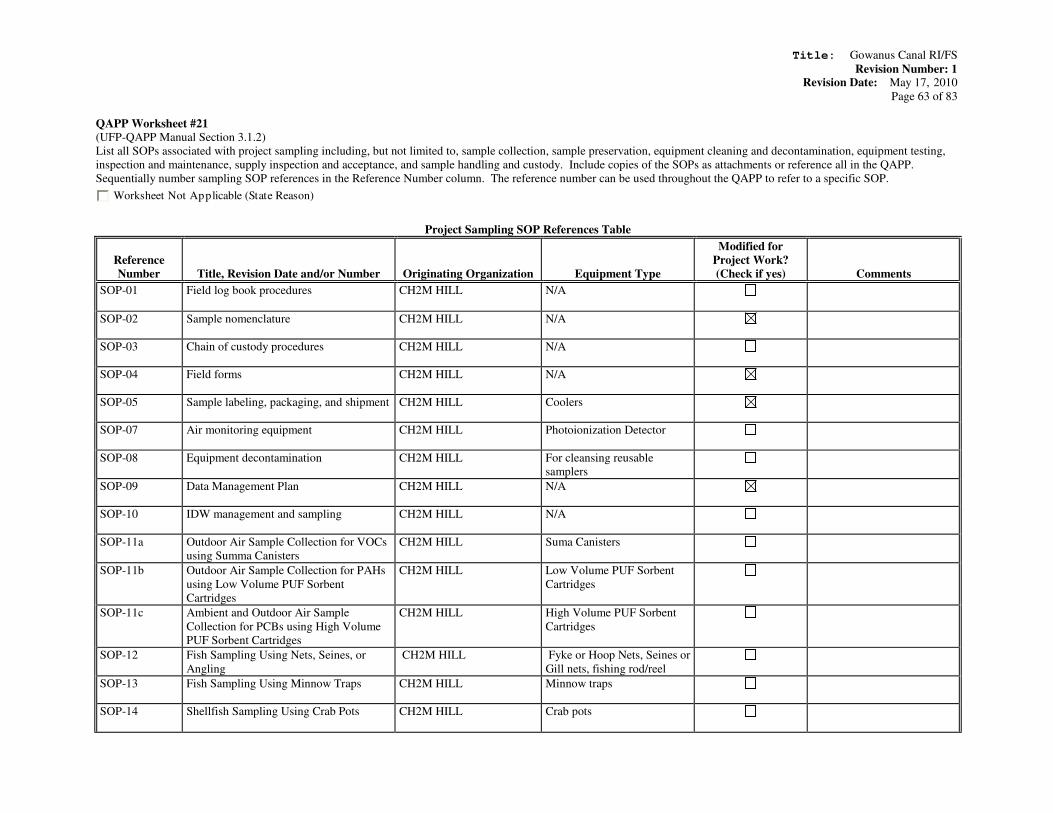
Title: Gowanus Canal RI/FS
Revision Number: 1 Revision Date: May 17, 2010
Page 63 of 83
QAPP Worksheet #21
(UFP-QAPP Manual Section 3.1.2)
List all SOPs associated with project sampling including, but not limited to, sample collection, sample preservation, equipment cleaning and decontamination, equipment testing,
inspection and maintenance, supply inspection and acceptance, and sample handling and custody. Include copies of the SOPs as attachments or reference all in the QAPP.
Sequentially number sampling SOP references in the Reference Number column. The reference number can be used throughout the QAPP to refer to a specific SOP.
Worksheet Not Applicable (State Reason)
Project Sampling SOP References Table
Reference
Number
Title, Revision Date and/or Number
Originating Organization
Equipment Type
Modified for
Project Work?
(Check if yes)
Comments
SOP-01 Field log book procedures
CH2M HILL N/A
SOP-02 Sample nomenclature CH2M HILL N/A
SOP-03 Chain of custody procedures CH2M HILL N/A
SOP-04 Field forms CH2M HILL N/A
SOP-05 Sample labeling, packaging, and shipment CH2M HILL Coolers
SOP-07 Air monitoring equipment CH2M HILL Photoionization Detector
SOP-08 Equipment decontamination CH2M HILL For cleansing reusable
samplers
SOP-09 Data Management Plan CH2M HILL N/A
SOP-10 IDW management and sampling CH2M HILL N/A
SOP-11a Outdoor Air Sample Collection for VOCs
using Summa Canisters
CH2M HILL Suma Canisters
SOP-11b Outdoor Air Sample Collection for PAHs
using Low Volume PUF Sorbent
Cartridges
CH2M HILL Low Volume PUF Sorbent
Cartridges
SOP-11c Ambient and Outdoor Air Sample
Collection for PCBs using High Volume
PUF Sorbent Cartridges
CH2M HILL High Volume PUF Sorbent
Cartridges
SOP-12
Fish Sampling Using Nets, Seines, or
Angling
CH2M HILL Fyke or Hoop Nets, Seines or
Gill nets, fishing rod/reel
SOP-13 Fish Sampling Using Minnow Traps CH2M HILL Minnow traps
SOP-14
Shellfish Sampling Using Crab Pots CH2M HILL Crab pots
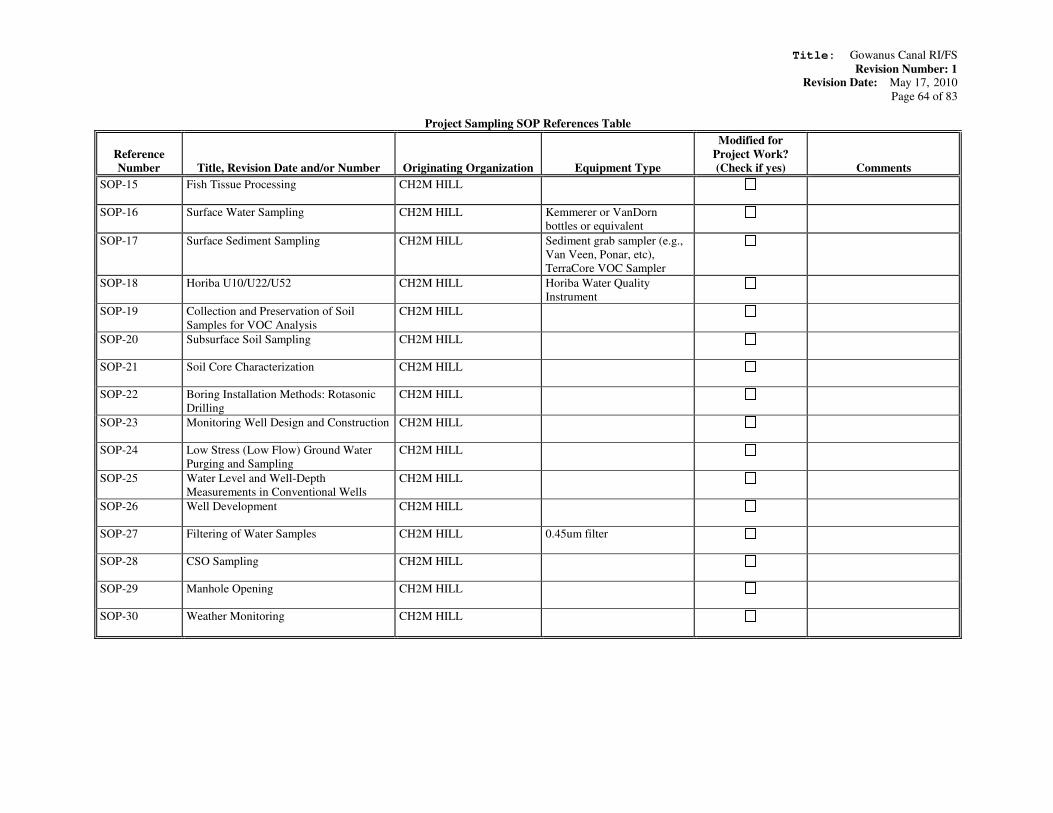
Title: Gowanus Canal RI/FS
Revision Number: 1 Revision Date: May 17, 2010
Page 64 of 83
Project Sampling SOP References Table
Reference
Number
Title, Revision Date and/or Number
Originating Organization
Equipment Type
Modified for
Project Work?
(Check if yes)
Comments
SOP-15 Fish Tissue Processing CH2M HILL
SOP-16 Surface Water Sampling CH2M HILL Kemmerer or VanDorn
bottles or equivalent
SOP-17 Surface Sediment Sampling CH2M HILL Sediment grab sampler (e.g.,
Van Veen, Ponar, etc),
TerraCore VOC Sampler
SOP-18 Horiba U10/U22/U52 CH2M HILL Horiba Water Quality
Instrument
SOP-19 Collection and Preservation of Soil
Samples for VOC Analysis
CH2M HILL
SOP-20 Subsurface Soil Sampling CH2M HILL
SOP-21 Soil Core Characterization CH2M HILL
SOP-22 Boring Installation Methods: Rotasonic
Drilling
CH2M HILL
SOP-23 Monitoring Well Design and Construction CH2M HILL
SOP-24 Low Stress (Low Flow) Ground Water
Purging and Sampling
CH2M HILL
SOP-25 Water Level and Well-Depth
Measurements in Conventional Wells
CH2M HILL
SOP-26 Well Development CH2M HILL
SOP-27 Filtering of Water Samples CH2M HILL 0.45um filter
SOP-28 CSO Sampling CH2M HILL
SOP-29 Manhole Opening CH2M HILL
SOP-30 Weather Monitoring CH2M HILL

Title: Gowanus Canal RI/FS
Revision Number: 1 Revision Date: May 17, 2010
Page 65 of 83
QAPP Worksheet #22
(UFP-QAPP Manual Section 3.1.2.4)
Identify all field equipment and instruments (other than analytical instrumentation) that require calibration, maintenance, testing, or inspection and provide the SOP reference number
for each type of equipment. In addition, document the frequency of activity, acceptance criteria, and corrective action requirements on the worksheet.
Worksheet Not Applicable (State Reason)
Field Equipment Calibration, Maintenance, Testing, and Inspection Table
Field
Equipment
Calibration
Activity
Maintenance
Activity
Testing Activity Inspection
Activity
Frequency
Acceptance
Criteria
Corrective
Action
Responsible
Person
SOP Reference1
Horiba
U10/U22/U52
Water Quality
Instrument
Daily Calibration
per manufacturer
recommendation
Per manufacturer
recommendation
NA Inspect prior to
use per
manufacturer
recommendation
Daily Parameter
specific
per model/
instruction
manual
Manufacturer
technical support
for
calibration errors
David Reamer, or
TBD
Field Team Lead,
CH2M HILL
SOP-18
Groundwater
sampling pumps
and tubing
NA NA NA Inspect pumps,
tubing and
air/sample line
quick-connects or
power cords.
Regularly Maintained in
good working
order per
manufacture’s
recommendation.
Replace items David Reamer, or
TBD
Field Team Lead,
CH2M HILL
SOP 24
MiniRAE
2000/3000 (PID)
Daily Calibration
per manufacturer
recommendation
Calibrate for
organic vapors
using compressed
gas cylinders
Per manufacturer
recommendation
Charge batteries.
Allow the
batteries to totally
discharge before
recharging to
prevent battery
memory from
occurring.
NA Inspect prior to
use per
manufacturer
recommendation
Daily before use.
Occasionally, as
needed.
Parameter
specific
per model/
instruction
manual
Check operations
manual for
acceptable range
of calibrated
probe for the
specific lamp
model.
Manufacturer
technical support
for
calibration errors
If meter fails to
calibrate, do not
use this meter.
David Reamer, or
TBD
Field Team Lead,
CH2M HILL
SOP 7
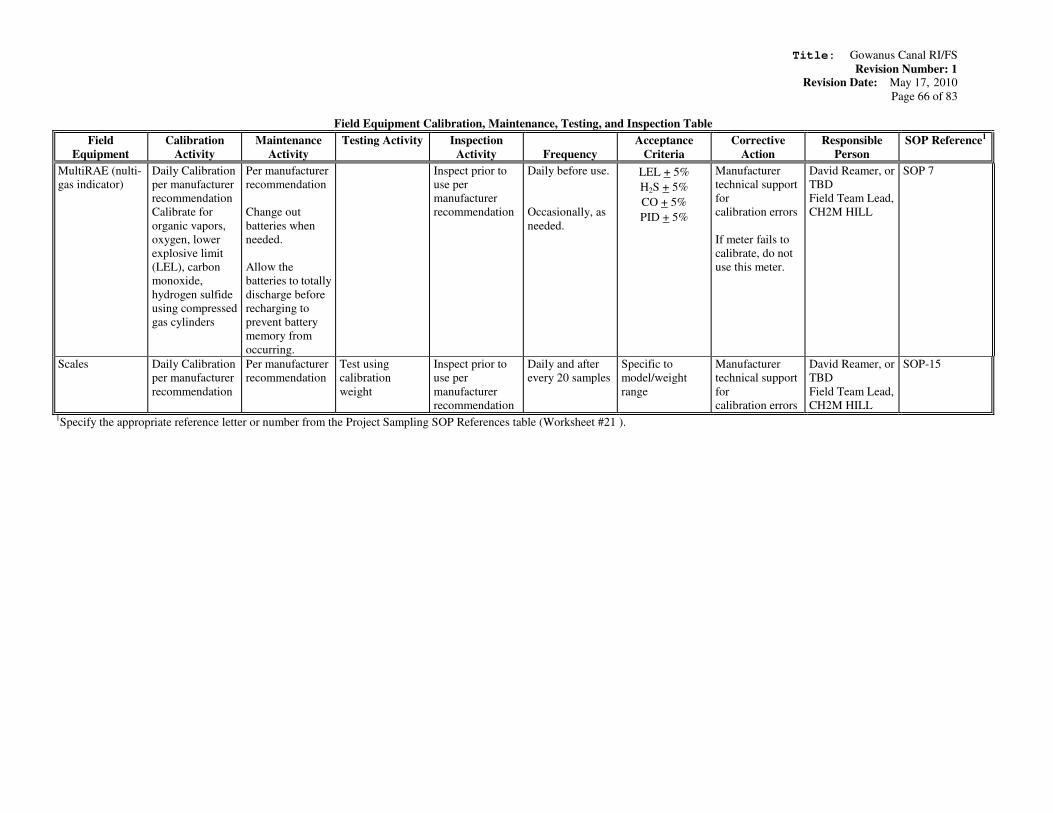
Title: Gowanus Canal RI/FS
Revision Number: 1 Revision Date: May 17, 2010
Page 66 of 83
Field Equipment Calibration, Maintenance, Testing, and Inspection Table
Field
Equipment
Calibration
Activity
Maintenance
Activity
Testing Activity Inspection
Activity
Frequency
Acceptance
Criteria
Corrective
Action
Responsible
Person
SOP Reference1
MultiRAE (nulti-
gas indicator)
Daily Calibration
per manufacturer
recommendation
Calibrate for
organic vapors,
oxygen, lower
explosive limit
(LEL), carbon
monoxide,
hydrogen sulfide
using compressed
gas cylinders
Per manufacturer
recommendation
Change out
batteries when
needed.
Allow the
batteries to totally
discharge before
recharging to
prevent battery
memory from
occurring.
Inspect prior to
use per
manufacturer
recommendation
Daily before use.
Occasionally, as
needed.
LEL + 5%
H2S + 5%
CO + 5%
PID + 5%
Manufacturer
technical support
for
calibration errors
If meter fails to
calibrate, do not
use this meter.
David Reamer, or
TBD
Field Team Lead,
CH2M HILL
SOP 7
Scales Daily Calibration
per manufacturer
recommendation
Per manufacturer
recommendation
Test using
calibration
weight
Inspect prior to
use per
manufacturer
recommendation
Daily and after
every 20 samples
Specific to
model/weight
range
Manufacturer
technical support
for
calibration errors
David Reamer, or
TBD
Field Team Lead,
CH2M HILL
SOP-15
1Specify the appropriate reference letter or number from the Project Sampling SOP References table (Worksheet #21 ).
Title: Gowanus Canal RI/FS
Revision Number: 1 Revision Date: May 17, 2010
Page 67 of 83
QAPP Worksheet #23 (UFP-QAPP Manual Section 3.2.1)
List all SOPs that will be used to perform on-site or off-site analysis. Indicate whether the procedure produces screening or definitive data. Sequentially number analytical SOP
reference in the Reference Number column. Include copies of the SOPs as attachments or reference in the QAPP. The reference number can be used throughout the QAPP to refer to
a specific SOP.
Worksheet Not Applicable (State Reason)
QAPP Worksheet #23
(UFP-QAPP Manual Section 3.2.1)
Analytical SOP References Table
Reference
Number Title, Revision Date, and/or Number
Definitive or
Screening Data Analytical Group Instrument
Organization Performing
Analysis
Modified for
Project Work?
(Y/N)
VOA GC/MS
SVOA GC/MS
PEST GC-ECD
PCB GC-ECD
ICP-AES
CVAA
Spectrophotometer
PCBCONG HRGC/HRMS
TCLPV GC/MS
TCLPS GC/MS
TCLPP GC-ECD
TCLPH GC-ECD
ICP-AES
CVAA
LAB-01 BR-WC-008; TOC Lloyd Kahn Method; 3/30/10; Rev. 12 Screening WCHEM TOC Analyzer Test America - Burlington N
LAB-02BR-GT-005; PARTICLE-SIZE DISTRIBUTION OF CATALYTIC MATERIAL LASER
LIGHT SCATTERING (ASTM D4464); 8/27/08; Rev. 1Screening GRAINSIZE
Laser-Scattering
Particle Size AnalyzerTest America - Burlington N
LAB-03 BR-WC-012; Acid Volatile Sulfide & Simultaneously Extracted Metals; 1/1/08; Rev. 8Titrator, ICP-AES,
CVAAN
LAB-04 BR-ME-005; Metals by ICP-OES (SW-846 Method 6010B); 3/8/10; Rev. 11 ICP-AES N
LAB-05 BR-ME-015; Mercury by CVAA (SW-846 7470A); 8/21/09; Rev. 13 CVAA N
LAB-06CT-CVS-02; SOP for Total Suspended Solids [ Method(s) SM 2540 D]; 10/22/09;
Rev. 7Analytical Balance Test America - Connecticut N
LAB-07CT-CVS-7; SOP for Total Alkalinity in Water [Methods 2320B/4500-CO2 D]; 6/8/09;
Rev. 9Titrator Test America - Connecticut N
LAB-08CT-CVS-61; Inorganic Anions by Ion Chromatography [ Method 300.0]; 2/22/10; Rev.
7Ion Chromatograph Test America - Connecticut N
LAB-09 CT-MES-40; SOP for Total Hardness [Method(s) SM2340B]; 3/8/10; Rev. 1 N/A (calculation) Test America - Connecticut N
LAB-10 BR-WC-013; Total Kjeldahl Nitrogen SM4500Norg C (19th Edition); 5/9/08; Rev. 11 Spectrophotometer Test America - Burlington N
LAB-11BR-WC-002; Total Organic Carbon (Combustion Method) SM5310B (19th Edition) &
SW-846 9060; 3/14/08; Rev. 11TOC Analyzer Test America - Burlington N
LAB-12 CT-CVS-01; SOP for Total Dissolved Solids [Method(s) SM 2540C]; 10/22/09; Rev. 6 Analytical Balance Test America - Connecticut N
LAB-13BR-WC-009; Nitrogen (Ammonia) Distillation & Nesslerization Method SM4500-NH3
B (18th Edition) SM4500-NH3 C (18th Edition); 5/9/08; Rev. 11Spectrophotometer Test America - Burlington N
METAL
TCLPM
Test America - BurlingtonAVSSEMScreening
WCHEMScreening
NA: SOPs are kept on file at the CLP laboratory that will perform the analysis.NA
NA: SOPs are kept on file at DESANA NDESADefinitive
NCLP LaboratoryDefinitive
1 of 2
QAPP Worksheet #23
(UFP-QAPP Manual Section 3.2.1)
Analytical SOP References Table
Reference
Number Title, Revision Date, and/or Number
Definitive or
Screening Data Analytical Group Instrument
Organization Performing
Analysis
Modified for
Project Work?
(Y/N)
LAB-14 BR-EX-016; Determination of Percent Lipids; 3/16/10; Rev. 8 Screening WCHEM Analytical Balance Test America - Burlington N
LAB-15BR-AT-004; Determination of VOCs in Ambient Air EPA Compendium Methods TO14
and TO15; 9/25/09; Rev. 7
LAB-16BR-AT-003; Low Concentration VOCs in Air by GC/MS EPA Compendium Method
TO15; 1/7/08; Rev. 1
LAB-17
WS-OP-0006; Preparation and Extraction of Semi-Volitiles on PUF (PolyUrethane
Foam)/XAD-2 Resin Samples for GC/MS Analysis [Method TO-13 and Method
8270C]; 1/9/08; Rev. 3
LAB-18WS-MS-0006; Determination of Polycyclic Aromatic Hydrocarbons (PAH) by GC/MS –
Isotope Dilution; 9/4/09 Rev. 3.1
LAB-19
WS-0P-0007; Extraction of Organochlorine Pesticides and PCBs for GC/ECD Analysis
(Polyurethane Foam Samples, PUF) [Method TO-4A Modified and TO-10A Modified];
8/7/09; Rev. 4.1
LAB-20
WS-GC-0002; Chromatographic Analysis Based on SW-846 Methods 8000B and 8082,
and Compendium Methods TO-4, TO-4A, TO-10, and TO-10A [Methods 8082, TO-4
and TO-10]; 6/24/09; Rev. 4.1
LAB-21 CT-CVS-19; SOP for Reactivity [Method(s) SW846 Chapter 7.3]; 1/15/10; Rev. 4 Definitive REACT Colorimeter Test America - Connecticut N
LAB-22CT-CVS-09; SOP for pH in Water [Method(s) SM 4500 H+ B, SW845
9040B]; 11/5/08; Rev. 3Definitive CORR pH Meter Test America - Connecticut N
LAB-23 CT-CVS-23; SOP for Ignitablity [Method 1030]; 10/22/09; Rev. 6
LAB-24CT-CVS-78; SOP for Flash Point Analysis [Method 1020A]; 7/29/08;
Rev. 0
NTest America - ConnecticutFlashpoint ApparatusIGNDefinitive
Definitive NTest America - West SacramentoGC/MSSVOA (air)
NTest America - West SacramentoGC-ECDPCB (air)Definitive
NTest America - BurlingtonGC/MSVOA (air)Definitive
2 of 2

Title: Gowanus Canal RI/FS
Revision Number: 1 Revision Date: May 17, 2010
Page 68 of 83
QAPP Worksheet #24
(UFP-QAPP Manual Section 3.2.2)
Identify all analytical instrumentation that requires calibration and provide the SOP reference number for each. In addition, document the frequency, acceptance criteria, and
corrective action requirements on the worksheet.
Worksheet Not Applicable (State Reason)
QAPP Worksheet #24
(UFP-QAPP Manual Section 3.2.2)
Analytical Instrument Calibration Table
InstrumentCalibration
ProcedureFrequency of Calibration Acceptance Criteria Corrective Action (CA)
Person Responsible
for CASOP Reference
1
Instrument Performance
Check (4-
Bromofluorobenzene)
At the beginning of each 12 hour period. As per EPA CLP SOM01.2Retune, clean the ion source, clean the quadrupole rods, etc. Acceptance criteria must be met
before analyzing samples.
Initial Calibration
(minimum of five
concentrations)
Upon award of the contract, whenever the
laboratory takes corrective action that may
change or affect the initial calibration criteria
(ion source cleaning or repair, column
replacement, etc.) or if the CCV technical
acceptance criteria have not been met.
Must meet required minimum RRF for compounds with required minimum RRF as per EPA CLP SOM01.2.
Must meet maximum %RSD for each target as per EPA CLP SOM01.2.
Up to two target compounds may fail to meet the minimum RRF requirements but must still meet
minimum RRF of 0.010. Up to two target compounds may fail to meet the maximum %RSD
requirements but must still meet maximum %RSD requirement of 40%. Inspect the system for
problems. Clean the ion source, change the column, survice the purge-and-trap device, etc. Repeat
the initial calibration. Initial calibration must meet the acceptance criteria before any samples are
analyzed.
Continuing Calibration
Verification
An opening continuing calibration verification
before the analysis of samples and a closing
calibration verification before the end of the 12-
hr time period.
Must meet required minimum RRF as per EPA CLP SOM01.2. Must fall within %D range as per EPA CLP
SOM01.2.
For an opening CCV, up to two target compounds may fail to meet the minimum RRF
requirements but must still meet minimum RRF of 0.010. For an opening CCV, up to two target
compounds may fail to meet the maximum %RSD requirements but must still meet maximum
%RSD requirement of 40%. If the opening CCV acceptance criteria are not met, recalibrate the
instrument. If the closing CCV acceptance criteria are not met, reanalyze all associated samples.
Clean the ion source, change the column, etc.
Instrument Performance
Check
(Decafluorotriphenylphos
phine)
At the beginning of each 12 hour period. As per EPA CLP SOM01.2Retune, clean the ion source, clean the quadrupole rods, etc. Acceptance criteria must be met
before analyzing samples.
Initial Calibration
(minimum of five
concentrations)
Upon award of the contract, whenever the
laboratory takes corrective action that may
change or affect the initial calibration criteria
(ion source cleaning or repair, column
replacement, etc.) or if the CCV technical
acceptance criteria have not been met.
Must meet required minimum RRF for all compounds as per EPA CLP SOM01.2. Must meet maximum %RSD
for each target with a maximum %RSD as per EPA CLP SOM01.2.
Up to four target compounds may fail to meet the minimum RRF requirements but must still meet
minimum RRF of 0.010. Up to two target compounds may fail to meet the maximum %RSD
requirements but must still meet maximum %RSD requirement of 40%. Inspect the system for
problems. Clean the ion source, change the column, etc. Repeat the initial calibration. Initial
calibration must meet the acceptance criteria before any samples are analyzed.
Continuing Calibration
Verification
An opening continuing calibration verification
before the analysis of samples and a closing
calibration verification before the end of the 12-
hr time period.
Must meet required minimum RRF as per EPA CLP SOM01.2. Must fall within %D range as per EPA CLP
SOM01.2.
For an opening CCV, up to four target compounds may fail to meet the minimum RRF
requirements but must still meet minimum RRF of 0.010. For an opening CCV, up to four target
compounds may fail to meet the maximum %RSD requirements but must still meet maximum
%RSD requirement of 40%. If the opening CCV acceptance criteria are not met, recalibrate the
instrument. If the closing CCV acceptance criteria are not met, reanalyze all associated samples.
Clean the ion source, change the column, etc.
Initial Calibration
(minimum of five
concentrations)
Upon award of the contract, whenever major
instrument modification or maintenance is
performed (column replacement or repair,
cleaning/replacing ECD, etc.) or if the CCV
technical acceptance criteria have not been met.
The resolution between two adjacent peaks in the resolution check mixture must be ≥ 80% on the primary column
and ≥ 50% on the secondary column. All single component compounds must be ≥ 90% resolved on each column.
Absolute RTs of each single-component compounds must fall within the RT window established by ICAL.
Percent difference between calculated and nominal amount for each single-component compound must be ±25%.
Percent breakdown of DDT and Endrin must be ≤ 20%. Combined % breakdown of DDT and Endrin must be ≤
30%. Must meet maximum %RSD as per EPA CLP SOM01.2.
Up to two single-component pesticides may fail to meet the maximum %RSD requirements but
must still meet maximum %RSD requirement of 30%. Change the column, bake out the detector,
clean the injection port, etc. Clean the ion source, change the column, etc. Repeat the initial
calibration. Initial calibration must meet the acceptance criteria before any samples are analyzed.
Calibration VerificationAn instrument blank and PEM must bracket
one end of each 12-hr time period.
All single component compounds must be ≥ 90% resolved on each column. The resolution between two adjacent
peaks in the resolution check mixture must be ≥ 80% on the primary column and ≥ 50% on the secondary column
if one individual standard mixture is used. Absolute RTs of each single-component compounds must fall within
the RT window established by ICAL. Percent difference between calculated and nominal amount for each single-
component compound must be ±25%. Percent breakdown of DDT and Endrin must be ≤ 20%. Combined %
breakdown of DDT and Endrin must be ≤ 30%. The percent difference between the CF of each of the single
component pesticides must be ±20% between mid-point concentration of individual standard mixture and average
CF from the initial calibration.
Inspect the system for problems. Change the column, bake out the detector, etc. Major corrective
actions require repeating the initial calibration.
Initial Calibration
Each HRGC/HRMS system must be calibrated
prior to analysis of samples under the contract,
whenever the Contractor takes corrective action
that may change or affect the initial calibration
criteria (e.g., ion source cleaning or repairs,
column replacement, etc.), or if the calibration
verification technical acceptance criteria are not
met.
The ion ratios must fall within the limits specified in Table 8 in Exhibit D of CBC01.2. The S/N ratios for the
HRGC/HRMS signal in every SICP must be ≥10. The RTs must fall within the appropriate RT windows
established by analysis of CS1. The %RSD for the RR must be ≤20% over the five-point calibration.
If the initial calibration technical acceptance criteria are not met, inspect the system for problems. It
may be necessary to change columns, adjust the system, and recalibrate until all the technical
acceptance criteria are met. All initial calibrations’ technical acceptance criteria must be met before
any, samples, LCS, or blanks are analyzed. Any analysis conducted when the technical acceptance
criteria have not been met will require reanalysis.
Continuing Calibration
A CS3 Standard must be analyzed at the
beginning of each 12-hour period during which
sample data are collected, but after the HRMS
system tune, as well as at the end of each 12-
hour period. If required, the diluted combined
209-Congener Standard Solutions (Section
7.10.2.2 in Exhibit D of CBC01.2) must also
be analyzed at the beginning of each 12-hour
period, but after the CS3. The CS3 Standard
analyzed at the end of a 12-hour period may
also be used as the beginning of the next 12-
hour period.
For each compound, compare the concentration with the calibration verification limit in Table 6 in Exhibit D of
CBC01.2 . If all compounds meet the acceptance criteria, a calibration has been verified and analysis of standards
and sample extracts may proceed. If, however, any compound fails its respective limit, the measurement system is
not performing properly. In this event, prepare a fresh Calibration Standard or correct the problem and repeat the
resolution and verification (Section 9.7.1 in Exhibit D of CBC01.2) tests, or recalibrate (Section 9 in Exhibit D of
CBC01.2). If recalibration is required, recalibration for the 209 Congeners (Section 9 in Exhibit D of CBC01.2)
must also be performed.
The absolute RTs of the Labeled Toxics/LOC/Window-Defining Congeners Standard Spiking Solution (Section
7.12 in Exhibit D of CBC01.2) in the verification test must be within ±15 sec. of the respective RTs in the
calibration or, if an alternate column or column system is employed, within ±15 sec. of the respective RTs in the
calibration for the alternate column or column system (Section 6.8 in Exhibit D of CBC01.2).
The Relative Retention Times (RRTs) of native CB congeners and labeled compounds in the verification test must
be within their respective RRT limits in Table 2 in Exhibit D of CBC01.2 or, if an alternate column or column
system is employed, within their respective RRT limits for the alternate column or column system (Section 6.8 in
Exhibit D of CBC01.2).
If the absolute or RRT of any compound is not within the limits specified, the GC is not performing properly. In
this event, adjust the GC and repeat the verification test (Section 9.7.2 in Exhibit D of CBC01.2) or recalibrate
(Section 9 in Exhibit D of CBC01.2), or replace the GC column and verify either calibration or recalibrate.
Calibration Verification technical acceptance criteria must be met before any samples, LCS, or
blanks are analyzed. Any analysis conducted when the technical acceptance criteria have not been
met will require reanalysis. If the calibration technical acceptance criteria are not met, inspect the
system for problems. It may be necessary to change columns, adjust the system, and recalibrate. If
recalibration is required, recalibration for the 209 congeners must also be performed.
GC/MS (for VOA)NA
2: EPA CLP
SOM01.2Analyst
NA2: EPA CLP
SOM01.2AnalystGC/MS (for SVOA)
NA2: EPA CLP
SOM01.2AnalystGC/ECD (for PEST and PCB)
HRGC/HRMS (for
PCBCONG)Analyst
NA2: EPA CLP
CBC01.2
1 of 4
QAPP Worksheet #24
(UFP-QAPP Manual Section 3.2.2)
Analytical Instrument Calibration Table
InstrumentCalibration
ProcedureFrequency of Calibration Acceptance Criteria Corrective Action (CA)
Person Responsible
for CASOP Reference
1
GC/MS (for VOA)NA
2: EPA CLP
SOM01.2Analyst
Initial CalibrationOnce every 24 hours and when the instrument
is set up.At least two standards are required. One must be a blank. Re-calibrate
Initial Calibration
VerificationImmediately after calibration. 90-110% recovery for all analytes. Terminate the analysis, correct the problem, repeat the calibration, Verify the calibration.
Continuing Calibration
Verification
10% or every two hours during a run,
whichever is more frequent.90-110% recovery for all analytes.
Stop the analysis, correct the problem, repeat the calibration, verify the calibration, and reanalyze
the 10 proceeding samples or all samples since the last compliant calibration verification.
Initial and Continuing
Calibration Blanks
Immediately after each ICV and CCV, 10%, or
every two hours during a run, whichever is
more frequent.
Absolute value of the blank result cannot exceed the CRQL.Terminate the analysis, correct the problem, repeat the calibration, Verify the calibration.
Reanalyze the 10 proceeding samples or all samples since the last compliant blank
Initial CalibrationOnce every 24 hours and when the instrument
is set up.Five standards are required. One must be a blank. Re-calibrate
Initial Calibration
VerificationImmediately after calibration. 80-120% recovery for mercury Terminate the analysis, correct the problem, repeat the calibration, Verify the calibration.
Continuing Calibration
Verification
10% or every two hours during a run,
whichever is more frequent.80-120% recovery for mercury
Stop the analysis, correct the problem, repeat the calibration, verify the calibration, and reanalyze
the 10 proceeding samples or all samples since the last compliant calibration verification.
Initial and Continuing
Calibration Blanks
Immediately after each ICV and CCV, 10%, or
every two hours during a run, whichever is
more frequent.
Absolute value of the blank result cannot exceed the CRQL.Terminate the analysis, correct the problem, repeat the calibration, Verify the calibration.
Reanalyze the 10 proceeding samples or all samples since the last compliant blank
Initial CalibrationOnce every 24 hours and when the instrument
is set up.Four standards are required. One must be a blank. Re-calibrate
Initial Calibration
Verification
Immediately after calibration. Must be
distilled.85-115% recovery for cyanide Terminate the analysis, correct the problem, repeat the calibration, Verify the calibration.
Continuing Calibration
Verification
10% or every two hours during a run,
whichever is more frequent.85-115% recovery for cyanide
Stop the analysis, correct the problem, repeat the calibration, verify the calibration, and reanalyze
the 10 proceeding samples or all samples since the last compliant calibration verification.
Initial and Continuing
Calibration Blanks
Immediately after each ICV and CCV, 10%, or
every two hours during a run, whichever is
more frequent.
Absolute value of the blank result cannot exceed the CRQL.Terminate the analysis, correct the problem, repeat the calibration, Verify the calibration.
Reanalyze the 10 proceeding samples or all samples since the last compliant blank
TOC Analyzer (for WCHEM,
Lloyd Kahn)LAB-01
Laser Scattering Particle Size
Analyzer (for GRAINSIZE)LAB-02
Titrator, ICP-AES, CVAA
(for AVSSEM)
LAB-03, LAB-04,
LAB-05
Analytical Balance (for
WCHEM, TSS)LAB-06
Titrator (for WCHEM,
Alkalinity)LAB-07
Ion Chromatograph (for
WCHEM, ions)LAB-08
Spectrophotometer (for
WCHEM, TKN)LAB-10
TOC Analyzer (for WCHEM,
TOC and DOC in water)LAB-11
Analytical Balance (for
WCHEM, TDS)LAB-12
Spectrophotometer (for
WCHEM, Ammonia)LAB-13
Analytical Balance (for
WCHEM, Percent Lipids)LAB-14
NA2: EPA CLP
ILM05.4AnalystICP-AES (for METAL)
Spectrophotometer (for
METAL)
CVAA (for METAL)
NA2: EPA CLP
ILM05.4
NA2: EPA CLP
ILM05.4
Refer to Laboratory SOP
For ICP-MS Analyst
Analyst
Analyst
NA2: EPA CLP
ILM05.4
AnalystRefer to Laboratory SOPRefer to Laboratory SOPRefer to Laboratory SOP
2 of 4
QAPP Worksheet #24
(UFP-QAPP Manual Section 3.2.2)
Analytical Instrument Calibration Table
InstrumentCalibration
ProcedureFrequency of Calibration Acceptance Criteria Corrective Action (CA)
Person Responsible
for CASOP Reference
1
GC/MS (for VOA)NA
2: EPA CLP
SOM01.2Analyst
Instrument Performance
Check (4-
Bromofluorobenzene)
Each analytical window. As per Section 10.2.1 of LAB-15. As per Section 10.2.1 of LAB-15.
Initial Calibration
(minimum of five
concentrations)
Upon award of the contract, whenever the
laboratory takes corrective action that may
change or affect the initial calibration criteria
(ion source cleaning or repair, column
replacement, etc.) or if the CCV technical
acceptance criteria have not been met.
The RSD for each target analyte must be <30% with at most 2 exceptions up to a limit of 40%. The area
response for the primary quantitation ion for the internal standard for each ICAL standard must be within 40% of
the mean area response over the calibration range for each internal standard. The RRT for each target compound
at each calibration level must be within 0.06 RRT units of the mean RRT for the compound. The retention time
shift for each of the internal standards at each calibration level must be within 20 seconds of the mean retention
time over the initial calibration range for each internal standard.
If these criteria are not met inspect the system for problems and perform corrective action.
Recommended corrective actions are provided in Section 10.2.5 and in Table 3 of LAB-15.
Initial Calibration
Verification
Immediately following an acceptable initial
calibration70-130%R
If criteria are not met, perform corrective action. Recommended corrective actions are provided in
Table 3 of LAB-15. If corrective action is not successful, remake your standards and recalibrate.
Continuing Calibration
Verification
Daily, after each Instrument Performance
CheckThe %D for each target analyte must be within ±30%.
If the above criteria are not met, repeat the analysis of the CCV once. If the second CCV meets
criteria, continue with the analytical sequence. If it fails, evaluate the data to determine if one of the
following conditions is met. If these conditions are not met corrective action must be taken.
Guidance for troubleshooting is provided in Section 10.2.5 of LAB-15. After corrective action the
analytical sequence may be continued only if two immediate, consecutive CCVs at different
concentrations are within acceptance criteria. If these two CCVs do not meet the criteria,
recalibration is required prior to further analysis.
perfluorotributylamine
(PFTBA) TuneAt the beginning of each continuous sequence. As per Section 10.2.2 of LAB-18. As per Section 10.2.2 of LAB-18.
Initial Calibration
(minimum of five
concentrations)
Before any samples are analyzed, and then
intermittently throughout sample analyses as
dictated by results of the continuing calibration
procedures described in this section, and after
any major maintenance.
As per Section 10.3.3 and 10.4.4 of LAB-18 As per Section 10.3.3 and 10.4.4 of LAB-18
Initial Calibration
Verification
Immediately following an acceptable initial
calibrationAs per Section 10.5 of LAB-18 As per Section 10.5 of LAB-18
Continuing Calibration
Verification
The calibration check standard must be
analyzed at the beginning of each analysis
period, or at the beginning of every 12-hour
shift if the laboratory operates during
consecutive 12-hour shifts.
As per Section 10.4 of LAB-18 As per Section 10.4 of LAB-18
Initial Calibration
(minimum of five
concentrations)
A new calibration curve must be generated
after major changes to the system or when the
continuing calibration criteria cannot be met.
As per Section 10.1 of LAB-20 As per Section 10.1 of LAB-20
Initial Calibration
Verification
Immediately following an acceptable initial
calibrationAs per Section 10.4 of LAB-20 As per Section 10.4 of LAB-20
Calibration Verification
At a minimum, the working calibration curve
or RF must be verified by the analysis of a mid-
level calibration standard at the beginning, after
every 12 hours, and at the end of the analysis
sequence.
As per Section 10.9 of LAB-20 As per Section 10.9 of LAB-20
Instrument Performance
Check (4-
Bromofluorobenzene)
Every 12 hours As per Table 4 of SW-846 8260B Retune and/or clean source. Acceptance criteria must be met.
Initial Calibration
(minimum of five
concentrations)
Instrument receipt, instrument change (new
column, source cleanin, etc.), when CCV is out
of specification
Six-point initial calibration for all analytes. RSD ≤30% for CCC; RF ≥0.10 or 0.30 for SPCC; RSD ≤15% for all
other compounds.Correct the problem, perform instrument maintenance, and rerun the initial calibration curve.
Continuing Calibration
VerificationAt the beginning of each 12 hour shift. RSD ≤30% for CCC; RF ≥0.10 or 0.30 for SPCC
Repeat initial calibration and reanalyze all samples analyzed since the last successful calibration
verification.
GC/ECD (for AR PCB)
GC/MS (for TCLPV) NA3: SW-846 8260Analyst
GC/MS (for AR SVOA) Analyst LAB-17, LAB-18
GC/MS (for AR VOA) Analyst LAB-15, LAB-16
Analyst LAB-19, LAB-20
3 of 4
QAPP Worksheet #24
(UFP-QAPP Manual Section 3.2.2)
Analytical Instrument Calibration Table
InstrumentCalibration
ProcedureFrequency of Calibration Acceptance Criteria Corrective Action (CA)
Person Responsible
for CASOP Reference
1
GC/MS (for VOA)NA
2: EPA CLP
SOM01.2Analyst
Instrument Performance
Check (4-
Bromofluorobenzene)
Every 12 hours As per Table 3 of SW-846 8270C Retune and/or clean source. Acceptance criteria must be met.
Initial Calibration
(minimum of five
concentrations)
Instrument receipt, instrument change (new
column, source cleanin, etc.), when CCV is out
of specification
Six-point initial calibration for all analytes. RSD ≤30% for CCC; RF ≥0.050 for SPCC; RSD ≤15% for all other
compounds.Correct the problem, perform instrument maintenance, and rerun the initial calibration curve.
Continuing Calibration
VerificationAt the beginning of each 12 hour shift. RSD ≤20% for CCC; RF ≥0.050 for SPCC
Repeat initial calibration and reanalyze all samples analyzed since the last successful calibration
verification.
Initial CalibrationInstrument receipt, instrument change, when
CCV is out of specification
Correlation coefficient of 0.995 or better. Six-point calibration of all pesticides except chlordane and toxaphene
(mid-point calibration standard).Check instrument conditions and analyze a new initial calibration.
Continuing Calibration
VerificationEvery 10 samples or every 12 hours. %D ≤15%
Rerun the continuing calibration and all data since the last succesful continuing calibration. If this
does not alleviate the problem, repeat the initial calibration.
Initial CalibrationInstrument receipt, instrument change, when
CCV is out of specificationCorrelation coefficient of 0.990 or better. Six-point calibration of all herbicides. Check instrument conditions and analyze a new initial calibration.
Continuing Calibration
VerificationEvery 10 samples or every 12 hours. %D ≤15%
Rerun the continuing calibration and all data since the last succesful continuing calibration. If this
does not alleviate the problem, repeat the initial calibration.
Initial Calibration Prior to each analytical run. 90-110% recovery for all analytes. Re-calibrate
Initial Calibration
VerificationImmediately after calibration. 90-110% recovery for all analytes. Reanalyze. If failure occurs twice, recalibrate the instrument.
Continuing Calibration
Verification
At the beginning of the run, after every 10
samples, and at the end of the run.90-110% recovery for all analytes. Reanalyze all samples associated with the failed CCV.
Initial and Continuing
Calibration BlanksImmediately after each ICV and CCV Absolute value of the blank result cannot exceed the reporting limit. Reanalyze samples following analysis of a successful calibration blank.
Initial Calibration Prior to each analytical run. Correlation coefficient shall be 0.995 or better. Determine the cause and recalibrate.
Initial Calibration
VerificationImmediately after calibration. 90-110% recovery for mercury Reanalyze. If failure occurs twice, recalibrate the instrument.
Continuing Calibration
Verification
At the beginning of the run, after every 10
samples, and at the end of the run.80-120% recovery for mercury
Terminate the analysis, correct the problem, recalibrate, and re-analyze all samples since the prior
acceptable CCV.
Initial and Continuing
Calibration BlanksImmediately after each ICV and CCV Absolute value of the blank result cannot exceed the reporting limit. Reanalyze samples following analysis of a successful calibration blank.
NA (for REACT) NANA: Method does not include an instrument
that requires calibration.NA: Solutions are prepared, standardized, and checked as per SOP LAB-21. NA: Refer to SOP LAB-21. Analyst LAB-21
pH probe (for CORR) Calibration Daily, prior to use. Calibrate against pH 4.00, 7.00, and 10.00. Then run the LCS. Recalibrate Analyst LAB-22
Reporting Limit NA 73°F is the method established RL NA
Demonstration of
CapabilityOnce per year per analyst Analysis of four laboratory-prepared samples 85-115% of true value. NA: demonstration of proficiency
1Specify the appropriate reference letter or number from the Analytical SOP References table (Worksheet #23).
2SOPs are kept on file at the CLP laboratory that will perform the analysis.
3SOPs are kept on file at DESA.
CVAA (for TCLPM)
LAB-23, LAB-24AnalystClosed-cup Tester (for IGN)
NA3: SW-846 6010
GC-ECD (for TCLPP)
NA3: SW-846 8270AnalystGC-ECD (for TCLPH)
NA3: SW-846 7470
ICP-AES (for TCLPM)
Analyst
NA3: SW-846 8270AnalystGC/MS (for TCLPS)
NA3: SW-846 8081Analyst
Analyst
4 of 4
Title: Gowanus Canal RI/FS
Revision Number: 1 Revision Date: May 17, 2010
Page 69 of 83
QAPP Worksheet #25
(UFP-QAPP Manual Section 3.2.3)
Identify all analytical instruments that require maintenance, testing, or inspection and provide the SOP reference number for each. In addition, document the frequency, acceptance
criteria, and corrective action requirements on the worksheet.
Worksheet Not Applicable (State Reason)
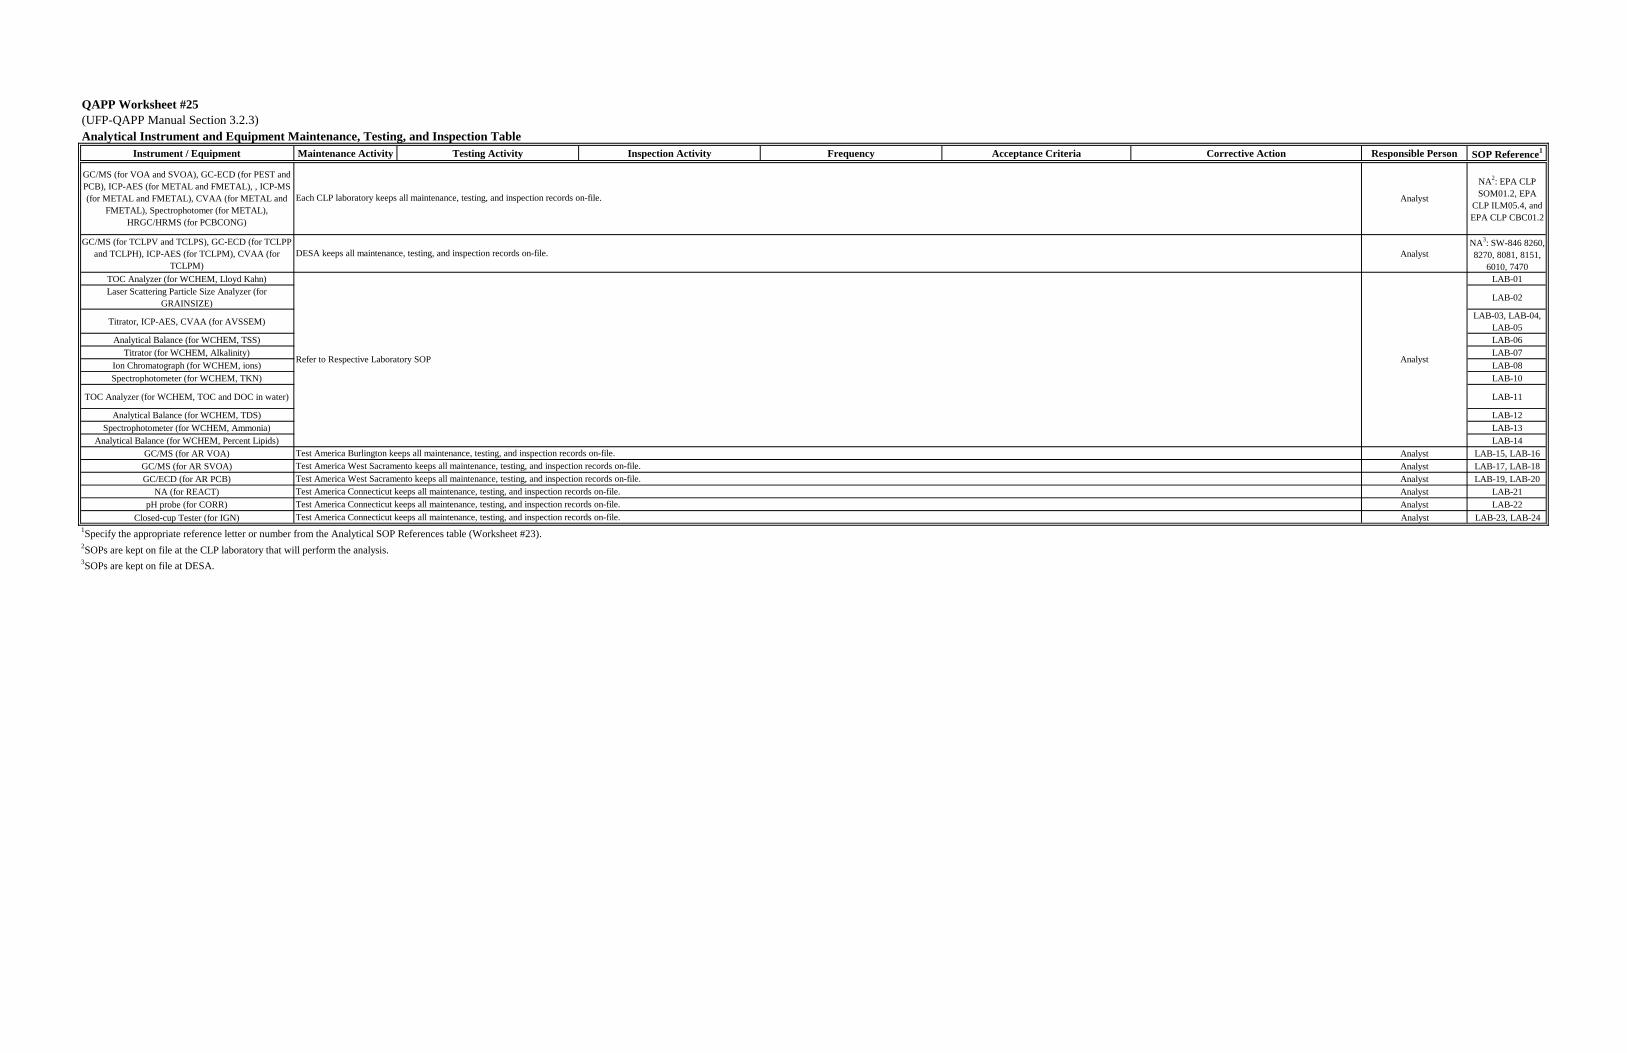
QAPP Worksheet #25
(UFP-QAPP Manual Section 3.2.3)
Analytical Instrument and Equipment Maintenance, Testing, and Inspection Table
Instrument / Equipment Maintenance Activity Testing Activity Inspection Activity Frequency Acceptance Criteria Corrective Action Responsible Person SOP Reference1
GC/MS (for VOA and SVOA), GC-ECD (for PEST and
PCB), ICP-AES (for METAL and FMETAL), , ICP-MS
(for METAL and FMETAL), CVAA (for METAL and
FMETAL), Spectrophotomer (for METAL),
HRGC/HRMS (for PCBCONG)
Analyst
NA2: EPA CLP
SOM01.2, EPA
CLP ILM05.4, and
EPA CLP CBC01.2
GC/MS (for TCLPV and TCLPS), GC-ECD (for TCLPP
and TCLPH), ICP-AES (for TCLPM), CVAA (for
TCLPM)
Analyst
NA3: SW-846 8260,
8270, 8081, 8151,
6010, 7470
TOC Analyzer (for WCHEM, Lloyd Kahn) LAB-01
Laser Scattering Particle Size Analyzer (for
GRAINSIZE)LAB-02
Titrator, ICP-AES, CVAA (for AVSSEM)LAB-03, LAB-04,
LAB-05
Analytical Balance (for WCHEM, TSS) LAB-06
Titrator (for WCHEM, Alkalinity) LAB-07
Ion Chromatograph (for WCHEM, ions) LAB-08
Spectrophotometer (for WCHEM, TKN) LAB-10
TOC Analyzer (for WCHEM, TOC and DOC in water) LAB-11
Analytical Balance (for WCHEM, TDS) LAB-12
Spectrophotometer (for WCHEM, Ammonia) LAB-13
Analytical Balance (for WCHEM, Percent Lipids) LAB-14
GC/MS (for AR VOA) Analyst LAB-15, LAB-16
GC/MS (for AR SVOA) Analyst LAB-17, LAB-18
GC/ECD (for AR PCB) Analyst LAB-19, LAB-20
NA (for REACT) Analyst LAB-21
pH probe (for CORR) Analyst LAB-22
Closed-cup Tester (for IGN) Analyst LAB-23, LAB-24
1Specify the appropriate reference letter or number from the Analytical SOP References table (Worksheet #23).
2SOPs are kept on file at the CLP laboratory that will perform the analysis.
3SOPs are kept on file at DESA.
AnalystRefer to Respective Laboratory SOP
Each CLP laboratory keeps all maintenance, testing, and inspection records on-file.
DESA keeps all maintenance, testing, and inspection records on-file.
Test America Connecticut keeps all maintenance, testing, and inspection records on-file.
Test America Burlington keeps all maintenance, testing, and inspection records on-file.
Test America West Sacramento keeps all maintenance, testing, and inspection records on-file.
Test America West Sacramento keeps all maintenance, testing, and inspection records on-file.
Test America Connecticut keeps all maintenance, testing, and inspection records on-file.
Test America Connecticut keeps all maintenance, testing, and inspection records on-file.
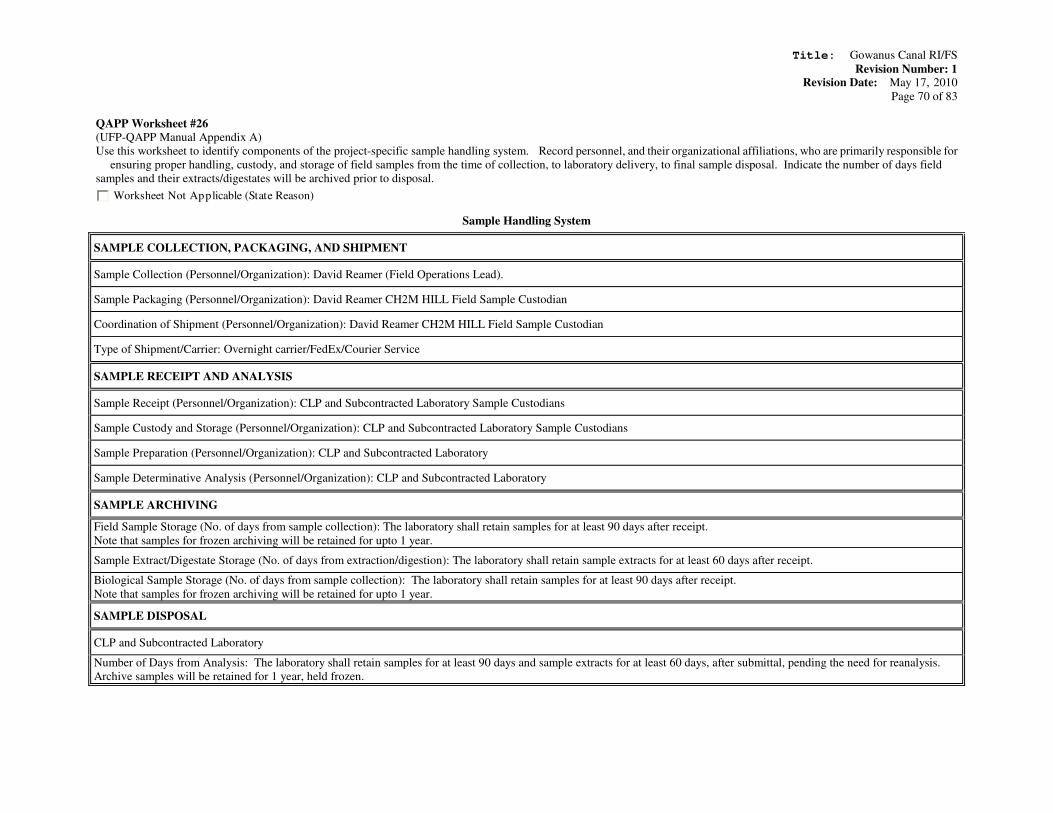
Title: Gowanus Canal RI/FS
Revision Number: 1 Revision Date: May 17, 2010
Page 70 of 83
QAPP Worksheet #26
(UFP-QAPP Manual Appendix A)
Use this worksheet to identify components of the project-specific sample handling system. Record personnel, and their organizational affiliations, who are primarily responsible for
ensuring proper handling, custody, and storage of field samples from the time of collection, to laboratory delivery, to final sample disposal. Indicate the number of days field
samples and their extracts/digestates will be archived prior to disposal.
Worksheet Not Applicable (State Reason)
Sample Handling System
SAMPLE COLLECTION, PACKAGING, AND SHIPMENT
Sample Collection (Personnel/Organization): David Reamer (Field Operations Lead).
Sample Packaging (Personnel/Organization): David Reamer CH2M HILL Field Sample Custodian
Coordination of Shipment (Personnel/Organization): David Reamer CH2M HILL Field Sample Custodian
Type of Shipment/Carrier: Overnight carrier/FedEx/Courier Service
SAMPLE RECEIPT AND ANALYSIS
Sample Receipt (Personnel/Organization): CLP and Subcontracted Laboratory Sample Custodians
Sample Custody and Storage (Personnel/Organization): CLP and Subcontracted Laboratory Sample Custodians
Sample Preparation (Personnel/Organization): CLP and Subcontracted Laboratory
Sample Determinative Analysis (Personnel/Organization): CLP and Subcontracted Laboratory
SAMPLE ARCHIVING
Field Sample Storage (No. of days from sample collection): The laboratory shall retain samples for at least 90 days after receipt.
Note that samples for frozen archiving will be retained for upto 1 year.
Sample Extract/Digestate Storage (No. of days from extraction/digestion): The laboratory shall retain sample extracts for at least 60 days after receipt.
Biological Sample Storage (No. of days from sample collection): The laboratory shall retain samples for at least 90 days after receipt.
Note that samples for frozen archiving will be retained for upto 1 year.
SAMPLE DISPOSAL
CLP and Subcontracted Laboratory
Number of Days from Analysis: The laboratory shall retain samples for at least 90 days and sample extracts for at least 60 days, after submittal, pending the need for reanalysis.
Archive samples will be retained for 1 year, held frozen.
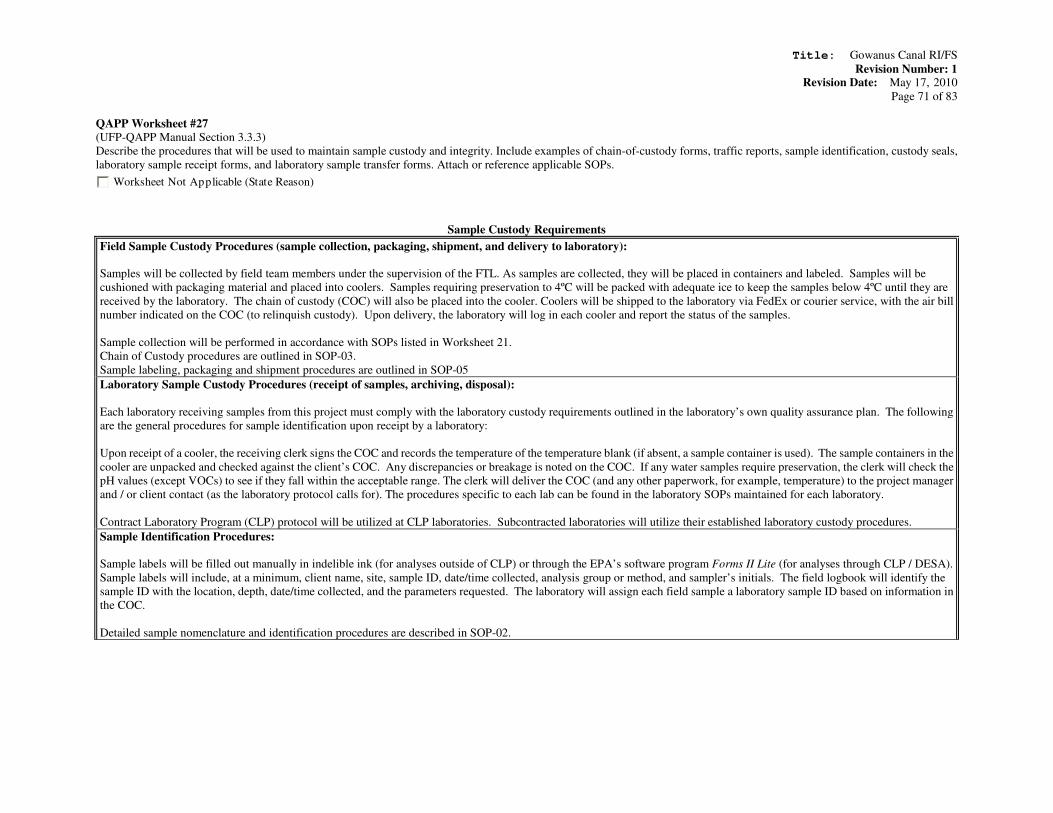
Title: Gowanus Canal RI/FS
Revision Number: 1 Revision Date: May 17, 2010
Page 71 of 83
QAPP Worksheet #27
(UFP-QAPP Manual Section 3.3.3)
Describe the procedures that will be used to maintain sample custody and integrity. Include examples of chain-of-custody forms, traffic reports, sample identification, custody seals,
laboratory sample receipt forms, and laboratory sample transfer forms. Attach or reference applicable SOPs.
Worksheet Not Applicable (State Reason)
Sample Custody Requirements
Field Sample Custody Procedures (sample collection, packaging, shipment, and delivery to laboratory):
Samples will be collected by field team members under the supervision of the FTL. As samples are collected, they will be placed in containers and labeled. Samples will be
cushioned with packaging material and placed into coolers. Samples requiring preservation to 4ºC will be packed with adequate ice to keep the samples below 4ºC until they are
received by the laboratory. The chain of custody (COC) will also be placed into the cooler. Coolers will be shipped to the laboratory via FedEx or courier service, with the air bill
number indicated on the COC (to relinquish custody). Upon delivery, the laboratory will log in each cooler and report the status of the samples.
Sample collection will be performed in accordance with SOPs listed in Worksheet 21.
Chain of Custody procedures are outlined in SOP-03.
Sample labeling, packaging and shipment procedures are outlined in SOP-05
Laboratory Sample Custody Procedures (receipt of samples, archiving, disposal):
Each laboratory receiving samples from this project must comply with the laboratory custody requirements outlined in the laboratory’s own quality assurance plan. The following
are the general procedures for sample identification upon receipt by a laboratory:
Upon receipt of a cooler, the receiving clerk signs the COC and records the temperature of the temperature blank (if absent, a sample container is used). The sample containers in the
cooler are unpacked and checked against the client’s COC. Any discrepancies or breakage is noted on the COC. If any water samples require preservation, the clerk will check the
pH values (except VOCs) to see if they fall within the acceptable range. The clerk will deliver the COC (and any other paperwork, for example, temperature) to the project manager
and / or client contact (as the laboratory protocol calls for). The procedures specific to each lab can be found in the laboratory SOPs maintained for each laboratory.
Contract Laboratory Program (CLP) protocol will be utilized at CLP laboratories. Subcontracted laboratories will utilize their established laboratory custody procedures.
Sample Identification Procedures:
Sample labels will be filled out manually in indelible ink (for analyses outside of CLP) or through the EPA’s software program Forms II Lite (for analyses through CLP / DESA).
Sample labels will include, at a minimum, client name, site, sample ID, date/time collected, analysis group or method, and sampler’s initials. The field logbook will identify the
sample ID with the location, depth, date/time collected, and the parameters requested. The laboratory will assign each field sample a laboratory sample ID based on information in
the COC.
Detailed sample nomenclature and identification procedures are described in SOP-02.
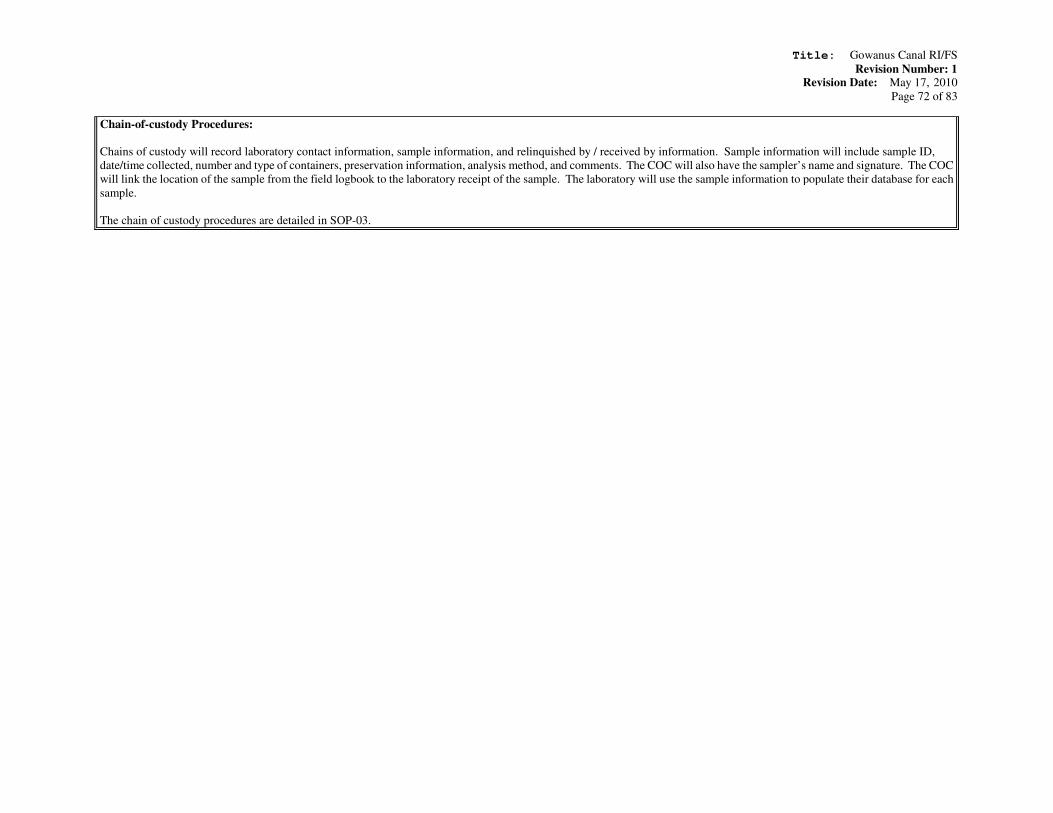
Title: Gowanus Canal RI/FS
Revision Number: 1 Revision Date: May 17, 2010
Page 72 of 83
Chain-of-custody Procedures:
Chains of custody will record laboratory contact information, sample information, and relinquished by / received by information. Sample information will include sample ID,
date/time collected, number and type of containers, preservation information, analysis method, and comments. The COC will also have the sampler’s name and signature. The COC
will link the location of the sample from the field logbook to the laboratory receipt of the sample. The laboratory will use the sample information to populate their database for each
sample.
The chain of custody procedures are detailed in SOP-03.
Title: Gowanus Canal RI/FS
Revision Number: 1 Revision Date: May 17, 2010
Page 73 of 83
QAPP Worksheet #28
(UFP-QAPP Manual Section 3.4)
Complete a separate worksheet for each sampling technique, analytical method/SOP, matrix, analytical group, and concentration level. If method/SOP QC acceptance limits exceed
the measurement performance criteria, the data obtained may be unusable for making project decisions.
Worksheet Not Applicable (State Reason)

QAPP Worksheet #28-1
(UFP-QAPP Manual Section 3.4)
QC Samples Table
Matrix2 SD, CSD, SB, GW, CSW,
SW, AQ
Analytical Group VOA
Concentration LevelLow Soil, Low Water, Trace
Water, Trace Water by SIM
Sampling SOP SOP-16, SOP-17, SOP-19,
SOP-20, SOP-24, SOP-28
Analytical Method /
SOP Reference
EPA CLP SOM01.2 / NA1
Sampler’s Name Theresa Himmer
Field Sampling
Organization
CH2M HILL
Analytical
Organization
CLP Laboratory
No. of Sample
Locations
307
QC Sample: Frequency / Number
Method / SOP QC
Acceptance Limits Corrective Action
Person(s)
Responsible for
Corrective Action
Data Quality
Indicator (DQI)
Measurement Performance
Criteria
Trip Blank One per cooler containing
VOA samples. Not needed
for SD samples.
Same as Method Blank Assess sample transport and accuracy.
Qualify as per Region II DV SOPs.
Data Validator, FTL,
Project Chemist
Contamination Same as Method Blank
Equipment Rinseate
Blank
One per day when
equipment is
decontaminated
Same as Method Blank Assess decontamination procedures.
Revisit sample collection. Qualify as per
Region II DV SOPs.
Data Validator, FTL,
Project Chemist
Contamination Same as Method Blank
Ambient Field Blank One per week of sampling Same as Method Blank Assess ambient field conditions. Qualify as
per Region II DV SOPs.
Data Validator, FTL,
Project Chemist
Contamination Same as Method Blank
Field Duplicate One per 10 normal field
samples
Should meet RPD criteria of
35% for SD, CSD, and SB
Should meet RPD criteria of
25% for GW, CSW, and SW
Evaluate results for possible source of
variability. Notify data users. Notify FTL
to evaluate sample collection procedures.
Data Validator, FTL,
Project Chemist
Precision Should meet RPD criteria of
35% for SD, CSD, and SB
Should meet RPD criteria of
25% for GW, CSW, and SW
Deuterated
Monitoring
Compounds (DMC)
All samples Must meet all DMC criteria as
specified by EPA CLP
SOM01.2
Reanalyze the associated sample. Analyst Accuracy Must meet all DMC criteria as
specified by EPA CLP
SOM01.2
Method Blank At least once during every
12 hour time period on each
GC/MS system used for
volatiles analysis.
Must meet all internal standard
and DMC criteria. All target
compounds < CRQL except
methylene chloride, acetone,
and 2-butanone which must be
< 2 times the CRQL.
Reanalyze the blank and associated
samples.
Analyst Contamination / Bias Must meet all internal standard
and DMC criteria. All target
compounds < CRQL except
methylene chloride, acetone,
and 2-butanone which must be
< 2 times the CRQL.
Instrument Blank After a sample exceeds the
calibration range or a
sample meets the maximum
contamination criteria in
Section 11.3.8 of EPA CLP
SOM01.2.
Same as Method Blank Reanalyze the sample following the
Instrument Blank if it contains detects >
CRQL.
Analyst Contamination Same as Method Blank
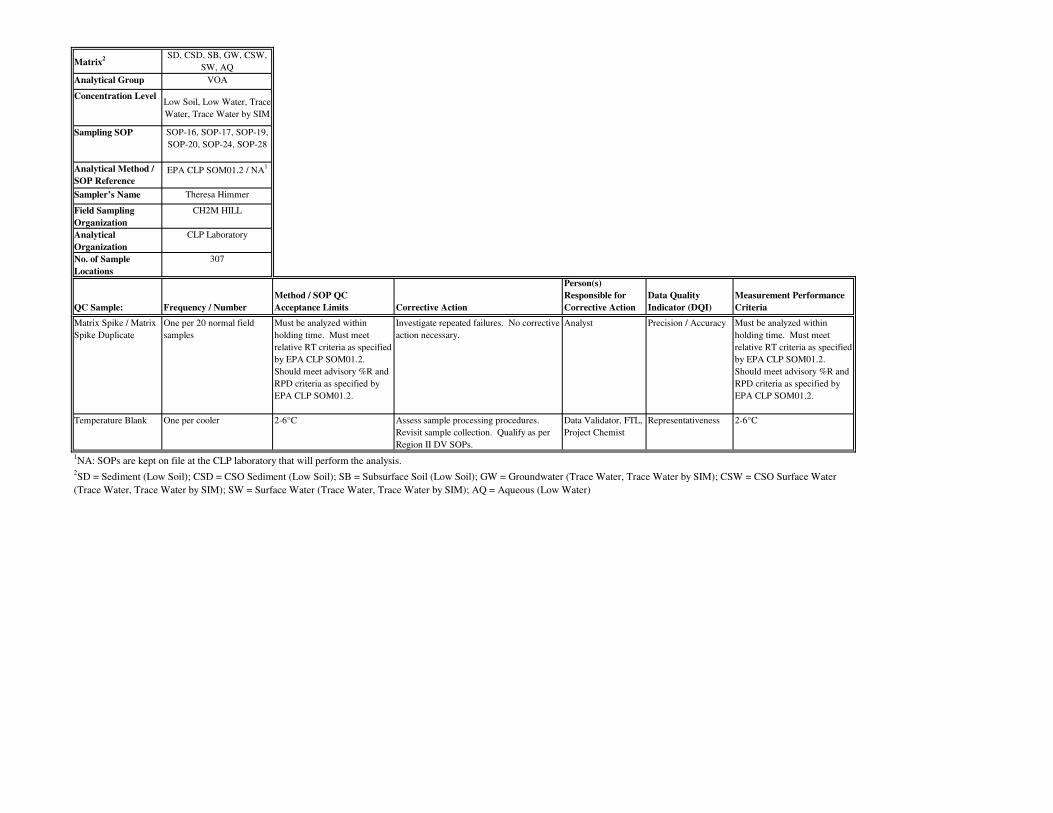
Matrix2 SD, CSD, SB, GW, CSW,
SW, AQ
Analytical Group VOA
Concentration LevelLow Soil, Low Water, Trace
Water, Trace Water by SIM
Sampling SOP SOP-16, SOP-17, SOP-19,
SOP-20, SOP-24, SOP-28
Analytical Method /
SOP Reference
EPA CLP SOM01.2 / NA1
Sampler’s Name Theresa Himmer
Field Sampling
Organization
CH2M HILL
Analytical
Organization
CLP Laboratory
No. of Sample
Locations
307
QC Sample: Frequency / Number
Method / SOP QC
Acceptance Limits Corrective Action
Person(s)
Responsible for
Corrective Action
Data Quality
Indicator (DQI)
Measurement Performance
Criteria
Matrix Spike / Matrix
Spike Duplicate
One per 20 normal field
samples
Must be analyzed within
holding time. Must meet
relative RT criteria as specified
by EPA CLP SOM01.2.
Should meet advisory %R and
RPD criteria as specified by
EPA CLP SOM01.2.
Investigate repeated failures. No corrective
action necessary.
Analyst Precision / Accuracy Must be analyzed within
holding time. Must meet
relative RT criteria as specified
by EPA CLP SOM01.2.
Should meet advisory %R and
RPD criteria as specified by
EPA CLP SOM01.2.
Temperature Blank One per cooler 2-6°C Assess sample processing procedures.
Revisit sample collection. Qualify as per
Region II DV SOPs.
Data Validator, FTL,
Project Chemist
Representativeness 2-6°C
1NA: SOPs are kept on file at the CLP laboratory that will perform the analysis.
2SD = Sediment (Low Soil); CSD = CSO Sediment (Low Soil); SB = Subsurface Soil (Low Soil); GW = Groundwater (Trace Water, Trace Water by SIM); CSW = CSO Surface Water
(Trace Water, Trace Water by SIM); SW = Surface Water (Trace Water, Trace Water by SIM); AQ = Aqueous (Low Water)
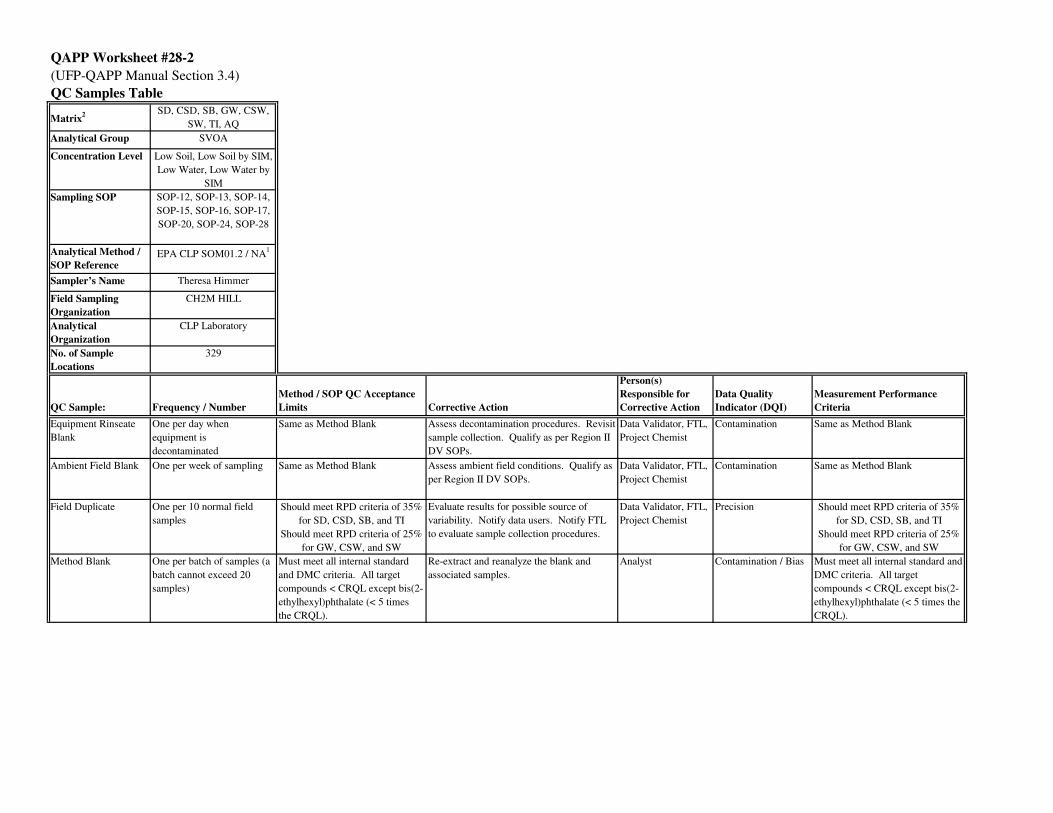
QAPP Worksheet #28-2
(UFP-QAPP Manual Section 3.4)
QC Samples Table
Matrix2 SD, CSD, SB, GW, CSW,
SW, TI, AQ
Analytical Group SVOA
Concentration Level Low Soil, Low Soil by SIM,
Low Water, Low Water by
SIM
Sampling SOP SOP-12, SOP-13, SOP-14,
SOP-15, SOP-16, SOP-17,
SOP-20, SOP-24, SOP-28
Analytical Method /
SOP ReferenceEPA CLP SOM01.2 / NA
1
Sampler’s Name Theresa Himmer
Field Sampling
Organization
CH2M HILL
Analytical
Organization
CLP Laboratory
No. of Sample
Locations
329
QC Sample: Frequency / Number
Method / SOP QC Acceptance
Limits Corrective Action
Person(s)
Responsible for
Corrective Action
Data Quality
Indicator (DQI)
Measurement Performance
Criteria
Equipment Rinseate
Blank
One per day when
equipment is
decontaminated
Same as Method Blank Assess decontamination procedures. Revisit
sample collection. Qualify as per Region II
DV SOPs.
Data Validator, FTL,
Project Chemist
Contamination Same as Method Blank
Ambient Field Blank One per week of sampling Same as Method Blank Assess ambient field conditions. Qualify as
per Region II DV SOPs.
Data Validator, FTL,
Project Chemist
Contamination Same as Method Blank
Field Duplicate One per 10 normal field
samples
Should meet RPD criteria of 35%
for SD, CSD, SB, and TI
Should meet RPD criteria of 25%
for GW, CSW, and SW
Evaluate results for possible source of
variability. Notify data users. Notify FTL
to evaluate sample collection procedures.
Data Validator, FTL,
Project Chemist
Precision Should meet RPD criteria of 35%
for SD, CSD, SB, and TI
Should meet RPD criteria of 25%
for GW, CSW, and SW
Method Blank One per batch of samples (a
batch cannot exceed 20
samples)
Must meet all internal standard
and DMC criteria. All target
compounds < CRQL except bis(2-
ethylhexyl)phthalate (< 5 times
the CRQL).
Re-extract and reanalyze the blank and
associated samples.
Analyst Contamination / Bias Must meet all internal standard and
DMC criteria. All target
compounds < CRQL except bis(2-
ethylhexyl)phthalate (< 5 times the
CRQL).
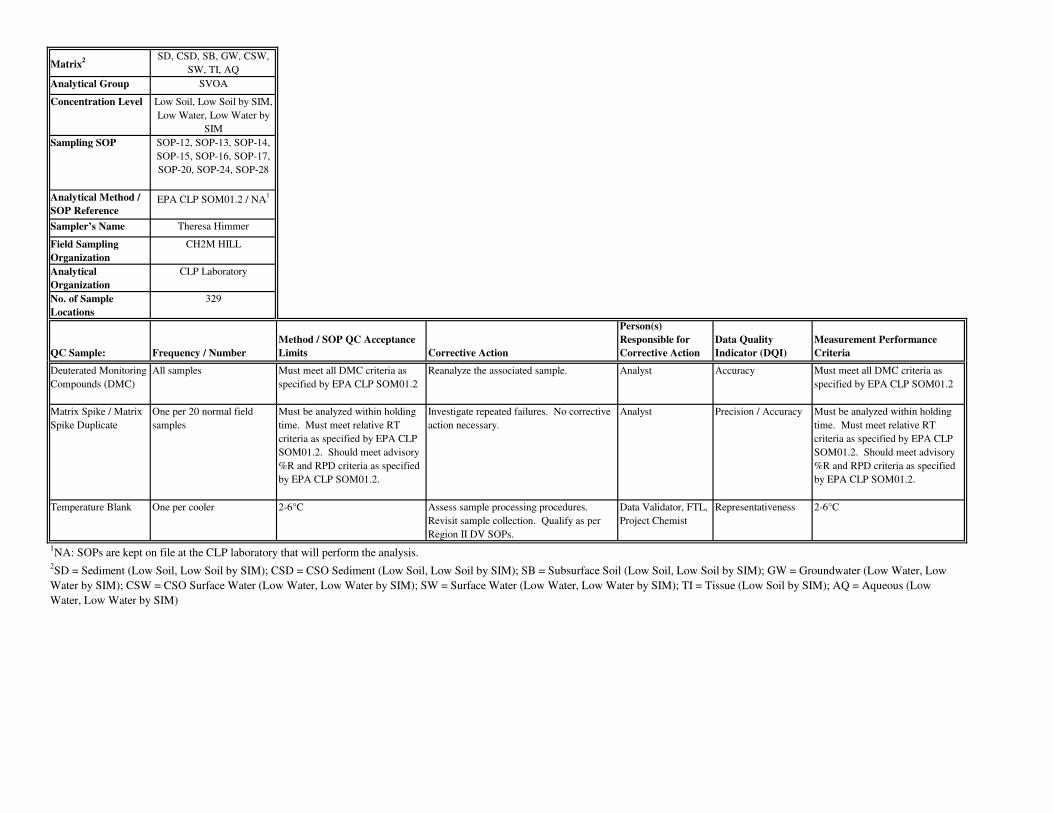
Matrix2 SD, CSD, SB, GW, CSW,
SW, TI, AQ
Analytical Group SVOA
Concentration Level Low Soil, Low Soil by SIM,
Low Water, Low Water by
SIM
Sampling SOP SOP-12, SOP-13, SOP-14,
SOP-15, SOP-16, SOP-17,
SOP-20, SOP-24, SOP-28
Analytical Method /
SOP ReferenceEPA CLP SOM01.2 / NA
1
Sampler’s Name Theresa Himmer
Field Sampling
Organization
CH2M HILL
Analytical
Organization
CLP Laboratory
No. of Sample
Locations
329
QC Sample: Frequency / Number
Method / SOP QC Acceptance
Limits Corrective Action
Person(s)
Responsible for
Corrective Action
Data Quality
Indicator (DQI)
Measurement Performance
Criteria
Deuterated Monitoring
Compounds (DMC)
All samples Must meet all DMC criteria as
specified by EPA CLP SOM01.2
Reanalyze the associated sample. Analyst Accuracy Must meet all DMC criteria as
specified by EPA CLP SOM01.2
Matrix Spike / Matrix
Spike Duplicate
One per 20 normal field
samples
Must be analyzed within holding
time. Must meet relative RT
criteria as specified by EPA CLP
SOM01.2. Should meet advisory
%R and RPD criteria as specified
by EPA CLP SOM01.2.
Investigate repeated failures. No corrective
action necessary.
Analyst Precision / Accuracy Must be analyzed within holding
time. Must meet relative RT
criteria as specified by EPA CLP
SOM01.2. Should meet advisory
%R and RPD criteria as specified
by EPA CLP SOM01.2.
Temperature Blank One per cooler 2-6°C Assess sample processing procedures.
Revisit sample collection. Qualify as per
Region II DV SOPs.
Data Validator, FTL,
Project Chemist
Representativeness 2-6°C
1NA: SOPs are kept on file at the CLP laboratory that will perform the analysis.
2SD = Sediment (Low Soil, Low Soil by SIM); CSD = CSO Sediment (Low Soil, Low Soil by SIM); SB = Subsurface Soil (Low Soil, Low Soil by SIM); GW = Groundwater (Low Water, Low
Water by SIM); CSW = CSO Surface Water (Low Water, Low Water by SIM); SW = Surface Water (Low Water, Low Water by SIM); TI = Tissue (Low Soil by SIM); AQ = Aqueous (Low
Water, Low Water by SIM)
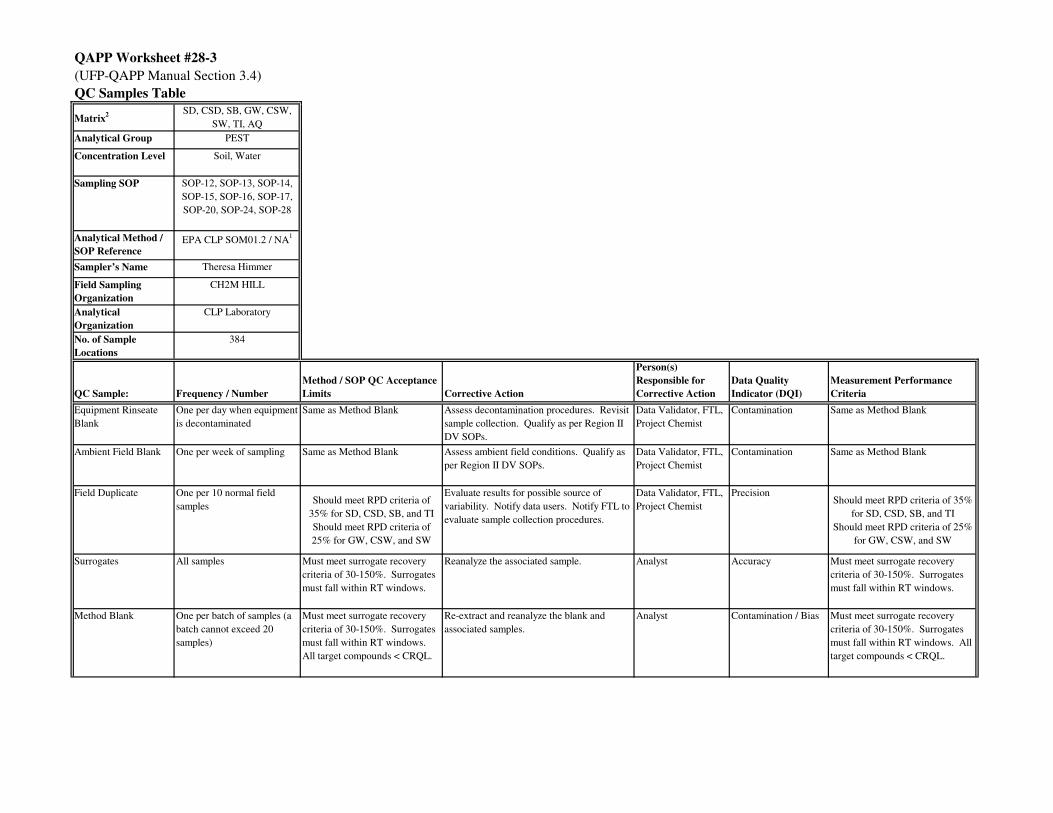
QAPP Worksheet #28-3
(UFP-QAPP Manual Section 3.4)
QC Samples Table
Matrix2 SD, CSD, SB, GW, CSW,
SW, TI, AQ
Analytical Group PEST
Concentration Level Soil, Water
Sampling SOP SOP-12, SOP-13, SOP-14,
SOP-15, SOP-16, SOP-17,
SOP-20, SOP-24, SOP-28
Analytical Method /
SOP ReferenceEPA CLP SOM01.2 / NA
1
Sampler’s Name Theresa Himmer
Field Sampling
Organization
CH2M HILL
Analytical
Organization
CLP Laboratory
No. of Sample
Locations
384
QC Sample: Frequency / Number
Method / SOP QC Acceptance
Limits Corrective Action
Person(s)
Responsible for
Corrective Action
Data Quality
Indicator (DQI)
Measurement Performance
Criteria
Equipment Rinseate
Blank
One per day when equipment
is decontaminated
Same as Method Blank Assess decontamination procedures. Revisit
sample collection. Qualify as per Region II
DV SOPs.
Data Validator, FTL,
Project Chemist
Contamination Same as Method Blank
Ambient Field Blank One per week of sampling Same as Method Blank Assess ambient field conditions. Qualify as
per Region II DV SOPs.
Data Validator, FTL,
Project Chemist
Contamination Same as Method Blank
Field Duplicate One per 10 normal field
samplesShould meet RPD criteria of
35% for SD, CSD, SB, and TI
Should meet RPD criteria of
25% for GW, CSW, and SW
Evaluate results for possible source of
variability. Notify data users. Notify FTL to
evaluate sample collection procedures.
Data Validator, FTL,
Project Chemist
PrecisionShould meet RPD criteria of 35%
for SD, CSD, SB, and TI
Should meet RPD criteria of 25%
for GW, CSW, and SW
Surrogates All samples Must meet surrogate recovery
criteria of 30-150%. Surrogates
must fall within RT windows.
Reanalyze the associated sample. Analyst Accuracy Must meet surrogate recovery
criteria of 30-150%. Surrogates
must fall within RT windows.
Method Blank One per batch of samples (a
batch cannot exceed 20
samples)
Must meet surrogate recovery
criteria of 30-150%. Surrogates
must fall within RT windows.
All target compounds < CRQL.
Re-extract and reanalyze the blank and
associated samples.
Analyst Contamination / Bias Must meet surrogate recovery
criteria of 30-150%. Surrogates
must fall within RT windows. All
target compounds < CRQL.

Matrix2 SD, CSD, SB, GW, CSW,
SW, TI, AQ
Analytical Group PEST
Concentration Level Soil, Water
Sampling SOP SOP-12, SOP-13, SOP-14,
SOP-15, SOP-16, SOP-17,
SOP-20, SOP-24, SOP-28
Analytical Method /
SOP ReferenceEPA CLP SOM01.2 / NA
1
Sampler’s Name Theresa Himmer
Field Sampling
Organization
CH2M HILL
Analytical
Organization
CLP Laboratory
No. of Sample
Locations
384
QC Sample: Frequency / Number
Method / SOP QC Acceptance
Limits Corrective Action
Person(s)
Responsible for
Corrective Action
Data Quality
Indicator (DQI)
Measurement Performance
Criteria
Instrument Blank One initiates each 12 hour
sequence.
Surrogates must fall within RT
windows. All target compounds
< CRQL.
Re-inject all samples (including QC samples)
since the last acceptable instrument blank.
Analyst Contamination Surrogates must fall within RT
windows. All target compounds <
CRQL.
Sulfur Cleanup Blank One per batch of samples (a
batch cannot exceed 20
samples) when sulfur
cleanup is performed.
Same as Method Blank Re-extract and reanalyze the blank and
associated samples (sulfur cleanup
performed).
Analyst Contamination Same as Method Blank
Laboratory Control
Sample (LCS)
One per batch of samples (a
batch cannot exceed 20
samples)
Must meet surrogate recovery
criteria of 30-150%. Surrogates
must fall within RT windows.
Must meet %R criteria as
specified by EPA CLP
SOM01.2.
Re-extract and reanalyze the associated
samples.
Analyst Accuracy Must meet surrogate recovery
criteria of 30-150%. Surrogates
must fall within RT windows.
Must meet %R criteria as
specified by EPA CLP SOM01.2.
Matrix Spike / Matrix
Spike Duplicate
One per 20 normal field
samples
must be analyzed within holding
time. surrogates must fall within
RT windows. should meet
advisory %R and RPD criteria as
specified by EPA CLP
SOM01.2.
Investigate repeated failures. No corrective
action necessary.
Analyst Precision / Accuracy must be analyzed within holding
time. surrogates must fall within
RT windows. should meet
advisory %R and RPD criteria as
specified by EPA CLP SOM01.2.
Temperature Blank One per cooler 2-6°C Assess sample processing procedures.
Revisit sample collection. Qualify as per
Region II DV SOPs.
Data Validator, FTL,
Project Chemist
Representativeness 2-6°C
1NA: SOPs are kept on file at the CLP laboratory that will perform the analysis.
2SD = Sediment (Soil); CSD = CSO Sediment (Soil); SB = Subsurface Soil (Soil); GW = Groundwater (Water); CSW = CSO Surface Water (Water); SW = Surface Water (Water); TI = Tissue
(Soil); AQ = Aqueous (Water)
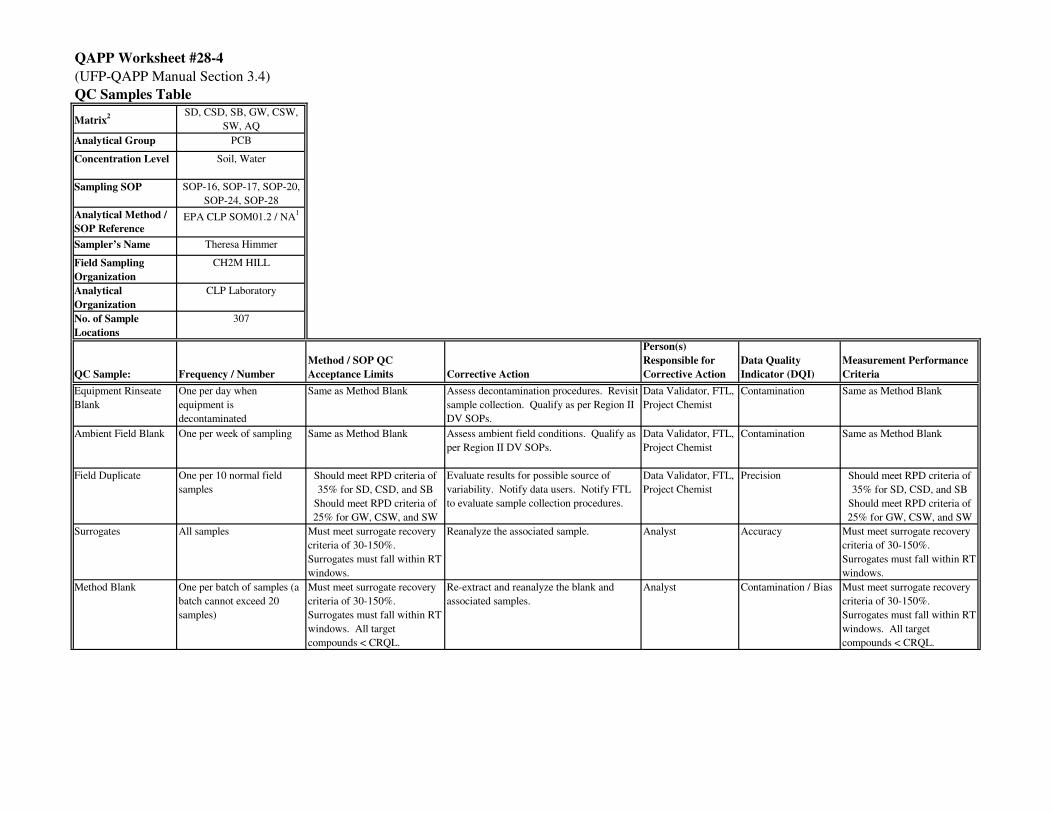
QAPP Worksheet #28-4
(UFP-QAPP Manual Section 3.4)
QC Samples Table
Matrix2 SD, CSD, SB, GW, CSW,
SW, AQ
Analytical Group PCB
Concentration Level Soil, Water
Sampling SOP SOP-16, SOP-17, SOP-20,
SOP-24, SOP-28
Analytical Method /
SOP ReferenceEPA CLP SOM01.2 / NA
1
Sampler’s Name Theresa Himmer
Field Sampling
Organization
CH2M HILL
Analytical
Organization
CLP Laboratory
No. of Sample
Locations
307
QC Sample: Frequency / Number
Method / SOP QC
Acceptance Limits Corrective Action
Person(s)
Responsible for
Corrective Action
Data Quality
Indicator (DQI)
Measurement Performance
Criteria
Equipment Rinseate
Blank
One per day when
equipment is
decontaminated
Same as Method Blank Assess decontamination procedures. Revisit
sample collection. Qualify as per Region II
DV SOPs.
Data Validator, FTL,
Project Chemist
Contamination Same as Method Blank
Ambient Field Blank One per week of sampling Same as Method Blank Assess ambient field conditions. Qualify as
per Region II DV SOPs.
Data Validator, FTL,
Project Chemist
Contamination Same as Method Blank
Field Duplicate One per 10 normal field
samples
Should meet RPD criteria of
35% for SD, CSD, and SB
Should meet RPD criteria of
25% for GW, CSW, and SW
Evaluate results for possible source of
variability. Notify data users. Notify FTL
to evaluate sample collection procedures.
Data Validator, FTL,
Project Chemist
Precision Should meet RPD criteria of
35% for SD, CSD, and SB
Should meet RPD criteria of
25% for GW, CSW, and SW
Surrogates All samples Must meet surrogate recovery
criteria of 30-150%.
Surrogates must fall within RT
windows.
Reanalyze the associated sample. Analyst Accuracy Must meet surrogate recovery
criteria of 30-150%.
Surrogates must fall within RT
windows.
Method Blank One per batch of samples (a
batch cannot exceed 20
samples)
Must meet surrogate recovery
criteria of 30-150%.
Surrogates must fall within RT
windows. All target
compounds < CRQL.
Re-extract and reanalyze the blank and
associated samples.
Analyst Contamination / Bias Must meet surrogate recovery
criteria of 30-150%.
Surrogates must fall within RT
windows. All target
compounds < CRQL.
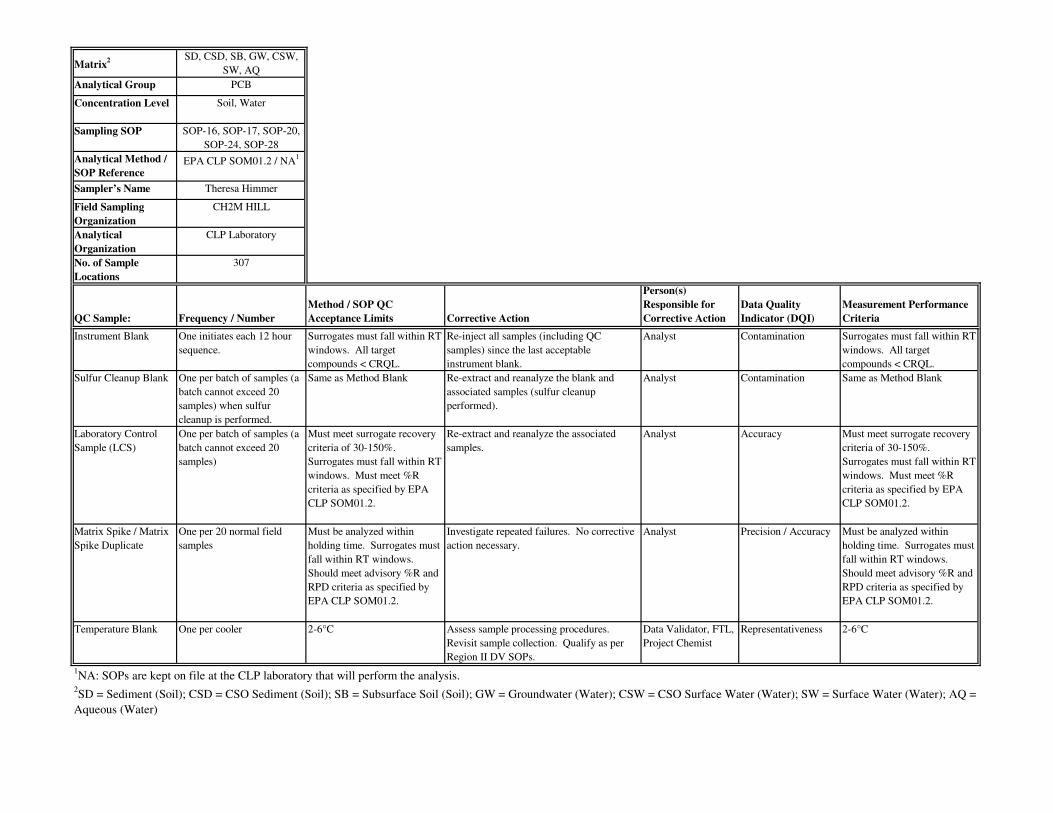
Matrix2 SD, CSD, SB, GW, CSW,
SW, AQ
Analytical Group PCB
Concentration Level Soil, Water
Sampling SOP SOP-16, SOP-17, SOP-20,
SOP-24, SOP-28
Analytical Method /
SOP ReferenceEPA CLP SOM01.2 / NA
1
Sampler’s Name Theresa Himmer
Field Sampling
Organization
CH2M HILL
Analytical
Organization
CLP Laboratory
No. of Sample
Locations
307
QC Sample: Frequency / Number
Method / SOP QC
Acceptance Limits Corrective Action
Person(s)
Responsible for
Corrective Action
Data Quality
Indicator (DQI)
Measurement Performance
Criteria
Instrument Blank One initiates each 12 hour
sequence.
Surrogates must fall within RT
windows. All target
compounds < CRQL.
Re-inject all samples (including QC
samples) since the last acceptable
instrument blank.
Analyst Contamination Surrogates must fall within RT
windows. All target
compounds < CRQL.
Sulfur Cleanup Blank One per batch of samples (a
batch cannot exceed 20
samples) when sulfur
cleanup is performed.
Same as Method Blank Re-extract and reanalyze the blank and
associated samples (sulfur cleanup
performed).
Analyst Contamination Same as Method Blank
Laboratory Control
Sample (LCS)
One per batch of samples (a
batch cannot exceed 20
samples)
Must meet surrogate recovery
criteria of 30-150%.
Surrogates must fall within RT
windows. Must meet %R
criteria as specified by EPA
CLP SOM01.2.
Re-extract and reanalyze the associated
samples.
Analyst Accuracy Must meet surrogate recovery
criteria of 30-150%.
Surrogates must fall within RT
windows. Must meet %R
criteria as specified by EPA
CLP SOM01.2.
Matrix Spike / Matrix
Spike Duplicate
One per 20 normal field
samples
Must be analyzed within
holding time. Surrogates must
fall within RT windows.
Should meet advisory %R and
RPD criteria as specified by
EPA CLP SOM01.2.
Investigate repeated failures. No corrective
action necessary.
Analyst Precision / Accuracy Must be analyzed within
holding time. Surrogates must
fall within RT windows.
Should meet advisory %R and
RPD criteria as specified by
EPA CLP SOM01.2.
Temperature Blank One per cooler 2-6°C Assess sample processing procedures.
Revisit sample collection. Qualify as per
Region II DV SOPs.
Data Validator, FTL,
Project Chemist
Representativeness 2-6°C
1NA: SOPs are kept on file at the CLP laboratory that will perform the analysis.
2SD = Sediment (Soil); CSD = CSO Sediment (Soil); SB = Subsurface Soil (Soil); GW = Groundwater (Water); CSW = CSO Surface Water (Water); SW = Surface Water (Water); AQ =
Aqueous (Water)
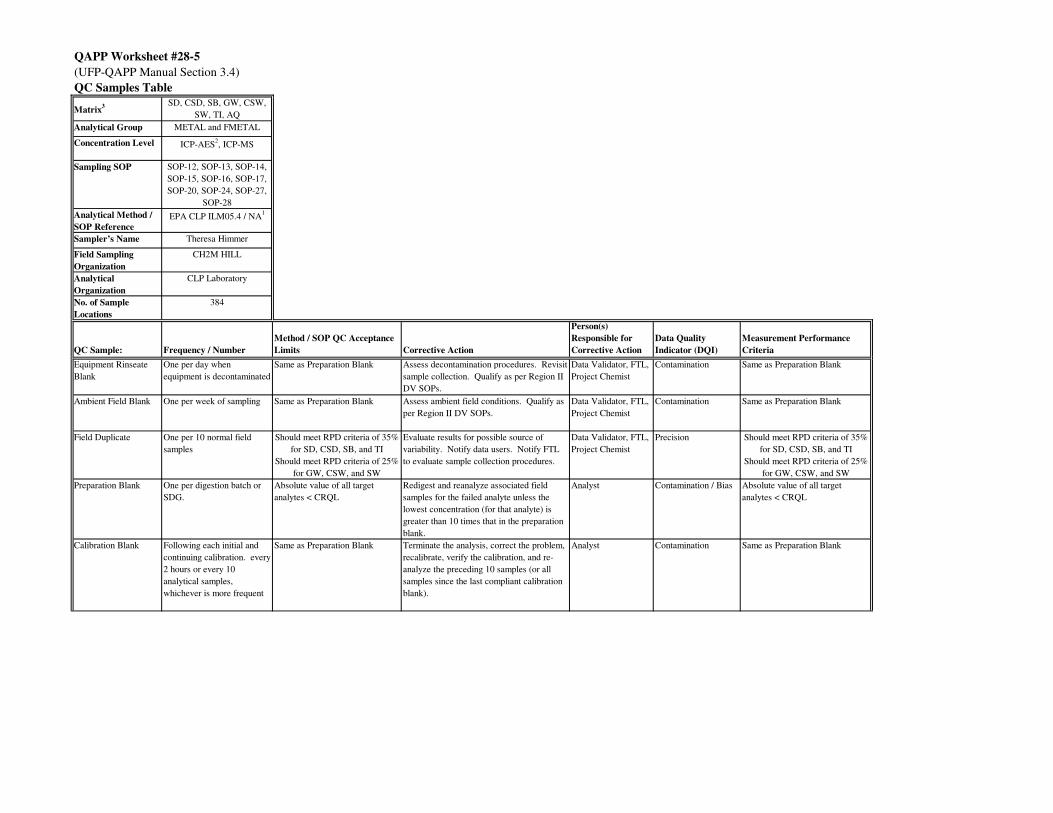
QAPP Worksheet #28-5
(UFP-QAPP Manual Section 3.4)
QC Samples Table
Matrix3 SD, CSD, SB, GW, CSW,
SW, TI, AQ
Analytical Group METAL and FMETAL
Concentration Level ICP-AES2, ICP-MS
Sampling SOP SOP-12, SOP-13, SOP-14,
SOP-15, SOP-16, SOP-17,
SOP-20, SOP-24, SOP-27,
SOP-28
Analytical Method /
SOP Reference
EPA CLP ILM05.4 / NA1
Sampler’s Name Theresa Himmer
Field Sampling
Organization
CH2M HILL
Analytical
Organization
CLP Laboratory
No. of Sample
Locations
384
QC Sample: Frequency / Number
Method / SOP QC Acceptance
Limits Corrective Action
Person(s)
Responsible for
Corrective Action
Data Quality
Indicator (DQI)
Measurement Performance
Criteria
Equipment Rinseate
Blank
One per day when
equipment is decontaminated
Same as Preparation Blank Assess decontamination procedures. Revisit
sample collection. Qualify as per Region II
DV SOPs.
Data Validator, FTL,
Project Chemist
Contamination Same as Preparation Blank
Ambient Field Blank One per week of sampling Same as Preparation Blank Assess ambient field conditions. Qualify as
per Region II DV SOPs.
Data Validator, FTL,
Project Chemist
Contamination Same as Preparation Blank
Field Duplicate One per 10 normal field
samples
Should meet RPD criteria of 35%
for SD, CSD, SB, and TI
Should meet RPD criteria of 25%
for GW, CSW, and SW
Evaluate results for possible source of
variability. Notify data users. Notify FTL
to evaluate sample collection procedures.
Data Validator, FTL,
Project Chemist
Precision Should meet RPD criteria of 35%
for SD, CSD, SB, and TI
Should meet RPD criteria of 25%
for GW, CSW, and SW
Preparation Blank One per digestion batch or
SDG.
Absolute value of all target
analytes < CRQL
Redigest and reanalyze associated field
samples for the failed analyte unless the
lowest concentration (for that analyte) is
greater than 10 times that in the preparation
blank.
Analyst Contamination / Bias Absolute value of all target
analytes < CRQL
Calibration Blank Following each initial and
continuing calibration. every
2 hours or every 10
analytical samples,
whichever is more frequent
Same as Preparation Blank Terminate the analysis, correct the problem,
recalibrate, verify the calibration, and re-
analyze the preceding 10 samples (or all
samples since the last compliant calibration
blank).
Analyst Contamination Same as Preparation Blank
Matrix3 SD, CSD, SB, GW, CSW,
SW, TI, AQ
Analytical Group METAL and FMETAL
Concentration Level ICP-AES2, ICP-MS
Sampling SOP SOP-12, SOP-13, SOP-14,
SOP-15, SOP-16, SOP-17,
SOP-20, SOP-24, SOP-27,
SOP-28
Analytical Method /
SOP Reference
EPA CLP ILM05.4 / NA1
Sampler’s Name Theresa Himmer
Field Sampling
Organization
CH2M HILL
Analytical
Organization
CLP Laboratory
No. of Sample
Locations
384
QC Sample: Frequency / Number
Method / SOP QC Acceptance
Limits Corrective Action
Person(s)
Responsible for
Corrective Action
Data Quality
Indicator (DQI)
Measurement Performance
Criteria
CRQL Check Standard
(CRI)
One per batch of samples (a
batch cannot exceed 20
samples)
Must meet 70-130%R (50-
150%R for Sb, Pb, and Tl)
criteria as specified by EPA CLP
ILM05.4
Reanalyze the CRI for the failed analytes. If
failure persists, re-calibrate and reanalyze
the CRI and associated samples.
Analyst Accuracy Must meet 70-130%R (50-150%R
for Sb, Pb, and Tl) criteria as
specified by EPA CLP ILM05.4
Interference Check
Sample (ICS) for ICP-
AES only
One per batch of samples (a
batch cannot exceed 20
samples)
Must fall within ±2 times the
CRQL of the analyte’s true value
or ± 20% of the analyte’s true
value, whichever is greater.
Terminate the analysis, correct the problem,
recalibrate, and re-analyze all samples since
the last compliant calibration blank.
Analyst Accuracy / Bias Must fall within ±2 times the
CRQL of the analyte’s true value
or ± 20% of the analyte’s true
value, whichever is greater.
Serial Dilution for ICP-
AES only
One per group of samples of
similar matrix or SDG.
%D should be < 10% of the
undiluted sample if analyte
concentration > 50 times the
MDL.
E-qualify failed analytes in associated
samples.
Analyst Precision / Accuracy %D should be < 10% of the
undiluted sample if analyte
concentration > 50 times the
MDL.
Laboratory Duplicate One per group of samples of
similar matrix or SDG.
RPD should be < 20% if analyte
concentration > 5 times the
CRQL. Results should be ± the
CRQL if if analyte concentration
< 5 times the CRQL.
*-qualify failed analytes in associated
samples.
Analyst Precisoin RPD should be < 20% if analyte
concentration > 5 times the
CRQL. Results should be ± the
CRQL if if analyte concentration
< 5 times the CRQL.
Post-Digestion Spike
(ICP-AES only)
Post-Distillation Spike
(CN only)
For analytes that fail the
matrix spike
Should meet 75-125%R as
specified by EPA CLP ILM05.4.
Qualify as per Region II DV SOPs. Analyst, DV Accuracy Should meet 75-125%R as
specified by EPA CLP ILM05.4.
Laboratory Control
Sample
One per digestion batch or
SDG.
must meet %R criteria established
by USEPA as specified in EPA
CLP ILM05.4
Terminate the analysis, correct the problem,
and redigest and reanalyze the LCS and
associated samples.
Analyst Accuracy must meet %R criteria established
by USEPA as specified in EPA
CLP ILM05.4
Matrix Spike One per 20 normal field
samples
Should meet 75-125%R as
specified by EPA CLP ILM05.4
N-qualify failed analytes in associated
samples.
Analyst Accuracy Should meet 75-125%R as
specified by EPA CLP ILM05.4
Temperature Blank One per cooler 2-6°C Assess sample processing procedures.
Revisit sample collection. Qualify as per
Region II DV SOPs.
Data Validator, FTL,
Project Chemist
Representativeness 2-6°C
1NA: SOPs are kept on file at the CLP laboratory that will perform the analysis.
2Concentration Range "ICP-AES" includes mercury by CVAA and cyanide by spectrophotometer as per EPA CLP ILM05.4 . TI samples do not require cyanide analysis.
Matrix3 SD, CSD, SB, GW, CSW,
SW, TI, AQ
Analytical Group METAL and FMETAL
Concentration Level ICP-AES2, ICP-MS
Sampling SOP SOP-12, SOP-13, SOP-14,
SOP-15, SOP-16, SOP-17,
SOP-20, SOP-24, SOP-27,
SOP-28
Analytical Method /
SOP Reference
EPA CLP ILM05.4 / NA1
Sampler’s Name Theresa Himmer
Field Sampling
Organization
CH2M HILL
Analytical
Organization
CLP Laboratory
No. of Sample
Locations
384
QC Sample: Frequency / Number
Method / SOP QC Acceptance
Limits Corrective Action
Person(s)
Responsible for
Corrective Action
Data Quality
Indicator (DQI)
Measurement Performance
Criteria
3SD = Sediment (ICP-AES); CSD = CSO Sediment (ICP-AES); SB = Subsurface Soil (ICP-AES); GW = Groundwater (ICP-AES, ICP-MS); CSW = CSO Surface Water (ICP-AES, ICP-MS);
SW = Surface Water (ICP-AES, ICP-MS); TI = Tissue (ICP-AES, ICP-MS); AQ = Aqueous (ICP-AES, ICP-MS)
QAPP Worksheet #28-6
(UFP-QAPP Manual Section 3.4)
QC Samples Table
Matrix2 SD, TI, AQ
Analytical Group PCBCONG
Concentration LevelWater, Other
Sampling SOP SOP-12, SOP-13, SOP-14,
SOP-15, SOP-17
Analytical Method /
SOP ReferenceEPA CLP CBC01.2 / NA
1
Sampler’s Name Theresa Himmer
Field Sampling
Organization
CH2M HILL
Analytical
Organization
CLP Laboratory
No. of Sample
Locations
88
QC Sample: Frequency / Number
Method / SOP QC
Acceptance Limits Corrective Action
Person(s)
Responsible for
Corrective Action
Data Quality
Indicator (DQI)
Measurement Performance
Criteria
Equipment Rinseate
Blank
One per day when
equipment is
decontaminated
Same as Method Blank Assess decontamination procedures. Revisit
sample collection. Qualify as per Region II
DV SOPs.
Data Validator, FTL,
Project Chemist
Contamination Same as Method Blank
Ambient Field Blank One per week of sampling Same as Method Blank Assess ambient field conditions. Qualify as
per Region II DV SOPs.
Data Validator, FTL,
Project Chemist
Contamination Same as Method Blank
Field Duplicate One per 10 normal field
samples Should meet RPD criteria of
35% for SD and TI
Evaluate results for possible source of
variability. Notify data users. Notify FTL
to evaluate sample collection procedures.
Data Validator, FTL,
Project Chemist
Precision
Should meet RPD criteria of
35% for SD and TI
Labeled Compounds All samplesMust meet recovery criteria as
outlined in Table 6 of Exhibit
D of EPA CLP CBC01.2 .
Re-extract and reanalyze the associated
sample.
Analyst AccuracyMust meet recovery criteria as
outlined in Table 6 of Exhibit
D of EPA CLP CBC01.2 .
Matrix2 SD, TI, AQ
Analytical Group PCBCONG
Concentration LevelWater, Other
Sampling SOP SOP-12, SOP-13, SOP-14,
SOP-15, SOP-17
Analytical Method /
SOP ReferenceEPA CLP CBC01.2 / NA
1
Sampler’s Name Theresa Himmer
Field Sampling
Organization
CH2M HILL
Analytical
Organization
CLP Laboratory
No. of Sample
Locations
88
QC Sample: Frequency / Number
Method / SOP QC
Acceptance Limits Corrective Action
Person(s)
Responsible for
Corrective Action
Data Quality
Indicator (DQI)
Measurement Performance
Criteria
Cleanup Standards All samplesMust meet recovery criteria as
outlined in Table 6 of Exhibit
D of EPA CLP CBC01.2 .
Re-extract and reanalyze the associated
sample.
Analyst AccuracyMust meet recovery criteria as
outlined in Table 6 of Exhibit
D of EPA CLP CBC01.2 .
Method Blank A method blank must be
extracted each time samples
are extracted. The number of
samples extracted with each
method blank will not
exceed 20 field samples.
The blank must meet the
sample acceptance criteria
listed in Section 11 of EPA
CLP CBC01.2 . For the 12
Toxics (listed in Exhibit C of
EPA CLP CBC01.2), the
method blank must contain less
than the Contract Required
Quantitation Limit (CRQL) of
any single toxic congener.
If contamination is the problem, then the
source of the contamination must be
investigated and appropriate corrective
measures taken and documented before
further sample analysis proceeds. Samples
associated with the contaminated blank
must be reextracted and reanalyzed.
Analyst Contamination / BiasThe blank must meet the
sample acceptance criteria
listed in Section 11 of EPA
CLP CBC01.2 . For the 12
Toxics (listed in Exhibit C of
EPA CLP CBC01.2), the
method blank must contain less
than the Contract Required
Quantitation Limit (CRQL) of
any single toxic congener.
Laboratory Control
Sample
The LCS should be extracted
each time samples are
extracted. The number of
samples extracted with each
LCS should not exceed 20
field samples.
The LCS must meet the sample
acceptance criteria listed in
Section 11 of EPA CLP
CBC01.2 . Must meet recovery
criteria as outlined in Table 6
of Exhibit D of EPA CLP
CBC01.2 .
Samples associated with a non-compliant
LCS must be re-extracted and re-analyzed.
Analyst Accuracy The LCS must meet the sample
acceptance criteria listed in
Section 11 of EPA CLP
CBC01.2 . Must meet recovery
criteria as outlined in Table 6
of Exhibit D of EPA CLP
CBC01.2 .
Temperature Blank One per cooler 2-6°C Assess sample processing procedures.
Revisit sample collection. Qualify as per
Region II DV SOPs.
Data Validator, FTL,
Project Chemist
Representativeness 2-6°C
1NA: SOPs are kept on file at the CLP laboratory that will perform the analysis.
2SD = Sediment (Other); TI = Tissue (Other); AQ = Aqueous (Water)
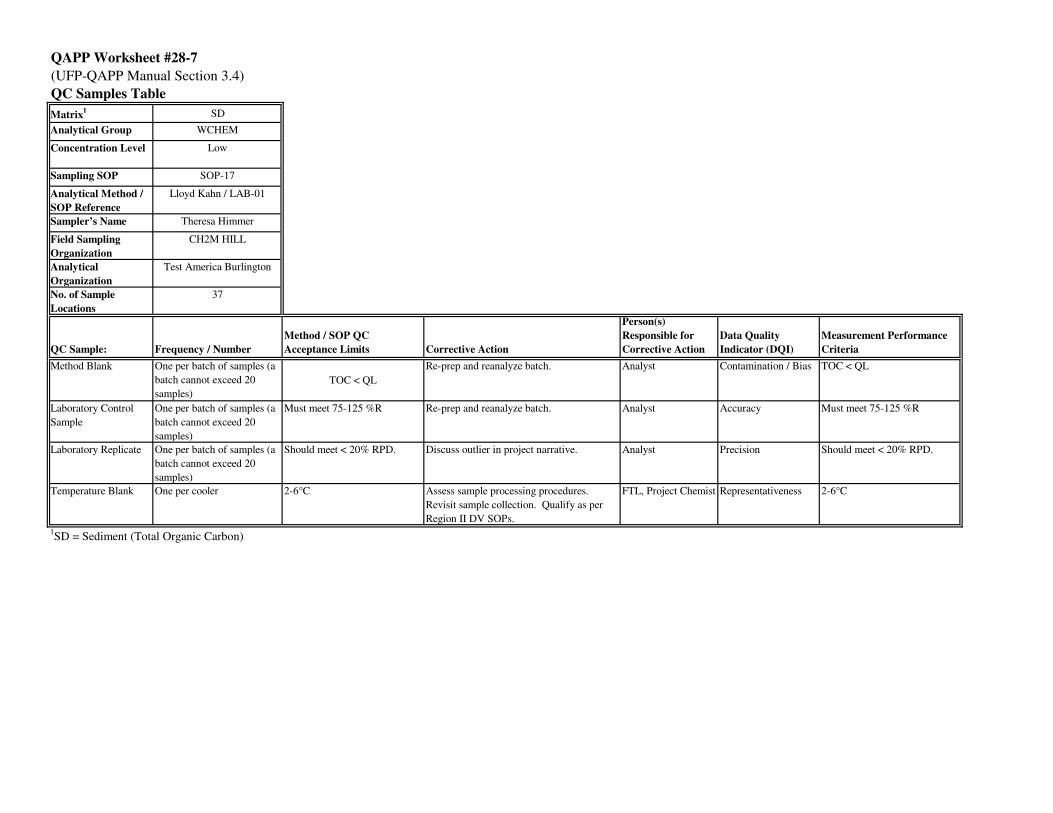
QAPP Worksheet #28-7
(UFP-QAPP Manual Section 3.4)
QC Samples Table
Matrix1 SD
Analytical Group WCHEM
Concentration Level Low
Sampling SOP SOP-17
Analytical Method /
SOP Reference
Lloyd Kahn / LAB-01
Sampler’s Name Theresa Himmer
Field Sampling
Organization
CH2M HILL
Analytical
Organization
Test America Burlington
No. of Sample
Locations
37
QC Sample: Frequency / Number
Method / SOP QC
Acceptance Limits Corrective Action
Person(s)
Responsible for
Corrective Action
Data Quality
Indicator (DQI)
Measurement Performance
Criteria
Method Blank One per batch of samples (a
batch cannot exceed 20
samples)
TOC < QL
Re-prep and reanalyze batch. Analyst Contamination / Bias TOC < QL
Laboratory Control
Sample
One per batch of samples (a
batch cannot exceed 20
samples)
Must meet 75-125 %R Re-prep and reanalyze batch. Analyst Accuracy Must meet 75-125 %R
Laboratory Replicate One per batch of samples (a
batch cannot exceed 20
samples)
Should meet < 20% RPD. Discuss outlier in project narrative. Analyst Precision Should meet < 20% RPD.
Temperature Blank One per cooler 2-6°C Assess sample processing procedures.
Revisit sample collection. Qualify as per
Region II DV SOPs.
FTL, Project Chemist Representativeness 2-6°C
1SD = Sediment (Total Organic Carbon)
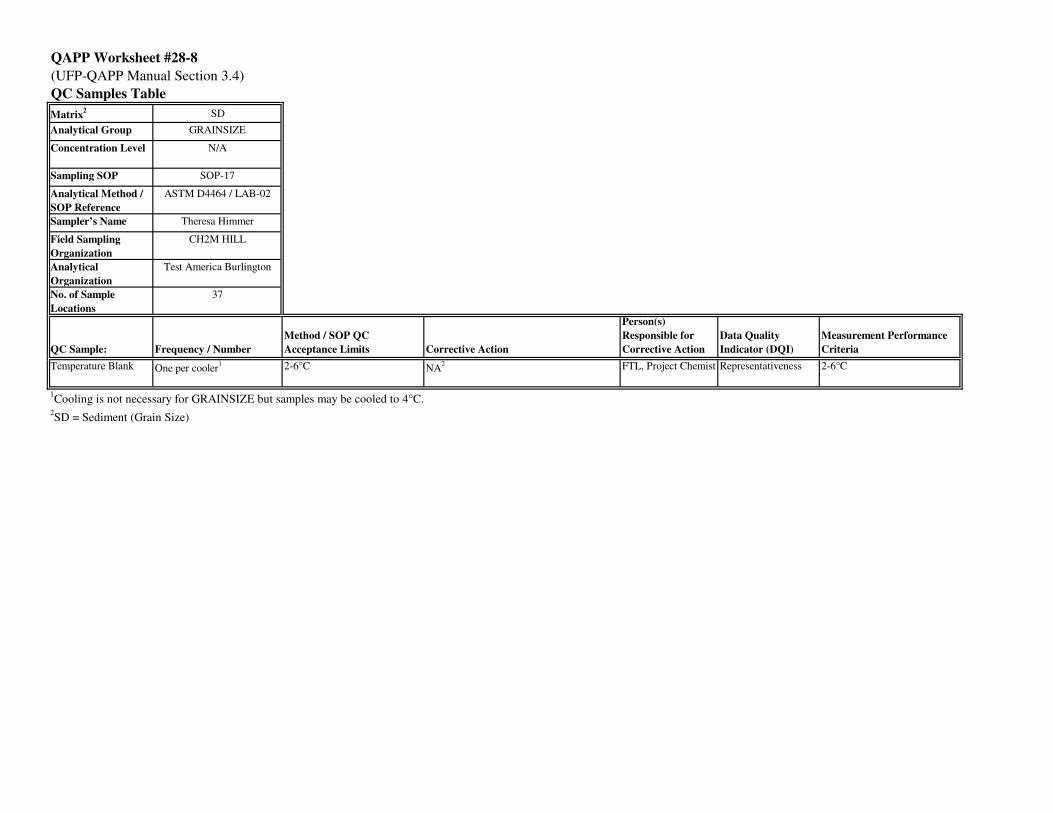
QAPP Worksheet #28-8
(UFP-QAPP Manual Section 3.4)
QC Samples Table
Matrix2 SD
Analytical Group GRAINSIZE
Concentration Level N/A
Sampling SOP SOP-17
Analytical Method /
SOP Reference
ASTM D4464 / LAB-02
Sampler’s Name Theresa Himmer
Field Sampling
Organization
CH2M HILL
Analytical
Organization
Test America Burlington
No. of Sample
Locations
37
QC Sample: Frequency / Number
Method / SOP QC
Acceptance Limits Corrective Action
Person(s)
Responsible for
Corrective Action
Data Quality
Indicator (DQI)
Measurement Performance
Criteria
Temperature Blank One per cooler1 2-6°C NA
2 FTL, Project Chemist Representativeness 2-6°C
1Cooling is not necessary for GRAINSIZE but samples may be cooled to 4°C.
2SD = Sediment (Grain Size)
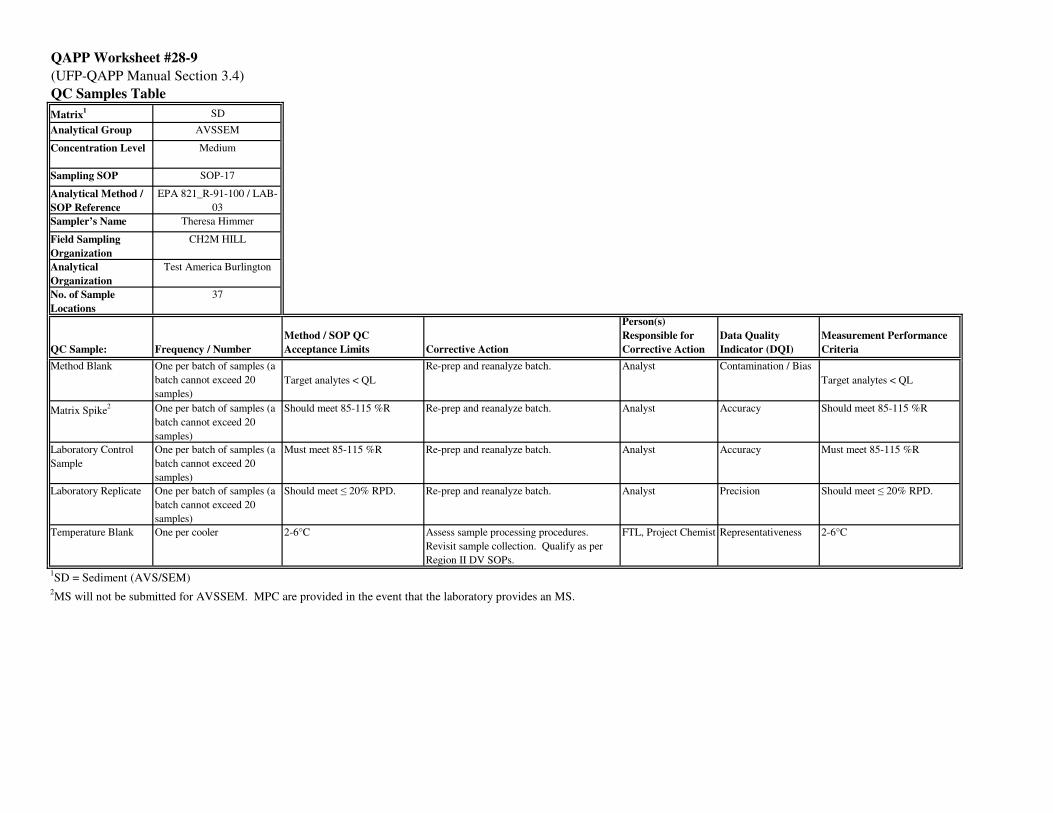
QAPP Worksheet #28-9
(UFP-QAPP Manual Section 3.4)
QC Samples Table
Matrix1 SD
Analytical Group AVSSEM
Concentration Level Medium
Sampling SOP SOP-17
Analytical Method /
SOP Reference
EPA 821_R-91-100 / LAB-
03
Sampler’s Name Theresa Himmer
Field Sampling
Organization
CH2M HILL
Analytical
Organization
Test America Burlington
No. of Sample
Locations
37
QC Sample: Frequency / Number
Method / SOP QC
Acceptance Limits Corrective Action
Person(s)
Responsible for
Corrective Action
Data Quality
Indicator (DQI)
Measurement Performance
Criteria
Method Blank One per batch of samples (a
batch cannot exceed 20
samples)
Target analytes < QL
Re-prep and reanalyze batch. Analyst Contamination / Bias
Target analytes < QL
Matrix Spike2 One per batch of samples (a
batch cannot exceed 20
samples)
Should meet 85-115 %R Re-prep and reanalyze batch. Analyst Accuracy Should meet 85-115 %R
Laboratory Control
Sample
One per batch of samples (a
batch cannot exceed 20
samples)
Must meet 85-115 %R Re-prep and reanalyze batch. Analyst Accuracy Must meet 85-115 %R
Laboratory Replicate One per batch of samples (a
batch cannot exceed 20
samples)
Should meet ≤ 20% RPD. Re-prep and reanalyze batch. Analyst Precision Should meet ≤ 20% RPD.
Temperature Blank One per cooler 2-6°C Assess sample processing procedures.
Revisit sample collection. Qualify as per
Region II DV SOPs.
FTL, Project Chemist Representativeness 2-6°C
1SD = Sediment (AVS/SEM)
2MS will not be submitted for AVSSEM. MPC are provided in the event that the laboratory provides an MS.
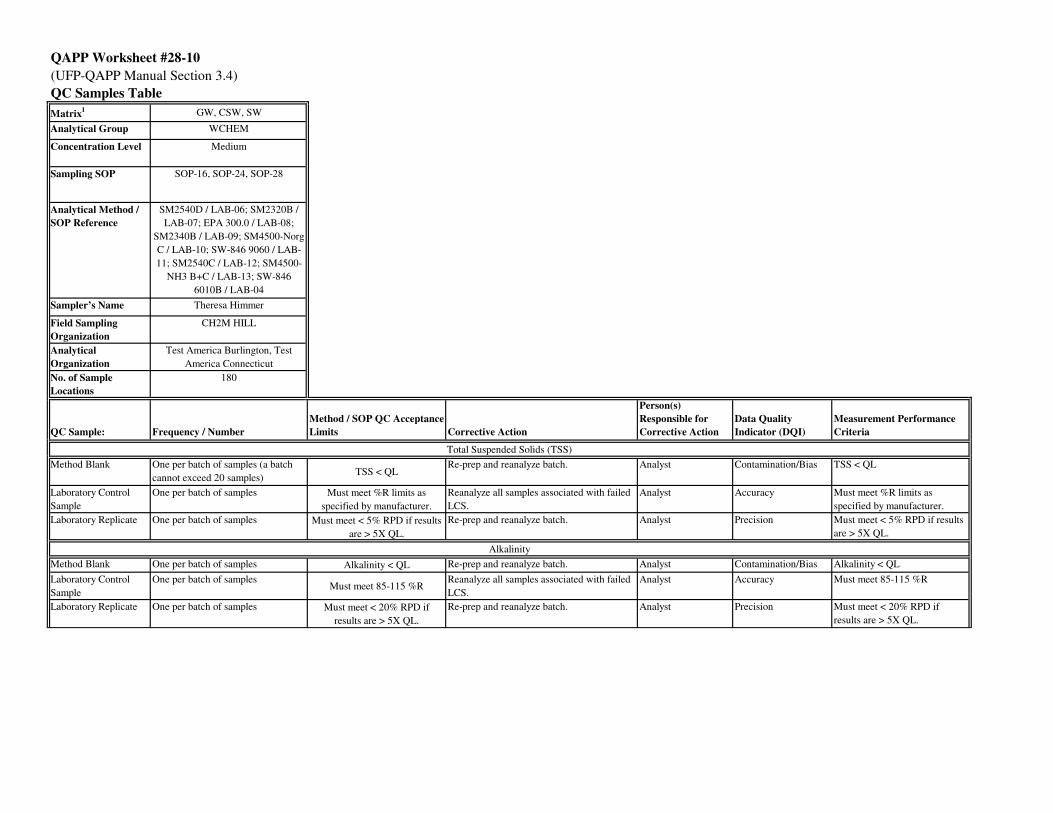
QAPP Worksheet #28-10
(UFP-QAPP Manual Section 3.4)
QC Samples Table
Matrix1 GW, CSW, SW
Analytical Group WCHEM
Concentration Level Medium
Sampling SOP SOP-16, SOP-24, SOP-28
Analytical Method /
SOP Reference
SM2540D / LAB-06; SM2320B /
LAB-07; EPA 300.0 / LAB-08;
SM2340B / LAB-09; SM4500-Norg
C / LAB-10; SW-846 9060 / LAB-
11; SM2540C / LAB-12; SM4500-
NH3 B+C / LAB-13; SW-846
6010B / LAB-04
Sampler’s Name Theresa Himmer
Field Sampling
Organization
CH2M HILL
Analytical
Organization
Test America Burlington, Test
America Connecticut
No. of Sample
Locations
180
QC Sample: Frequency / Number
Method / SOP QC Acceptance
Limits Corrective Action
Person(s)
Responsible for
Corrective Action
Data Quality
Indicator (DQI)
Measurement Performance
Criteria
Method Blank One per batch of samples (a batch
cannot exceed 20 samples)TSS < QL
Re-prep and reanalyze batch. Analyst Contamination/Bias TSS < QL
Laboratory Control
Sample
One per batch of samples Must meet %R limits as
specified by manufacturer.
Reanalyze all samples associated with failed
LCS.
Analyst Accuracy Must meet %R limits as
specified by manufacturer.
Laboratory Replicate One per batch of samples Must meet < 5% RPD if results
are > 5X QL.
Re-prep and reanalyze batch. Analyst Precision Must meet < 5% RPD if results
are > 5X QL.
Method Blank One per batch of samples Alkalinity < QL Re-prep and reanalyze batch. Analyst Contamination/Bias Alkalinity < QL
Laboratory Control
Sample
One per batch of samplesMust meet 85-115 %R
Reanalyze all samples associated with failed
LCS.
Analyst Accuracy Must meet 85-115 %R
Laboratory Replicate One per batch of samples Must meet < 20% RPD if
results are > 5X QL.
Re-prep and reanalyze batch. Analyst Precision Must meet < 20% RPD if
results are > 5X QL.
Total Suspended Solids (TSS)
Alkalinity
Matrix1 GW, CSW, SW
Analytical Group WCHEM
Concentration Level Medium
Sampling SOP SOP-16, SOP-24, SOP-28
Analytical Method /
SOP Reference
SM2540D / LAB-06; SM2320B /
LAB-07; EPA 300.0 / LAB-08;
SM2340B / LAB-09; SM4500-Norg
C / LAB-10; SW-846 9060 / LAB-
11; SM2540C / LAB-12; SM4500-
NH3 B+C / LAB-13; SW-846
6010B / LAB-04
Sampler’s Name Theresa Himmer
Field Sampling
Organization
CH2M HILL
Analytical
Organization
Test America Burlington, Test
America Connecticut
No. of Sample
Locations
180
QC Sample: Frequency / Number
Method / SOP QC Acceptance
Limits Corrective Action
Person(s)
Responsible for
Corrective Action
Data Quality
Indicator (DQI)
Measurement Performance
Criteria
Method Blank One per batch of samplesTargets < MDL. If any targets
are detected in the method
blank, any related sample
detects must be > 10X the
concentration in the blank.
Re-prep and reanalyze batch. Analyst Contamination/Bias Targets < MDL. If any targets
are detected in the method
blank, any related sample
detects must be > 10X the
concentration in the blank.
Laboratory Control
Sample
One per batch of samplesMust meet 90-110 %R
Reanalyze all samples associated with failed
LCS.
Analyst Accuracy Must meet 90-110 %R
Laboratory Replicate One per batch of samplesShould meet < 20% RPD.
Re-prep and reanalyze batch. Analyst Precision Should meet < 20% RPD.
Matrix Spike2 One per batch of samples
Should meet 90-110% RNarrate. Discuss corrective action with
client.
Analyst Accuracy Should meet 90-110% R
Various One per batch of samplesAll analytical QC requirements
must be met for SW-846 6010B
as per LAB-04.
Various Analyst Various All analytical QC requirements
must be met for SW-846 6010B
as per LAB-04.
Method Blank One per batch of samples TKN < QL Re-prep and reanalyze batch. Analyst Contamination/Bias TKN < QL
Laboratory Control
Sample
One per batch of samplesMust meet 85-115 %R
Reanalyze all samples associated with failed
LCS.
Analyst Accuracy Must meet 85-115 %R
Laboratory Replicate One per batch of samplesShould meet < 20% RPD.
Re-prep and reanalyze batch. Analyst Precision Should meet < 20% RPD.
Ions by EPA 300.0
Hardness by Calculation
Total Kjeldahl Nitrogen (TKN)

Matrix1 GW, CSW, SW
Analytical Group WCHEM
Concentration Level Medium
Sampling SOP SOP-16, SOP-24, SOP-28
Analytical Method /
SOP Reference
SM2540D / LAB-06; SM2320B /
LAB-07; EPA 300.0 / LAB-08;
SM2340B / LAB-09; SM4500-Norg
C / LAB-10; SW-846 9060 / LAB-
11; SM2540C / LAB-12; SM4500-
NH3 B+C / LAB-13; SW-846
6010B / LAB-04
Sampler’s Name Theresa Himmer
Field Sampling
Organization
CH2M HILL
Analytical
Organization
Test America Burlington, Test
America Connecticut
No. of Sample
Locations
180
QC Sample: Frequency / Number
Method / SOP QC Acceptance
Limits Corrective Action
Person(s)
Responsible for
Corrective Action
Data Quality
Indicator (DQI)
Measurement Performance
Criteria
Matrix Spike and
Matrix Spike
Duplicate2
One per batch of samplesShould meet 80-120%R and <
20% RPD
Narrate. Discuss corrective action with
client.
Analyst Precision/Accuracy Should meet 80-120%R and <
20% RPD
Method Blank One per batch of samples TOC or DOC < QL Re-prep and reanalyze batch. Analyst Contamination/Bias TOC or DOC < QL
Laboratory Control
Sample
One per batch of samplesMust meet 85-115 %R
Reanalyze all samples associated with failed
LCS.
Analyst Accuracy Must meet 85-115 %R
Laboratory Replicate One per batch of samplesShould meet < 20% RPD.
Re-prep and reanalyze batch. Analyst Precision Should meet < 20% RPD.
Matrix Spike2 One per batch of samples
Should meet 85-115%RNarrate. Discuss corrective action with
client.
Analyst Accuracy Should meet 85-115%R
Total Organic Carbon (TOC) or Dissolved Organic Carbon (DOC)

Matrix1 GW, CSW, SW
Analytical Group WCHEM
Concentration Level Medium
Sampling SOP SOP-16, SOP-24, SOP-28
Analytical Method /
SOP Reference
SM2540D / LAB-06; SM2320B /
LAB-07; EPA 300.0 / LAB-08;
SM2340B / LAB-09; SM4500-Norg
C / LAB-10; SW-846 9060 / LAB-
11; SM2540C / LAB-12; SM4500-
NH3 B+C / LAB-13; SW-846
6010B / LAB-04
Sampler’s Name Theresa Himmer
Field Sampling
Organization
CH2M HILL
Analytical
Organization
Test America Burlington, Test
America Connecticut
No. of Sample
Locations
180
QC Sample: Frequency / Number
Method / SOP QC Acceptance
Limits Corrective Action
Person(s)
Responsible for
Corrective Action
Data Quality
Indicator (DQI)
Measurement Performance
Criteria
Method Blank One per batch of samples TDS < QL Re-prep and reanalyze batch. Analyst Contamination/Bias TDS < QL
Laboratory Control
Sample
One per batch of samples Must meet %R limits as
specified by manufacturer.
Reanalyze all samples associated with failed
LCS.
Analyst Accuracy Must meet %R limits as
specified by manufacturer.
Laboratory Replicate One per batch of samples Must meet < 5% RPD if results
are > 5X QL.
Re-prep and reanalyze batch. Analyst Precision Must meet < 5% RPD if results
are > 5X QL.
Method Blank One per batch of samples Ammonia < QL Re-prep and reanalyze batch. Analyst Contamination/Bias Ammonia < QL
Laboratory Control
Sample
One per batch of samplesMust meet 85-115 %R
Reanalyze all samples associated with failed
LCS.
Analyst Accuracy Must meet 85-115 %R
Laboratory Replicate One per batch of samplesShould meet < 20% RPD.
Re-prep and reanalyze batch. Analyst Precision Should meet < 20% RPD.
Matrix Spike and
Matrix Spike
Duplicate2
One per batch of samplesShould meet 85-115%R and <
20% RPD
Narrate. Discuss corrective action with
client.
Analyst Precision/Accuracy Should meet 85-115%R and <
20% RPD
Method Blank One per batch of samples Silicon < QL Re-prep and reanalyze batch. Analyst Contamination/Bias Silicon < QL
Serial Dilution One per batch of samples 5X dilution within ±10% of
sample result
Re-prep and reanalyze batch. Analyst Precision/Accuracy 5X dilution within ±10% of
sample result
Laboratory Replicate One per batch of samplesRPD should be < 20%
Re-prep and reanalyze batch. Analyst Precision RPD should be < 20%
Matrix Spike and
Matrix Spike
Duplicate2
One per batch of samplesShould meet 80-120%R and <
20% RPD
Re-prep and reanalyze batch. Analyst Precision/Accuracy Should meet 80-120%R and <
20% RPD
Laboratory Control
Sample
One per batch of samplesMust meet 80-120%R
Reanalyze all samples associated with failed
LCS.
Analyst Accuracy Must meet 80-120%R
Total Dissolved Solids (TDS)
Ammonia
Silica by SW-846 6010B

Matrix1 GW, CSW, SW
Analytical Group WCHEM
Concentration Level Medium
Sampling SOP SOP-16, SOP-24, SOP-28
Analytical Method /
SOP Reference
SM2540D / LAB-06; SM2320B /
LAB-07; EPA 300.0 / LAB-08;
SM2340B / LAB-09; SM4500-Norg
C / LAB-10; SW-846 9060 / LAB-
11; SM2540C / LAB-12; SM4500-
NH3 B+C / LAB-13; SW-846
6010B / LAB-04
Sampler’s Name Theresa Himmer
Field Sampling
Organization
CH2M HILL
Analytical
Organization
Test America Burlington, Test
America Connecticut
No. of Sample
Locations
180
QC Sample: Frequency / Number
Method / SOP QC Acceptance
Limits Corrective Action
Person(s)
Responsible for
Corrective Action
Data Quality
Indicator (DQI)
Measurement Performance
Criteria
Temperature Blank One per cooler 2-6°C Assess sample processing procedures.
Revisit sample collection. Qualify as per
Region II DV SOPs.
FTL, Project Chemist Representativeness 2-6°C
2MS and/or MS/MSD will not be submitted for WCHEM. MPC are provided in the event that the laboratory provides an MS and/or MS/MSD.
All methods listed above
1GW = Groundwater (TSS, Alkalinity, Cl, NO3, SO4, PO4, Hardness, TKN, TOC, DOC, TDS, Ammonia, Silica); CSW = CSO Surface Water (TSS); SW = Surface Water (TSS)
QAPP Worksheet #28-11
(UFP-QAPP Manual Section 3.4)
QC Samples Table
Matrix1 TI
Analytical Group WCHEM
Concentration Level Low
Sampling SOP SOP-12, SOP-13, SOP-14,
SOP-15
Analytical Method /
SOP Reference
BR-EX-016 / LAB-14
Sampler’s Name Theresa Himmer
Field Sampling
Organization
CH2M HILL
Analytical
Organization
Test America Burlington
No. of Sample
Locations
77
QC Sample: Frequency / Number
Method / SOP QC
Acceptance Limits Corrective Action
Person(s)
Responsible for
Corrective Action
Data Quality
Indicator (DQI)
Measurement Performance
Criteria
Method Blank One per batch of samples (a
batch cannot exceed 20
samples)
% Lipids <0.1% in Method
blank
Re-prep and reanalyze batch. Analyst Contamination / Bias% Lipids <0.1% in Method
blank
Laboratory Replicate One per batch of samples (a
batch cannot exceed 20
samples)
Should meet < 25% RPD.
Discuss outlier in project narrative. Analyst Precision
Should meet < 25% RPD.
Temperature Blank One per cooler 2-6°C Assess sample processing procedures.
Revisit sample collection. Qualify as per
Region II DV SOPs.
FTL, Project Chemist Representativeness 2-6°C
4TI = Tissue (% Lipids)
QAPP Worksheet #28-12
(UFP-QAPP Manual Section 3.4)
QC Samples Table
Matrix1 AR
Analytical Group VOA
Concentration Level Medium, Low-Level
Sampling SOP SOP-11a
Analytical Method /
SOP Reference
TO-15 / LAB-15; TO-15 /
LAB-16
Sampler’s Name Theresa Himmer
Field Sampling
Organization
CH2M HILL
Analytical
Organization
Test America Burlington
No. of Sample
Locations
46
QC Sample: Frequency / Number
Method / SOP QC
Acceptance Limits Corrective Action
Person(s)
Responsible for
Corrective Action
Data Quality
Indicator (DQI)
Measurement Performance
Criteria
Ambient Field Blank One per eventSame as Method Blank
Assess ambient field conditions. Qualify as
per Region II DV SOPs.
Analyst ContaminationSame as Method Blank
Field Duplicate One per event
Should meet RPD criteria of
35% for AR
Evaluate results for possible source of
variability. Notify data users. Notify FTL
to evaluate sample collection procedures.
Analyst Precision
Should meet RPD criteria of
35% for AR
Method Blank One per batch of samples (a
batch cannot exceed 20
samples)
No target analytes detected >
QL
Re-prep and reanalyze batch. Analyst Contamination/BiasNo target analytes detected >
QL
Laboratory Replicate One per batch of samples≤25%RPD
Re-prep and reanalyze batch. Analyst Precision≤25%RPD
Laboratory Control
Sample (LCS)
One per batch of samples70-130%R
Re-prep and reanalyze batch. Analyst Accuracy70-130%R
Laboratory Control
Sample Duplicate
(LCSD)
One per batch of samples
70-130%R and ≤25%RPD
Re-prep and reanalyze batch. Analyst Precision/Accuracy
70-130%R and ≤25%RPD
Medium-Level
Matrix1 AR
Analytical Group VOA
Concentration Level Medium, Low-Level
Sampling SOP SOP-11a
Analytical Method /
SOP Reference
TO-15 / LAB-15; TO-15 /
LAB-16
Sampler’s Name Theresa Himmer
Field Sampling
Organization
CH2M HILL
Analytical
Organization
Test America Burlington
No. of Sample
Locations
46
QC Sample: Frequency / Number
Method / SOP QC
Acceptance Limits Corrective Action
Person(s)
Responsible for
Corrective Action
Data Quality
Indicator (DQI)
Measurement Performance
Criteria
Ambient Field Blank One per eventSame as Method Blank
Assess ambient field conditions. Qualify as
per Region II DV SOPs.
Analyst ContaminationSame as Method Blank
Field Duplicate One per event Should meet RPD criteria of
35% for AR
Evaluate results for possible source of
variability. Notify data users. Notify FTL
to evaluate sample collection procedures.
Analyst Precision Should meet RPD criteria of
35% for AR
Method Blank One per batch of samples No target analytes detected >
QL
Re-prep and reanalyze batch. Analyst Contamination/Bias No target analytes detected >
QL
Laboratory Replicate One per batch of samples ≤25%RPD Re-prep and reanalyze batch. Analyst Precision ≤25%RPD
Laboratory Control
Sample (LCS)
One per batch of samples 70-130%R Re-prep and reanalyze batch. Analyst Accuracy 70-130%R
Temperature Blank One per cooler 2-6°C Assess sample processing procedures.
Revisit sample collection. Qualify as per
Region II DV SOPs.
FTL, Project Chemist Representativeness 2-6°C
1AR = Air (TO-15 VOA (medium and Low-Level))
Low-Level
Medium-Level and Low-Level
QAPP Worksheet #28-13
(UFP-QAPP Manual Section 3.4)
QC Samples Table
Matrix1 AR
Analytical Group SVOA
Concentration Level SIM
Sampling SOP SOP-11b
Analytical Method /
SOP Reference
TO-13A_SIM / LAB-17,
LAB-18
Sampler’s Name Theresa Himmer
Field Sampling
Organization
CH2M HILL
Analytical
Organization
Test America West
Sacramento
No. of Sample
Locations
46
QC Sample: Frequency / Number
Method / SOP QC
Acceptance Limits Corrective Action
Person(s)
Responsible for
Corrective Action
Data Quality
Indicator (DQI)
Measurement Performance
Criteria
Ambient Field Blank One per eventSame as Method Blank
Assess ambient field conditions. Qualify as
per Region II DV SOPs.
AnalystContamination Same as Method Blank
Field Duplicate One per event
Should meet RPD criteria of
35% for AR
Evaluate results for possible source of
variability. Notify data users. Notify FTL
to evaluate sample collection procedures.
Analyst
PrecisionShould meet RPD criteria of
35% for AR
Deuterated Monitoring
Compounds (DMC)
All samples25-150%R (refer to Worksheet
12-13)
Reanalyze associated sample Analyst
Accuracy25-150%R (refer to Worksheet
12-13)
Method Blank One per batch of samples (a
batch cannot exceed 20
samples)
All target compounds < QL
except naphthalene (common
laboratory contaminant for air
matrices)
Re-prep and reanalyze batch. Analyst
Contamination/Bias
All target compounds < QL
except naphthalene (common
laboratory contaminant for air
matrices)
Laboratory Control
Sample (LCS)
One per batch of samplesSame as LCSD except %RPD
control limits do not apply.
Re-prep and reanalyze batch. Analyst
PrecisionSame as LCSD except %RPD
control limits do not apply.
Laboratory Control
Sample Duplicate
(LCSD)
One per batch of samplesRefer to Worksheet 12-13 for
compound-specific accuracy
and precision limits.
Re-prep and reanalyze batch. Analyst
Precision/Accuracy
Refer to Worksheet 12-13 for
compound-specific accuracy
and precision limits.
Temperature Blank One per cooler 2-6°C Assess sample processing procedures.
Revisit sample collection. Qualify as per
Region II DV SOPs.
FTL, Project Chemist Representativeness 2-6°C
1AR = Air (SIM PAHs)

QAPP Worksheet #28-14
(UFP-QAPP Manual Section 3.4)
QC Samples Table
Matrix1 AR
Analytical Group PCB
Concentration Level SIM
Sampling SOP SOP-11c
Analytical Method /
SOP Reference
TO-4A_SIM / LAB-19,
LAB-20
Sampler’s Name Theresa Himmer
Field Sampling
Organization
CH2M HILL
Analytical
Organization
Test America West
Sacramento
No. of Sample
Locations
2
QC Sample: Frequency / Number Method / SOP QC Acceptance Limits Corrective Action
Person(s)
Responsible for
Corrective Action
Data Quality
Indicator (DQI)
Measurement Performance
Criteria
Ambient Field Blank One per eventSame as Method Blank
Assess ambient field conditions. Qualify as
per Region II DV SOPs.
AnalystContamination Same as Method Blank
Field Duplicate One per event
Should meet RPD criteria of 35% for
AR
Evaluate results for possible source of
variability. Notify data users. Notify FTL
to evaluate sample collection procedures.
Analyst
PrecisionShould meet RPD criteria of 35% for
AR
Surrogates All samples Decachlorobiphenyl: 60-120%R
Tetrachloro-m-xylene: 60-120%R
Reanalyze associated sample. AnalystAccuracy
Decachlorobiphenyl: 60-120%R
Tetrachloro-m-xylene: 60-120%R
Method Blank One per batch of samples (a
batch cannot exceed 20
samples)
No target compounds > QL or greater
than 10% that in an associated sample.
Method blank contamination is
acceptable if there are no related
sample detects.
Re-prep and reanalyze batch. Analyst
Contamination/Bias
No target compounds > QL or greater
than 10% that in an associated
sample. Method blank contamination
is acceptable if there are no related
sample detects.
Laboratory Control
Sample (LCS)
One per batch of samples Aroclor-1016: 65-125%R
Aroclor-1260: 65-125%R
Re-prep and reanalyze batch. AnalystAccuracy
Aroclor-1016: 65-125%R
Aroclor-1260: 65-125%R
Laboratory Control
Sample Duplicate
(LCSD)
One per batch of samples
Same as LCS and within 30% RPD
Re-prep and reanalyze batch. Analyst
Precision/Accuracy Same as LCS and within 30% RPD
Temperature Blank One per cooler 2-6°C Assess sample processing procedures.
Revisit sample collection. Qualify as per
Region II DV SOPs.
FTL, Project
Chemist
Representativeness 2-6°C
1AR = Air (PCBs via SIM method)
QAPP Worksheet #28-15
(UFP-QAPP Manual Section 3.4)
QC Samples Table
Matrix1 SD, AQ, SB
Analytical Group REACT
Concentration Level Medium
Sampling SOP SOP-10
Analytical Method /
SOP Reference
SW-846 7.3.3.2, SW-846
7.3.4.1 / LAB-21
SW-846 7.3.4.1 / LAB-04,
LAB-05
Sampler’s Name Theresa Himmer
Field Sampling
Organization
CH2M HILL
Analytical
Organization
Test America Connecticut
No. of Sample
Locations
15
QC Sample: Frequency / Number
Method / SOP QC
Acceptance Limits Corrective Action
Person(s)
Responsible for
Corrective Action
Data Quality
Indicator (DQI)
Measurement Performance
Criteria
Method Blank One per batch of samples (a
batch cannot exceed 20
samples)
Analytes < QL
Reanalyze the blank and associated samples. Analyst Contamination / Bias Analytes < QL
Laboratory Control
Sample
One per batch of samples (a
batch cannot exceed 20
samples)
Must meet 50-150 %R for
Reactive Cyanide and Reactive
Sulfide
Reanalyze the LCS and associated samples. Analyst Accuracy Must meet 50-150 %R for
Reactive Cyanide and Reactive
Sulfide
Laboratory Replicate One per batch of samples (a
batch cannot exceed 20
samples)
Should meet < 20% RPD. Reanalyze associated samples Analyst Precision Should meet < 20% RPD.
Temperature Blank One per cooler 2-6°C Assess sample processing procedures. FTL, Project Chemist Representativeness 2-6°C
1SD = Sediment (React CN and S); SB = Subsurface Soil (React CN and S); AQ = Aqueous (React CN and S)
QAPP Worksheet #28-16
(UFP-QAPP Manual Section 3.4)
QC Samples Table
Matrix1 SD, AQ, SB
Analytical Group CORR
Concentration Level Medium
Sampling SOP SOP-10
Analytical Method /
SOP Reference
SW-846 9045 / LAB-22
Sampler’s Name Theresa Himmer
Field Sampling
Organization
CH2M HILL
Analytical
Organization
Test America Connecticut
No. of Sample
Locations
15
QC Sample: Frequency / Number
Method / SOP QC
Acceptance Limits Corrective Action
Person(s)
Responsible for
Corrective Action
Data Quality
Indicator (DQI)
Measurement Performance
Criteria
pH 7.0 Buffer One per batch of samples (a
batch cannot exceed 20
samples)
±0.05 pH Reanalyze associated samples Analyst Accuracy ±0.05 pH
LCS: pH 6.0 Buffer One per batch of samples (a
batch cannot exceed 20
samples)
±10% Reanalyze associated samples Analyst Accuracy ±10%
Laboratory Replicate One per batch of samples (a
batch cannot exceed 20
samples)
Should meet < 20% RPD. Reanalyze associated samples Analyst Precision Should meet < 20% RPD.
Temperature Blank One per cooler 2-6°C Assess sample processing procedures. FTL, Project Chemist Representativeness 2-6°C
1SD = Sediment (Corrosivity (pH)); SB = Subsurface Soil (Corrosivity (pH)); AQ = Aqueous (Corrosivity (pH))
QAPP Worksheet #28-17
(UFP-QAPP Manual Section 3.4)
QC Samples Table
Matrix1 SD, AQ, SB
Analytical Group IGN
Concentration Level Medium
Sampling SOP SOP-10
Analytical Method /
SOP Reference
Pensky Martens / LAB-23,
LAB-24
Sampler’s Name Theresa Himmer
Field Sampling
Organization
CH2M HILL
Analytical
Organization
Test America Connecticut
No. of Sample
Locations
15
QC Sample: Frequency / Number
Method / SOP QC
Acceptance Limits Corrective Action
Person(s)
Responsible for
Corrective Action
Data Quality
Indicator (DQI)
Measurement Performance
Criteria
Method Blank One per batch of samples (a
batch cannot exceed 20
samples)
> 200°F Reanalyze associated samples Analyst Contamination / Bias > 200°F
Laboratory Replicate One per batch of samples (a
batch cannot exceed 20
samples)
RPD ≤ 20% Reanalyze associated samples Analyst Precision RPD ≤ 20%
Laboratory Control
Sample (p-Xylene)
One per batch of samples (a
batch cannot exceed 20
samples)
81 + 5°F Reanalyze associated samples Analyst Accuracy 81 + 5°F
Temperature Blank One per cooler 2-6°C Assess sample processing procedures. FTL, Project Chemist Representativeness 2-6°C
1SD = Sediment (Ignitability); SB = Subsurface Soil (Ignitability); AQ = Aqueous (Ignitability)
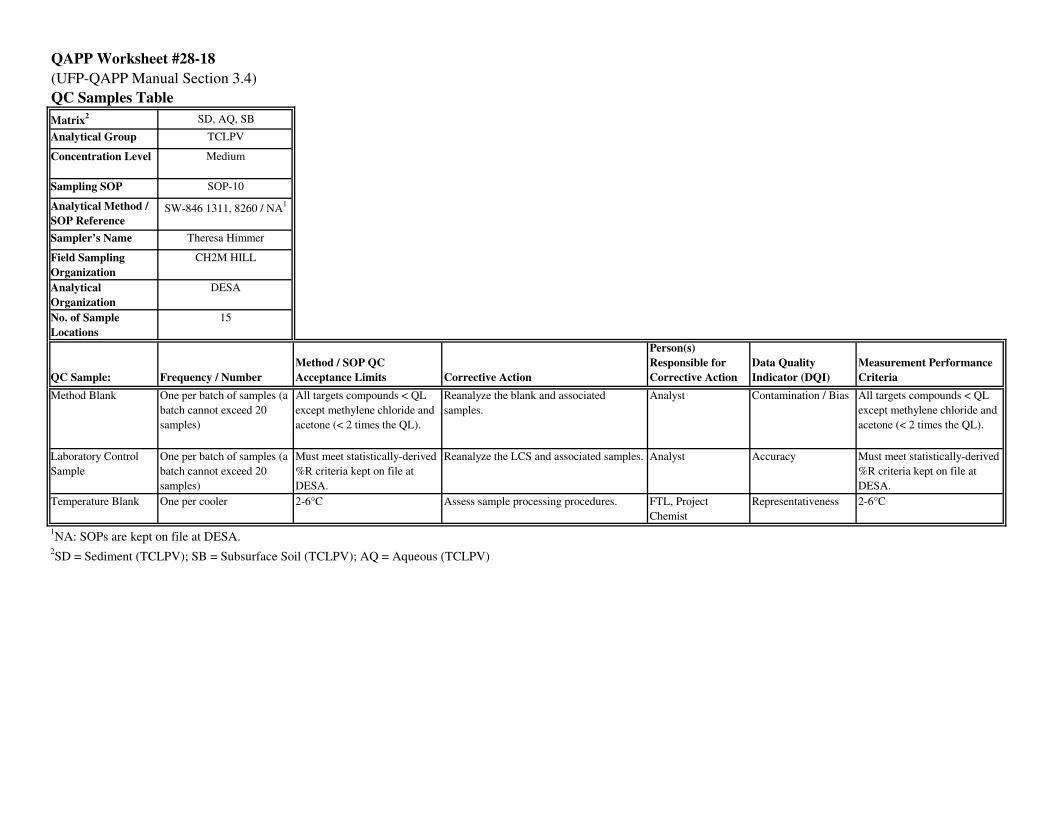
QAPP Worksheet #28-18
(UFP-QAPP Manual Section 3.4)
QC Samples Table
Matrix2 SD, AQ, SB
Analytical Group TCLPV
Concentration Level Medium
Sampling SOP SOP-10
Analytical Method /
SOP ReferenceSW-846 1311, 8260 / NA
1
Sampler’s Name Theresa Himmer
Field Sampling
Organization
CH2M HILL
Analytical
Organization
DESA
No. of Sample
Locations
15
QC Sample: Frequency / Number
Method / SOP QC
Acceptance Limits Corrective Action
Person(s)
Responsible for
Corrective Action
Data Quality
Indicator (DQI)
Measurement Performance
Criteria
Method Blank One per batch of samples (a
batch cannot exceed 20
samples)
All targets compounds < QL
except methylene chloride and
acetone (< 2 times the QL).
Reanalyze the blank and associated
samples.
Analyst Contamination / Bias All targets compounds < QL
except methylene chloride and
acetone (< 2 times the QL).
Laboratory Control
Sample
One per batch of samples (a
batch cannot exceed 20
samples)
Must meet statistically-derived
%R criteria kept on file at
DESA.
Reanalyze the LCS and associated samples. Analyst Accuracy Must meet statistically-derived
%R criteria kept on file at
DESA.
Temperature Blank One per cooler 2-6°C Assess sample processing procedures. FTL, Project
Chemist
Representativeness 2-6°C
1NA: SOPs are kept on file at DESA.
2SD = Sediment (TCLPV); SB = Subsurface Soil (TCLPV); AQ = Aqueous (TCLPV)

QAPP Worksheet #28-19
(UFP-QAPP Manual Section 3.4)
QC Samples Table
Matrix2 SD, AQ, SB
Analytical Group TCLPS
Concentration Level Medium
Sampling SOP SOP-10
Analytical Method /
SOP ReferenceSW-846 1311, 8270 / NA
1
Sampler’s Name Theresa Himmer
Field Sampling
Organization
CH2M HILL
Analytical
Organization
DESA
No. of Sample
Locations
15
QC Sample: Frequency / Number
Method / SOP QC
Acceptance Limits Corrective Action
Person(s)
Responsible for
Corrective Action
Data Quality
Indicator (DQI)
Measurement Performance
Criteria
Method Blank One per batch of samples (a
batch cannot exceed 20
samples)
All targets compounds < 1/2
QL
Re-extract and reanalyze the blank and
associated samples.
Analyst Contamination / Bias All targets compounds < 1/2
QL
Laboratory Control
Sample
One per batch of samples (a
batch cannot exceed 20
samples)
Must meet statistically-derived
%R criteria kept on file at
DESA.
Reanalyze the LCS and associated samples. Analyst Accuracy Must meet statistically-derived
%R criteria kept on file at
DESA.
Temperature Blank One per cooler 2-6°C Assess sample processing procedures. FTL, Project
Chemist
Representativeness 2-6°C
1NA: SOPs are kept on file at DESA.
2SD = Sediment (TCLPS); SB = Subsurface Soil (TCLPS); AQ = Aqueous (TCLPS)
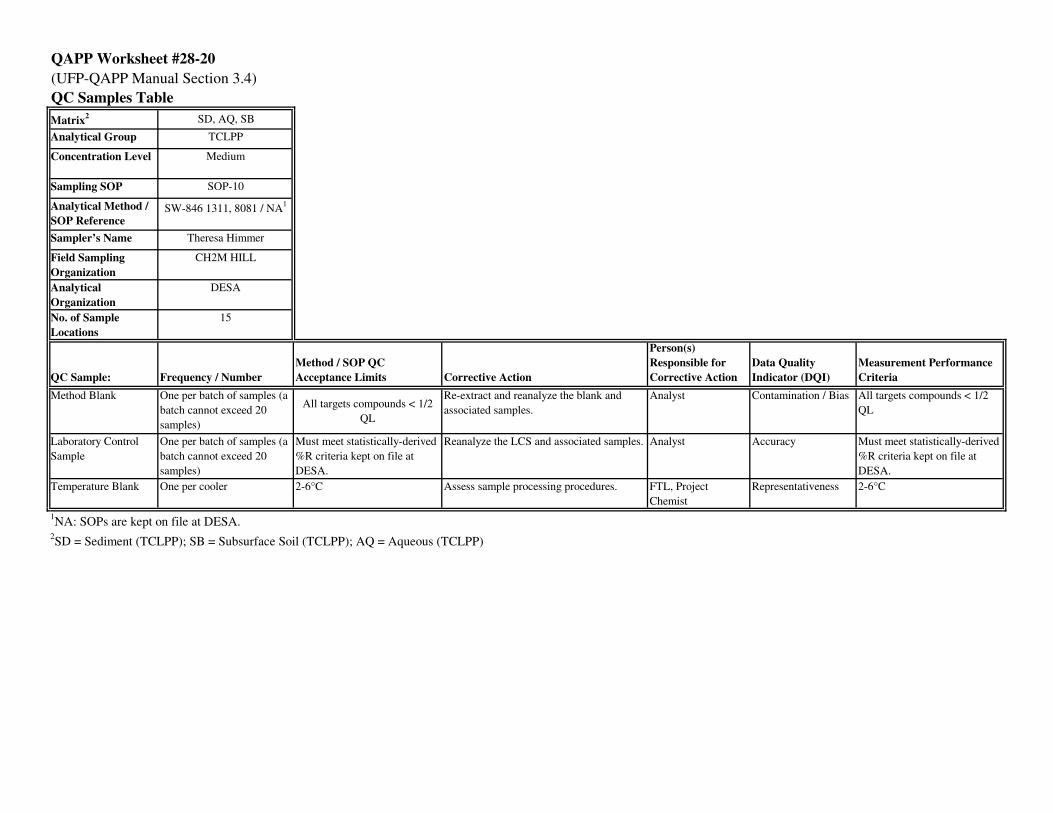
QAPP Worksheet #28-20
(UFP-QAPP Manual Section 3.4)
QC Samples Table
Matrix2 SD, AQ, SB
Analytical Group TCLPP
Concentration Level Medium
Sampling SOP SOP-10
Analytical Method /
SOP ReferenceSW-846 1311, 8081 / NA
1
Sampler’s Name Theresa Himmer
Field Sampling
Organization
CH2M HILL
Analytical
Organization
DESA
No. of Sample
Locations
15
QC Sample: Frequency / Number
Method / SOP QC
Acceptance Limits Corrective Action
Person(s)
Responsible for
Corrective Action
Data Quality
Indicator (DQI)
Measurement Performance
Criteria
Method Blank One per batch of samples (a
batch cannot exceed 20
samples)
All targets compounds < 1/2
QL
Re-extract and reanalyze the blank and
associated samples.
Analyst Contamination / Bias All targets compounds < 1/2
QL
Laboratory Control
Sample
One per batch of samples (a
batch cannot exceed 20
samples)
Must meet statistically-derived
%R criteria kept on file at
DESA.
Reanalyze the LCS and associated samples. Analyst Accuracy Must meet statistically-derived
%R criteria kept on file at
DESA.
Temperature Blank One per cooler 2-6°C Assess sample processing procedures. FTL, Project
Chemist
Representativeness 2-6°C
1NA: SOPs are kept on file at DESA.
2SD = Sediment (TCLPP); SB = Subsurface Soil (TCLPP); AQ = Aqueous (TCLPP)
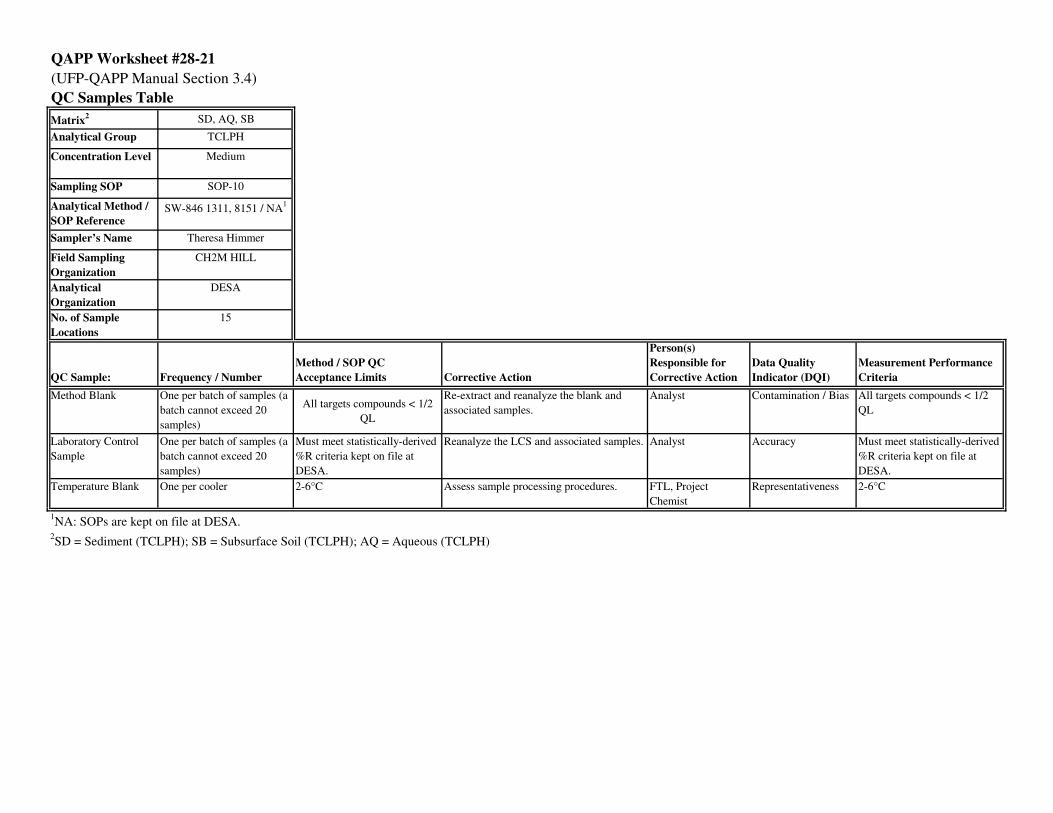
QAPP Worksheet #28-21
(UFP-QAPP Manual Section 3.4)
QC Samples Table
Matrix2 SD, AQ, SB
Analytical Group TCLPH
Concentration Level Medium
Sampling SOP SOP-10
Analytical Method /
SOP ReferenceSW-846 1311, 8151 / NA
1
Sampler’s Name Theresa Himmer
Field Sampling
Organization
CH2M HILL
Analytical
Organization
DESA
No. of Sample
Locations
15
QC Sample: Frequency / Number
Method / SOP QC
Acceptance Limits Corrective Action
Person(s)
Responsible for
Corrective Action
Data Quality
Indicator (DQI)
Measurement Performance
Criteria
Method Blank One per batch of samples (a
batch cannot exceed 20
samples)
All targets compounds < 1/2
QL
Re-extract and reanalyze the blank and
associated samples.
Analyst Contamination / Bias All targets compounds < 1/2
QL
Laboratory Control
Sample
One per batch of samples (a
batch cannot exceed 20
samples)
Must meet statistically-derived
%R criteria kept on file at
DESA.
Reanalyze the LCS and associated samples. Analyst Accuracy Must meet statistically-derived
%R criteria kept on file at
DESA.
Temperature Blank One per cooler 2-6°C Assess sample processing procedures. FTL, Project
Chemist
Representativeness 2-6°C
1NA: SOPs are kept on file at DESA.
2SD = Sediment (TCLPH); SB = Subsurface Soil (TCLPH); AQ = Aqueous (TCLPH)
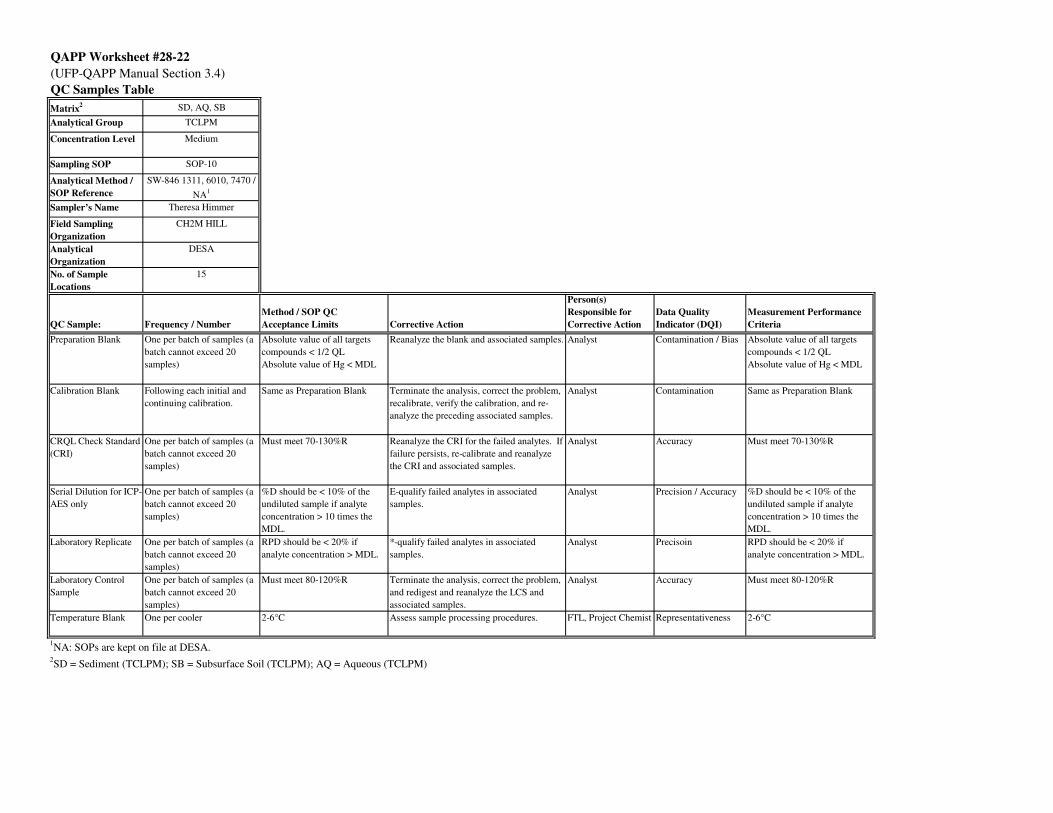
QAPP Worksheet #28-22
(UFP-QAPP Manual Section 3.4)
QC Samples Table
Matrix2 SD, AQ, SB
Analytical Group TCLPM
Concentration Level Medium
Sampling SOP SOP-10
Analytical Method /
SOP Reference
SW-846 1311, 6010, 7470 /
NA1
Sampler’s Name Theresa Himmer
Field Sampling
Organization
CH2M HILL
Analytical
Organization
DESA
No. of Sample
Locations
15
QC Sample: Frequency / Number
Method / SOP QC
Acceptance Limits Corrective Action
Person(s)
Responsible for
Corrective Action
Data Quality
Indicator (DQI)
Measurement Performance
Criteria
Preparation Blank One per batch of samples (a
batch cannot exceed 20
samples)
Absolute value of all targets
compounds < 1/2 QL
Absolute value of Hg < MDL
Reanalyze the blank and associated samples. Analyst Contamination / Bias Absolute value of all targets
compounds < 1/2 QL
Absolute value of Hg < MDL
Calibration Blank Following each initial and
continuing calibration.
Same as Preparation Blank Terminate the analysis, correct the problem,
recalibrate, verify the calibration, and re-
analyze the preceding associated samples.
Analyst Contamination Same as Preparation Blank
CRQL Check Standard
(CRI)
One per batch of samples (a
batch cannot exceed 20
samples)
Must meet 70-130%R Reanalyze the CRI for the failed analytes. If
failure persists, re-calibrate and reanalyze
the CRI and associated samples.
Analyst Accuracy Must meet 70-130%R
Serial Dilution for ICP-
AES only
One per batch of samples (a
batch cannot exceed 20
samples)
%D should be < 10% of the
undiluted sample if analyte
concentration > 10 times the
MDL.
E-qualify failed analytes in associated
samples.
Analyst Precision / Accuracy %D should be < 10% of the
undiluted sample if analyte
concentration > 10 times the
MDL.
Laboratory Replicate One per batch of samples (a
batch cannot exceed 20
samples)
RPD should be < 20% if
analyte concentration > MDL.
*-qualify failed analytes in associated
samples.
Analyst Precisoin RPD should be < 20% if
analyte concentration > MDL.
Laboratory Control
Sample
One per batch of samples (a
batch cannot exceed 20
samples)
Must meet 80-120%R Terminate the analysis, correct the problem,
and redigest and reanalyze the LCS and
associated samples.
Analyst Accuracy Must meet 80-120%R
Temperature Blank One per cooler 2-6°C Assess sample processing procedures. FTL, Project Chemist Representativeness 2-6°C
1NA: SOPs are kept on file at DESA.
2SD = Sediment (TCLPM); SB = Subsurface Soil (TCLPM); AQ = Aqueous (TCLPM)
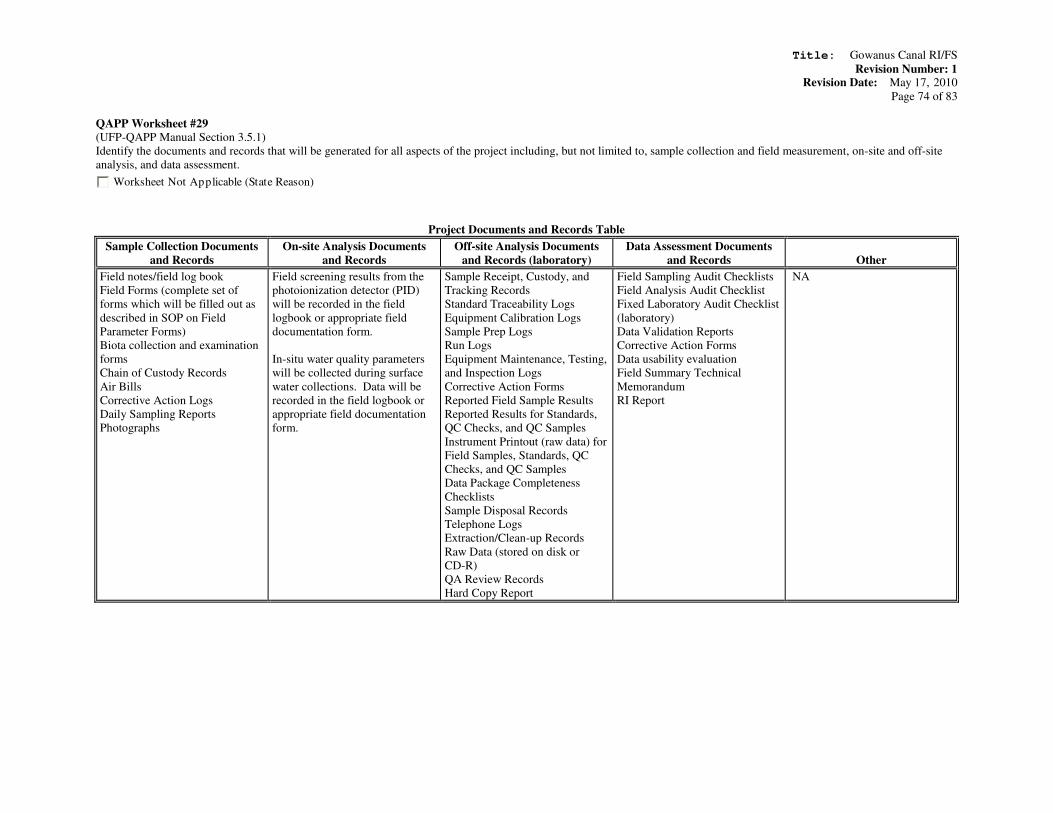
Title: Gowanus Canal RI/FS
Revision Number: 1 Revision Date: May 17, 2010
Page 74 of 83
QAPP Worksheet #29
(UFP-QAPP Manual Section 3.5.1)
Identify the documents and records that will be generated for all aspects of the project including, but not limited to, sample collection and field measurement, on-site and off-site
analysis, and data assessment.
Worksheet Not Applicable (State Reason)
Project Documents and Records Table
Sample Collection Documents
and Records
On-site Analysis Documents
and Records
Off-site Analysis Documents
and Records (laboratory)
Data Assessment Documents
and Records Other
Field notes/field log book
Field Forms (complete set of
forms which will be filled out as
described in SOP on Field
Parameter Forms)
Biota collection and examination
forms
Chain of Custody Records
Air Bills
Corrective Action Logs
Daily Sampling Reports
Photographs
Field screening results from the
photoionization detector (PID)
will be recorded in the field
logbook or appropriate field
documentation form.
In-situ water quality parameters
will be collected during surface
water collections. Data will be
recorded in the field logbook or
appropriate field documentation
form.
Sample Receipt, Custody, and
Tracking Records
Standard Traceability Logs
Equipment Calibration Logs
Sample Prep Logs
Run Logs
Equipment Maintenance, Testing,
and Inspection Logs
Corrective Action Forms
Reported Field Sample Results
Reported Results for Standards,
QC Checks, and QC Samples
Instrument Printout (raw data) for
Field Samples, Standards, QC
Checks, and QC Samples
Data Package Completeness
Checklists
Sample Disposal Records
Telephone Logs
Extraction/Clean-up Records
Raw Data (stored on disk or
CD-R)
QA Review Records
Hard Copy Report
Field Sampling Audit Checklists
Field Analysis Audit Checklist
Fixed Laboratory Audit Checklist
(laboratory)
Data Validation Reports
Corrective Action Forms
Data usability evaluation
Field Summary Technical
Memorandum
RI Report
NA
Title: Gowanus Canal RI/FS
Revision Number: 1 Revision Date: May 17, 2010
Page 75 of 83
QAPP Worksheet #30
(UFP-QAPP Manual Section 3.5.2.3)
Complete this worksheet for each matrix, analytical group, and concentration level. Identify all laboratories or organizations that will provide analytical services for the project,
including on-site screening, on-site definitive, and off-site laboratory analytical work. If applicable, identify the subcontractor laboratories and backup laboratory or organization that
will be used if the primary laboratory or organizations cannot be used.
Worksheet Not Applicable (State Reason)
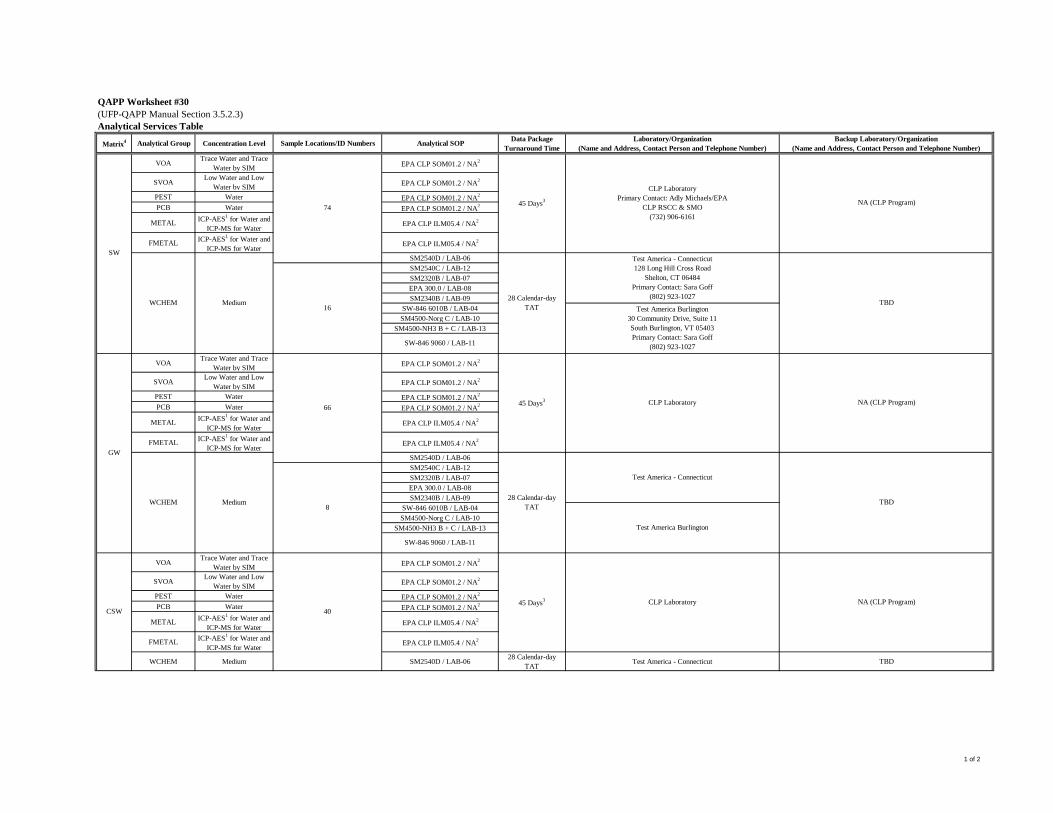
QAPP Worksheet #30
(UFP-QAPP Manual Section 3.5.2.3)
Analytical Services Table
Matrix4 Analytical Group Concentration Level Sample Locations/ID Numbers Analytical SOP
Data Package
Turnaround Time
Laboratory/Organization
(Name and Address, Contact Person and Telephone Number)
Backup Laboratory/Organization
(Name and Address, Contact Person and Telephone Number)
VOATrace Water and Trace
Water by SIMEPA CLP SOM01.2 / NA
2
SVOALow Water and Low
Water by SIMEPA CLP SOM01.2 / NA
2
PEST Water EPA CLP SOM01.2 / NA2
PCB Water EPA CLP SOM01.2 / NA2
METALICP-AES
1 for Water and
ICP-MS for WaterEPA CLP ILM05.4 / NA
2
FMETALICP-AES
1 for Water and
ICP-MS for WaterEPA CLP ILM05.4 / NA
2
SM2540D / LAB-06
SM2540C / LAB-12
SM2320B / LAB-07
EPA 300.0 / LAB-08
SM2340B / LAB-09
SW-846 6010B / LAB-04
SM4500-Norg C / LAB-10
SM4500-NH3 B + C / LAB-13
VOATrace Water and Trace
Water by SIMEPA CLP SOM01.2 / NA
2
SVOALow Water and Low
Water by SIMEPA CLP SOM01.2 / NA
2
PEST Water EPA CLP SOM01.2 / NA2
PCB Water EPA CLP SOM01.2 / NA2
METALICP-AES
1 for Water and
ICP-MS for WaterEPA CLP ILM05.4 / NA
2
FMETALICP-AES
1 for Water and
ICP-MS for WaterEPA CLP ILM05.4 / NA
2
WCHEM Medium SM2540D / LAB-0628 Calendar-day
TATTest America - Connecticut TBD
CSW
SW
45 Days3
CLP Laboratory
Primary Contact: Adly Michaels/EPA
CLP RSCC & SMO
(732) 906-6161
Medium28 Calendar-day
TAT
Test America - Connecticut
NA (CLP Program)
WCHEM
SW-846 9060 / LAB-11
74
16
28 Calendar-day
TATTBD
Test America Burlington
30 Community Drive, Suite 11
South Burlington, VT 05403
Primary Contact: Sara Goff
(802) 923-1027
Test America - Connecticut
128 Long Hill Cross Road
Shelton, CT 06484
Primary Contact: Sara Goff
(802) 923-1027Medium
GW
6645 Days
3 CLP Laboratory NA (CLP Program)
WCHEM TBD8
Test America Burlington
SW-846 9060 / LAB-11
40
45 Days3 CLP Laboratory NA (CLP Program)
1 of 2
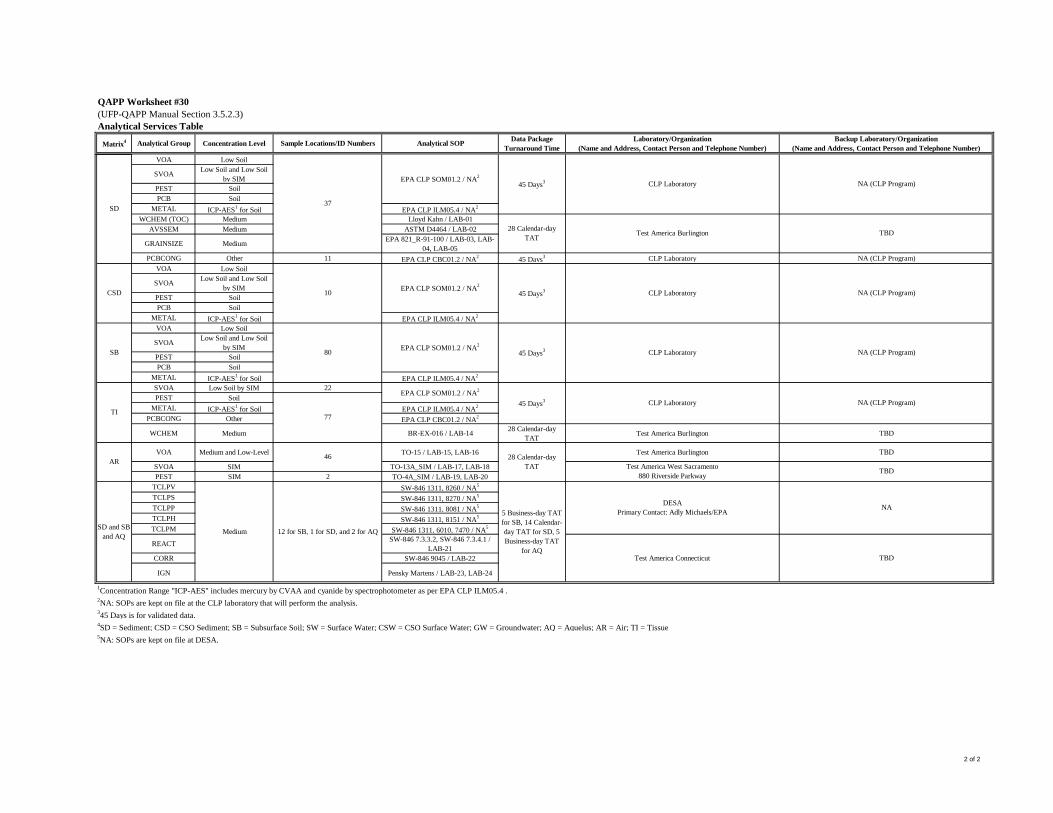
QAPP Worksheet #30
(UFP-QAPP Manual Section 3.5.2.3)
Analytical Services Table
Matrix4 Analytical Group Concentration Level Sample Locations/ID Numbers Analytical SOP
Data Package
Turnaround Time
Laboratory/Organization
(Name and Address, Contact Person and Telephone Number)
Backup Laboratory/Organization
(Name and Address, Contact Person and Telephone Number)
SW
45 Days3
CLP Laboratory
Primary Contact: Adly Michaels/EPA
CLP RSCC & SMO
(732) 906-6161
NA (CLP Program)74
VOA Low Soil
SVOALow Soil and Low Soil
by SIM
PEST Soil
PCB Soil
METAL ICP-AES1 for Soil EPA CLP ILM05.4 / NA
2
WCHEM (TOC) Medium Lloyd Kahn / LAB-01
AVSSEM Medium ASTM D4464 / LAB-02
GRAINSIZE MediumEPA 821_R-91-100 / LAB-03, LAB-
04, LAB-05
PCBCONG Other 11 EPA CLP CBC01.2 / NA2
45 Days3 CLP Laboratory NA (CLP Program)
VOA Low Soil
SVOALow Soil and Low Soil
by SIM
PEST Soil
PCB Soil
METAL ICP-AES1 for Soil EPA CLP ILM05.4 / NA
2
VOA Low Soil
SVOALow Soil and Low Soil
by SIM
PEST Soil
PCB Soil
METAL ICP-AES1 for Soil EPA CLP ILM05.4 / NA
2
SVOA Low Soil by SIM 22
PEST Soil
METAL ICP-AES1 for Soil EPA CLP ILM05.4 / NA
2
PCBCONG Other EPA CLP CBC01.2 / NA2
WCHEM Medium BR-EX-016 / LAB-1428 Calendar-day
TATTest America Burlington TBD
VOA Medium and Low-Level TO-15 / LAB-15, LAB-16 Test America Burlington TBD
SVOA SIM TO-13A_SIM / LAB-17, LAB-18
PEST SIM 2 TO-4A_SIM / LAB-19, LAB-20
TCLPV SW-846 1311, 8260 / NA5
TCLPS SW-846 1311, 8270 / NA5
TCLPP SW-846 1311, 8081 / NA5
TCLPH SW-846 1311, 8151 / NA5
TCLPM SW-846 1311, 6010, 7470 / NA5
REACTSW-846 7.3.3.2, SW-846 7.3.4.1 /
LAB-21
CORR SW-846 9045 / LAB-22
IGN Pensky Martens / LAB-23, LAB-24
1Concentration Range "ICP-AES" includes mercury by CVAA and cyanide by spectrophotometer as per EPA CLP ILM05.4 .
2NA: SOPs are kept on file at the CLP laboratory that will perform the analysis.
345 Days is for validated data.
4SD = Sediment; CSD = CSO Sediment; SB = Subsurface Soil; SW = Surface Water; CSW = CSO Surface Water; GW = Groundwater; AQ = Aquelus; AR = Air; TI = Tissue
5NA: SOPs are kept on file at DESA.
5 Business-day TAT
for SB, 14 Calendar-
day TAT for SD, 5
Business-day TAT
for AQ
NA (CLP Program)CLP Laboratory
37
EPA CLP SOM01.2 / NA2
28 Calendar-day
TAT
45 Days3
Test America Burlington TBD
SD
EPA CLP SOM01.2 / NA2
SD and SB
and AQ
DESA
Primary Contact: Adly Michaels/EPANA
12 for SB, 1 for SD, and 2 for AQ
TBDTest America Connecticut
Medium
45 Days3 CLP Laboratory NA (CLP Program)CSD 10
SB 80EPA CLP SOM01.2 / NA
2
45 Days3 CLP Laboratory NA (CLP Program)
TI77
EPA CLP SOM01.2 / NA2
45 Days3
TBD
NA (CLP Program)CLP Laboratory
AR28 Calendar-day
TAT
46
Test America West Sacramento
880 Riverside Parkway
2 of 2
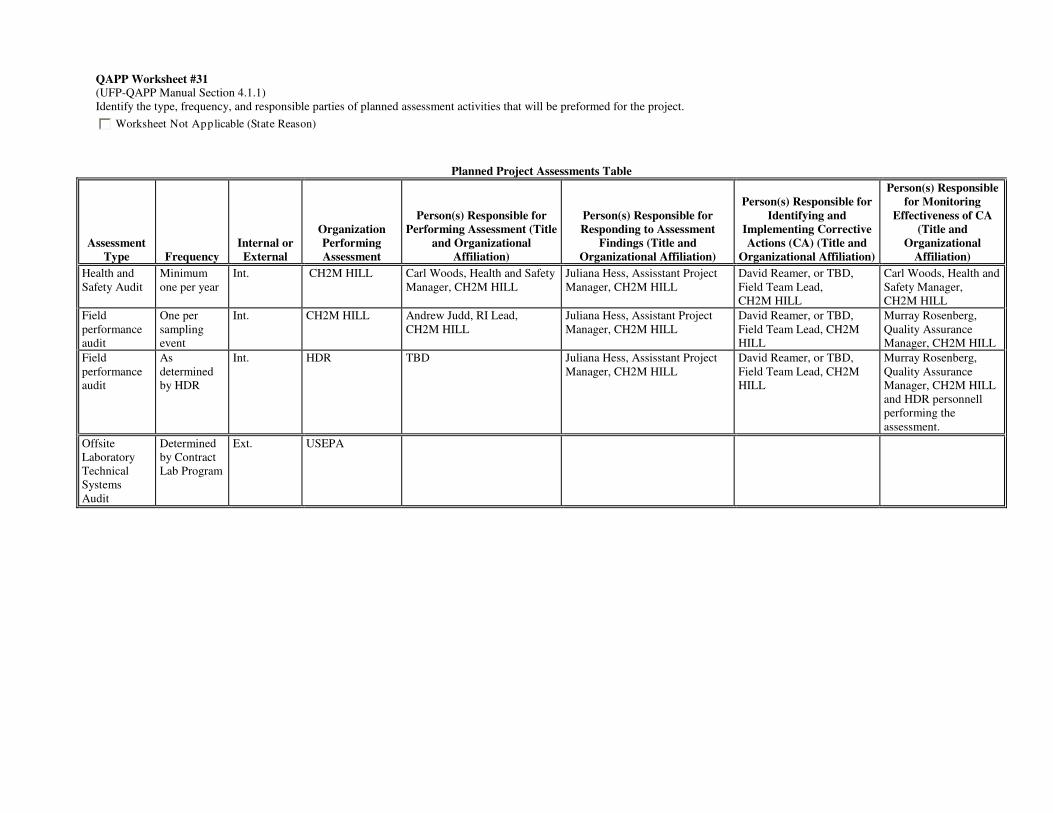
QAPP Worksheet #31 (UFP-QAPP Manual Section 4.1.1)
Identify the type, frequency, and responsible parties of planned assessment activities that will be preformed for the project.
Planned Project Assessments Table
Assessment
Type Frequency
Internal or
External
Organization
Performing
Assessment
Person(s) Responsible for
Performing Assessment (Title
and Organizational
Affiliation)
Person(s) Responsible for
Responding to Assessment
Findings (Title and
Organizational Affiliation)
Person(s) Responsible for
Identifying and
Implementing Corrective
Actions (CA) (Title and
Organizational Affiliation)
Person(s) Responsible
for Monitoring
Effectiveness of CA
(Title and
Organizational
Affiliation)
Health and
Safety Audit
Minimum
one per year
Int. CH2M HILL Carl Woods, Health and Safety
Manager, CH2M HILL
Juliana Hess, Assisstant Project
Manager, CH2M HILL
David Reamer, or TBD,
Field Team Lead,
CH2M HILL
Carl Woods, Health and
Safety Manager,
CH2M HILL
Field
performance
audit
One per
sampling
event
Int. CH2M HILL Andrew Judd, RI Lead,
CH2M HILL
Juliana Hess, Assistant Project
Manager, CH2M HILL
David Reamer, or TBD,
Field Team Lead, CH2M
HILL
Murray Rosenberg,
Quality Assurance
Manager, CH2M HILL
Field
performance
audit
As
determined
by HDR
Int. HDR TBD Juliana Hess, Assisstant Project
Manager, CH2M HILL
David Reamer, or TBD,
Field Team Lead, CH2M
HILL
Murray Rosenberg,
Quality Assurance
Manager, CH2M HILL
and HDR personnell
performing the
assessment.
Offsite
Laboratory
Technical
Systems
Audit
Determined
by Contract
Lab Program
Ext. USEPA
Worksheet Not Applicable (State Reason)
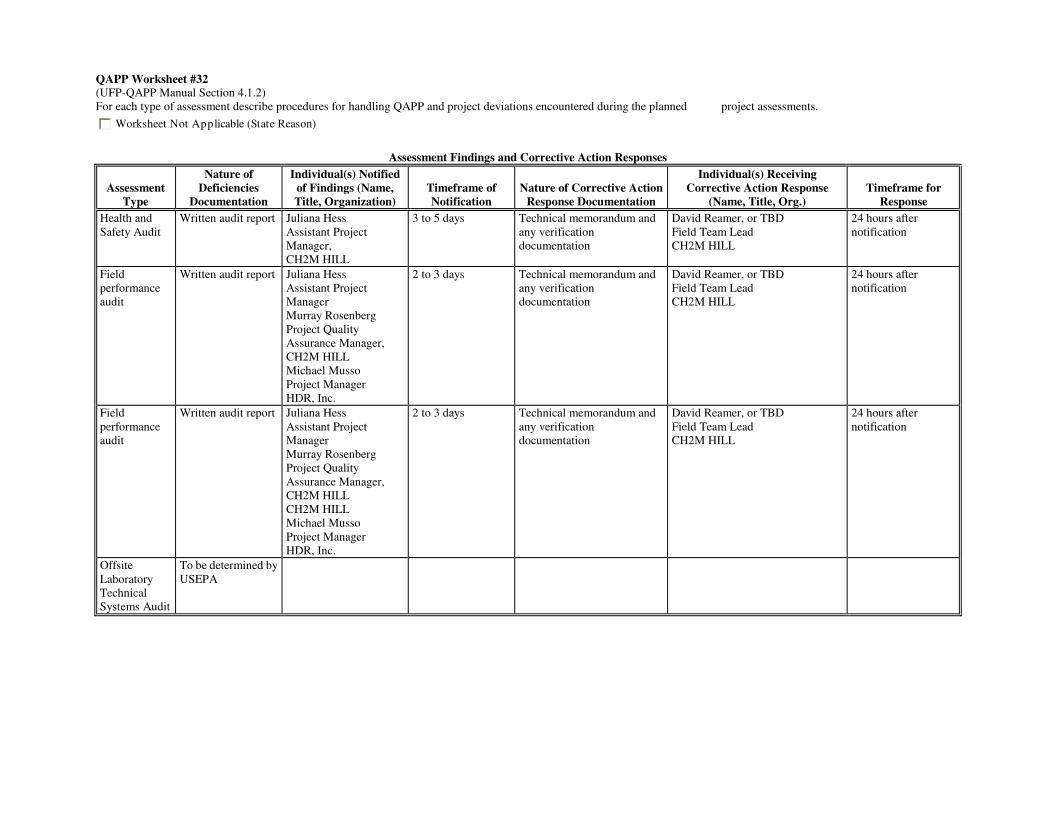
QAPP Worksheet #32 (UFP-QAPP Manual Section 4.1.2)
For each type of assessment describe procedures for handling QAPP and project deviations encountered during the planned project assessments.
Assessment Findings and Corrective Action Responses
Assessment
Type
Nature of
Deficiencies
Documentation
Individual(s) Notified
of Findings (Name,
Title, Organization)
Timeframe of
Notification
Nature of Corrective Action
Response Documentation
Individual(s) Receiving
Corrective Action Response
(Name, Title, Org.)
Timeframe for
Response
Health and
Safety Audit
Written audit report Juliana Hess
Assistant Project
Manager,
CH2M HILL
3 to 5 days Technical memorandum and
any verification
documentation
David Reamer, or TBD
Field Team Lead
CH2M HILL
24 hours after
notification
Field
performance
audit
Written audit report Juliana Hess
Assistant Project
Manager
Murray Rosenberg
Project Quality
Assurance Manager,
CH2M HILL
Michael Musso
Project Manager
HDR, Inc.
2 to 3 days Technical memorandum and
any verification
documentation
David Reamer, or TBD
Field Team Lead
CH2M HILL
24 hours after
notification
Field
performance
audit
Written audit report Juliana Hess
Assistant Project
Manager
Murray Rosenberg
Project Quality
Assurance Manager,
CH2M HILL
CH2M HILL
Michael Musso
Project Manager
HDR, Inc.
2 to 3 days Technical memorandum and
any verification
documentation
David Reamer, or TBD
Field Team Lead
CH2M HILL
24 hours after
notification
Offsite
Laboratory
Technical
Systems Audit
To be determined by
USEPA
Worksheet Not Applicable (State Reason)
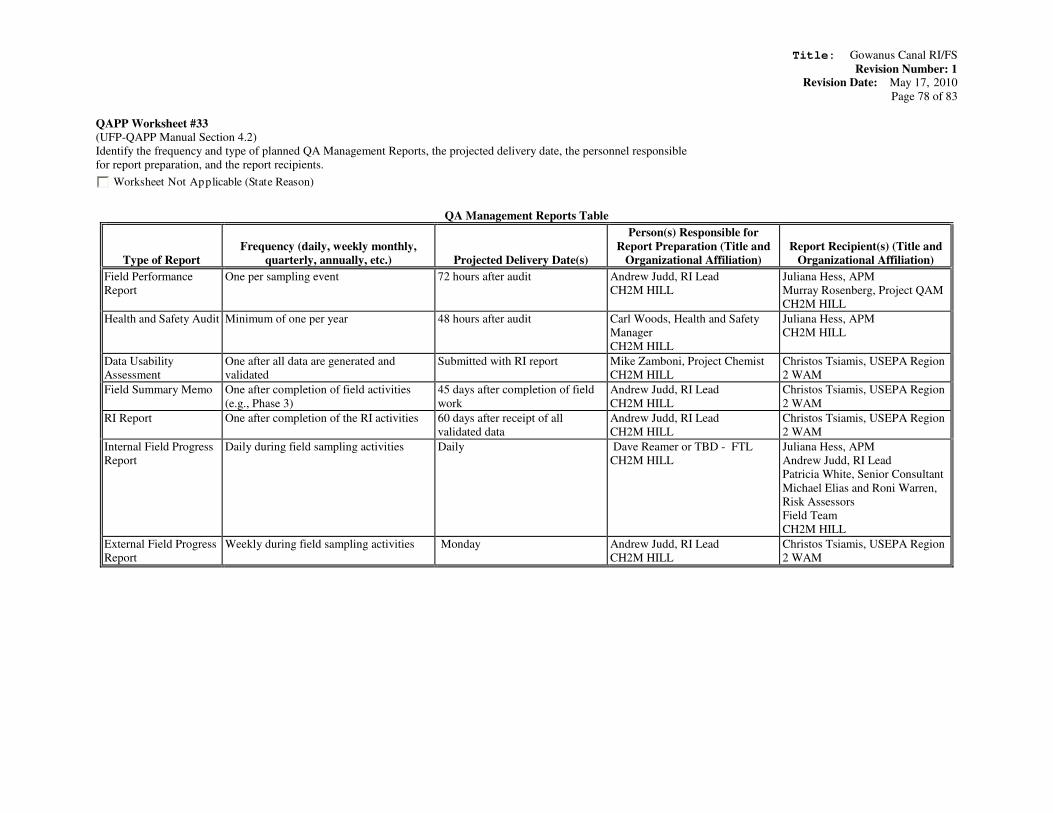
Title: Gowanus Canal RI/FS
Revision Number: 1 Revision Date: May 17, 2010
Page 78 of 83
QAPP Worksheet #33
(UFP-QAPP Manual Section 4.2)
Identify the frequency and type of planned QA Management Reports, the projected delivery date, the personnel responsible
for report preparation, and the report recipients.
Worksheet Not Applicable (State Reason)
QA Management Reports Table
Type of Report
Frequency (daily, weekly monthly,
quarterly, annually, etc.) Projected Delivery Date(s)
Person(s) Responsible for
Report Preparation (Title and
Organizational Affiliation)
Report Recipient(s) (Title and
Organizational Affiliation)
Field Performance
Report
One per sampling event 72 hours after audit Andrew Judd, RI Lead
CH2M HILL
Juliana Hess, APM
Murray Rosenberg, Project QAM
CH2M HILL
Health and Safety Audit Minimum of one per year 48 hours after audit Carl Woods, Health and Safety
Manager
CH2M HILL
Juliana Hess, APM
CH2M HILL
Data Usability
Assessment
One after all data are generated and
validated
Submitted with RI report Mike Zamboni, Project Chemist
CH2M HILL
Christos Tsiamis, USEPA Region
2 WAM
Field Summary Memo One after completion of field activities
(e.g., Phase 3)
45 days after completion of field
work
Andrew Judd, RI Lead
CH2M HILL
Christos Tsiamis, USEPA Region
2 WAM
RI Report One after completion of the RI activities 60 days after receipt of all
validated data
Andrew Judd, RI Lead
CH2M HILL
Christos Tsiamis, USEPA Region
2 WAM
Internal Field Progress
Report
Daily during field sampling activities Daily Dave Reamer or TBD - FTL
CH2M HILL
Juliana Hess, APM
Andrew Judd, RI Lead
Patricia White, Senior Consultant
Michael Elias and Roni Warren,
Risk Assessors
Field Team
CH2M HILL
External Field Progress
Report
Weekly during field sampling activities Monday Andrew Judd, RI Lead
CH2M HILL
Christos Tsiamis, USEPA Region
2 WAM
Title: Gowanus Canal RI/FS
Revision Number: 1 Revision Date: May 17, 2010
Page 79 of 83
QAPP Worksheet #34
(UFP-QAPP Manual Section 5.2.1)
Describe the processes that will be followed to verify project data. Verification inputs include items such as those listed in Table 9 of the UFP-QAPP Manual (Section 5.1). Describe
how each item will be verified, when the activity will occur, and what documentation is necessary, and identify the persons responsible. Internal or external is in relation to the data
generator.
Worksheet Not Applicable (State Reason)
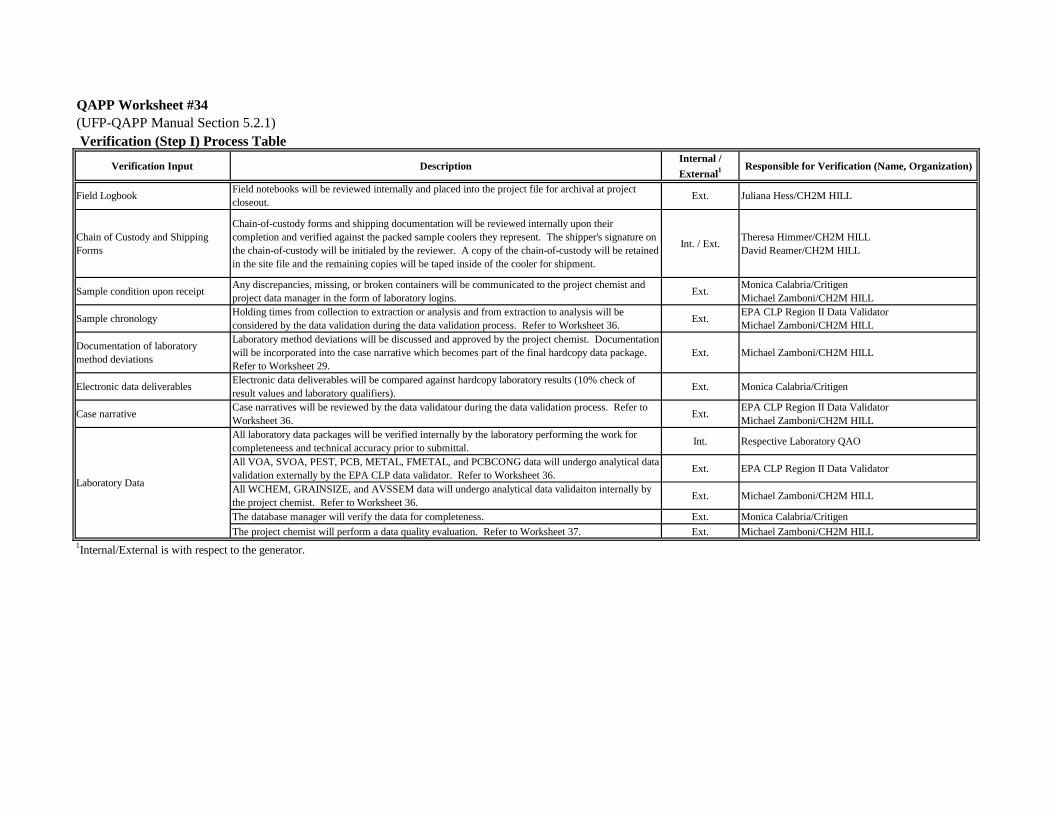
QAPP Worksheet #34
(UFP-QAPP Manual Section 5.2.1)
Verification (Step I) Process Table
Verification Input DescriptionInternal /
External1 Responsible for Verification (Name, Organization)
Field LogbookField notebooks will be reviewed internally and placed into the project file for archival at project
closeout.Ext. Juliana Hess/CH2M HILL
Chain of Custody and Shipping
Forms
Chain-of-custody forms and shipping documentation will be reviewed internally upon their
completion and verified against the packed sample coolers they represent. The shipper's signature on
the chain-of-custody will be initialed by the reviewer. A copy of the chain-of-custody will be retained
in the site file and the remaining copies will be taped inside of the cooler for shipment.
Int. / Ext.Theresa Himmer/CH2M HILL
David Reamer/CH2M HILL
Sample condition upon receiptAny discrepancies, missing, or broken containers will be communicated to the project chemist and
project data manager in the form of laboratory logins.Ext.
Monica Calabria/Critigen
Michael Zamboni/CH2M HILL
Sample chronologyHolding times from collection to extraction or analysis and from extraction to analysis will be
considered by the data validation during the data validation process. Refer to Worksheet 36.Ext.
EPA CLP Region II Data Validator
Michael Zamboni/CH2M HILL
Documentation of laboratory
method deviations
Laboratory method deviations will be discussed and approved by the project chemist. Documentation
will be incorporated into the case narrative which becomes part of the final hardcopy data package.
Refer to Worksheet 29.
Ext. Michael Zamboni/CH2M HILL
Electronic data deliverablesElectronic data deliverables will be compared against hardcopy laboratory results (10% check of
result values and laboratory qualifiers).Ext. Monica Calabria/Critigen
Case narrativeCase narratives will be reviewed by the data validatour during the data validation process. Refer to
Worksheet 36.Ext.
EPA CLP Region II Data Validator
Michael Zamboni/CH2M HILL
All laboratory data packages will be verified internally by the laboratory performing the work for
completeneess and technical accuracy prior to submittal.Int. Respective Laboratory QAO
All VOA, SVOA, PEST, PCB, METAL, FMETAL, and PCBCONG data will undergo analytical data
validation externally by the EPA CLP data validator. Refer to Worksheet 36.Ext. EPA CLP Region II Data Validator
All WCHEM, GRAINSIZE, and AVSSEM data will undergo analytical data validaiton internally by
the project chemist. Refer to Worksheet 36.Ext. Michael Zamboni/CH2M HILL
The database manager will verify the data for completeness. Ext. Monica Calabria/Critigen
The project chemist will perform a data quality evaluation. Refer to Worksheet 37. Ext. Michael Zamboni/CH2M HILL
1Internal/External is with respect to the generator.
Laboratory Data
Title: Gowanus Canal RI/FS
Revision Number: 1 Revision Date: May 17, 2010
Page 80 of 83
QAPP Worksheet #35
(UFP-QAPP Manual Section 5.2.2)
Describe the processes that will be followed to validate project data. Validation inputs include items such as those listed in Table 9 of the
UFP-QAPP Manual (Section 5.1). Describe how each item will be validated, when the activity will occur, and what documentation is
necessary and identify the person responsible. Differentiate between steps IIa and IIb of validation.
Worksheet Not Applicable (State Reason)
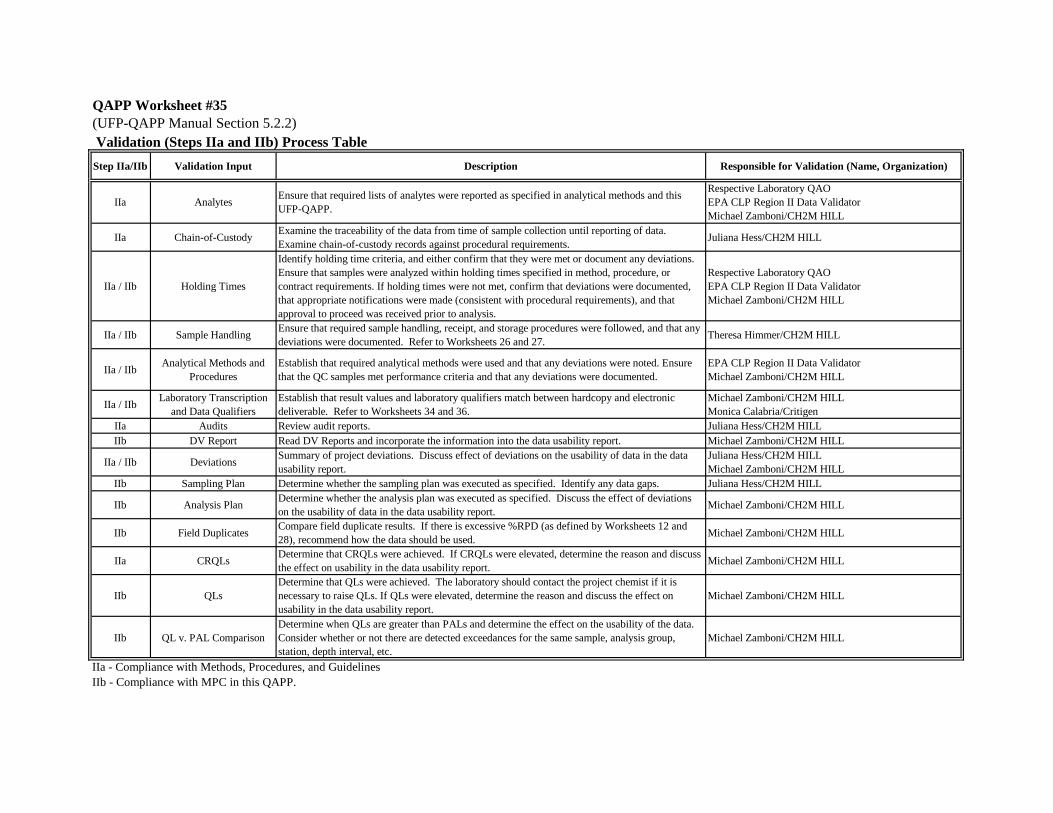
QAPP Worksheet #35
(UFP-QAPP Manual Section 5.2.2)
Validation (Steps IIa and IIb) Process Table
Step IIa/IIb Validation Input Description Responsible for Validation (Name, Organization)
IIa AnalytesEnsure that required lists of analytes were reported as specified in analytical methods and this
UFP-QAPP.
Respective Laboratory QAO
EPA CLP Region II Data Validator
Michael Zamboni/CH2M HILL
IIa Chain-of-CustodyExamine the traceability of the data from time of sample collection until reporting of data.
Examine chain-of-custody records against procedural requirements.Juliana Hess/CH2M HILL
IIa / IIb Holding Times
Identify holding time criteria, and either confirm that they were met or document any deviations.
Ensure that samples were analyzed within holding times specified in method, procedure, or
contract requirements. If holding times were not met, confirm that deviations were documented,
that appropriate notifications were made (consistent with procedural requirements), and that
approval to proceed was received prior to analysis.
Respective Laboratory QAO
EPA CLP Region II Data Validator
Michael Zamboni/CH2M HILL
IIa / IIb Sample HandlingEnsure that required sample handling, receipt, and storage procedures were followed, and that any
deviations were documented. Refer to Worksheets 26 and 27.Theresa Himmer/CH2M HILL
IIa / IIbAnalytical Methods and
Procedures
Establish that required analytical methods were used and that any deviations were noted. Ensure
that the QC samples met performance criteria and that any deviations were documented.
EPA CLP Region II Data Validator
Michael Zamboni/CH2M HILL
IIa / IIbLaboratory Transcription
and Data Qualifiers
Establish that result values and laboratory qualifiers match between hardcopy and electronic
deliverable. Refer to Worksheets 34 and 36.
Michael Zamboni/CH2M HILL
Monica Calabria/Critigen
IIa Audits Review audit reports. Juliana Hess/CH2M HILL
IIb DV Report Read DV Reports and incorporate the information into the data usability report. Michael Zamboni/CH2M HILL
IIa / IIb DeviationsSummary of project deviations. Discuss effect of deviations on the usability of data in the data
usability report.
Juliana Hess/CH2M HILL
Michael Zamboni/CH2M HILL
IIb Sampling Plan Determine whether the sampling plan was executed as specified. Identify any data gaps. Juliana Hess/CH2M HILL
IIb Analysis PlanDetermine whether the analysis plan was executed as specified. Discuss the effect of deviations
on the usability of data in the data usability report.Michael Zamboni/CH2M HILL
IIb Field DuplicatesCompare field duplicate results. If there is excessive %RPD (as defined by Worksheets 12 and
28), recommend how the data should be used.Michael Zamboni/CH2M HILL
IIa CRQLsDetermine that CRQLs were achieved. If CRQLs were elevated, determine the reason and discuss
the effect on usability in the data usability report.Michael Zamboni/CH2M HILL
IIb QLs
Determine that QLs were achieved. The laboratory should contact the project chemist if it is
necessary to raise QLs. If QLs were elevated, determine the reason and discuss the effect on
usability in the data usability report.
Michael Zamboni/CH2M HILL
IIb QL v. PAL Comparison
Determine when QLs are greater than PALs and determine the effect on the usability of the data.
Consider whether or not there are detected exceedances for the same sample, analysis group,
station, depth interval, etc.
Michael Zamboni/CH2M HILL
IIa - Compliance with Methods, Procedures, and Guidelines
IIb - Compliance with MPC in this QAPP.
Title: Gowanus Canal RI/FS
Revision Number: 1 Revision Date: May 17, 2010
Page 81 of 83
QAPP Worksheet #36
(UFP-QAPP Manual Section 5.2.2)
Identify the matrices, analytical groups, and concentration levels that each entity performing validation will be responsible for, as well as criteria that will be used to validate those
data.
Worksheet Not Applicable (State Reason)
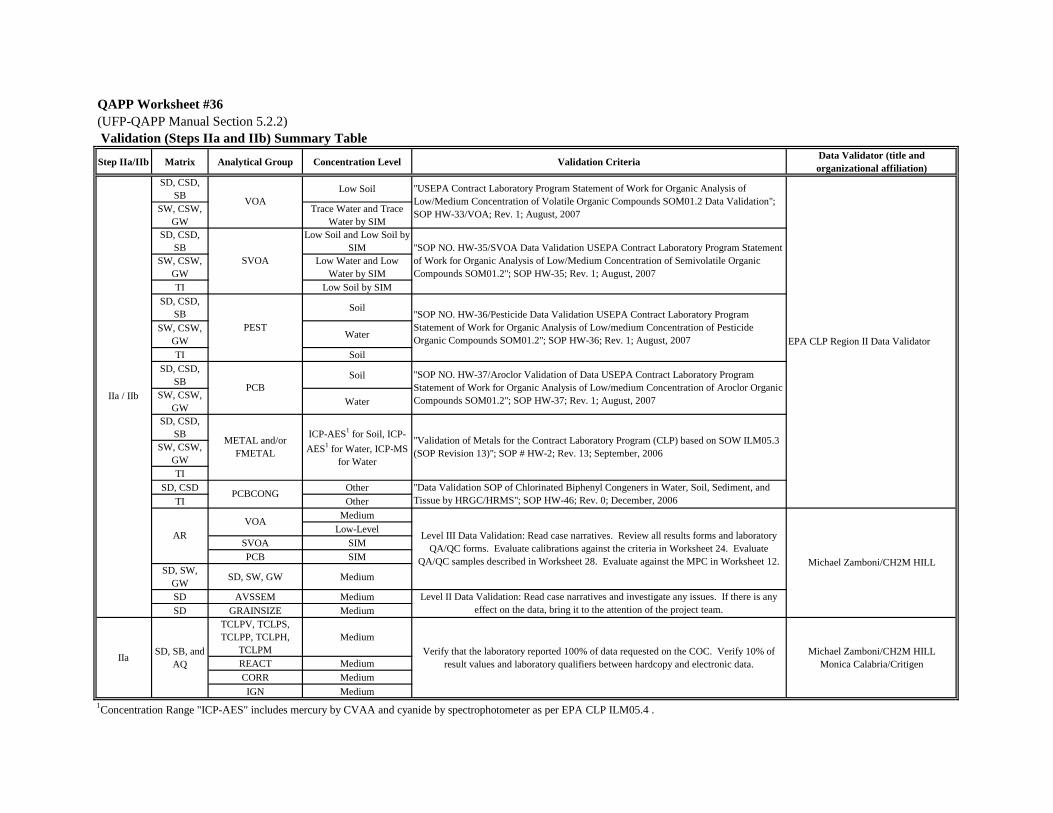
QAPP Worksheet #36
(UFP-QAPP Manual Section 5.2.2)
Validation (Steps IIa and IIb) Summary Table
Step IIa/IIb Matrix Analytical Group Concentration Level Validation CriteriaData Validator (title and
organizational affiliation)
SD, CSD,
SBLow Soil
SW, CSW,
GW
Trace Water and Trace
Water by SIM
SD, CSD,
SB
Low Soil and Low Soil by
SIM
SW, CSW,
GW
Low Water and Low
Water by SIM
TI Low Soil by SIM
SD, CSD,
SBSoil
SW, CSW,
GWWater
TI Soil
SD, CSD,
SBSoil
SW, CSW,
GWWater
SD, CSD,
SB
SW, CSW,
GW
TI
SD, CSD Other
TI Other
Medium
Low-Level
SVOA SIM
PCB SIM
SD, SW,
GWSD, SW, GW Medium
SD AVSSEM Medium
SD GRAINSIZE Medium
TCLPV, TCLPS,
TCLPP, TCLPH,
TCLPM
Medium
REACT Medium
CORR Medium
IGN Medium
1Concentration Range "ICP-AES" includes mercury by CVAA and cyanide by spectrophotometer as per EPA CLP ILM05.4 .
IIaMichael Zamboni/CH2M HILL
Monica Calabria/Critigen
Verify that the laboratory reported 100% of data requested on the COC. Verify 10% of
result values and laboratory qualifiers between hardcopy and electronic data.
SD, SB, and
AQ
AR
VOA
EPA CLP Region II Data Validator
IIa / IIb
Michael Zamboni/CH2M HILL
Level II Data Validation: Read case narratives and investigate any issues. If there is any
effect on the data, bring it to the attention of the project team.
Level III Data Validation: Read case narratives. Review all results forms and laboratory
QA/QC forms. Evaluate calibrations against the criteria in Worksheet 24. Evaluate
QA/QC samples described in Worksheet 28. Evaluate against the MPC in Worksheet 12.
"USEPA Contract Laboratory Program Statement of Work for Organic Analysis of
Low/Medium Concentration of Volatile Organic Compounds SOM01.2 Data Validation";
SOP HW-33/VOA; Rev. 1; August, 2007
VOA
PCBCONG"Data Validation SOP of Chlorinated Biphenyl Congeners in Water, Soil, Sediment, and
Tissue by HRGC/HRMS"; SOP HW-46; Rev. 0; December, 2006
"SOP NO. HW-36/Pesticide Data Validation USEPA Contract Laboratory Program
Statement of Work for Organic Analysis of Low/medium Concentration of Pesticide
Organic Compounds SOM01.2"; SOP HW-36; Rev. 1; August, 2007
PEST
"SOP NO. HW-35/SVOA Data Validation USEPA Contract Laboratory Program Statement
of Work for Organic Analysis of Low/Medium Concentration of Semivolatile Organic
Compounds SOM01.2"; SOP HW-35; Rev. 1; August, 2007
SVOA
"Validation of Metals for the Contract Laboratory Program (CLP) based on SOW ILM05.3
(SOP Revision 13)"; SOP # HW-2; Rev. 13; September, 2006
ICP-AES1 for Soil, ICP-
AES1 for Water, ICP-MS
for Water
METAL and/or
FMETAL
"SOP NO. HW-37/Aroclor Validation of Data USEPA Contract Laboratory Program
Statement of Work for Organic Analysis of Low/medium Concentration of Aroclor Organic
Compounds SOM01.2"; SOP HW-37; Rev. 1; August, 2007
PCB
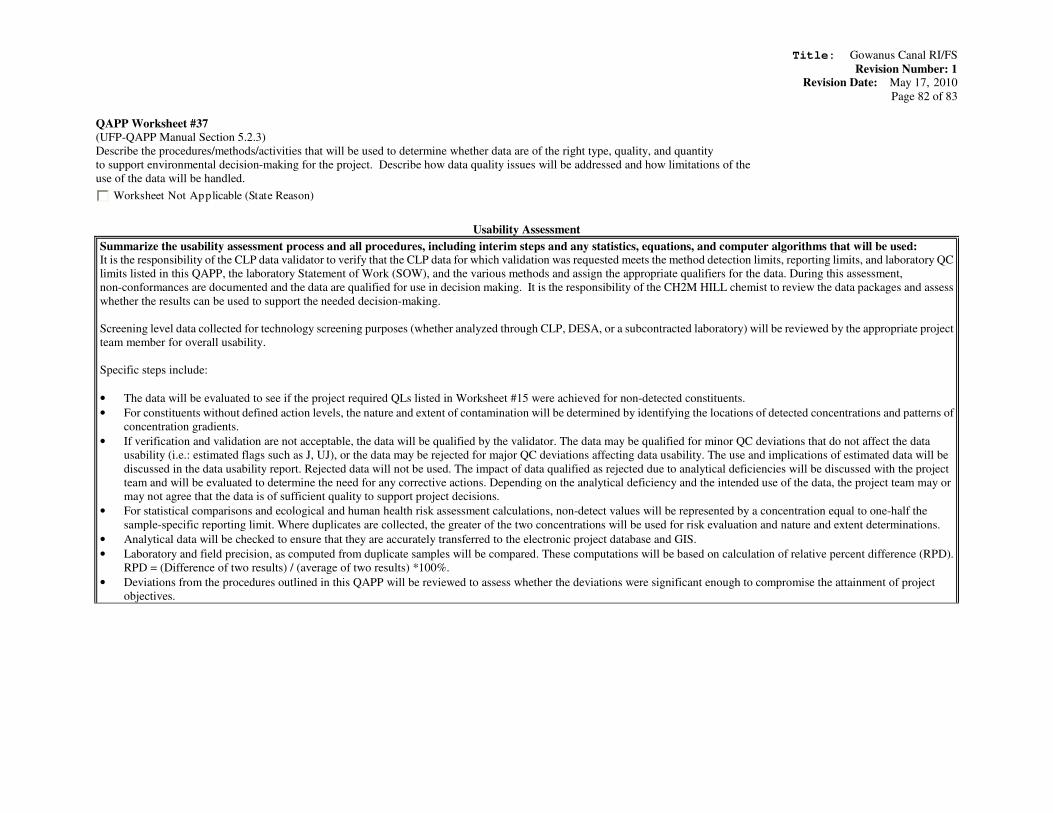
Title: Gowanus Canal RI/FS
Revision Number: 1 Revision Date: May 17, 2010
Page 82 of 83
QAPP Worksheet #37
(UFP-QAPP Manual Section 5.2.3)
Describe the procedures/methods/activities that will be used to determine whether data are of the right type, quality, and quantity
to support environmental decision-making for the project. Describe how data quality issues will be addressed and how limitations of the
use of the data will be handled.
Worksheet Not Applicable (State Reason)
Usability Assessment
Summarize the usability assessment process and all procedures, including interim steps and any statistics, equations, and computer algorithms that will be used: It is the responsibility of the CLP data validator to verify that the CLP data for which validation was requested meets the method detection limits, reporting limits, and laboratory QC
limits listed in this QAPP, the laboratory Statement of Work (SOW), and the various methods and assign the appropriate qualifiers for the data. During this assessment,
non-conformances are documented and the data are qualified for use in decision making. It is the responsibility of the CH2M HILL chemist to review the data packages and assess
whether the results can be used to support the needed decision-making.
Screening level data collected for technology screening purposes (whether analyzed through CLP, DESA, or a subcontracted laboratory) will be reviewed by the appropriate project
team member for overall usability.
Specific steps include:
• The data will be evaluated to see if the project required QLs listed in Worksheet #15 were achieved for non-detected constituents.
• For constituents without defined action levels, the nature and extent of contamination will be determined by identifying the locations of detected concentrations and patterns of
concentration gradients.
• If verification and validation are not acceptable, the data will be qualified by the validator. The data may be qualified for minor QC deviations that do not affect the data
usability (i.e.: estimated flags such as J, UJ), or the data may be rejected for major QC deviations affecting data usability. The use and implications of estimated data will be
discussed in the data usability report. Rejected data will not be used. The impact of data qualified as rejected due to analytical deficiencies will be discussed with the project
team and will be evaluated to determine the need for any corrective actions. Depending on the analytical deficiency and the intended use of the data, the project team may or
may not agree that the data is of sufficient quality to support project decisions.
• For statistical comparisons and ecological and human health risk assessment calculations, non-detect values will be represented by a concentration equal to one-half the
sample-specific reporting limit. Where duplicates are collected, the greater of the two concentrations will be used for risk evaluation and nature and extent determinations.
• Analytical data will be checked to ensure that they are accurately transferred to the electronic project database and GIS.
• Laboratory and field precision, as computed from duplicate samples will be compared. These computations will be based on calculation of relative percent difference (RPD).
RPD = (Difference of two results) / (average of two results) *100%.
• Deviations from the procedures outlined in this QAPP will be reviewed to assess whether the deviations were significant enough to compromise the attainment of project
objectives.
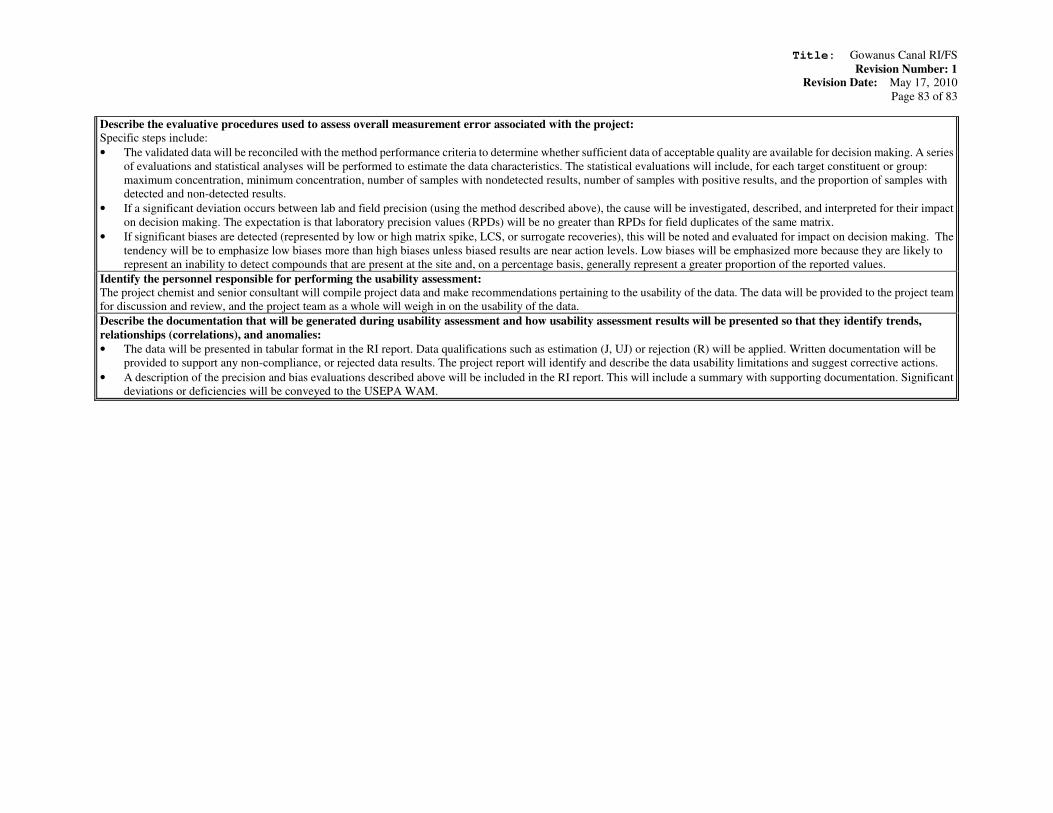
Title: Gowanus Canal RI/FS
Revision Number: 1 Revision Date: May 17, 2010
Page 83 of 83
Describe the evaluative procedures used to assess overall measurement error associated with the project:
Specific steps include:
• The validated data will be reconciled with the method performance criteria to determine whether sufficient data of acceptable quality are available for decision making. A series
of evaluations and statistical analyses will be performed to estimate the data characteristics. The statistical evaluations will include, for each target constituent or group:
maximum concentration, minimum concentration, number of samples with nondetected results, number of samples with positive results, and the proportion of samples with
detected and non-detected results.
• If a significant deviation occurs between lab and field precision (using the method described above), the cause will be investigated, described, and interpreted for their impact
on decision making. The expectation is that laboratory precision values (RPDs) will be no greater than RPDs for field duplicates of the same matrix.
• If significant biases are detected (represented by low or high matrix spike, LCS, or surrogate recoveries), this will be noted and evaluated for impact on decision making. The
tendency will be to emphasize low biases more than high biases unless biased results are near action levels. Low biases will be emphasized more because they are likely to
represent an inability to detect compounds that are present at the site and, on a percentage basis, generally represent a greater proportion of the reported values.
Identify the personnel responsible for performing the usability assessment:
The project chemist and senior consultant will compile project data and make recommendations pertaining to the usability of the data. The data will be provided to the project team
for discussion and review, and the project team as a whole will weigh in on the usability of the data.
Describe the documentation that will be generated during usability assessment and how usability assessment results will be presented so that they identify trends,
relationships (correlations), and anomalies:
• The data will be presented in tabular format in the RI report. Data qualifications such as estimation (J, UJ) or rejection (R) will be applied. Written documentation will be
provided to support any non-compliance, or rejected data results. The project report will identify and describe the data usability limitations and suggest corrective actions.
• A description of the precision and bias evaluations described above will be included in the RI report. This will include a summary with supporting documentation. Significant
deviations or deficiencies will be conveyed to the USEPA WAM.

DRAFT
Phase 3 QUALITY ASSURANCE PROJECT PLAN
VOLUME 2 ATTACHMENTS
Gowanus Canal Proposed Superfund Site
Remedial Investigation and Feasibility Study
Brooklyn, New York
Prepared for:
U.S. ENVIRONMENTAL PROTECTION AGENCY
Prepared under:
Contract No. EP-W-09-009
Work Assignment WA No. 013-RICO-02ZP /
May 19 2010
NONDISCLOSURE STATEMENT
This document has been prepared for the U.S. Environmental Protection Agency Region 2. The
material contained herein is not to be disclosed to, discussed with, or made available to any persons
for any reason without the prior expressed approval of a responsible official of the U.S.
Environmental Protection Agency Region 2.
Attachment 1
Sampling Support Information Draft Final Gowanus Canal Superfund Site Brooklyn, New York Phase 3 Remedial Investigation Technical Approach Redline Showing Changes from the Planned Investigation Activities Described in the May Draft Final Based on Received Comments June 2010
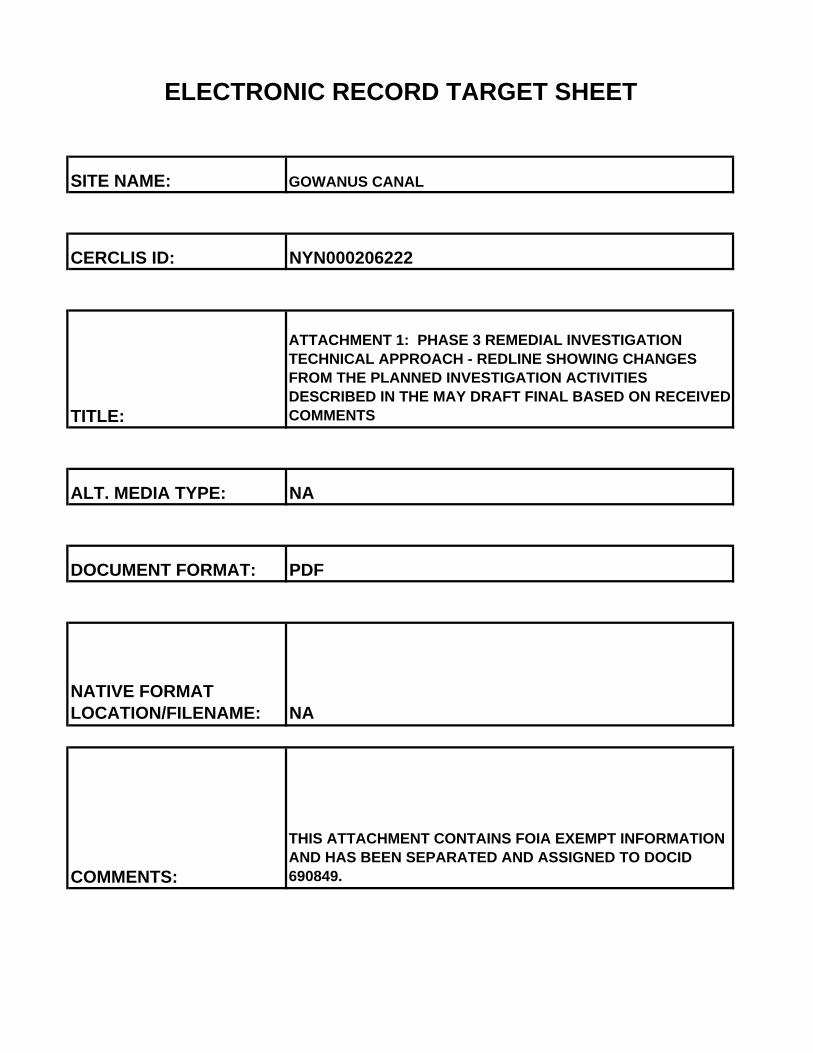
SITE NAME: GOWANUS CANAL
CERCLIS ID: NYN000206222
TITLE:
ATTACHMENT 1: PHASE 3 REMEDIAL INVESTIGATION TECHNICAL APPROACH - REDLINE SHOWING CHANGES FROM THE PLANNED INVESTIGATION ACTIVITIES DESCRIBED IN THE MAY DRAFT FINAL BASED ON RECEIVED COMMENTS
ALT. MEDIA TYPE: NA
DOCUMENT FORMAT: PDF
NATIVE FORMAT LOCATION/FILENAME: NA
COMMENTS:
THIS ATTACHMENT CONTAINS FOIA EXEMPT INFORMATION AND HAS BEEN SEPARATED AND ASSIGNED TO DOCID 690849.
ELECTRONIC RECORD TARGET SHEET
Title: Gowanus Canal RI/FS
Revision Number: 1 Revision Date: May 17, 2010
Page 89 of 83
Attachment 2
Laboratory SOPs
Laboratory SOPs are kept in the project file.

Title: Gowanus Canal RI/FS
Revision Number: 1 Revision Date: May 17, 2010
Page 90 of 83
Attachment 3
Field Standard Operating Procedures

SOP-01: Field Logbook Procedures
Revision No.: 0 Date: February 2010
Page 1 of 2
STANDARD OPERATING PROCEDURE FIELD LOGBOOK PROCEDURES
1.0 Scope and Application
The purpose of this Standard Operating Procedure (SOP) is to describe protocols for recording field information in a field logbook.
2.0 Materials
a. Field Logbook b. Indelible ink pen (normal conditions) c. Pencil (only for extreme weather conditions – cold/rain)
3.0 Procedure
NOTE: Client has requested that we note in the field log books and notify Field Operations Manager of observed sheens on the water surface and whether their origin can be noted (e.g., seepage from a bulhead).
All information pertinent to a field survey or sampling effort will be recorded in a bound field logbook that will be initiated at the start of the first onsite activity. The field logbook will consist of a bound notebook with consecutively numbered pages that cannot be removed. The outside front cover of the logbook will contain the project (site) name and the specific activity (e.g., remedial design sampling). The inside front cover will include:
Site name and USEPA work assignment number
Project number
Site manager’s name and mailing address
Sequential logbook number
Start date and end date of logbook
Each page will be consecutively numbered, dated, and initialed. All entries will be made in indelible black ink, and all corrections will consist of line-out deletions that are initialed and dated. If only part of a page is used, the remainder of the page should have an "X" drawn across it. At a minimum, entries in the logbook will include the following:
Time of arrival and departure of site personnel, site visitors, and equipment
Instrument calibration information, including make, model, and serial number of the equipment calibrated
Field observations (e.g., sample description, weather, unusual site conditions or observations, sources of potential contamination, etc.)
Detailed description of the sampling location, including a sketch
Details of the sample site (e.g., coordinates [x, y], water depth [z], core penetration and recovery)
Sampling methodology and matrix, including distinction between grab and composite samples
Names of samplers and crew members
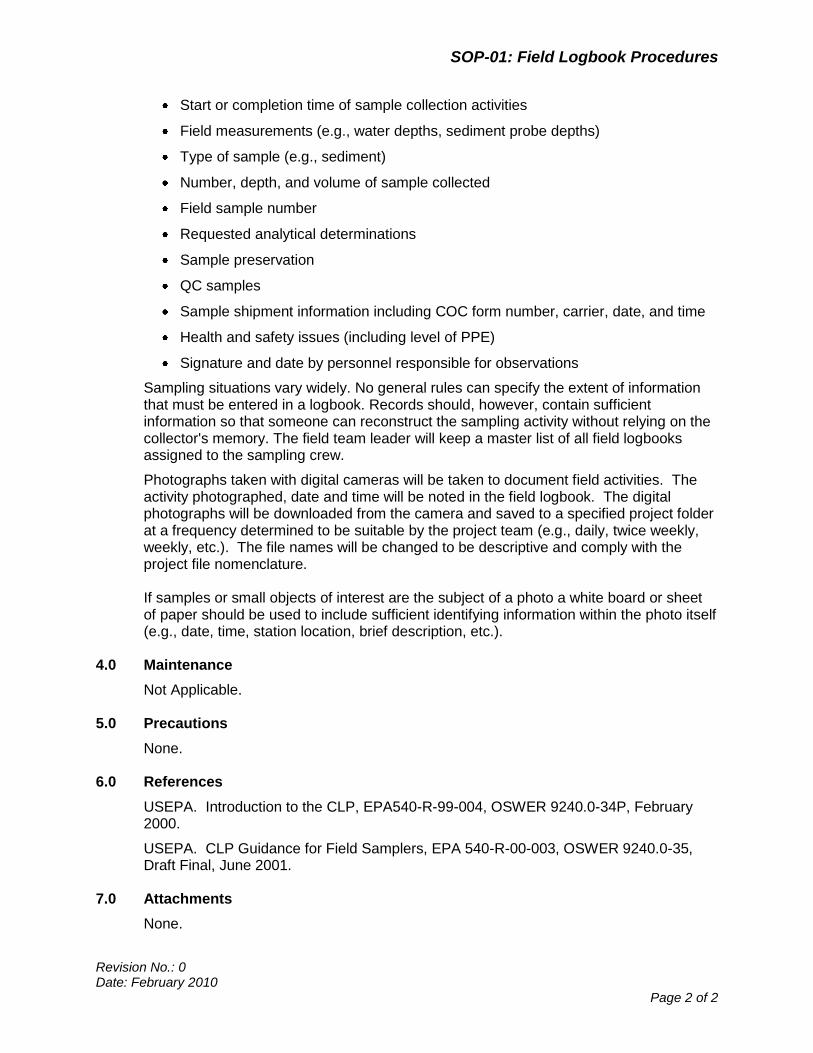
SOP-01: Field Logbook Procedures
Revision No.: 0 Date: February 2010
Page 2 of 2
Start or completion time of sample collection activities
Field measurements (e.g., water depths, sediment probe depths)
Type of sample (e.g., sediment)
Number, depth, and volume of sample collected
Field sample number
Requested analytical determinations
Sample preservation
QC samples
Sample shipment information including COC form number, carrier, date, and time
Health and safety issues (including level of PPE)
Signature and date by personnel responsible for observations
Sampling situations vary widely. No general rules can specify the extent of information that must be entered in a logbook. Records should, however, contain sufficient information so that someone can reconstruct the sampling activity without relying on the collector's memory. The field team leader will keep a master list of all field logbooks assigned to the sampling crew.
Photographs taken with digital cameras will be taken to document field activities. The activity photographed, date and time will be noted in the field logbook. The digital photographs will be downloaded from the camera and saved to a specified project folder at a frequency determined to be suitable by the project team (e.g., daily, twice weekly, weekly, etc.). The file names will be changed to be descriptive and comply with the project file nomenclature. If samples or small objects of interest are the subject of a photo a white board or sheet of paper should be used to include sufficient identifying information within the photo itself (e.g., date, time, station location, brief description, etc.).
4.0 Maintenance
Not Applicable. 5.0 Precautions
None. 6.0 References
USEPA. Introduction to the CLP, EPA540-R-99-004, OSWER 9240.0-34P, February 2000.
USEPA. CLP Guidance for Field Samplers, EPA 540-R-00-003, OSWER 9240.0-35, Draft Final, June 2001.
7.0 Attachments
None.

SOP-02: Sample Nomenclature
Revision No. 1 Date: April 2010
Page 1 of 4
STANDARD OPERATING PROCEDURE SAMPLE NOMENCLATURE
1.0 Scope and Application
The purpose of this Standard Operating Procedure (SOP) is to describe protocols for designating sample numbers during the Gowanus Canal Phase 3 Remedial Investigation. Every sample will have a sample number uniquely identifying the sampling point and phase of sampling.
2.0 Materials
None required.
3.0 Procedure
3.1 Each sample collected during the field investigation will be assigned a unique identification number or alpha-numeric code. This sample ID will be included on the sample tag and the traffic report and chain-of-custody record.
The sample ID nomenclature is based on the following system:
Site—GC (Gowanus Canal)
FOLLOWED BY
Sample type - the types of sample are as follows: SD = Sediment SW = Surface Water AS = Air Sample TI = Tissue WD = Investigation Derived Waste (IDW) Disposal Sample SB = Soil boring Sample MW = Monitoring Well Sample RH or OH = CSO Sample
FOLLOWED BY
Station Location—the station location code consists of four to five alphanumeric characters for air samples, surface water samples, and sediment samples. Soil boring locations will be designated based on the monitoring well that is constructed at the locations (e.g., SBMW01I is the soil boring installed for the construction of intermediate monitoring well 01). Monitoring wells will be designated based on the pair that they represent with an S or I used to designate whether shallow or intermediate (e.g., MW01S is the shallow well at location 1). CSO station locations will be as designated by the NYCDEP CSO nomenclature system. The identifiers are based on the pre-determined sample location within the canal. The tissue sample locations will be assigned based on the reach of the canal (See QAPP Attachment 1 – 6 reaches within the canal and one reach for the reference locations).
FOLLOWED BY
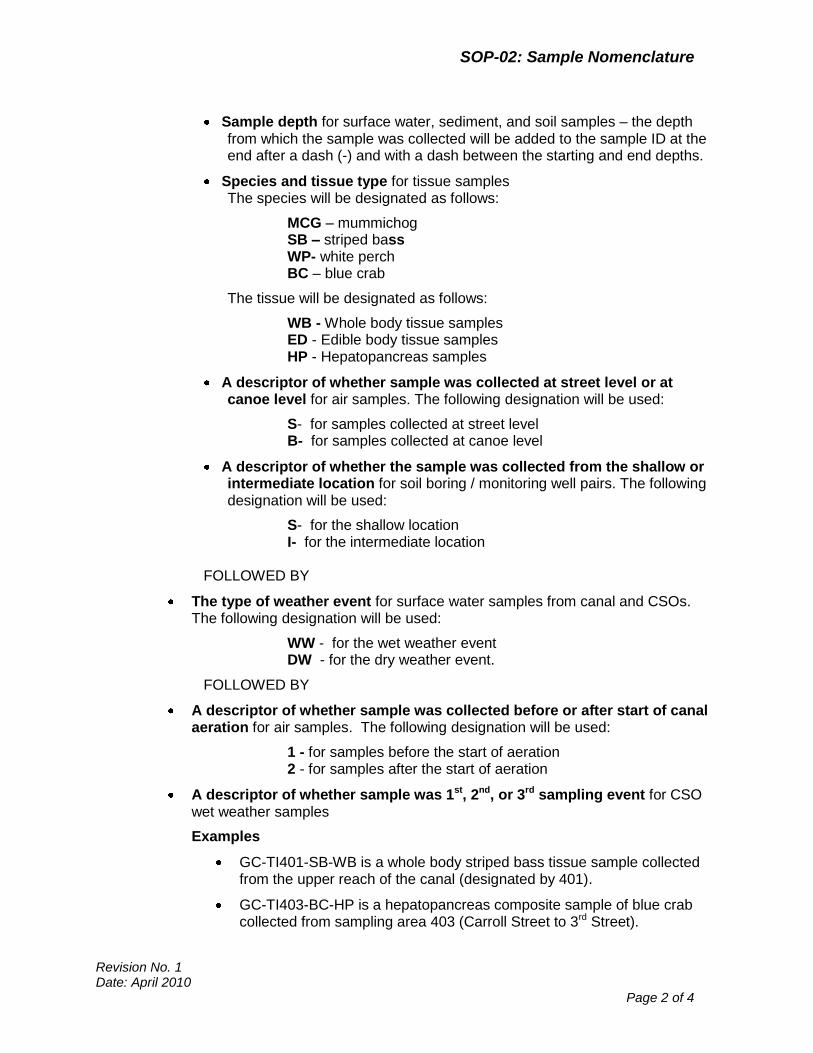
SOP-02: Sample Nomenclature
Revision No. 1 Date: April 2010
Page 2 of 4
Sample depth for surface water, sediment, and soil samples – the depth from which the sample was collected will be added to the sample ID at the end after a dash (-) and with a dash between the starting and end depths.
Species and tissue type for tissue samples The species will be designated as follows:
MCG – mummichog SB – striped bass WP- white perch BC – blue crab
The tissue will be designated as follows:
WB - Whole body tissue samples ED - Edible body tissue samples HP - Hepatopancreas samples
A descriptor of whether sample was collected at street level or at canoe level for air samples. The following designation will be used:
S- for samples collected at street level B- for samples collected at canoe level
A descriptor of whether the sample was collected from the shallow or intermediate location for soil boring / monitoring well pairs. The following designation will be used:
S- for the shallow location I- for the intermediate location
FOLLOWED BY
The type of weather event for surface water samples from canal and CSOs. The following designation will be used:
WW - for the wet weather event DW - for the dry weather event.
FOLLOWED BY
A descriptor of whether sample was collected before or after start of canal aeration for air samples. The following designation will be used:
1 - for samples before the start of aeration 2 - for samples after the start of aeration
A descriptor of whether sample was 1st, 2nd, or 3rd sampling event for CSO wet weather samples
Examples
GC-TI401-SB-WB is a whole body striped bass tissue sample collected from the upper reach of the canal (designated by 401).
GC-TI403-BC-HP is a hepatopancreas composite sample of blue crab collected from sampling area 403 (Carroll Street to 3rd Street).
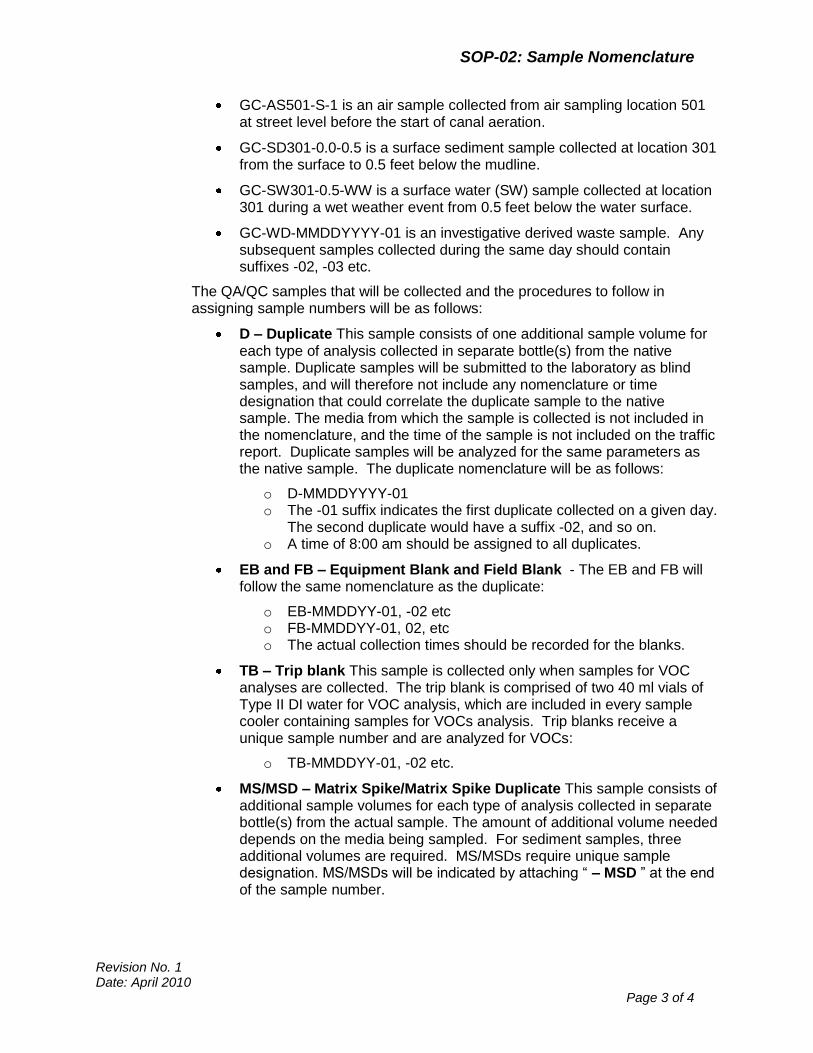
SOP-02: Sample Nomenclature
Revision No. 1 Date: April 2010
Page 3 of 4
GC-AS501-S-1 is an air sample collected from air sampling location 501 at street level before the start of canal aeration.
GC-SD301-0.0-0.5 is a surface sediment sample collected at location 301 from the surface to 0.5 feet below the mudline.
GC-SW301-0.5-WW is a surface water (SW) sample collected at location 301 during a wet weather event from 0.5 feet below the water surface.
GC-WD-MMDDYYYY-01 is an investigative derived waste sample. Any subsequent samples collected during the same day should contain suffixes -02, -03 etc.
The QA/QC samples that will be collected and the procedures to follow in assigning sample numbers will be as follows:
D – Duplicate This sample consists of one additional sample volume for each type of analysis collected in separate bottle(s) from the native sample. Duplicate samples will be submitted to the laboratory as blind samples, and will therefore not include any nomenclature or time designation that could correlate the duplicate sample to the native sample. The media from which the sample is collected is not included in the nomenclature, and the time of the sample is not included on the traffic report. Duplicate samples will be analyzed for the same parameters as the native sample. The duplicate nomenclature will be as follows:
o D-MMDDYYYY-01 o The -01 suffix indicates the first duplicate collected on a given day.
The second duplicate would have a suffix -02, and so on. o A time of 8:00 am should be assigned to all duplicates.
EB and FB – Equipment Blank and Field Blank - The EB and FB will follow the same nomenclature as the duplicate:
o EB-MMDDYY-01, -02 etc o FB-MMDDYY-01, 02, etc o The actual collection times should be recorded for the blanks.
TB – Trip blank This sample is collected only when samples for VOC analyses are collected. The trip blank is comprised of two 40 ml vials of Type II DI water for VOC analysis, which are included in every sample cooler containing samples for VOCs analysis. Trip blanks receive a unique sample number and are analyzed for VOCs:
o TB-MMDDYY-01, -02 etc.
MS/MSD – Matrix Spike/Matrix Spike Duplicate This sample consists of additional sample volumes for each type of analysis collected in separate bottle(s) from the actual sample. The amount of additional volume needed depends on the media being sampled. For sediment samples, three additional volumes are required. MS/MSDs require unique sample designation. MS/MSDs will be indicated by attaching ― – MSD ‖ at the end of the sample number.
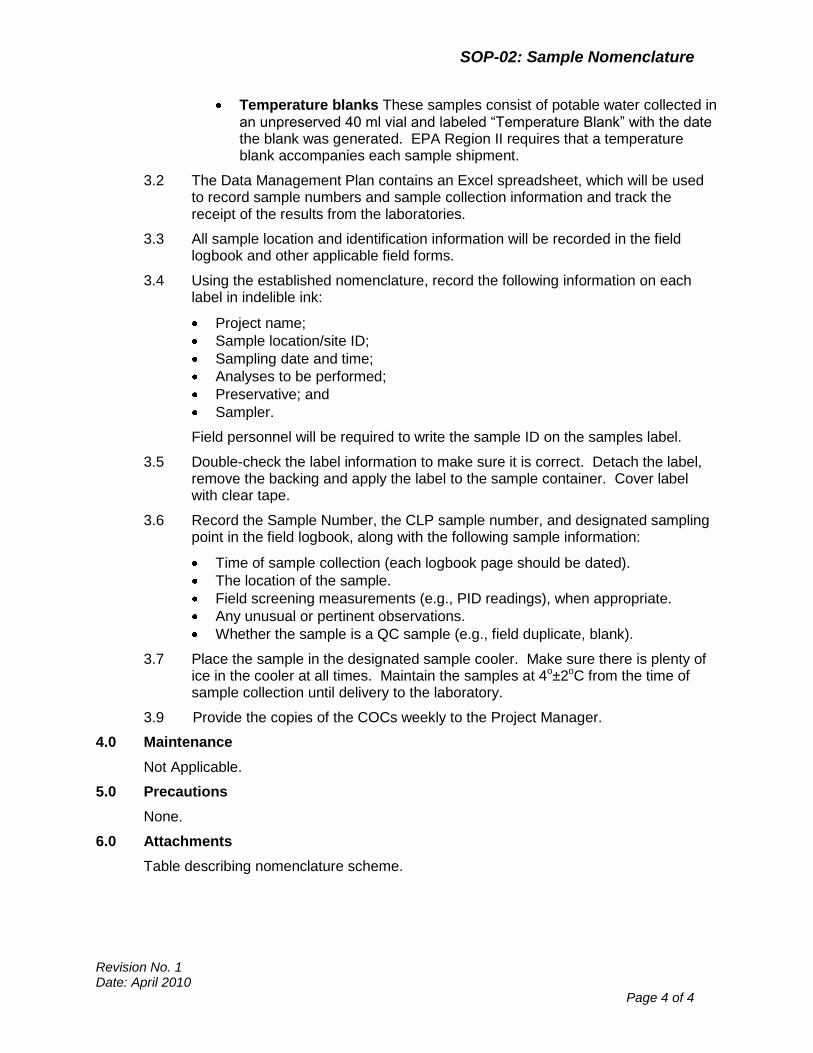
SOP-02: Sample Nomenclature
Revision No. 1 Date: April 2010
Page 4 of 4
Temperature blanks These samples consist of potable water collected in an unpreserved 40 ml vial and labeled ―Temperature Blank‖ with the date the blank was generated. EPA Region II requires that a temperature blank accompanies each sample shipment.
3.2 The Data Management Plan contains an Excel spreadsheet, which will be used to record sample numbers and sample collection information and track the receipt of the results from the laboratories.
3.3 All sample location and identification information will be recorded in the field logbook and other applicable field forms.
3.4 Using the established nomenclature, record the following information on each label in indelible ink:
Project name;
Sample location/site ID;
Sampling date and time;
Analyses to be performed;
Preservative; and
Sampler.
Field personnel will be required to write the sample ID on the samples label.
3.5 Double-check the label information to make sure it is correct. Detach the label, remove the backing and apply the label to the sample container. Cover label with clear tape.
3.6 Record the Sample Number, the CLP sample number, and designated sampling point in the field logbook, along with the following sample information:
Time of sample collection (each logbook page should be dated).
The location of the sample.
Field screening measurements (e.g., PID readings), when appropriate.
Any unusual or pertinent observations.
Whether the sample is a QC sample (e.g., field duplicate, blank).
3.7 Place the sample in the designated sample cooler. Make sure there is plenty of ice in the cooler at all times. Maintain the samples at 4o±2oC from the time of sample collection until delivery to the laboratory.
3.9 Provide the copies of the COCs weekly to the Project Manager.
4.0 Maintenance
Not Applicable.
5.0 Precautions
None.
6.0 Attachments
Table describing nomenclature scheme.
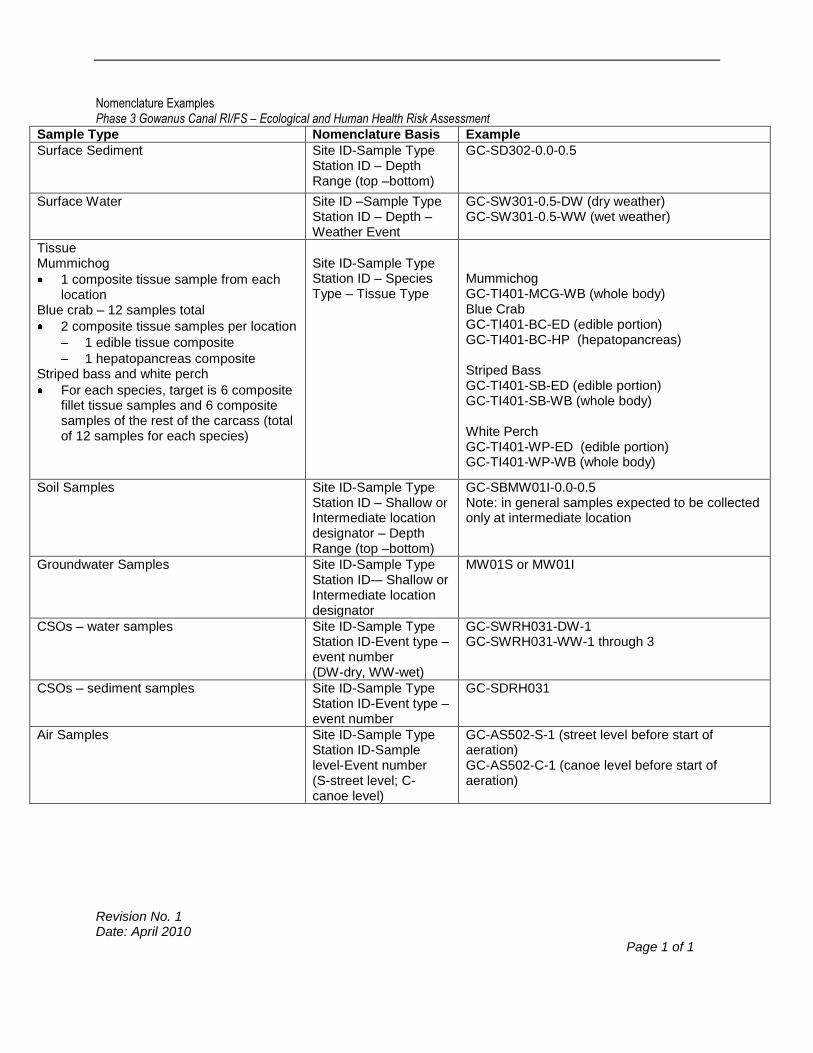
Nomenclature Examples Phase 3 Gowanus Canal RI/FS – Ecological and Human Health Risk Assessment
Sample Type Nomenclature Basis Example
Surface Sediment Site ID-Sample Type Station ID – Depth Range (top –bottom)
GC-SD302-0.0-0.5
Surface Water Site ID –Sample Type Station ID – Depth – Weather Event
GC-SW301-0.5-DW (dry weather) GC-SW301-0.5-WW (wet weather)
Tissue Mummichog
1 composite tissue sample from each location
Blue crab – 12 samples total
2 composite tissue samples per location
1 edible tissue composite
1 hepatopancreas composite Striped bass and white perch
For each species, target is 6 composite fillet tissue samples and 6 composite samples of the rest of the carcass (total of 12 samples for each species)
Site ID-Sample Type Station ID – Species Type – Tissue Type
Mummichog GC-TI401-MCG-WB (whole body) Blue Crab GC-TI401-BC-ED (edible portion) GC-TI401-BC-HP (hepatopancreas) Striped Bass GC-TI401-SB-ED (edible portion) GC-TI401-SB-WB (whole body) White Perch GC-TI401-WP-ED (edible portion) GC-TI401-WP-WB (whole body)
Soil Samples Site ID-Sample Type Station ID – Shallow or Intermediate location designator – Depth Range (top –bottom)
GC-SBMW01I-0.0-0.5 Note: in general samples expected to be collected only at intermediate location
Groundwater Samples Site ID-Sample Type Station ID-– Shallow or Intermediate location designator
MW01S or MW01I
CSOs – water samples Site ID-Sample Type Station ID-Event type – event number (DW-dry, WW-wet)
GC-SWRH031-DW-1 GC-SWRH031-WW-1 through 3
CSOs – sediment samples Site ID-Sample Type Station ID-Event type – event number
GC-SDRH031
Air Samples Site ID-Sample Type Station ID-Sample level-Event number (S-street level; C-canoe level)
GC-AS502-S-1 (street level before start of aeration) GC-AS502-C-1 (canoe level before start of aeration)
Revision No. 1 Date: April 2010
Page 1 of 1

SOP-03: CLP Laboratory Chain of Custody Procedures
Revision No.0 Date: February 2010
Page 1 of 2
STANDARD OPERATING PROCEDURE
CLP AND DESA LABORATORY
CHAIN-OF-CUSTODY PROCEDURES
1.0 Scope and Application
This Standard Operating Procedure (SOP) describes the use of the EPA CLP Chain-of-Custody (COC) forms for documenting and tracking organic and inorganic samples. These forms will be completed through the EPA FORMS II Lite Software. Refer to the software documentation for specific details on its application and for examples of the COC forms. The forms are used to ship samples to CLP laboratories.
2.0 Materials
2.0 EPA FORMS II Lite Software, Version 5.1 (or latest available version)
2.1 Laptop computer and laser printer (with printer labels)
2.2 Indelible black ink pen
3.0 Procedure
3.1 Enter the 5-digit case number provided by EPA's RSCC.
3.2 Give the project name, project code
3.3 Enter CH2M HILL Point of Contact (name and phone number).
3.4 Enter the names of the samplers.
3.5 List the sample number assigned by EPA (the CLP number), the sample number (see the sample nomenclature SOP), and any appropriate QC sample qualifier. Both the CLP sample number and the project-assigned sample number will be entered into the project database. The database can then be queried for strings of characters in the project-specific identifier (e.g., all soil samples from a
particular interval in all soil borings, all field rinse blanks, or other). Note that
EPA CLP numbers never utilize the letters “O, U, V, or I”, but do utilize the
numerals “1, and 0”.
3.6 Indicate the date of sample collection.
3.7 List the sampling times (24-hour format) for all samples.

Revision No.0 Date: February 2010
Page 2 of 2
3.8 Indicate "grab" or "composite" sample
3.9 Indicate the matrix sampled (e.g., soil, water)
3.10 Identify level of concentration (e.g., low, medium, or high)
3.11 Indicate the analyses per sample location.
3.12 Indicate whether the shipment for the sampling analysis is complete. Complete indicates that all shipments of samples to this laboratory under this CLP Case number are completed. No more samples will be shipped to the lab using this CLP Case number (e.g., if you are collecting samples tomorrow using this CLP Case number, the sampling is NOT complete).
3.13 List the preservation requirements for each analysis.
3.14 State the carrier service and air bill number, and analytical laboratory.
3.16 Upon completion of the form print one “Laboratory Copy” and place inside of the sample cooler to be sent to the designated CLP laboratory. Make a photo copy for project records.
3.17 Print one copy of the “Region Copy” to be faxed nightly to the EPA Sample Manager or RSCC and then sent as a hard copy with the end of sampling case CLP Case Report Summary. Make a photocopy for project records.
Note that the “Laboratory Copy” and “Region Copy” of the COC forms are formatted slightly differently and contain different information.
3.15 Sign, date, and time the "relinquished by" section on ALL copies of the COC’s.
4.0 Maintenance
Not Applicable.
5.0 Precautions
Sample personnel should be aware that a sample is considered to be in a person's custody if the sample is: (a) in a person's actual possession; (b) in view after being in a person's possession; (c) secured for storage such that no one can tamper with it after having been in their physical custody.
6.0 References
USEPA. Introduction to the CLP, EPA540-R-07-02, OSWER 9240.0-42, January 2007.
USEPA. CLP Guidance for Field Samplers, EPA 540-R-07-06, OSWER 540-R-07-06, Final, July 2007.
7.0 Attachments
None.
SOP-03a: Non CLP Laboratory Chain of Custody Procedures
Revision No. 0 Date: February 2010 Page 1 of 2
STANDARD OPERATING PROCEDURE
NON CLP LABORATORY
CHAIN-OF-CUSTODY PROCEDURES 1.0 Scope and Application
This Standard Operating Procedure (SOP) describes the use of the Chain-of-Custody (COC) forms for documenting and tracking organic and inorganic samples as well as samples sent for specialty analysis to subcontracted laboratories. The COC record will be completed by the Sample Management Coordinator. Field team staff may be requested to assist the Sample Management Coordinator.
2.0 Materials
1. Laboratory provided COC forms 2. Indelible black ink pen
3.0 Procedure
1. Enter Laboratory Quote Number (if applicable).
2. Enter the appropriate Project Number (To be provided).
3. Enter CH2M Hill’s Purchase Order Number.
4. Enter Project Name (Gowanus Cana).
5. Enter Company Name/CH2M HILL office.
6. Enter date samples are shipped / picked up by the laboratory.
7. Enter the name of actual person (Juliana Hess) receiving data.
8. Enter CH2M Hills Project Manager’s name (Juliana Hess).
9. Indicate the name of the person who should also receive a copy of the analytical data (Andy Judd).
10. Indicate to the laboratory the requested date when data package should be completed (turn around time)
11. Indicate the name of person or persons who collected the samples.
12. Indicate level of validation (Level III).
13. Indicate EDD is requested, Excel format.
14. Enter the sample identification number.
15. Enter sample matrix description (i.e., soil or water).
16. Enter sample type (i.e., grab or composite).
17. Indicate preservative added to sample.
18. Put an “X” in the box or boxes indicating the analysis requested.
19. Enter the date samples were collected.
20. Enter the time (in military time) samples were collected.
SOP-03a: Non CLP Laboratory Chain of Custody Procedures
Revision No. 0 Date: February 2010 Page 2 of 2
21. Enter any important information the laboratory should know about the sample / shipment (i.e., MS/MSD samples, trip blanks). The sample for MS/MSD should be indicated in the comments section of COC.
22. Do not indicate duplicate samples on Chain-of-Custody form or labels sent to the laboratory. Submit duplicate samples as “Blind” in accordance with the Sample Nomenclature SOP.
23. Sign, date, and time the “relinquished by” section.
24. If samples are shipped by carrier, indicate carrier name. A signature is not necessary, provided this COC is sealed inside cooler at the time it is relinquished to the carrier.
25. Obtain “Client” copy of COC prior to shipment of cooler.
26. All “Client” copies of COC’s will be filed in a project notebook kept on site for future reference.
4.0 Maintenance
Not Applicable.
5.0 Precautions
1. Sample personnel should be aware that a sample is considered to be in a person's custody if the sample is: (a) in a person's actual possession; (b) in view after being in a person's possession; (c) secured for storage such that no one can tamper with it after having been in their physical custody.
References
None.
Attachments
None.
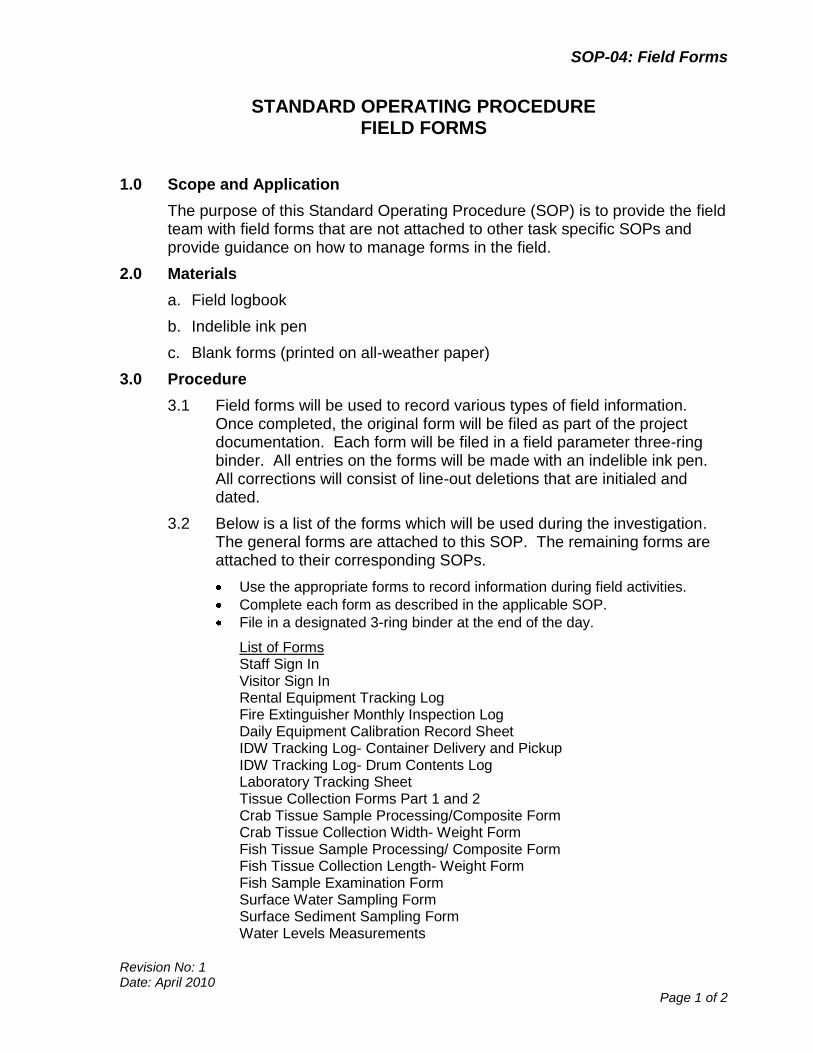
SOP-04: Field Forms
Revision No: 1 Date: April 2010
Page 1 of 2
STANDARD OPERATING PROCEDURE FIELD FORMS
1.0 Scope and Application
The purpose of this Standard Operating Procedure (SOP) is to provide the field team with field forms that are not attached to other task specific SOPs and provide guidance on how to manage forms in the field.
2.0 Materials
a. Field logbook
b. Indelible ink pen
c. Blank forms (printed on all-weather paper)
3.0 Procedure
3.1 Field forms will be used to record various types of field information. Once completed, the original form will be filed as part of the project documentation. Each form will be filed in a field parameter three-ring binder. All entries on the forms will be made with an indelible ink pen. All corrections will consist of line-out deletions that are initialed and dated.
3.2 Below is a list of the forms which will be used during the investigation. The general forms are attached to this SOP. The remaining forms are attached to their corresponding SOPs.
Use the appropriate forms to record information during field activities.
Complete each form as described in the applicable SOP.
File in a designated 3-ring binder at the end of the day.
List of Forms Staff Sign In Visitor Sign In Rental Equipment Tracking Log Fire Extinguisher Monthly Inspection Log Daily Equipment Calibration Record Sheet IDW Tracking Log- Container Delivery and Pickup IDW Tracking Log- Drum Contents Log Laboratory Tracking Sheet Tissue Collection Forms Part 1 and 2 Crab Tissue Sample Processing/Composite Form Crab Tissue Collection Width- Weight Form Fish Tissue Sample Processing/ Composite Form Fish Tissue Collection Length- Weight Form Fish Sample Examination Form Surface Water Sampling Form Surface Sediment Sampling Form Water Levels Measurements
SOP-04: Field Forms
Revision No: 1 Date: April 2010
Page 2 of 2
Low Flow Groundwater Sampling: Field Data Sheet Well Completion Diagram Soil Boring Log
4.0 Maintenance
Not Applicable.
5.0 Precautions
None.
6.0 References
None.
7.0 Attachments
Staff Sign-In Sheet Visitor Sign-In Sheet Rental Equipment Tracking Log Fire Extinguisher Inspection Log Daily Equipment Calibration Log (PID, GCI, Horiba) Drum Waste Tracking Log
Staff Sign-In
Gowanus Canal Remedial Investigation
Brooklyn, Kings County,
New York
Name (Print Legibly) Affiliation Date
Time Arrived at
Site
Time Departed
from Site Purpose of Visit / Comments
John Doe CH2M HILL 01/1/2010 0700 1700
Date: February 2010
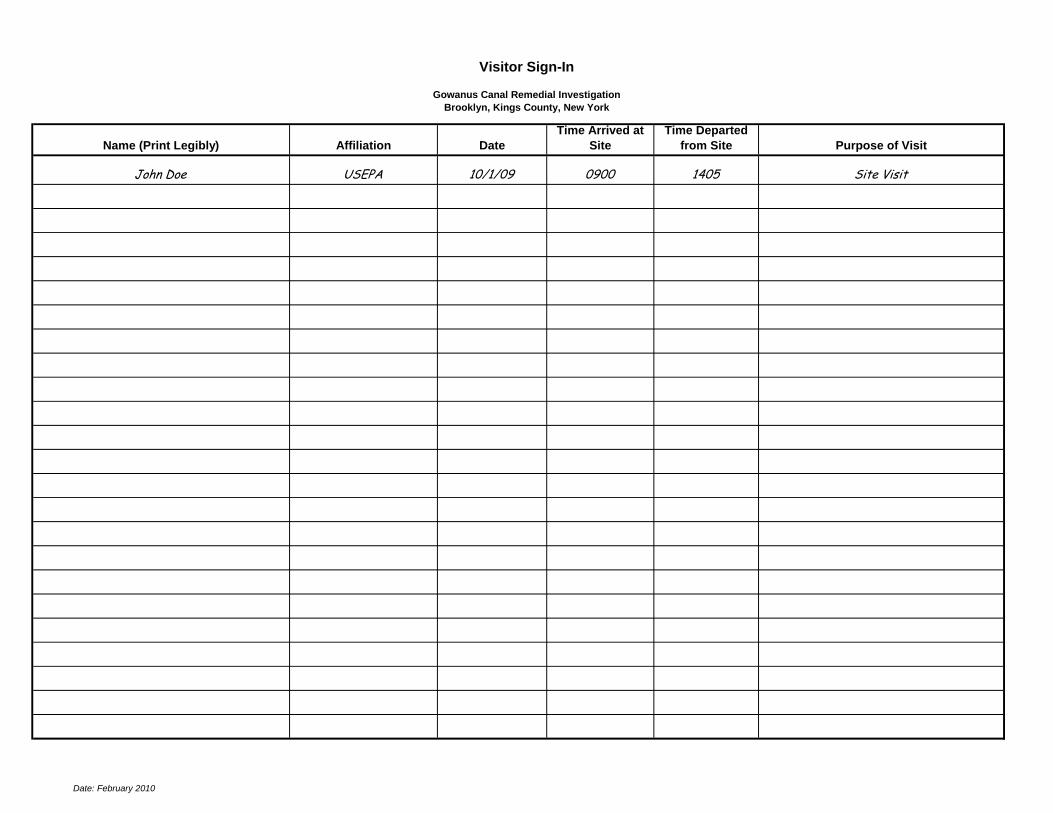
Visitor Sign-In
Gowanus Canal Remedial Investigation
Brooklyn, Kings County, New York
Name (Print Legibly) Affiliation Date
Time Arrived at
Site
Time Departed
from Site Purpose of Visit
John Doe USEPA 10/1/09 0900 1405 Site Visit
Date: February 2010
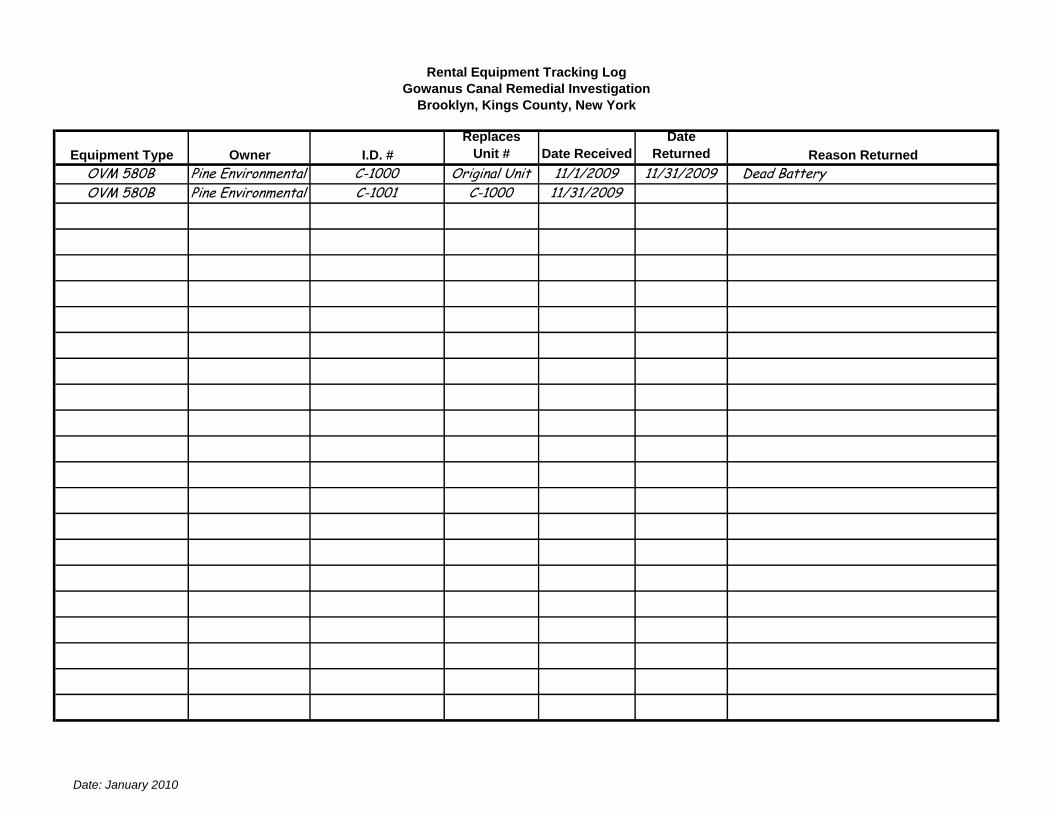
Equipment Type Owner I.D. #
Replaces
Unit # Date Received
Date
Returned Reason Returned
OVM 580B Pine Environmental C-1000 Original Unit 11/1/2009 11/31/2009 Dead Battery
OVM 580B Pine Environmental C-1001 C-1000 11/31/2009
Rental Equipment Tracking Log
Gowanus Canal Remedial Investigation
Brooklyn, Kings County, New York
Date: January 2010
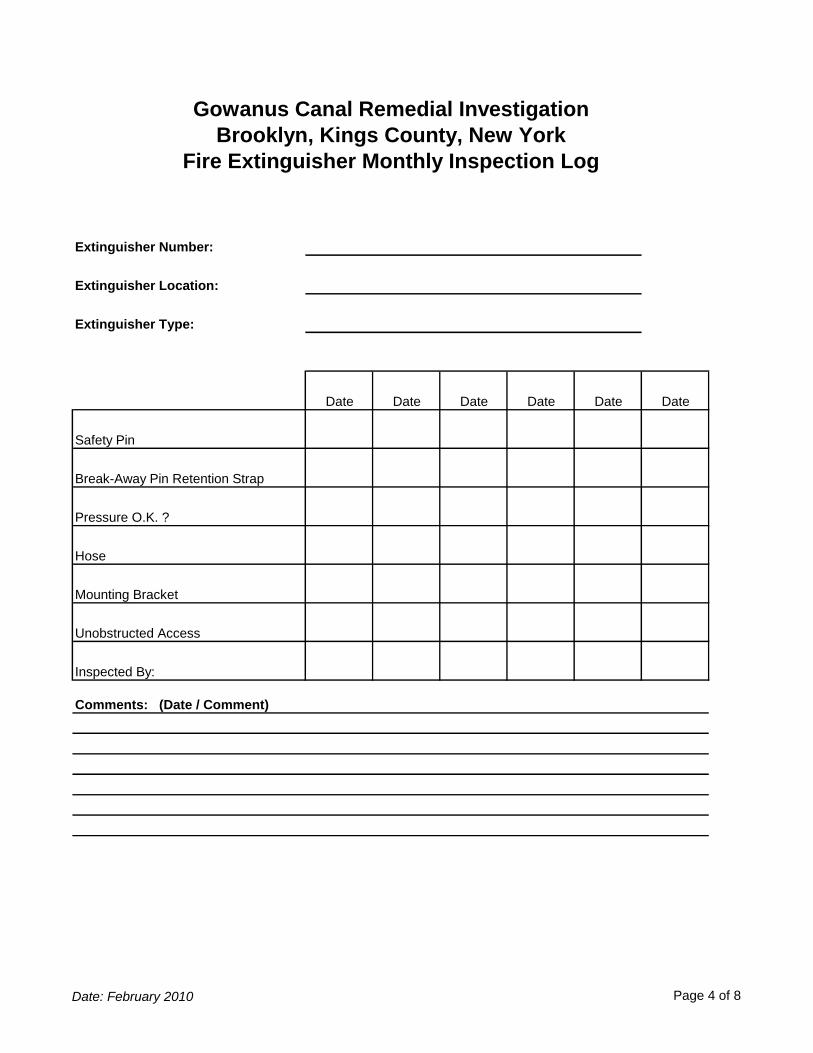
Extinguisher Number:
Extinguisher Location:
Extinguisher Type:
Date Date Date Date Date Date
Safety Pin
Break-Away Pin Retention Strap
Pressure O.K. ?
Hose
Mounting Bracket
Unobstructed Access
Inspected By:
Comments: (Date / Comment)
Gowanus Canal Remedial Investigation
Brooklyn, Kings County, New York
Fire Extinguisher Monthly Inspection Log
Date: February 2010 Page 4 of 8
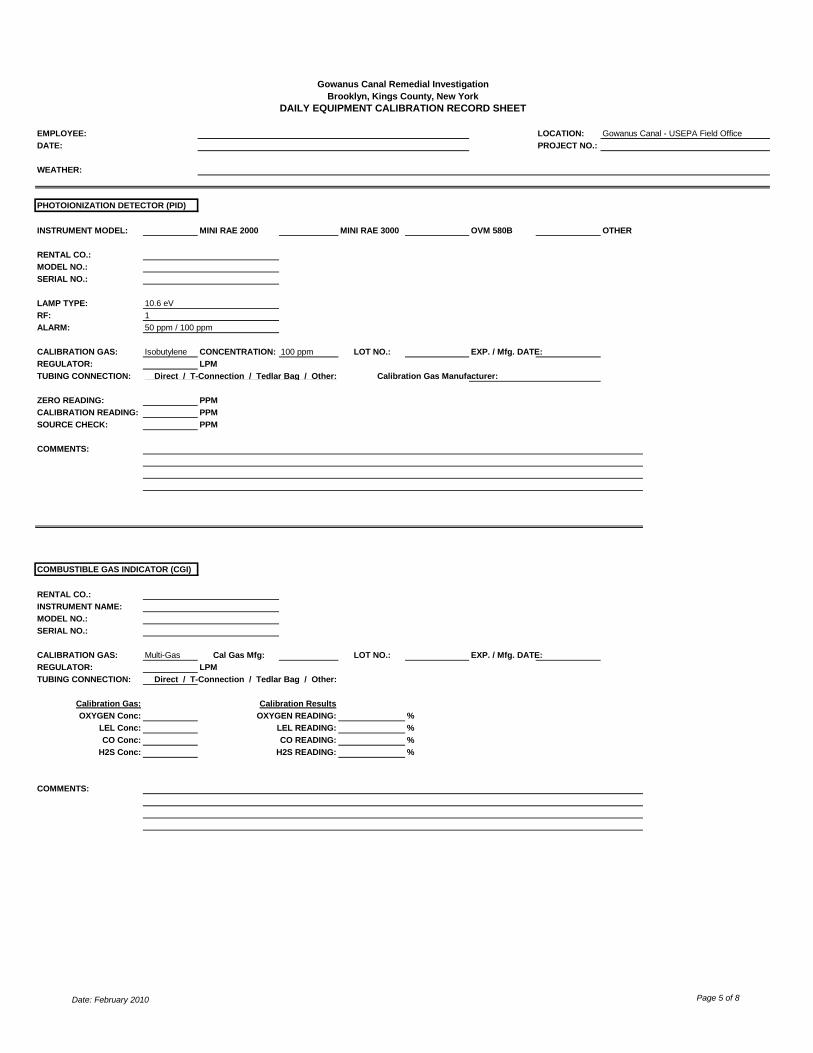
EMPLOYEE: LOCATION: Gowanus Canal - USEPA Field Office
DATE: PROJECT NO.:
WEATHER:
PHOTOIONIZATION DETECTOR (PID)
INSTRUMENT MODEL: MINI RAE 2000 MINI RAE 3000 OVM 580B OTHER
RENTAL CO.:
MODEL NO.:
SERIAL NO.:
LAMP TYPE: 10.6 eV
RF: 1
ALARM: 50 ppm / 100 ppm
CALIBRATION GAS: Isobutylene CONCENTRATION: 100 ppm LOT NO.: EXP. / Mfg. DATE:
REGULATOR: LPM
TUBING CONNECTION: Direct / T-Connection / Tedlar Bag / Other: Calibration Gas Manufacturer:
ZERO READING: PPM
CALIBRATION READING: PPM
SOURCE CHECK: PPM
COMMENTS:
COMBUSTIBLE GAS INDICATOR (CGI)
RENTAL CO.:
INSTRUMENT NAME:
MODEL NO.:
SERIAL NO.:
CALIBRATION GAS: Multi-Gas Cal Gas Mfg: LOT NO.: EXP. / Mfg. DATE:
REGULATOR: LPM
TUBING CONNECTION: Direct / T-Connection / Tedlar Bag / Other:
Calibration Gas: Calibration Results
OXYGEN Conc: OXYGEN READING: %
LEL Conc: LEL READING: %
CO Conc: CO READING: %
H2S Conc: H2S READING: %
COMMENTS:
Gowanus Canal Remedial Investigation
DAILY EQUIPMENT CALIBRATION RECORD SHEET
Brooklyn, Kings County, New York
Date: February 2010 Page 5 of 8

EMPLOYEE: LOCATION: Gowanus Canal - USEPA Field Office
DATE: PROJECT NO.:
WEATHER:
HORIBA U-22
RENTAL CO.: CALIBRATION SOLUTION MFR.:
MODEL NO.: CALIBRATION SOLUTION LOT NO.:
SERIAL NO.: CALIBRATION SOLUTION EXP. / MFG. DATE:
CALIBRATION PROCEDURE: AutoCalibrate
pH: Reading Units Std. Units Standard 4.0 Std. Units
Conductivity Reading Units Standard 4.49 mS/cm
Turbidity: Reading Units NTU Standard 0.0 NTU
Temperature: Reading UnitsoC Standard N/A (Ambient Air)
Dissolved Oxygen: Reading Units mg/L Standard N/A (Ambient Air)
ORP: Reading Units mV Standard N/A (Ambient Air)
COMMENTS:
CALIBRATION OK: Y / N
HORIBA U-10
RENTAL CO.: CALIBRATION SOLUTION MFR.:
MODEL NO.: CALIBRATION SOLUTION LOT NO.:
SERIAL NO.: CALIBRATION SOLUTION EXP. / MFG. DATE:
CALIBRATION PROCEDURE: AutoCalibrate
pH: Reading Units Std. Units Standard 4.0 Std. Units
Conductivity Reading Units Standard 4.49 mS/cm
Turbidity: Reading Units NTU Standard 0.0 NTU
Temperature: Reading UnitsoC Standard N/A (Ambient Air)
Dissolved Oxygen: Reading Units mg/L Standard N/A (Ambient Air)
COMMENTS:
CALIBRATION OK: Y / N
Gowanus Canal Remedial Investigation
Brooklyn, Kings County, New York
DAILY EQUIPMENT CALIBRATION RECORD SHEET
Revision No. 3
Date: February 2009 Page 1
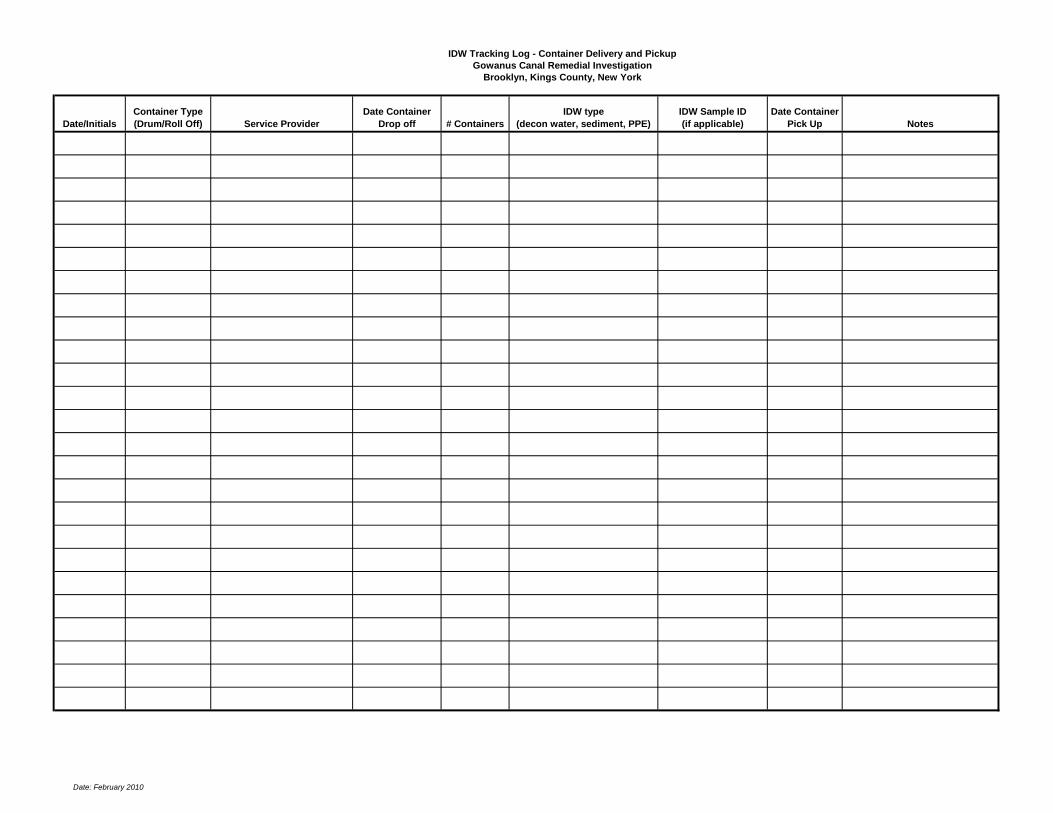
Date/Initials
Container Type
(Drum/Roll Off) Service Provider
Date Container
Drop off # Containers
IDW type
(decon water, sediment, PPE)
IDW Sample ID
(if applicable)
Date Container
Pick Up Notes
IDW Tracking Log - Container Delivery and Pickup
Gowanus Canal Remedial Investigation
Brooklyn, Kings County, New York
Date: February 2010

Date/Initials Drum No.
Contents -
sediment or water
Start date of
accumulation
End date of
accumulation
Description of wastes in drum
(e.g., core No. 1) Notes
IDW Tracking Log - Drum Contents Log
Gowanus Canal Remedial Investigation
Brooklyn, Kings County, New York
Date: February 2010
SOP-05: Sample Labeling, Packaging, Shipping
Revision No.: 1 Date: April 2010
Page 1 of 2
STANDARD OPERATING PROCEDURE SAMPLE LABELING, PACKAGING AND SHIPPING
1.0 Scope and Application
The purpose of this Standard Operating Procedure (SOP) is to describe protocols for the labeling, packaging and shipping of samples to the laboratory for analysis.
2.0 Materials
a. Waterproof hard plastic coolers
b. Metal paint cans
c. Sample labels from subcontracted laboratories, CLP labels, custody seals
d. Chain of custody forms from subcontracted laboratories and FORMS II LiteTM
software to prepare chain of custody forms for the CLP laboratories
d. Absorbent packing material
e. Ice
f. Dry Ice
g. Clear tape
h. Clear Ziploc bags
3.0 Procedure
3.1 Ensure sample lids are tight.
3.2 Place each sample in the shipping cooler as collected.
3.3 Place the following, properly filled-out, on each CLP laboratory sample bottle: CLP sample label generated by FORMS II LiteTM software.
3.4 Samples for archiving should be designated as “freeze and archive only” for the analysis type. The archive sample should be assigned the same organics CLP sample number as the parent sample.
3.5 If laboratory sample is destined for a non-CLP laboratory, place the completed subcontracted laboratory’s sample label on each bottle.
3.6 Place Custody Seal across the cap of each bottle.
3.7 Enclose each sample, properly identified and with a sealed lid, in a clear Ziploc bag, and make sure that sample labels are visible. Include the temperature blank in the cooler. Temperature blanks will be labeled as “Temperature Blank” and the date of the blank will be recorded on the label.
3.8 Add sufficient ice in cooler to maintain the internal temperature at 4o±2oC during transport. Double-bag and seal loose ice in Ziploc bags to prevent melting ice from soaking the packing material.
If dry ice is utilized to shipment of tissue samples, consult an appropriate dangerous goods handling specialist (e.g., Rob Strehlow/MKE) for instruction on the necessary packaging and labeling requirements.
SOP-05: Sample Labeling, Packaging, Shipping
Revision No.: 1 Date: April 2010
Page 2 of 2
3.9 Fill cooler with enough absorbent and packing material to prevent breakage of the sample bottles and to absorb the entire volume of the liquid being shipped (off site sample shipment only).
3.10 Any samples suspected to be of medium/high concentration (for example, NAPL free product samples) must be enclosed in a metal can with a sealable lid (e.g., clean paint cans). The samples should be cushioned inside the can with enough noncombustible, absorbent material (e.g., certified asbestos-free vermiculite) to prevent breakage and absorb leakage. Label the outer metal container with the sample number of the sample inside.
3.11 Samples collected which contain free product will be labeled and shipped in accordance to CH2M HILL’s Procedures for Shipping Dangerous Goods.
3.12 Affix the Chain of Custody form to the underside of the cooler lid. If more than one cooler is being used, a unique COC must be completed for each cooler and the samples contained therein.
3.13 Seal coolers at a minimum of two locations (e.g., opposite corners of the cooler) with signed custody seals and cover the seals with clear tape.
3.14 Tape the cooler shut with strapping tape over the hinges and place tape over the cooler drain. Do not obscure the custody seals.
3.15 Coolers containing tissue samples should be labeled with stickers indicating that the materials are “Perishable Goods”
3.16 Attach completed shipping label to the top of the cooler using wide clear tape.
3.17 Ship all samples via priority overnight delivery within 24 hours of collection (off site sample analyses only) or transport in cooler to on-site laboratory for analysis. Insure all sample shipments up to $1,000.
4.0 Maintenance
Not Applicable.
5.0 Precautions
None.
6.0 References
USEPA. Introduction to the CLP, EPA540-R-07-02, OSWER 9240.0-42, January 2007.
USEPA. CLP Guidance for Field Samplers, EPA 540-R-07-06, OSWER 540-R-07-06, Final, July 2007.
7.0 Attachments
None

Revison No.: 0 Date: February 2010
Page 1 of 59
SOP-07: Air Monitoring Equipment: PID, CGI, Aerosol, Draeger Tubes
STANDARD OPERATING PROCEDURE
AIR MONITORING EQUIPMENT (PID, CGI, AEROSOL, DRAEGER
TUBES)
1.0 Scope and Application
The purpose of this Standard Operating Procedure (SOP) is to generally describe the protocol for using an assortment of air monitoring instruments that will be used to evaluate environmental conditions and monitor for health and safety considerations. The instruments that will be used during the Remedial Investigation include Photoionization Devices (PID), Combustible Gas Indicators (CGI), Aerosol monitors (for airborne dust particulates), and Drager Tubes for determining vinyl chloride in ambient air. The following SOP provides a general introduction to the equipment and should be supplemented by referencing the equipment-specific operation and maintenance manuals provided by the manufacturer.
2.0 Materials
a. Specific piece of monitoring equipment b. Associated calibration equipment c. Power supply equipment (e.g., batteries or charging cords) d. Manufacturer’s equipment specific operation and maintenance manual
3.0 Procedure
3.1 The attached “HS&E Field Equipment Manual” produced by CH2M HILL’s health and safety department provides an overview of the operation and maintenance of PID and CGI air monitoring equipment. This document should be reviewed in conjunction with the equipment-specific operation and maintenance manuals provided by the manufacturer. Additionally, CH2M HILL’s site-specific Health and Safety Plan should be consulted for specific air monitoring requirements, calibration requirements, and action levels established for the Gowanus Canal site.
4.0 Maintenance
As prescribed by the equipment manufacturer.
5.0 Precautions
Avoid skin contact with calibration fluids.
6.0 References
Equipment Specific Operations and Maintenance Manuals CH2M HILL’s “HS&E Field Equipment Manual” CH2M HILL’s site-specific Health and Safety Plan for the Gowanus Canal Site
7.0 Attachments
Equipment Calibration Form CH2M HILL’s “HS&E Field Equipment Manual”

EMPLOYEE: LOCATION: Gowanus Canal Field Office
DATE: PROJECT NO.:
WEATHER:
PHOTOIONIZATION DETECTOR (PID)
INSTRUMENT MODEL: MINI RAE 2000 MINI RAE 3000 OVM 580B OTHER
RENTAL CO.:
MODEL NO.:
SERIAL NO.:
LAMP TYPE: 10.6 eV
RF: 1
ALARM: 10 ppm
CALIBRATION GAS: Isobutylene CONCENTRATION: 100 ppm LOT NO.: EXP. / Mfg. DATE:
REGULATOR: LPM
TUBING CONNECTION: Direct / T-Connection / Tedlar Bag / Other: Calibration Gas Manufacturer:
ZERO READING: PPM
CALIBRATION READING: PPM
SOURCE CHECK: PPM
COMMENTS:
COMBUSTIBLE GAS INDICATOR (CGI)
RENTAL CO.:
INSTRUMENT NAME:
MODEL NO.:
SERIAL NO.:
CALIBRATION GAS: Multi-Gas Cal Gas Mfg: LOT NO.: EXP. / Mfg. DATE:
REGULATOR: LPM
TUBING CONNECTION: Direct / T-Connection / Tedlar Bag / Other:
Calibration Gas: Calibration Results
OXYGEN Conc: OXYGEN READING: %
LEL Conc: LEL READING: %
CO Conc: CO READING: %
H2S Conc: H2S READING: %
COMMENTS:
Gowanus Canal Remedial Investigation
DAILY EQUIPMENT CALIBRATION RECORD SHEET
Revision No.: 3
Date: February 2009 Page 1 of 1
SOP-07: Air Monitoring Equipment: PID, CGI, Aerosol, Draeger Tubes
HS&E Field Equipment Manual
Contents
Direct Reading Instrumentation*
Photoionization Detectors TVA 1000 OVM Datalogger Mini Rae Multi Rae
Flame Ionization Detectors OVA 128 TVA 1000
Combustible Gas Indicator MSA Model 260, 261
Real-Time Aerosol Monitor MiniRAM
Colormetric Indicator Tubes Gastec Drager
Air Sampling Personal Sampling Area Sampling Sampling Supplies Sampling Equipment Organic Vapor Badges Calibration Procedures Sample Volume Field Blank Shipping Information
Occupational Exposure Limits
Background United States OELs International OELs OEL Types Immediately Dangerous to Life and Health
Sound Level Meters
Measurement procedures General Calibration Calibration Adjustments for Altitude Personal Measurement Procedures
Sampling Documentation
Log Books Sampling Forms
Chain of Custody Air Sampling Data Form
Page 1
3 4 6 8
12 17 18 22 24 26 27 28 30 31 32
33
33 33 33 34 34 34 35 36 36
37 37 37 37 38 39
40
40
40 41 41
42
42 43 43 46

Attachments
Direct Reading Data Form Air Sample Collection Form
PAGE 1
Direct-Reading Instruments Airborne contaminants can present a significant threat to worker health and safety. Reliable measurements of airborne contaminants are useful to:
Assess the potential health effects of exposure
Select personal protective equipment
Delineate areas where protection is needed and protective work zones
Determine the need for specific medical monitoring
Determine the most appropriate equipment for additional monitoring
Develop optimum sampling and analytical protocols
The two principal methods of evaluating air contaminants are direct-reading instruments and the collection of air samples for laboratory analysis.
Direct-reading instruments, also known as real-time monitors, are tools for detecting and quantifying gases, vapors, and aerosols. The monitors are referred to as “direct’ or “real-time” because they permit instantaneous or nearly immediate results. Air contaminants are sampled and analyzed within the instrument in a relatively short time. Each machine performs either active or passive sampling and measurement. Active sampling involves the collection of airborne contaminants via a forced movement of air such as with an air pump. Passive sampling is the collection of airborne contaminants at a rate controlled by a physical process such as diffusion through a static layer or permeation through a membrane without the forced movement of air.
Direct-reading instruments may be used to rapidly detect flammable or explosive atmospheres; oxygen deficiency; certain gases and vapors; and dust concentrations. Priorities for air monitoring shall be based on:
Monitoring for Immediately Dangerous to Life of Health (IDLH) conditions Air monitoring for IDLH atmospheres includes identifying conditions such as flammable or explosive atmospheres, oxygen-deficient environments, and highly toxic levels of airborne contaminants.
Exposure monitoring Exposure monitoring includes the characterization of chemical or physical agents to determine the type and extent of exposure. By comparing the data to occupational exposure limits or action levels, the worker protection plan can be developed.
Perimeter monitoring Perimeter monitoring measures the extent of contaminant migration away from the site or project area. These results help identify exclusion zone boundaries and any public health concerns. Perimeter monitoring will also measure airborne contaminant concentration from changes due to atmospheric conditions, work location, types of contaminants, or types of operation.
Direct-reading instruments range in size from small personal monitors to hand-held devices to large, complex installations. Most instruments indicate results through a digital or analog display. The measurement can be as specific as a single gas or vapor, certain categories of gases and vapors, or as non-specific as multiple gases and vapors. The health and safety coordinator will follow the
PAGE 2
instructions contained in the project-specific written safety plan, which will specify collecting samples in the breathing zone or general work area. The results can be reported as an instantaneous concentration or a time-weighted average. A variety of detection processes is used for gases and vapors including infrared (IR), ultraviolet (UV), flame ionization, photoionization, colorimetric, and electrochemical. Direct-reading instruments for aerosols operate using optical, electrical, resonance oscillation, and beta absorption.
Operators need to be familiar with the instrument’s operating procedures and limitations. The instrument manual has specific information concerning the instruments operation, calibration, and troubleshooting.
Advantages:
Perform both sampling and measurement; ideal for immediate data.
Eliminate lag time for lab to analyze samples.
Data-logging capabilities free the safety coordinator of manually recording data and allow for statistical analysis and graphic presentation.
Field monitoring instruments are usually lightweight, portable, rugged, temperature sensitive, and simple to operate and maintain.
Disadvantages:
There is no single instrument that can measure all contaminants in the air.
Instruments used for gases and vapors cannot be used for measuring aerosols.
In general, direct-reading instruments for aerosols cannot differentiate between types of aerosols.
Instrument performance and accuracy can be directly affected by environmental conditions.
Interference by similar compounds, resulting in false readings.
Calibrated using single standard and not for each gas, vapor, or aerosol measured.
Usually do not detect airborne concentration below 1 part per million (ppm).

PAGE 3
Photoionization Detectors (PID) The PID is a nonspecific survey instrument used to give qualitative information on the concentration and class of chemicals present in the air. The PID operates on the principle that most organic compounds and some inorganic compounds are be ionized when they are bombarded by high-energy ultraviolet light. These compounds absorb the energy of the light, which excites the molecule and results in a loss of electron and the formation of a positively charged ion. The number of ions formed and the ion current produced is directly proportional to mass and concentration. The amount of energy required to displace an electron is called ionization potential (IP). The air sample is drawn into a UV lamp using a pump or a fan. The energy of the lamp determines whether a particular chemical will be ionized. Each chemical compound has a unique ionizing potential. When the UV light energy is greater than the ionization potential of the chemical, ionization will occur. When the sample is ionized, the electrical signal is displayed on an analog or digital output. Although the output does not distinguish between chemicals, it does detect an increase in the ion current. If only one chemical is present in the air, it is possible to use PIDs quantitatively. Chemical structure and lamp intensity affects the sensitivity of the instrument to a given contaminant. All PID readings are relative to the calibration gas, usually isobutylene. It is important to calibrate the PID in the same temperature and elevation that the equipment will be used, and to determine the background concentrations in the field before taking measurements. For environments where background readings are high, factory zero calibration gas should be used.
Advantages
The ionization potential of atmospheric gases (nitrogen, oxygen, water, carbon monoxide, and carbon dioxide) and methane is greater than 12 eV, so ambient air constituents will not be affect measurement of airborne contaminants.
Can detect some inorganic compounds.
Many PID models have data-logging capabilities and data retrieval options.
Smaller, lighter models are being manufactured; one model can be mounted in a worker’s breathing zone.
Does not require carrier gases or fuel gases (hydrogen used in FIDs). Disadvantages
The PID does not distinguish between chemicals.
11.7 eV and 11.8 eV lamps have short usable lives due to window degradation caused by the effects of UV on the hygroscopic lithium fluoride.
Humidity, particulates, and hot and corrosive atmospheres adversely affect the PID.
PAGE 4
Water vapor can cause lamp fogging and deflect, scatter, or absorb light reducing contaminant ionization and resulting in lower meter readings.
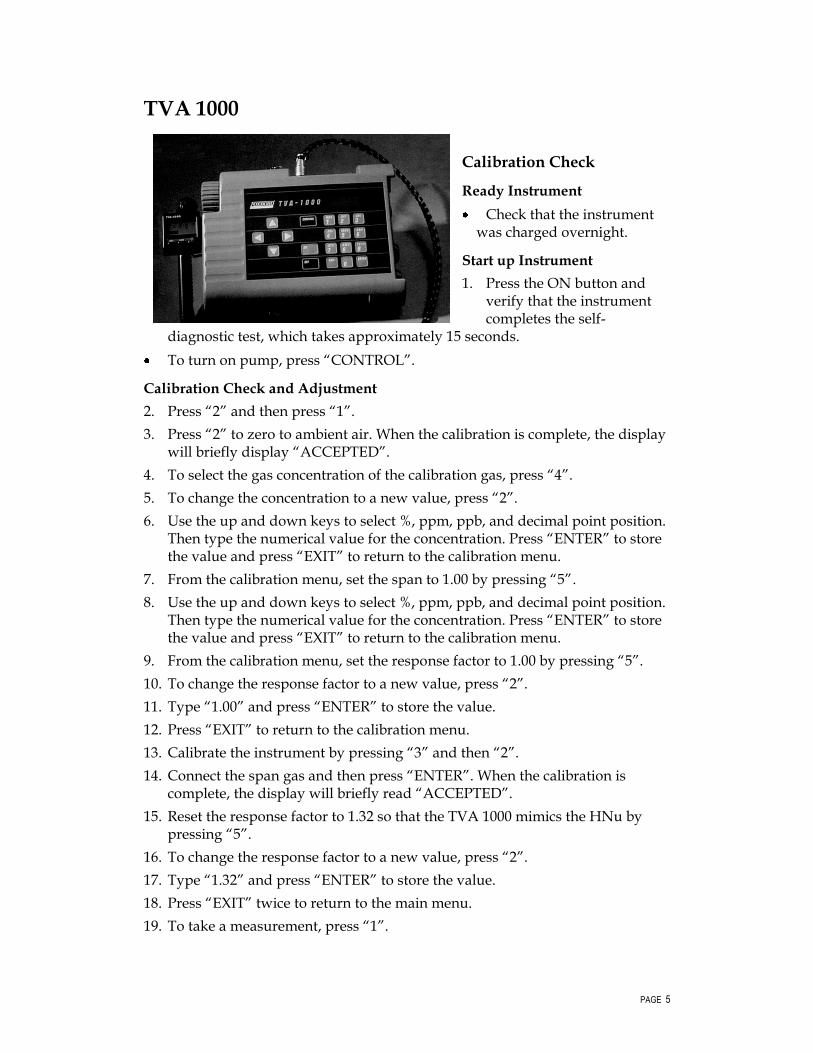
PAGE 5
TVA 1000
Calibration Check
Ready Instrument
Check that the instrument was charged overnight.
Start up Instrument
1. Press the ON button and verify that the instrument completes the self-
diagnostic test, which takes approximately 15 seconds.
To turn on pump, press “CONTROL”.
Calibration Check and Adjustment
2. Press “2” and then press “1”.
3. Press “2” to zero to ambient air. When the calibration is complete, the display will briefly display “ACCEPTED”.
4. To select the gas concentration of the calibration gas, press “4”.
5. To change the concentration to a new value, press “2”.
6. Use the up and down keys to select %, ppm, ppb, and decimal point position. Then type the numerical value for the concentration. Press “ENTER” to store the value and press “EXIT” to return to the calibration menu.
7. From the calibration menu, set the span to 1.00 by pressing “5”.
8. Use the up and down keys to select %, ppm, ppb, and decimal point position. Then type the numerical value for the concentration. Press “ENTER” to store the value and press “EXIT” to return to the calibration menu.
9. From the calibration menu, set the response factor to 1.00 by pressing “5”.
10. To change the response factor to a new value, press “2”.
11. Type “1.00” and press “ENTER” to store the value.
12. Press “EXIT” to return to the calibration menu.
13. Calibrate the instrument by pressing “3” and then “2”.
14. Connect the span gas and then press “ENTER”. When the calibration is complete, the display will briefly read “ACCEPTED”.
15. Reset the response factor to 1.32 so that the TVA 1000 mimics the HNu by pressing “5”.
16. To change the response factor to a new value, press “2”.
17. Type “1.32” and press “ENTER” to store the value.
18. Press “EXIT” twice to return to the main menu.
19. To take a measurement, press “1”.
PAGE 6
20. Calibration is complete
Troubleshooting
When the analyzer is operating, dust or other foreign matter could be drawn into the probe, forming deposits on the surface of the UV lamp or in the ion chamber. This condition is indicated by meter readings that are low, erratic, unstable, non-repeatable, drifting, or show apparent moisture sensitivity. These deposits interfere with the ionization process and cause erroneous readings. The probe filter should be used and cleaned after use in moist or dusty conditions. Check for this condition monthly or as required. Detailed instructions are in the Instruction Manual for the instrument.
For a low battery, recharge the instrument.
Drifting readings can mean that the lamp is dirty and needs to be cleaned.
Humidity can cause false readings.
High methane concentrations can result in false low readings of the PID.

PAGE 7
OVM Datalogger
Calibration Check
Ready Instrument
1. Check to see what lamp is in the instrument.
2. Power-up instrument by plugging in the power plug or the charger cable.
Start up Instrument
1. Press “ON/OFF” key to ignite lamp and initiate sample pump. The words “LAMP OUT” will be displayed until lamp is ignited.
Setting Zero
1. Press “MODE/STORE” key.
2. Using “-/CRSR” key, scroll through: “LOG THIS VALUE”-- “R/COMM”-- “CONC METER”-- “FREE SPACE”-- “RESET TO CALIBRATE.” Display should read “RF=1.00”.
3. If RF needs to be changed, hold down “RESET” while pressing “-/CRSR” to select cursor position. Then use “+/INC” key to set response factor (RF) to “1.00”. Release RESET key only when selection is made.
4. Using “-/CRSR” key, scroll to “LAMP.” Verify LAMP setting. If the setting needs to be changed, press “RESET”, press “+/INC” for 10.0 EV LAMP. Press “-/CRSR” for 11.8 EV LAMP. Press “RESET”.
5. Using “-/CRSR” key, scroll through “LAMP”-- “ALM”-- “AVERAGE”-- “LOC. CODE MODE”-- “AUTO LOGGING”-- “CONC METER”-- “FREE SPACE”. Display should read “RESET TO CALIBRATE”. Press “RESET” key.
6. Press “-/CRSR” in response to “RESTORE BACKUP” prompt.
7. Press “RESET” key. Instrument will zero to ambient air. (Note: Zero gas or a zero filter may be used to set the unit to an absolute zero -- connect prior to pressing “RESET” key.)
Calibration Check and Adjustment
1. Instrument should display “SPAN PPM = --- + TO CONTINUE”.
2. Press “RESET” and “-/CRSR” keys simultaneously to select cursor position.
3. Press “RESET” and “+/INC” keys simultaneously to scroll through preset SPAN values. Set SPAN = 100, which corresponds to the 100 ppm isobutylene.
4. When span has been entered, press “+/INC” key to continue.
5. Connect span gas cylinder. Turn valve on. Press “RESET” key.
PAGE 8
6. When finished calibrating, display will read “RESET TO CALIBRATE”. Press “MODE/STORE” key. Display should read about 100 ppm. Turn valve off. Disconnect span gas cylinder.
7. Calibration complete
Troubleshooting
When the analyzer is operating, dust or other foreign matter could be drawn into the probe, forming deposits on the surface of the UV lamp or in the ion chamber. This condition is indicated by meter readings that are low, erratic, unstable, non-repeatable, drifting, or show apparent moisture sensitivity. These deposits interfere with the ionization process and cause erroneous readings. The dust pre-filter should be replaced as needed.
If the battery is low, recharge the instrument.
Drifting readings can mean that the lamp is dirty and needs to be cleaned.
Humidity can cause false readings.
High methane concentrations can result in false low readings.
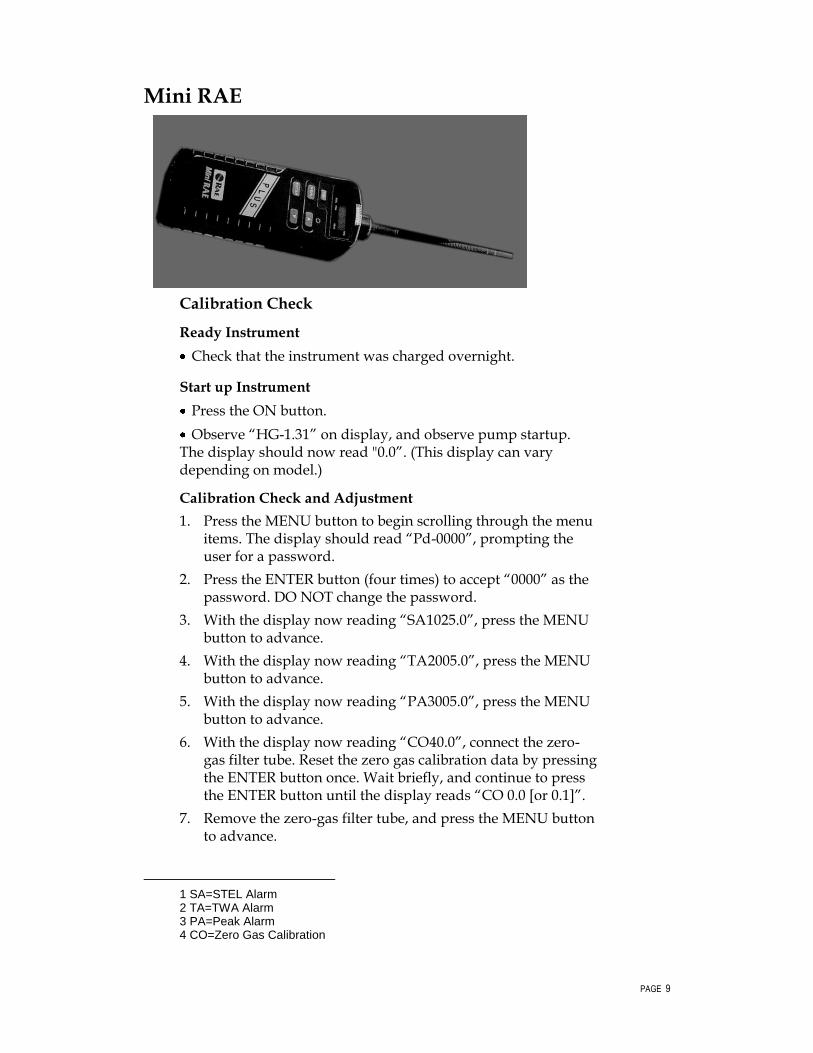
PAGE 9
Mini RAE
Calibration Check
Ready Instrument
Check that the instrument was charged overnight.
Start up Instrument
Press the ON button.
Observe “HG-1.31” on display, and observe pump startup. The display should now read "0.0”. (This display can vary depending on model.)
Calibration Check and Adjustment
1. Press the MENU button to begin scrolling through the menu items. The display should read “Pd-0000”, prompting the user for a password.
2. Press the ENTER button (four times) to accept “0000” as the password. DO NOT change the password.
3. With the display now reading “SA1025.0”, press the MENU button to advance.
4. With the display now reading “TA2005.0”, press the MENU button to advance.
5. With the display now reading “PA3005.0”, press the MENU button to advance.
6. With the display now reading “CO40.0”, connect the zero-gas filter tube. Reset the zero gas calibration data by pressing the ENTER button once. Wait briefly, and continue to press the ENTER button until the display reads “CO 0.0 [or 0.1]”.
7. Remove the zero-gas filter tube, and press the MENU button to advance.
1 SA=STEL Alarm 2 TA=TWA Alarm 3 PA=Peak Alarm 4 CO=Zero Gas Calibration
PAGE 10
8. The display will read “Clu 100.0”. To make instrument mimic the HNu, change the standard calibration gas value by pressing ENTER to scroll left to right. Change the flashing
numbers as needed by pressing the “ ” or “ ” buttons. The display should read “Clu 53.0”.
9. Once the ENTER key is pressed the fourth time to accept the calibration gas value, the display will read “GAS On”.
10. Connect the 100-ppm isobutylene calibration gas with 0.5-LPM regulator with direct tubing or 1.5-LPM regulator and T-tubing, and press the ENTER button.
11. The display will read “CAL” for about 30 seconds, and then will read “Cl 100.0 [+5ppm]”, indicating standard calibration gas value.
12. If the displayed result is not acceptable, continue to press the ENTER button to return to the calibration data to accept the displayed result.
13. Press the MENU button to exit calibration procedure, and disconnect the calibration gas.
14. Continue to press the MENU button to scroll through the “Clr ALL”, Hr xx.xx” for changes to time, and “dA xx.xx” for changes to date displays. The display should read “0.0” once the user has scrolled through and exited the above menu items.
15. Calibration complete
Troubleshooting Troubleshooting Data
Problem Possible Reasons Possible Solutions
1. Cannot turn on power after charging the battery
a. Bad battery connection
Check battery connection
b. Discharged battery Charge or replace the battery
c. Defective battery Reset microprocessor by disconnecting, then reconnecting the battery
d. Microprocessor hang-up
If unit is Mini RAE “Plus,” check white switch between changing and RS232 ports
2. No LED or LCD back light
e. Defective LED or LCD back light
Call authorized service center
3. Buzzer inoperative
f. Bad buzzer Call authorized service center
PAGE 11
Troubleshooting Data
Problem Possible Reasons Possible Solutions
4. Reading abnormally high
g. Dirty or wet sensor Clean sensor module
h. Dirty probe assembly
Clean probe assembly
i. Dirty membrane filter
Replace membrane filter
Use water trap disk
5. Reading abnormally low
j. Lamp dirty or weak Clean or replace lamp
6. "Err xxx.x" message during operation
k. Dirty sensor Clean sensor
l. Weak or defective lamp
Replace lamp, filter
7. Read a small background value
m. There is actually a background gas level
Do zero-gas calibration
n. Instrument zero drift
8. Reading jumps randomly
o. Incorrect gas calibration
Recalibrate Change filters Clean lamp
p. Low sensitivity to cal gas
Use different cal gas
9. Slow response to gas input
q. Leakage in probe as-sembly or sensor module
Tighten the probe assembly and sensor module
Make sure “O” rings are present
10. No air draw at gas inlet tube
r. Defective pump or leakage in probe assembly and sensor module
Replace pump, tighten the probe assembly and sensor module
Make sure “O” rings are present
11. "Lo bAt" message at power on
s. Discharged battery Recharge battery
12. Cannot turn off unit or corrupted characters in LCD display
t. Microprocessor hang-up
Disconnect and reconnect battery
Reload software from PC
13. Full-scale measurement in humid environment
u. Dirty or wet sensor Clean and dry sensor Use water trap disk
to block out moisture
PAGE 12
Troubleshooting Data
Problem Possible Reasons Possible Solutions
14. Measurement max out at certain level
v. Dirty lamp/sensor module
Clean lamp/sensor module
w. Weak lamp Replace new lamp
15. Calibration error message
x. No standard gas input
Make sure standard gas flows into inlet probe
y. Low sensitivity to cal gas
Change calibration gas
Make sure calibration gas is attached during calibration
PAGE 13
Multi RAE
Calibration Check
For Multi RAE configured with O2, LEL, H2S, CO, sensors and a 10.6eV PID Lamp.
Start up Instrument
Press Mode button
Observe displays:

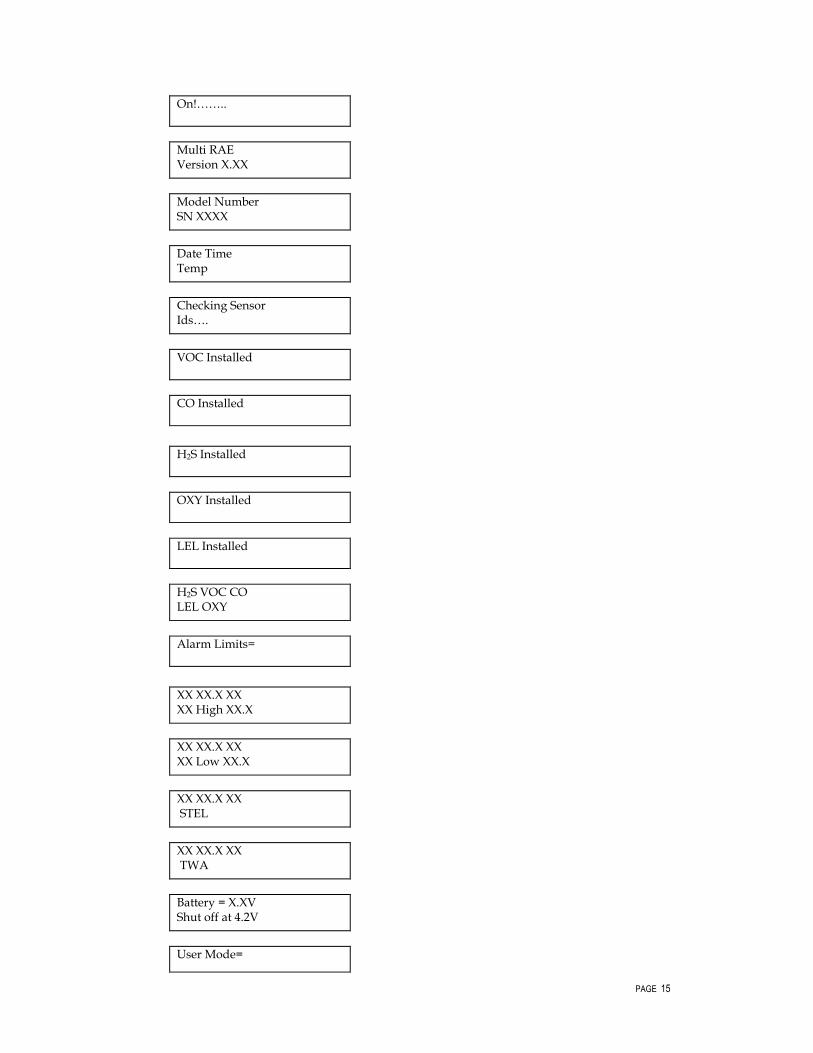
PAGE 15
On!……..
Multi RAE Version X.XX
Model Number SN XXXX
Date Time Temp
Checking Sensor Ids….
VOC Installed
CO Installed
H2S Installed
OXY Installed
LEL Installed
H2S VOC CO LEL OXY
Alarm Limits=
XX XX.X XX XX High XX.X
XX XX.X XX XX Low XX.X
XX XX.X XX STEL
XX XX.X XX TWA
Battery = X.XV Shut off at 4.2V
User Mode=
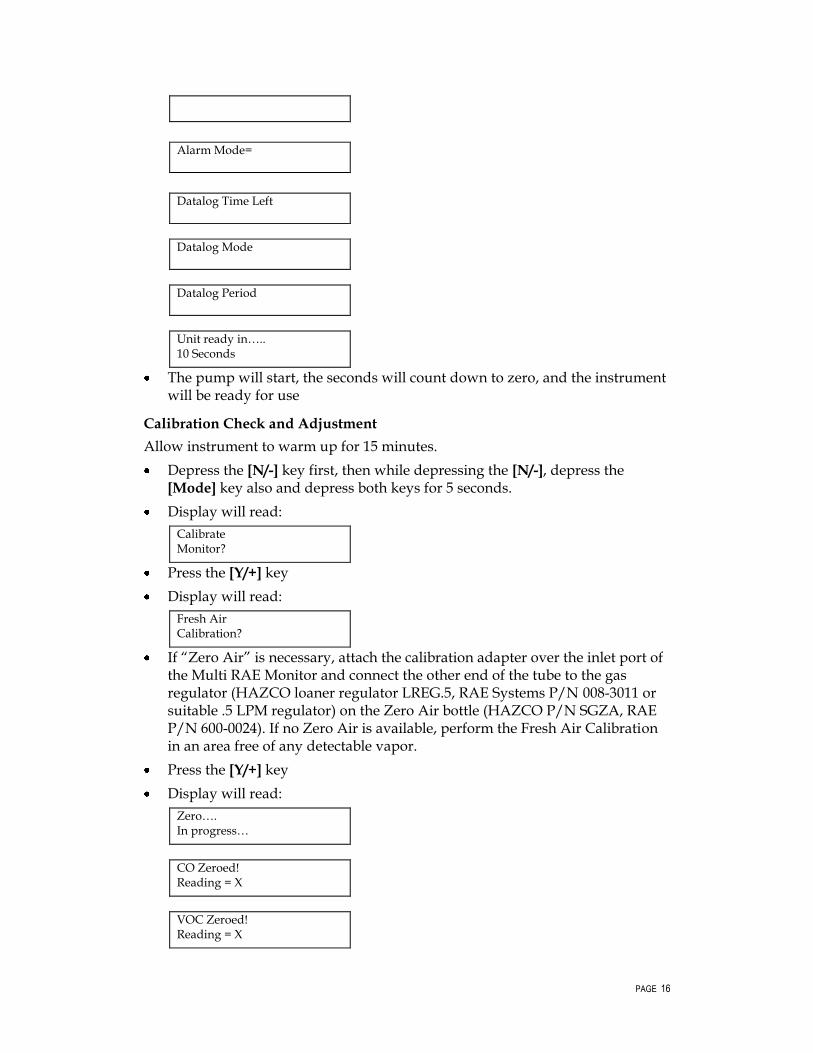
PAGE 16
Alarm Mode=
Datalog Time Left
Datalog Mode
Datalog Period
Unit ready in….. 10 Seconds
The pump will start, the seconds will count down to zero, and the instrument will be ready for use
Calibration Check and Adjustment
Allow instrument to warm up for 15 minutes.
Depress the [N/-] key first, then while depressing the [N/-], depress the [Mode] key also and depress both keys for 5 seconds.
Display will read:
Calibrate Monitor?
Press the [Y/+] key
Display will read:
Fresh Air Calibration?
If “Zero Air” is necessary, attach the calibration adapter over the inlet port of the Multi RAE Monitor and connect the other end of the tube to the gas regulator (HAZCO loaner regulator LREG.5, RAE Systems P/N 008-3011 or suitable .5 LPM regulator) on the Zero Air bottle (HAZCO P/N SGZA, RAE P/N 600-0024). If no Zero Air is available, perform the Fresh Air Calibration in an area free of any detectable vapor.
Press the [Y/+] key
Display will read:
Zero…. In progress…
CO Zeroed! Reading = X
VOC Zeroed! Reading = X
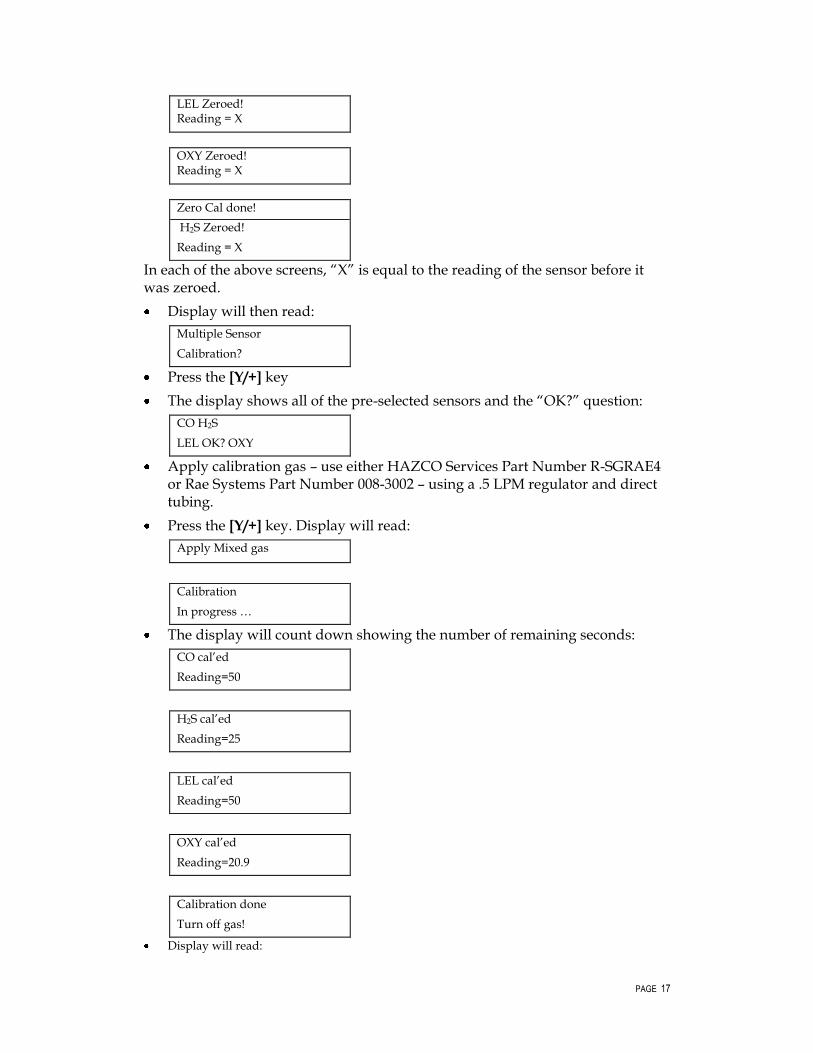
PAGE 17
LEL Zeroed! Reading = X
OXY Zeroed! Reading = X
Zero Cal done!
H2S Zeroed!
Reading = X
In each of the above screens, “X” is equal to the reading of the sensor before it was zeroed.
Display will then read:
Multiple Sensor
Calibration?
Press the [Y/+] key
The display shows all of the pre-selected sensors and the “OK?” question:
CO H2S
LEL OK? OXY
Apply calibration gas – use either HAZCO Services Part Number R-SGRAE4 or Rae Systems Part Number 008-3002 – using a .5 LPM regulator and direct tubing.
Press the [Y/+] key. Display will read:
Apply Mixed gas
Calibration
In progress …
The display will count down showing the number of remaining seconds:
CO cal’ed
Reading=50
H2S cal’ed
Reading=25
LEL cal’ed
Reading=50
OXY cal’ed
Reading=20.9
Calibration done
Turn off gas!
Display will read:
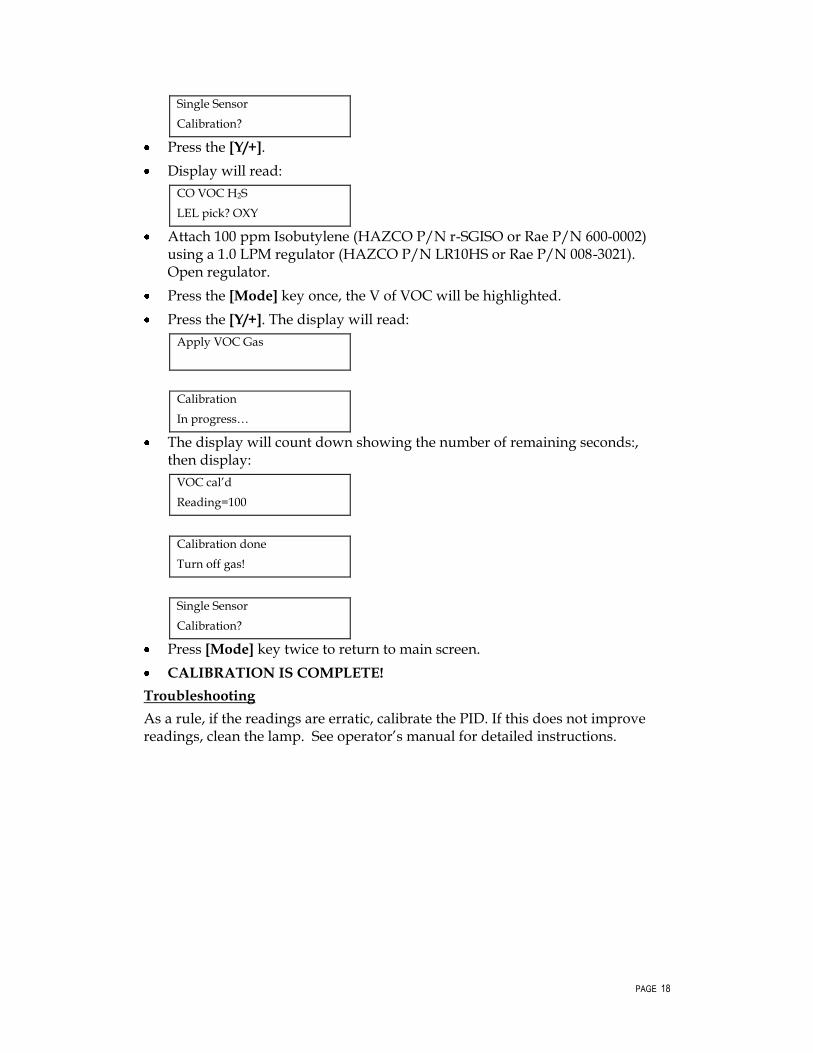
PAGE 18
Single Sensor
Calibration?
Press the [Y/+].
Display will read:
CO VOC H2S
LEL pick? OXY
Attach 100 ppm Isobutylene (HAZCO P/N r-SGISO or Rae P/N 600-0002) using a 1.0 LPM regulator (HAZCO P/N LR10HS or Rae P/N 008-3021). Open regulator.
Press the [Mode] key once, the V of VOC will be highlighted.
Press the [Y/+]. The display will read:
Apply VOC Gas
Calibration
In progress…
The display will count down showing the number of remaining seconds:, then display:
VOC cal’d
Reading=100
Calibration done
Turn off gas!
Single Sensor
Calibration?
Press [Mode] key twice to return to main screen.
CALIBRATION IS COMPLETE!
Troubleshooting
As a rule, if the readings are erratic, calibrate the PID. If this does not improve readings, clean the lamp. See operator’s manual for detailed instructions.
PAGE 19
Flame Ionization Detectors (FID) Portable FIDs use a hydrogen flame as the means to produce ions, instead of the ultraviolet light used by the PID. FIDs are used in similar situations as a PID, but they respond to a greater number of organic chemicals than PIDs and are linear over a greater range. The sensitivity of the FID to vapors depends on the energy required to break chemical bonds. Like the PID and ionization potentials, the FID will vary depending on a particular chemical. The detector response is proportional to the number of molecules, but the relationship is not linear and is skewed with organic compounds containing oxygen, nitrogen, sulfur, or chlorine. The FID uses a burner assembly in which hydrogen is mixed with the incoming sample gas stream, and this is fed into the jet where ignition occurs. The organic chemicals present in the gas stream form carbon ions. Positively charged carbon ions are collected on a negatively charged electrode. The current generated is proportional to the number of ions and concentration. Measurements using the FID are relative to the factory calibration gas, usually methane. Before field operation, FIDs should be calibrated with a known methane concentration within the concentration range expected in the field. Once the meter is turned on and stable for at least one minute, the flame can be ignited. After lighting, the meter may be unstable, but should stabilize within 15 minutes. The FID can be zeroed in the field using the most sensitive setting and a background reading obtained. If clean, ambient air is not available for background readings, an activated charcoal filter can be attached to the sample inlet to remove all hydrocarbons except methane and ethane. FIDs have inlet particulate filters that prevent large particles from entering the combustion chamber and should be changed frequently.
Advantages:
The FID is less sensitive to humidity than the PID.
The FID is insensitive to ambient gases (water, nitrogen, oxygen, and most inorganic compounds, and has a negligible response to carbon monoxide and carbon dioxide) making the FID extremely useful in the analysis of atmospheric samples.
If only one organic contaminant is present, it may be possible to quantify the contaminant if the FID has been calibrated for that specific contaminant.
The molecular size of methane is too small to be trapped in the charcoal filter. In a case where the instrument is showing high readings in the field but methane is suspect, the charcoal filter can be placed on the sample inlet. Any other contaminants should be trapped. If the major contaminant is methane, then the reading will not show a significant change. If the reading drops notably, then another contaminant is present in substantial amounts.
Disadvantages:
The FID responds to methane but does not distinguish between methane and other gases.
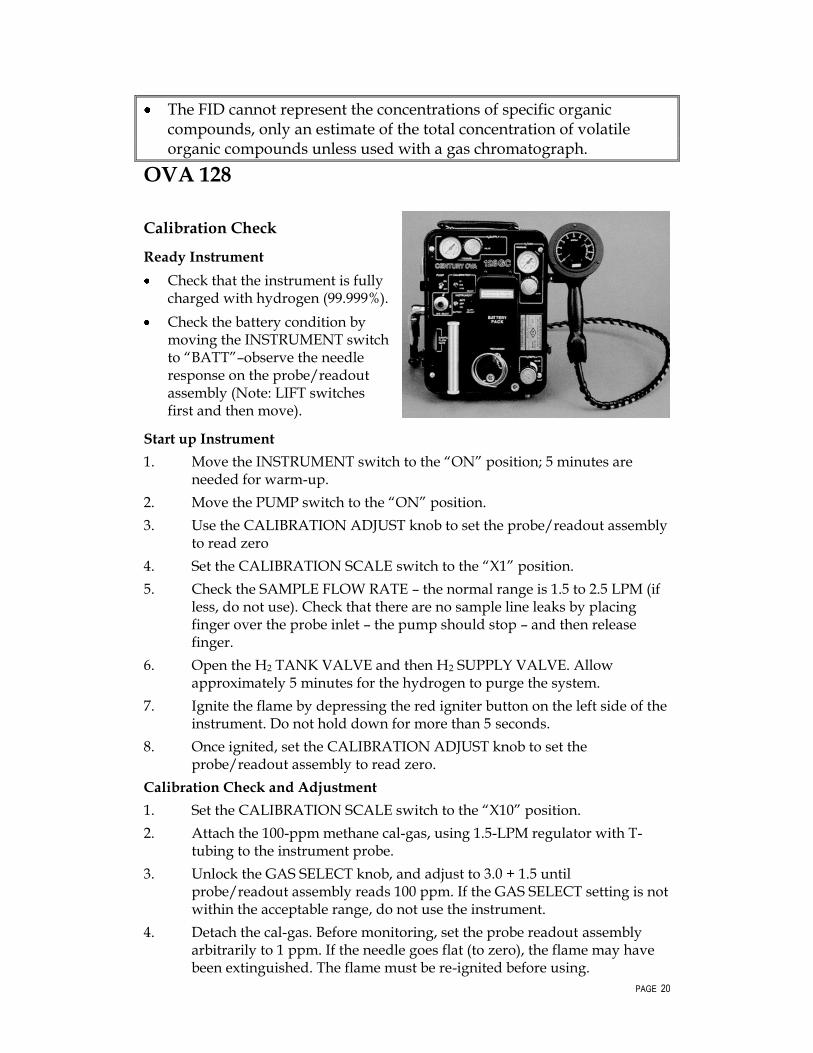
PAGE 20
The FID cannot represent the concentrations of specific organic compounds, only an estimate of the total concentration of volatile organic compounds unless used with a gas chromatograph.
OVA 128
Calibration Check
Ready Instrument
Check that the instrument is fully charged with hydrogen (99.999%).
Check the battery condition by moving the INSTRUMENT switch to “BATT”–observe the needle response on the probe/readout assembly (Note: LIFT switches first and then move).
Start up Instrument
1. Move the INSTRUMENT switch to the “ON” position; 5 minutes are needed for warm-up.
2. Move the PUMP switch to the “ON” position.
3. Use the CALIBRATION ADJUST knob to set the probe/readout assembly to read zero
4. Set the CALIBRATION SCALE switch to the “X1” position.
5. Check the SAMPLE FLOW RATE – the normal range is 1.5 to 2.5 LPM (if less, do not use). Check that there are no sample line leaks by placing finger over the probe inlet – the pump should stop – and then release finger.
6. Open the H2 TANK VALVE and then H2 SUPPLY VALVE. Allow approximately 5 minutes for the hydrogen to purge the system.
7. Ignite the flame by depressing the red igniter button on the left side of the instrument. Do not hold down for more than 5 seconds.
8. Once ignited, set the CALIBRATION ADJUST knob to set the probe/readout assembly to read zero.
Calibration Check and Adjustment
1. Set the CALIBRATION SCALE switch to the “X10” position.
2. Attach the 100-ppm methane cal-gas, using 1.5-LPM regulator with T-tubing to the instrument probe.
3. Unlock the GAS SELECT knob, and adjust to 3.0 + 1.5 until probe/readout assembly reads 100 ppm. If the GAS SELECT setting is not within the acceptable range, do not use the instrument.
4. Detach the cal-gas. Before monitoring, set the probe readout assembly arbitrarily to 1 ppm. If the needle goes flat (to zero), the flame may have been extinguished. The flame must be re-ignited before using.
PAGE 21
Troubleshooting
Troubleshooting Data
Problem Possible Procedure Possible Solution
1. Low sample flow rate on flow indicator
a. Check Teflon tubing on valve assembly for kinks, etc.
Straighten or replace Teflon tubing.
b. Check flow rate with valve in down position.
Check for over-restriction of charcoal filter.
2. Hydrogen flame will not light
a. Check column connections on top of unit to make sure they are tight.
Tighten fittings.
b. Check column for sharp bends or kinks. (Hydrogen flows through this column at all times, and a sharp bend will compact packing too tightly for proper hydrogen flow.)
Replace column.
c. Check charcoal filter fittings to make sure they are tight.
Tighten fittings.
d. Check hydrogen flow rates from the column.
Adjust hydrogen pressure to obtain 12-cm3/min flow rate.
e. Check that the inject and backflush valves are both completely in or out. A partially activated valve will block the hydrogen and airflow paths.
Ensure both valves are either completely in or out.
PAGE 22
Troubleshooting Data
Problem Possible Procedure Possible Solution
f. If a new column was installed prior to identifying the problem, check for proper hydrogen flow rate through the column (should be approximately 12 cm/min).
Increase hydrogen pressure to obtain proper hydrogen flow rate, or if column is excessively restrictive, replace or repack the column.
g. Allow time for hydrogen to reach ionization chamber.
Wait several minutes before igniting flame.
3. Ambient background reading in clean environment is too high
a. Check for contamination in charcoal filter assembly. This can be detected if ambient reading increases when going into the chro-matographic mode.
Replace activated charcoal in charcoal filter assembly.
b. Check for contamination in column.
Replace or clean column.
c. Check for contamination in column valve assembly.
Remove valve stems and wipe with clean lint-free cloth. Heat valve assembly during operation to vaporize and remove contaminants.
4. Flame-out when operating either valve
a. Ensure valves are being operated with a quick, positive motion.
Operate valve with a positive motion.
b. Either hydrogen or air may be leaking around one or more of the valve quad rings. Assess by tests and O-ring inspection.
Remove stems and lightly coat with silicone grease, only on contact surface of the O-ring. Wipe off excess (do not remove quad rings).
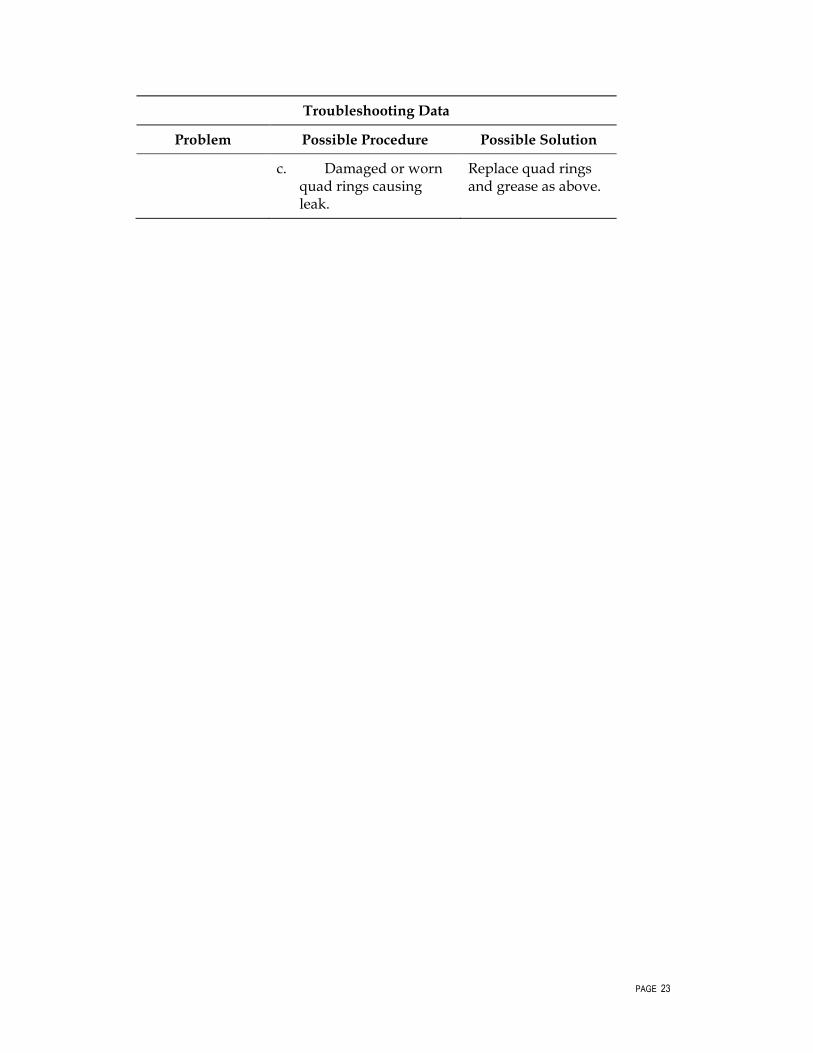
PAGE 23
Troubleshooting Data
Problem Possible Procedure Possible Solution
c. Damaged or worn quad rings causing leak.
Replace quad rings and grease as above.

PAGE 24
TVA 1000 Calibration Check
Ready Instrument
Check that the instrument was charged overnight.
Check that the cylinder is fully charged with hydrogen (99.999%).
Start up Instrument
1. Press the ON button and verify that the instrument completes
the self-diagnostic test, which takes approximately 15 seconds.
2. To turn on pump, press “CONTROL”.
3. Press “1” to turn on pump.
4. To ignite the flame, open the hydrogen valve on the side of the instrument and wait 30 seconds. Press “CONTROL” and then “2”. After “2” has been pressed, the main menu will be displayed.
Calibration Check and Adjustment
1. Press “2” and then press “1”.
2. Press “2” to zero to ambient air. When the calibration is complete, the display will briefly display “ACCEPTED”.
3. To select the gas concentration of the calibration gas, press “4”.
4. To change the concentration to a new value, press “3”.
5. Use the up and down keys to select %, ppm, ppb, and decimal point position. Then type the numerical value for the concentration. Press “ENTER” to store the value and press “EXIT” to return to the calibration menu.
6. From the calibration menu, set the span to 1.00 by pressing “5”.
7. To change the response factor to a new value, press “3”.
8. Type “1.00” and press “ENTER” to store the value.
9. Press “EXIT” to return to the calibration menu.
10. Calibrate the instrument by pressing “3” twice.
11. Connect the span gas and then press “ENTER”. When the calibration is complete, the display will briefly display “ACCEPTED”.
12. Press “EXIT” to return to the main menu.
13. To take a measurement, press “1”.
Troubleshooting
When the analyzer is operating, dust or other foreign matter could be drawn into the probe, forming deposits on the surface of the UV lamp or in the ion chamber. This condition is indicated by meter readings that are low, erratic, unstable, non-
PAGE 25
repeatable, drifting, or show apparent moisture sensitivity. These deposits interfere with the ionization process and cause erroneous readings.
If the battery is low, recharge the instrument.
Fill the hydrogen tank by attaching the filling hose. Bleed the hose before filling or you will get high background readings.
Charcoal filters are used to screen methane. Your action levels are based on non-methane readings, so you need to use the difference between the readings with and without the filter.
PAGE 26
Combustible Gas Indicator (CGI)
Combustible gas instruments were the first direct-reading instruments to be developed. British miners used CGIs to detect methane in underground mines. Today CGIs are used to measure gases in confined spaces and atmospheres containing flammable and combustible gases and vapors. The instruments measure the presence of flammable and combustible gases in percentage of lower explosion limit (LEL). The CGI is primarily a safety meter used to detect hazardous condition concentrations up to 100% of the LEL. When 100% of the LEL is reached, flammable or explosive concentrations are present. CGIs cannot be used to determine compliance with occupational exposure limits.
Most CGIs in use today operate based on catalytic combustion. The air containing the contaminant passed over a heated catalytic filament, which is incorporated into a Wheatstone Bridge. A Wheatstone Bridge is a circuit that measures the differential resistance in an electric current. The catalytic sensor contains two filaments; one is coated with a catalyst (usually platinum) to facilitate oxidation or combustion of very low concentrations of a gas. The other filament, the compensating filament, operates at the same voltage as the catalyst, but does not cause oxidation and therefore does not increase in temperature.
The other common method of operation for CGIs is based on thermal conductivity, which uses the specific heat of combustion of a gas or vapor as a measure of its concentration in air. This method is not sensitive to low concentrations of gases. Typical applications include pipeline leaks, tank farms, and landfills.
All CGI readings are relative to the calibration gas (either methane, propane, pentane, or hexane). CGIs should be calibrated under the same conditions as those in the field. The response of the instrument should be within the manufacturer’s acceptable limits.
CGIs should always be used in conjunction with oxygen sensors. CGIs that use a catalytic sensor, require the sample air to be oxidized or burned on the filament. If the concentration of oxygen in the ambient air is too low, the measurement will be too low. The oxygen concentration should be measured first, since the CGI performance depends on oxygen availability.
Active CGIs use a small pump to pull the atmospheric sample through a filter and then into a manifold block in which the oxygen sensor and combustible gas diffusion head are mounted. Passive CGIs use the diffusion principle to carry the atmospheric sample to the sensors.
Advantages:
Small, hand-held.
Can be calibrated for a single vapor or known mixtures.

PAGE 27
Disadvantages:
Not specific.
Give false indication of safety when oxygen concentration is less than 8%.
Does not give ppm measurements.
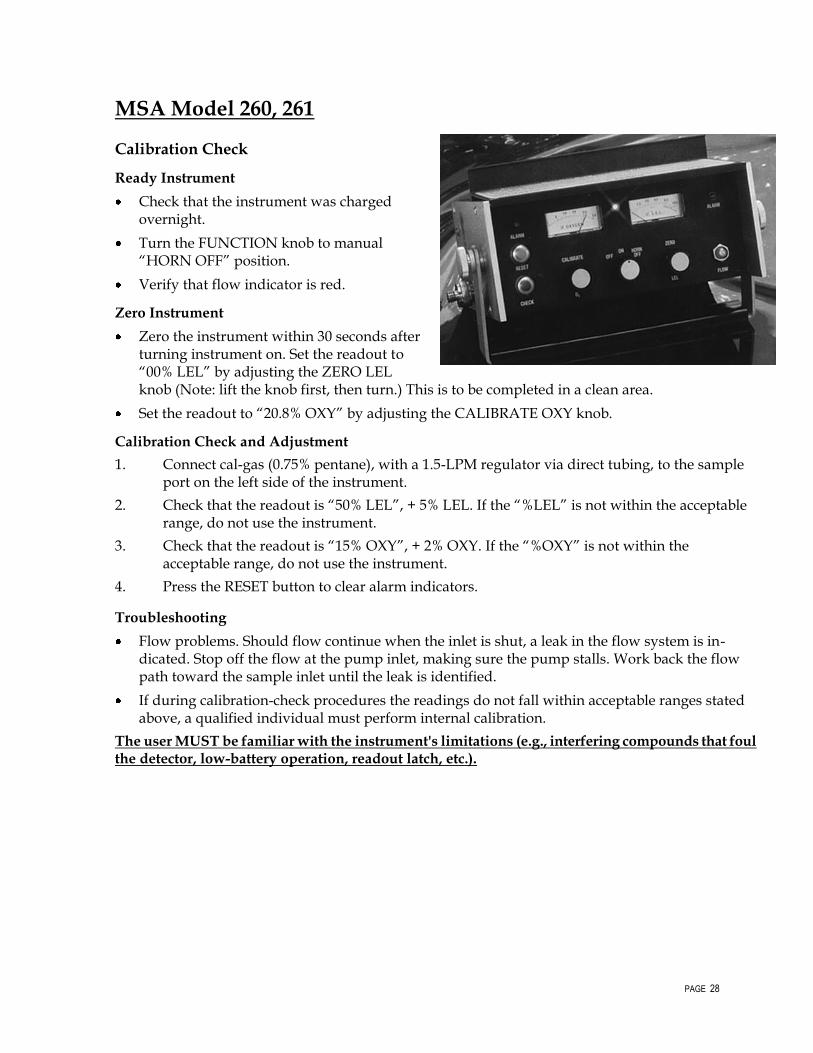
PAGE 28
MSA Model 260, 261
Calibration Check
Ready Instrument
Check that the instrument was charged overnight.
Turn the FUNCTION knob to manual “HORN OFF” position.
Verify that flow indicator is red.
Zero Instrument
Zero the instrument within 30 seconds after turning instrument on. Set the readout to “00% LEL” by adjusting the ZERO LEL knob (Note: lift the knob first, then turn.) This is to be completed in a clean area.
Set the readout to “20.8% OXY” by adjusting the CALIBRATE OXY knob.
Calibration Check and Adjustment
1. Connect cal-gas (0.75% pentane), with a 1.5-LPM regulator via direct tubing, to the sample port on the left side of the instrument.
2. Check that the readout is “50% LEL”, + 5% LEL. If the “%LEL” is not within the acceptable range, do not use the instrument.
3. Check that the readout is “15% OXY”, + 2% OXY. If the “%OXY” is not within the acceptable range, do not use the instrument.
4. Press the RESET button to clear alarm indicators.
Troubleshooting
Flow problems. Should flow continue when the inlet is shut, a leak in the flow system is in-dicated. Stop off the flow at the pump inlet, making sure the pump stalls. Work back the flow path toward the sample inlet until the leak is identified.
If during calibration-check procedures the readings do not fall within acceptable ranges stated above, a qualified individual must perform internal calibration.
The user MUST be familiar with the instrument's limitations (e.g., interfering compounds that foul the detector, low-battery operation, readout latch, etc.).
PAGE 29
Real-Time Aerosol Monitor
Direct-reading field instruments for aerosols can determine total mass, total count, and particle size distribution. The most popular direct-reading aerosol monitors are light scattering devices that operate by illuminating an aerosol as it passes through a chamber and by measuring the light scattered by all the particles. When particles are drawn into the instrument, the intensity of the light scattered into the detector can be used to estimate concentration. As the number of particles increases, the light reaching the detector increases. The amount of light scattered by a particle into the detector depends on the size, shape and refractive index of the particle.
The MiniRAM is an airborne particulate monitor whose operating principle in based on the detection of scattered electromagnetic radiation in the near infrared. The MiniRAM is a light scattering aerosol monitor, i.e.; the instrument continuously senses the combined scattering from the particles present. The instrument should be positioned vertically to minimize potential particle deposition within the sensing chamber. The MiniRAM should be factory calibrated periodically, and is field calibrated using the Z-Bag. The MiniRAM is placed inside the Z-Bag, which provides a clean-air environment. The MiniRAM can be used to measure the concentration of all forms of aerosol: dusts, fumes, smokes, fogs, etc. MiniRAM provides a data logging system, with several of print outs of zero or measured data.
Advantages:
Easy to use.
Instantaneous readout.
Permit measurement of the principal characteristics of liquid and solid particles in an unaltered airborne state.
Capable of measuring particle concentrations in air as low as a fraction of a milligram at the appropriate sampling rate.
The rate at which air passes through the sensor does not influence the indicated concentration. Flow rate only influences response time.
Can run without a time limit through an A/C line, using the charger that is provided.
Small and light so it works well as a personal monitor, but the MiniRAM may also be used as an area monitor for both indoor and ambient air situations.
Disadvantages:
Rechargeable Ni-Cd batteries can provide power up to 8.5 hours, but the device sometimes does not fully charge (although a full charge is indicated) and shuts off during sampling.
Illumination and detection lenses, windows in sensing chamber, and interior walls may become contaminated with particles, causing inaccuracy in measurements.
All stored data will be lost if batteries are disconnected.
Unable to measure particle sizes (i.e. respirable fraction).
PAGE 30
MiniRAM
Calibration Check
Ready Instrument
Check that the instrument was charged overnight.
Start up Instrument
If the miniRAM shows a blanked display, press OFF and wait until the display reads “OFF”, before pressing MEAS to initiate measurement cycle.
If the miniRAM shows “OFF”, press MEAS directly to initiate measurement cycle.
Concentration display that changes or “blinks” once every 10 seconds indicate the miniRAM is in the measurement mode.
Calibration Check and Adjustment
1. Remove rubber bulb filter assembly from Z-Bag. Place Z-Bag on flat surface with red flow fitting facing up. Flatten bag. Remove small plastic cap from flow fitting on bag.
2. Insert ribbed elbow connector into red flow fitting of plastic bag, until connector is flush with bottom of red flow fitting.
3. MiniRAM should be in its OFF condition. If display is blanked, or if miniRAM is in the MEAS mode, key OFF.
4. Open Z-Bag and place miniRAM inside, approximately at its center.
5. Key ZERO through the open end of the Z-BAG. Immediately zip closed the Z-bag and begin to pump hand bulb.
6. Z-Bag should inflate as hand pumping continues, up to a height of about 5 inches. Continue pumping gently to maintain bag interior pressure, until the miniRAM displays OFF again.
7. Unzip Z-Bag and remove miniRAM. MiniRAM is now ready for monitoring.
8. Place rubber bulb/filter assembly inside Z-Bag, and plug small plastic cap into flow fitting to close it. Zip close while flattening Z-Bas to store it to ensure cleanliness of the bag interior.
Troubleshooting
1. No response when OFF key is pressed, display remains blank
a. Batteries exhausted, recharge battery pack. If after charging, unit still does not function, check the following:
b. Measure output of battery charger. A voltmeter should read about 24.5 Vac.
c. Of charger is ok, remove battery pack and slightly separate 2 gray connectors. Attach voltmeter + lead to red wire and – lead to black wire. Voltmeter should read about 8.5 Vdc. while plugged into the charger.
PAGE 31
d. If battery pack is ok, check the fuse on the circuit board. Fuse is located 3/8 inch behind analog output jack and is designated F on the circuit board. Leaving the – lead of the voltmeter connected to the battery pack use + lead to check voltage on both sides of fuse. Voltage should be the same as in C above. If not, fuse must be replaced. This is preferably done at the factory.
2. Unit constantly displays .0.3-
This indicates electronic component failure. Unit should be sent back to MIE for repair and recalibration.
3. Improper display segments appear
Usually an indication that the circuit board and/or display board has been contaminated. This may be corrected by removing the battery pack and cleaning affected areas with a small brush. Do not use any cleaning fluids or solvents on circuit board. If brushing does not correct problem unit should be sent to MIE for repair.
4. Pressing TWA, ID, TIME, keys, etc. during MEAS mode causes unit to shut off
a. Keypad failure: Unit should be sent for repair
b. Display board contamination: clean board as in 3 above.
PAGE 32
Colorimetric Indicator Tubes Colorimetric or detector indicator tubes, are the mostly widely used direct reading devices due to their ease of use, minimum training requirements, fast on-site results, and wide range of chemical sensitivities. A detector tube is a hermetically sealed glass tube containing an inert solid or granular material, such as silica gel, alumina, pumice, or ground glass. The inert material is impregnated with one or more reagents that change color when they react with a chemical or group of chemicals. The reagents are selected for specific chemicals or group of chemicals and may vary by manufacturer. When exposed to the contaminant, a chemical reaction causes a color change that is proportional to the concentration of the contaminant. The tubes are scribed with gradations to note the length of the stain to decipher the concentration. Most tubes are marked in ppm and can be read directly, but some scales require a conversion. The manufacturer usually packs ten tubes per box and marks the tubes with the expiration date, which is usually one to three years. Some tubes suggest special storage specifications such as refrigeration.
Pumps must be leak tested before each use and periodically sent to the manufacturer for flow testing. To take a sample, the sealed ends of the tube are broken off and the tube is attached to the correct pump (the tubes and the pump must be from the same manufacturer). Air is drawn through the tube at a set flow rate and number of strokes. Selecting the orifice size sets the flow rate. Pumps draw a preset volume with each stroke; the number of strokes will be indicated in the manufacturer instructions. Adequate time must be left between strokes to allow the pump to completely fill with air. Time depends on the orifice size and the type of detector tube.
Advantages:
Simple to operate.
Inexpensive.
Quick results.
Correction factors are usually included in the instruction sheet to use when environmental conditions are abnormal.
Disadvantages:
Environmental conditions (temperature, pressure, and relative humidity) may affect accuracy.
Field measurements can vary as much as 25%.
Interference of other chemicals may cause false readings.

PAGE 33
Gastec
Calibration Check Ready Instrument Perform leak check by placing an unopened tube into
socket and attempting to draw air by stoking the pump once. If the white disk, flow indicator, does not appear after 10-15 minutes, the lead check is complete. If leak check is successful, sampling may begin.
Gastec contaminate specific tubes must be used. Inside the package of tubes, specific instructions will be given as to the number of strokes needed and the allowable time limits.
Sampling Procedures 1. Using the built in tube breaker, break both ends from the tube. Use caution with
broken glass. 2. Confirm the pump handle is fully pushed in and then insert the detector tube into the
rubber flange of the pump with the arrow on the tube pointing toward the pump. 3. Align the correct volume selection mark on the pump handle with alignment mark on
pump body. 4. Firmly pull out the handle fully (for 100 ml sampling) or halfway (for 50 ml sampling)
along the guideline to the lock position according to tube instructions. 5. Wait until sampling time has elapsed. A small white disc will become visible in the
flow finish indicator in the handle when sampling is completed. The white indicator or the flow finish indicator is pulled in by the vacuum generated in the pump cylinder. It pops out when the prescribed volume has been fully sampled.
6. Repeat above step if multiple strokes are needed. 7. When finished with strokes, remove the tube from the pump and read the value at the
end of color stain according to tube instructions. Troubleshooting Never modify or disassemble pump sections, such actions may invalidate warranty
conditions. Primary causes of air leaks within the pump are loosened inlet clamping nut, damaged or
deteriorated rubber inlet, and discolored lubricant or insufficient lubricant. Contact manufacturer to help determine if replacement parts should be ordered or if service is needed.

PAGE 34
Drager
Calibration Check Ready Instrument Perform pump leak test by insert unopened tube into socket, squeeze
pump completely and release. Pump is adequately leak-proof if the end-of-stroke indicator had not appeared after 15 minutes.
Drager contaminate specific tubes must be used. Inside the package of tubes, specific instructions will be given as to the number of strokes needed and the allowable time limits.
Sampling Procedures 1. Using the built in tube breaker, open both tips of the tube. 2. Reset the stroke counter to “0”. 3. Insert tube into pump, the arrow must point towards the pump. 4. Squeeze pump completely and release. When the end-of-stroke indicator appears,
squeeze pump completely again. Repeat until the number on the stroke counter corresponds to that given in the instructions for use.
5. Evaluation of the results in accordance with the instructions for use of the tube in question.
6. Remove used tube from socket. 7. Flush pump with a few pump strokes in clean air.
Troubleshooting If leak is detected, inspect socket for damages or cracking socket. Replacement sockets
and exhaust valves can be purchased and replaced as needed.

PAGE 35
Air Sampling Air sampling refers to the use of an air sampling pump and collection media (or other appropriate means) to obtain air samples of contaminants of concern. The air-sampling pump causes air to be drawn through the collection media at a constant, predetermined flow rate. Samples must later be run through a separate analysis process in order to determine contaminant concentrations. Results are typically reported as a time-weighted average, the generic term that refers to any 8-hour Occupational Exposure Limit (OEL) (such as, PEL, or TLV) in part per million (PPM) or mg/m3. This concentration is used to specify engineering controls and PPE requirements, and to demonstrate compliance with hazard (exposure) limits.
Air sampling methods tend to be more precise in the quantification and identification of contaminants than direct reading air monitoring. Air sampling may be performed to supplement direct reading air-monitoring results. Under specific situations, some safety regulations require air sampling for exposure to certain contaminants (asbestos, lead, and cadmium for example). Air sampling is also used for potential airborne organic and inorganic vapors, gases and aerosols (dusts). Air sampling pumps must be calibrated according to the guidelines in the calibration procedure section for both personal and area sampling.
The limitations of air sampling are: the air sampling duration is typically 8 hours, availability of laboratory analysis ranging from days to weeks, and results are not available in real-time. Air sampling is expensive, with costs ranging from $50 to $500 per sample. Results must be compared to a hazard (exposure) limit for a specific chemical (for example, the PEL, REL, or TLV).
Personal Sampling
Personal samples are collected in the breathing zone of a worker, which is defined as a half-sphere around the head of the employee being monitored and forward from the plane of the shoulders. Personal air sampling is used to average the varying range of contaminant concentration levels with time and activities performed over a defined period.
Area Sampling
Occasionally additional information is needed to accompany the data recorded through personal breathing zone sampling. Samples may be taken at a specific operation or in a general work area to help assess the potential exposures. The positioning of these samples can help to determine a source of contamination or evaluate engineering controls. The type of information desired should contribute to the overall sampling strategy. Your RHSPM will determine whether personal breathing zone or area samples will be collected.
Sampling Supplies
Specific analytical methods will require various types of sampling collection media to be used. The most common media are cassette filters and sorbent tubes. Gases and vapor are typically collected in sorbent tubes that contain small granules or beads that adsorb the contaminate. Liquids or particulates are more commonly collected on filters, which can be either treated or untreated. The specific analytical method will determine the most appropriate collection device. Various analytical methods exist, both NIOSH and OSHA have published databases of validate methods. The RHSPM will specify sampling methods needed and communicate with the SC.
Sampling Equipment
Sampling pumps are produced by a variety of manufacturers but all work in the same manner. The principle is to pull, by suction, a constant amount of air through the collection device in line. Sampling pumps are to be calibrated to within 5% of the
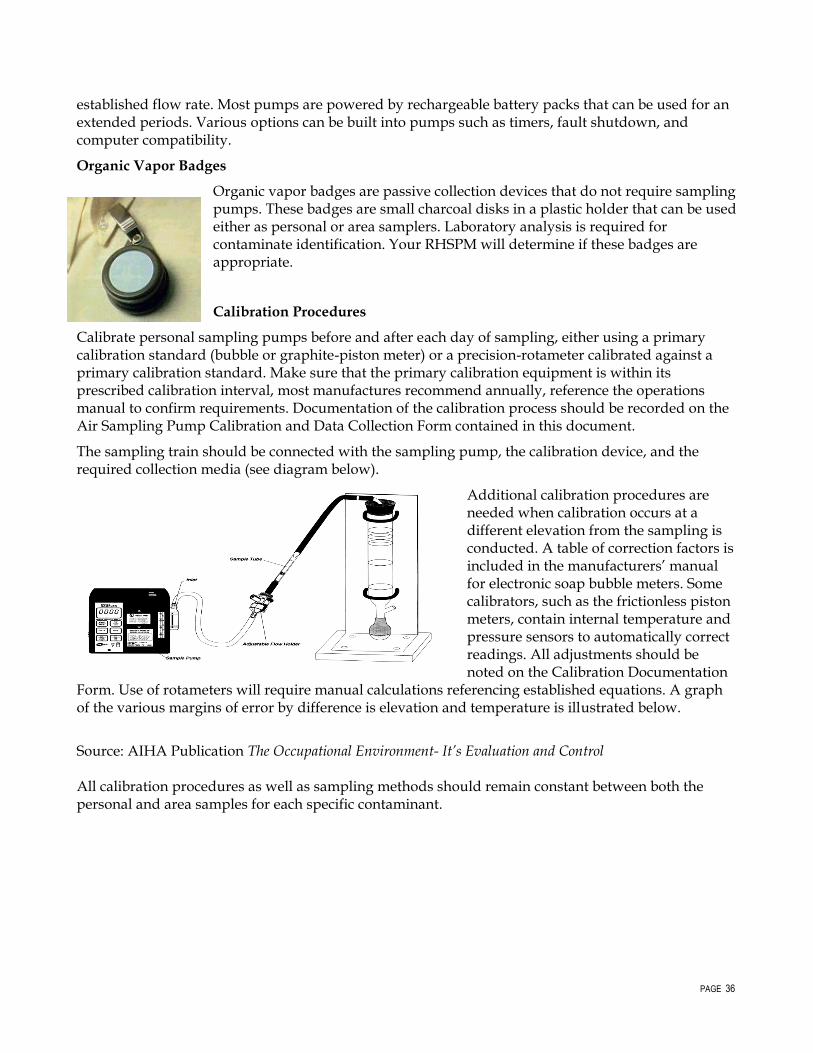
PAGE 36
established flow rate. Most pumps are powered by rechargeable battery packs that can be used for an extended periods. Various options can be built into pumps such as timers, fault shutdown, and computer compatibility.
Organic Vapor Badges
Organic vapor badges are passive collection devices that do not require sampling pumps. These badges are small charcoal disks in a plastic holder that can be used either as personal or area samplers. Laboratory analysis is required for contaminate identification. Your RHSPM will determine if these badges are appropriate.
Calibration Procedures
Calibrate personal sampling pumps before and after each day of sampling, either using a primary calibration standard (bubble or graphite-piston meter) or a precision-rotameter calibrated against a primary calibration standard. Make sure that the primary calibration equipment is within its prescribed calibration interval, most manufactures recommend annually, reference the operations manual to confirm requirements. Documentation of the calibration process should be recorded on the Air Sampling Pump Calibration and Data Collection Form contained in this document.
The sampling train should be connected with the sampling pump, the calibration device, and the required collection media (see diagram below).
Additional calibration procedures are needed when calibration occurs at a different elevation from the sampling is conducted. A table of correction factors is included in the manufacturers’ manual for electronic soap bubble meters. Some calibrators, such as the frictionless piston meters, contain internal temperature and pressure sensors to automatically correct readings. All adjustments should be noted on the Calibration Documentation
Form. Use of rotameters will require manual calculations referencing established equations. A graph of the various margins of error by difference is elevation and temperature is illustrated below.
Source: AIHA Publication The Occupational Environment- It’s Evaluation and Control All calibration procedures as well as sampling methods should remain constant between both the personal and area samples for each specific contaminant.
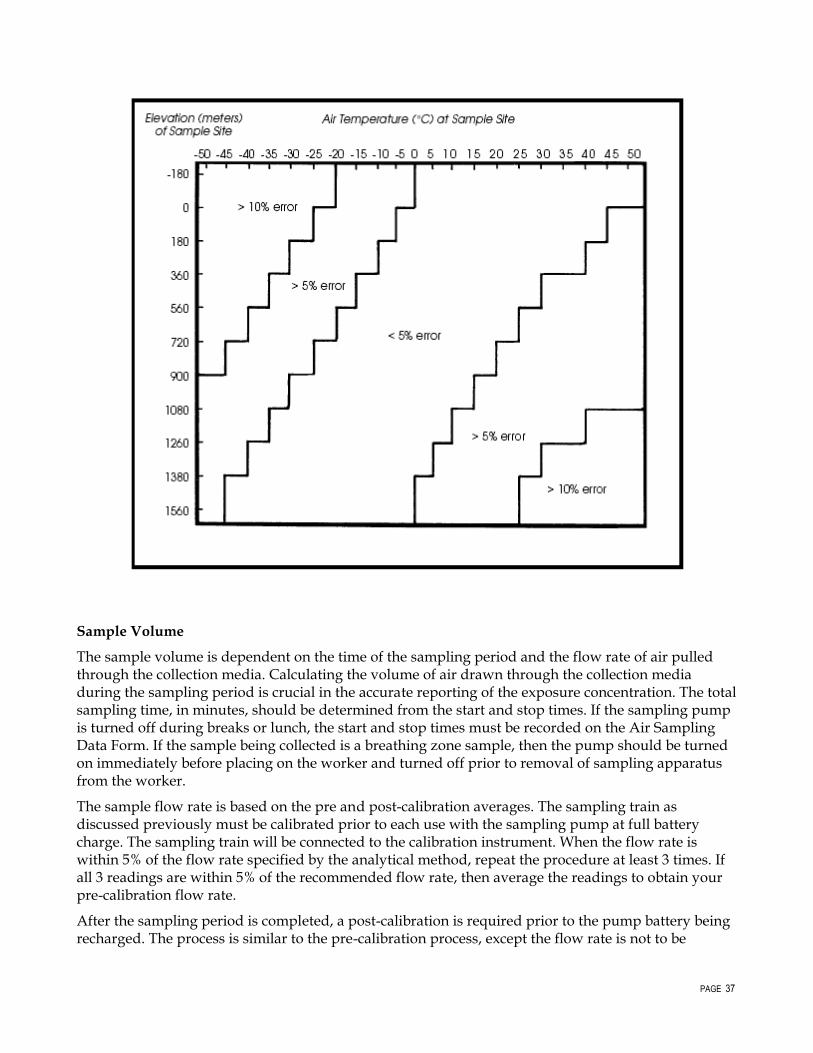
PAGE 37
Sample Volume
The sample volume is dependent on the time of the sampling period and the flow rate of air pulled through the collection media. Calculating the volume of air drawn through the collection media during the sampling period is crucial in the accurate reporting of the exposure concentration. The total sampling time, in minutes, should be determined from the start and stop times. If the sampling pump is turned off during breaks or lunch, the start and stop times must be recorded on the Air Sampling Data Form. If the sample being collected is a breathing zone sample, then the pump should be turned on immediately before placing on the worker and turned off prior to removal of sampling apparatus from the worker.
The sample flow rate is based on the pre and post-calibration averages. The sampling train as discussed previously must be calibrated prior to each use with the sampling pump at full battery charge. The sampling train will be connected to the calibration instrument. When the flow rate is within 5% of the flow rate specified by the analytical method, repeat the procedure at least 3 times. If all 3 readings are within 5% of the recommended flow rate, then average the readings to obtain your pre-calibration flow rate.
After the sampling period is completed, a post-calibration is required prior to the pump battery being recharged. The process is similar to the pre-calibration process, except the flow rate is not to be
PAGE 38
adjusted. Simply connect the sampling train to the calibration instrument and record 3 flow rate readings and average. The average flow rate is listed on the Air Sampling Data Form as the post-calibration flow rate.
The next step is to compare the pre and post-calibration flow rates to determine the sample flow rate. If the pre and post-calibration flow rates are within 5% of each other, then average the two to determine the sample flow rate. If the difference between the pre and post-calibration is greater than 5% but less than 10%, the lower of the two flow rates will be used as the sample flow rate. If the comparison of the pre and post-calibration flow rates indicates a difference of greater than 10%, the difference is too great to accurately estimate a flow rate and the sample must be voided.
If the temperature, pressure or altitude of the sample collection process is different from the conditions of the pre and post calibrations, the flow rate may have to be adjusted. To adjust the sample flow rate the following equation is to be used: Calibration Conditions Sampling Conditions
(Volume) (Pressure) = (Volume) (Pressure) Temperature Temperature The sample flow rate is then multiplied by the sample time to obtain the sample air volume, which is usually reported to the analytical laboratory in liters of air.
Field Blanks
Along with each set of air samples, field blank samples will be included with the shipment of samples to the laboratory. Field blanks are used to determine accidental contamination of the samples during the handling and shipping process. Field blanks should be of the same media type and lot number as the media used for each type of sample collected. One blank should be submitted with each 10 samples for any given analysis/sampling period as the general rule. Some specific sampling and analytical methods will require additional blanks. Prior to shipping, consult the sampling and analytical method or laboratory to determine the number of blanks. The blanks should be opened but not used to take samples (charcoal tubes, filters etc.). They should be handled in the same manner as any sampling media used in sampling air contaminants, with the exception that no air is drawn through them. The blanks should be labeled as blanks or noted on the laboratory analysis sheet as a blank.
Shipping Information
Prior to shipping, check with the analytical laboratory or your RHSPM for any special shipping requirements. Some samples are required to be shipped cold. Most samples will be shipped to the laboratory by overnight delivery. Try not to ship samples to the laboratory on Friday, unless you have arranged with the laboratory for a Saturday delivery. Please note that overnight delivery services have been known to not deliver packages on Saturday although the shipping papers specify Saturday delivery. The samples will be staged in uncontrolled environmental conditions that may affect the samples. If samples need to be taken on Friday, check with the laboratory to see if the samples could be refrigerated over the weekend and then shipped out of Monday.
Do not ship samples without thoroughly completing the chain-of-custody form. The lab completing the analysis should provide the appropriate form. If not, use the Chain-of-Custody Form found in this guide.
PAGE 39
Occupational Exposure Limits (OEL) Background
The necessity to establish acceptable levels for exposure to workplace contaminants was recognized as early as the 1920's. The Bureau of Mines and the Bureau of Standards compiled these early lists. In the 1940's the American Standards Association, known today as the American National Standards Institute (ANSI) and the American Conference of Governmental Industrial Hygienists (ACGIH) established maximum allowable concentrations. In 1960, the term "maximum allowable concentration" was discarded and the Threshold Limit Value (TLV) was introduced.
United States OELs
Threshold Limit Value (TLV) TLVs refer to airborne concentrations of substances and represent conditions under which it is believed that nearly all workers may be repeatedly exposed day after day without adverse effect. Because of wide variation in individual susceptibility, a small percentage of workers may experience discomfort from some substances at concentrations at or below the threshold limit. A smaller percentage may be affected more seriously by aggravation of a pre-existing condition or by development of an occupational illness.
TLVs are based on the best available information from industrial experience, from experimental human and animal studies and, when possible, from a combination of the three. The basis on which the values are established may differ from substance to substance; protection against impairment of health may be a guiding factor for some, whereas reasonable freedom from irritation, narcosis, nuisance or other forms of stress may form the basis for others. The amount and nature of the information available for establishing a TLV also varies from substance to substance. The precision of the estimated TLV is also subject to variation and the latest TLV documentation should be consulted in order to assess the extent of the data available for a given substance.
The TLVs are intended for use in the practice of industrial hygiene as guidelines or recommendations in the control of potential health hazards and for no other use. TLVs and TLV Documentation are updated annually.
Permissible Exposure Limits (PEL) The Occupational Safety and Health Administration (OSHA) in 1970 established PELs. They are United States legal limits, which shall not be exceeded. The majority of the PELs were adopted from ANSI standards and ACGIH TLVs
Recommended Exposure Limit (REL) RELs are established by the National Institute for Occupational Safety and Health (NIOSH) as the scientific basis for OSHA to use in the standard setting process. Due to the breakdown in the PEL process, RELs remain as recommended limits and are not enforceable. RELs given as TWAs are based on a 10-hour workday during a 40-hour workweek.
International OELs
Numerous countries besides the United States are active in establishing OELs for their specific working conditions. Many are based upon the ACGIH TLVs. Some notable international OELs are:
Maximum Concentration Values in the Workplace (MAK)
PAGE 40
MAKs are established by the German Commission for the Investigation of Health Hazards of Chemical Compounds.
Occupational Exposure Limits (OEL) OELs are established by the Great Britain Health and Safety Commission. These OELs are enforceable by law. Great Britain also has OELs that are recommend levels and is approved by Britain’s Health and Safety Executive.
OEL Types
OELs are expressed in different types of limits or levels. The limits or levels listed are used on a chemical specific basis to define the period of time and concentration a worker may be exposed. The RHSPM or HSM use the different types of OELs to determine the appropriate sampling strategy and equipment uses these limits or levels.
Action Level (AL) The AL is the concentration at which a certain action is required. The AL is variable but in the industrial setting, it is usually 50% of the PEL. Some substance-specific OSHA standards require medical monitoring, workplace monitoring, training, and labeling at the action level.
Time Weighted Average (TWA) PEL The employee's average airborne exposures in any 8-hour work shift of a 40-hour
workweek which shall not be exceeded.
TLV The time-weighted average concentration for a normal 8-hour workday and a 40-hour workweek, to which nearly all workers may be repeatedly exposed, day after day, without adverse effect.
REL The employee's average airborne exposures in any 10-hour work shift of a 40-hour workweek which shall not be exceeded.
Ceiling Values PEL The employee's exposure limit that shall not be exceeded during any part of the
workday. If instantaneous monitoring is not feasible; the ceiling shall be assessed as a 15-minute time weighted average exposure which shall not be exceeded at any time over a working day.
TLV or REL: The concentration that should not be exceeded during any part of the working exposure.
Short Term Exposure Limit (STEL) PEL The employee's 15-minute time weighted average exposure, which shall not be exceeded
at any time during a workday unless another time limit is specified in a standard.
TLV A 15-minute TWA exposure that should not be exceeded at any time during a workday even if the 8-hour TWA is within the TLV-TWA. Exposures above the TLV-TWA up to the STEL should not be longer than 15 minutes and should not occur more than four times per day. There should be at least 60 minutes between successive exposures in this range. An averaging period other than 15 minutes may be recommended when this is warranted by observed biological effects PEL.
Skin Designation To prevent or reduce skin absorption, an employee's skin exposure to substances listed with the designation "skin" shall be prevented or reduced to the extent necessary in the circumstances
PAGE 41
through the use of gloves, coveralls, goggles, or other appropriate personal protective equipment, engineering controls or work practices.
TLV Skin Listed substances followed by the designation "skin" refer to the potential contribution to the overall exposure by the cutaneous route including mucous membranes and eyes, either by airborne or, more particularly, by direct contact with the substance. Vehicles present in solutions and mixtures can alter skin absorption
Excursion Limits TLV Excursions in worker exposure levels may exceed 3 times the TLV-TWA for no more
than a total of 30 minutes during a workday, and under no circumstances should they exceed 5 times the TLV-TWA, provided that the TLV-TWA is not exceeded.
Mixtures PEL In case of a mixture of air contaminants, an employer shall compute the equivalent
exposure as follows:
Em = (C1/L1 + C2/L2) + ... (Cn/Ln)
Where: Em is the equivalent exposure for the mixture. C is the concentration of a particular contaminant. L is the exposure limit for that substance specified in Subpart Z of 29 CFR 1910.
The value of Em shall not exceed unity (1). TLV When two or more hazardous substances which act upon the same organ system are
present, their combined effect, rather than that of either individually, should be given primary consideration. In the absence of information to the contrary, the effects of the different hazards should be considered as additive. That is, if the sum of the following fractions,
C1/T1 + C2/T2 + ... Cn/Tn
exceeds unity; the threshold limit of the mixture should be considered as being exceeded. C1 indicates the observed atmospheric concentration, and T1 the corresponding threshold limit.
Immediately Dangerous to Life and Health (IDLH The maximum concentration from which, in the event of respirator failure, one could escape within 30 minutes without a respirator and without experiencing any escape impairing (e.g. severe eye irritation) or irreversible health effects. These values were determined only for the purpose of respirator selection
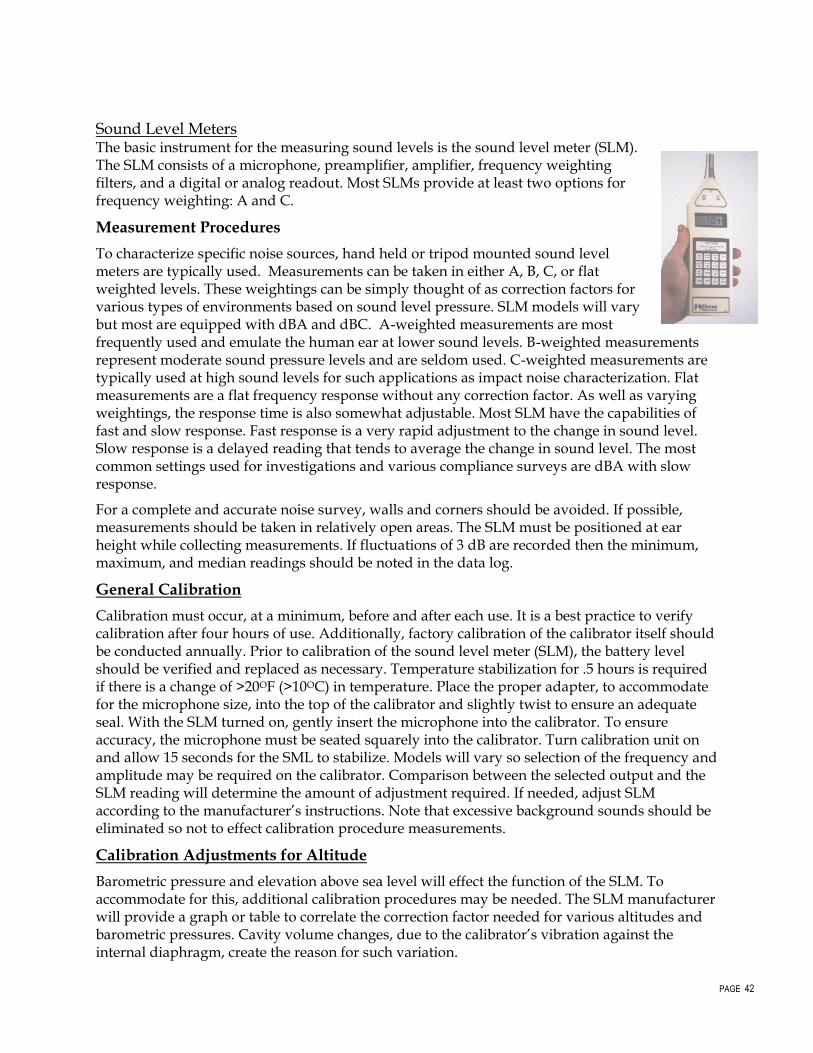
PAGE 42
Sound Level Meters The basic instrument for the measuring sound levels is the sound level meter (SLM). The SLM consists of a microphone, preamplifier, amplifier, frequency weighting filters, and a digital or analog readout. Most SLMs provide at least two options for frequency weighting: A and C.
Measurement Procedures
To characterize specific noise sources, hand held or tripod mounted sound level meters are typically used. Measurements can be taken in either A, B, C, or flat weighted levels. These weightings can be simply thought of as correction factors for various types of environments based on sound level pressure. SLM models will vary but most are equipped with dBA and dBC. A-weighted measurements are most frequently used and emulate the human ear at lower sound levels. B-weighted measurements represent moderate sound pressure levels and are seldom used. C-weighted measurements are typically used at high sound levels for such applications as impact noise characterization. Flat measurements are a flat frequency response without any correction factor. As well as varying weightings, the response time is also somewhat adjustable. Most SLM have the capabilities of fast and slow response. Fast response is a very rapid adjustment to the change in sound level. Slow response is a delayed reading that tends to average the change in sound level. The most common settings used for investigations and various compliance surveys are dBA with slow response.
For a complete and accurate noise survey, walls and corners should be avoided. If possible, measurements should be taken in relatively open areas. The SLM must be positioned at ear height while collecting measurements. If fluctuations of 3 dB are recorded then the minimum, maximum, and median readings should be noted in the data log.
General Calibration
Calibration must occur, at a minimum, before and after each use. It is a best practice to verify calibration after four hours of use. Additionally, factory calibration of the calibrator itself should be conducted annually. Prior to calibration of the sound level meter (SLM), the battery level should be verified and replaced as necessary. Temperature stabilization for .5 hours is required if there is a change of >20OF (>10OC) in temperature. Place the proper adapter, to accommodate for the microphone size, into the top of the calibrator and slightly twist to ensure an adequate seal. With the SLM turned on, gently insert the microphone into the calibrator. To ensure accuracy, the microphone must be seated squarely into the calibrator. Turn calibration unit on and allow 15 seconds for the SML to stabilize. Models will vary so selection of the frequency and amplitude may be required on the calibrator. Comparison between the selected output and the SLM reading will determine the amount of adjustment required. If needed, adjust SLM according to the manufacturer’s instructions. Note that excessive background sounds should be eliminated so not to effect calibration procedure measurements.
Calibration Adjustments for Altitude
Barometric pressure and elevation above sea level will effect the function of the SLM. To accommodate for this, additional calibration procedures may be needed. The SLM manufacturer will provide a graph or table to correlate the correction factor needed for various altitudes and barometric pressures. Cavity volume changes, due to the calibrator’s vibration against the internal diaphragm, create the reason for such variation.
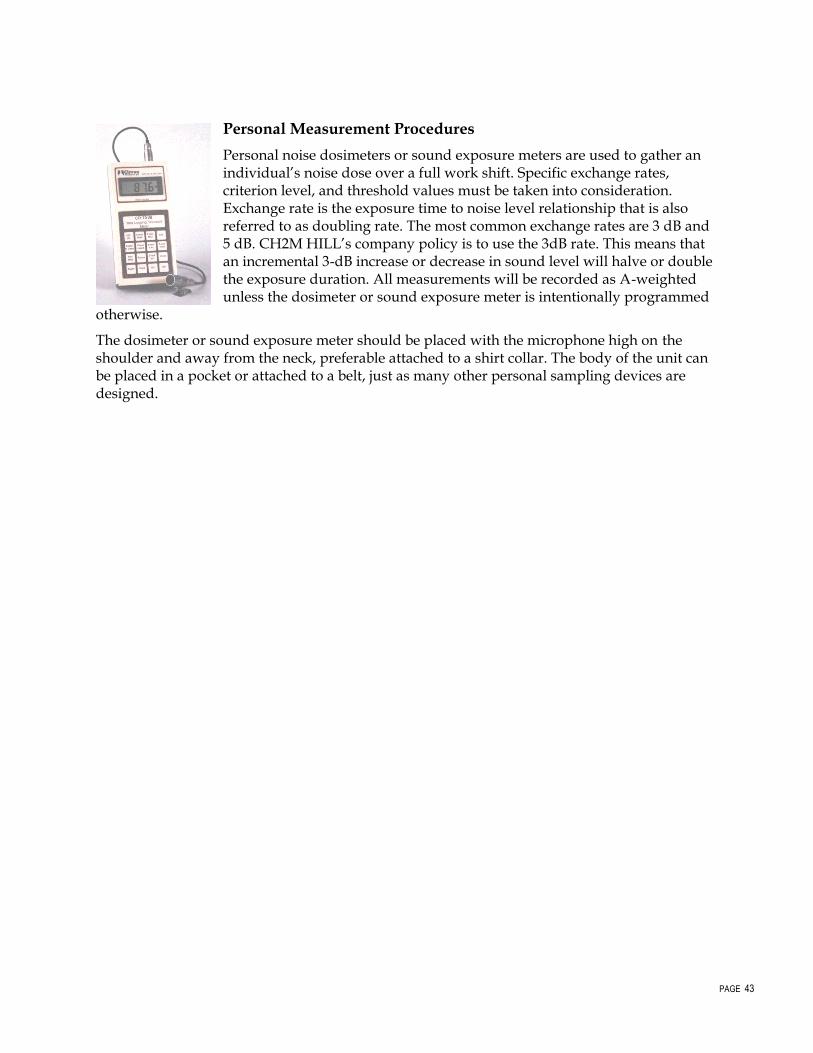
PAGE 43
Personal Measurement Procedures
Personal noise dosimeters or sound exposure meters are used to gather an individual’s noise dose over a full work shift. Specific exchange rates, criterion level, and threshold values must be taken into consideration. Exchange rate is the exposure time to noise level relationship that is also referred to as doubling rate. The most common exchange rates are 3 dB and 5 dB. CH2M HILL’s company policy is to use the 3dB rate. This means that an incremental 3-dB increase or decrease in sound level will halve or double the exposure duration. All measurements will be recorded as A-weighted unless the dosimeter or sound exposure meter is intentionally programmed
otherwise.
The dosimeter or sound exposure meter should be placed with the microphone high on the shoulder and away from the neck, preferable attached to a shirt collar. The body of the unit can be placed in a pocket or attached to a belt, just as many other personal sampling devices are designed.
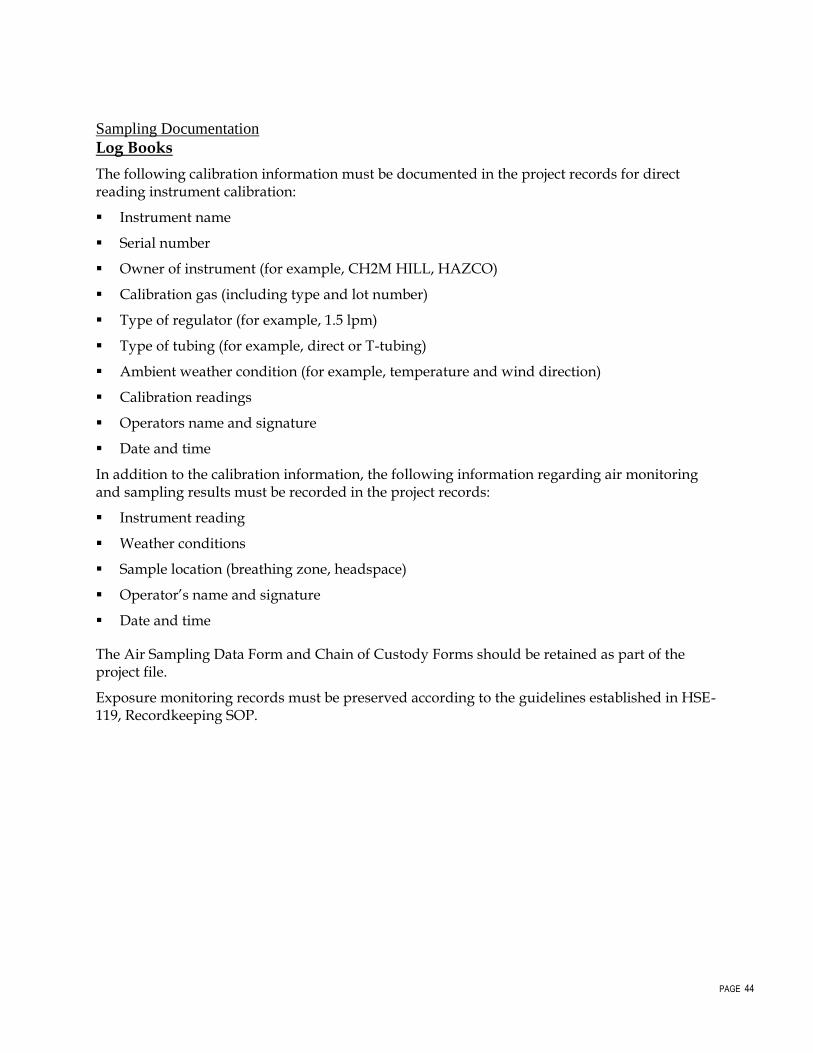
PAGE 44
Sampling Documentation
Log Books
The following calibration information must be documented in the project records for direct reading instrument calibration:
Instrument name
Serial number
Owner of instrument (for example, CH2M HILL, HAZCO)
Calibration gas (including type and lot number)
Type of regulator (for example, 1.5 lpm)
Type of tubing (for example, direct or T-tubing)
Ambient weather condition (for example, temperature and wind direction)
Calibration readings
Operators name and signature
Date and time
In addition to the calibration information, the following information regarding air monitoring and sampling results must be recorded in the project records:
Instrument reading
Weather conditions
Sample location (breathing zone, headspace)
Operator’s name and signature
Date and time
The Air Sampling Data Form and Chain of Custody Forms should be retained as part of the project file.
Exposure monitoring records must be preserved according to the guidelines established in HSE-119, Recordkeeping SOP.
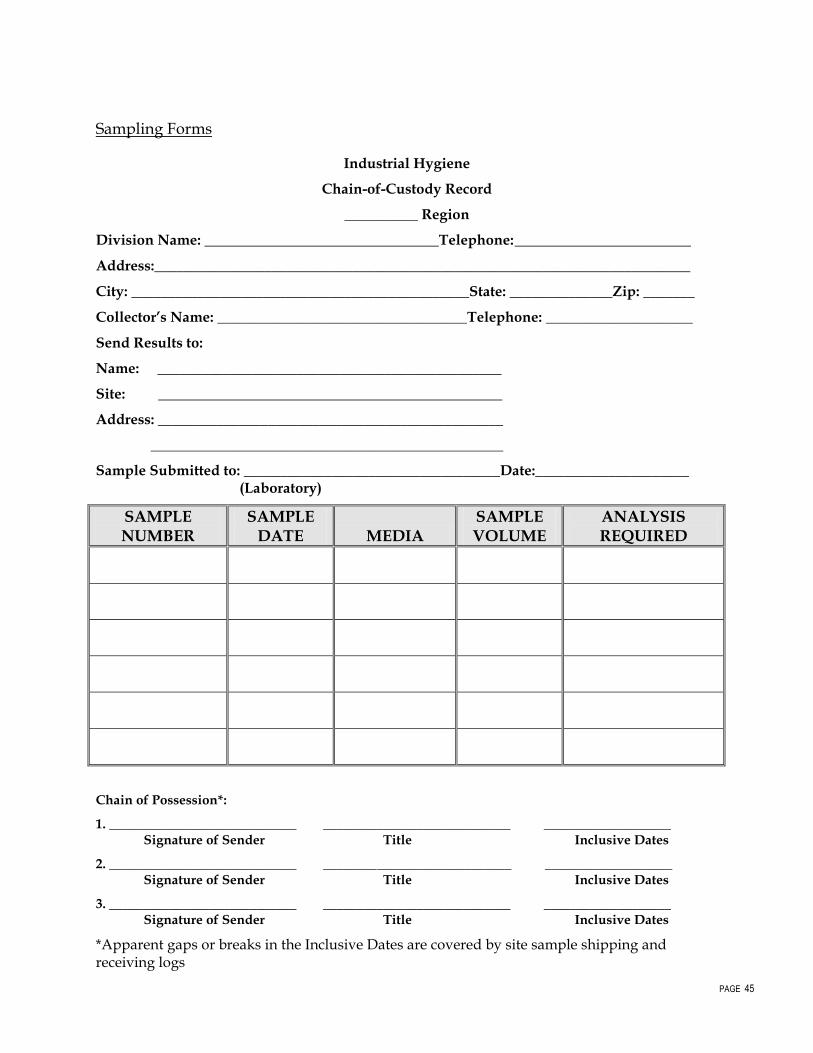
PAGE 45
Sampling Forms
Industrial Hygiene
Chain-of-Custody Record
__________ Region
Division Name: ________________________________Telephone:________________________
Address:_________________________________________________________________________
City: ______________________________________________State: ______________Zip: _______
Collector’s Name: __________________________________Telephone: ____________________
Send Results to:
Name: _______________________________________________
Site: _______________________________________________
Address: _______________________________________________
________________________________________________
Sample Submitted to: ___________________________________Date:_____________________ (Laboratory)
SAMPLE NUMBER
SAMPLE DATE MEDIA
SAMPLE VOLUME
ANALYSIS REQUIRED
Chain of Possession*:
1. ____________________________ ____________________________ ___________________ Signature of Sender Title Inclusive Dates
2. ____________________________ ____________________________ ___________________ Signature of Sender Title Inclusive Dates
3. ____________________________ ____________________________ ___________________ Signature of Sender Title Inclusive Dates
*Apparent gaps or breaks in the Inclusive Dates are covered by site sample shipping and receiving logs
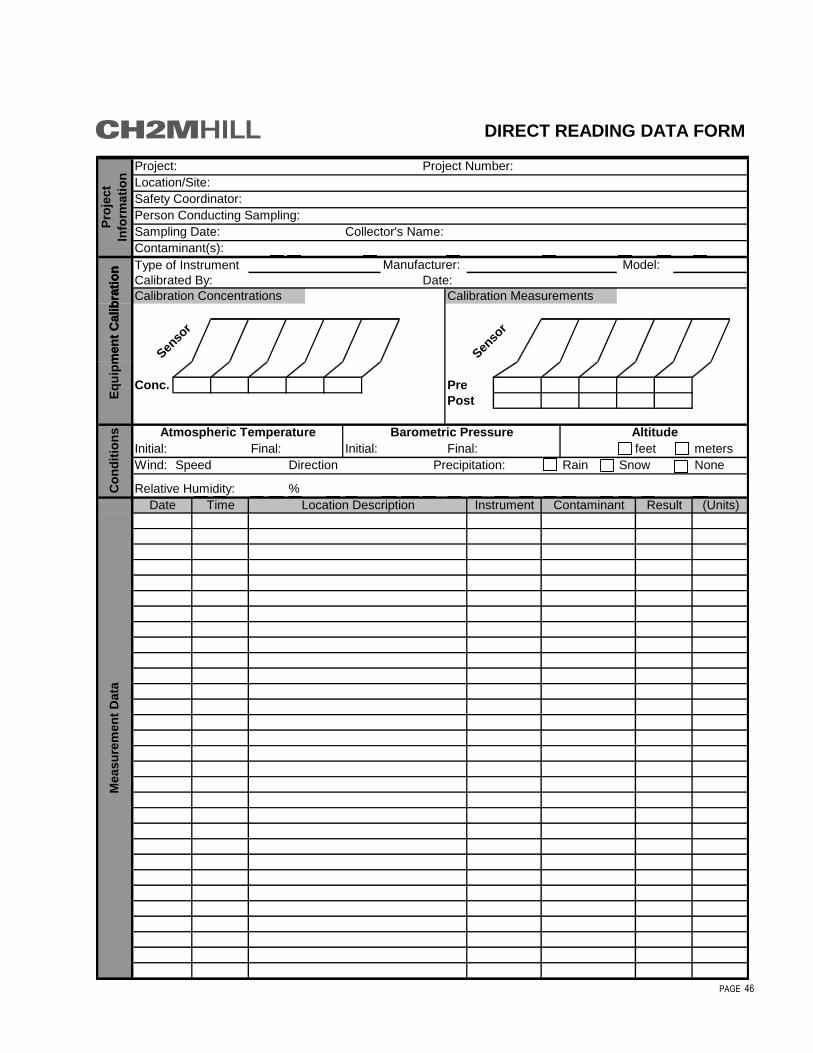
PAGE 46
Project: Project Number:
Location/Site:
Safety Coordinator:
Person Conducting Sampling:
Sampling Date: Collector's Name:
Contaminant(s):
Type of Instrument Manufacturer: Model:
Calibrated By: Date:
Eq
uip
men
t C
alib
rati
on
DIRECT READING DATA FORM
Pro
ject
Info
rmati
on
Calibration Concentrations Calibration Measurements
Senso
r
Senso
r
Eq
uip
men
t C
alib
rati
on
Conc. Pre
Post
Initial: Final: Initial: Final: feet meters
Wind: Speed Direction Rain Snow None
Relative Humidity: %
Eq
uip
men
t C
alib
rati
on
Co
nd
itio
ns AltitudeAtmospheric Temperature Barometric Pressure
Location DescriptionDate Time
Precipitation:
Instrument Result (Units)Contaminant
Measu
rem
en
t D
ata
PA
GE
47
Illustrations Comments Describe Tasks and Activities Sampled
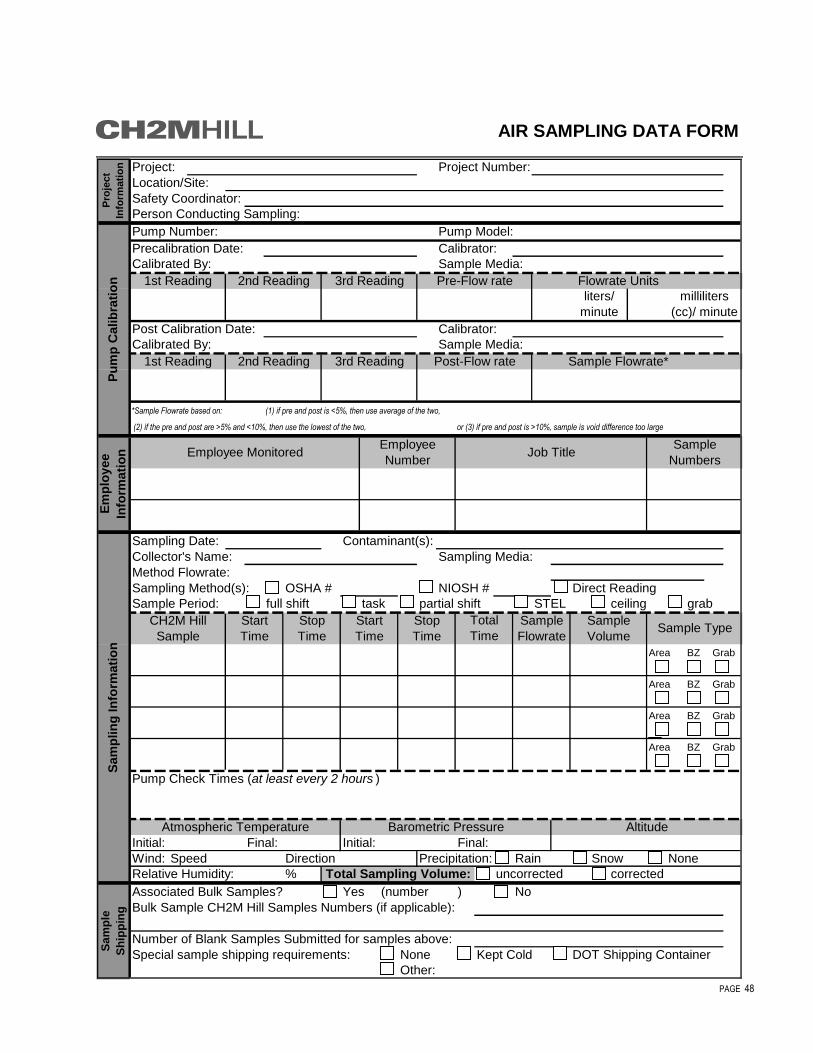
PAGE 48
Project: Project Number:
Location/Site:
Safety Coordinator:
Person Conducting Sampling:
Pump Number: Pump Model:
Precalibration Date: Calibrator:
Calibrated By: Sample Media:
Post Calibration Date: Calibrator:
Calibrated By: Sample Media:
*Sample Flowrate based on: (1) if pre and post is <5%, then use average of the two,
(2) if the pre and post are >5% and <10%, then use the lowest of the two, or (3) if pre and post is >10%, sample is void difference too large
Sampling Date: Contaminant(s):
Collector's Name: Sampling Media:
Method Flowrate:
Sampling Method(s): OSHA # NIOSH # Direct Reading
Sample Period: full shift task partial shift STEL ceiling grab
Area BZ
Area BZ
Area BZ
Area BZ
Pump Check Times (at least every 2 hours )
Initial: Final: Initial: Final:
Wind: Speed Direction Rain Snow None
Relative Humidity: % uncorrected corrected
Associated Bulk Samples? Yes (number ) No
Bulk Sample CH2M Hill Samples Numbers (if applicable):
Number of Blank Samples Submitted for samples above:
Special sample shipping requirements: None Kept Cold DOT Shipping Container
Other:
Sa
mp
lin
g I
nfo
rma
tio
n
Sample
Numbers
Sample Type
Grab
Grab
Grab
Precipitation:
Total Sampling Volume:
Grab
Altitude
Pro
ject
Info
rmati
on
Pu
mp
Ca
lib
rati
on 1st Reading 2nd Reading
1st Reading 2nd Reading
Total
Time
Sample
Flowrate
Sample
Volume
liters/
minute
3rd Reading Flowrate UnitsPre-Flow rate
milliliters
(cc)/ minute
Employee MonitoredEmployee
NumberJob Title
Sample Flowrate*
Atmospheric Temperature Barometric Pressure
CH2M Hill
Sample
Start
Time
Stop
Time
Start
Time
AIR SAMPLING DATA FORM
Em
plo
ye
e
Info
rma
tio
n
3rd Reading Post-Flow rate
Sa
mp
le
Sh
ipp
ing
Stop
Time
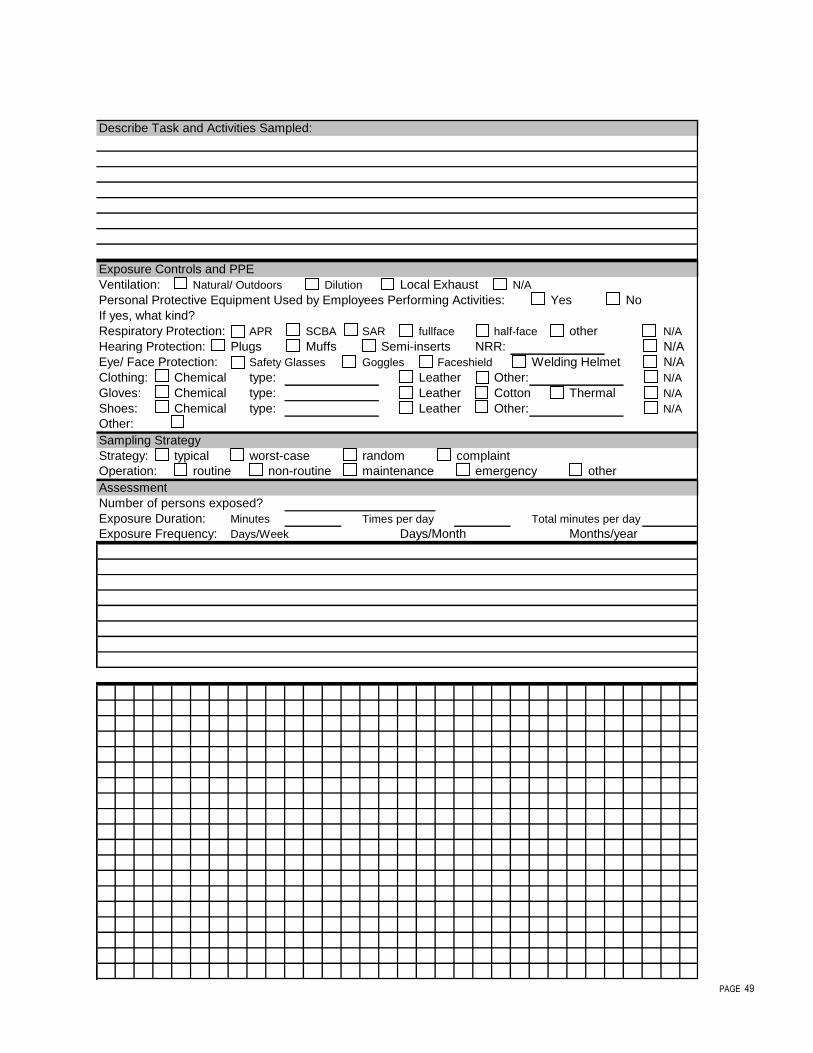
PAGE 49
Describe Task and Activities Sampled:
Ventilation: Natural/ Outdoors Dilution Local Exhaust N/A
Personal Protective Equipment Used by Employees Performing Activities: Yes No
If yes, what kind?
Respiratory Protection: APR SCBA SAR fullface half-face other N/A
Hearing Protection: Plugs Muffs Semi-inserts NRR: N/A
Eye/ Face Protection: Safety Glasses Goggles Faceshield Welding Helmet N/A
Clothing: Chemical type: Leather Other: N/A
Gloves: Chemical type: Leather Cotton Thermal N/A
Shoes: Chemical type: Leather Other: N/A
Other:
Sampling Strategy
Strategy: typical worst-case random complaint
Operation: routine non-routine maintenance emergency other
Assessment
Number of persons exposed?
Exposure Duration: Minutes Times per day Total minutes per day
Exposure Frequency: Days/Week Days/Month Months/year
Exposure Controls and PPE

SOP-08: Equipment Decontamination
Revision No.: 0 Date: February 2010
Page 1 of 2
STANDARD OPERATING PROCEDURE EQUIPMENT DECONTAMINATION
1.0 Scope and Application
All reusable sample processing equipment must be decontaminated following each use in order to prevent cross-contamination. This Standard Operating Procedure (SOP) describes the procedures to be followed for decontaminating sampling equipment used during field activities.
2.0 Materials
a. Plastic sheeting b. 1 – 2 Quart heavy duty squirt bottles c. Deionized (DI) water
d. Demonstrated analyte-free Type I deionized water e. 1% and 10% by volume solutions Nitric Acid (HNO3) (ultra-pure grade) f. Low phosphate detergent (i.e., alconox) h. 10% by volume solution Methanol or Isopropanol (optima-grade) i. Aluminum foil
3.0 Procedure
3.1 Decontamination of the Outside of Sample Bottles
At the completion of each sampling activity the sample bottles must be decontaminated as follows:
1. Be sure that the bottle lids are on tight.
2. Wipe the outside of the bottle with a paper towel to remove excess soil or water.
3.2 Decontamination of Sampling Equipment
3.2.1 Non-disposable, non-electric sample processing equipment (utensils, pans, etc.) used during shore-based sample processing.
1. Wash and scrub with low-phosphate detergent and potable water solution (e.g., Liquinox)
2. Rinse with potable (tap) water
3. Rinse with 10% by volume Nitric Acid (HNO3) solution (ultra pure grade) when sampling for inorganics, unless using carbon steel sampling equipment when a 1% by volume HNO3 solution should be used to avoid stripping of metals.
4. Rinse with DI water
5. Rinse with 10% by volume Methanol or Isopropanol Solution (optima grade or better)
6. Rinse with DI water (five times the volume of solvent used).
7. Air dry
8. Wrap exposed portions in aluminum foil (shiny side out)

SOP-08: Equipment Decontamination
Revision No.: 0 Date: February 2010
Page 2 of 2
4.0 Maintenance
Not Applicable.
5.0 Precautions
5.1 Once a piece of equipment has been decontaminated be careful to keep it in such condition until needed.
5.2 Refer to the Health and Safety Plan for appropriate health and safety precautions.
6.0 References
U.S. EPA Region II Low Stress (Low Flow) Purging and Sampling Groundwater Sampling Procedure, Final. March 16, 1998.
U.S. EPA Environmental Response Team SOP #2006 Sampling Equipment Decontamination. August 11, 1994.
U.S. EPA Region 9 Laboratory SOP #1230 Sampling Equipment Decontamination. September 1999.
7.0 Attachments
None.
SOP-09: Data Management Plan
Revision No.: 1 Date: April 2010
Page 1 of 4
STANDARD OPERATING PROCEDURE DATA MANAGEMENT PLAN
1.0 Scope and Application
This SOP describes the database that will be used and how the data will be presented in a consistent manner during investigations. The following are discussed:
Description of the field and laboratory data collected during Phase 3 of investigations of the Gowanus Canal Site
Data management
2.0 Materials
None
3.0 Procedure
Description of the samples requiring data management for Phase 3 of the Gowanus Canal RI/FS: Surface Sediment and Surface Water, Air, Tissue, CSO (water and sediment), and Subsurface Soil and Groundwater
There are two sets of data that will require management and presentation: the field data and the analytical data from laboratories. Analytical Data The analytical data to be collected for all media are described in the UFP-QAPP.
QA/QC samples will collected as described in the UFP-QAPP. Hard copy validated and Electronic Data Deliverables will be provided through CLP or through a subcontracted laboratory (not validated data).
Field Data The field data that will be collected will include the following:
Date and time of collection of the samples
As-sampled coordinates (x,y) or description of sampling location, where applicable
Water depth at time of collection (for both sediment and surface water samples)
Sample collection depth
In-situ water quality parameters at time of surface water and groundwater sampling
Sediment / soil boring characterization logs or observations of the media sampled
A list of samples submitted for analysis and a schedule of analyses for which samples were submitted
COC and shipping information
Photographic log (if applicable)
SOP-09: Data Management Plan
Revision No.: 1 Date: April 2010
Page 2 of 4
For each media sampled, the applicable field forms will be completed.
The as-sampled coordinates, water depth (for aqueous samples), and sample collection information (date, time, etc.) will all be recorded in the field log book at the time of collection. This information will be tabulated using Excel throughout the sampling event. The table will be stored electronically within the designated project folder on the CH2M HILL network. The field logbook will be scanned and stored in the same location at the end of the event (or more frequently if project needs dictate).
Sediment / soil boring characterization logs (or other characterization forms per applicable SOPs) will be pre-printed from a template established specifically for the project and will be filled out by hand during the processing operations. The completed forms will be organized into 3-ring binders (in accordance with SOP-04) during the field event. Periodically during the event, the logs will be scanned and uploaded to a designated project folder; the frequency will be determined prior to the field event based on input from the needs of the project team. Information from these logs may be transcribed into electronic (Excel) format for final report-quality logs.
Photos of soil / other samples collected (where applicable) will be downloaded from the digital camera(s) throughout the field event. The file names will be renamed to comply with project requirements and be descriptive. The naming system for the photographs will be consistent with the sampling location nomenclature. For example, the title of a photograph for a core location will identify the core location where it was taken:
Subject of photo File Name Soil Boring GC-MW-03 6 to 8 ft GC-MW-03-06-08.jpg An electronic table (Excel format) containing a list of samples submitted for analysis and a schedule of analyses for which samples were submitted will be maintained. This table will be updated daily and will include the sample name, matrix, sample type (normal, field duplicate, matrix spike, etc), collection time, sample depth, parent sample location, EPA case number, and any other information deemed appropriate by the project team. The core collection information noted above can be included in this table to generate a single repository of field data.
The field custodian will retain copies of the chain of custodies and shipping documentation in accordance with SOP-04 during the field event. These documents will be scanned and saved to the project folders periodically.
Analytical Data
The electronic analytical data packages received from the laboratories and data validation reports will be stored in a designated space within the project folder on the CH2M HILL server. The project chemist or data manager, or their designee, will review data packages for completeness and accuracy prior to releasing to the project team.
Following release to the project team, the following will be completed to ensure accurate loading of the data into the project database:
Database Manager
Review EDDs of validated data for completeness and accuracy and resolve.
Do not load EDDs of unvalidated data.
Check EDDs for duplicate results and resolve.
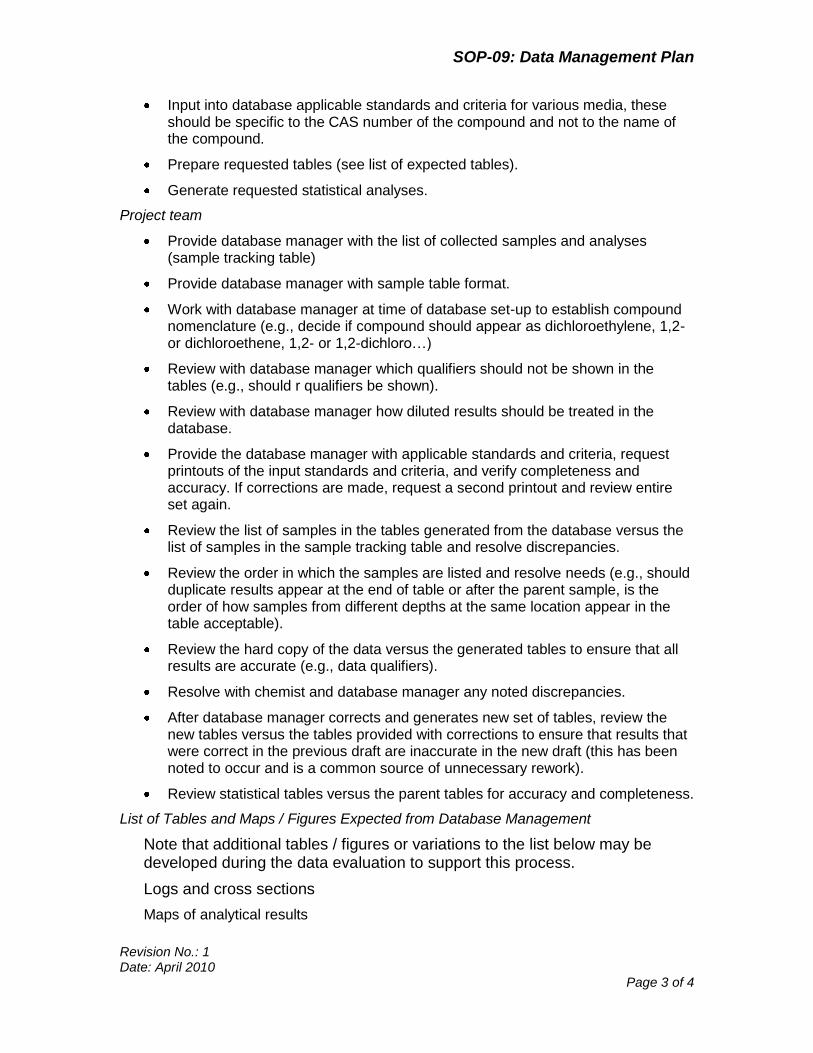
SOP-09: Data Management Plan
Revision No.: 1 Date: April 2010
Page 3 of 4
Input into database applicable standards and criteria for various media, these should be specific to the CAS number of the compound and not to the name of the compound.
Prepare requested tables (see list of expected tables).
Generate requested statistical analyses.
Project team
Provide database manager with the list of collected samples and analyses (sample tracking table)
Provide database manager with sample table format.
Work with database manager at time of database set-up to establish compound nomenclature (e.g., decide if compound should appear as dichloroethylene, 1,2- or dichloroethene, 1,2- or 1,2-dichloro…)
Review with database manager which qualifiers should not be shown in the tables (e.g., should r qualifiers be shown).
Review with database manager how diluted results should be treated in the database.
Provide the database manager with applicable standards and criteria, request printouts of the input standards and criteria, and verify completeness and accuracy. If corrections are made, request a second printout and review entire set again.
Review the list of samples in the tables generated from the database versus the list of samples in the sample tracking table and resolve discrepancies.
Review the order in which the samples are listed and resolve needs (e.g., should duplicate results appear at the end of table or after the parent sample, is the order of how samples from different depths at the same location appear in the table acceptable).
Review the hard copy of the data versus the generated tables to ensure that all results are accurate (e.g., data qualifiers).
Resolve with chemist and database manager any noted discrepancies.
After database manager corrects and generates new set of tables, review the new tables versus the tables provided with corrections to ensure that results that were correct in the previous draft are inaccurate in the new draft (this has been noted to occur and is a common source of unnecessary rework).
Review statistical tables versus the parent tables for accuracy and completeness.
List of Tables and Maps / Figures Expected from Database Management
Note that additional tables / figures or variations to the list below may be developed during the data evaluation to support this process.
Logs and cross sections
Maps of analytical results
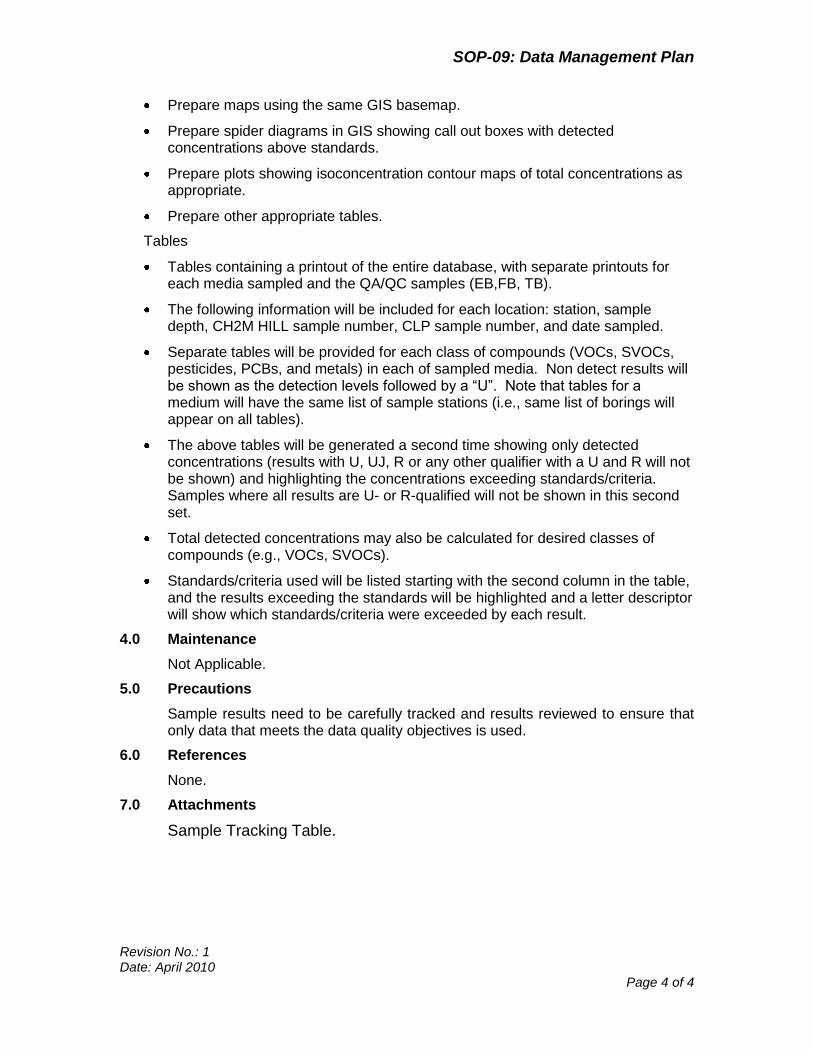
SOP-09: Data Management Plan
Revision No.: 1 Date: April 2010
Page 4 of 4
Prepare maps using the same GIS basemap.
Prepare spider diagrams in GIS showing call out boxes with detected concentrations above standards.
Prepare plots showing isoconcentration contour maps of total concentrations as appropriate.
Prepare other appropriate tables.
Tables
Tables containing a printout of the entire database, with separate printouts for each media sampled and the QA/QC samples (EB,FB, TB).
The following information will be included for each location: station, sample depth, CH2M HILL sample number, CLP sample number, and date sampled.
Separate tables will be provided for each class of compounds (VOCs, SVOCs, pesticides, PCBs, and metals) in each of sampled media. Non detect results will be shown as the detection levels followed by a “U”. Note that tables for a medium will have the same list of sample stations (i.e., same list of borings will appear on all tables).
The above tables will be generated a second time showing only detected concentrations (results with U, UJ, R or any other qualifier with a U and R will not be shown) and highlighting the concentrations exceeding standards/criteria. Samples where all results are U- or R-qualified will not be shown in this second set.
Total detected concentrations may also be calculated for desired classes of compounds (e.g., VOCs, SVOCs).
Standards/criteria used will be listed starting with the second column in the table, and the results exceeding the standards will be highlighted and a letter descriptor will show which standards/criteria were exceeded by each result.
4.0 Maintenance
Not Applicable.
5.0 Precautions
Sample results need to be carefully tracked and results reviewed to ensure that only data that meets the data quality objectives is used.
6.0 References
None.
7.0 Attachments
Sample Tracking Table.
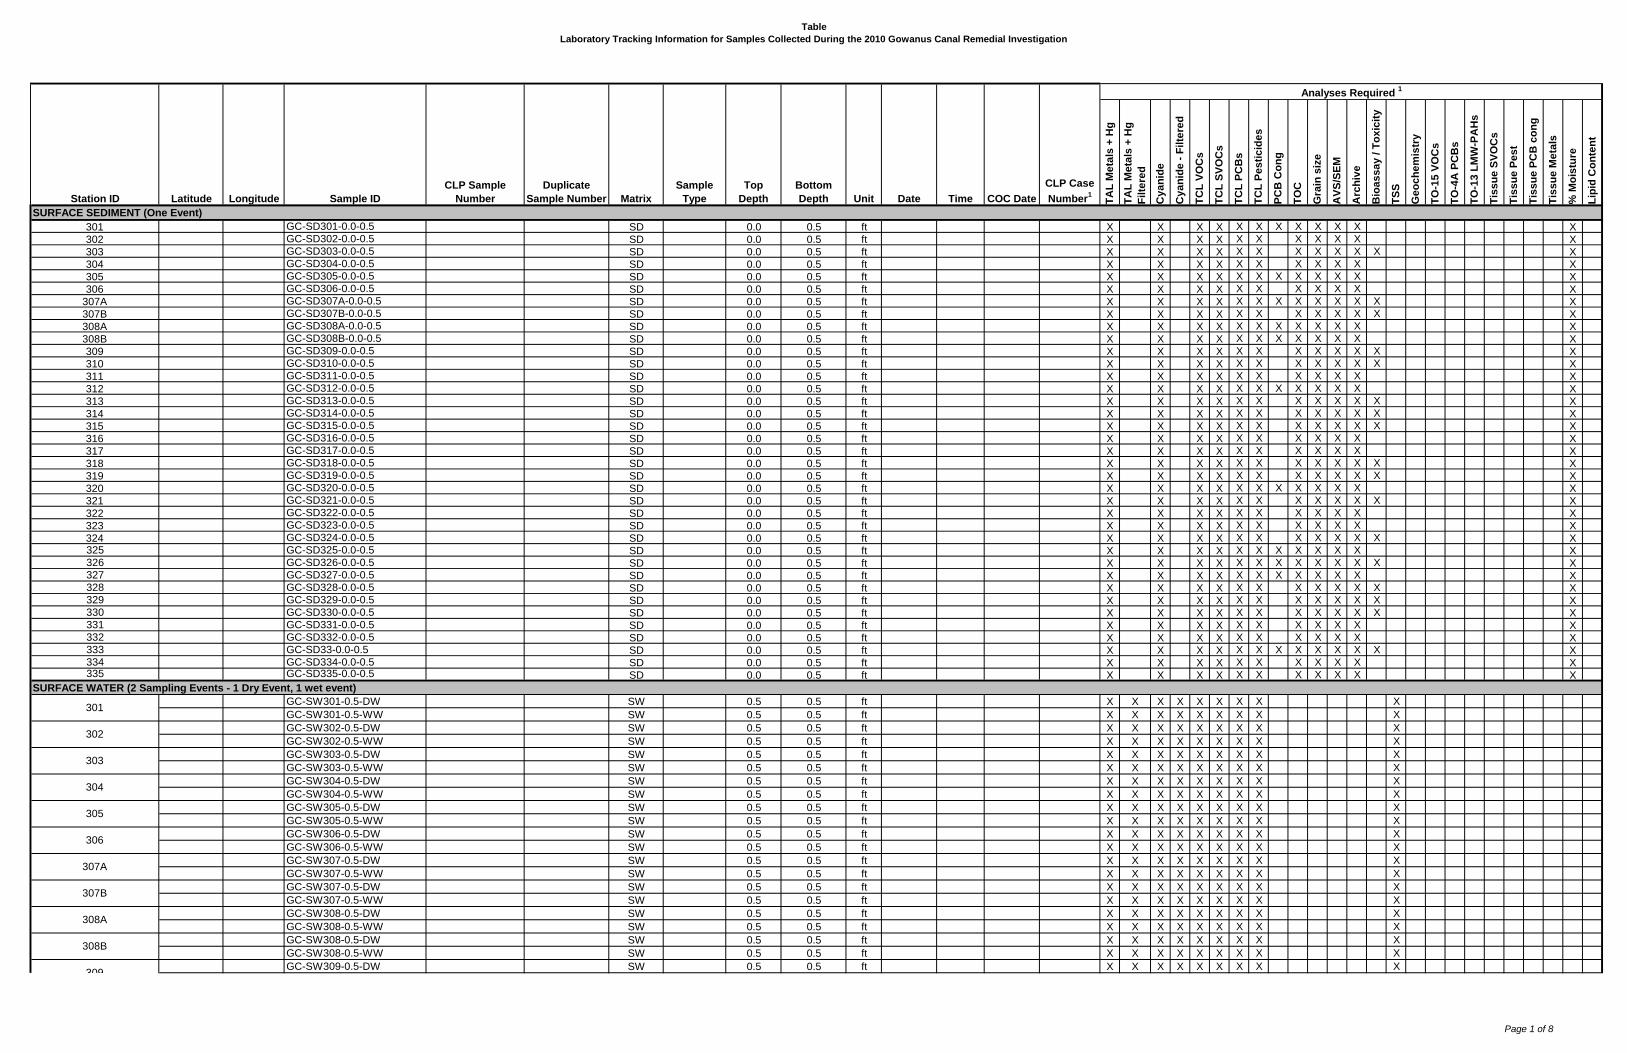
Table
Laboratory Tracking Information for Samples Collected During the 2010 Gowanus Canal Remedial Investigation
TA
L M
eta
ls +
Hg
TA
L M
eta
ls +
Hg
Filte
red
Cy
an
ide
Cy
an
ide
- F
ilte
red
TC
L V
OC
s
TC
L S
VO
Cs
TC
L P
CB
s
TC
L P
es
tic
ide
s
PC
B C
on
g
TO
C
Gra
in s
ize
AV
S/S
EM
Arc
hiv
e
Bio
as
sa
y / T
ox
icit
y
TS
S
Ge
oc
he
mis
try
TO
-15
VO
Cs
TO
-4A
PC
Bs
TO
-13
LM
W-P
AH
s
Tis
su
e S
VO
Cs
Tis
su
e P
es
t
Tis
su
e P
CB
co
ng
Tis
su
e M
eta
ls
% M
ois
ture
Lip
id C
on
ten
t
301 GC-SD301-0.0-0.5 SD 0.0 0.5 ft X X X X X X X X X X X X
302 GC-SD302-0.0-0.5 SD 0.0 0.5 ft X X X X X X X X X X X
303 GC-SD303-0.0-0.5 SD 0.0 0.5 ft X X X X X X X X X X X X
304 GC-SD304-0.0-0.5 SD 0.0 0.5 ft X X X X X X X X X X X
305 GC-SD305-0.0-0.5 SD 0.0 0.5 ft X X X X X X X X X X X X
306 GC-SD306-0.0-0.5 SD 0.0 0.5 ft X X X X X X X X X X X
307A GC-SD307A-0.0-0.5 SD 0.0 0.5 ft X X X X X X X X X X X X X
307B GC-SD307B-0.0-0.5 SD 0.0 0.5 ft X X X X X X X X X X X X
308A GC-SD308A-0.0-0.5 SD 0.0 0.5 ft X X X X X X X X X X X X
308B GC-SD308B-0.0-0.5 SD 0.0 0.5 ft X X X X X X X X X X X X
309 GC-SD309-0.0-0.5 SD 0.0 0.5 ft X X X X X X X X X X X X
310 GC-SD310-0.0-0.5 SD 0.0 0.5 ft X X X X X X X X X X X X
311 GC-SD311-0.0-0.5 SD 0.0 0.5 ft X X X X X X X X X X X
312 GC-SD312-0.0-0.5 SD 0.0 0.5 ft X X X X X X X X X X X X
313 GC-SD313-0.0-0.5 SD 0.0 0.5 ft X X X X X X X X X X X X
314 GC-SD314-0.0-0.5 SD 0.0 0.5 ft X X X X X X X X X X X X
315 GC-SD315-0.0-0.5 SD 0.0 0.5 ft X X X X X X X X X X X X
316 GC-SD316-0.0-0.5 SD 0.0 0.5 ft X X X X X X X X X X X
317 GC-SD317-0.0-0.5 SD 0.0 0.5 ft X X X X X X X X X X X
318 GC-SD318-0.0-0.5 SD 0.0 0.5 ft X X X X X X X X X X X X
319 GC-SD319-0.0-0.5 SD 0.0 0.5 ft X X X X X X X X X X X X
320 GC-SD320-0.0-0.5 SD 0.0 0.5 ft X X X X X X X X X X X X
321 GC-SD321-0.0-0.5 SD 0.0 0.5 ft X X X X X X X X X X X X
322 GC-SD322-0.0-0.5 SD 0.0 0.5 ft X X X X X X X X X X X
323 GC-SD323-0.0-0.5 SD 0.0 0.5 ft X X X X X X X X X X X
324 GC-SD324-0.0-0.5 SD 0.0 0.5 ft X X X X X X X X X X X X325 GC-SD325-0.0-0.5 SD 0.0 0.5 ft X X X X X X X X X X X X326 GC-SD326-0.0-0.5 SD 0.0 0.5 ft X X X X X X X X X X X X X327 GC-SD327-0.0-0.5 SD 0.0 0.5 ft X X X X X X X X X X X X328 GC-SD328-0.0-0.5 SD 0.0 0.5 ft X X X X X X X X X X X X329 GC-SD329-0.0-0.5 SD 0.0 0.5 ft X X X X X X X X X X X X330 GC-SD330-0.0-0.5 SD 0.0 0.5 ft X X X X X X X X X X X X331 GC-SD331-0.0-0.5 SD 0.0 0.5 ft X X X X X X X X X X X332 GC-SD332-0.0-0.5 SD 0.0 0.5 ft X X X X X X X X X X X333 GC-SD33-0.0-0.5 SD 0.0 0.5 ft X X X X X X X X X X X X X334 GC-SD334-0.0-0.5 SD 0.0 0.5 ft X X X X X X X X X X X335 GC-SD335-0.0-0.5 SD 0.0 0.5 ft X X X X X X X X X X X
GC-SW301-0.5-DW SW 0.5 0.5 ft X X X X X X X X X
GC-SW301-0.5-WW SW 0.5 0.5 ft X X X X X X X X X
GC-SW302-0.5-DW SW 0.5 0.5 ft X X X X X X X X X
GC-SW302-0.5-WW SW 0.5 0.5 ft X X X X X X X X X
GC-SW303-0.5-DW SW 0.5 0.5 ft X X X X X X X X X
GC-SW303-0.5-WW SW 0.5 0.5 ft X X X X X X X X X
GC-SW304-0.5-DW SW 0.5 0.5 ft X X X X X X X X X
GC-SW304-0.5-WW SW 0.5 0.5 ft X X X X X X X X X
GC-SW305-0.5-DW SW 0.5 0.5 ft X X X X X X X X X
GC-SW305-0.5-WW SW 0.5 0.5 ft X X X X X X X X X
GC-SW306-0.5-DW SW 0.5 0.5 ft X X X X X X X X X
GC-SW306-0.5-WW SW 0.5 0.5 ft X X X X X X X X X
GC-SW307-0.5-DW SW 0.5 0.5 ft X X X X X X X X X
GC-SW307-0.5-WW SW 0.5 0.5 ft X X X X X X X X X
GC-SW307-0.5-DW SW 0.5 0.5 ft X X X X X X X X X
GC-SW307-0.5-WW SW 0.5 0.5 ft X X X X X X X X X
GC-SW308-0.5-DW SW 0.5 0.5 ft X X X X X X X X X
GC-SW308-0.5-WW SW 0.5 0.5 ft X X X X X X X X X
GC-SW308-0.5-DW SW 0.5 0.5 ft X X X X X X X X X
GC-SW308-0.5-WW SW 0.5 0.5 ft X X X X X X X X X
GC-SW309-0.5-DW SW 0.5 0.5 ft X X X X X X X X X
Top
Depth
Bottom
Depth
302
303
SURFACE SEDIMENT (One Event)
Station ID
301
SURFACE WATER (2 Sampling Events - 1 Dry Event, 1 wet event)
COC DateLatitude Longitude Date
Analyses Required 1
CLP Case
Number1
Unit TimeSample ID
CLP Sample
Number
Duplicate
Sample Number Matrix
Sample
Type
308A
309
304
305
306
307A
307B
308B
Page 1 of 8
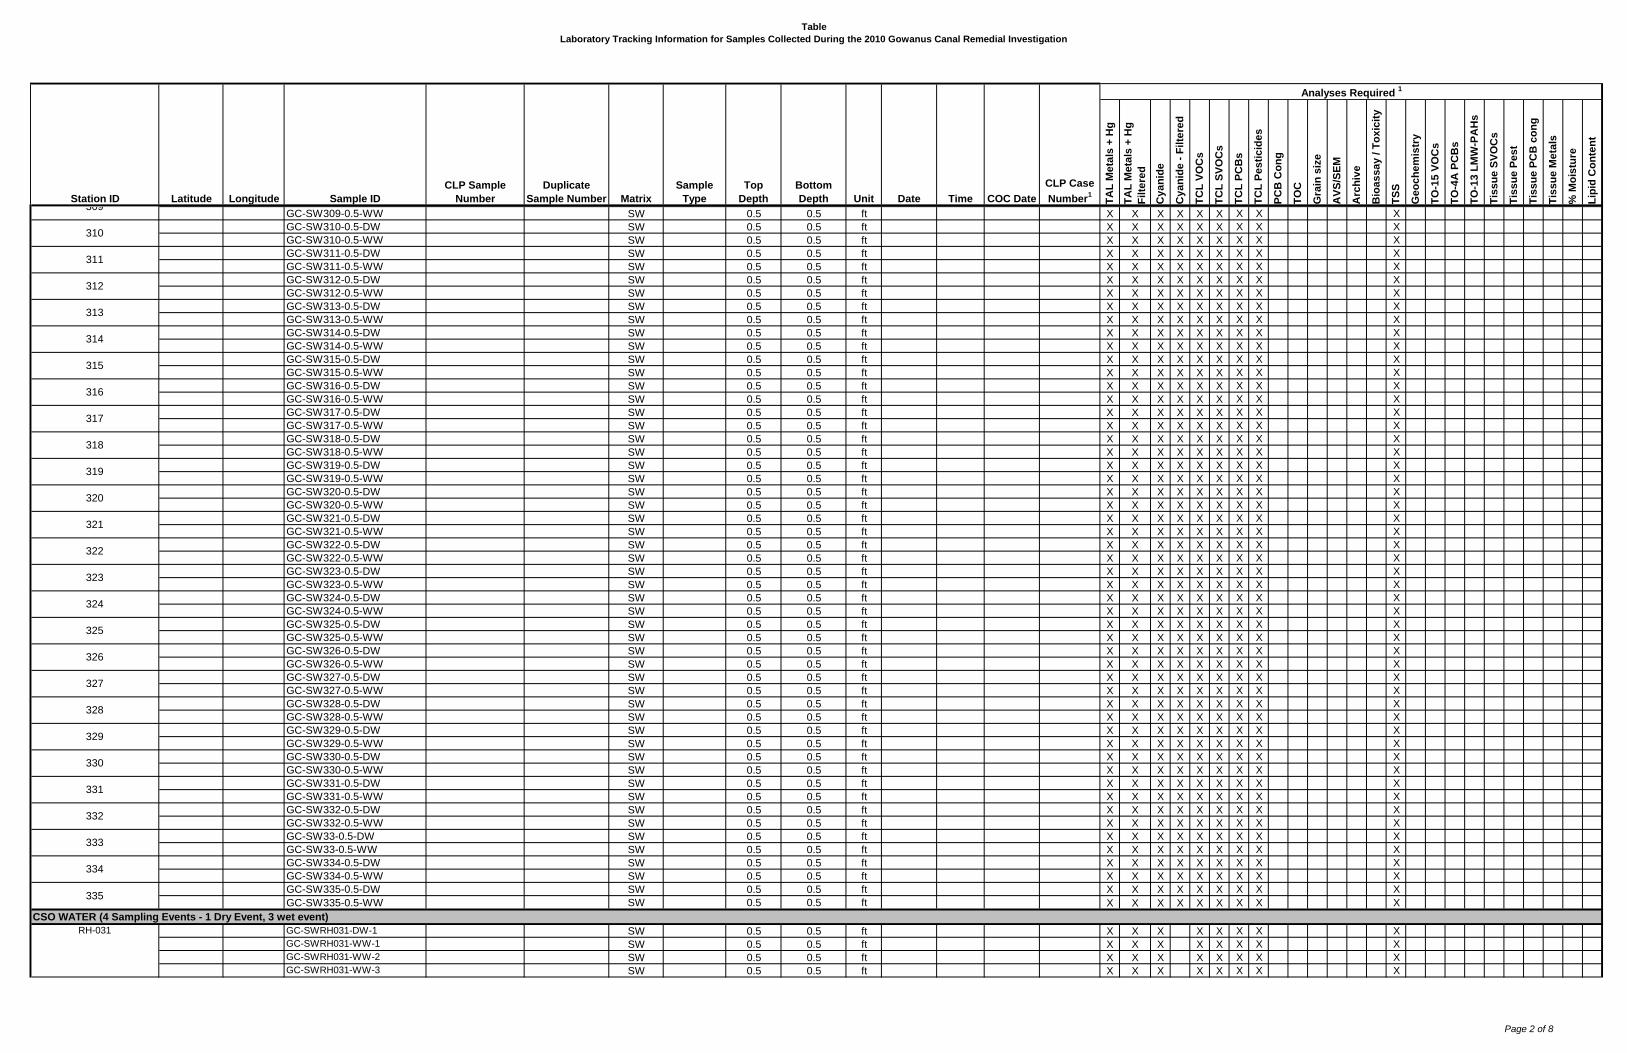
Table
Laboratory Tracking Information for Samples Collected During the 2010 Gowanus Canal Remedial Investigation
TA
L M
eta
ls +
Hg
TA
L M
eta
ls +
Hg
Filte
red
Cy
an
ide
Cy
an
ide
- F
ilte
red
TC
L V
OC
s
TC
L S
VO
Cs
TC
L P
CB
s
TC
L P
es
tic
ide
s
PC
B C
on
g
TO
C
Gra
in s
ize
AV
S/S
EM
Arc
hiv
e
Bio
as
sa
y / T
ox
icit
y
TS
S
Ge
oc
he
mis
try
TO
-15
VO
Cs
TO
-4A
PC
Bs
TO
-13
LM
W-P
AH
s
Tis
su
e S
VO
Cs
Tis
su
e P
es
t
Tis
su
e P
CB
co
ng
Tis
su
e M
eta
ls
% M
ois
ture
Lip
id C
on
ten
t
Top
Depth
Bottom
Depth
SURFACE SEDIMENT (One Event)
Station ID COC DateLatitude Longitude Date
Analyses Required 1
CLP Case
Number1
Unit TimeSample ID
CLP Sample
Number
Duplicate
Sample Number Matrix
Sample
Type
GC-SW309-0.5-WW SW 0.5 0.5 ft X X X X X X X X X
GC-SW310-0.5-DW SW 0.5 0.5 ft X X X X X X X X X
GC-SW310-0.5-WW SW 0.5 0.5 ft X X X X X X X X X
GC-SW311-0.5-DW SW 0.5 0.5 ft X X X X X X X X X
GC-SW311-0.5-WW SW 0.5 0.5 ft X X X X X X X X X
GC-SW312-0.5-DW SW 0.5 0.5 ft X X X X X X X X X
GC-SW312-0.5-WW SW 0.5 0.5 ft X X X X X X X X X
GC-SW313-0.5-DW SW 0.5 0.5 ft X X X X X X X X X
GC-SW313-0.5-WW SW 0.5 0.5 ft X X X X X X X X X
GC-SW314-0.5-DW SW 0.5 0.5 ft X X X X X X X X X
GC-SW314-0.5-WW SW 0.5 0.5 ft X X X X X X X X X
GC-SW315-0.5-DW SW 0.5 0.5 ft X X X X X X X X X
GC-SW315-0.5-WW SW 0.5 0.5 ft X X X X X X X X X
GC-SW316-0.5-DW SW 0.5 0.5 ft X X X X X X X X X
GC-SW316-0.5-WW SW 0.5 0.5 ft X X X X X X X X X
GC-SW317-0.5-DW SW 0.5 0.5 ft X X X X X X X X X
GC-SW317-0.5-WW SW 0.5 0.5 ft X X X X X X X X X
GC-SW318-0.5-DW SW 0.5 0.5 ft X X X X X X X X X
GC-SW318-0.5-WW SW 0.5 0.5 ft X X X X X X X X X
GC-SW319-0.5-DW SW 0.5 0.5 ft X X X X X X X X X
GC-SW319-0.5-WW SW 0.5 0.5 ft X X X X X X X X X
GC-SW320-0.5-DW SW 0.5 0.5 ft X X X X X X X X X
GC-SW320-0.5-WW SW 0.5 0.5 ft X X X X X X X X X
GC-SW321-0.5-DW SW 0.5 0.5 ft X X X X X X X X X
GC-SW321-0.5-WW SW 0.5 0.5 ft X X X X X X X X X
GC-SW322-0.5-DW SW 0.5 0.5 ft X X X X X X X X X
GC-SW322-0.5-WW SW 0.5 0.5 ft X X X X X X X X X
GC-SW323-0.5-DW SW 0.5 0.5 ft X X X X X X X X X
GC-SW323-0.5-WW SW 0.5 0.5 ft X X X X X X X X X
GC-SW324-0.5-DW SW 0.5 0.5 ft X X X X X X X X X
GC-SW324-0.5-WW SW 0.5 0.5 ft X X X X X X X X X
GC-SW325-0.5-DW SW 0.5 0.5 ft X X X X X X X X X
GC-SW325-0.5-WW SW 0.5 0.5 ft X X X X X X X X X
GC-SW326-0.5-DW SW 0.5 0.5 ft X X X X X X X X X
GC-SW326-0.5-WW SW 0.5 0.5 ft X X X X X X X X X
GC-SW327-0.5-DW SW 0.5 0.5 ft X X X X X X X X X
GC-SW327-0.5-WW SW 0.5 0.5 ft X X X X X X X X X
GC-SW328-0.5-DW SW 0.5 0.5 ft X X X X X X X X X
GC-SW328-0.5-WW SW 0.5 0.5 ft X X X X X X X X X
GC-SW329-0.5-DW SW 0.5 0.5 ft X X X X X X X X X
GC-SW329-0.5-WW SW 0.5 0.5 ft X X X X X X X X X
GC-SW330-0.5-DW SW 0.5 0.5 ft X X X X X X X X X
GC-SW330-0.5-WW SW 0.5 0.5 ft X X X X X X X X X
GC-SW331-0.5-DW SW 0.5 0.5 ft X X X X X X X X X
GC-SW331-0.5-WW SW 0.5 0.5 ft X X X X X X X X X
GC-SW332-0.5-DW SW 0.5 0.5 ft X X X X X X X X X
GC-SW332-0.5-WW SW 0.5 0.5 ft X X X X X X X X X
GC-SW33-0.5-DW SW 0.5 0.5 ft X X X X X X X X X
GC-SW33-0.5-WW SW 0.5 0.5 ft X X X X X X X X X
GC-SW334-0.5-DW SW 0.5 0.5 ft X X X X X X X X X
GC-SW334-0.5-WW SW 0.5 0.5 ft X X X X X X X X X
GC-SW335-0.5-DW SW 0.5 0.5 ft X X X X X X X X X
GC-SW335-0.5-WW SW 0.5 0.5 ft X X X X X X X X X
GC-SWRH031-DW-1 SW 0.5 0.5 ft X X X X X X X XGC-SWRH031-WW-1 SW 0.5 0.5 ft X X X X X X X XGC-SWRH031-WW-2 SW 0.5 0.5 ft X X X X X X X XGC-SWRH031-WW-3 SW 0.5 0.5 ft X X X X X X X X
321
310
311
312
309
320
313
314
315
316
317
318
319
332
333
322
323
324
325
326
327
328
329
330
331
334
335
CSO WATER (4 Sampling Events - 1 Dry Event, 3 wet event)
RH-031
Page 2 of 8
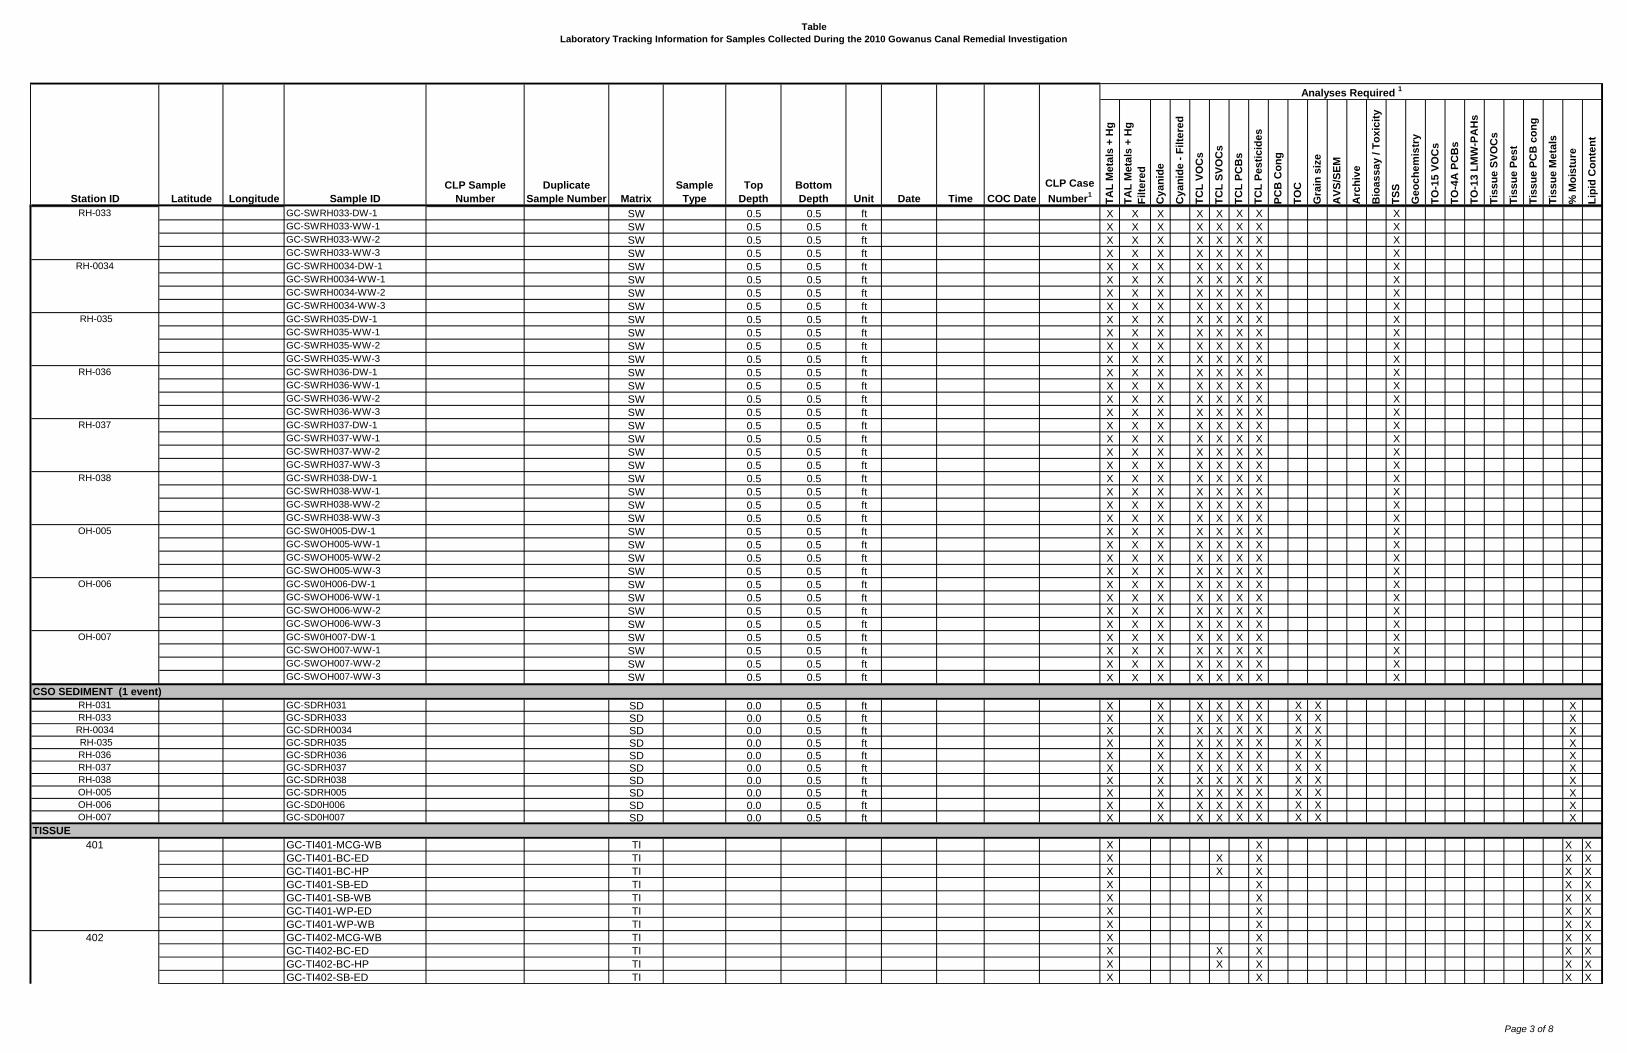
Table
Laboratory Tracking Information for Samples Collected During the 2010 Gowanus Canal Remedial Investigation
TA
L M
eta
ls +
Hg
TA
L M
eta
ls +
Hg
Filte
red
Cy
an
ide
Cy
an
ide
- F
ilte
red
TC
L V
OC
s
TC
L S
VO
Cs
TC
L P
CB
s
TC
L P
es
tic
ide
s
PC
B C
on
g
TO
C
Gra
in s
ize
AV
S/S
EM
Arc
hiv
e
Bio
as
sa
y / T
ox
icit
y
TS
S
Ge
oc
he
mis
try
TO
-15
VO
Cs
TO
-4A
PC
Bs
TO
-13
LM
W-P
AH
s
Tis
su
e S
VO
Cs
Tis
su
e P
es
t
Tis
su
e P
CB
co
ng
Tis
su
e M
eta
ls
% M
ois
ture
Lip
id C
on
ten
t
Top
Depth
Bottom
Depth
SURFACE SEDIMENT (One Event)
Station ID COC DateLatitude Longitude Date
Analyses Required 1
CLP Case
Number1
Unit TimeSample ID
CLP Sample
Number
Duplicate
Sample Number Matrix
Sample
Type
GC-SWRH033-DW-1 SW 0.5 0.5 ft X X X X X X X XGC-SWRH033-WW-1 SW 0.5 0.5 ft X X X X X X X XGC-SWRH033-WW-2 SW 0.5 0.5 ft X X X X X X X XGC-SWRH033-WW-3 SW 0.5 0.5 ft X X X X X X X X
GC-SWRH0034-DW-1 SW 0.5 0.5 ft X X X X X X X XGC-SWRH0034-WW-1 SW 0.5 0.5 ft X X X X X X X XGC-SWRH0034-WW-2 SW 0.5 0.5 ft X X X X X X X XGC-SWRH0034-WW-3 SW 0.5 0.5 ft X X X X X X X X
GC-SWRH035-DW-1 SW 0.5 0.5 ft X X X X X X X XGC-SWRH035-WW-1 SW 0.5 0.5 ft X X X X X X X XGC-SWRH035-WW-2 SW 0.5 0.5 ft X X X X X X X XGC-SWRH035-WW-3 SW 0.5 0.5 ft X X X X X X X X
GC-SWRH036-DW-1 SW 0.5 0.5 ft X X X X X X X XGC-SWRH036-WW-1 SW 0.5 0.5 ft X X X X X X X XGC-SWRH036-WW-2 SW 0.5 0.5 ft X X X X X X X XGC-SWRH036-WW-3 SW 0.5 0.5 ft X X X X X X X X
GC-SWRH037-DW-1 SW 0.5 0.5 ft X X X X X X X XGC-SWRH037-WW-1 SW 0.5 0.5 ft X X X X X X X XGC-SWRH037-WW-2 SW 0.5 0.5 ft X X X X X X X XGC-SWRH037-WW-3 SW 0.5 0.5 ft X X X X X X X X
GC-SWRH038-DW-1 SW 0.5 0.5 ft X X X X X X X XGC-SWRH038-WW-1 SW 0.5 0.5 ft X X X X X X X XGC-SWRH038-WW-2 SW 0.5 0.5 ft X X X X X X X XGC-SWRH038-WW-3 SW 0.5 0.5 ft X X X X X X X X
GC-SW0H005-DW-1 SW 0.5 0.5 ft X X X X X X X XGC-SWOH005-WW-1 SW 0.5 0.5 ft X X X X X X X XGC-SWOH005-WW-2 SW 0.5 0.5 ft X X X X X X X XGC-SWOH005-WW-3 SW 0.5 0.5 ft X X X X X X X X
GC-SW0H006-DW-1 SW 0.5 0.5 ft X X X X X X X XGC-SWOH006-WW-1 SW 0.5 0.5 ft X X X X X X X XGC-SWOH006-WW-2 SW 0.5 0.5 ft X X X X X X X XGC-SWOH006-WW-3 SW 0.5 0.5 ft X X X X X X X X
GC-SW0H007-DW-1 SW 0.5 0.5 ft X X X X X X X XGC-SWOH007-WW-1 SW 0.5 0.5 ft X X X X X X X XGC-SWOH007-WW-2 SW 0.5 0.5 ft X X X X X X X XGC-SWOH007-WW-3 SW 0.5 0.5 ft X X X X X X X X
RH-031 GC-SDRH031 SD 0.0 0.5 ft X X X X X X X X XRH-033 GC-SDRH033 SD 0.0 0.5 ft X X X X X X X X XRH-0034 GC-SDRH0034 SD 0.0 0.5 ft X X X X X X X X X RH-035 GC-SDRH035 SD 0.0 0.5 ft X X X X X X X X XRH-036 GC-SDRH036 SD 0.0 0.5 ft X X X X X X X X XRH-037 GC-SDRH037 SD 0.0 0.5 ft X X X X X X X X XRH-038 GC-SDRH038 SD 0.0 0.5 ft X X X X X X X X XOH-005 GC-SDRH005 SD 0.0 0.5 ft X X X X X X X X XOH-006 GC-SD0H006 SD 0.0 0.5 ft X X X X X X X X XOH-007 GC-SD0H007 SD 0.0 0.5 ft X X X X X X X X X
GC-TI401-MCG-WB TI X X X X
GC-TI401-BC-ED TI X X X X X
GC-TI401-BC-HP TI X X X X X
GC-TI401-SB-ED TI X X X X
GC-TI401-SB-WB TI X X X X
GC-TI401-WP-ED TI X X X X
GC-TI401-WP-WB TI X X X X
GC-TI402-MCG-WB TI X X X X
GC-TI402-BC-ED TI X X X X X
GC-TI402-BC-HP TI X X X X X
GC-TI402-SB-ED TI X X X X
TISSUE
401
402
RH-0034
RH-033
RH-035
RH-037
RH-036
RH-038
OH-005
OH-006
OH-007
CSO SEDIMENT (1 event)
Page 3 of 8
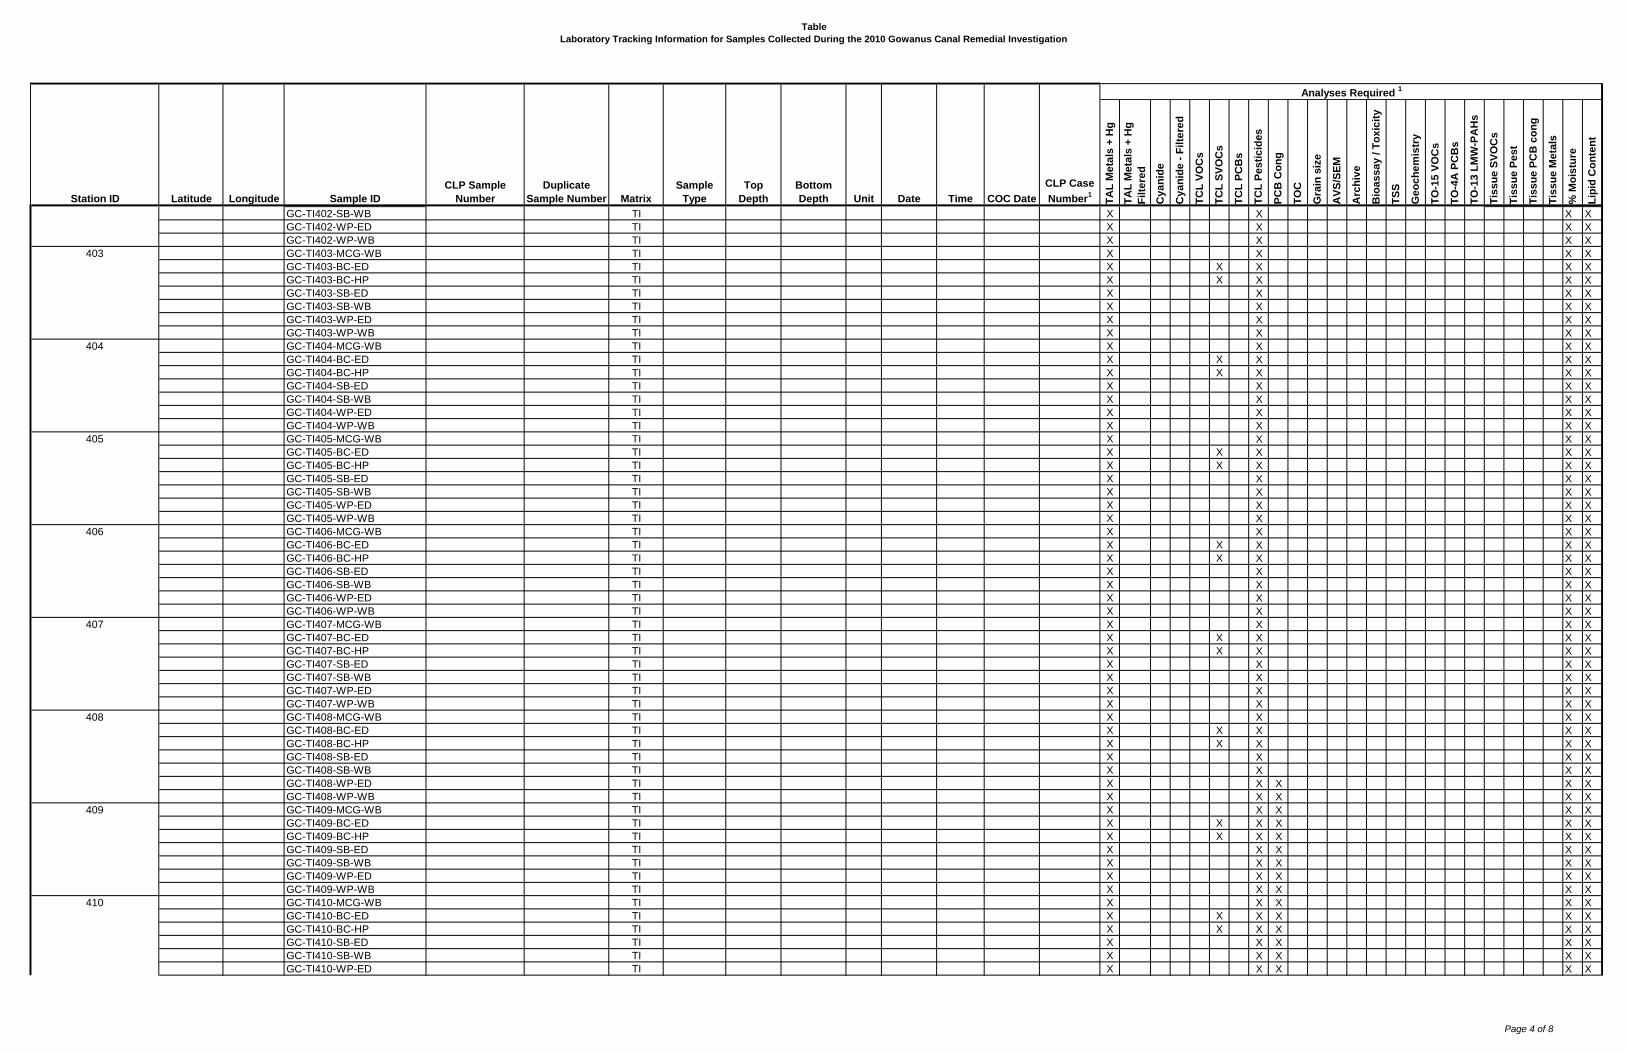
Table
Laboratory Tracking Information for Samples Collected During the 2010 Gowanus Canal Remedial Investigation
TA
L M
eta
ls +
Hg
TA
L M
eta
ls +
Hg
Filte
red
Cy
an
ide
Cy
an
ide
- F
ilte
red
TC
L V
OC
s
TC
L S
VO
Cs
TC
L P
CB
s
TC
L P
es
tic
ide
s
PC
B C
on
g
TO
C
Gra
in s
ize
AV
S/S
EM
Arc
hiv
e
Bio
as
sa
y / T
ox
icit
y
TS
S
Ge
oc
he
mis
try
TO
-15
VO
Cs
TO
-4A
PC
Bs
TO
-13
LM
W-P
AH
s
Tis
su
e S
VO
Cs
Tis
su
e P
es
t
Tis
su
e P
CB
co
ng
Tis
su
e M
eta
ls
% M
ois
ture
Lip
id C
on
ten
t
Top
Depth
Bottom
Depth
SURFACE SEDIMENT (One Event)
Station ID COC DateLatitude Longitude Date
Analyses Required 1
CLP Case
Number1
Unit TimeSample ID
CLP Sample
Number
Duplicate
Sample Number Matrix
Sample
Type
GC-TI402-SB-WB TI X X X X
GC-TI402-WP-ED TI X X X X
GC-TI402-WP-WB TI X X X X
GC-TI403-MCG-WB TI X X X X
GC-TI403-BC-ED TI X X X X X
GC-TI403-BC-HP TI X X X X X
GC-TI403-SB-ED TI X X X X
GC-TI403-SB-WB TI X X X X
GC-TI403-WP-ED TI X X X X
GC-TI403-WP-WB TI X X X X
GC-TI404-MCG-WB TI X X X X
GC-TI404-BC-ED TI X X X X X
GC-TI404-BC-HP TI X X X X X
GC-TI404-SB-ED TI X X X X
GC-TI404-SB-WB TI X X X X
GC-TI404-WP-ED TI X X X X
GC-TI404-WP-WB TI X X X X
GC-TI405-MCG-WB TI X X X X
GC-TI405-BC-ED TI X X X X X
GC-TI405-BC-HP TI X X X X X
GC-TI405-SB-ED TI X X X X
GC-TI405-SB-WB TI X X X X
GC-TI405-WP-ED TI X X X X
GC-TI405-WP-WB TI X X X X
GC-TI406-MCG-WB TI X X X X
GC-TI406-BC-ED TI X X X X X
GC-TI406-BC-HP TI X X X X X
GC-TI406-SB-ED TI X X X X
GC-TI406-SB-WB TI X X X X
GC-TI406-WP-ED TI X X X X
GC-TI406-WP-WB TI X X X X
GC-TI407-MCG-WB TI X X X X
GC-TI407-BC-ED TI X X X X X
GC-TI407-BC-HP TI X X X X X
GC-TI407-SB-ED TI X X X X
GC-TI407-SB-WB TI X X X X
GC-TI407-WP-ED TI X X X X
GC-TI407-WP-WB TI X X X X
GC-TI408-MCG-WB TI X X X X
GC-TI408-BC-ED TI X X X X X
GC-TI408-BC-HP TI X X X X X
GC-TI408-SB-ED TI X X X X
GC-TI408-SB-WB TI X X X X
GC-TI408-WP-ED TI X X X X X
GC-TI408-WP-WB TI X X X X X
GC-TI409-MCG-WB TI X X X X X
GC-TI409-BC-ED TI X X X X X X
GC-TI409-BC-HP TI X X X X X X
GC-TI409-SB-ED TI X X X X X
GC-TI409-SB-WB TI X X X X X
GC-TI409-WP-ED TI X X X X X
GC-TI409-WP-WB TI X X X X X
GC-TI410-MCG-WB TI X X X X X
GC-TI410-BC-ED TI X X X X X X
GC-TI410-BC-HP TI X X X X X X
GC-TI410-SB-ED TI X X X X X
GC-TI410-SB-WB TI X X X X X
GC-TI410-WP-ED TI X X X X X
409
407
408
402
410
403
404
405
406
Page 4 of 8
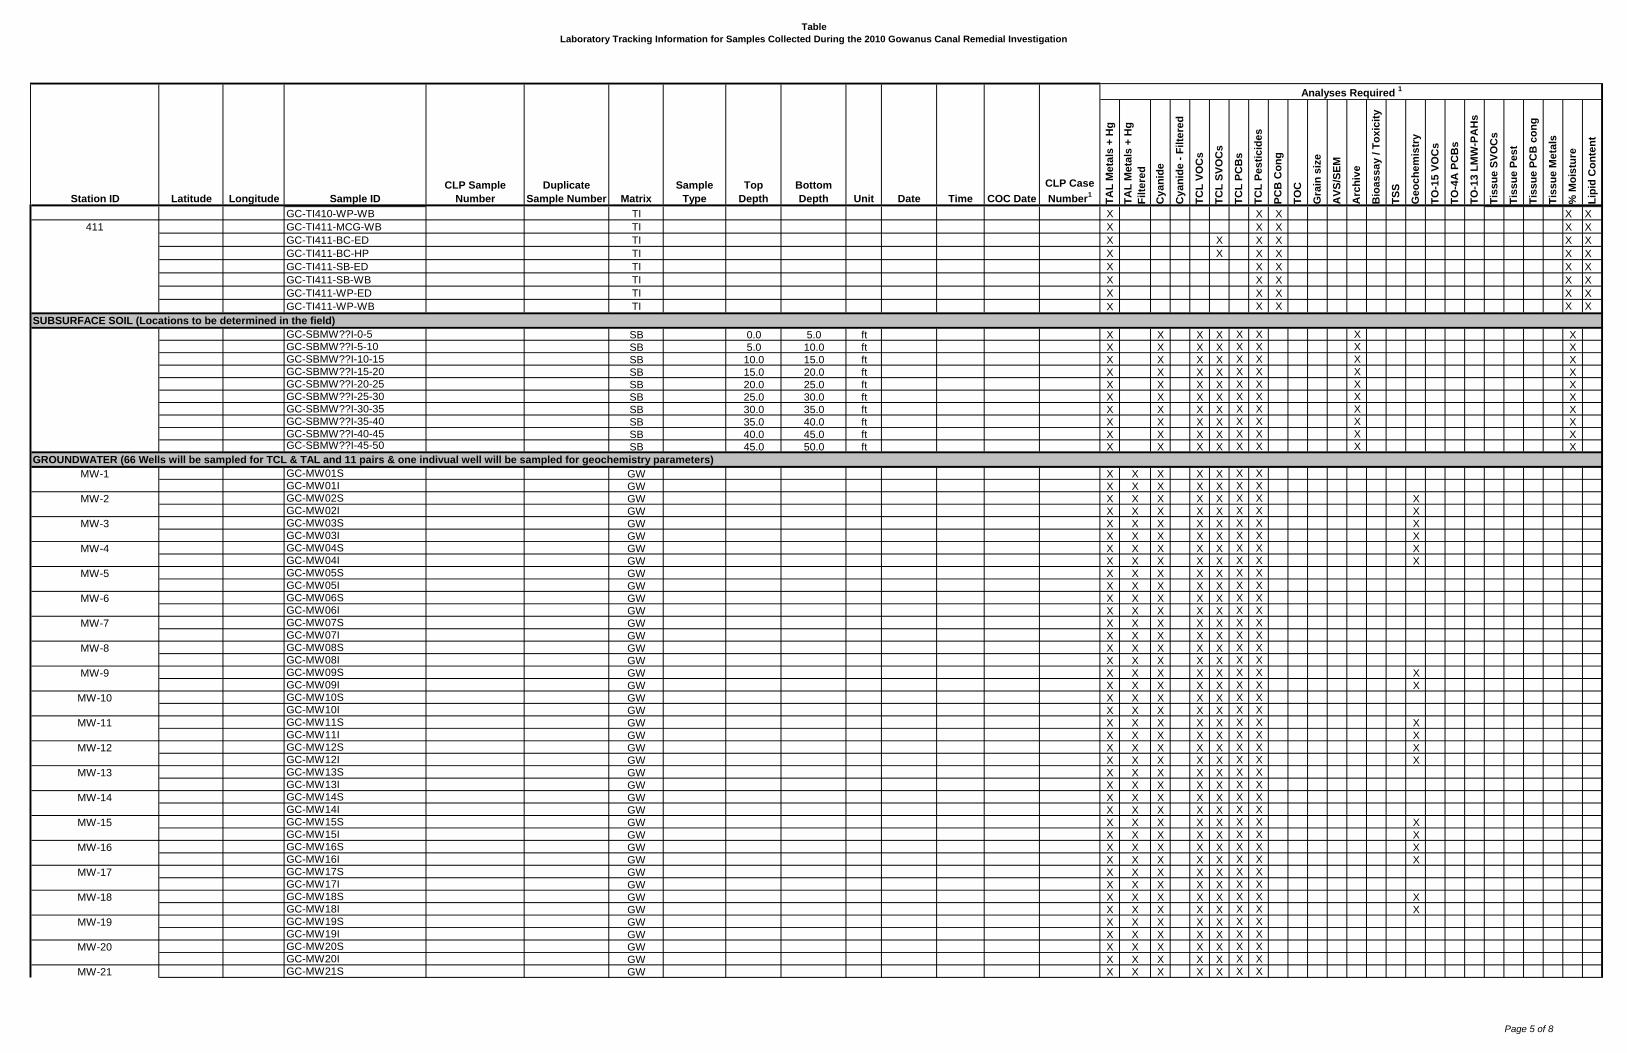
Table
Laboratory Tracking Information for Samples Collected During the 2010 Gowanus Canal Remedial Investigation
TA
L M
eta
ls +
Hg
TA
L M
eta
ls +
Hg
Filte
red
Cy
an
ide
Cy
an
ide
- F
ilte
red
TC
L V
OC
s
TC
L S
VO
Cs
TC
L P
CB
s
TC
L P
es
tic
ide
s
PC
B C
on
g
TO
C
Gra
in s
ize
AV
S/S
EM
Arc
hiv
e
Bio
as
sa
y / T
ox
icit
y
TS
S
Ge
oc
he
mis
try
TO
-15
VO
Cs
TO
-4A
PC
Bs
TO
-13
LM
W-P
AH
s
Tis
su
e S
VO
Cs
Tis
su
e P
es
t
Tis
su
e P
CB
co
ng
Tis
su
e M
eta
ls
% M
ois
ture
Lip
id C
on
ten
t
Top
Depth
Bottom
Depth
SURFACE SEDIMENT (One Event)
Station ID COC DateLatitude Longitude Date
Analyses Required 1
CLP Case
Number1
Unit TimeSample ID
CLP Sample
Number
Duplicate
Sample Number Matrix
Sample
Type
GC-TI410-WP-WB TI X X X X X
GC-TI411-MCG-WB TI X X X X X
GC-TI411-BC-ED TI X X X X X X
GC-TI411-BC-HP TI X X X X X X
GC-TI411-SB-ED TI X X X X X
GC-TI411-SB-WB TI X X X X X
GC-TI411-WP-ED TI X X X X X
GC-TI411-WP-WB TI X X X X X
GC-SBMW??I-0-5 SB 0.0 5.0 ft X X X X X X X XGC-SBMW??I-5-10 SB 5.0 10.0 ft X X X X X X X XGC-SBMW??I-10-15 SB 10.0 15.0 ft X X X X X X X XGC-SBMW??I-15-20 SB 15.0 20.0 ft X X X X X X X XGC-SBMW??I-20-25 SB 20.0 25.0 ft X X X X X X X XGC-SBMW??I-25-30 SB 25.0 30.0 ft X X X X X X X XGC-SBMW??I-30-35 SB 30.0 35.0 ft X X X X X X X XGC-SBMW??I-35-40 SB 35.0 40.0 ft X X X X X X X XGC-SBMW??I-40-45 SB 40.0 45.0 ft X X X X X X X XGC-SBMW??I-45-50 SB 45.0 50.0 ft X X X X X X X X
GC-MW01S GW X X X X X X XGC-MW01I GW X X X X X X XGC-MW02S GW X X X X X X X XGC-MW02I GW X X X X X X X XGC-MW03S GW X X X X X X X XGC-MW03I GW X X X X X X X XGC-MW04S GW X X X X X X X XGC-MW04I GW X X X X X X X XGC-MW05S GW X X X X X X XGC-MW05I GW X X X X X X XGC-MW06S GW X X X X X X XGC-MW06I GW X X X X X X XGC-MW07S GW X X X X X X XGC-MW07I GW X X X X X X XGC-MW08S GW X X X X X X XGC-MW08I GW X X X X X X XGC-MW09S GW X X X X X X X XGC-MW09I GW X X X X X X X XGC-MW10S GW X X X X X X XGC-MW10I GW X X X X X X XGC-MW11S GW X X X X X X X XGC-MW11I GW X X X X X X X XGC-MW12S GW X X X X X X X XGC-MW12I GW X X X X X X X XGC-MW13S GW X X X X X X XGC-MW13I GW X X X X X X XGC-MW14S GW X X X X X X XGC-MW14I GW X X X X X X XGC-MW15S GW X X X X X X X XGC-MW15I GW X X X X X X X XGC-MW16S GW X X X X X X X XGC-MW16I GW X X X X X X X XGC-MW17S GW X X X X X X XGC-MW17I GW X X X X X X XGC-MW18S GW X X X X X X X XGC-MW18I GW X X X X X X X XGC-MW19S GW X X X X X X XGC-MW19I GW X X X X X X XGC-MW20S GW X X X X X X XGC-MW20I GW X X X X X X XGC-MW21S GW X X X X X X X
410
411
SUBSURFACE SOIL (Locations to be determined in the field)
GROUNDWATER (66 Wells will be sampled for TCL & TAL and 11 pairs & one indivual well will be sampled for geochemistry parameters)
MW-1
MW-2
MW-3
MW-4
MW-5
MW-6
MW-7
MW-8
MW-9
MW-10
MW-21
MW-11
MW-12
MW-13
MW-14
MW-15
MW-16
MW-17
MW-18
MW-19
MW-20
Page 5 of 8
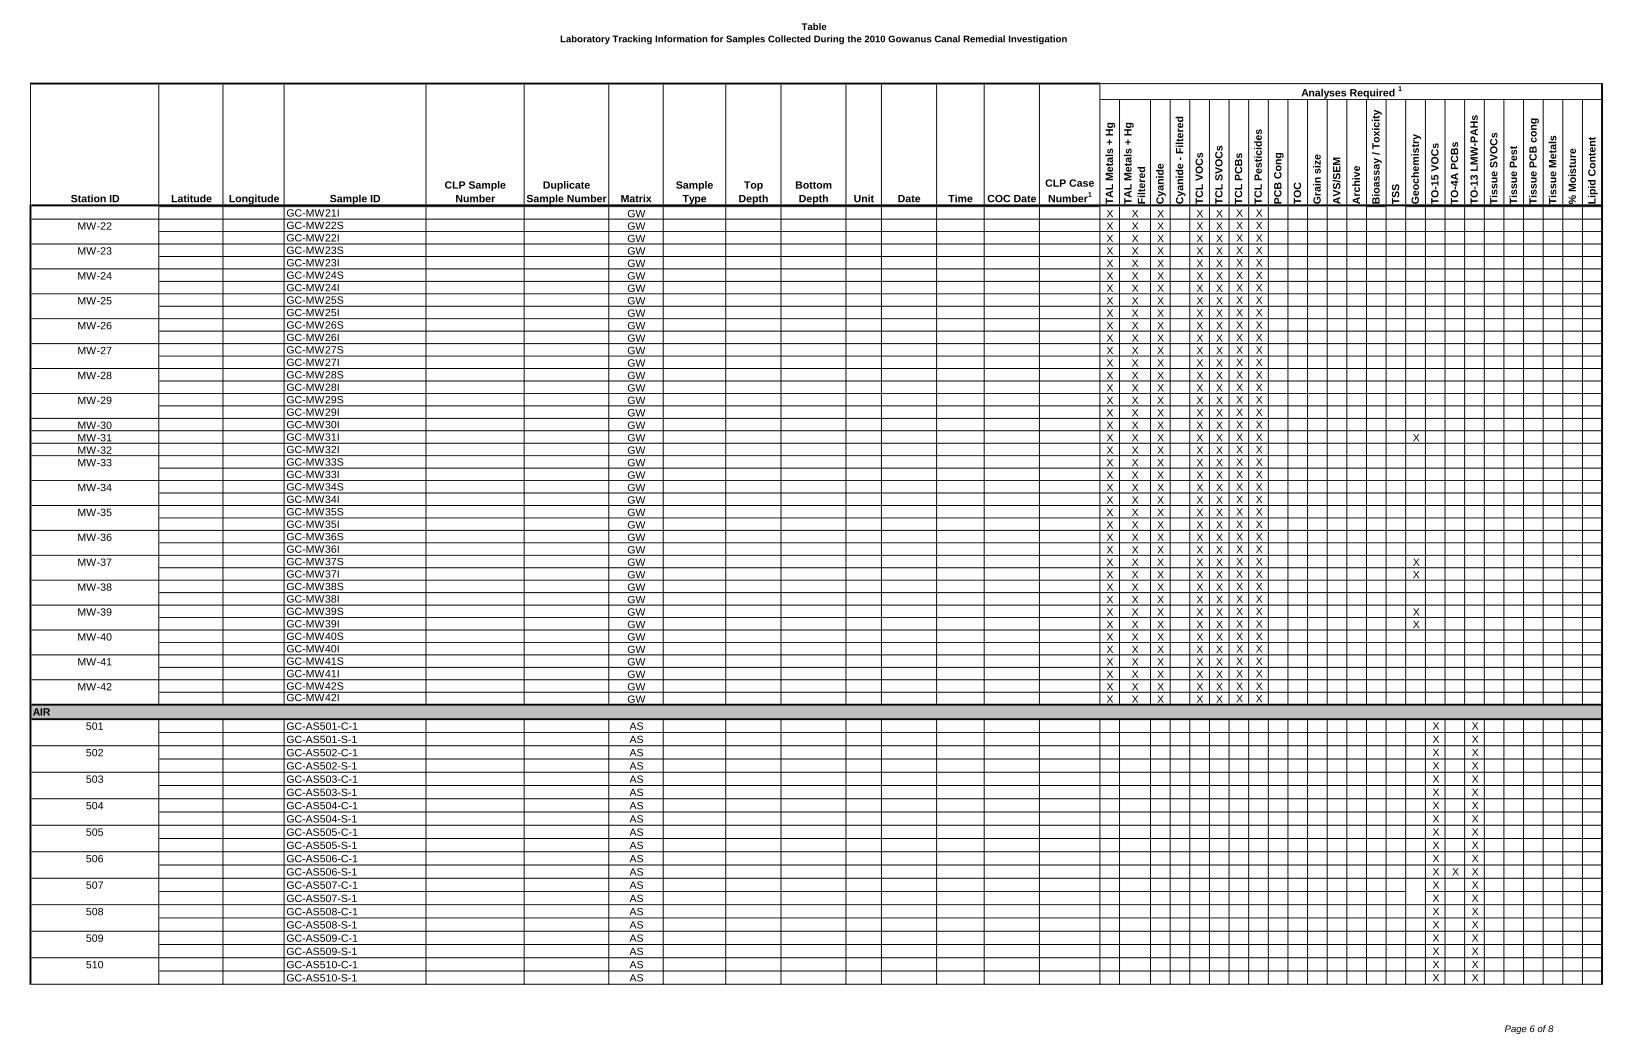
Table
Laboratory Tracking Information for Samples Collected During the 2010 Gowanus Canal Remedial Investigation
TA
L M
eta
ls +
Hg
TA
L M
eta
ls +
Hg
Filte
red
Cy
an
ide
Cy
an
ide
- F
ilte
red
TC
L V
OC
s
TC
L S
VO
Cs
TC
L P
CB
s
TC
L P
es
tic
ide
s
PC
B C
on
g
TO
C
Gra
in s
ize
AV
S/S
EM
Arc
hiv
e
Bio
as
sa
y / T
ox
icit
y
TS
S
Ge
oc
he
mis
try
TO
-15
VO
Cs
TO
-4A
PC
Bs
TO
-13
LM
W-P
AH
s
Tis
su
e S
VO
Cs
Tis
su
e P
es
t
Tis
su
e P
CB
co
ng
Tis
su
e M
eta
ls
% M
ois
ture
Lip
id C
on
ten
t
Top
Depth
Bottom
Depth
SURFACE SEDIMENT (One Event)
Station ID COC DateLatitude Longitude Date
Analyses Required 1
CLP Case
Number1
Unit TimeSample ID
CLP Sample
Number
Duplicate
Sample Number Matrix
Sample
Type
GC-MW21I GW X X X X X X XGC-MW22S GW X X X X X X XGC-MW22I GW X X X X X X XGC-MW23S GW X X X X X X XGC-MW23I GW X X X X X X XGC-MW24S GW X X X X X X XGC-MW24I GW X X X X X X XGC-MW25S GW X X X X X X XGC-MW25I GW X X X X X X XGC-MW26S GW X X X X X X XGC-MW26I GW X X X X X X XGC-MW27S GW X X X X X X XGC-MW27I GW X X X X X X XGC-MW28S GW X X X X X X XGC-MW28I GW X X X X X X XGC-MW29S GW X X X X X X XGC-MW29I GW X X X X X X X
MW-30 GC-MW30I GW X X X X X X X
MW-31 GC-MW31I GW X X X X X X X X
MW-32 GC-MW32I GW X X X X X X XGC-MW33S GW X X X X X X XGC-MW33I GW X X X X X X XGC-MW34S GW X X X X X X XGC-MW34I GW X X X X X X XGC-MW35S GW X X X X X X XGC-MW35I GW X X X X X X XGC-MW36S GW X X X X X X XGC-MW36I GW X X X X X X XGC-MW37S GW X X X X X X X XGC-MW37I GW X X X X X X X XGC-MW38S GW X X X X X X XGC-MW38I GW X X X X X X XGC-MW39S GW X X X X X X X XGC-MW39I GW X X X X X X X XGC-MW40S GW X X X X X X XGC-MW40I GW X X X X X X XGC-MW41S GW X X X X X X XGC-MW41I GW X X X X X X XGC-MW42S GW X X X X X X XGC-MW42I GW X X X X X X X
GC-AS501-C-1 AS X X
GC-AS501-S-1 AS X X
GC-AS502-C-1 AS X X
GC-AS502-S-1 AS X X
GC-AS503-C-1 AS X X
GC-AS503-S-1 AS X X
GC-AS504-C-1 AS X X
GC-AS504-S-1 AS X X
GC-AS505-C-1 AS X X
GC-AS505-S-1 AS X X
GC-AS506-C-1 AS X X
GC-AS506-S-1 AS X X X
GC-AS507-C-1 AS X X
GC-AS507-S-1 AS X X
GC-AS508-C-1 AS X X
GC-AS508-S-1 AS X X
GC-AS509-C-1 AS X X
GC-AS509-S-1 AS X X
GC-AS510-C-1 AS X X
GC-AS510-S-1 AS X X
AIR
508
509
510
503
504
501
502
505
506
507
MW-21
MW-22
MW-23
MW-24
MW-25
MW-26
MW-27
MW-28
MW-29
MW-40
MW-41
MW-42
MW-33
MW-34
MW-35
MW-36
MW-37
MW-38
MW-39
Page 6 of 8

Table
Laboratory Tracking Information for Samples Collected During the 2010 Gowanus Canal Remedial Investigation
TA
L M
eta
ls +
Hg
TA
L M
eta
ls +
Hg
Filte
red
Cy
an
ide
Cy
an
ide
- F
ilte
red
TC
L V
OC
s
TC
L S
VO
Cs
TC
L P
CB
s
TC
L P
es
tic
ide
s
PC
B C
on
g
TO
C
Gra
in s
ize
AV
S/S
EM
Arc
hiv
e
Bio
as
sa
y / T
ox
icit
y
TS
S
Ge
oc
he
mis
try
TO
-15
VO
Cs
TO
-4A
PC
Bs
TO
-13
LM
W-P
AH
s
Tis
su
e S
VO
Cs
Tis
su
e P
es
t
Tis
su
e P
CB
co
ng
Tis
su
e M
eta
ls
% M
ois
ture
Lip
id C
on
ten
t
Top
Depth
Bottom
Depth
SURFACE SEDIMENT (One Event)
Station ID COC DateLatitude Longitude Date
Analyses Required 1
CLP Case
Number1
Unit TimeSample ID
CLP Sample
Number
Duplicate
Sample Number Matrix
Sample
Type
511 GC-AS511-S-1 AS X X
512 GC-AS512-S-1 AS X X
513 GC-AS513-S-1 AS X X
GC-AS501-C-2 AS X X
GC-AS501-S-2 AS X X
GC-AS502-C-2 AS X X
GC-AS502-S-2 AS X X
GC-AS503-C-2 AS X X
GC-AS503-S-2 AS X X
GC-AS504-C-2 AS X X
GC-AS504-S-2 AS X X
GC-AS505-C-2 AS X X
GC-AS505-S-2 AS X X
GC-AS506-C-2 AS X X
GC-AS506-S-2 AS X X X
GC-AS507-C-2 AS X X
GC-AS507-S-2 AS X X
GC-AS508-C-2 AS X X
GC-AS508-S-2 AS X X
GC-AS509-C-2 AS X X
GC-AS509-S-2 AS X X
GC-AS510-C-2 AS X X X
GC-AS510-S-2 AS X X
511 GC-AS511-S-2 AS X X
512 GC-AS512-S-2 AS X X
513 GC-AS513-S-2 AS X X
GC-SWMW2 GC-SWMW2 SW GW/SW
interractionX
GC-SWMW3 GC-SWMW3 SW GW/SW
interractionX
GC-SWMW9 GC-SWMW9 SW GW/SW
interractionX
GC-SWMW11 GC-SWMW11 SW GW/SW
interractionX
GC-SWMW15 GC-SWMW15 SW GW/SW
interractionX
GC-SWMW18 GC-SWMW18 SW GW/SW
interractionX
GC-SWMW31 GC-SWMW31 SW GW/SW
interractionX
GC-SWMW37 GC-SWMW37 SW GW/SW
interractionX
GC-SWMW39 GC-SWMW39 SW GW/SW
interractionX
FIELD BLANKS
TRIP BLANKS
INVESTIGATION DERIVED WASTE
501
506
507
508
509
510
505
502
503
504
Surface Water for Geochemistry Evaluation (5 locations to be sampled)
Page 7 of 8

Table
Laboratory Tracking Information for Samples Collected During the 2010 Gowanus Canal Remedial Investigation
TA
L M
eta
ls +
Hg
TA
L M
eta
ls +
Hg
Filte
red
Cy
an
ide
Cy
an
ide
- F
ilte
red
TC
L V
OC
s
TC
L S
VO
Cs
TC
L P
CB
s
TC
L P
es
tic
ide
s
PC
B C
on
g
TO
C
Gra
in s
ize
AV
S/S
EM
Arc
hiv
e
Bio
as
sa
y / T
ox
icit
y
TS
S
Ge
oc
he
mis
try
TO
-15
VO
Cs
TO
-4A
PC
Bs
TO
-13
LM
W-P
AH
s
Tis
su
e S
VO
Cs
Tis
su
e P
es
t
Tis
su
e P
CB
co
ng
Tis
su
e M
eta
ls
% M
ois
ture
Lip
id C
on
ten
t
Top
Depth
Bottom
Depth
SURFACE SEDIMENT (One Event)
Station ID COC DateLatitude Longitude Date
Analyses Required 1
CLP Case
Number1
Unit TimeSample ID
CLP Sample
Number
Duplicate
Sample Number Matrix
Sample
Type
Legend:
EB Equipment Blank
FD Field Duplicate TAL Target Analyte List
TB Trip Blank TCL Target Compound List includes:
W Water sample for equipment and trip blanks volatile organic compounds, semi-volatile organic compounds, pesticides, and PCBs
N Normal VOC Volatile Organic Compound
AS Air sample SVOC Semi-Volatile Organic Compound
SD Sediment Sample PEST Pesticides
TI Tissue Sample PCB Polychlorinated biphenyls
SW Surface Water Sample LMW-PAHs Low molecular weight PAHs
WD IDW Sample AVS/SEM Acid volatile sulfide/simultaneously extracted metals
SB Soil Boring Sample TSS Total suspended solids
GW Ground Water Sample TO-15 VOCs volatile organic compounds in ambient air
Page 8 of 8
SOP-10: IDW Management and Sampling
Revision No.: 0
Date: February 2010
Page 1 of 4
STANDARD OPERATING PROCEDURE
IDW Management and Sampling
1.0 Scope and Application
The purpose of this Standard Operating Procedure (SOP) is to describe the management procedures for investigation derived waste for the Gowanus Canal Phase 3 Remedial Investigation. This SOP also defines the procedures for collecting samples from IDW waste streams (decontamination water and unused sample media). All waste streams will be stored and identified in accordance to the Site Management Plan.
2.0 General IDW Management Protocols
2.1 IDW vs. Municipal Trash
Any items that are contaminated or potentially contaminated due to contact with media (sediment, soil, or groundwater) must be disposed as IDW. This includes all excess soil and purge water and sampling equipment such as disposable scoops, pans, and gloves and other PPE used during the Phase 3 RI. All sampling equipment and plastic sheeting used to line the processing tables must also be disposed as IDW.
Any purge and rinse water (including acids) produced during the Phase 3 RI must be captured and drummed as IDW. These solutions must NOT be put down any drains that connect to a municipal sewer system or discharged to the canal.
Any items such as food wrappers & containers, coffee cups, packaging for supplies, that did not come in contact with contaminated materials can be disposed as regular municipal trash.
2.2 IDW Handling
The following sections detail how the different waste streams should be handled. At a minimum safety glasses and gloves are required for handling IDW; the site specific Health and Safety Plan should be consulted for additional instruction on PPE requirements.
2.2.1 Solid IDW produced during Phase 3 activities
All excess soils created during the installation of monitoring wells must be collected and disposed of in a plastic-lined IDW roll-off box. Any items that come into contact with contaminated or potentially contaminated media during the Phase 3 sampling activities must be disposed of as IDW. This includes all disposable scoops, pans, and gloves and other PPE used during the Phase 3 soil, sediment, CSO, and air sampling activities. These items get bagged in heavy duty plastic bags and are disposed in the solid waste IDW roll-off box (dumpster).
2.2.2 Aqueous IDW produced during Phase 3 activities All excess water (decon & purge water) created during the Phase 3 RI/FS will be collected and stored in DOT approved fifty-five gallon, open top, drums. Decontamination solutions may be collected in a dedicated, lidded high density polyethylene (HDPE) bucket in the processing area. This bucket will be emptied into a 55-gallon drum as needed.
SOP-10: IDW Management and Sampling
Revision No.: 0
Date: February 2010
Page 2 of 4
2.3 Municipal Trash Handling
All non-contaminated municipal trash (coffee cups, food wrappers, etc) should be securely bagged in heavy duty garbage bags and disposed in the general trash dumpster. Small, loose debris should not be thrown in the dumpster without being bagged.
2.4 IDW Dumpster or Roll-off Box Management
The following guidelines will be followed with respect to the IDW dumpster or roll-off box.
o Container is covered with tarp at all times unless IDW is being transferred into container
o Container is double lined with plastic liners
o The staging area for the container is lined with a plastic liner
o Container is labeled "IDW Storage"
o Container is stored on adjacent fenced lot with separate (2nd) security fence specifically around the container.
o Any time a container is delivered or IDW is picked up by a waste handling subcontractor, the activity will be noted on the IDW delivery and pickup tracking log (attached).
2.5 Drum Management
The following guidelines will be followed with respect to the drum management:
o Staging area for drums is lined with a plastic liner (whether inside building or outside)
o Individual drums must be labeled [Drum No….; Contents – IDW sediment or water; Analysis Pending; Start date ….; sediment cores disposed of in the drum; and contact information]
o Mark the IDW added to drum (e.g., the core No.) every time IDW is added.
o Mark the same information in the IDW drum contents tracking log
o Drums must be stored inside building or within fenced area of property
o Any time drums are delivered or IDW is picked up by a waste handling subcontractor, the activity will be noted on the waste tracking table (attached).
o Information on the drum label must be correct and consistent with the information on the IDW drum contents tracking log. Verify that this is the case for the drum in use every time IDW is added to the drum.
3.0 IDW Sampling Procedures
3.1 Liquid IDW Sampling – Decontamination Solutions
3.1.1 Materials Needed
1. ¾” Teflon Lined Disposable Bailer 2. 100’ of string 3. 8 mil Plastic Sheeting 4. Photoionization Detector 5. Shipping containers (coolers with ice)
SOP-10: IDW Management and Sampling
Revision No.: 0
Date: February 2010
Page 3 of 4
6. PPE: Nitrile Gloves and Eye Protection 7. Sample bottles (pre-preserved) 8. Sample tags, labels and chain of custody forms 9. Field logbook
3.1.2 Sampling Steps
1. Prior to opening a drum, prepare sampling by placing protective plastic material around the drum to be sampled.
2. Upon opening a drum, screen the breathing zone with a calibrated PID.
3. Remove the plastic wrapping from the dedicated bailer and attach a bailer cord (braided nylon) to the bailer.
4. Lower the bailer slowly and gently into to the IDW drum. Once the bailer is completely full, carefully (avoiding contact with the sides of the drum) withdraw a sample from the well. Transfer the sample from the bailer directly into the sample container(s).
5. Record sampling information in the field logbook. Label appropriate sampling containers with sampling details and prepare custody documentation.
6. Secure lid back onto IDW drum.
7. Dispose of all sampling material and PPE as required by the Site Management Plan
Dispose of all sampling material and PPE as required by the Site Management Plan
3.1 Solid IDW Sampling
3.1.1 Prior to opening a covered roll off box, prepare for sampling by placing protective plastic material around the roll off box to be sampled.
3.1.2 Upon opening a covered roll off box, screen the head space and worker breathing zone with a calibrated PID.
3.1.3 Using a dedicated or decontaminated sampling trowel, remove and set aside six inches of soil from the top of the IDW to expose a fresh patch of soil. Collect a sample aliquot and place it in a dedicated or decontaminated compositing container. Homogenize the sample using the “drawing and quartering” method prior to filling sample containers.
3.1.4 Record sampling information in the field logbook. Label appropriate sampling containers with sampling details and prepare custody documentation.
3.1.5 Secure the cover onto IDW roll off box.
4.0 Maintenance
Not Applicable.
5.0 Precautions
Refer to the Health and Safety Plan for appropriate health and safety precautions.
SOP-10: IDW Management and Sampling
Revision No.: 0
Date: February 2010
Page 4 of 4
6.0 References
None
7.0 Attachments
IDW Tracking Log - Container Delivery and Pickup IDW Tracking Log - Drum Contents Log
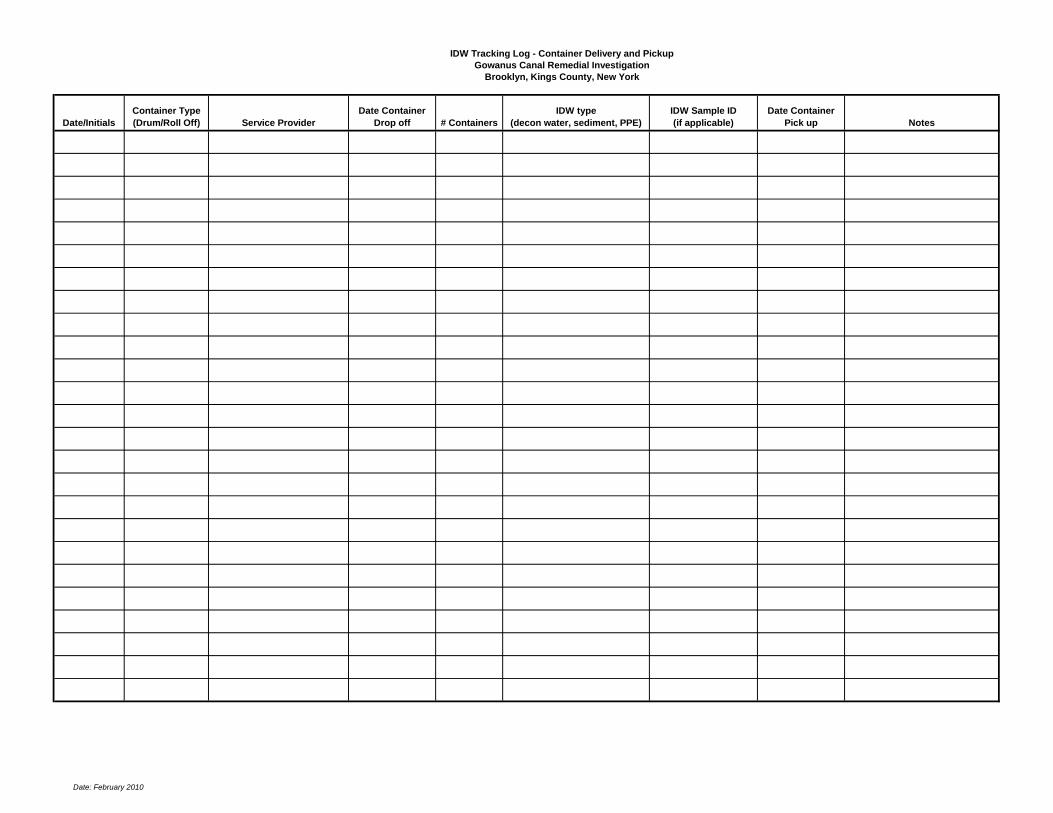
Date/Initials
Container Type
(Drum/Roll Off) Service Provider
Date Container
Drop off # Containers
IDW type
(decon water, sediment, PPE)
IDW Sample ID
(if applicable)
Date Container
Pick up Notes
IDW Tracking Log - Container Delivery and Pickup
Gowanus Canal Remedial Investigation
Brooklyn, Kings County, New York
Date: February 2010
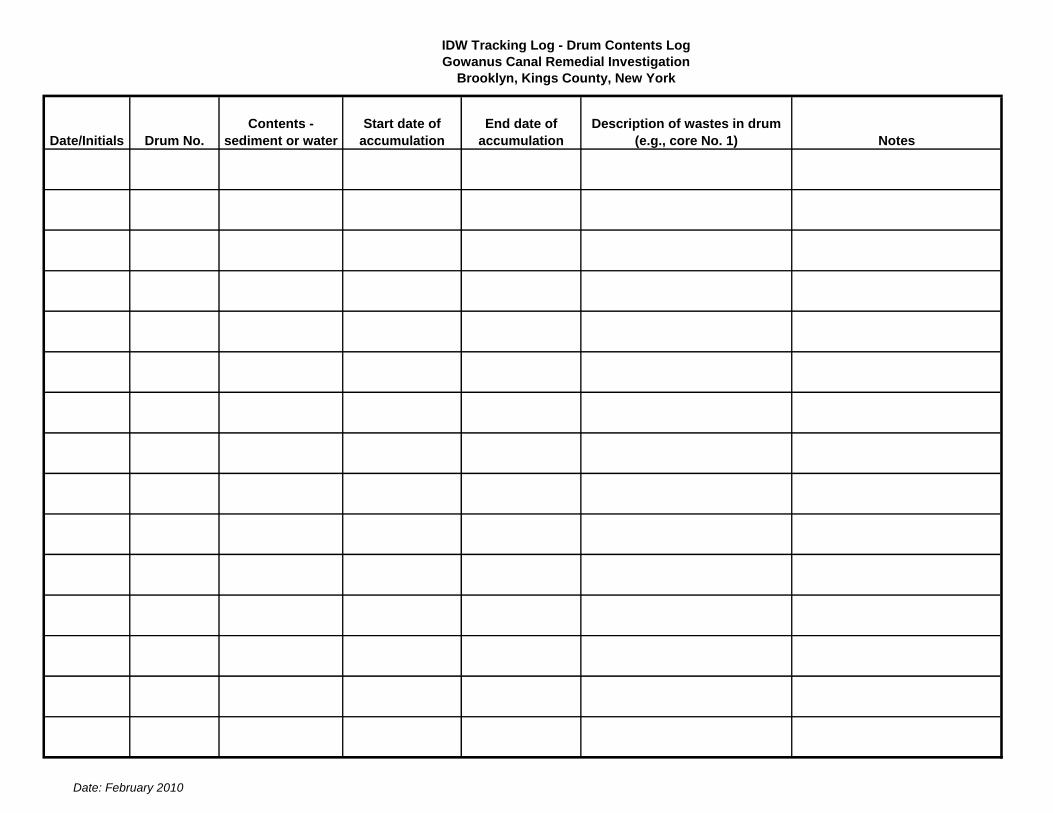
Date/Initials Drum No.
Contents -
sediment or water
Start date of
accumulation
End date of
accumulation
Description of wastes in drum
(e.g., core No. 1) Notes
IDW Tracking Log - Drum Contents Log
Gowanus Canal Remedial Investigation
Brooklyn, Kings County, New York
Date: February 2010

SOP-11A: Air Sample Collection for VOCs
Revision No 0 Date: February 2010
Page 1 of 5
STANDARD OPERATING PROCEDURES
OUTDOOR AIR SAMPLE COLLECTION FOR VOCs USING SUMMA
CANISTERS 1.0 Introduction
This sampling method describes the procedure for collecting air samples for volatile organic compounds (VOCs). Reporting limits for these samples are usually very low and extremely prone to positive bias from interfering VOC sources. The method presented here is based on „clean‟ sampling techniques. The requirements of „clean‟ sampling dictate that sampling and sample handling are done by trained personnel.
2.0 Collection Procedure
A sample of air is withdrawn, using clean technique, into a certified clean and evacuated SUMMA canister using a certified clean flow controller. Sample collection can be integrated over time by laboratory adjustment of the flow controller. Project-specific sample periods as short as 10 minutes to as long as 24 hours can be achieved based on the size of canister used and the sampling rate selected (see Table 1). Generally, 6-liter canisters are used for ambient air sampling. In cases where the crawl space or bulkhead area is most conveniently sampled by access through crawl space vents or other confined access points, a sampling probe (sample delivery line made of Teflon or stainless steel) of sufficient length is attached to the inlet of the flow controller.
3.0 Materials
- Canister, SUMMA polished, certified clean and evacuated. (Canisters are provided by the laboratory)
- Flow controller, certified clean and set at desired sampling rate. (Flow controllers are provided and set by the laboratory.)
- Shipping container suitable for protection of canister during shipping. Typically, strong cardboard boxes are used for canister shipment. The canisters should be shipped back to the laboratory in the same shipping container in which they were received.
- Wrenches and screw driver (clean and free of contaminants), various sizes as needed for connecting fittings and making adjustment to the flow controller A 9/16-inch wrench fits the ¼-inch Swagelok® fittings, which most canisters and flow controllers have.
- Negative pressure gauge, oil-free and clean, to check canister pressure. (The pressure gauges are typically provided by the laboratory.) The laboratory may either provide one pressure gauge to be used with all of the canisters, or a pressure gauge for each canister to be left on during sample collection. Sometimes the canisters are fitted with built-in pressure gauges that are not removable.
- Sampling probe, new Teflon or stainless steel tubing, fitted with compression fittings. (For crawl spaces or areas of difficult access)
4.0 Sample Collection
4.1 „Clean‟ sampling protocols must be followed when handling and collecting samples. This requires care in the shipping, storage, and use of sampling equipment. Cleanliness of personnel who come in contact with the sampling equipment is also important: no smoking, no eating, no drinking, no perfumes, no deodorants, no dry cleaned clothing, etc. Canisters should not be transported in vehicles with gas-

SOP-11A: Air Sample Collection for VOCs
Revision No 0 Date: February 2010
Page 2 of 5
powered equipment or gasoline cans. Sharpie markers should not be used for labeling or note- taking during sampling.
4.2 The SUMMA canisters are certified clean and evacuated by the laboratory to near absolute zero pressure. Care should be used at all times to prevent inadvertent loss
of canister vacuum. Never open the canister’s valve unless the intent is to
collect a sample or check the canister pressure.
4.3 When taking outdoor or crawl space samples, be sure to note on the field log any items that might bias analytical results (such as gasoline cans, garbage, fresh paint, etc.)
4.4 Inspect the canister for damage and do not use a canister that has visible damage.
4.5 Verify that the vacuum pressure of the canister is between 28 – 30 inches mercury (Hg). Do not use a canister that has an initial pressure less than 28 inches Hg because that canister likely leaked during shipment.
4.6 Remove the protective cap from the valve on the canister.
4.7 If using an external gauge, attach the gauge to the canister and open the valve. If the pressure gauge has two openings, make sure that the other opening is closed; the canister cap can be used for this. After taking the reading, close the canister and remove the gauge.
4.8 If using assigned pressure gauges, attach the pressure gauge to the canister, then attach the flow controller. When sample collection begins, record the initial pressure.
4.9 Flow controllers should come pre-set by the laboratory to sample at a pre-determined rate based on specific project requirements.
4.10 In the field log book the canister identification (ID), flow controller ID, initial vacuum, desired flow rate, sample location information, and all other information pertinent to the sampling effort. The temperature and barometric pressure should be recorded when sampling is begun and completed.
4.11 Connect the flow controller to the canister.
4.11.1 The flow controller fitting denoted “LP” or “OUT” is connected to the canister. Tighten the fitting to be leak free but do not over-tighten (a ¼ turn past snug is usually enough.) When tightening the fitting, be sure that the valve assembly does not rotate by using your other hand to hold the valve steady.
4.11.2 If an assigned pressure gauge is used for each canister, the pressure gauge should be attached to the canister first and then the flow controller should be attached to the pressure gauge.
4.11.3 When the flow controller and pressure gauge are attached correctly they will not move separately from the canister (they will not spin around).
4.12 For outdoor samples, be sure that the inlet to the flow controller is protected from precipitation. Either place the canister and flow controller under a shelter/enclosure, or use a clean piece of aluminum foil to build a tent over the flow controller inlet.
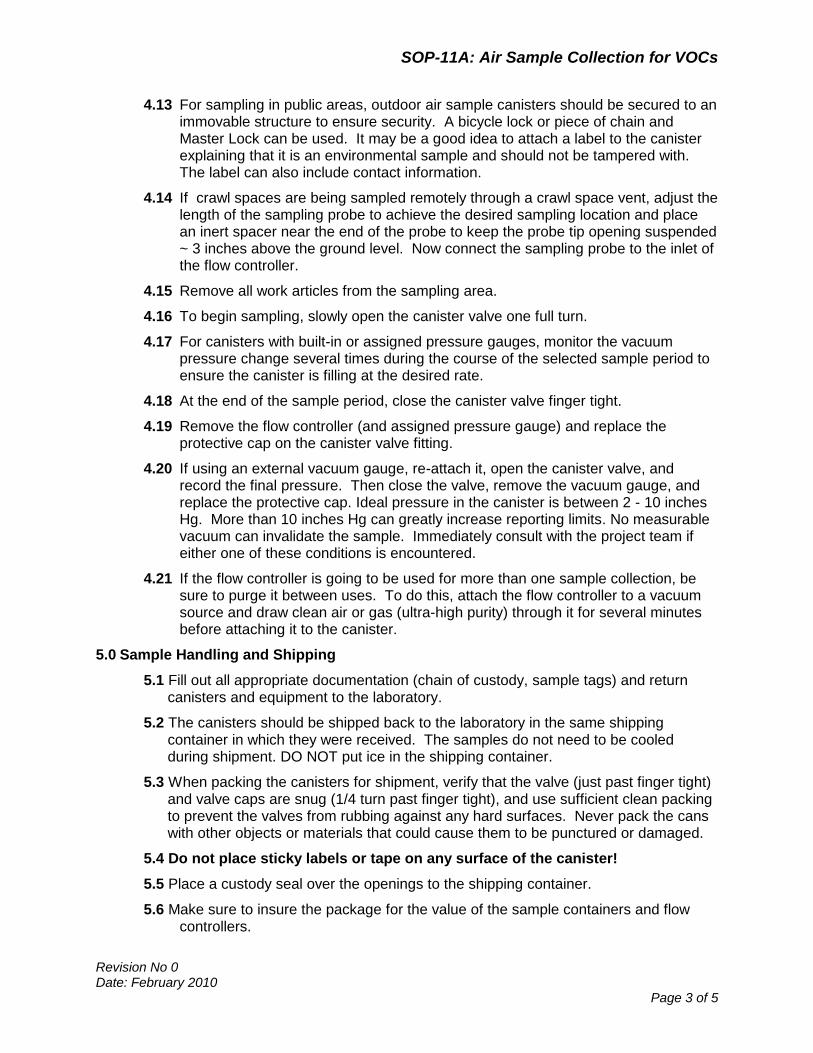
SOP-11A: Air Sample Collection for VOCs
Revision No 0 Date: February 2010
Page 3 of 5
4.13 For sampling in public areas, outdoor air sample canisters should be secured to an immovable structure to ensure security. A bicycle lock or piece of chain and Master Lock can be used. It may be a good idea to attach a label to the canister explaining that it is an environmental sample and should not be tampered with. The label can also include contact information.
4.14 If crawl spaces are being sampled remotely through a crawl space vent, adjust the length of the sampling probe to achieve the desired sampling location and place an inert spacer near the end of the probe to keep the probe tip opening suspended ~ 3 inches above the ground level. Now connect the sampling probe to the inlet of the flow controller.
4.15 Remove all work articles from the sampling area.
4.16 To begin sampling, slowly open the canister valve one full turn.
4.17 For canisters with built-in or assigned pressure gauges, monitor the vacuum pressure change several times during the course of the selected sample period to ensure the canister is filling at the desired rate.
4.18 At the end of the sample period, close the canister valve finger tight.
4.19 Remove the flow controller (and assigned pressure gauge) and replace the protective cap on the canister valve fitting.
4.20 If using an external vacuum gauge, re-attach it, open the canister valve, and record the final pressure. Then close the valve, remove the vacuum gauge, and replace the protective cap. Ideal pressure in the canister is between 2 - 10 inches Hg. More than 10 inches Hg can greatly increase reporting limits. No measurable vacuum can invalidate the sample. Immediately consult with the project team if either one of these conditions is encountered.
4.21 If the flow controller is going to be used for more than one sample collection, be sure to purge it between uses. To do this, attach the flow controller to a vacuum source and draw clean air or gas (ultra-high purity) through it for several minutes before attaching it to the canister.
5.0 Sample Handling and Shipping
5.1 Fill out all appropriate documentation (chain of custody, sample tags) and return canisters and equipment to the laboratory.
5.2 The canisters should be shipped back to the laboratory in the same shipping container in which they were received. The samples do not need to be cooled during shipment. DO NOT put ice in the shipping container.
5.3 When packing the canisters for shipment, verify that the valve (just past finger tight) and valve caps are snug (1/4 turn past finger tight), and use sufficient clean packing to prevent the valves from rubbing against any hard surfaces. Never pack the cans with other objects or materials that could cause them to be punctured or damaged.
5.4 Do not place sticky labels or tape on any surface of the canister!
5.5 Place a custody seal over the openings to the shipping container.
5.6 Make sure to insure the package for the value of the sample containers and flow controllers.
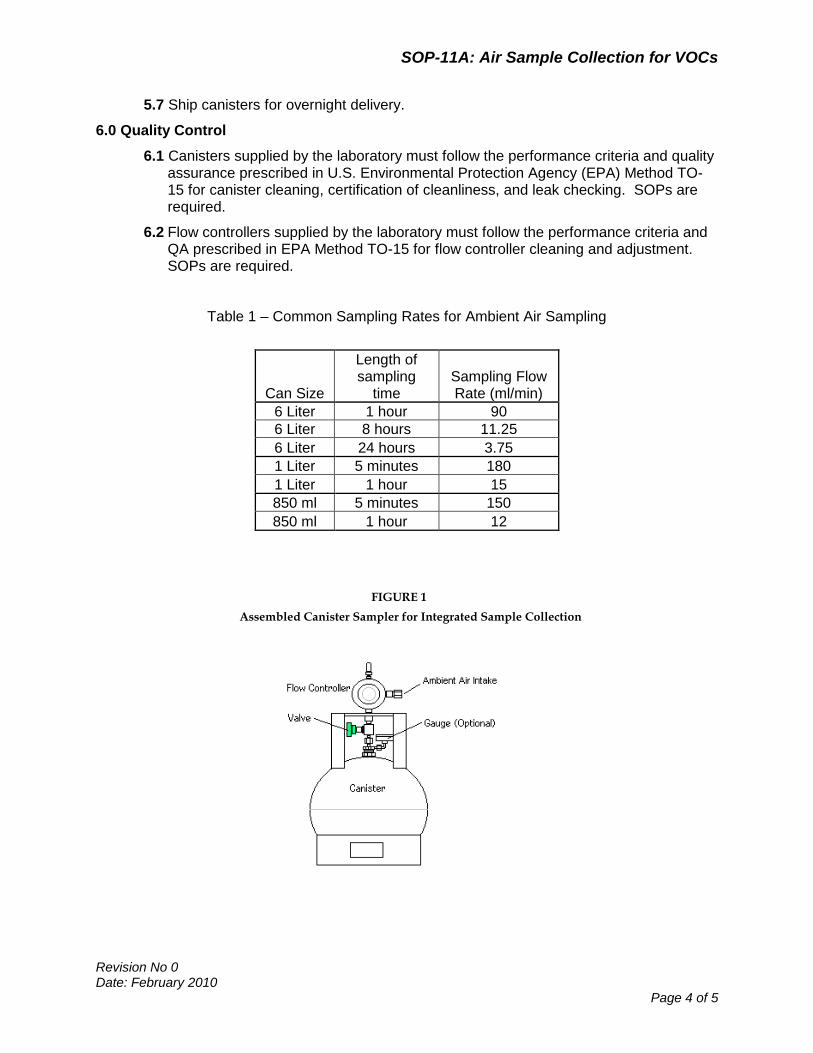
SOP-11A: Air Sample Collection for VOCs
Revision No 0 Date: February 2010
Page 4 of 5
5.7 Ship canisters for overnight delivery.
6.0 Quality Control
6.1 Canisters supplied by the laboratory must follow the performance criteria and quality assurance prescribed in U.S. Environmental Protection Agency (EPA) Method TO-15 for canister cleaning, certification of cleanliness, and leak checking. SOPs are required.
6.2 Flow controllers supplied by the laboratory must follow the performance criteria and QA prescribed in EPA Method TO-15 for flow controller cleaning and adjustment. SOPs are required.
Table 1 – Common Sampling Rates for Ambient Air Sampling
Can Size
Length of sampling
time Sampling Flow Rate (ml/min)
6 Liter 1 hour 90
6 Liter 8 hours 11.25
6 Liter 24 hours 3.75
1 Liter 5 minutes 180
1 Liter 1 hour 15
850 ml 5 minutes 150
850 ml 1 hour 12
FIGURE 1
Assembled Canister Sampler for Integrated Sample Collection
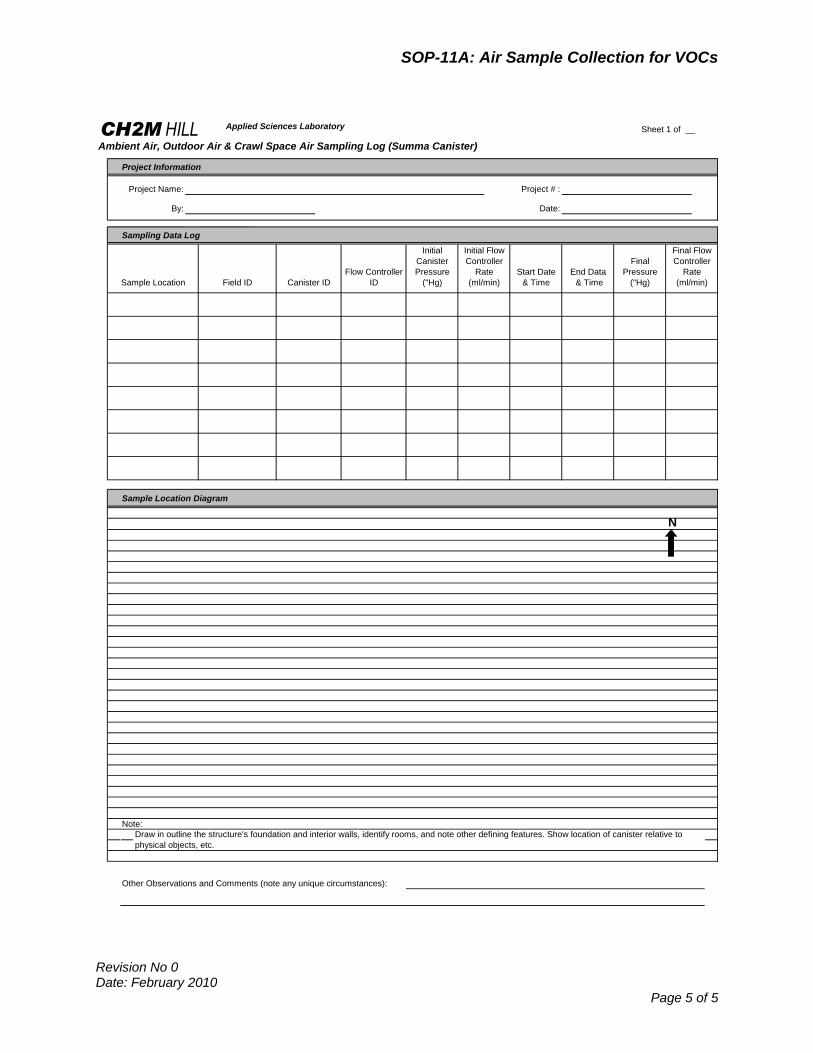
SOP-11A: Air Sample Collection for VOCs
Revision No 0 Date: February 2010
Page 5 of 5
CH2M HILL Applied Sciences Laboratory Sheet 1 of __
Ambient Air, Outdoor Air & Crawl Space Air Sampling Log (Summa Canister)
Project Information
Project Name: Project # :
By: Date:
Sampling Data Log
Sample Location Diagram
N
Note:
Other Observations and Comments (note any unique circumstances):
Final Flow
Controller
Rate
(ml/min)
Draw in outline the structure's foundation and interior walls, identify rooms, and note other defining features. Show location of canister relative to
physical objects, etc.
Sample Location Field ID Canister ID
Flow Controller
ID
Initial
Canister
Pressure
("Hg)
Final
Pressure
("Hg)
End Data
& Time
Start Date
& Time
Initial Flow
Controller
Rate
(ml/min)

SOP-11B: Air Sample Collection for PAHs
Revision No. 0 Date: April 2010
Page 1 of 3
STANDARD OPERATING PROCEDURES
OUTDOOR AIR SAMPLE COLLECTION FOR PAHS USING LOW VOLUME
PUF SORBENT CARTRIDGES
1.0 Introduction
This sampling method describes the procedure for collecting time integrated samples of ambient air and outdoor air samples for polycyclic aromatic hydrocarbons (PAH). The method presented here is based on USEPA Compendium MethodsTO-13A for PAH analysis using low sampling flow. The requirements of „clean‟ sampling dictate that sampling and sample handling are done by trained personnel.
2.0 Collection Procedure
The sampling procedure is based on the adsorption of chemicals from ambient air on a polyurethane foam (PUF)/Tenax cartridge using a low volume sample pump. A sample of air is drawn through a laboratory certified pre-cleaned cartridge. The cartridge is connected via flexible tubing to a sampling pump which is set for 5 liters per minute (LPM) and allowed to sample continuously for 24 hours. Great care must be taken in handling the cartridge to ensure that no contamination is introduced.
3.0 Materials
- Continuous-flow sampling pump – capable of 5 LPM
- Air flow calibrator (such as a Bios DryCal Defender)
- Certified clean PUF/Tenax cartridge - glass tube containing PUF/Tenax/PUF (30 mm/750 mg/30 mm) insert
- Flexible Tygon® tubing
- Aluminum Foil
- Small screwdriver and tube cutters (clean and free of contaminants)
- Latex or nitrile gloves
- Field test datasheet
- Shipping container (such as a cooler), bubble wrap, and ice.
4.0 Procedure
4.1 „Clean‟ sampling protocols must be followed when handling and collecting samples. This requires care in the shipping, storage, and use of sampling equipment. Cleanliness of personnel who come in contact with the sampling equipment is also important: no smoking, no eating, no drinking, no perfumes, no deodorants, no dry cleaned clothing, etc. Sampling equipment should not be transported in vehicles with gas-powered equipment or gasoline cans. Sharpie markers should not be used for labeling or note- taking during sampling.
4.2 Obtain PUF cartridges that have been cleaned, certified, and prepared according to the procedure described in method TO-13A. They will arrive pre-spiked with sampling efficiency surrogate spikes, will be wrapped tightly in hexane rinsed aluminum foil, and
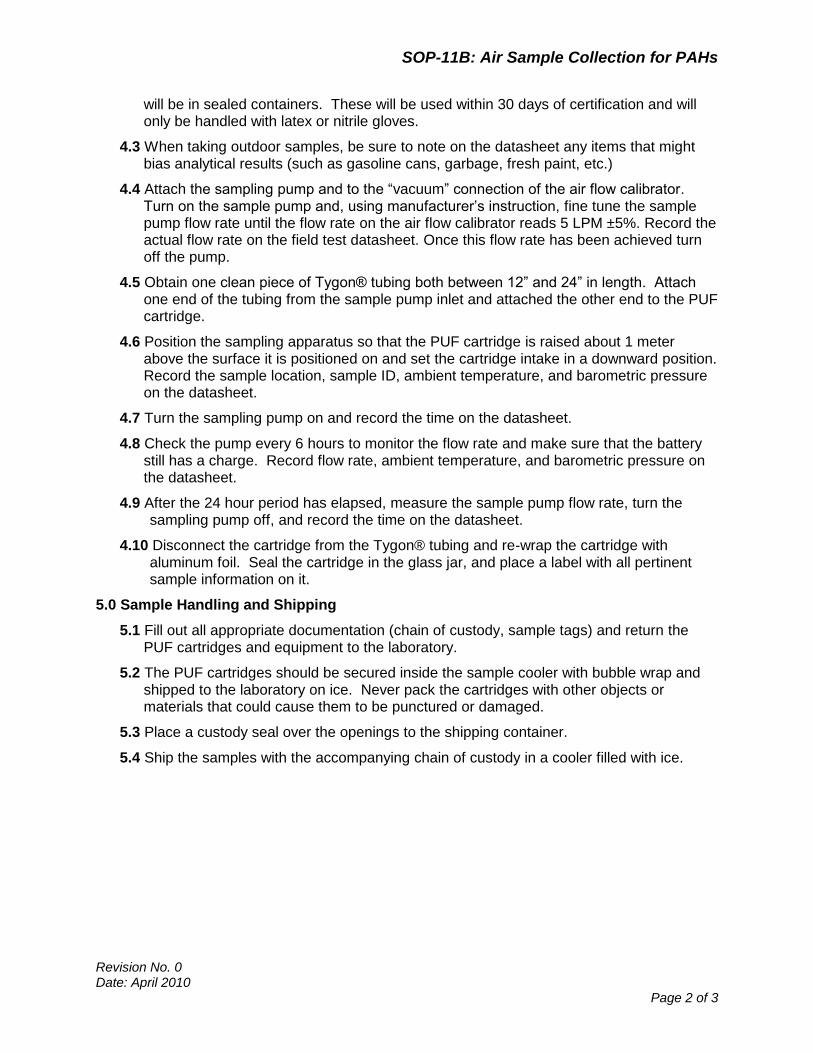
SOP-11B: Air Sample Collection for PAHs
Revision No. 0 Date: April 2010
Page 2 of 3
will be in sealed containers. These will be used within 30 days of certification and will only be handled with latex or nitrile gloves.
4.3 When taking outdoor samples, be sure to note on the datasheet any items that might bias analytical results (such as gasoline cans, garbage, fresh paint, etc.)
4.4 Attach the sampling pump and to the “vacuum” connection of the air flow calibrator. Turn on the sample pump and, using manufacturer‟s instruction, fine tune the sample pump flow rate until the flow rate on the air flow calibrator reads 5 LPM ±5%. Record the actual flow rate on the field test datasheet. Once this flow rate has been achieved turn off the pump.
4.5 Obtain one clean piece of Tygon® tubing both between 12” and 24” in length. Attach one end of the tubing from the sample pump inlet and attached the other end to the PUF cartridge.
4.6 Position the sampling apparatus so that the PUF cartridge is raised about 1 meter above the surface it is positioned on and set the cartridge intake in a downward position. Record the sample location, sample ID, ambient temperature, and barometric pressure on the datasheet.
4.7 Turn the sampling pump on and record the time on the datasheet.
4.8 Check the pump every 6 hours to monitor the flow rate and make sure that the battery still has a charge. Record flow rate, ambient temperature, and barometric pressure on the datasheet.
4.9 After the 24 hour period has elapsed, measure the sample pump flow rate, turn the sampling pump off, and record the time on the datasheet.
4.10 Disconnect the cartridge from the Tygon® tubing and re-wrap the cartridge with aluminum foil. Seal the cartridge in the glass jar, and place a label with all pertinent sample information on it.
5.0 Sample Handling and Shipping
5.1 Fill out all appropriate documentation (chain of custody, sample tags) and return the PUF cartridges and equipment to the laboratory.
5.2 The PUF cartridges should be secured inside the sample cooler with bubble wrap and shipped to the laboratory on ice. Never pack the cartridges with other objects or materials that could cause them to be punctured or damaged.
5.3 Place a custody seal over the openings to the shipping container.
5.4 Ship the samples with the accompanying chain of custody in a cooler filled with ice.
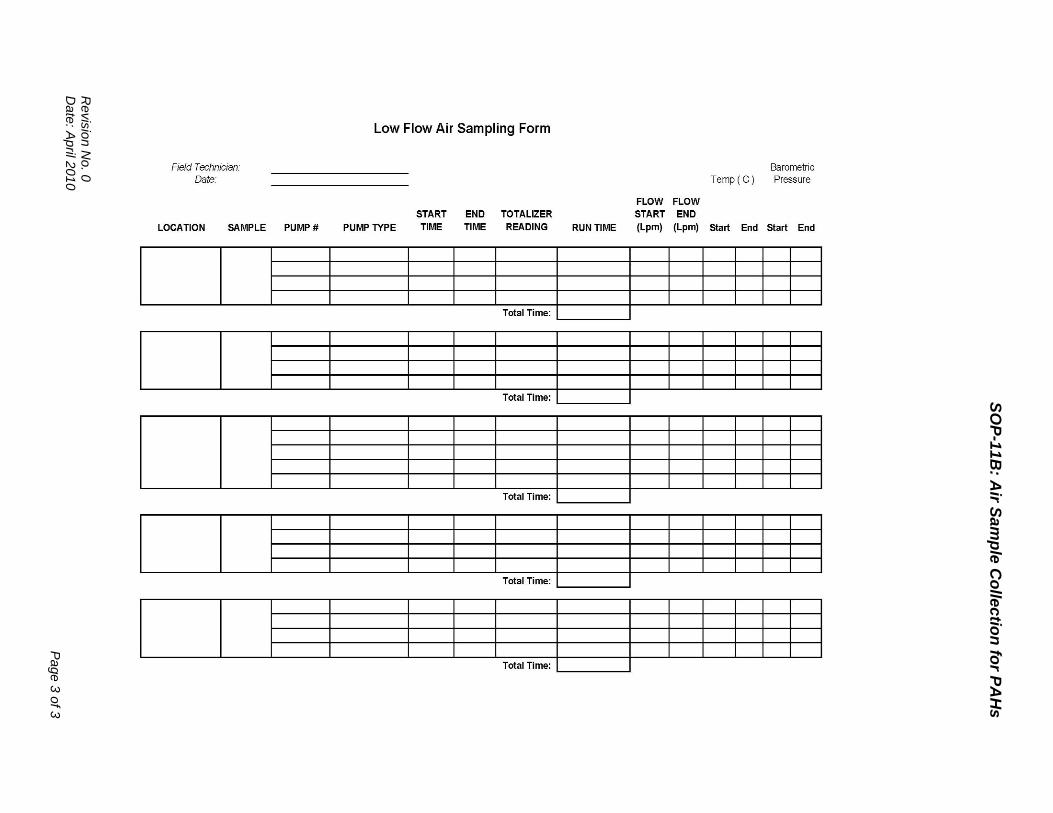
SO
P-1
1B
: Air S
am
ple
Co
llec
tion
for P
AH
s
Revis
ion N
o. 0
D
ate
: April 2
010
Page 3
of 3
SOP-11C: Air Sample Collection for PCBs
Revision No. 0 Date: April 2010
Page 1 of 13
STANDARD OPERATING PROCEDURES
AMBIENT AND OUTDOOR AIR SAMPLE COLLECTION FOR PCBs USING HIGH VOLUME PUF SORBENT CARTRIDGES
1.0 Introduction
This sampling method describes the procedure for collecting time integrated samples of ambient air and outdoor air samples for polychlorinated biphenyls (PCBs). The method presented here is based on USEPA Compendium MethodsTO-4A for PCB analysis. The method presented here is based on ‘clean’ sampling techniques. The requirements of ‘clean’ sampling dictate that sampling and sample handling are done by trained personnel.
2.0 Collection Overview
The sampling procedure is based on the adsorption of chemicals from ambient air on polyurethane foam (PUF) using a high volume sample pump. A sample of air is drawn into a covered housing, through a quartz filter, and through a laboratory certified pre-cleaned PUF filter using a high volume sampling pump set to a flow rate of 200-280 liters per minute (LPM) over a 24 hour sample period. The mass concentration of PCBs in the ambient air is computed by measuring the mass of PCB collected on the quartz filter and PUF and in relation to the volume of air sampled. Great care must be taken in handling the PUF and quartz filter to ensure that no contamination is introduced.
3.0 Sampling Material
- High volume sample pump - capable of 280 LPM (such as an Andersen PUF Sampler) - Certified clean PUF sorbent tube - glass tube containing 75 mm PUF insert - 102mm Quartz filter - Flow recording charts - Hand tools including a screwdriver and wrenches (clean and free of contaminants) - Barometer and thermometer - Latex or nitrile gloves - Field data sheets - Shipping container (such as a cooler), bubble wrap, and ice.
3.1 Calibration Equipment
The following equipment will be required for field calibration of the sampler:
- Orifice transfer standard with calibration that meets National Institute of Standards and Technology (NIST) criteria. The calibration certification papers will also be needed to calculate the flows for the transfer standard.
- An associated water or oil manometer, with 0- to 16-inch range and a minimum scale division of 0.1 inch for measurement of the transfer standard's flow. (Note: Manometers used for field calibration are subject to damage or malfunction and should be checked frequently.)
- Thermometer capable of accurately measuring temperature ranging from 0 to 50°C (273 to 323 K) to the nearest ±C calibrated annually to within ±2°C of a NIST or ASTM thermometer.
- A portable aneroid barometer (e.g., a climber's or engineer's altimeter) capable of accurately measuring ambient barometric pressure ranging from 500 to 800 millimeters mercury (mm Hg) (106 kiloPascals [kPa]) to the nearest mm Hg and calibrated at least annually to within ±5 mm Hg of a barometer of known accuracy.

SOP-11C: Air Sample Collection for PCBs
Revision No. 0 Date: April 2010
Page 2 of 13
The operator can also use the barometric pressure reading from the National Weather Service.
- Miscellaneous hand tools, calibration data sheets or station log book, and 51-mm (2-inch) duct tape or rubber stoppers.
4.0 Sample Collection Procedures
4.1 Equipment Set-Up
4.1.1 Clean’ sampling protocols must be followed when handling and collecting samples. This requires care in the shipping, storage, and use of sampling equipment. Cleanliness of personnel who come in contact with the sampling equipment is also important: no smoking, no eating, no drinking, no perfumes, no deodorants, no dry cleaned clothing, etc. Sampling equipment should not be transported in vehicles with gas-powered equipment or gasoline cans. Sharpie markers should not be used for labeling or note- taking during sampling.
4.1.2 When taking outdoor samples, be sure to note on the datasheet any items that might bias analytical results (such as gasoline cans, garbage, fresh paint, etc.)
4.1.3 Collect particulate monitoring supplies, including filters, blank field data sheets, dusting cloth, flow recorder charts.
4.1.4 Pull the exhaust hose from out of the shlter bottom and extend it away from the shelter on the ground.
4.1.5 Gently open the shelter hood to allow access to the filter holder and screen.
4.1.6 Examine the filter screen. If the screen or the metal area round the screen appears dirty, wipe it clean with the dusting cloth.
4.2 Basic Calibration Procedure for a High-Volume Sampler Using an Orifice Transfer Standard
The samplers are calibrated before sampling begins and routinely throughout the sampling program as outlined below:
1. After a motor brush change or any repair work has been done to alter the speed of the motor
2. At least once a month or whenever the sampler has failed a performance audit or a QC flow check
A sampler essentially pulls a sample of a known volume of ambient air through a filter during a measured period of time and PCBs. In order to establish PCB concentrations, three independent determinations are made: air volume flowrate, sampling time, and concentration of PCB per filter and PUF cartridge.
The sampler calibration procedure presented in this SOP relates known flowrates to the pressure in the exit orifice plenum. The known flowrates are determined by an orifice transfer standard that has been certified according to the procedure presented in the Quality Assurance Handbook for Air Pollution Measurement Systems, Volume II (EPA-600/4-77-027a). The exit orifice plenum is the area within the motor housing (below the motor unit) through which the air flows just before it is exhausted to the atmosphere through the exit orifice. This exit orifice plenum pressure is measured with an 8-inch oil manometer. A 4-inch continuous pressure flow recorder chart is used to determine flow rate and verify that flow was constant and uninterrupted over the sample period. The transfer standard for the flow-rate calibration is an orifice device equipped withfive resistance plates to simulate various flowrates within a specified range of 39
SOP-11C: Air Sample Collection for PCBs
Revision No. 0 Date: April 2010
Page 3 of 13
to 60 cfm or 1.10 to 1.70 m3/min. The pressure drop across the orifice is measured by an associated water or oil manometer. The sampler will be calibrated in standard volumetric flow-rate units (Qstd), and the orifice transfer standard is also calibrated in Qstd.
4.3 Multipoint Flow-Rate Calibration Procedure
Caution: Do not attempt to calibrate the sampler under windy conditions. Short-term wind velocity fluctuations will produce variable pressure readings by the orifice transfer standard's manometer. The calibration will be less precise because of the pressure variations.
1. Set up the calibration system as illustrated in the instrument manual. Samplers are calibrated without a filter or filter cassette installed.
2. Install the orifice transfer standard and its adapter faceplate on the sampler. Check all gaskets and replace any questionable ones.
Caution: Tighten the faceplate nuts evenly on alternate corners to properly align and seat the gaskets. The nuts should be only hand-tightened because too much compression can damage the sealing gasket.
3. Leak Test: Block the orifice with rubber stoppers, wide duct tape, or other suitable means. Make sure the manometer is not connected to the orifice. The vacuum created by the leak check will draw the liquid out of the manometer and into the sampler, resulting in damage to the motor. Seal the pressure port of the orifice by crimping the manometer hose (a rubber cap can also be used). Turn on the sampler.
Caution: Avoid running the sampler for more than 30 seconds at a time with the orifice blocked. This precaution will reduce the chance that the motor will overheat from the lack of air cooling. Such overheating can shorten the motor's lifetime and can raise temperatures to the point of defeating the electrical insulation, which could result in fire or electric shock to the user.
4. Gently rock the orifice transfer standard and listen for a whistling sound that would indicate a leak in the system. A leak-free system should read approximately zero on the flow recorder chart. Leaks are usually caused either by a damaged or missing gasket between the orifice transfer standard and the faceplate or by cross threading of the orifice transfer standard on the faceplate. All leaks must be eliminated before calibration. When the system is determined to be leak-free, turn off the sampler and unblock the orifice.
5. Inspect the connecting tubing of both manometers for crimps or cracks. Open the manometer valves (if present) and blow gently through the tubing, watching for the free flow of the fluid.
6. Adjust the manometers' sliding scales so that their zero lines are at the bottom of the meniscus. Connect the orifice transfer standard manometer to the orifice transfer standard. Ensure that one side of the manometer is open to atmospheric pressure. Make sure that the tubing fits snugly on the pressure ports and on the manometer.
7. Read and record the following parameters on the one point flow check sheet (see Appendix).
• Date, location, and operator's signature
• Sampler number
• Ambient barometric pressure (Pav), mm Hg or kPa
• Ambient temperature (Tav), K (K = °C + 273)
• Orifice S/N and calibration relationship
SOP-11C: Air Sample Collection for PCBs
Revision No. 0 Date: April 2010
Page 4 of 13
Note: Consistency of temperature and barometric pressure units is required. All temperatures will be expressed in Kelvin (K = °C + 273) and all barometric pressures will be expressed in mm Hg.
8. Turn on the sampler and allow it to warm up to operating temperature (3 to 5 minutes). Then, read and record the orifice transfer standard's manometer in total inches of water in the second column of the calibration data sheet [(Total ∆H2O (in.) (trsf. Standard)] (see Appendix). Record the flow recorder chart reading in the fourth column, "I (Indicated flow from Dickson Chart)" on the calibration data sheet. Tap the box the flow recorder chart is mounted in to ensure that the pen is not stuck.
Note: The sampler inlet may be partially lowered over the orifice transfer standard to act as a draft shield (if a shield is not otherwise provided).
9. Select the first calibration resistance plate and adjust the variable orifice valve.
10. Change the resistance plate to obtain each of the other calibration flowrates. At least five calibration flowrates are measured The sampler's previous calibration values should be consulted for reasonability. If this is an initial calibration, the operator should consult the transfer standard's calibration to determine flowrates from the associated manometer readings. The same manometer readings can be generated for the calibration provided they are in the corrected range.
11. Repeat Step 10 for any data points that are questionable. Running additional calibration points at differing flowrates or repeating the calibration points at the same flowrates is encouraged to improve the precision of the calibration.
Note: The data points should be verified in the field as the calibration is occurring.
12. Turn off the sampler and remove the orifice transfer standard.
13. The Data Manager will perform the calibration calculations shown on the calculation data sheet. The data generated will be used to determine the flowrate of each sample run. The flow recorder chart reading for each sample run will be entered into the regression equation for that particular sampler to determine actual flow.
4.4 Calibration Calculations
Gather together all the calibration data, including the orifice calibration information and the sampler calibration data sheet.
Note: These calculations should be done at the time of the calibration, rather than later. This approach will allow additional calibration points to be run if questions arise about the data obtained.
1. Verify that the orifice transfer standard calibration relationship is current and traceable to an acceptable primary standard.
2. Calculate and record Qstd for each calibration point from the orifice calibration information and write these values under the column labeled "X-Axis" on the sampler calibration data sheet.
SOP-11C: Air Sample Collection for PCBs
Revision No. 0 Date: April 2010
Page 5 of 13
Qstd (orifice) = {[∆H20(298/Tav)Pav/760)]1/2 - b} {1/m} where:
Qstd(orifice) = standard volumetric flowrate as indicated by the transfer standard orifice, standard m3/minute
∆H2O = pressure drop across the orifice, in. H2O (from manometer) Tav = ambient temperature during use, K (K = °C + 273) Pav = ambient barometric pressure during use, mm Hg (or kPa) b = y intercept of the orifice calibration relationship m = slope of the orifice calibration relationship
3. Calculate and record in the fifth column, Y-Axis, on the data sheet the quantity It for each calibration point as:
Y-Axis t = It = I[(298/Tav)(Pav/760)]l/2 (when calibrating with a flow recorder chart)
where:
Tav = ambient temperature, K (K = °C + 273) Pav = ambient barometric pressure, mm Hg It = transformed flow chart reading indicated by flow recorder chart I = indicated flow reading from flow recorder chart
4. Using a programmable calculator, determine the linear regression slope (m), intercept (b), and correlation coefficient (r) and record them on the data sheet. A five-point calibration should yield a regression equation with a correlation coefficient of R > 0.995 . For the regression equation, calculate the data points as follows and record them in the sixth column on the data sheet under "Y-Calc."
Y calculated = m[Qstd orifice] + b
where:
m = slope of the sampler calibration relationship Qstd = transfer standard orifice's standard volumetric flowrate b = intercept of the sampler calibration relationship
5. For subsequent sample periods or flow checks, the sampler's average standard operational flowrate, Qstd, is calculated from the calibration slope and intercept using the following equation:
Qstd = {mean I(Tav+- b}{ 1/m}
where: Qstd = the sampler's average standard flowrate, m3/minute
Mean I = average of sampler chart readings,
Tav = average ambient temperature for the sample period, K (K = °C + 273)
Pav = average ambient pressure for the sample period, mm Hg b = intercept of the sampler calibration relationship m = slope of the sampler calibration relationship
SOP-11C: Air Sample Collection for PCBs
Revision No. 0 Date: April 2010
Page 6 of 13
4.5 Sample Collection Procedures
4.5.1 Once the equipment has been adqequetly calibrated, note the filter number on the Field Data Sheet and place the clean 102mm quartz filter on the support screen and secure it with the hold down ring and swing bolts. Tighten the bolts sufficiently to hold the filter cassette securely and check that the ring is in good condition and has not deteriorated.
Caution: Tighten the bolts evenly on alternate corners to properly align and seat the gasket. The bolts should be only hand-tightened because too much compression can damage the sealing ring.
4.5.2 Unscrew the 4” filter holder and the sampling module cap leaving the module tube in place with the glass cartridge exposed.
4.5.3 Load the glass cartridge containing the PUF into the module tube and record the PUF model and serial number on the data sheet. Fasten the glass cartridge with the module cap and 4” filter holder assembly while making sure that the module assembly, 4” filter holder, and all fittings are snug and not over tightened. Lower the sampler inlet hood and secure as necessary so the hood cannot blow open.
4.5.4 Open the front door of the sampler and the door to the flow recorder, then examine the flow recorder. Record the sampler number, filter ID number, site location, and sampling date on the back of a clean chart and install the chart in the flow recorder.
While installing the chart, raise the pen head by pushing on the very top of the pen arm (or by using the pen lift). Be sure that the chart tab is centered on the slotted drive to ensure full 360-degree rotation in 24 hours. Make sure that the chart edges are properly located beneath the retaining clips. Lower the pen arm and tap the recorder face lightly to make certain that the pen is free.
Note: During periods of inclement weather, the chart tends to stick to the recorder face. Two charts can be installed simultaneously to enable the sample (top, annotated) chart to rotate freely.
4.5.5 Using a coin or slotted screwdriver, advance the chart and check to see that the pen rests on zero – the smallest circle diameter. If necessary, adjust the zero setscrew while gently tapping on the side of the flow recorder. If a chart with a linear-function scale is used, some positive zero offset may be desirable to allow for normal variations in the zero readings.
4.5.6 Turn on the sampler and allow it to equilibrate to operating temperature (3 to 5 minutes).
4.5.7 While the sampler is equilibrating, record the following parameters on the field data sheet. A copy of the field data sheet is located in the Appendix A.
Site location
• Sample date
• Filter ID number
• Sampler number
• Sampler calibration information
• Weather conditions
SOP-11C: Air Sample Collection for PCBs
Revision No. 0 Date: April 2010
Page 7 of 13
4.5.8 Verify that the flow recorder is operational and that the pen is inking. Adjust the flow rate to approximately 250 LPM (8.8 cubic feet per minute). Record the observed flowrate on the field data sheet. This will provide a record that the sampler was checked for proper operation before each sampling event.
4.5.9 Turn the sampler off.
4.5.10 Check the time indicated by the time-set pointer on the flow recorder. If it is in error, rotate the chart clockwise by inserting a screwdriver or coin in the slotted drive in the center of the chart face until the correct time is indicated. Close and secure the flow recorder door.
4.5.11 Set the circular timer to turn on at the appropriate time or turn the sampler on manually, then close the sampler door.
4.5.12 Review the flowrate periodically during operation to ensure that the desired flowrate is being consistantly produced. If the flow rate increases or decreased by more than 10% of the desired flow rate and cannot be stabilized or corrected, the sampling event will be terminated and the sample pump will be returned to the vendor for proper calibration or replacement prior to recollecting a sample. A new sample will be collected once the problem has been rectified.
5.0 Sample Recovery Procedure
5.1 At the completion of each day’s sampling event, the operator should return to the monitoring sites to retrieve the exposed PUF and filter. Particle gain, loss or filter damage will result if the PUF if left in the sampler for extended periods. Every effort shall be made to remove the PUF as soon as possible after sampling for the day is completed.
5.2 Note the final flow reading from the flow recorder chart and record it on the field data sheet.
5.3 Turn off the sampler.
5.4 Open the door of the sampler, remove the flow recorder chart, and examine the recorder trace. If the trace indicates extensive flow fluctuations above or below the acceptable flow range, the sample will be discarded and the sample pump will be returned to the vendor for repair and/or proper calibration.
5.5 Record the elapsed time of the sampling period on the field data sheet.
Note: Average ambient temperature (Tav) and average ambient pressure (Pav) readings will be obtained by the data coordinator using the meteorological data available from a local weather station.
5.6 Observe conditions around the monitoring site. Note any activities that may affect filter particle loading (e.g., paving, mowing, fire) and record this information on the field data sheet under “Remarks.”
5.7 PUF recovery and handling procedures include the following:
NOTE: PUF & Filter recovery should take place during calm wind conditions if possible.
• Remove the sample inlet hood and remove the 4” filter holder care not to disturb the sample.
• Check the sample's validity using the validation criteria found in the next section.
SOP-11C: Air Sample Collection for PCBs
Revision No. 0 Date: April 2010
Page 8 of 13
• Carefully remove the glass cartridge with forceps and clean, gloved hands and immediately place the catridge in a sealed container for transport to the laboratory.
• Place a label on the container with all pertinent sample information on it.
5.8 Filter recovery and handling procedures include the following:
• Remove the top frame of the filter unit, taking care not to disturb the sample.
• Check the sample's validity using the validation criteria found in the next section.
• Carefully slip a manila folder underneath the edge of the exposed filter. The filter may stick in the cassette because of overcompression of the filter cassette gasket. Be extremely careful to avoid damage to the brittle quartz filter.
• Fold the filter once lengthwise with the exposed portions of the filter touching only exposed portions of the filter. Place the folded filter in the 4.5 by 10.5 glycine envelope provided in each filter packet. If pieces of filter get broken off while placing the filter in the envelope, gather the pieces and place them into the envelope also. Note this on the field data sheet also.
• Place the filter, the flow recorder chart, and the top copy of the field data sheet in the envelope in which the filter was originally shipped. This envelope should be stamped with the filter's number.
6.0 Sample Handling and Shipping
6.1 Fill out all appropriate documentation (chain of custody, sample tags) and return the PUF cartridges and equipment to the laboratory.
6.2 The PUF cartridges and filters should be secured inside the sample cooler with bubble wrap and shipped to the laboratory on ice. Never pack the cartridges with other objects or materials that could cause them to be punctured or damaged.
6.3 Place a custody seal over the openings to the shipping container.
6.4 Ship the samples with the accompanying chain of custody in a cooler filled with ice.
7.0 Single-Point Audit of the High Volume Sampling System Utilizing Calibrated Orifice Transfer Standard
7.1 A single point calibration check is required after each 24-hour test period. The purpose of this check is to track the sampler's calibration stability. Maintain a control chart presenting the percentage difference between a sampler's indicated and measured flow rates. This chart provides a quick reference of sampler flow-rate drift problems and is useful for tracking the performance of the sampler. Either the sampler log book or a data sheet will be used to document flow check information. This information includes, but is not limited to, sampler and orifice transfer standard serial number, ambient temperature, pressure conditions, and collected flow-check data.
7.2 Prior to single point audit, place a "dummy" glass cartridge in the sampling head and activate the sampling motor. Fully open the flow control valve and adjust the voltage variator so that a sample flow rate corresponding to 110 percent of the desired flow rate (typically 0.19 to 0.28 m /min) is indicated on the Magnehelic gauge (based on the previously obtained multipoint calibration curve). Allow the motor to warm up for 10 minutes and then adjust the flow control valve to achieve
SOP-11C: Air Sample Collection for PCBs
Revision No. 0 Date: April 2010
Page 9 of 13
the desired flow rate. Turn off the sampler. Record the ambient temperature and barometric pressure on the Field Test Data Sheet.
7.3 Place the flow rate transfer standard on the sampling head. Properly align the retaining rings with the filter holder and secure by tightening the 3 screw clamps. Connect the flow rate transfer standard to the manometer using a length of tubing.
7.4 Using tubing, attach 1 manometer connector to the pressure tap of the transfer standard. Leave the other connector open to the atmosphere.
7.5 Adjust the manometer midpoint by sliding the movable scale until the zero point corresponds with the water meniscus. Gently shake or tap to remove any air bubbles and/or liquid remaining on tubing connectors. (If additional liquid is required, remove tubing connector and add clean water.)
7.6 Turn on high-volume motor and let run for 5 minutes.
7.7 Record the pressure differential indicated, ∆H, in inches of water, on the Field
Test Data Sheet. Be sure stable ∆H has been established.
7.8 Record the observed Magnehelic gauge reading, in inches of water, on the Field Test Data Sheet. Be sure stable ªM has been established.
7.9 Using previous established Orifice Transfer Standard curve, calculate Qstd
.
7.10 This flow should be within ±10 percent of the sampler set point, normally, 8 ft. If not, perform a new multipoint calibration of the sampler.
7.11 Remove flow rate transfer standard and dummy adsorbent cartridge.
SOP-11C: Air Sample Collection for PCBs
Revision No. 0 Date: April 2010
Page 10 of 13
Appendix A
PCB Air Sampling Field Forms
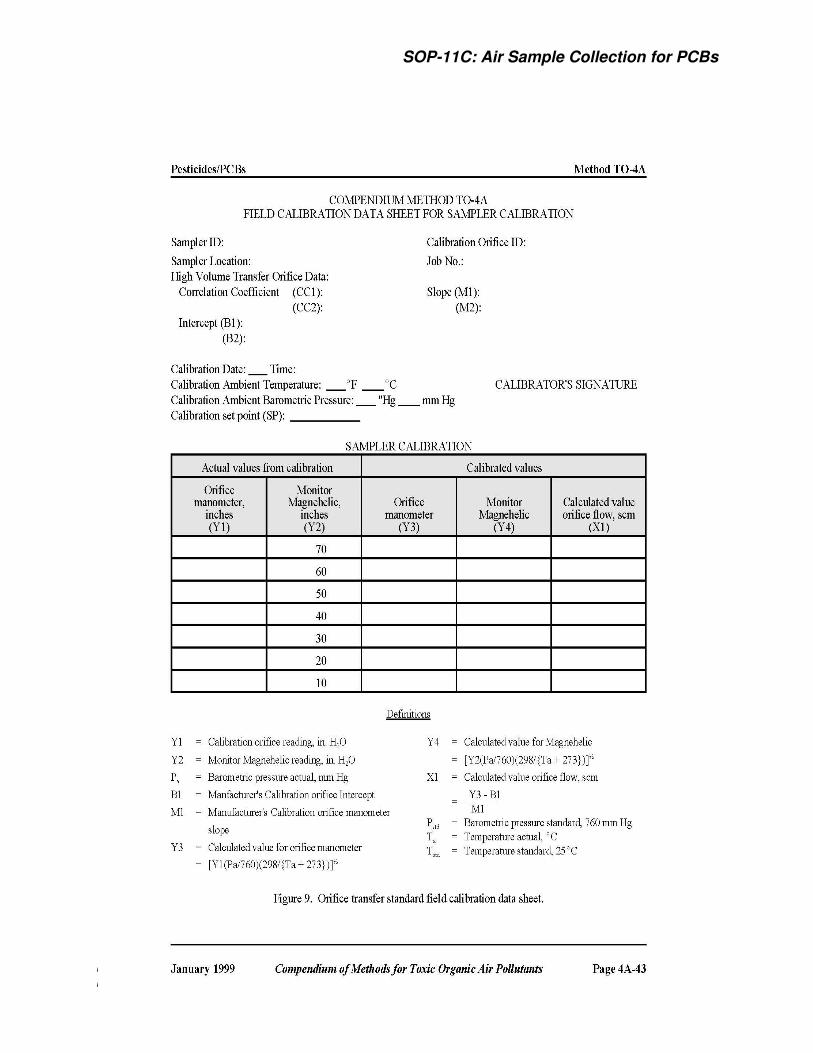
SOP-11C: Air Sample Collection for PCBs
Revision No. 0 Date: April 2010
Page 11 of 13
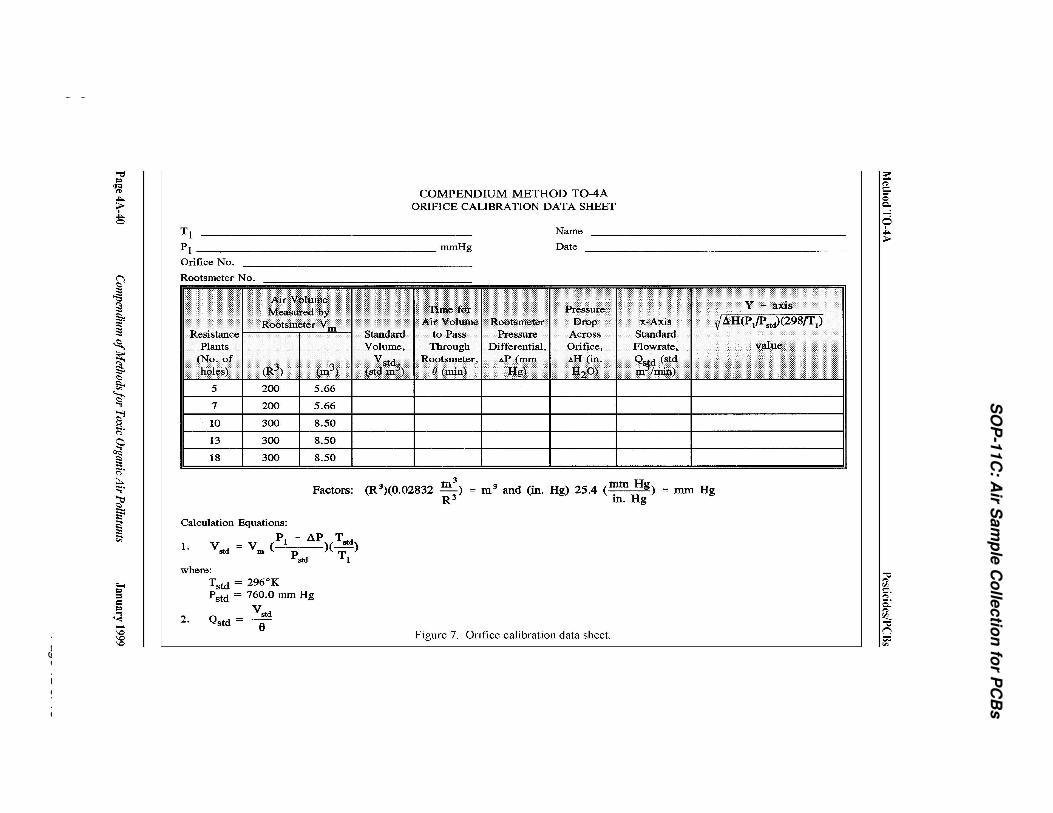
SO
P-1
1C
: Air S
am
ple
Co
llec
tion
for P
CB
s
Revis
ion N
o. 0
D
ate
: April 2
01
0
Pag
e 1
2 o
f 13
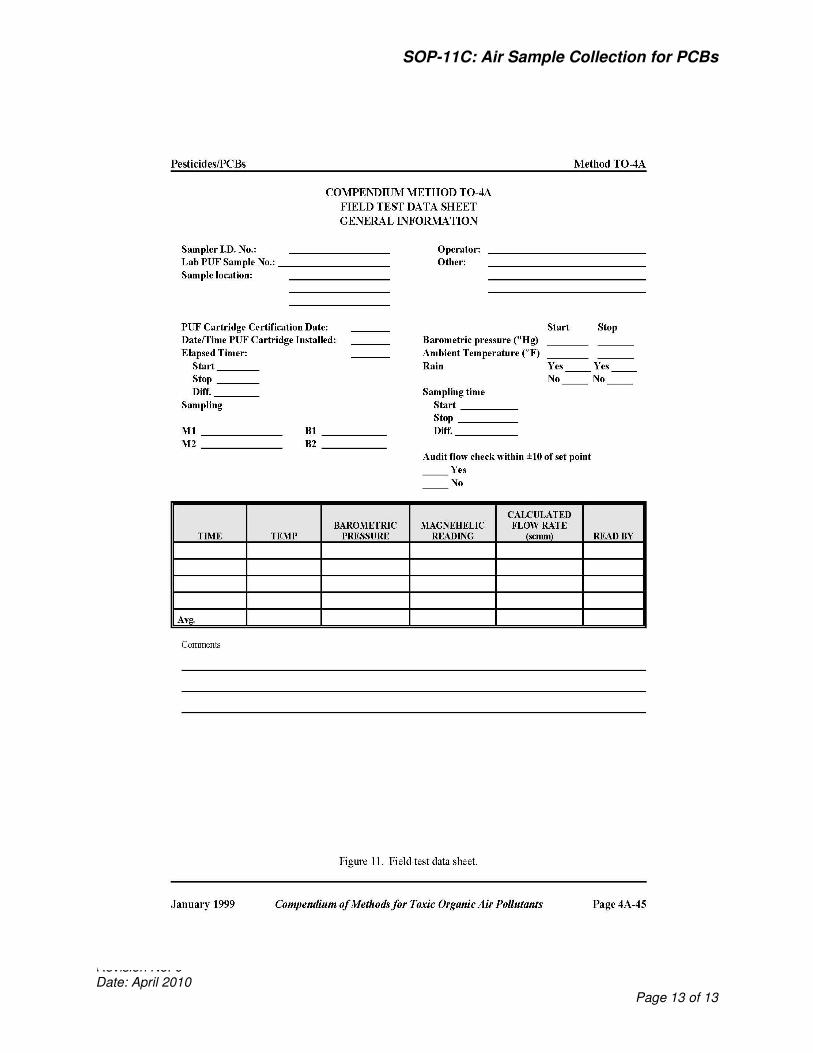
SOP-11C: Air Sample Collection for PCBs
Revision No. 0 Date: April 2010
Page 13 of 13
SOP-12: FISH SAMPLE COLLECTION USING HOOP/FYKE OR GILL NETS, MIDWATER TRAWLS, OR BAITED LONGLINES
Revision No.: 0 Date: April 2010
Page 1 of 5
STANDARD OPERATING PROCEDURE FISH SAMPLE COLLECTION USING HOOP/FYKE OR GILL NETS,
MIDWATER TRAWLS, OR BAITED LONGLINES 1.0 Introduction
This standard operating procedure (SOP) describes the sampling equipment and techniques for the collection of fish using a variety of possible methods. Tissue samples obtained from the fish will then be analyzed for chemical constituents and the results used to assess the human health and ecological risks associated with the site.
2.0 Preliminary Activities and Permits
Apply for and receive applicable scientific collection permits as required by the state. Contact local fish or game officials and inform them of your activities.
Collect and review information pertinent to the fish sampling project, including station locations, nearby boat access locations, known sediment contamination, water depth, tidal variation, any waterway obstructions or inconsistencies (e.g. shallow or grassy areas, low structures, pipe crossings), any other biological studies previously conducted on or near the site, species used locally for human consumption and the degree of such consumption, and the most appropriate sampling method for the species of interest that is permitted by law.
3.0 Materials
The following materials are needed:
Small Boat(s)
GPS unit
Nets (midwater trawl, gill nets, hoop/fyke nets, etc) with the appropriate mesh size (determined by target fish size) and weights and buoys, as needed.
Line (wire, ropes/bridles, etc)
Additional line and coupling supplies
Tools (pliers, hammer, adjustable wrench, etc)
Tweezers
Fish Measuring Board
0-16 oz scale and 1-4 lb scale
Camera
Appropriate identification keys for targeted fish species
5 gallon bucket or live well (large tub with flow through system)
Field log book and data sheets
Permanent black markers and indelible pens
Large Ziploc storage bags

SOP-12: FISH SAMPLE COLLECTION USING HOOP/FYKE OR GILL NETS, MIDWATER TRAWLS, OR BAITED LONGLINES
Revision No.: 0 Date: April 2010
Page 2 of 5
Ice and Cooler
Personal Protective Equipment as required by the Health and Safety Plan
4.0 Sample Collection Procedure
The primary considerations for collecting fish for tissue analysis include identifying the appropriate sampling locations, proper sampling techniques, proper handling of samples, and proper documentation of samples. The generalized collection procedures are detailed by collection method in the following sections.
4.1. Hoop or Fyke Net
Net Deployment.
1. One net will be placed at a central location within each sample reach.
2. Place bait in a mesh bag and attach it inside, near the closed end of the net.
3. Attach a weight and buoys to both ends of the net. Field personnel that are setting the net should be standing on the bow of the boat.
4. Place the closed end of the net with the attached weight to the bottom and slowly release the net, pulling it tight while backing the boat slowly in order to stretch the net to its full length.
5. Record the GPS coordinates, date, and time for each net set in the field log book. The net should remain in place for 8 to 12 hours.
Net Retrieval.
1. While standing on the bow of the boat, the open end of the net should first be pulled up from the water, followed by the remaining net segments.
2. Once the net is on the bow of the boat, the drawstring at the closed end of the net should be opened and the collected fish removed.
3. Place the collected fish into 5-gallon bucket or live well approximately one-half full of fresh site water.
4. Release all nontarget species.
4.2. Gill Net
Net Deployment.
1. One net will be placed at a central location within each sample reach.
2. While standing on the bow of the boat, place one end of the gill net (with a weight attached to the bottom and a buoy attached to the top) into the water.
3. Stretch the gill net (do not leave slack) across the area to be sampled by pulling it along with the boat. If there is a discernible flow, the net should be set in the upstream direction.
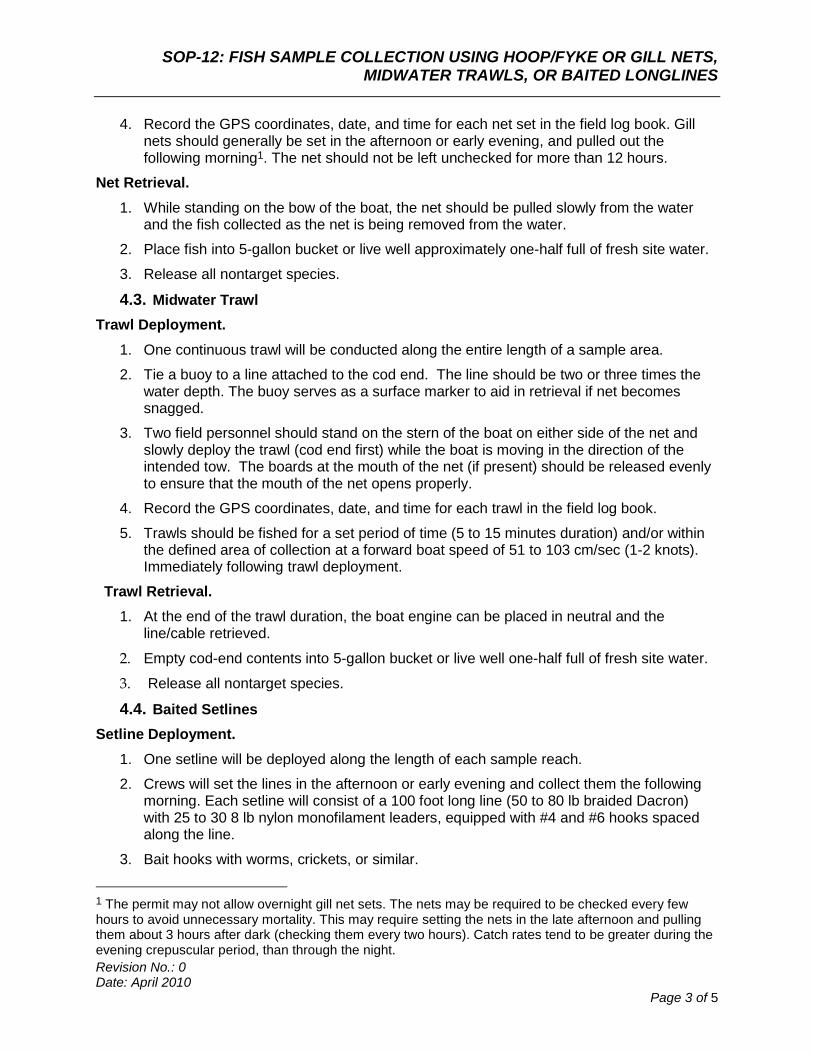
SOP-12: FISH SAMPLE COLLECTION USING HOOP/FYKE OR GILL NETS, MIDWATER TRAWLS, OR BAITED LONGLINES
Revision No.: 0 Date: April 2010
Page 3 of 5
4. Record the GPS coordinates, date, and time for each net set in the field log book. Gill nets should generally be set in the afternoon or early evening, and pulled out the following morning1. The net should not be left unchecked for more than 12 hours.
Net Retrieval.
1. While standing on the bow of the boat, the net should be pulled slowly from the water and the fish collected as the net is being removed from the water.
2. Place fish into 5-gallon bucket or live well approximately one-half full of fresh site water.
3. Release all nontarget species.
4.3. Midwater Trawl
Trawl Deployment.
1. One continuous trawl will be conducted along the entire length of a sample area.
2. Tie a buoy to a line attached to the cod end. The line should be two or three times the water depth. The buoy serves as a surface marker to aid in retrieval if net becomes snagged.
3. Two field personnel should stand on the stern of the boat on either side of the net and slowly deploy the trawl (cod end first) while the boat is moving in the direction of the intended tow. The boards at the mouth of the net (if present) should be released evenly to ensure that the mouth of the net opens properly.
4. Record the GPS coordinates, date, and time for each trawl in the field log book.
5. Trawls should be fished for a set period of time (5 to 15 minutes duration) and/or within the defined area of collection at a forward boat speed of 51 to 103 cm/sec (1-2 knots). Immediately following trawl deployment.
Trawl Retrieval.
1. At the end of the trawl duration, the boat engine can be placed in neutral and the line/cable retrieved.
2. Empty cod-end contents into 5-gallon bucket or live well one-half full of fresh site water.
3. Release all nontarget species.
4.4. Baited Setlines
Setline Deployment.
1. One setline will be deployed along the length of each sample reach.
2. Crews will set the lines in the afternoon or early evening and collect them the following morning. Each setline will consist of a 100 foot long line (50 to 80 lb braided Dacron) with 25 to 30 8 lb nylon monofilament leaders, equipped with #4 and #6 hooks spaced along the line.
3. Bait hooks with worms, crickets, or similar.
1 The permit may not allow overnight gill net sets. The nets may be required to be checked every few hours to avoid unnecessary mortality. This may require setting the nets in the late afternoon and pulling them about 3 hours after dark (checking them every two hours). Catch rates tend to be greater during the evening crepuscular period, than through the night.

SOP-12: FISH SAMPLE COLLECTION USING HOOP/FYKE OR GILL NETS, MIDWATER TRAWLS, OR BAITED LONGLINES
Revision No.: 0 Date: April 2010
Page 4 of 5
4. A weight and marker buoy should be attached to both ends of the line. The end of the line should be lowered to the bottom of the canal.
5. The line should be slowly stretched and released over the edge of the boat until completely deployed.
6. Record the GPS coordinates, date, and time for each net set in the field log book. The lines should remain in place overnight.
Setline Retrieval.
1. Slowly retrieve the lines, unhook the fish. If it is difficult to remove a hook without damaging a fish sample, the nylon leader should be cut as far away from the mouth as possible, making it easy to identify a fish in need of hook removal during sample processing. All fish containing hooks will be noted in the field notebook.
2. Place fish into 5-gallon bucket or live well approximately one-half full of fresh site water.
4.5 Initial Fish Processing
1. Record approximate numbers and species of all fish caught in the log book.
2. Collect a sufficient number of individuals of the target species to achieve the required tissue mass for laboratory analyses as specified in the project instructions or work plan.
3. Transfer specimens to the shore-based crew as soon as practicable for processing (length and weight measurement and examination).
4. Process the fish in accordance with SOP 15.
5.0 Record Keeping
The following general information will be recorded in the Field Logbook:
Sample identification (site name, location, sample name/number and location, fish species in sample, number of organisms in the sample, time and date, and sampler’s identity).
Field observations and measurements (sample setting, appearance of substrate and habitat, sampling method, and photograph descriptions).
Additional remarks, as appropriate.
Information specific to the collected fish species should be recorded in the Tissue Collection Form attached to this SOP.
6.0 Maintenance
Not applicable.
7.0 Precautions
Deploying these nets and equipment may require leaning over the side of a small, shallow draft vessel (e.g., a john boat); care should be taken to assure that the vessel is stabilized appropriately and PFDs and other required safety equipment specified in the HASP must be worn.
8.0 Attachments
Tissue Collection Form
SOP-12: FISH SAMPLE COLLECTION USING HOOP/FYKE OR GILL NETS, MIDWATER TRAWLS, OR BAITED LONGLINES
Revision No.: 0 Date: April 2010
Page 5 of 5
9.0 References
Brower, 1977. James E. Brower and H. Jerrold Zar. Field and Laboratory Methods for General Ecology. Wm. C. Brown Company Publishers. 1977.
Ricker, 1971. Ricker, W.E. Methods for Assessment of Fish Production in Fresh Waters. International Biological Programme Handbook No. 3. 1971.
U.S. EPA, 1987. U.S. Environmental Protection Agency. A Compendium of Superfund Field Operations Methods. Office of Emergency and Remedial Response, Office of Waste Programs Enforcement. December 1987.
U.S. EPA, 1989. Warren-Hicks, William, Parkhurst, Benjamin R., Baker, Samuel S. Jr. Ecological Assessment of Hazardous Waste Sites: A Field and Laboratory Reference. U.S. EPA, Environmental Research Laboratory, Corvallis, OR 97333. March 1989.

Sampling Reach Collection Date Start End
Gear Details (check one)
Crab Pot Trap 1 2 3 4 5 6 7 ________
Minnow Trap Trap 1 2 3 4 5 6 7 ________
Fyke Net Net 1 2 3 4 5 6 7 ________
Hoop Net Net 1 2 3 4 5 6 7 ________
Gill Net Net 1 2 3 4 5 6 7 ________
Angling Run 1 2 3 4 5 6 7 ________
Seine Run 1 2 3 4 5 6 7 ________
Other___________________ 1 2 3 4 5 6 7 ________
Sampling Information
Start Date/Time
Start Location
Latitude Longitude
End Date/Time
End Location
Latitude Longitude
Sampling Depth Water Depth
Site Description
Datum Used
Crew Information
Collectors Names (print)
Field Team Lead (print and sign)
Notes/Sketch
Tissue Collection Form Part 1
Gowanus Canal Remedial Investigation
Brooklyn, Kings County, New York
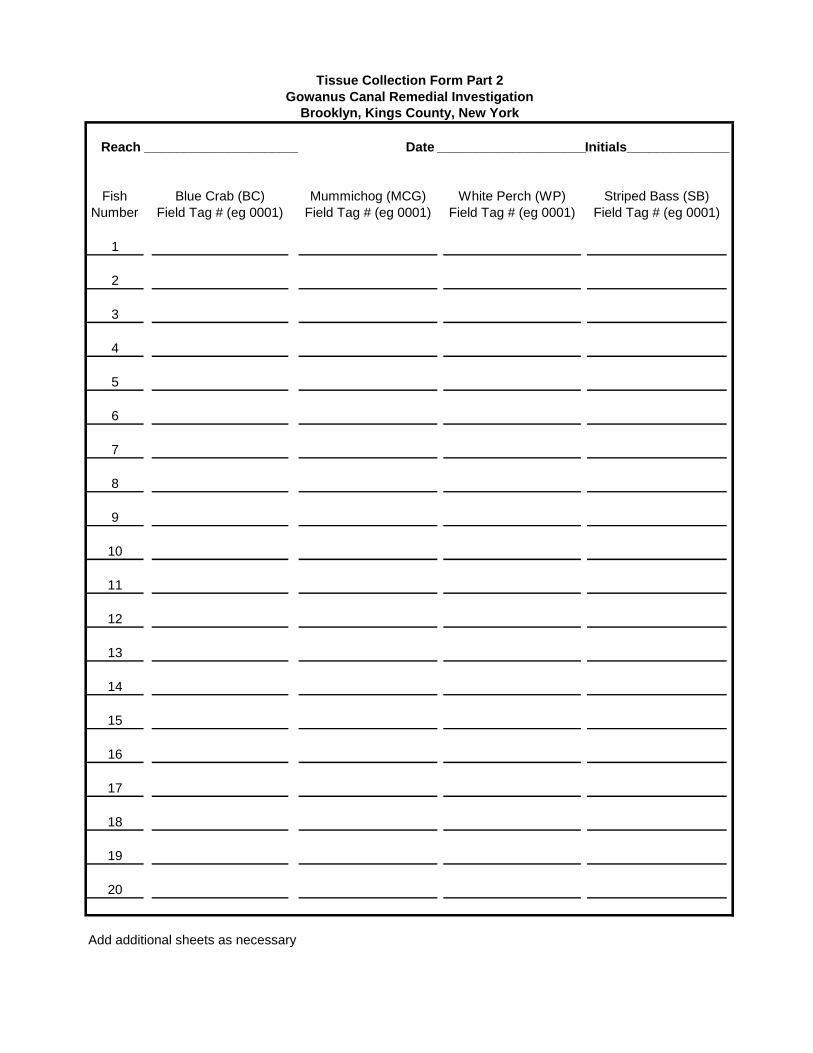
Reach______________________ Date______________________Initials______________
Fish
Number
Blue Crab (BC)
Field Tag # (eg 0001)
Mummichog (MCG)
Field Tag # (eg 0001)
White Perch (WP)
Field Tag # (eg 0001)
Striped Bass (SB)
Field Tag # (eg 0001)
1
2
3
4
5
6
7
8
9
10
11
12
13
14
15
16
17
18
19
20
Add additional sheets as necessary
Tissue Collection Form Part 2
Gowanus Canal Remedial Investigation
Brooklyn, Kings County, New York
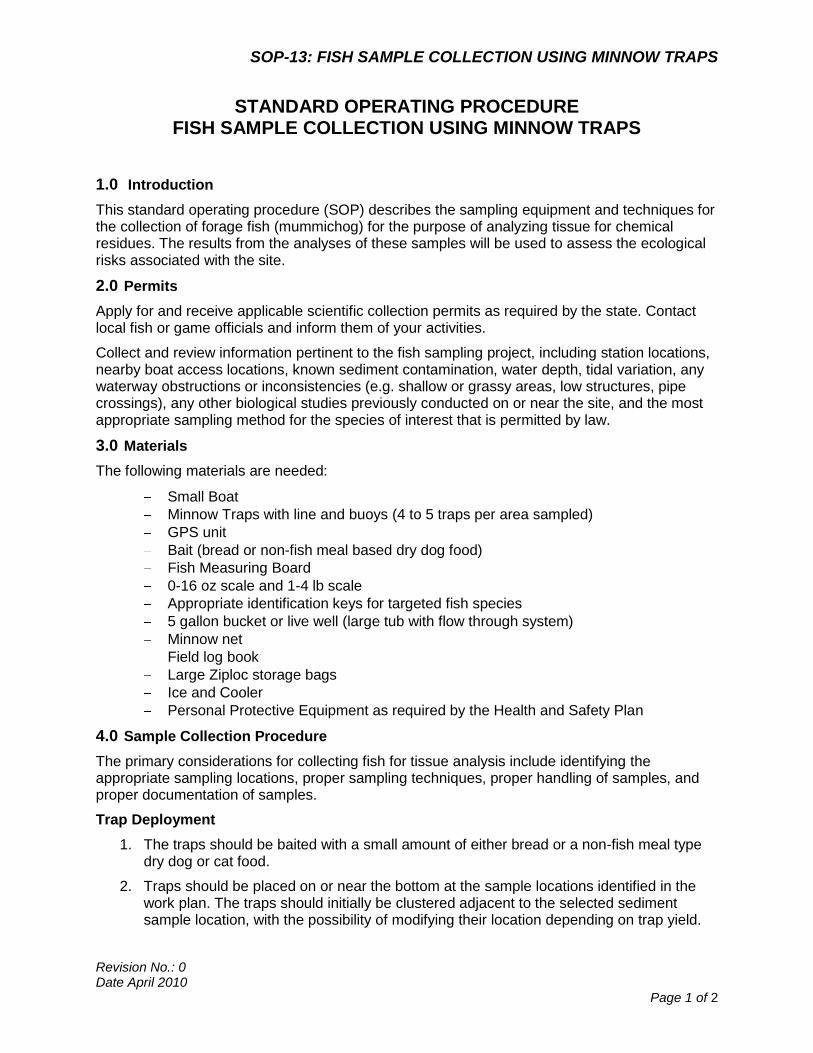
SOP-13: FISH SAMPLE COLLECTION USING MINNOW TRAPS
Revision No.: 0 Date April 2010
Page 1 of 2
STANDARD OPERATING PROCEDURE FISH SAMPLE COLLECTION USING MINNOW TRAPS
1.0 Introduction
This standard operating procedure (SOP) describes the sampling equipment and techniques for the collection of forage fish (mummichog) for the purpose of analyzing tissue for chemical residues. The results from the analyses of these samples will be used to assess the ecological risks associated with the site.
2.0 Permits
Apply for and receive applicable scientific collection permits as required by the state. Contact local fish or game officials and inform them of your activities.
Collect and review information pertinent to the fish sampling project, including station locations, nearby boat access locations, known sediment contamination, water depth, tidal variation, any waterway obstructions or inconsistencies (e.g. shallow or grassy areas, low structures, pipe crossings), any other biological studies previously conducted on or near the site, and the most appropriate sampling method for the species of interest that is permitted by law.
3.0 Materials
The following materials are needed:
Small Boat
Minnow Traps with line and buoys (4 to 5 traps per area sampled)
GPS unit
Bait (bread or non-fish meal based dry dog food)
Fish Measuring Board
0-16 oz scale and 1-4 lb scale
Appropriate identification keys for targeted fish species
5 gallon bucket or live well (large tub with flow through system)
Minnow net
Field log book
Large Ziploc storage bags
Ice and Cooler
Personal Protective Equipment as required by the Health and Safety Plan
4.0 Sample Collection Procedure
The primary considerations for collecting fish for tissue analysis include identifying the appropriate sampling locations, proper sampling techniques, proper handling of samples, and proper documentation of samples.
Trap Deployment
1. The traps should be baited with a small amount of either bread or a non-fish meal type dry dog or cat food.
2. Traps should be placed on or near the bottom at the sample locations identified in the work plan. The traps should initially be clustered adjacent to the selected sediment sample location, with the possibility of modifying their location depending on trap yield.
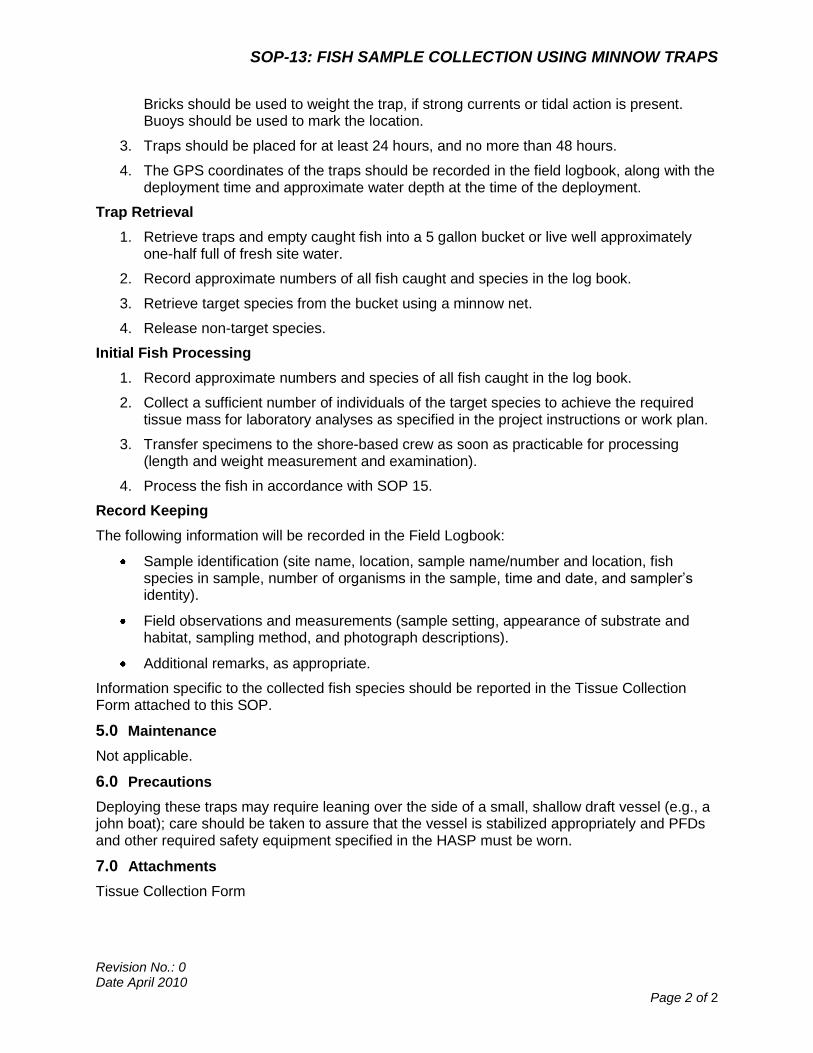
SOP-13: FISH SAMPLE COLLECTION USING MINNOW TRAPS
Revision No.: 0 Date April 2010
Page 2 of 2
Bricks should be used to weight the trap, if strong currents or tidal action is present. Buoys should be used to mark the location.
3. Traps should be placed for at least 24 hours, and no more than 48 hours.
4. The GPS coordinates of the traps should be recorded in the field logbook, along with the deployment time and approximate water depth at the time of the deployment.
Trap Retrieval
1. Retrieve traps and empty caught fish into a 5 gallon bucket or live well approximately one-half full of fresh site water.
2. Record approximate numbers of all fish caught and species in the log book.
3. Retrieve target species from the bucket using a minnow net.
4. Release non-target species.
Initial Fish Processing
1. Record approximate numbers and species of all fish caught in the log book.
2. Collect a sufficient number of individuals of the target species to achieve the required tissue mass for laboratory analyses as specified in the project instructions or work plan.
3. Transfer specimens to the shore-based crew as soon as practicable for processing (length and weight measurement and examination).
4. Process the fish in accordance with SOP 15.
Record Keeping
The following information will be recorded in the Field Logbook:
Sample identification (site name, location, sample name/number and location, fish species in sample, number of organisms in the sample, time and date, and sampler’s identity).
Field observations and measurements (sample setting, appearance of substrate and habitat, sampling method, and photograph descriptions).
Additional remarks, as appropriate.
Information specific to the collected fish species should be reported in the Tissue Collection Form attached to this SOP.
5.0 Maintenance
Not applicable.
6.0 Precautions
Deploying these traps may require leaning over the side of a small, shallow draft vessel (e.g., a john boat); care should be taken to assure that the vessel is stabilized appropriately and PFDs and other required safety equipment specified in the HASP must be worn.
7.0 Attachments
Tissue Collection Form
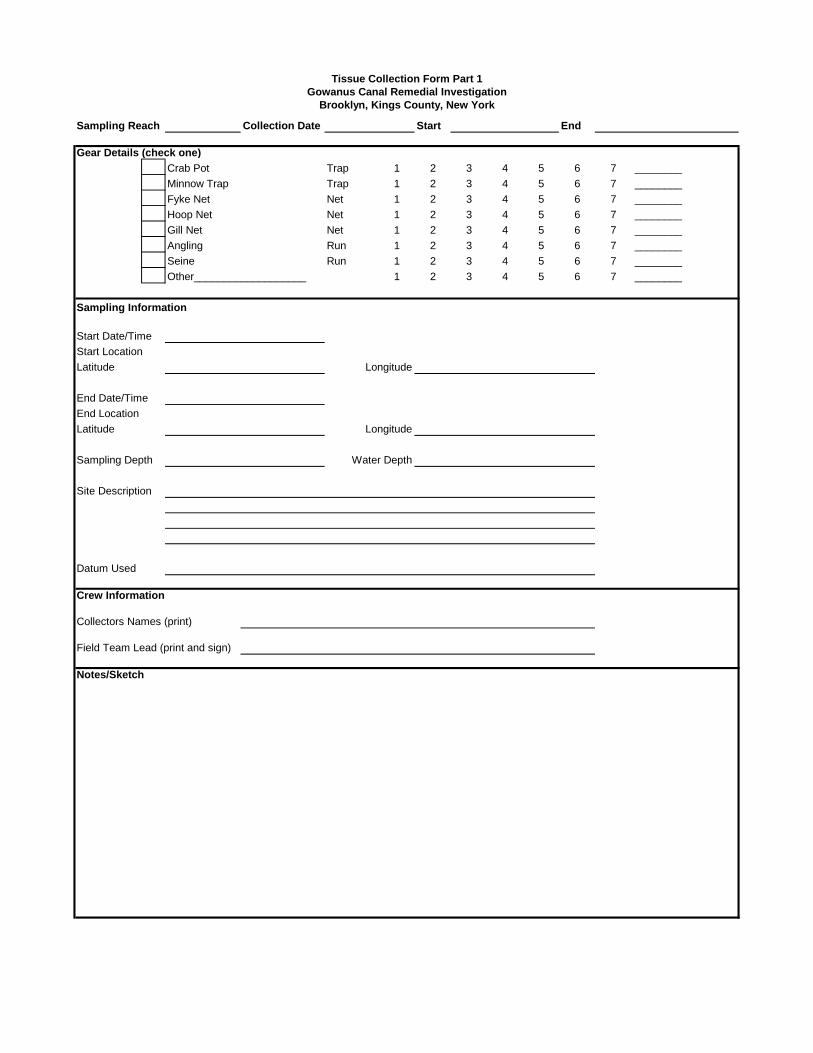
Sampling Reach Collection Date Start End
Gear Details (check one)
Crab Pot Trap 1 2 3 4 5 6 7 ________
Minnow Trap Trap 1 2 3 4 5 6 7 ________
Fyke Net Net 1 2 3 4 5 6 7 ________
Hoop Net Net 1 2 3 4 5 6 7 ________
Gill Net Net 1 2 3 4 5 6 7 ________
Angling Run 1 2 3 4 5 6 7 ________
Seine Run 1 2 3 4 5 6 7 ________
Other___________________ 1 2 3 4 5 6 7 ________
Sampling Information
Start Date/Time
Start Location
Latitude Longitude
End Date/Time
End Location
Latitude Longitude
Sampling Depth Water Depth
Site Description
Datum Used
Crew Information
Collectors Names (print)
Field Team Lead (print and sign)
Notes/Sketch
Tissue Collection Form Part 1
Gowanus Canal Remedial Investigation
Brooklyn, Kings County, New York

Reach ______________________ Date______________________Initials______________
Fish
Number
Blue Crab (BC)
Field Tag # (eg 0001)
Mummichog (MCG)
Field Tag # (eg 0001)
White Perch (WP)
Field Tag # (eg 0001)
Striped Bass (SB)
Field Tag # (eg 0001)
1
2
3
4
5
6
7
8
9
10
11
12
13
14
15
16
17
18
19
20
21
22
23
24
25
Tissue Collection Form Part 2
Gowanus Canal Remedial Investigation
Brooklyn, Kings County, New York
SOP-14: SHELLFISH SAMPLE COLLECTION USING CRAB POTS
Revision No.: 0 Date: April 2010
Page 1 of 3
STANDARD OPERATING PROCEDURE CRAB SAMPLE COLLECTION USING CRAB POTS
1.0 Introduction
This standard operating procedure (SOP) describes the sampling equipment and techniques for using crab pots for the collection of shell fish (e.g., blue crab) for the purpose of analyzing tissue for chemical residues. The results from the analyses of these samples will be used to assess the human health and ecological risks associated with the site.
2.0 Permits
Apply for and receive applicable scientific collection permits as required by the state. Contact local fish or game officials and inform them of your activities.
Collect and review information pertinent to the crab sampling project, including station locations, nearby boat access locations, known sediment contamination, water depth, tidal variation, any waterway obstructions or inconsistencies (e.g. shallow or grassy areas, low structures, pipe crossings), any other biological studies previously conducted on or near the site, species used locally for human consumption and the degree of such consumption, and the most appropriate sampling method for the species of interest that is permitted by law.
3.0 Materials
The following materials are needed:
Small Boat
Commercially available stainless-steel rubber-wrapped crab traps (4 to 5 traps per area sampled) outfitted with degradable latches to ensure that escape holes will open if a trap is lost
Bait (fish scraps, chicken/turkey necks, or bull lips)
Stainless steel calipers for measure carapace
0-16 oz scale and 1-4 lb scale
Appropriate identification keys for targeted species
5 gallon bucket or live well (large tub with flow through system)
Small dip net
Field log book
Large Ziploc storage bags
Ice and Cooler
Personal Protective Equipment as required by the Health and Safety Plan
4.0 Sample Collection Procedure
The primary considerations for collecting crab for tissue analysis include identifying sampling locations, proper sampling techniques, proper handling of samples, and proper documentation of samples.
SOP-14: SHELLFISH SAMPLE COLLECTION USING CRAB POTS
Revision No.: 0 Date: April 2010
Page 2 of 3
Trap Deployment
1. Bait the traps with. Place the crab bait (fish scraps, chicken/turkey necks, or bull lips) in mesh bait bags and tie to the inside of the trap so the bag cannot be opened and its contents consumed.
2. Attach a float to each trap.
3. Deploy traps over side of boat. The traps should initially be spaced evenly over each sample area, with the possibility of modifying their location depending on trap yield.
4. The GPS coordinates of each trap should be recorded in the field logbook, along with the deployment time and approximate water depth at the time of deployment.
5. Traps should be retrieved and crabs removed at least every 24 hours, but traps can be immediately re-baited and redeployed as necessary to collect additional crabs.
Trap Retrieval
1. Retrieve traps and empty caught organisms into a 5 gallon bucket or live well approximately one-half full of fresh site water.
2. Record approximate numbers of all organisms and species caught in the log book.
3. Retrieve target species from the bucket and release non-target species.
4. Inspect crab samples to ensure that their exoskeletons have not been cracked or damaged; discard any damaged crabs.
Initial Crab Processing
1. Record approximate numbers and species of all crabs caught in the log book.
2. Collect a sufficient number of individuals of the target species to achieve the required tissue mass for laboratory analyses as specified in the work plan.
3. Place crabs on ice prior to further processing. Transfer specimens to the shore-based crew as soon as practicable for processing (length and weight measurement and examination).
4. Complete processing the crabs in accordance with SOP 15.
Record Keeping
The following information will be recorded in the Field Logbook:
Sample identification (site name, location, sample name/number and location, number of organisms in the sample, time and date, and sampler’s identity).
Field observations and measurements (sample setting, appearance of substrate and habitat, sampling method, and photograph descriptions).
Additional remarks, as appropriate.
Complete the Tissue Collection Form attached to this SOP.
5.0 Maintenance
At the beginning of each day, and after every 20 measurements, check the calibration of the fish-weighing scale using the calibration weight.
SOP-14: SHELLFISH SAMPLE COLLECTION USING CRAB POTS
Revision No.: 0 Date: April 2010
Page 3 of 3
6.0 Precautions
Deploying these traps may require leaning over the side of a small, shallow draft vessel (e.g., a john boat); care should be taken to assure that the vessel is stabilized appropriately and PFDs and other required safety equipment specified in the HASP must be worn.
7.0 Attachments
Tissue Collection Form

Sampling Reach Collection Date Start End
Gear Details (check one)
Crab Pot Trap 1 2 3 4 5 6 7 ________
Minnow Trap Trap 1 2 3 4 5 6 7 ________
Fyke Net Net 1 2 3 4 5 6 7 ________
Hoop Net Net 1 2 3 4 5 6 7 ________
Gill Net Net 1 2 3 4 5 6 7 ________
Angling Run 1 2 3 4 5 6 7 ________
Seine Run 1 2 3 4 5 6 7 ________
Other___________________ 1 2 3 4 5 6 7 ________
Sampling Information
Start Date/Time
Start Location
Latitude Longitude
End Date/Time
End Location
Latitude Longitude
Sampling Depth Water Depth
Site Description
Datum Used
Crew Information
Collectors Names (print)
Field Team Lead (print and sign)
Notes/Sketch
Tissue Collection Form Part 1
Gowanus Canal Remedial Investigation
Brooklyn, Kings County, New York
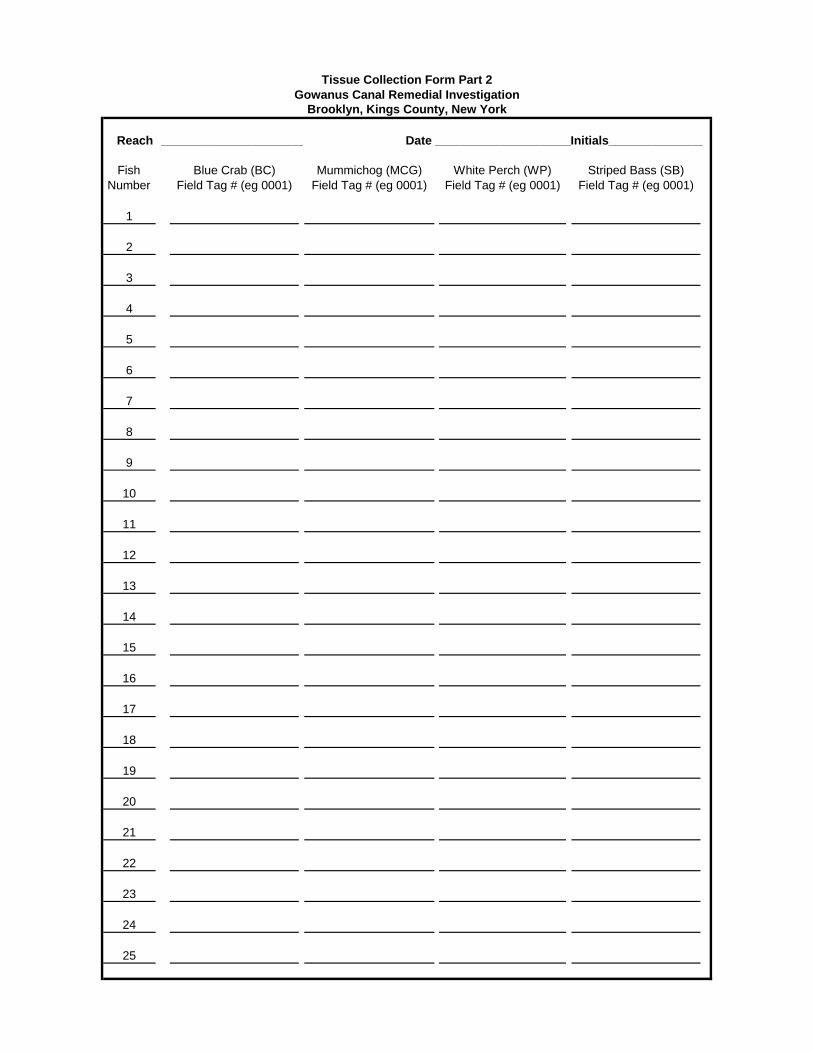
Reach ______________________ Date______________________Initials______________
Fish
Number
Blue Crab (BC)
Field Tag # (eg 0001)
Mummichog (MCG)
Field Tag # (eg 0001)
White Perch (WP)
Field Tag # (eg 0001)
Striped Bass (SB)
Field Tag # (eg 0001)
1
2
3
4
5
6
7
8
9
10
11
12
13
14
15
16
17
18
19
20
21
22
23
24
25
Tissue Collection Form Part 2
Gowanus Canal Remedial Investigation
Brooklyn, Kings County, New York
SOP-15: FISH AND CRAB SAMPLE PROCESSING
Revision No.: 0 Date: April 2010
Page 1 of 4
STANDARD OPERATING PROCEDURE FISH AND CRAB SAMPLE PROCESSING
1.0 Introduction
This standard of practice (SOP) describes the procedures used for measuring fish length and weight and performing the external examination of the collected fish. This SOP applies to all fish collected as part of the remedial investigation activities.
2.0 Materials
The following materials are needed:
Coolers and thermometers
Balance and calibration weight
Measuring board
Examination board (such as a plastic cutting board or stainless steel pan or tray)
Nitrile gloves
Heavy-duty aluminum foil
Tubular, 4-mil, low-density polyethylene (LDPE), Food and Drug Administration (FDA)-approved plastic bags
Cable ties
Sprayer or buckets containing site water for rinsing equipment
Forms (data sheets): length-weight form (LWF) and fish external examination form for fish; width-weight form (WWF) for crabs
Secondary field tags
Cell phone
Site Health and Safety Plan
3.0 General Guidelines and Procedures
The measurement and external examination of fish and crabs will be performed at the site at a station specifically set up for this purpose. The station will be equipped with necessary communications equipment to contact the personnel on board a sampling vessel or an alternate land site. The work area will have proper ventilation. The work area will be lined with plastic and will contain at least two coolers with ice, work tables/benches, the measuring equipment, and space for examining the fish.
Fish Processing
The procedures below will be used for fish processing at the onshore station. Fish will generally be measured and examined on the same day that they are collected. Fish will be measured, examined, and shipped to the lab on ice within 24 hours of collection.
1. Receive fish from field sample crew. Fish will be on ice in coolers, sorted by sampling area and species. Check that coolers are clearly labeled and that ice in coolers is adequate to keep fish cold until measurement and examination is complete.

SOP-15: FISH AND CRAB SAMPLE PROCESSING
Revision No.: 0 Date: April 2010
Page 2 of 4
2. Wear nitrile gloves when handling fish. Clean gloves should be worn when handling fish from different sampling areas.
3. For each cooler, count all fish, confirm species identification, and check that each fish has been tagged.
4. Check the field tag against the information on the fish collection form (FCF).
5. Locate or prepare an LWF for each species composite sample and proceed as follows:
• A separate LWF should be used for each species collected at each Area.
• A single LWF should be used for up to 25 individuals of a species at an Area, even if the fish were collected at different dates or times. If more than 25 fish of a species are collected from an Area, an additional LWF may be used.
• Record date and time of measurement on the LWF.
6. Prepare the measuring and examination area, as follows:
a) At the beginning of each day, and after every 20 measurements, check the calibration of the fish-weighing scale using the calibration weight for the larger fish caught.
b) Decontaminate the examination board or tray and the measuring board using a DI water rinse (rinse into a bucket or tub and discard water in IDW drum). This will be performed when a different species or different sample location is being measured.
c) If necessary, decontaminate the balance pan by rinsing with DI water (this is unnecessary if the balance pan is covered with a clean piece of foil for each fish).
7. Rinse the surface of the fish by spraying with DI water to remove loose scales or other particles, dirt, or blood. Discard rinse water as described in Step 6b, above.
8. Record the field tag number on the LWF for the Area and species identified by the label on the cooler. This information should be cross-checked with the information on the FCF filled out by the sampler at the time of collection.
9. Measure the length of the fish. Place the fish on the measuring board with the anterior end (nose) of the fish against the zero line on the board. Measure the length of the fish at its longest point, and record the value on the LWF. Record length to the nearest millimeter.
10. Measure the weight of the fish. Tare the balance and place the fish on the balance. Make sure that any parts of the fish overhanging the balance pan are not touching the table or any other objects. Record the weight of the fish on the LWF. Record weight to the nearest gram (note that the balance used may read in 2-gram increments, in which case record to the nearest 2 grams).
11. Perform the external examination. Place the fish on the examination board or on the piece of foil that will be used to wrap the fish for storage and shipping. Fill out a fish external examination form (attached), using a separate form for each fish. A detailed explanation of each step in the examination will be available in the examination area.
12. After the examination has been performed and the length and weight recorded, wrap each fish in aluminum foil with the dull surface of the foil against the fish.
SOP-15: FISH AND CRAB SAMPLE PROCESSING
Revision No.: 0 Date: April 2010
Page 3 of 4
13. Fill out a secondary field tag. The secondary field tag will be used by the homogenization lab to identify the fish without unwrapping it. The tag will be an adhesive tag that will be placed on the outside of the bag and secured with clear packing tape. The minimum information on the tag will include the reach (area) where the sample was collected, species, field tag number and composite sample ID.
14. Place the fish inside the bag, close the bag and stick the secondary field tag on the outside of the bag.
15. Place the fish in shipping cooler. Fish to be included in the same composite sample should be placed together in one large bag.
16. Scan copies of the FCFs and LWFs for distribution to the team and place in the project files.
Crab Processing
The procedures below will be used for crab processing at the onshore station. Crabs will generally be measured and examined on the same day that they are collected. Crabs will be measured, examined, and shipped to the lab on ice within 24 hours of collection.
1. Receive crabs from field sample crew. Crabs will be on ice in coolers, sorted by sampling area and species. Check that coolers are clearly labeled and that ice in coolers is adequate to keep crabs cold until measurement and examination is complete.
2. Wear nitrile gloves when handling crabs. Clean gloves should be worn when handling crabs from different sampling areas.
3. For each cooler, count all crabs, confirm species identification, and check that each crab has been tagged.
4. Check the field tag against the information on the crab collection form (CCF).
5. Locate or prepare an WWF for each species composite sample and proceed as follows:
• A separate WWF should be used for each species collected at each Area.
• A single WWF should be used for up to 25 individuals of a species at an Area, even if the crabs were collected at different dates or times. If more than 25 crabs are collected from an Area, an additional WWF may be used.
• Record date and time of measurement on the WWF.
6. Prepare the measuring and examination area, as follows:
a) At the beginning of each day, and after every 20 measurements, check the calibration of the crab-weighing scale using the calibration weight.
b) Decontaminate the examination board or tray and the measuring board using a DI water rinse (rinse into a bucket or tub and discard water in IDW drum.
c) If necessary, decontaminate the balance pan by rinsing with DI water (this is unnecessary if the balance pan is covered with a clean piece of foil for each crab).
7. Rinse the surface of the crab by spraying with DI water to remove loose particles, dirt, or blood. Discard rinse water as described in Step 6b, above.
8. Record the field tag number on the LWF for the Area and species identified by the label on the cooler. This information should be cross-checked with the information on the CCF filled out by the sampler at the time of collection.
SOP-15: FISH AND CRAB SAMPLE PROCESSING
Revision No.: 0 Date: April 2010
Page 4 of 4
9. Measure individual target crab specimens to the nearest 1 mm using stainless-steel calipers. Crab carapace width measurements will be obtained using stainless-steel calipers and a measuring board, respectively.
10. Measure the weight of the crab (easiest if done in a stainless steel bowl tared to the scale). Tare the balance and place the crab on the balance. Make sure that any parts of the crab overhanging the balance pan are not touching the table or any other objects. Record weight to the nearest 0.5 grams and document it on the WWF.
12. After the width and weight have been recorded, wrap each crab in aluminum foil with the dull surface of the foil against the fish.
13. Fill out a secondary field tag. The secondary field tag will be used by the homogenization lab to identify the crab without unwrapping it. The tag will be an adhesive tag that will be placed on the outside of the bag and secured with clear packing tape. The minimum information on the tag will include the reach (area) where the sample was collected, species, field tag number and composite sample ID.
14. Place the crab inside the bag, close the bag and stick the secondary field tag on the outside of the bag.
15. Place the crab in shipping cooler. Crab to be included in the same composite sample should be placed together in one large bag.
16. Scan copies of the CCFs and WWFs for distribution to the team and place in the project files.
4.0 Maintenance
Not applicable.
5.0 Precautions
PPE specified in the HASP should be worn.
6.0 Attachments
Length – Weight Form External Examination Form Tissue Sampling/Composite Form
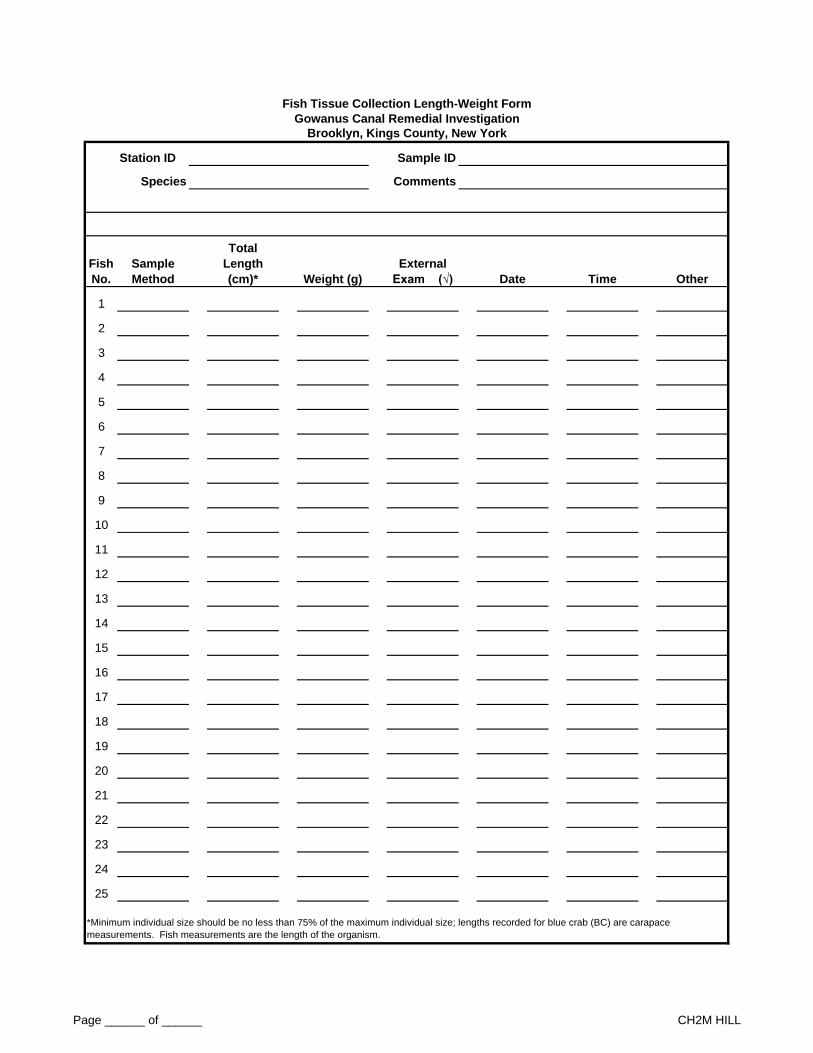
Station ID Sample ID
Species Comments
Fish
No.
Sample
Method
Total
Length
(cm)* Weight (g)
External
Exam (√) Date Time Other
1
2
3
4
5
6
7
8
9
10
11
12
13
14
15
16
17
18
19
20
21
22
23
24
25
*Minimum individual size should be no less than 75% of the maximum individual size; lengths recorded for blue crab (BC) are carapace
measurements. Fish measurements are the length of the organism.
Fish Tissue Collection Length-Weight Form
Gowanus Canal Remedial Investigation
Brooklyn, Kings County, New York
Page ______ of ______ CH2M HILL

Fish Tissue Collection Length-Weight Form
Gowanus Canal Remedial Investigation
Brooklyn, Kings County, New York
Fish Length-Weight Form Notes:
Page ______ of ______ CH2M HILL
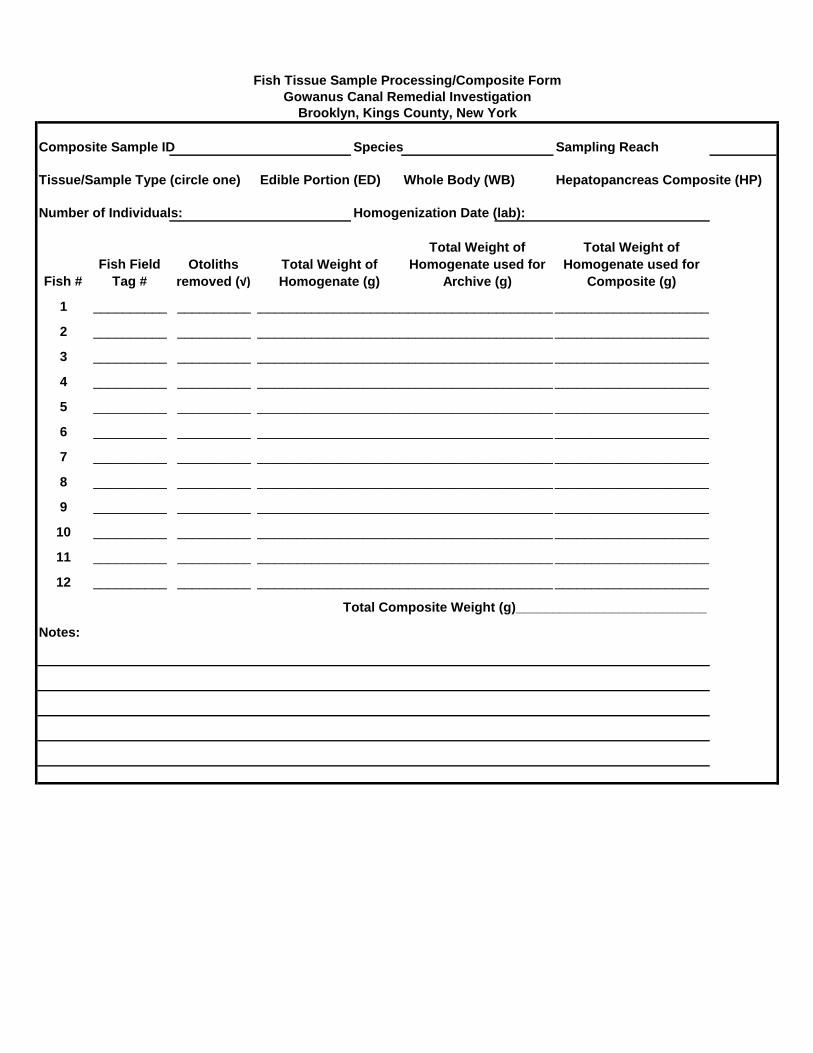
Composite Sample ID Species Sampling Reach
Tissue/Sample Type (circle one) Edible Portion (ED) Whole Body (WB) Hepatopancreas Composite (HP)
Number of Individuals: Homogenization Date (lab):
Fish #
Fish Field
Tag #
Otoliths
removed (√)
1 __________ __________
2 __________ __________
3 __________ __________
4 __________ __________
5 __________ __________
6 __________ __________
7 __________ __________
8 __________ __________
9 __________ __________
10 __________ __________
11 __________ __________
12 __________ __________
Notes:
Total Composite Weight (g)__________________________
_______________________________________________________________
_______________________________________________________________
_______________________________________________________________
_______________________________________________________________
_______________________________________________________________
_______________________________________________________________
_______________________________________________________________
_______________________________________________________________
_______________________________________________________________
_______________________________________________________________
_______________________________________________________________
_______________________________________________________________
Fish Tissue Sample Processing/Composite Form
Gowanus Canal Remedial Investigation
Brooklyn, Kings County, New York
Total Weight of
Homogenate (g)
Total Weight of
Homogenate used for
Archive (g)
Total Weight of
Homogenate used for
Composite (g)

Sampling Reach ______________________________ Species ___________________________
Date__________________________________________ Length (cm) _______________________
Field Tag Number ____________________________ Weight (g)__________________________
Eyes:
normal normal head
raised growth(s) deformed head
reddened lesion(s) upper lip growth normal normal
spinal deformaties lower lip growth exothalmic exothalmic
hemorrhagic body swollen nare opaque opaque
focal discoloration missing missing
body fungs hemorrhagic hemorrhagic
parasites (specifiy) normal emboli emboli
____white spot(s) missing
____black spot(s) stubbed
____leech(es) deformed
____anchor worm(s)
Other, specify Other, specify Other, specify Other, specify
Opercula:
normal Other, specify
slight shortening
severe shortening
Gills:
normal normal
frayed frayed
marginate marginate
pale pale
other, specify other, specify
Fins:
normal frayed Other, specify
mild erosion hemorrhagic
severe erosion emboli
Barbels:
Left Right
Fish Sample Examination Form
Gowanus Canal Remedial Investigation
Brooklyn, Kings County, New York
Body Surface: Head and Oral Cavity:
Left Right
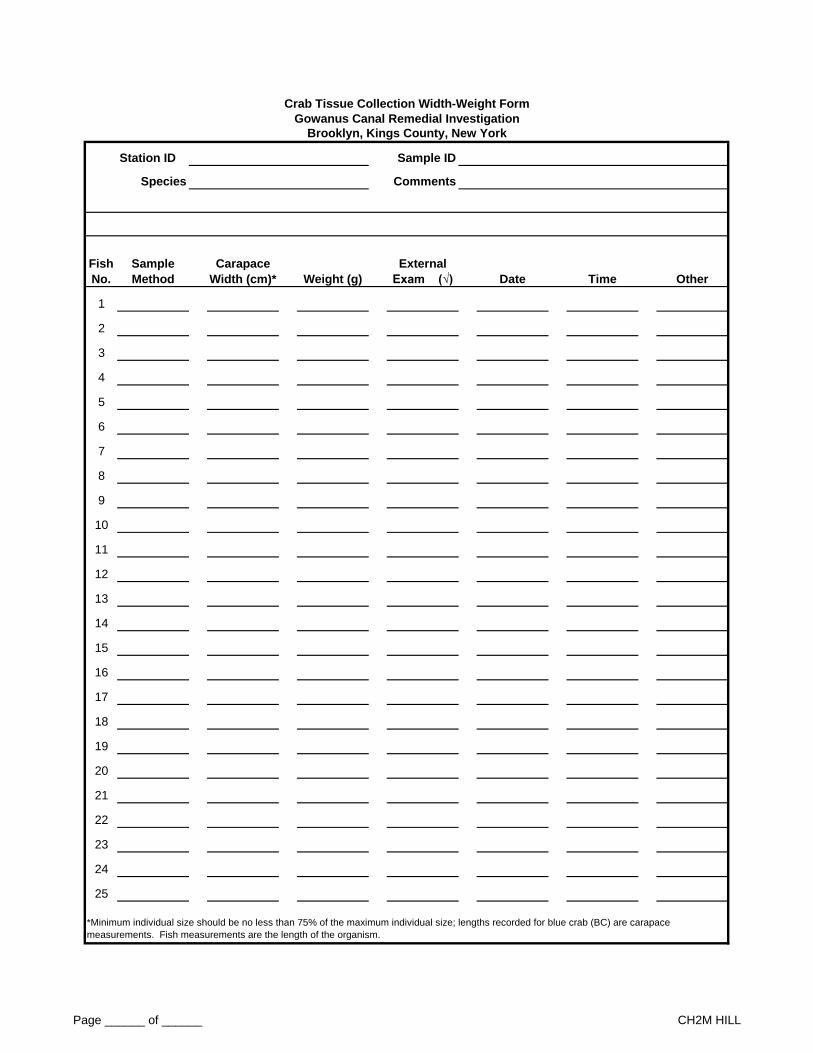
Station ID Sample ID
Species Comments
Fish
No.
Sample
Method
Carapace
Width (cm)* Weight (g)
External
Exam (√) Date Time Other
1
2
3
4
5
6
7
8
9
10
11
12
13
14
15
16
17
18
19
20
21
22
23
24
25
Crab Tissue Collection Width-Weight Form
Gowanus Canal Remedial Investigation
Brooklyn, Kings County, New York
*Minimum individual size should be no less than 75% of the maximum individual size; lengths recorded for blue crab (BC) are carapace
measurements. Fish measurements are the length of the organism.
Page ______ of ______ CH2M HILL

Crab Tissue Collection Width-Weight Form
Gowanus Canal Remedial Investigation
Brooklyn, Kings County, New York
Fish Length-Weight Form Notes:
Page ______ of ______ CH2M HILL

Composite Sample ID Species Sampling Reach
Tissue/Sample Type Edible Portion (ED) Whole Body (WB) Hepatopancreas Composite (HP)
(circle one)
Number of Individuals: Homogenization Date (lab):
Fish #
Crab Field Tag
#
1 __________
2 __________
3 __________
4 __________
5 __________
6 __________
7 __________
8 __________
9 __________
10 __________
11 __________
12 __________
Notes:
Total Composite Weight (g)__________________________
_____________________ _____________________ _____________________
_____________________ _____________________ _____________________
_____________________ _____________________ _____________________
_____________________ _____________________ _____________________
_____________________ _____________________ _____________________
_____________________ _____________________ _____________________
_____________________ _____________________ _____________________
_____________________ _____________________ _____________________
_____________________ _____________________ _____________________
_____________________ _____________________ _____________________
_____________________ _____________________ _____________________
_____________________ _____________________ _____________________
Crab Tissue Sample Processing/Composite Form
Gowanus Canal Remedial Investigation
Brooklyn, Kings County, New York
Total Weight of
Homogenate (g)
Total Weight of
Homogenate used for
Archive (g)
Total Weight of Homogenate
used for Composite (g)

SOP-16: Surface Water Sample Collection
Revision No.: 0 Date: April 2010
Page 1 of 3
STANDARD OPERATING PROCEDURE SURFACE WATER SAMPLE COLLECTION
1.0 Introduction
This Standard Operating Procedure (SOP) describes protocols for collecting and processing surface water samples. This SOP also includes procedures for collecting equipment and field blanks.
2.0 Materials
The following materials are needed for surface water sample collection and processing:
Field logbook
Weighted measuring line or sounding pole
Bottleware, labels, and appropriate preservatives for samples
PPE – gloves, safety glasses
Kemmerer sampler, Van Dorn bottles, or other appropriate discrete water sampler
Bladder pump, tubing and compressor (optional – to be used for a back up)
Water quality collection instrument and calibration solutions (e.g. Horiba or YSI unit) with sensors for DO, pH, salinity, temperature, specific conductivity, turbidity, and ORP.
Hand pump or small peristaltic pump (with power source),0.45 µm inline filters, and tubing for inorganic sample filtration
Ziploc bags
Ice
Decontamination solutions
Digital camera
3.0 Surface Water Sample Collection Procedure
Collection of surface water samples may be supported by a qualified subcontractor. The vessel maneuvering and positioning will be performed by the qualified subcontractor in accordance with their standard procedures and specifications noted in the Scope of Work. The subcontractor may also provide support during the sampling.
The minimum following information must be recorded in the field log book by the project team representative on the vessel:
Time and date of sample collection
Station coordinates (as-sampled)
Water depth
Note any problems with sample collection (e.g., number of attempts needed to collect an adequate sample)
Note general conditions of the water column (odor, color of water, clarity/turbidity, presence of floating debris/trash)

SOP-16: Surface Water Sample Collection
Revision No.: 0 Date: April 2010
Page 2 of 3
Analytical samples collected Surface water samples are collected manually by submerging a clean glass, stainless steel, or poly ethylene container into the water body.
Samples may be collected at depth with a covered bottle that can be removed with a tripline.
The most common sampler types are beakers, sealable bottles and jars, pond samplers, and weighted bottle samplers. Pond samplers have a fixed or telescoping pole attached to the sample container. Weighted bottle samplers are lowered below water surface, where the attached bottle is opened, allowed to fill, and pulled out of the water. When retrieved, the bottle is tightly capped and removed from the sampler assembly.
Specific types of weighted bottle samplers include dissolved oxygen, Kemmerer, or Van Dorn, and are acceptable in most instances.
A sample is taken with the following specific steps:
1. The sampling location is selected.
2. The sample site is approached from downstream in a manner that avoids disturbance of bottom sediments as much as possible.
3. Once positioned on station, the water depth is recorded using a weighted line or sounding pole. Care should be taken to minimize disturbance of the sediment surface and creating turbidity.
4. Collect and record in-situ water quality parameters (DO, pH, salinity, temperature, specific conductivity, turbidity, and ORP) from the depth at which the water sample is to be collected.
5. Using a properly decontaminated or new pond sampler, Kemmerer or Van Dorn bottle, set the sampling device so that the sampling end pieces are pulled away from the sampling tube, allowing the water to be sampled to pass through this tube.
6. Lower the pre-set sampling device to approximately 6 inches below the water surface. Avoid bottom disturbance.
7. When the discrete sampler bottle is at the required depth, send down the messenger, closing the sampling device.
8. Retrieve the sampler and discharge the first 10 to 20 mL to clear any potential contamination on the valve. Transfer the sample to the appropriate sample container.
9. Be sure to use special attachments available on some discrete samplers to distribute small volumes at low flow rates (e.g., VOCs at 100 to 200 mL/ min).
10. For samples collected near the surface, bottles not requiring preservative can be filled by removing the cap from the submerged sampling bottle and filling the containers directly.
11. If bottles can be directly filled at a location, the VOC vials can be filled by transferring water from an unpreserved amber jar to the preserved VOC vials or by using one of the discrete samplers listed below. Metals samples must be collected using a Teflon or HDPE bottle. A non-preserved Teflon or HDPE will be used to collect the water samples for total and dissolved inorganic parameters.
12. The sample for dissolved inorganic parameters will be filtered according to SOP-19. Briefly, the sample will be pumped from the unpreserved container, through a 0.45 µM filter, into a bottle with the appropriate preservative.

SOP-16: Surface Water Sample Collection
Revision No.: 0 Date: April 2010
Page 3 of 3
4.0 Equipment Blank Collection
Equipment blanks will be collected by passing aliquots of the Type II Deionized (DI) water supplied by an environmental sampling supply company through a decontaminated sampling device then decanted into the appropriate bottleware for submittal to the laboratories (QAPP worksheet #19 and attached to this SOP).
Equipment blanks will be analyzed for TAL/TCL parameters and total suspended solids (TSS) as described in the QAPP.
Equipment blanks will be collected daily.
5.0 Field Blank Collection
Field blanks will be collected by transferring aliquots of the Type II DI water supplied by an environmental sampling supply company to the appropriate bottleware for submittal to the laboratories. The purpose of the Field Blank is to assess potential cross-contamination present in the work environment. The transfer of water should be performed in a cascading method between jars to allow for entrainment of potential contaminants.
Field blanks will be analyzed for TAL/TCL parameters and TSS as described in the QAPP.
Field blanks will be collected once per week.
6.0 Maintenance
Not applicable
7.0 Precautions
Sample preservatives may include acids or bases and require use of nitrile gloves and safety glasses. Sampling devices with “snap-top” designs can pose a pinch hazard and care should be taken when setting the devices.
8.0 Attachments
Surface Water Sample Collection Record
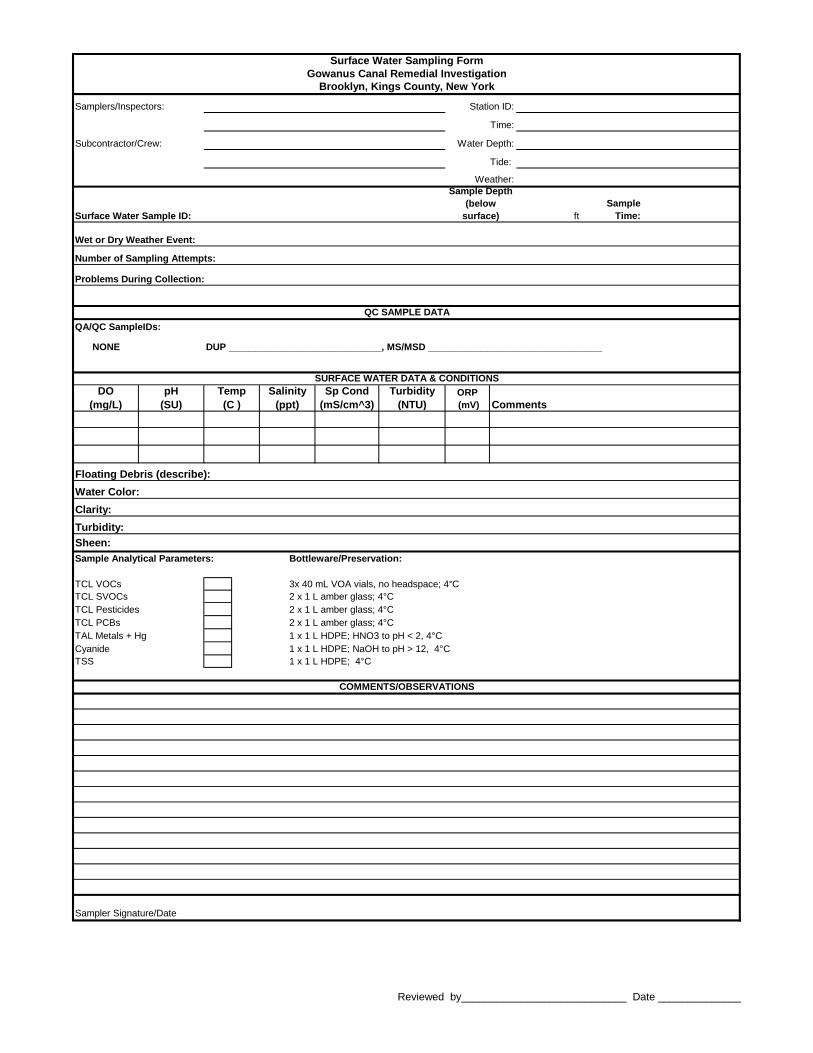
Samplers/Inspectors: Station ID:
Time:
Subcontractor/Crew: Water Depth:
Tide:
Weather:
Surface Water Sample ID: ft
Sample
Time:
Wet or Dry Weather Event:
Number of Sampling Attempts:
QA/QC SampleIDs:
NONE DUP _____________________________, MS/MSD _________________________________
DO
(mg/L)
pH
(SU)
Turbidity
(NTU)
ORP
(mV)
Floating Debris (describe):
Water Color:
Clarity:
Turbidity:
Sheen:
Sample Analytical Parameters: Bottleware/Preservation:
3x 40 mL VOA vials, no headspace; 4°C
2 x 1 L amber glass; 4°C
2 x 1 L amber glass; 4°C
2 x 1 L amber glass; 4°C
1 x 1 L HDPE; HNO3 to pH < 2, 4°C
1 x 1 L HDPE; NaOH to pH > 12, 4°C
1 x 1 L HDPE; 4°C
Sampler Signature/Date
Surface Water Sampling Form
Gowanus Canal Remedial Investigation
Brooklyn, Kings County, New York
SURFACE WATER DATA & CONDITIONS
Sample Depth
(below
surface)
Problems During Collection:
QC SAMPLE DATA
Temp
(C )
Salinity
(ppt)
Sp Cond
(mS/cm^3) Comments
TSS
COMMENTS/OBSERVATIONS
TCL VOCs
TCL SVOCs
TCL Pesticides
TCL PCBs
TAL Metals + Hg
Cyanide
Reviewed by____________________________ Date ______________
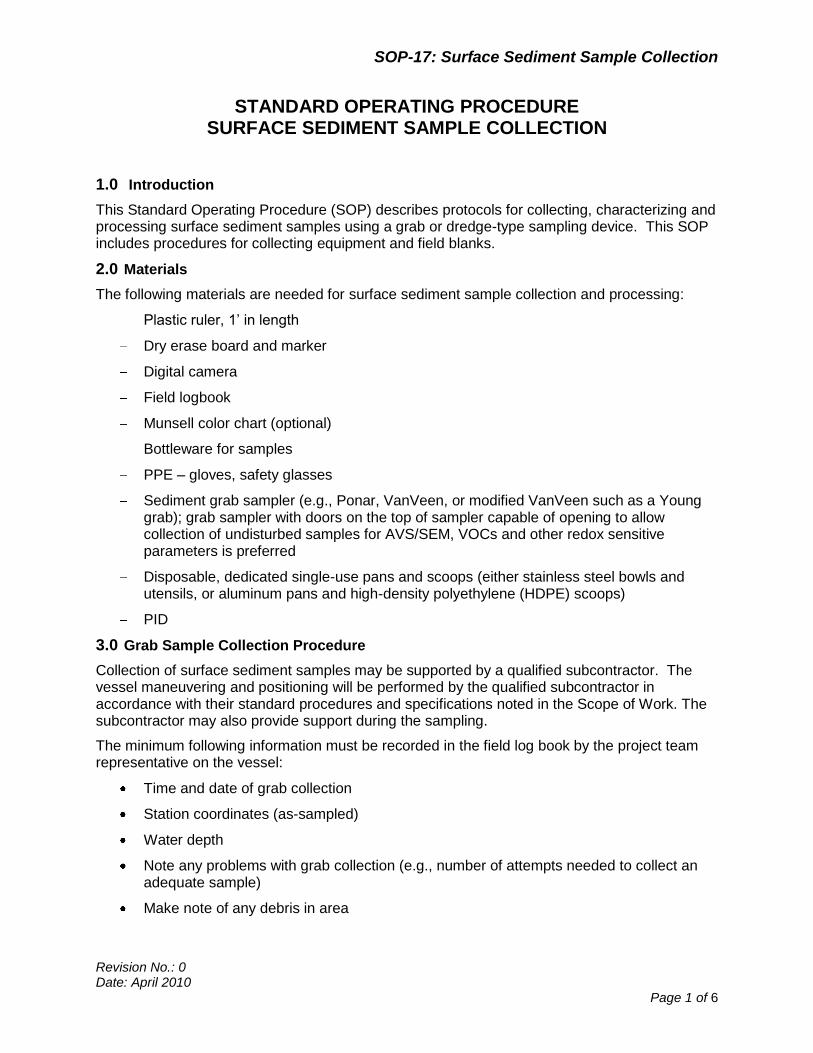
SOP-17: Surface Sediment Sample Collection
Revision No.: 0 Date: April 2010
Page 1 of 6
STANDARD OPERATING PROCEDURE SURFACE SEDIMENT SAMPLE COLLECTION
1.0 Introduction
This Standard Operating Procedure (SOP) describes protocols for collecting, characterizing and processing surface sediment samples using a grab or dredge-type sampling device. This SOP includes procedures for collecting equipment and field blanks.
2.0 Materials
The following materials are needed for surface sediment sample collection and processing:
Plastic ruler, 1’ in length
Dry erase board and marker
Digital camera
Field logbook
Munsell color chart (optional)
Bottleware for samples
PPE – gloves, safety glasses
Sediment grab sampler (e.g., Ponar, VanVeen, or modified VanVeen such as a Young grab); grab sampler with doors on the top of sampler capable of opening to allow collection of undisturbed samples for AVS/SEM, VOCs and other redox sensitive parameters is preferred
Disposable, dedicated single-use pans and scoops (either stainless steel bowls and utensils, or aluminum pans and high-density polyethylene (HDPE) scoops)
PID
3.0 Grab Sample Collection Procedure
Collection of surface sediment samples may be supported by a qualified subcontractor. The vessel maneuvering and positioning will be performed by the qualified subcontractor in accordance with their standard procedures and specifications noted in the Scope of Work. The subcontractor may also provide support during the sampling.
The minimum following information must be recorded in the field log book by the project team representative on the vessel:
Time and date of grab collection
Station coordinates (as-sampled)
Water depth
Note any problems with grab collection (e.g., number of attempts needed to collect an adequate sample)
Make note of any debris in area
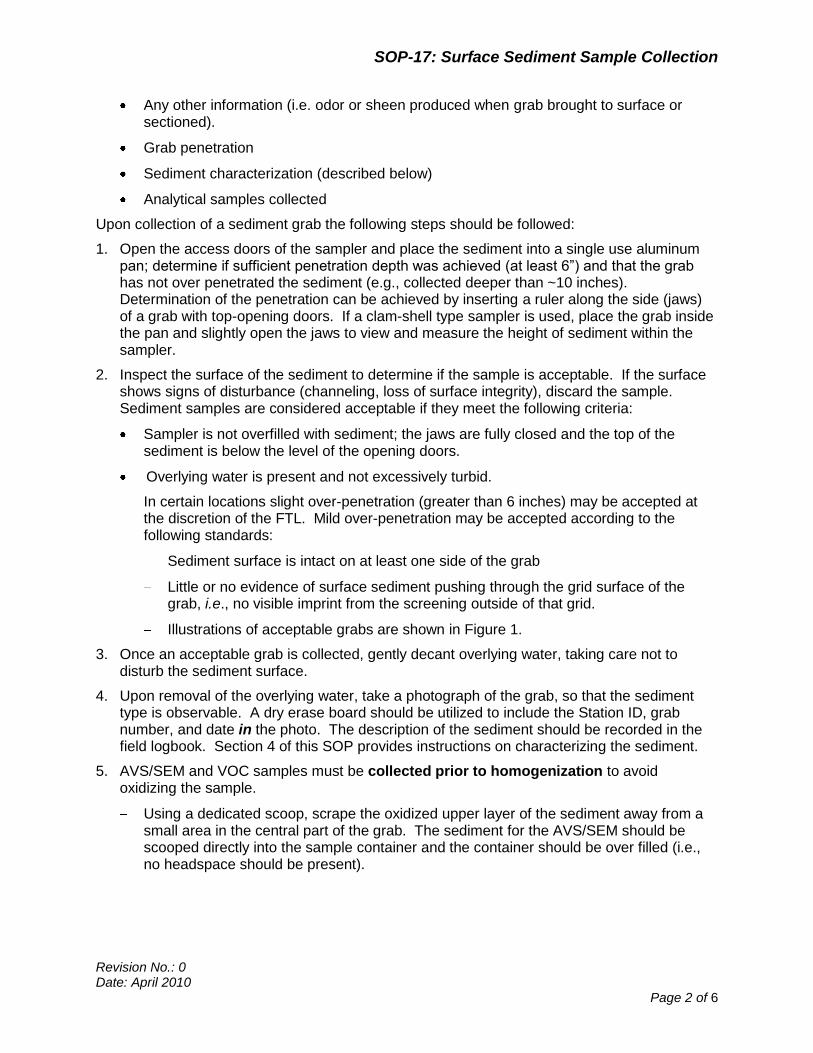
SOP-17: Surface Sediment Sample Collection
Revision No.: 0 Date: April 2010
Page 2 of 6
Any other information (i.e. odor or sheen produced when grab brought to surface or sectioned).
Grab penetration
Sediment characterization (described below)
Analytical samples collected
Upon collection of a sediment grab the following steps should be followed:
1. Open the access doors of the sampler and place the sediment into a single use aluminum pan; determine if sufficient penetration depth was achieved (at least 6”) and that the grab has not over penetrated the sediment (e.g., collected deeper than ~10 inches). Determination of the penetration can be achieved by inserting a ruler along the side (jaws) of a grab with top-opening doors. If a clam-shell type sampler is used, place the grab inside the pan and slightly open the jaws to view and measure the height of sediment within the sampler.
2. Inspect the surface of the sediment to determine if the sample is acceptable. If the surface shows signs of disturbance (channeling, loss of surface integrity), discard the sample. Sediment samples are considered acceptable if they meet the following criteria:
Sampler is not overfilled with sediment; the jaws are fully closed and the top of the sediment is below the level of the opening doors.
Overlying water is present and not excessively turbid.
In certain locations slight over-penetration (greater than 6 inches) may be accepted at the discretion of the FTL. Mild over-penetration may be accepted according to the following standards:
Sediment surface is intact on at least one side of the grab
Little or no evidence of surface sediment pushing through the grid surface of the grab, i.e., no visible imprint from the screening outside of that grid.
Illustrations of acceptable grabs are shown in Figure 1.
3. Once an acceptable grab is collected, gently decant overlying water, taking care not to disturb the sediment surface.
4. Upon removal of the overlying water, take a photograph of the grab, so that the sediment type is observable. A dry erase board should be utilized to include the Station ID, grab number, and date in the photo. The description of the sediment should be recorded in the field logbook. Section 4 of this SOP provides instructions on characterizing the sediment.
5. AVS/SEM and VOC samples must be collected prior to homogenization to avoid oxidizing the sample.
Using a dedicated scoop, scrape the oxidized upper layer of the sediment away from a small area in the central part of the grab. The sediment for the AVS/SEM should be scooped directly into the sample container and the container should be over filled (i.e., no headspace should be present).
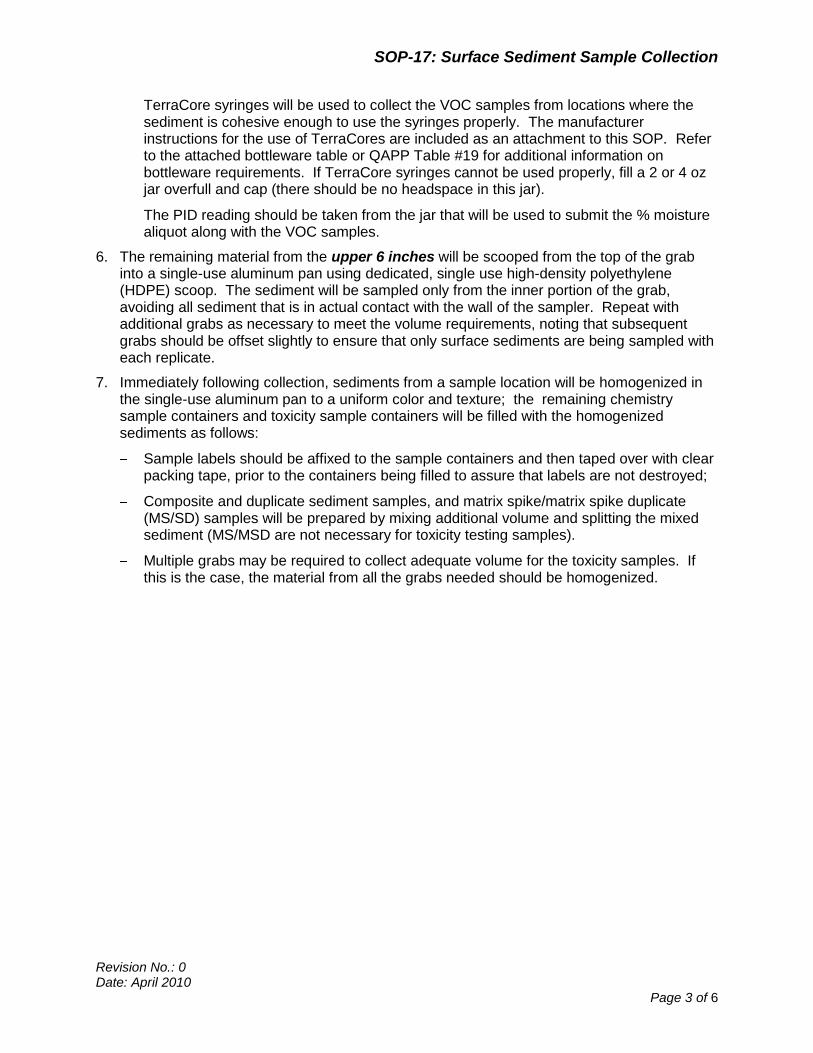
SOP-17: Surface Sediment Sample Collection
Revision No.: 0 Date: April 2010
Page 3 of 6
TerraCore syringes will be used to collect the VOC samples from locations where the sediment is cohesive enough to use the syringes properly. The manufacturer instructions for the use of TerraCores are included as an attachment to this SOP. Refer to the attached bottleware table or QAPP Table #19 for additional information on bottleware requirements. If TerraCore syringes cannot be used properly, fill a 2 or 4 oz jar overfull and cap (there should be no headspace in this jar).
The PID reading should be taken from the jar that will be used to submit the % moisture aliquot along with the VOC samples.
6. The remaining material from the upper 6 inches will be scooped from the top of the grab into a single-use aluminum pan using dedicated, single use high-density polyethylene (HDPE) scoop. The sediment will be sampled only from the inner portion of the grab, avoiding all sediment that is in actual contact with the wall of the sampler. Repeat with additional grabs as necessary to meet the volume requirements, noting that subsequent grabs should be offset slightly to ensure that only surface sediments are being sampled with each replicate.
7. Immediately following collection, sediments from a sample location will be homogenized in the single-use aluminum pan to a uniform color and texture; the remaining chemistry sample containers and toxicity sample containers will be filled with the homogenized sediments as follows:
Sample labels should be affixed to the sample containers and then taped over with clear packing tape, prior to the containers being filled to assure that labels are not destroyed;
Composite and duplicate sediment samples, and matrix spike/matrix spike duplicate (MS/SD) samples will be prepared by mixing additional volume and splitting the mixed sediment (MS/MSD are not necessary for toxicity testing samples).
Multiple grabs may be required to collect adequate volume for the toxicity samples. If this is the case, the material from all the grabs needed should be homogenized.
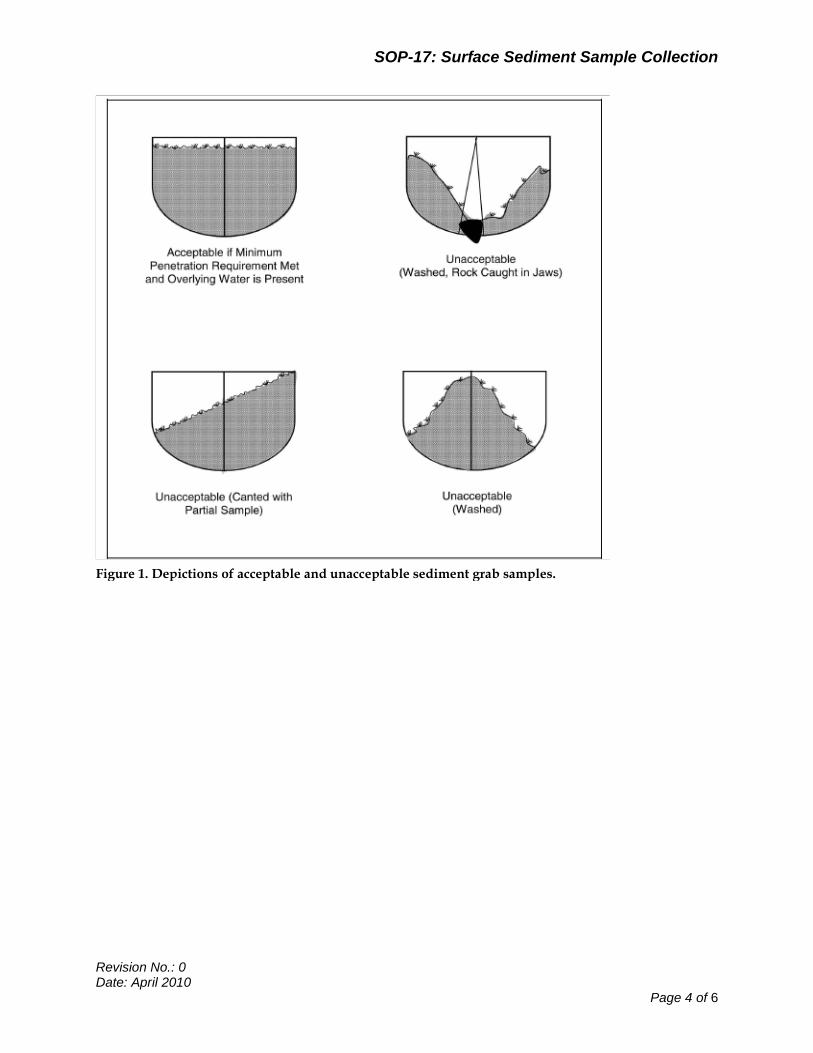
SOP-17: Surface Sediment Sample Collection
Revision No.: 0 Date: April 2010
Page 4 of 6
Figure 1. Depictions of acceptable and unacceptable sediment grab samples.
SOP-17: Surface Sediment Sample Collection
Revision No.: 0 Date: April 2010
Page 5 of 6
4.0 Sediment Characterization
The sediment will be visually characterized for sediment type, color, moisture content, texture, grain size and shape, consistency, visible evidence of staining, and any other observations. The observations recorded must be factual and accurate and must not contain any subjective conclusions about product type (i.e., NAPL observations will consist of a description of the physical properties of the material including a description of odor as standardized below).
The sediment will be described using the Unified Soil Classification System (USCS) (modified slightly for sediment characterization) based visual-manual identification in accordance with the American Society for Testing and Materials (ASTM) ASTM-2488 standard practice.
The colors will be designated using a Munsell color chart. The information will be recorded in a field logbook.
Odor: Use the descriptors none, strong, moderate, or faint to quantify odor.
Odor will be only be categorized as follows:
No Odor
Unclassified Odor (UNC) – used when a distinct odor is present but it cannot be classified into any of the identified categories
Sulfur-like Odor (S) – used to describe a distinct rotten-egg-like odor
Petroleum hydrocarbon-like Odor (PHC) – used to describe odors similar to petroleum products such as gasoline, kerosene, diesel, and fuel oil
Tar-like Odor (T) – used to describe the distinctive odor of coal tar products similar to an asphalt/paving odor
Evidence of contamination: The following descriptors should be used to characterize any visible evidence of non-aqueous phase liquid (NAPL) impact:
NAPL – Any free phase NAPL observed in surface sediments should be described in terms of color, distribution, and viscosity (if determinable) as described further below. Free phase product should be described as NAPL in the “Comments” column on the sample logs. Do not draw any conclusions about the type of product (e.g., oil, tar, fuel, coal tar, etc.)
Sheen - iridescent petroleum-like sheen. Free product is not present but a distinct film is evident.
Stained - used w/ color (i.e. black or brown stained) to indicate that the soil matrix is stained a color other than the natural (unimpacted) color of the soil.
Coated - sediment grains are coated with product – there is not sufficient free-phase material present to saturate the pore spaces.
Blebs - observed discrete sphericals of NAPL - but for the most part the sediment matrix is not visibly contaminated or saturated with NAPL.
Saturated - the entirety of the pore space for a sample is saturated with free product. Care should be taken to ensure that the pore spaces are saturated with NAPL rather than water if this term is used.

SOP-17: Surface Sediment Sample Collection
Revision No.: 0 Date: April 2010
Page 6 of 6
Viscosity of Free-Phase Product – If free-phase product is present, a qualitative description of viscosity should be made. The following descriptors should be used:
• Highly viscous (e.g. taffy-like) • Viscous (e.g. No. 6 fuel oil or bunker crude like) • Low viscosity (e.g. No. 2 fuel oil like)
5.0 Equipment Blank Collection
Equipment blanks will be collected by passing aliquots of the Type II Deionized (DI) water supplied by an environmental sampling supply company over a set of dedicated/disposable or decontaminated re-useable sampling equipment (e.g., HDPE scoop and shallow pan or stainless steel bowl and trowel) and then decanted into the appropriate bottleware for submittal to the laboratories (QAPP worksheet #19 and attached to this SOP).
Equipment blanks will be analyzed for TAL/TCL parameters.
Equipment blanks will be collected daily. Since sediment in contact with the sides of the grab sampler will not be collected for chemical analyses, it is not necessary to collect a blank from the grab sampler.
6.0 Field Blank Collection
Field blanks will be collected by transferring aliquots of the Type II DI water supplied by an environmental sampling supply company to the appropriate bottleware for submittal to the laboratories. The purpose of the Field Blank is to assess potential cross-contamination present in the work environment. The transfer of water should be performed in a cascading method between jars to allow for entrainment of potential contaminants.
Field blanks will be analyzed for TAL/TCL parameters and sulfide.
Field blanks will be collected once per week.
7.0 Maintenance
Not applicable
8.0 Precautions
Sediment grab sampling devices have numerous pinch points and the jaws are very powerful (on large grabs, these are heavy enough to severely injure fingers). Staff should familiarize themselves with the proper operation of the grab and utilize appropriate PPE (heavy gloves) when setting and deploying the grab sampler. If a subcontractor is performing the grab collections, sampling staff should remain clear of the grab and pulleys until given clearance by the operator.
9.0 Attachments
Surface Sediment Sample Collection Record ASTM Method TerraCore Manufacturer’s instructions Sediment Characterization Key

Samplers/Inspectors: Station ID:
Time:
Subcontractor/Crew: Water Depth:
Tide:
Weather:
Bulk Sediment Sample ID: ft
Sample
Time:
Number of Sampling Attempts:
QA/QC SampleIDs:
NONE DUP _____________________________, MS/MSD _________________________________
Floating Debris (describe):
Water Color:
Clarity:
Turbidity:
Sheen:
Sample Analytical Parameters: Bottleware/Preservation:
3x 40 mL vials/TerraCore with stir bar, 1-40 mL vial,full; 4°C
8 oz Amber, wide mouth glass; protect from light, 4°C
8 oz wide mouth glass; 4°C
8 oz wide mouth glass; 4°C
8 oz wide mouth glass; 4°C
8 oz wide mouth glass; 4°C
4 oz wide mouth glass; 4°C
4 oz wide mouth glass; no headspace; 4°C
3 x 1-gallon HDPE buckets; 4°C
Color: Moisture: Dry Sl. Moist Moist V.Moist Wet
Major Description:
Minor Description: Organic Mottled Plastic M.Plastic Nodules vf f coarse-grained Ang / SA / SR / Rounded
Other Descriptors:
Sampler Signature/Date
Cyanide
TOC
TCL VOCs
TCL SVOCs
TCL Pesticides
TCL PCBs
TAL Metals + Hg
Grainsize
AVS/SEM
SED SAMPLE DESCRIPTION
COMMENTS/OBSERVATIONS
Toxicity
Clay Silty Clay Silt Clayey Sand Sandy Clay Sand Gravelly Sand Gravel Grvly Clay
Well / poorly / mod - sorted well / poorly / mod - cemented Loose
Grab
Penetration
Surface Sediment Sampling Form
Gowanus Canal Remedial Investigation
Brooklyn, Kings County, New York
QC SAMPLE DATA
Problems During Collection:
Reviewed by____________________________ Date ______________

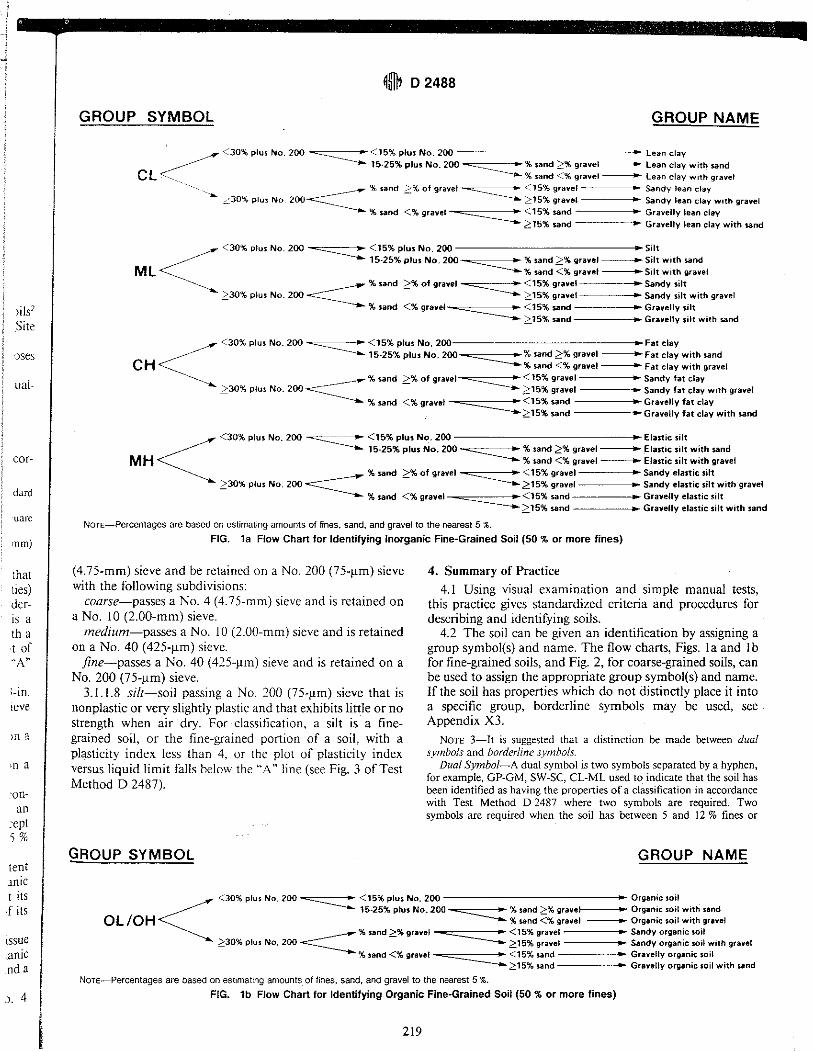

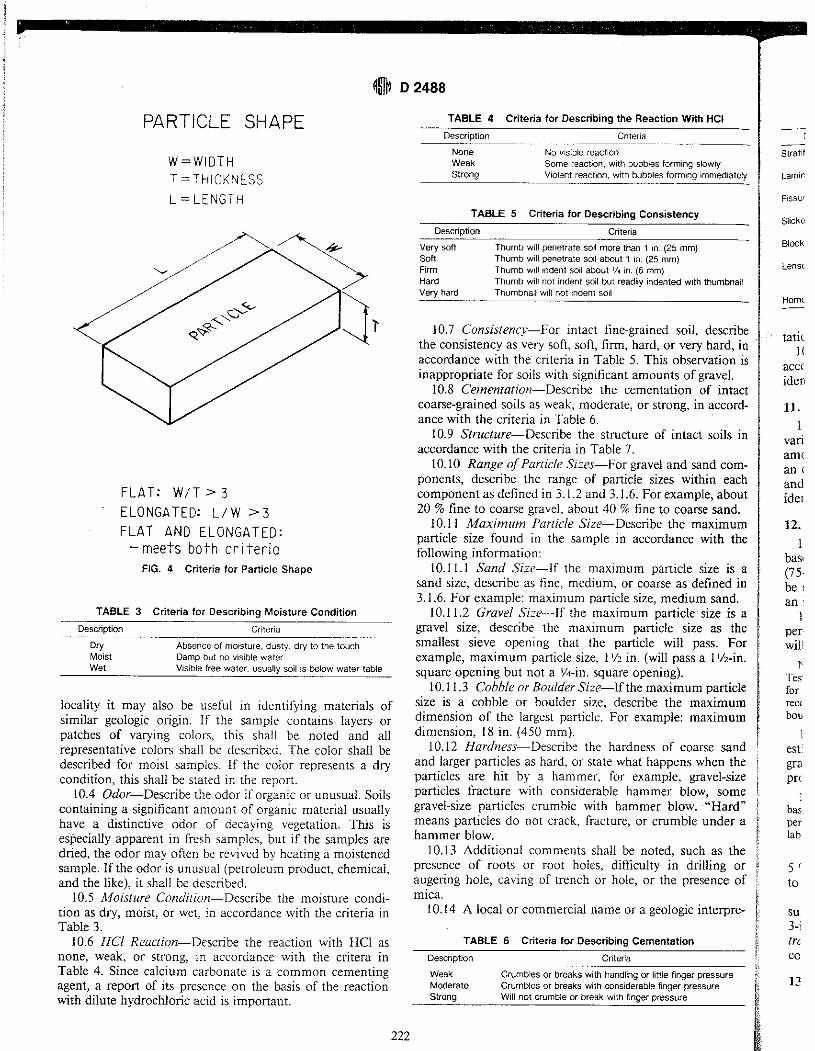
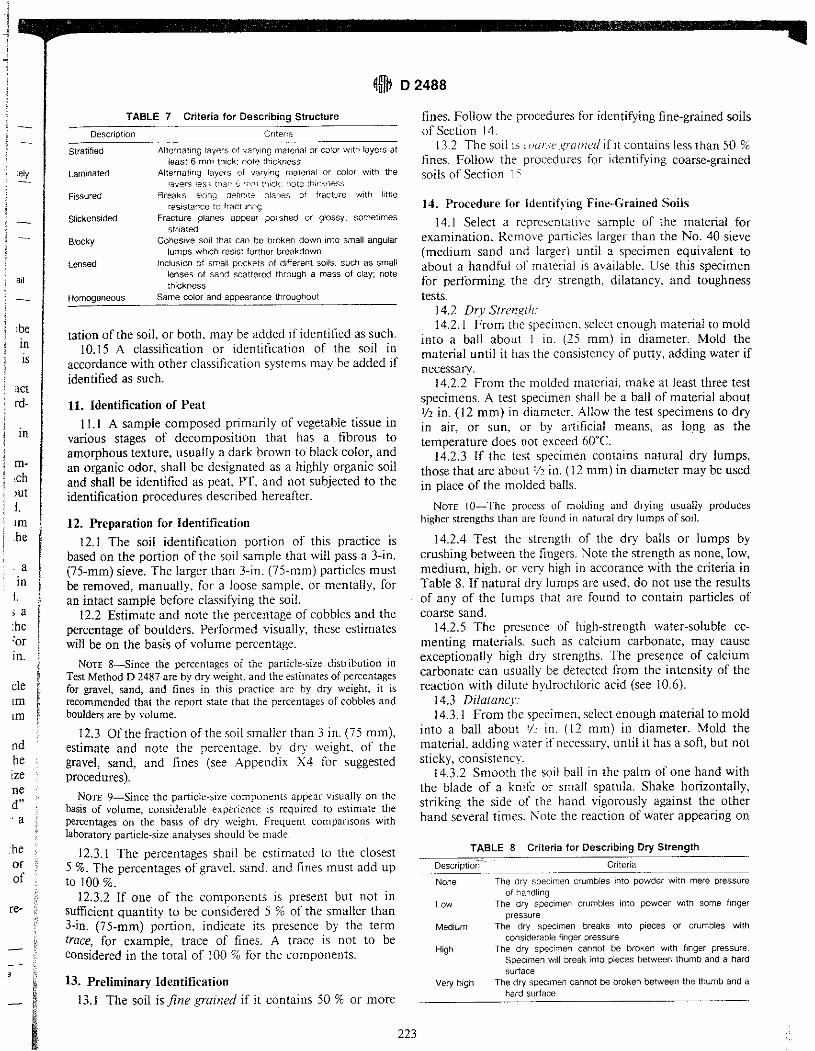


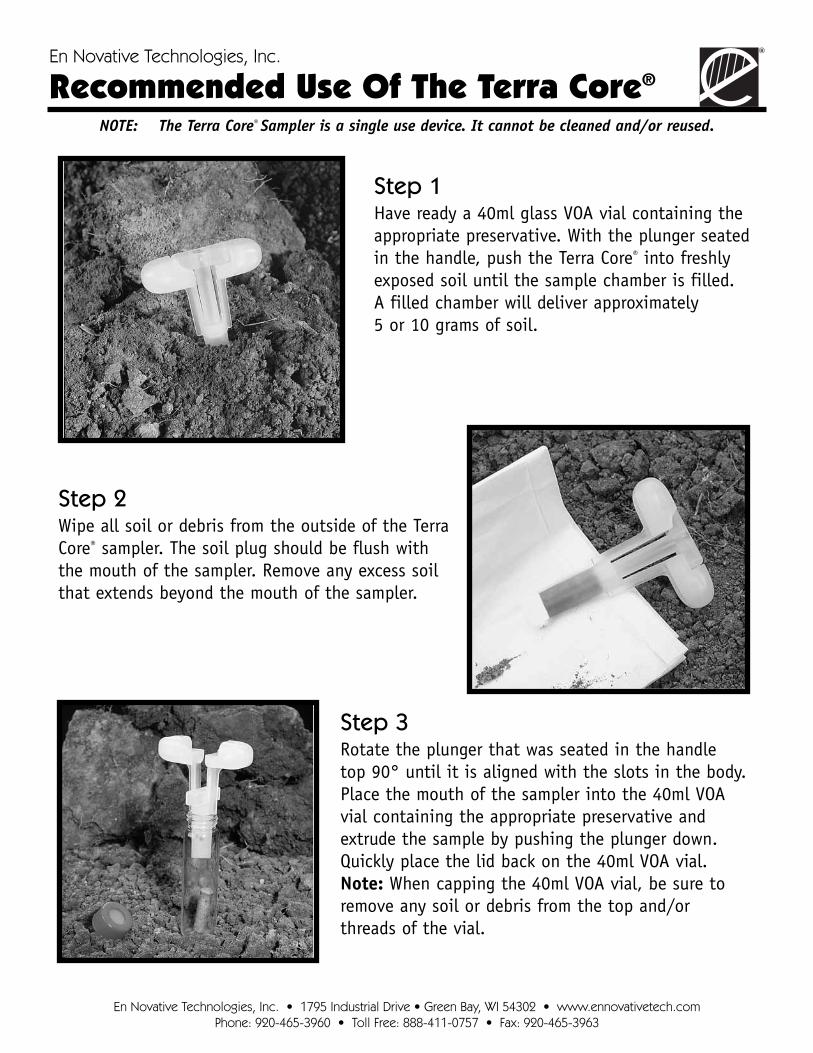
En Novative Technologies, Inc.
Recommended Use Of The Terra Core®
En Novative Technologies, Inc. • 1795 Industrial Drive • Green Bay, WI 54302 • www.ennovativetech.comPhone: 920-465-3960 • Toll Free: 888-411-0757 • Fax: 920-465-3963
NOTE: The Terra Core® Sampler is a single use device. It cannot be cleaned and/or reused.
Step 1Have ready a 40ml glass VOA vial containing theappropriate preservative. With the plunger seatedin the handle, push the Terra Core® into freshlyexposed soil until the sample chamber is filled.A filled chamber will deliver approximately5 or 10 grams of soil.
Step 2Wipe all soil or debris from the outside of the TerraCore® sampler. The soil plug should be flush withthe mouth of the sampler. Remove any excess soilthat extends beyond the mouth of the sampler.
Step 3Rotate the plunger that was seated in the handletop 90° until it is aligned with the slots in the body.Place the mouth of the sampler into the 40ml VOAvial containing the appropriate preservative andextrude the sample by pushing the plunger down.Quickly place the lid back on the 40ml VOA vial.Note: When capping the 40ml VOA vial, be sure toremove any soil or debris from the top and/orthreads of the vial.
En Novative Technologies, Inc.
Terms and Conditions of Sale
En Novative Technologies, Inc. • 1795 Industrial Drive • Green Bay, WI 54302 • www.ennovativetech.comPhone: 920-465-3960 • Toll Free: 888-411-0757 • Fax: 920-465-3963
1. Acceptance. ALL SALES ARE SUBJECT TO AND EXPRESSLY CONDITIONED UPON THE TERMS AND CONDITIONS CONTAINED HEREIN. NO VARIATION OFTHESE TERMS AND CONDITIONS WILL BE BINDING UPON SELLER, UNLESS AGREED TO IN WRITING AND SIGNED BY AN OFFICER OR OTHER AUTHORIZEDREPRESENTATIVE OF SELLER. IF THESE TERMS AND CONDITIONS ARE NOT ACCEPTABLE TO BUYER, BUYER MUST SO NOTIFY SELLER IMMEDIATELY INWRITING.
2. Terms, Delivery, Delays. Unless otherwise specified, terms are net 30 days from the date of invoice, F.O.B. shipping point, freight prepaid and added.All prices are subject to change without notice. Stenographic, clerical and computer errors are subject to correction. If financial condition of Buyerresults in the insecurity of Seller, in Seller’s sole discretion, as to the ultimate collectibility of the purchase price, Seller may, without notice toBuyer, delay or postpone the delivery of goods, and Seller at its option, is authorized to change the terms of payment to payment in full or in partin advance of shipment of the entire undelivered balance of said goods. Buyer agrees to pay all costs, including but not limited to, reasonableattorney and accounting fees and other expenses of collection resulting from any default by Buyer in any of the terms hereof. All risk of loss ordamage during shipping shall be borne by Buyer. Seller reserves the right, in its discretion, to determine the exact method of shipment. Sellerreserves the right to make delivery in installments, all such installments to be separately invoiced and paid for when due per invoice, without regardto subsequent deliveries. Delay in delivery of any installment shall not relieve Buyer or Buyer’s obligation to accept remaining deliveries.Immediately upon Buyer’s receipt of any goods shipped hereunder, Buyer shall inspect the same and shall notify Seller in writing of any claims forshortages, defects or damages and shall hold the goods for Seller’s written instructions concerning disposition. Seller shall not be liable for anyloss, damage or penalty as a result of any delay in or failure to manufacture, deliver or otherwise perform hereunder due to any cause beyond Seller’sreasonable control, including, without limitation, strikes or labor difficulties, acts or omissions of any governmental authority or Buyer, accident,insurrection or riot, fires, floods or other acts of God, breakdowns of essential equipment, priorities or embargoes, shortages, delays in transportation, or inability to obtain necessary labor, fuel, materials, supplies or power at current prices or from usual sources.
3. Allocation of Goods. If Seller is unable for any reason to supply the total demands for goods specified in Buyer’s order, Seller may allocate its available supply among any or all buyers on such basis as Seller may deem fair and practical, without liability for any failure of performance which mayresult therefrom.
4. Taxes and Other Charges. Any use tax, sales tax, excise tax, or any other tax, fee or charge of any nature whatsoever imposed by any governmentalauthority, on or measured by the transaction between Seller and Buyer, shall be paid by Buyer in addition to the prices quoted or invoiced.
5. Warranty. SELLER MAKES NO WARRANTIES REGARDING THE TERRA CORE™ SAMPLER, WHETHER ORAL, WRITTEN, EXPRESS, IMPLIED OR STATUTORY,INCLUDING ANY INFORMATION PROVIDED BY SALES REPRESENTATIVES IN MARKETING LITERATURE, DIRECTIONS FOR USE, OR ANY OTHER INFORMATIONSUPPLIED WITH THE SAMPLER. IMPLIED WARRANTIES OF FITNESS AND MERCHANTABILITY SHALL NOT APPLY. Seller’s warranty obligations and Buyer’sremedies are solely and exclusively as stated herein. FURTHERMORE, SELLER SPECIFICALLY DISCLAIMS ANY WARRANTIES RELATING TO SAMPLE QUALITY OR SAMPLE PRESERVATION. SELLER DOES NOT WARRANT THAT THE USE OF THE TERRA CORE™ SAMPLER WILL RESULT IN COMPLIANCE WITH ANYSAMPLING METHODS OUTLINED BY ANY REGULATORY BODY. SELLER DOES NOT WARRANTY OR GUARANTEE SAMPLING RESULTS.
6. Limitation of Liability. IN NO EVENT SHALL SELLER BE LIABLE FOR ANTICIPATED PROFITS, INCIDENTAL, SPECIAL OR CONSEQUENTIAL DAMAGES,INCLUDING, BUT NOT LIMITED TO, DAMAGES FOR LOSS OF REVENUE, DOWN TIME, REMEDIATION ACTIVITIES, REMOBILIZATION OR RESAMPLING, COSTOF CAPITAL, SERVICE INTERRUPTION OR FAILURE OF SUPPLY, ANY LIABILITY OF BUYER TO A THIRD PARTY, OR FOR LABOR, OVERHEAD, TRANSPORTATION, SUBSTITUTE SUPPLY SOURCES OR ANY OTHER EXPENSE, DAMAGE OR LOSS, INCLUDING PERSONAL INJURY OR PROPERTY DAMAGE. SELLER IS NOTRESPONSIBLE FOR INTERPRETATION OF ANY SAMPLING METHODS OUTLINED BY ANY REGULATORY BODY OR BUYER’S INABILITY TO COMPLY WITH ORCORRECTLY FOLLOW ANY SUCH SAMPLING METHODS. SELLER IS NOT LIABLE FOR DAMAGE CAUSED BY ACCIDENT, ABUSE, MISHANDLING OR DROPPINGOF SAMPLER, DAMAGES DUE TO SAMPLERS THAT HAVE BEEN OPENED, DISASSEMBLED OR MISHANDLED, OR DAMAGES DUE TO SAMPLERS NOT USED INACCORDANCE WITH THE DIRECTIONS. Seller’s liability on any claim of any kind shall be replacement of such goods or refund of the purchase price.Seller shall not be liable for penalties of any description whatsoever. In the event the Terra CoreTM sampler will be utilized by Buyer on behalf of athird party, such third party shall not occupy the position of a third-party beneficiary of the obligation or warranty provided by Seller, and no suchthird party shall have the right to enforce same. All claims must be brought within one (1) year of shipment, regardless of their nature.
7. Returns. Written authorization must be obtained from Seller prior to returning any goods. Buyer shall strictly comply with Seller’s return shipmentinstructions. Returned goods will be subject to a restocking charge.
8. Technical Assistance. At Buyer’s request, Seller may, at Seller’s discretion, furnish technical assistance and information with respect to Seller’sproducts. SELLER MAKES NO WARRANTIES OF ANY KIND OR NATURE, EXPRESS OR IMPLIED, INCLUDING ANY IMPLIED WARRANTY OF MERCHANTABILITYOR FITNESS FOR A PARTICULAR PURPOSE, WITH RESPECT TO TECHNICAL ASSISTANCE OR INFORMATION PROVIDED BY SELLER OR SELLER’S REPRESENTATIVES. ANY SUGGESTIONS BY SELLER REGARDING USE, SELECTION, APPLICATION OR SUITABILITY OF THE SAMPLER SHALL NOT BE CONSTRUED AS ANEXPRESS WARRANTY OF ANY KIND, INCLUDING COMPLIANCE WITH ANY SAMPLING METHODS OUTLINED BY ANY REGULATORY BODY, UNLESS SPECIFICALLY DESIGNATED AS SUCH IN A WRITING SIGNED BY AN OFFICER OF SELLER.
9. Miscellaneous. Seller’s failure to strictly enforce any term or condition of an order or to exercise any right arising hereunder shall not constitute awaiver of Seller’s right to strictly enforce such terms or conditions or exercise such right thereafter. All rights and remedies with respect to anyorder are cumulative and are in addition to any other rights and remedies Seller may have at law or equity. Any waiver of a default by Buyer hereunder shall be in writing. If any provision of these agreed upon terms and conditions shall be held to be invalid, illegal or unenforceable, the validity, legality and enforceability of the remaining provisions shall not be affected or impaired thereby. The paragraph headings herein are for convenience only; they form no part of the terms and conditions and shall not affect their interpretation. This agreement and the terms and conditionsherein shall be binding upon, inure to the benefit of, and be enforceable by, the parties hereto, and their respective heirs, personal representatives,successors and assigns.
10. Governing Law. All disputes relating to the terms hereof, performance of this order or any other claim related to Seller’s goods shall be governed bythe laws of the State of Wisconsin; provided, however, construction shall be without regard to any rule or presumption requiring construction againstthe party causing this agreement to be drafted. Buyer and Seller agree that any dispute arising between them which results in either party instituting court proceedings that such action will be maintained in the Circuit Court for Brown County, Wisconsin.
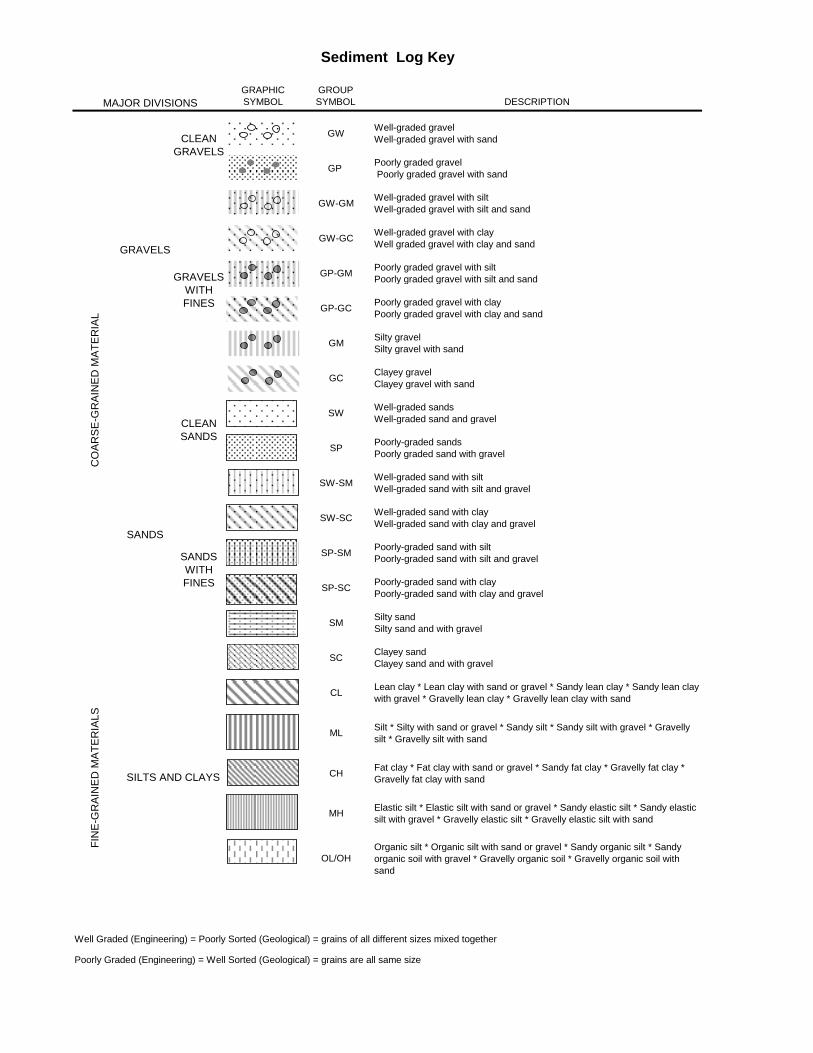
GRAPHIC
SYMBOL
GROUP
SYMBOL DESCRIPTION
GWWell-graded gravel
Well-graded gravel with sand
GP Poorly graded gravel
Poorly graded gravel with sand
GW-GMWell-graded gravel with silt
Well-graded gravel with silt and sand
GW-GCWell-graded gravel with clay
Well graded gravel with clay and sand
GP-GMPoorly graded gravel with silt
Poorly graded gravel with silt and sand
GP-GCPoorly graded gravel with clay
Poorly graded gravel with clay and sand
GMSilty gravel
Silty gravel with sand
GCClayey gravel
Clayey gravel with sand
SWWell-graded sands
Well-graded sand and gravel
SPPoorly-graded sands
Poorly graded sand with gravel
SW-SMWell-graded sand with silt
Well-graded sand with silt and gravel
SW-SCWell-graded sand with clay
Well-graded sand with clay and gravel
SP-SMPoorly-graded sand with silt
Poorly-graded sand with silt and gravel
SP-SCPoorly-graded sand with clay
Poorly-graded sand with clay and gravel
SMSilty sand
Silty sand and with gravel
SCClayey sand
Clayey sand and with gravel
CLLean clay * Lean clay with sand or gravel * Sandy lean clay * Sandy lean clay
with gravel * Gravelly lean clay * Gravelly lean clay with sand
MLSilt * Silty with sand or gravel * Sandy silt * Sandy silt with gravel * Gravelly
silt * Gravelly silt with sand
CHFat clay * Fat clay with sand or gravel * Sandy fat clay * Gravelly fat clay *
Gravelly fat clay with sand
MHElastic silt * Elastic silt with sand or gravel * Sandy elastic silt * Sandy elastic
silt with gravel * Gravelly elastic silt * Gravelly elastic silt with sand
OL/OH
Organic silt * Organic silt with sand or gravel * Sandy organic silt * Sandy
organic soil with gravel * Gravelly organic soil * Gravelly organic soil with
sand
Well Graded (Engineering) = Poorly Sorted (Geological) = grains of all different sizes mixed together
Poorly Graded (Engineering) = Well Sorted (Geological) = grains are all same size
FIN
E-G
RA
INE
D M
AT
ER
IALS
SILTS AND CLAYS
Sediment Log Key
MAJOR DIVISIONSC
OA
RS
E-G
RA
INE
D M
AT
ER
IAL
GRAVELS
CLEAN
GRAVELS
GRAVELS
WITH
FINES
SANDS
CLEAN
SANDS
SANDS
WITH
FINES

Shell hash
λλλλ Peat/organic matter
CONSISTENCY MAXIMUM PARTICLE SIZE Moisture Content
Penetration of thumb: SC = Small Cobble Wet
<0.25 cm = hard (H) CP = Coarse Pebble Moist
0.25 - 2.0 cm = firm (F) MP = Medium Pebble Dry
2.0 - 4.0 cm = soft (S) SP = Small Pebble
>4.0 cm = very soft (VS) CS = Coarse Sand
MS = Medium Sand
CEMENTATION FS = Fine Sand
N = not cemented VFS = Very Fine Sand
W = weakly cemented Z = Silt
M = Moderately cemented
S = Strongly cemented SA = Sub-angular well graded = poorly sorted = grains of all different sizes mixed together
VA = Very angular poorly graded = well sorted = grains are all same size
STRUCTURE ODOR
H = Homogeneous N = None
S = Stratified UNC = Unclassified
L = Laminated S = Sulfur-like
M = Mottled T = tar-like
COLOR
from munsell chart
Quantifying Descriptors
Strong
Moderate
Faint
VISIBLE CONTAMINATION DESCRIPTORS
VISIBLE CONTAMINATION DESCRIPTORS
Blebs - observed discrete sphericals of tar/free product - but for the most part the soil matrix was not visibly contaminated or saturated. Typically
this is residual product.
Saturated - the entirety of the pore space for a sample is saturated with NAPL. Care should be taken to ensure that you’re not observing water
saturating the pore spaces if you use this term. Depending on viscosity, free-phase saturated materials may freely drain from a soil sample.
PHC = Petroleum hydrocarbon-
like
Sheen - iridescent petroleum-like sheen. Free product is not present but a distinct film is evident. Not to be used to describe a “bacterial sheen”
which can be distinguished by its tendency to break up on the water surface at angles whereas petroleum sheen will be continuous and will not
break up.
Stained - used w/ color (i.e. black or brown stained) to indicate that the soil matrix is stained a color other than the natural (unimpacted) color of the
soil.
Coated - soil grains are coated with free product – there is not sufficient free-phase material present to saturate the pore spaces.
SOP-18: HORIBA U-10/U-22 WATER QUALITY METER
Revision No.: 0 Date: February 2010
Page 1 of 4
STANDARD OPERATING PROCEDURE HORIBA U10/U-22 WATER QUALITY METER
1.0 Scope and Application
The purpose of this Standard Operating Procedure (SOP) is to describe the protocol for the field operation of a Horiba U-22 Multi-Parameter Water Quality Monitoring System. The Horiba U-10 and U-22 model instruments incorporate the same monitoring probes, user interface systems, and calibration procedures, but are configured for batch sampling (U-10) or use with an in-line flow-through cell (U-11). The instruments are equipped with several probes used to measure specific field chemistry parameters including pH, oxidation reduction potential (ORP), temperature, dissolved oxygen (DO), specific conductivity, and turbidity. These probes are contained within one unit and allow for simultaneous measurements to be collected.
The Horiba will be used to measure in-situ water quality parameters. The sonde will be fitted with a protective screen that will allow it to be deployed into the water column. This SOP will provide guidance for using this instrument during the surface water investigation activities.
2.0 Materials
a. Horiba U-10 or U-22 with protective screen b. Horiba Auto Cal solution c. Calibration cup or other plastic cup to contain cal solutions
3.0 Procedure
3.1 Calibration (Auto Calibration procedure)
3.1.1 The Auto Calibration mode allows for the calibration of the pH, COND, and TURB sensors in the Auto Calibration solution. DO is calibrated in the atmosphere simultaneously. Temperature and ORP are not field calibrated.
3.1.2 Before performing the auto calibration procedure, turn the unit on and allow it to warm up for about a half hour to one hour. This will allow the temperature to stabilize which will minimize unstable values during calibration.
3.1.3 Wash the sensors with distilled water a few times and fill the calibration cup to the marked line with the Auto Calibration solution. Immerse the probe sensors into the calibration solution until the cup snaps securely onto the probe.
3.1.4 Be sure that one of the measurement modes (pH, COND, or TURB) are selected. Press the CAL key. AUTO and CAL appear in the upper portion of the screen and the instrument is now in Auto Calibration mode.
SOP-18: HORIBA U-10/U-22 WATER QUALITY METER
Revision No.: 0 Date: February 2010
Page 2 of 4
3.1.5 Press the ENT key to start the Auto Calibration. During calibration DATA IN and the current measurement being calibrated blink. When a measurement is calibrated it stops blinking and remains illuminated.
3.1.6 END will be displayed upon the completion of the calibration procedure for all measurements. Press the MEAS key to return to the measurement mode.
3.1.7 Press the MEAS key to view each of the measurements and record the readings while in the Auto calibration solution.
3.1.8 If an ERROR message occurs after calibration refer to the Horiba “Operation Manual” for error explanations and troubleshooting guidance (p. 89).
3.2 Operation
U-22
3.2.1 Connect the flow through cell to the U-22 probe. Be sure that the probe is attached securely to the flow through cell to ensure an air tight seal. Check that barbed fittings are tightly in place. If necessary, re-apply Teflon plumbers tape to the barbed fittings and secure into place.
3.2.2 Connect the end of the tubing from the submersible pump (already installed in the well) to the intake barb of the flow through cell (located on the bottom of the flow through cell). For correct operation the flow through cell must be filled from the bottom up.
3.2.3 Cut a small piece of tubing (approximately 2’ to 3’) to connect to the discharge barb of the flow through cell (located on the top of the flow through cell). The end of this tubing should be placed into a 5 gallon bucket for containment of the purge water.
3.2.4 Once all tubing connections have been made, secure the probe so that it does not tip over during purging. While purging, movement of the probe should be minimized so as to prevent disturbance of the measurements.
U-10
3.2.5 A sampling container is not provided with the U-10. The calibration cup cannot be used for sampling due to the cut-out in the cup that exposes the dissolved oxygen sensor to ambient air for calibration (this sensor would not be exposed to the water sample if the calibration cup were utilized for sampling). Fill a sampling container (e.g., a tupperware container) with enough water to cover all of the sensors – including the dissolved oxygen sensor – when the instrument is placed in the sampling container.
SOP-18: HORIBA U-10/U-22 WATER QUALITY METER
Revision No.: 0 Date: February 2010
Page 3 of 4
3.2.6 Turn the Horiba U-10 / U-22 on. Proceed with purging as per Field Sampling Protocols. Toggle through the measurements by pressing the MEAS key.
4.0 Maintenance
During periods of meter operation, silt and other foreign materials can accumulate on the probes. The turbidity probe is especially susceptible to this due to its small size. The accumulation of these materials may result in erroneous readings. The probe and sensors should be rinsed between each location and at the end of the day before packing the instrument away.
The following items cover basic field maintenance procedures for the Horiba U-22. Maintenance instructions for specific Error Codes can be obtained from the Horiba “Operation Manual.” Complicated repairs and sensor replacement should be left to a trained service technician.
4.1 After use in each well, remove the protective cage from around the probe and the protective cover over the turbidity sensor. Using a non-abrasive Alconox wash, rinse the probe and the individual sensors
4.2 Apply a final rinse using deionized water. Be sure to remove all soapy material.
4.3 The turbidity probe can be further cleaned by gently wiping the two lenses with a clean, damp paper towel.
4.4 Replace the turbidity and probe protective covers.
5.0 Precautions
5.1 The Horiba is designed to monitor groundwater and surface water. The instrument (hand held display) is constructed to be water resistant. However, it is good practice to keep the instrument as dry as possible. When working in the rain the instrument’s control unit should be placed inside a Ziploc baggie.
5.2 The probe is not designed to monitor water containing free product. Free product will likely damage the sensors rendering the unit inoperable. Care should be taken to confirm that no free product will be encountered in the wells to be sampled
5.3 Exposure to direct sunlight can cause the LCD display to deteriorate. Do not expose the instrument to direct sunlight for long periods of time. It is preferable to provide some type of shade when working in direct sunlight conditions.
5.4 Freezing temperatures can cause damage to the instrument sensors. When working in freezing or near freezing conditions, store the instruments in a warm location overnight to avoid damage.
5.5 When storing the instrument the sensors should be kept moist to avoid drying out. Place a small amount of Auto Calibration solution in the calibration cup and place the probe inside the cup.
SOP-18: HORIBA U-10/U-22 WATER QUALITY METER
Revision No.: 0 Date: February 2010
Page 4 of 4
5.6 Do not drop the instrument or probe. Glass electrodes in some sensors and delicate electronics can easily break if the instrument is grossly mishandled.
6.0 References
Horiba, 1999, U-20 Series Operation Manual
7.0 Attachments
Calibration Form
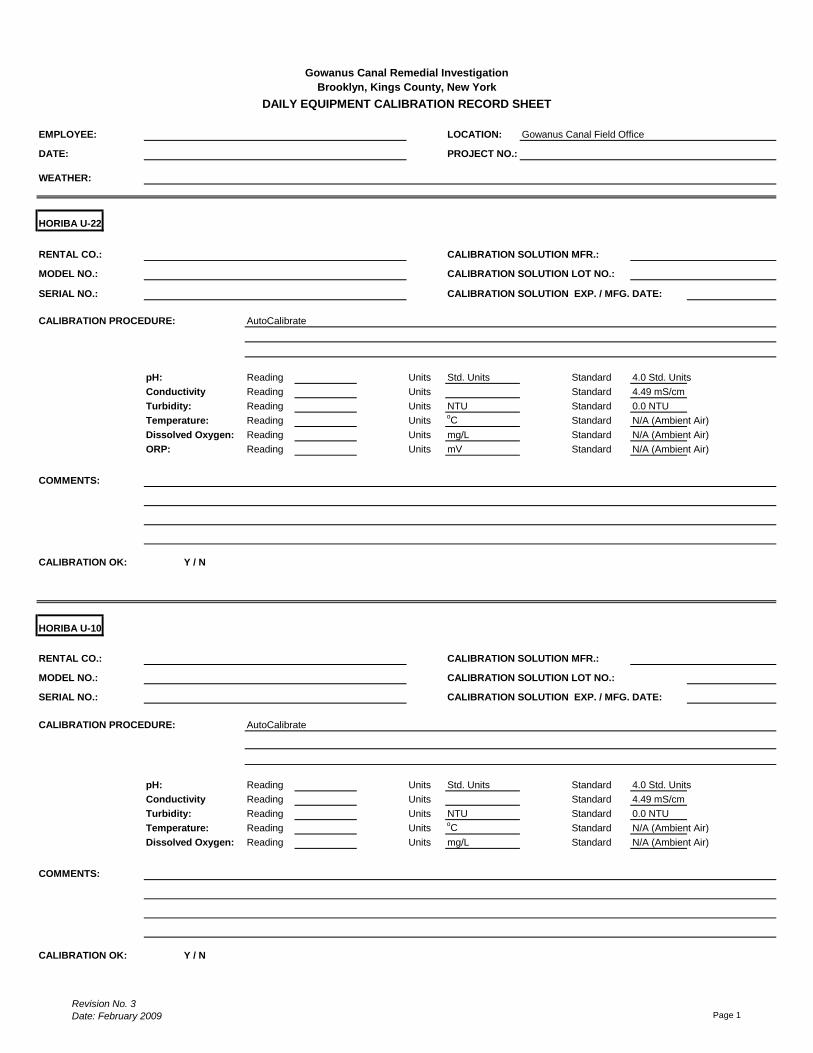
EMPLOYEE: LOCATION: Gowanus Canal Field Office
DATE: PROJECT NO.:
WEATHER:
HORIBA U-22
RENTAL CO.: CALIBRATION SOLUTION MFR.:
MODEL NO.: CALIBRATION SOLUTION LOT NO.:
SERIAL NO.: CALIBRATION SOLUTION EXP. / MFG. DATE:
CALIBRATION PROCEDURE: AutoCalibrate
pH: Reading Units Std. Units Standard 4.0 Std. Units
Conductivity Reading Units Standard 4.49 mS/cm
Turbidity: Reading Units NTU Standard 0.0 NTU
Temperature: Reading UnitsoC Standard N/A (Ambient Air)
Dissolved Oxygen: Reading Units mg/L Standard N/A (Ambient Air)
ORP: Reading Units mV Standard N/A (Ambient Air)
COMMENTS:
CALIBRATION OK: Y / N
HORIBA U-10
RENTAL CO.: CALIBRATION SOLUTION MFR.:
MODEL NO.: CALIBRATION SOLUTION LOT NO.:
SERIAL NO.: CALIBRATION SOLUTION EXP. / MFG. DATE:
CALIBRATION PROCEDURE: AutoCalibrate
pH: Reading Units Std. Units Standard 4.0 Std. Units
Conductivity Reading Units Standard 4.49 mS/cm
Turbidity: Reading Units NTU Standard 0.0 NTU
Temperature: Reading UnitsoC Standard N/A (Ambient Air)
Dissolved Oxygen: Reading Units mg/L Standard N/A (Ambient Air)
COMMENTS:
CALIBRATION OK: Y / N
DAILY EQUIPMENT CALIBRATION RECORD SHEET
Gowanus Canal Remedial Investigation
Brooklyn, Kings County, New York
Revision No. 3
Date: February 2009 Page 1
SOP No. 19: Collection and Preservation of Soil Samples for VOC Analysis
Revision No.: 0 Date: April 2010
Page 1 of 3
STANDARD OPERATING PROCEDURE COLLECTION AND PRESERVATION
OF SOIL SAMPLES FOR VOC ANALYSIS 1.0 Scope and Application
The purpose of this Standard Operating Procedure (SOP) is to describe the collection of soil samples for VOC analysis. This SOP will ensure that soil samples collected for VOC analysis are handled in a manner which will minimize the loss of contaminants due to volatilization.
2.0 Materials
a. Terra Core® Sampler (5g)
b. Pre-tared 40ml wide volatile organic analysis (VOA) vials w/ a magnetic stir bar.
c. Non-preserved 40ml VOA vial for dry weight (percent moisture)
d. Stainless-steel spoon or disposable plastic trowel
e. Paper towel
3.0 Procedure
The soil coring sleeves will be visually observed as they are brought to the surface and scanned with a PID in order to determine if they might contain VOC contaminants and to select the section of the pre-determined sample interval from which the sample for VOC laboratory analysis is to be collected.
The section of the pre-determined sampling interval (refer to SOP 20 for information on the selection of core intervals to be sampled) from which the subsurface soil sample for VOC analysis will be collected, will be selected based on the following criteria, listed in order of importance:
1) results of PID measurements (soils with high PID readings will be sampled)
2) visible staining or discoloration
3) middle section of the core or professional judgment if the PID does not indicate the presence of any VOCs (uniform conditions observed over the 5-foot targeted sampling interval)
For each VOC soil sample, a 6-inch interval of core material will be used (i.e., samples will not be composites of larger core intervals). Immediately after the depth interval to be sampled for VOCs is selected, the sample aliquot for VOC analysis will be collected using Terra Core Samplers. Note that duplicate samples for VOC analysis are to be collected from the same interval as close as possible to each other. These duplicate samples are also known as co-located samples. Once the sample for VOC analysis is collected, the remaining soil from the sample interval will be composited for the remaining analyses collected following the subsurface soil sampling SOP.
3.1 Collect three Terra Core® samples and one 40ml unpreserved VOA vial (to determine moisture content) for each VOC sample point.

SOP No. 19: Collection and Preservation of Soil Samples for VOC Analysis
Revision No.: 0 Date: April 2010
Page 2 of 3
3.2 Remove the Terra Core® sample plunger from the package and seat the plunger into the handle.
3.3 Quickly push the sampler into a freshly exposed surface of soil until the sampler is full.
3.4 Visually check to see whether the sampler body is full by looking at the sample chamber. If the sample chamber is inadequately filled, push the sampler back into the freshly exposed surface of soil until the chamber is full. A filled chamber will deliver approximately 5 to 10 grams of soil.
3.5 Scrape away any excess soil extending beyond the mouth of the sampler with the edge of the sampler using a dedicated plastic or decontaminated stainless steel trowel.
3.6 Wipe all soil or debris from the outside of the Terra Core® sampler.
3.7 Rotation the plunger that was seated in the handle top 90 degrees until it is aligned with the slots in the body.
3.8 Place the mouth of the sampler into the pre-tared 40ml VOA vial containing the magnetic stir bar and extrude the sample by pushing the plunger down.
3.9 Quickly place the lid back on the 40ml VOA vial. Be sure to remove any soil or debris from the top and/or threads of the vial.
3.10 Complete the sample label on the pre-tared VOA using indelible ink. DO NOT attach an additional or CLP label on the VOA since this may interfere with the VOA’s pre-tared weight.
3.11 Repeat the procedure above for the other two Terra Core® samplers.
3.12 Collect the percent moisture sample in a separate sample container (40ml unpreserved VOA vial). Use a paper towel to clean the threads of the sample container and cap. Ensure that the sample bottle is tightly sealed to prevent loss of soil moisture.
3.13 Place the VOAs into a zipper lock package and seal the zipper lock. A custody seal should be placed over the opening of the zipper lock package to ensure sample integrity. A CLP sample label must be attached to the exterior of the zipper lock package.
3.14 Double volume is required for the collection of MS/MSD samples.
3.15 Store all samples in a cooler with bagged ice to maintain 4 degrees Celsius while storing on site and during shipment to the laboratory.
3.16 Samples must be shipped to the laboratory nightly to meet strict 24 hour sample holding time requirements.
4.0 Maintenance
Not Applicable.
5.0 Precautions
None
6.0 References
En Novative Technologies, Inc., Recommended Use of the Terra Core.
SOP No. 19: Collection and Preservation of Soil Samples for VOC Analysis
Revision No.: 0 Date: April 2010
Page 3 of 3
7.0 Attachments
None

SOP-20: Subsurface Soil Sampling
Revision No.: 0 Date: April 2010
Page 1 of 2
STANDARD OPERATING PROCEDURE SUBSURFACE SOIL SAMPLING 1.0 Scope and Application
The purpose of this Standard Operating Procedure (SOP) is to describe the protocol for sampling subsurface soils during soil boring installation. The samples will be sent for laboratory analysis to obtain information on chemical contamination in soils.
2.0 Materials
1. Drill rig and associated boring equipment
2. Stainless-steel or disposable plastic trowels
3. Stainless-steel bowl or disposable aluminum trays
4. Paper towels
5. Appropriate Personal Protective Equipment (PPE)
6. Photoionization (PID) detector
7. Sample bottles
3.0 Procedure
3.1 The depth intervals from which subsurface soil samples for laboratory analyses will be collected will be determined using the decision-making process below after the soil cores are brought to the surface.
Soil sampling for laboratory analysis will be performed during installation of select intermediate depth monitoring wells.
Soil sampling will be performed over the full length of the soil boring for TCL Organics and TAL Metals analysis. Composite samples will be collected over discrete 5-foot intervals for TCL and TAL analysis except for VOCs which will be assessed via a grab-sample biased to the 6-inch interval within the 5-foot composite that shows the greatest indication (e.g., PID readings, visual staining) of potential contamination. If uniform conditions are observed in the 5-foot interval then the VOC sample will be collected from the middle of the interval.
The core sleeves will be cut open and scanned with a PID and visually observed in order to screen for potential VOC contaminants.
3.2 Within each 5-foot sampling interval, the soil sample for VOC analysis will be collected first (see SOP 19: Collection and Preservation of Soil Samples for VOC Analysis). Within each interval, the section from which the sample will be collected will be selected based on the following criteria, listed in order of importance:
results of PID measurements (soils with high PID readings will be sampled)
visible staining or discoloration
middle section of the core or professional judgment if the PID or observations do not indicate the presence of any VOCs (uniform conditions observed over the 5-foot targeted sampling interval)
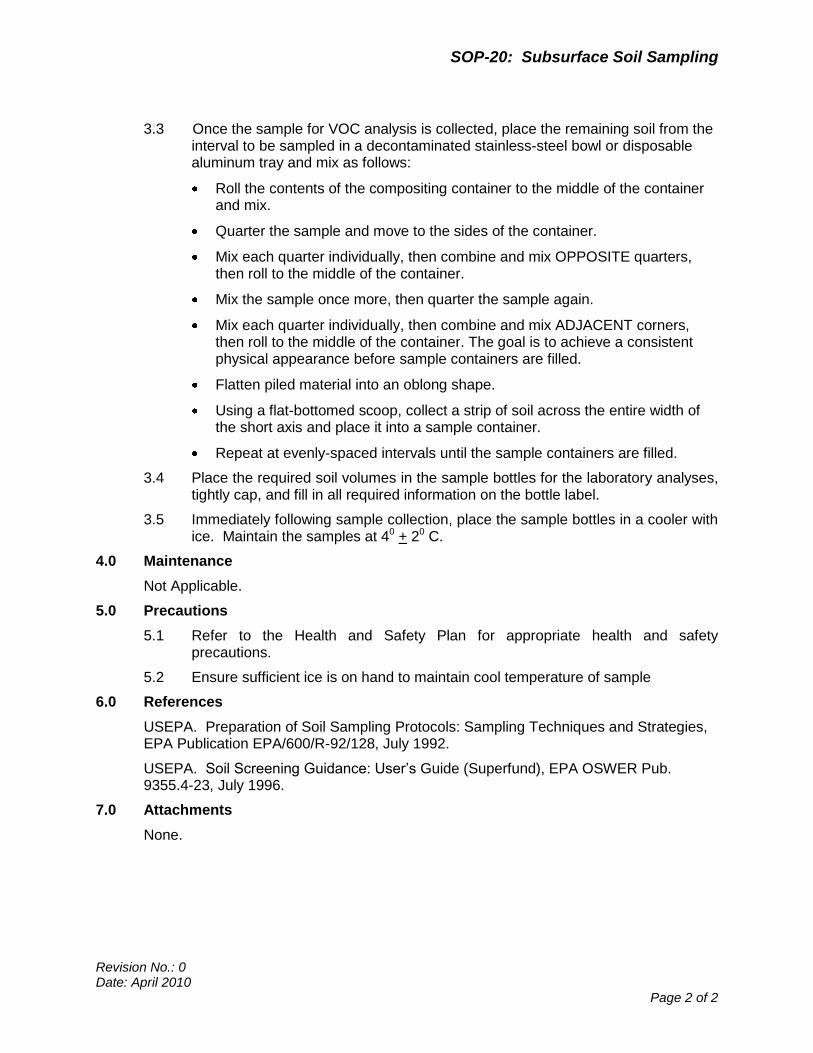
SOP-20: Subsurface Soil Sampling
Revision No.: 0 Date: April 2010
Page 2 of 2
3.3 Once the sample for VOC analysis is collected, place the remaining soil from the interval to be sampled in a decontaminated stainless-steel bowl or disposable aluminum tray and mix as follows:
Roll the contents of the compositing container to the middle of the container and mix.
Quarter the sample and move to the sides of the container.
Mix each quarter individually, then combine and mix OPPOSITE quarters, then roll to the middle of the container.
Mix the sample once more, then quarter the sample again.
Mix each quarter individually, then combine and mix ADJACENT corners, then roll to the middle of the container. The goal is to achieve a consistent physical appearance before sample containers are filled.
Flatten piled material into an oblong shape.
Using a flat-bottomed scoop, collect a strip of soil across the entire width of the short axis and place it into a sample container.
Repeat at evenly-spaced intervals until the sample containers are filled.
3.4 Place the required soil volumes in the sample bottles for the laboratory analyses, tightly cap, and fill in all required information on the bottle label.
3.5 Immediately following sample collection, place the sample bottles in a cooler with ice. Maintain the samples at 40 + 20 C.
4.0 Maintenance
Not Applicable.
5.0 Precautions
5.1 Refer to the Health and Safety Plan for appropriate health and safety precautions.
5.2 Ensure sufficient ice is on hand to maintain cool temperature of sample
6.0 References
USEPA. Preparation of Soil Sampling Protocols: Sampling Techniques and Strategies, EPA Publication EPA/600/R-92/128, July 1992.
USEPA. Soil Screening Guidance: User’s Guide (Superfund), EPA OSWER Pub. 9355.4-23, July 1996.
7.0 Attachments
None.
SOP-21: Soil Core Characterization
Revision No. 0 Date: April 2010
Page 1 of 3
STANDARD OPERATING PROCEDURE SOIL CORE CHARACTERIZATION
1.0 Introduction
The purpose of this Standard Operating Procedure (SOP) is to describe protocols for geological characterization and logging of soil cores.
2.0 Collection Procedure
Soil core collection will be performed by a qualified drilling sub-contractor in accordance with their standard procedures and specifications noted in the Scope of Work.
The minimum following information must be recorded in the field log book:
Time and date of core collection
Station location / ID
Total depth drilled
Note any problems with core collection (e.g., number of attempts needed)
3.0 Characterization and Sampling Procedure
3.1. Materials
The following materials are needed for core characterization, processing and sampling:
Plastic sheeting and duct tape
Straight bladed knife and cut resistant gloves
Measuring tape (engineering scale)
Dry erase board and marker
Digital camera
Core logging form
Munsell color chart
PPE – gloves, safety glasses
PID
3.2. Opening the Core
Prepare the processing table by covering with plastic sheeting and securing with heavy duty tape (e.g. duct tape). Place the core segments on the table so that the top of the core is to the left and the bottom is to the right.
Once the core segments are arranged, cut the core sleeve open to expose the soil core. Use of proper cutting techniques and cut-resistant gloves is required.
Arrange tape measure next to core so that it will be visible in photos.

SOP-21: Soil Core Characterization
Revision No. 0 Date: April 2010
Page 2 of 3
3.3. Core Characterization
The soil cores will be visually characterized for soil type, color, moisture content, texture, grain size and shape, consistency, visible evidence of staining, and any other observations. The observations recorded must be factual and accurate and must not contain any subjective conclusions about product type if product is observed (i.e., NAPL observations will consist of a description of the physical properties of the material including a description of odor as standardized below).
The Core Log Key (attached) is to be used for this characterization. The soil will be described using the Unified Soil Classification System (USCS) based visual-manual identification in accordance with the American Society for Testing and Materials (ASTM) ASTM-2488 standard practice.
The colors will be designated using a Munsell color chart. Geologic logs will be recorded on the Core Log Field Form (attached).
Digital photographs of each core segment will be taken in order to visually document the undisturbed core structure. Each photograph will include a scale (i.e. tape measure), station ID, indication of depth interval, indication of top orientation, and date of core collection.
Odor: Use the descriptors none, strong, moderate, or faint to quantify odor.
Odor will be only be categorized as follows:
No Odor
Unclassified Odor (UNC) – used when a distinct odor is present but it cannot be classified into any of the identified categories
Sulfur-like Odor (S) – used to describe a distinct rotten-egg-like odor
Petroleum hydrocarbon-like Odor (PHC) – used to describe odors similar to petroleum products such as gasoline, kerosene, diesel, and fuel oil
Tar-like Odor (T) – used to describe the distinctive odor of coal tar products similar to an asphalt/paving odor
Evidence of contamination: The following descriptors should be used to characterize any visible evidence of non-aqueous phase liquid (NAPL) impact:
NAPL – Any free phase NAPL observed in cores should be described in terms of color, distribution, and viscosity (if determinable) as described further below. Free phase product should be described as NAPL in the “Comments” column on the core logs. Do not draw any conclusions about the type of product (e.g., oil, tar, fuel, coal tar, etc.)
Sheen - iridescent petroleum-like sheen. Free product is not present but a distinct film is evident.
Stained - used w/ color (i.e. black or brown stained) to indicate that the soil matrix is stained a color other than the natural (unimpacted) color of the soil.
SOP-21: Soil Core Characterization
Revision No. 0 Date: April 2010
Page 3 of 3
Coated - sediment grains are coated with product – there is not sufficient free-phase material present to saturate the pore spaces.
Blebs - observed discrete sphericals of NAPL - but for the most part the soil matrix is not visibly contaminated or saturated with NAPL.
Saturated - the entirety of the pore space for a sample is saturated with free product. Care should be taken to ensure that the pore spaces are saturated with NAPL rather than water if this term is used.
Viscosity of Free-Phase Product – If free-phase product is present a qualitative description of viscosity should be made. The following descriptors should be used:
Highly viscous (e.g. taffy-like)
Viscous (e.g. No. 6 fuel oil or bunker crude like)
Low viscosity (e.g. No. 2 fuel oil like)
4.0 Maintenance
The blades on the knives used for opening the cores should be changed when there is a noticeable difference in the amount of force required to cut the liner.
5.0 Precautions
There are several precautions that should be taken when handling, opening, and processing the cores:
When opening the cores, knives and/or other cutting instruments must be used. Cut resistant gloves should be worn under nitrile gloves when cores are opened.
Soil cores can be very heavy and due the shape of the core can be very awkward to move. Proper lifting technique and team lifting should be used when handling heavy cores.
6.0 Attachments
ASTM Method


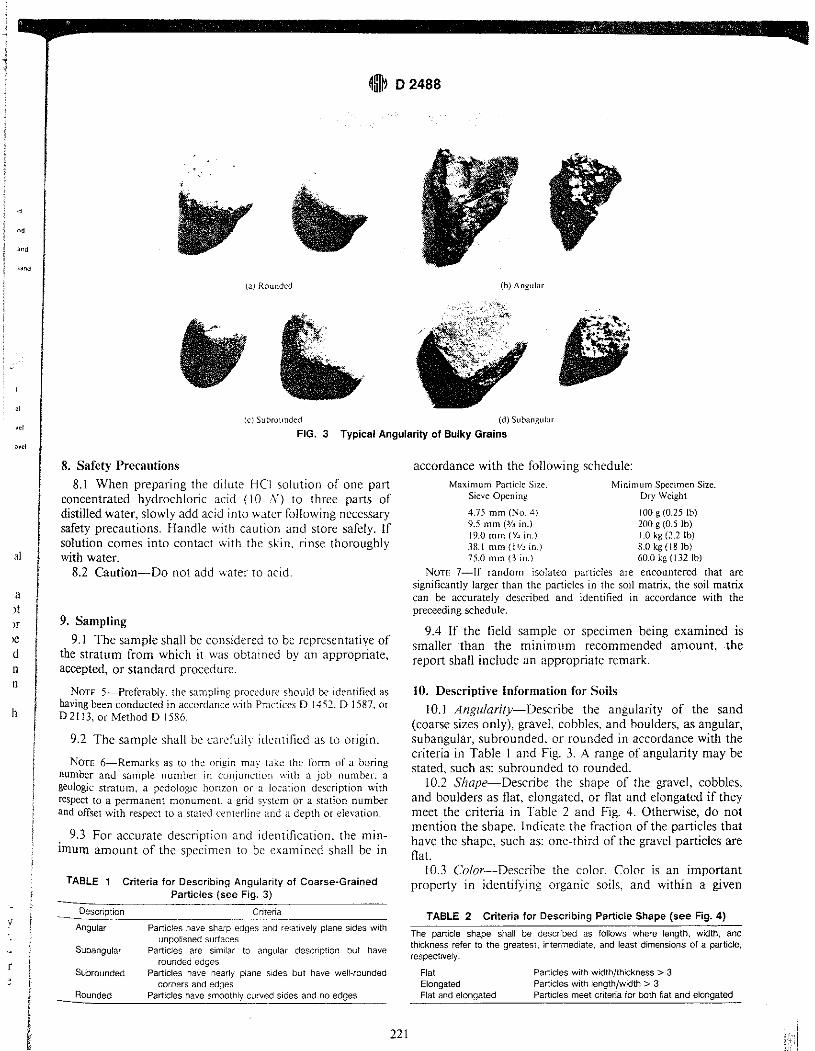


SOP-22: Boring Installation Methods: RotaSonic Drilling
Revision No.: 0 Date: April 2010
Page 1 of 3
STANDARD OPERATING PROCEDURE
BORING INSTALLATION METHODS: ROTASONIC DRILLING
1.0 Scope and Application
The purpose of this SOP is to specify the equipment, materials, and protocol for RotaSonic drilling which will be used for the collection of subsurface soil samples and installation of groundwater monitoring wells. A maximum depth of approximately 50 feet below the ground surface (bgs) is anticipated for this investigation.
RotaSonic Materials
a. RotaSonic drill rig b. 4” Sonic coring barrels and 6” sonic overdrill barrels c. 4” Soil Core Plastic Sheathing d. Soil Boring Logs e. Multi-gas Detector
2.0 General Procedures and Guidelines – All Drilling Methods
2.1 Decontaminate drill stem and other non-dedicated downhole equipment in accordance with the SOP on Equipment Decontamination prior to beginning.
2.2 Technical oversight will be provided during all drilling and well installation activities. The person providing the oversight will fully describe and record all tasks performed in the field logbook. This person will be responsible for the rig, including: logging of soils, monitoring of drilling operations, recording of groundwater data, preparing the geologic soil boring logs and well construction diagrams, and recording the well installation procedures of the rig.
2.3 Each time a soil core is extracted, be careful to keep the core oriented distinguishing between the top (shallower portion) and bottom (deeper portion) of the core. Record the depth interval below ground surface (bgs) of the core and log the geologic/lithologic characteristics of the core. Use soil classification charts, Munsell color charts, a PID to scan for vapors, and other references as appropriate. Review the sampling plan and SOP on subsurface soil sampling in order to determine the depth intervals to be sampled for laboratory analysis.
2.4 Upon completion of a soil boring, construct a monitoring well or backfill the boring as appropriate in accordance with the SOPs on Monitoring Well Design and Construction and Borehole Abandonment.
2.5 Decontamination of all well installation equipment and materials will be carried out as described in the SOP on Equipment Decontamination.
2.6 Petroleum jelly, teflon tape, or lithium grease shall not be used on the threads of downhole drilling equipment. If a lubricating agent is required, the proposed lubricant MUST be reviewed for approval by the site geologist. Adequate time and information, such as Material Safety Data Sheets (MSDS), must be provided for the geologists review. Time spent for on-site review of the proposed material will be considered Down Time and will not be billable by the drilling contractor.
SOP-22: Boring Installation Methods: RotaSonic Drilling
Revision No.: 0 Date: April 2010
Page 2 of 3
Food grade vegetable oil is an example of an approved lubricant. Additives containing either lead or copper will not be allowed. In addition, polychlorinated biphenyls (PCBs) will not be contained in hydraulic fluids or other fluids used in the drill rig, pumps, or other field equipment and vehicles. MSDS sheets must be available for all such fluids.
2.7 Surface runoff or other fluids will not be allowed to enter any boring or well during or after drilling/construction. Likewise, fluids generated during drilling (e.g. purged groundwater) will be contained in the work area during installation of borings and not allowed to runoff onto surrounding areas. The drill rig and associated equipment will be maintained in good working order and will not be allowed to leak fluids in the work area.
2.8 Screening of the breathing air in the vicinity of the borehole will be conducted at regular intervals using a PID. A multi-gas meter will be used in the drilling work area to monitor for LEL and H2S at a minimum. The work area will be scanned for the presence of vapors before initiating work.
2.9 Document all quantities of drilling footage and materials used on a daily basis for reconciliation with the drilling subcontract invoices.
2.10 Proceed to the next drilling location after decontamination of all downhole equipment, including the working surfaces of the drill rig.
3.0 RotaSonic Procedures and Guidelines
3.1 Soil sampling and drilling with RotaSonic equipment is a two-step process. First, a 4” diameter core barrel is advanced into the zone of interest to collect a soil core sample. This barrel is 10-feet long, and up to two can be connected in series to retrieve a 4” by 20 ft. core sample. After the 4” diameter soil core barrel has been advanced to the terminal depth of the sample run, a larger diameter drill rod (6”, 8”, 10” or 12”) is advanced over the 4” rod to both ream the hole and dislodge the advanced 4” rod. The 4” rod is then removed from the borehole and the soil core is extruded from the barrel into plastic sheathing for examination by the site geologist. The larger diameter rod, which remains in place throughout the drilling event, also acts as temporary casing supporting the borehole from collapse while the 4” rod is removed from the borehole. The sequence is repeated to collect the next length of soil core.
3.2 Each time a soil core is extracted; record the depth interval bgs of the core and review the sampling plan and SOP on subsurface soil sampling in order to determine the depth intervals to be sampled for laboratory analysis. All soil cores will be examined and geologic descriptions recorded.
3.3 Following retrieval of a plastic sheathed soil core, cut the plastic open with a sharp, decontaminated knife parallel to its length to expose the core. The 4 inch diameter soil core can then be broken open to expose a fresh soil surface. Observe the core, screen it with a PID and collect soil samples from the pre-determined intervals(s) following the SOP on Subsurface Soil Sampling. Record lithological information for preparation of a soil boring log (see attached example soil boring log).
SOP-22: Boring Installation Methods: RotaSonic Drilling
Revision No.: 0 Date: April 2010
Page 3 of 3
3.4 Upon completion of a soil boring, construct a monitoring well or backfill the boring in accordance with the SOPs on Monitoring Well Design and Construction and Borehole Abandonment.
3.5 Decontamination of all well installation equipment and materials will be carried out as described in the SOP on Equipment Decontamination.
3.6 Proceed to the next drilling location after decontamination of all downhole equipment, including the working surfaces of the drill rig.
4.0 Collection and Disposal of Drill Cuttings
4.1 The drilling contractor will be responsible for containerizing all drill cuttings and other wastes generated by the drilling. Cuttings from the investigation locations will be placed into fifty-five gallon, open top, type 17E (1A2) DOT-approved drums. The contractor will transport all drums to an area designated for the storage of wastes.
4.2 Wastes including soil cuttings, groundwater, and other drilling-related materials must be containerized at the borehole and will not be allowed to overflow or discharge onto the ground surface. A clean work area must be maintained at all times.
5.0 Maintenance
Not applicable
6.0 Precautions
1. Confirm that the drilling contractor has obtained utility clearance (underground and overhead) through the use of the DigNet of New York City & Long Island utility markout system (800-272-4480, www.dignetnycli.com), independent utility markout company, and use of soft-dig technology before beginning work.
2. Verify that the drill rig is clean and in proper working order.
3. Ensure that the drill rig operators thoroughly complete the decontamination process between sampling locations.
4. Use caution to ensure that soil core sections are oriented the correct way (top vs. bottom) when observing lithology and collecting samples.
5. Verify that the borehole made during sampling activities has been properly backfilled or abandoned.
7.0 References
None.
8.0 Attachments
Example Boring Log
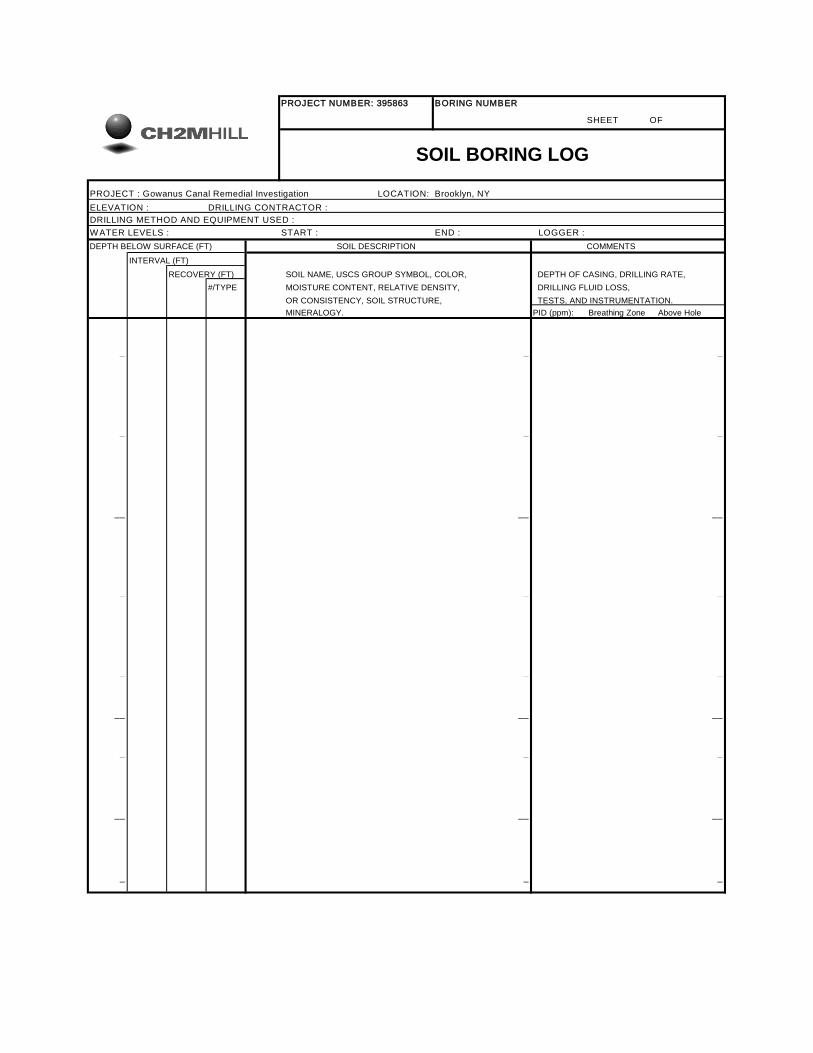
PROJECT NUMBER: 395863 BORING NUMBER
SHEET OF
SOIL BORING LOG
PROJECT : Gowanus Canal Remedial Investigation LOCATION: Brooklyn, NY
ELEVATION : DRILLING CONTRACTOR :
DRILLING METHOD AND EQUIPMENT USED :
W ATER LEVELS : START : END : LOGGER :
DEPTH BELOW SURFACE (FT) SOIL DESCRIPTION COMMENTS
INTERVAL (FT)
RECOVERY (FT) SOIL NAME, USCS GROUP SYMBOL, COLOR, DEPTH OF CASING, DRILLING RATE,
#/TYPE MOISTURE CONTENT, RELATIVE DENSITY, DRILLING FLUID LOSS,
OR CONSISTENCY, SOIL STRUCTURE, TESTS, AND INSTRUMENTATION.
MINERALOGY. PID (ppm): Breathing Zone Above Hole
_ _ _
_ _ _
_ _ _
_ _ _
__ __ __
_ _ _
_ _ _
_ _ _
_ _ _
__ __ __
_ _ _
_ _ _
_ _ _
_ _ _
__ __ __
_ _ _
_ _ _
_ _ _
_ _ _
__ __ __
_ _ _
_ _ _
_ _ _
_ _ _
__ __ __
_ _ _
_ _ _
_ _ _

PROJECT NUMBER BORING NUMBER
SHEET OF
SOIL BORING LOG
PROJECT : LOCATION :
ELEVATION : DRILLING CONTRACTOR :
DRILLING METHOD AND EQUIPMENT USED :
W ATER LEVELS : START : END : LOGGER :
DEPTH BELOW SURFACE (FT) STANDARD SOIL DESCRIPTION COMMENTS
INTERVAL (FT) PENETRATION
RECOVERY (IN) TEST SOIL NAME, USCS GROUP SYMBOL, COLOR, DEPTH OF CASING, DRILLING RATE,
#/TYPE RESULTS MOISTURE CONTENT, RELATIVE DENSITY, DRILLING FLUID LOSS,
6"-6"-6"-6" OR CONSISTENCY, SOIL STRUCTURE, TESTS, AND INSTRUMENTATION.
(N) MINERALOGY. PID (ppm): Breathing Zone Above Hole
_ _ _
_ _ _
_ _ _
_ _ _
__ __ __
_ _ _
_ _ _
_ _ _
_ _ _
__ __ __
_ _ _
_ _ _
_ _ _
_ _ _
__ __ __
_ _ _
_ _ _
_ _ _
_ _ _
__ __ __
_ _ _
_ _ _
_ _ _
_ _ _
__ __ __
_ _ _
_ _ _
_ _ _

SOP-23: Monitoring Well Design and Construction
Revision No.: 0 Date: April 2010
Page 1 of 4
STANDARD OPERATING PROCEDURE MONITORING WELL DESIGN AND CONSTRUCTION
1.0 Scope and Application
This Standard Operating Procedure (SOP) provides technical guidance for the installation of permanent groundwater monitoring wells. This SOP also provides a list of the materials that will be used in the design and construction of the monitoring wells.
The actual depth of the monitoring wells will depend on the encountered subsurface conditions. Shallow wells will be installed straddling the water table interface, located at approximately 8-15 feet below ground surface (bgs). Intermediate wells will be installed at a depth corresponding to 5-feet below the bottom of the Gowanus Canal. Knowing the ground elevation at the drilling location and the elevation of the top of native sediments in the adjacent canal (see bathymetric survey report) will be required to determine the depth for the intermediate well.
2.0 Equipment and Materials Required
a. Drill rig
b. Flush-threaded, 2-inch diameter, Schedule 40 PVC riser pipe
c. Flush-threaded, 2-inch diameter, Schedule 40 PVC well screen with factory machined 0.010 inch diameter (10-slot) slotting
d. Feeler gauge to verify screen slot diameter
e. Portland Type I or Type II neat cement
f. Certified granular bentonite (acetone free)
g. Pre-sampled and approved water
h. Certified clean silica sand for screen gravel pack (# 1 or equivalent)
i. Certified clean silica sand for annular seal (# 00 or equivalent)
j. Lockable expanding compression caps (water tight)
k. Keyed-alike brass locks
l. Flush mount outer protective steel manhole (9” diameter with 12” collar skirt)
m. Water Level Indicator/ Interface Probe
n. Weighted tape
o. Well Construction Diagram
3.0 Procedure
3.1 Borehole Drilling
Details regarding borehole drilling for the installation of monitoring wells is provided in the SOP for Borehole Installation.
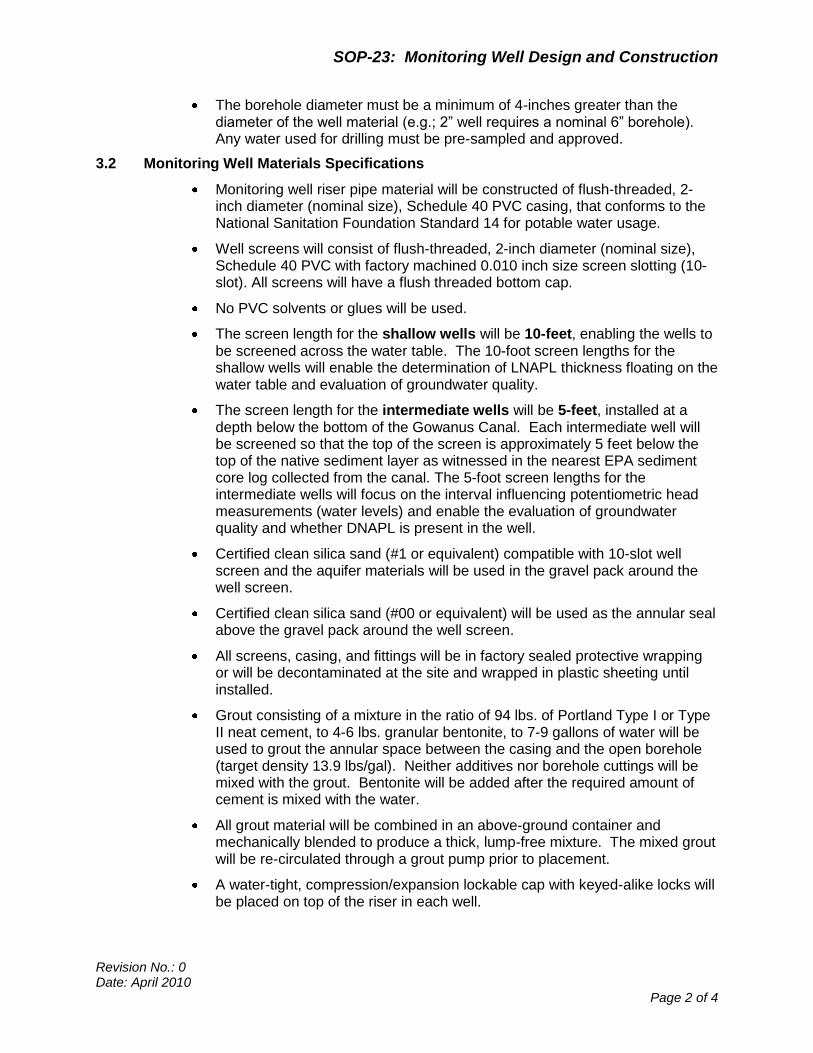
SOP-23: Monitoring Well Design and Construction
Revision No.: 0 Date: April 2010
Page 2 of 4
The borehole diameter must be a minimum of 4-inches greater than the diameter of the well material (e.g.; 2” well requires a nominal 6” borehole). Any water used for drilling must be pre-sampled and approved.
3.2 Monitoring Well Materials Specifications
Monitoring well riser pipe material will be constructed of flush-threaded, 2-inch diameter (nominal size), Schedule 40 PVC casing, that conforms to the National Sanitation Foundation Standard 14 for potable water usage.
Well screens will consist of flush-threaded, 2-inch diameter (nominal size), Schedule 40 PVC with factory machined 0.010 inch size screen slotting (10-slot). All screens will have a flush threaded bottom cap.
No PVC solvents or glues will be used.
The screen length for the shallow wells will be 10-feet, enabling the wells to be screened across the water table. The 10-foot screen lengths for the shallow wells will enable the determination of LNAPL thickness floating on the water table and evaluation of groundwater quality.
The screen length for the intermediate wells will be 5-feet, installed at a depth below the bottom of the Gowanus Canal. Each intermediate well will be screened so that the top of the screen is approximately 5 feet below the top of the native sediment layer as witnessed in the nearest EPA sediment core log collected from the canal. The 5-foot screen lengths for the intermediate wells will focus on the interval influencing potentiometric head measurements (water levels) and enable the evaluation of groundwater quality and whether DNAPL is present in the well.
Certified clean silica sand (#1 or equivalent) compatible with 10-slot well screen and the aquifer materials will be used in the gravel pack around the well screen.
Certified clean silica sand (#00 or equivalent) will be used as the annular seal above the gravel pack around the well screen.
All screens, casing, and fittings will be in factory sealed protective wrapping or will be decontaminated at the site and wrapped in plastic sheeting until installed.
Grout consisting of a mixture in the ratio of 94 lbs. of Portland Type I or Type II neat cement, to 4-6 lbs. granular bentonite, to 7-9 gallons of water will be used to grout the annular space between the casing and the open borehole (target density 13.9 lbs/gal). Neither additives nor borehole cuttings will be mixed with the grout. Bentonite will be added after the required amount of cement is mixed with the water.
All grout material will be combined in an above-ground container and mechanically blended to produce a thick, lump-free mixture. The mixed grout will be re-circulated through a grout pump prior to placement.
A water-tight, compression/expansion lockable cap with keyed-alike locks will be placed on top of the riser in each well.
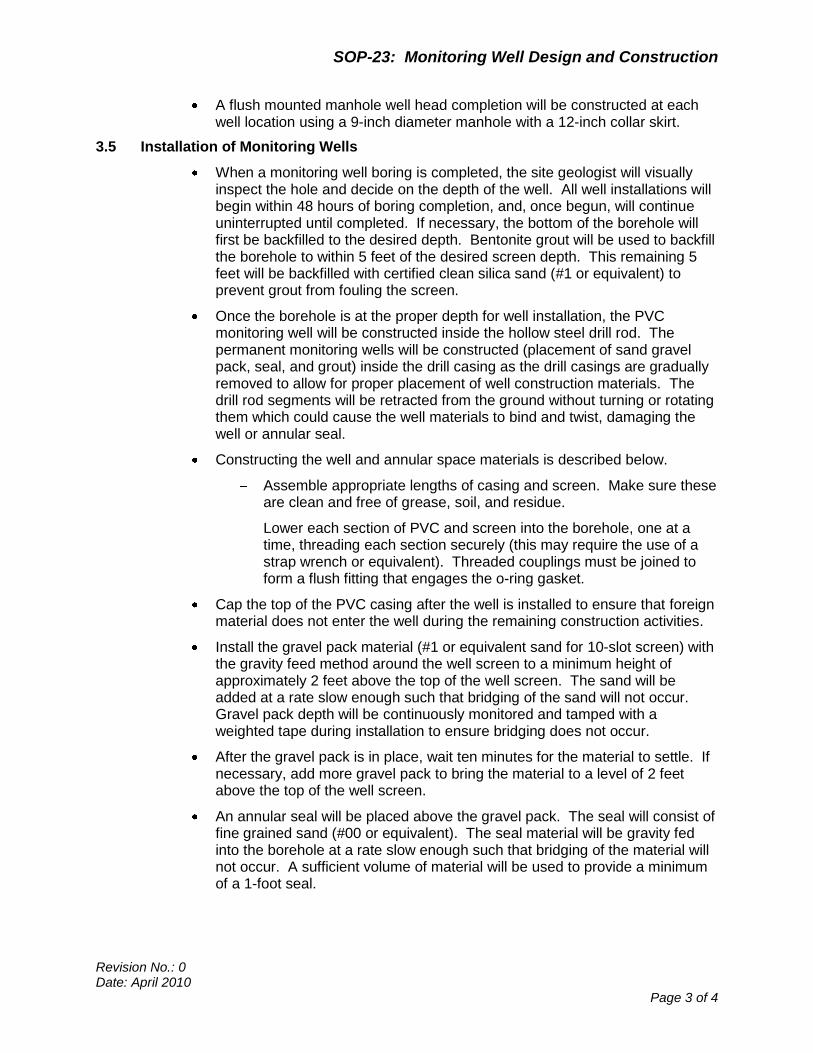
SOP-23: Monitoring Well Design and Construction
Revision No.: 0 Date: April 2010
Page 3 of 4
A flush mounted manhole well head completion will be constructed at each well location using a 9-inch diameter manhole with a 12-inch collar skirt.
3.5 Installation of Monitoring Wells
When a monitoring well boring is completed, the site geologist will visually inspect the hole and decide on the depth of the well. All well installations will begin within 48 hours of boring completion, and, once begun, will continue uninterrupted until completed. If necessary, the bottom of the borehole will first be backfilled to the desired depth. Bentonite grout will be used to backfill the borehole to within 5 feet of the desired screen depth. This remaining 5 feet will be backfilled with certified clean silica sand (#1 or equivalent) to prevent grout from fouling the screen.
Once the borehole is at the proper depth for well installation, the PVC monitoring well will be constructed inside the hollow steel drill rod. The permanent monitoring wells will be constructed (placement of sand gravel pack, seal, and grout) inside the drill casing as the drill casings are gradually removed to allow for proper placement of well construction materials. The drill rod segments will be retracted from the ground without turning or rotating them which could cause the well materials to bind and twist, damaging the well or annular seal.
Constructing the well and annular space materials is described below.
Assemble appropriate lengths of casing and screen. Make sure these are clean and free of grease, soil, and residue.
Lower each section of PVC and screen into the borehole, one at a time, threading each section securely (this may require the use of a strap wrench or equivalent). Threaded couplings must be joined to form a flush fitting that engages the o-ring gasket.
Cap the top of the PVC casing after the well is installed to ensure that foreign material does not enter the well during the remaining construction activities.
Install the gravel pack material (#1 or equivalent sand for 10-slot screen) with the gravity feed method around the well screen to a minimum height of approximately 2 feet above the top of the well screen. The sand will be added at a rate slow enough such that bridging of the sand will not occur. Gravel pack depth will be continuously monitored and tamped with a weighted tape during installation to ensure bridging does not occur.
After the gravel pack is in place, wait ten minutes for the material to settle. If necessary, add more gravel pack to bring the material to a level of 2 feet above the top of the well screen.
An annular seal will be placed above the gravel pack. The seal will consist of fine grained sand (#00 or equivalent). The seal material will be gravity fed into the borehole at a rate slow enough such that bridging of the material will not occur. A sufficient volume of material will be used to provide a minimum of a 1-foot seal.
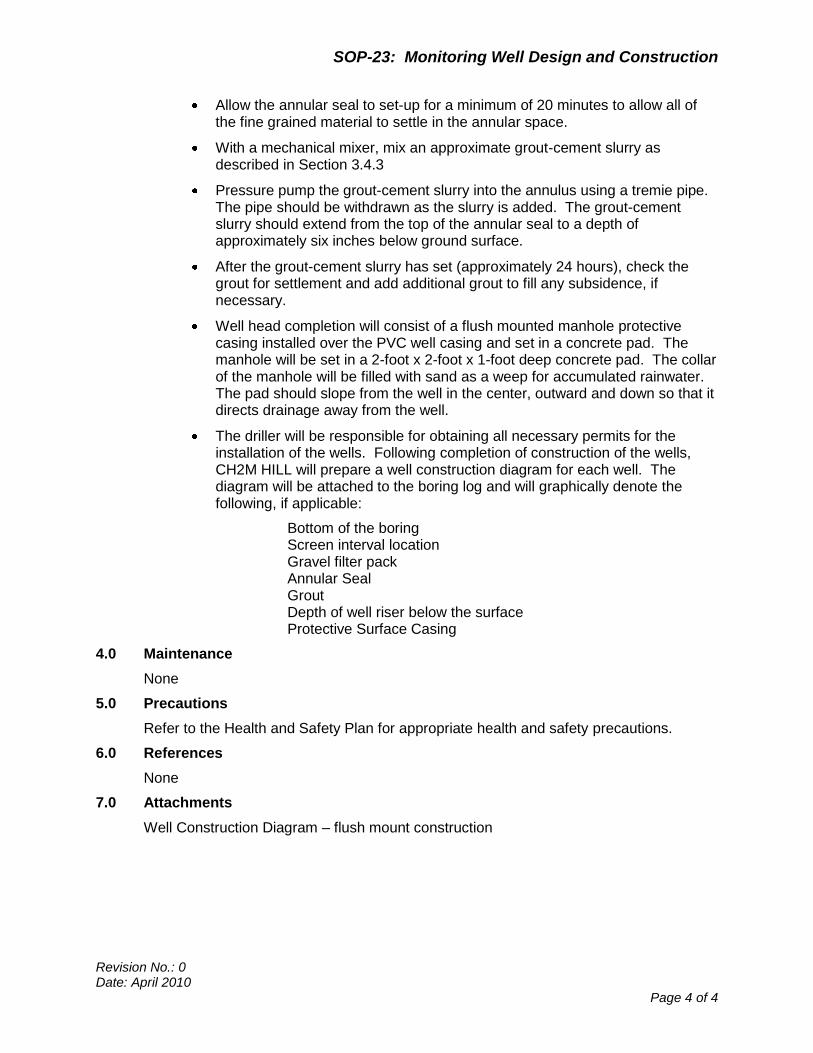
SOP-23: Monitoring Well Design and Construction
Revision No.: 0 Date: April 2010
Page 4 of 4
Allow the annular seal to set-up for a minimum of 20 minutes to allow all of the fine grained material to settle in the annular space.
With a mechanical mixer, mix an approximate grout-cement slurry as described in Section 3.4.3
Pressure pump the grout-cement slurry into the annulus using a tremie pipe. The pipe should be withdrawn as the slurry is added. The grout-cement slurry should extend from the top of the annular seal to a depth of approximately six inches below ground surface.
After the grout-cement slurry has set (approximately 24 hours), check the grout for settlement and add additional grout to fill any subsidence, if necessary.
Well head completion will consist of a flush mounted manhole protective casing installed over the PVC well casing and set in a concrete pad. The manhole will be set in a 2-foot x 2-foot x 1-foot deep concrete pad. The collar of the manhole will be filled with sand as a weep for accumulated rainwater. The pad should slope from the well in the center, outward and down so that it directs drainage away from the well.
The driller will be responsible for obtaining all necessary permits for the installation of the wells. Following completion of construction of the wells, CH2M HILL will prepare a well construction diagram for each well. The diagram will be attached to the boring log and will graphically denote the following, if applicable:
Bottom of the boring Screen interval location Gravel filter pack Annular Seal Grout Depth of well riser below the surface Protective Surface Casing
4.0 Maintenance
None
5.0 Precautions
Refer to the Health and Safety Plan for appropriate health and safety precautions.
6.0 References
None
7.0 Attachments
Well Construction Diagram – flush mount construction

PROJECT NUMBER 395863 BORING NUMBER
SHEET 1 OF 1
WELL COMPLETION DIAGRAM
PROJECT : Gowanus Canal Remedial Investigation LOCATION : Brooklyn, NY
ELEVATION : DRILLING CONTRACTOR :
DRILLING METHOD AND EQUIPMENT USED :
WATER LEVELS : START : END : LOGGER :
3
3a 2 1 1- Ground elevation at well
2- Top of casing elevation
3- Wellhead protection cover type
a) concrete pad dimensions
8
4- Diameter/type of well casing
5- Type/slot size of screen
7
6- Type screen filter
4 a) Quantity used
7- Type of seal
a) Quantity used
5 8- Grout
a) Grout mix used
b) Method of placement
c) Quantity of well casing grout
Development method
6
Development time
Estimated purge volume
Comments
Borehole Diameter
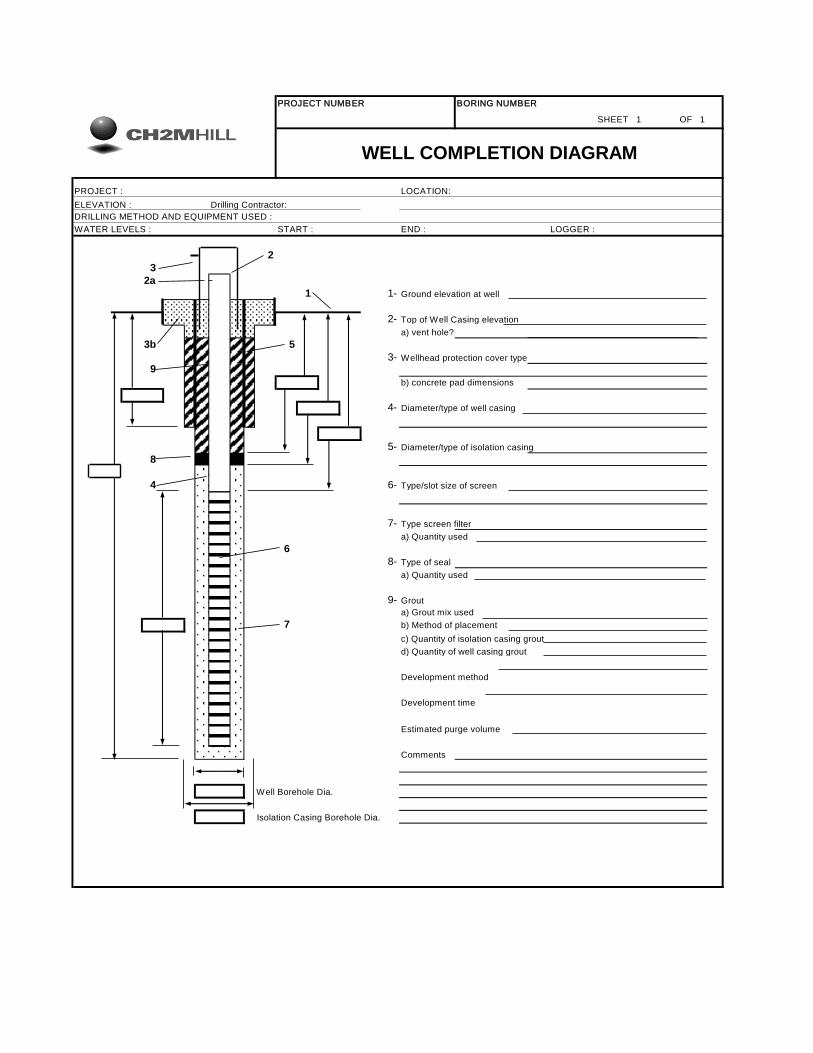
PROJECT NUMBER BORING NUMBER
SHEET 1 OF 1
WELL COMPLETION DIAGRAM
PROJECT : LOCATION:
ELEVATION : Drilling Contractor:
DRILLING METHOD AND EQUIPMENT USED :
WATER LEVELS : START : END : LOGGER :
2
3
2a
1 1- Ground elevation at well
2- Top of Well Casing elevation
a) vent hole?
3b 5
3- Wellhead protection cover type
9
b) concrete pad dimensions
4- Diameter/type of well casing
5- Diameter/type of isolation casing
8
4 6- Type/slot size of screen
7- Type screen filter
a) Quantity used
6
8- Type of seal
a) Quantity used
9- Grout
a) Grout mix used
7 b) Method of placement
c) Quantity of isolation casing grout
d) Quantity of well casing grout
Development method
Development time
Estimated purge volume
Comments
Well Borehole Dia.
Isolation Casing Borehole Dia.
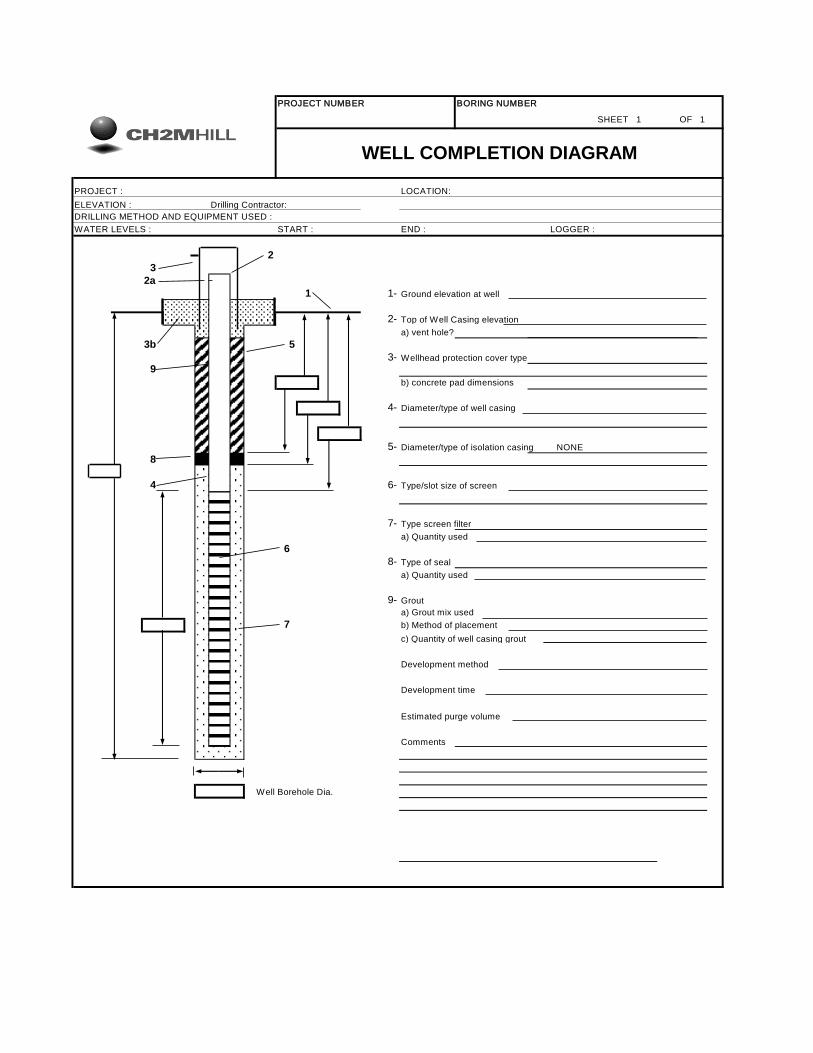
PROJECT NUMBER BORING NUMBER
SHEET 1 OF 1
WELL COMPLETION DIAGRAM
PROJECT : LOCATION:
ELEVATION : Drilling Contractor:
DRILLING METHOD AND EQUIPMENT USED :
WATER LEVELS : START : END : LOGGER :
2
3
2a
1 1- Ground elevation at well
2- Top of Well Casing elevation
a) vent hole?
3b 5
3- Wellhead protection cover type
9
b) concrete pad dimensions
4- Diameter/type of well casing
5- Diameter/type of isolation casing NONE
8
4 6- Type/slot size of screen
7- Type screen filter
a) Quantity used
6
8- Type of seal
a) Quantity used
9- Grout
a) Grout mix used
7 b) Method of placement
c) Quantity of well casing grout
Development method
Development time
Estimated purge volume
Comments
Well Borehole Dia.
SOP-24: Low Stress Groundwater Purging and Sampling
Revision No.: 0
Date: April 2010
Page 1 of 7
STANDARD OPERATING PROCEDURE LOW STRESS (LOW FLOW) GROUND WATER PURGING AND
SAMPLING I. SCOPE & APPLICATION
This Low Stress (or Low-Flow) Purging and Sampling Ground Water Standard
Operating Procedure is the EPA Region II Final, March 16, 1998 SOP describing the
standard method for collecting low stress (low flow) ground water samples from
monitoring wells. Low stress Purging and Sampling results in collection of ground water
samples from monitoring wells that are representative of ground water conditions in the
geological formation. This is accomplished by minimizing stress on the geological
formation and minimizing disturbance of sediment that has collected in the well. The
procedure applies to monitoring wells that have an inner casing with a diameter of 2.0
inches or greater, and maximum screened intervals of ten feet unless multiple intervals
are sampled. The procedure is appropriate for collection of ground water samples that
will be analyzed for volatile and semi-volatile organic compounds (VOCs and SVOCs),
pesticides, polychlorinated biphenyls (PCBs), metals, and microbiological and other
contaminants in association with all EPA programs.
This procedure does not address the collection of light or dense non-aqueous phase
liquids (LNAPL or DNAPL) samples, and should be used for aqueous samples only. For
sampling NAPLS, the reader is referred to the following EPA publications: DNAPL Site
Evaluation (Cohen & Mercer, 1993) and the RCRA Ground-Water Monitoring: Draft
Technical Guidance (EPA/530-R-93-001), and references therein.
Note: This procedure applies to the collection of groundwater samples from the
conventional monitoring wells at the site.
II. METHOD SUMMARY
The purpose of the low stress purging and sampling procedure is to collect ground water
samples from monitoring wells that are representative of ground water conditions in the
geological formation. This is accomplished by setting the intake velocity of the sampling
pump to a flow rate that limits drawdown inside the well casing.
Sampling at the prescribed (low) flow rate has three primary benefits. First, it minimizes
disturbance of sediment in the bottom of the well, thereby producing a sample with low
turbidity (i. E., low concentration of suspended particles). Typically, this saves time and
analytical costs by eliminating the need for collecting and analyzing an additional filtered
sample from the same well. Second, this procedure minimizes aeration of the ground
water during sample collection, which improves the sample quality for VOC analysis.
Third, in most cases the procedure significantly reduces the volume of ground water
purged from a well and the costs associated with its proper treatment and disposal.
III. ADDRESSING POTENTIAL PROBLEMS
Problems that may be encountered using this technique include: a) difficulty in sampling
wells with insufficient yield; b) failure of one or more key indicator parameters to
stabilize; c) cascading of water and/or formation of air bubbles in the tubing; and d)
cross-contamination between wells.
SOP-24: Low Stress Groundwater Purging and Sampling
Revision No.: 0
Date: April 2010
Page 2 of 7
Insufficient Yield
Wells with insufficient yield (i. e., low recharge rate of the well) may dewater during
purging. Care should be taken to avoid loss of pressure in the tubing line due to
dewatering of the well below the level of the pump’s intake. Purging should be
interrupted before the water level in the well drops below the top of the pump, as this
may induce cascading of the sand pack. Pumping the well dry should therefore be
avoided to the extent possible in all cases. Sampling should commence as soon as the
volume in the well has recovered sufficiently to allow collection of samples.
Alternatively, ground water samples may be obtained with techniques designed for the
unsaturated zone, such as lysimeters.
Failure to Stabilize Key Indicator Parameters
If one or more key indicator parameters fails to stabilize after 4 hours, one of three
options should be considered: a) continue purging in an attempt to achieve stabilization;
b) discontinue purging, do not collect samples, and document attempts to reach
stabilization in the log book; c) discontinue purging, collect samples, and document
attempts to reach stabilization in the log book; or d) secure the well, purge and collect
samples the next day (preferred). The key indicator parameter for samples to be
analyzed for VOCs is dissolved oxygen. The key indicator parameter for all other
samples is turbidity.
Cascading
To prevent cascading and/or air bubble formation in the tubing, care should be taken to
ensure that the flow rate is sufficient to maintain pump suction. Minimize the length and
diameter of tubing (i. e., 1/4 or 3/8 inch ID) to ensure that tubing remains filled with
ground water during sampling.
Cross-Contamination
To prevent cross-contamination between wells, it is strongly recommended that
dedicated, in-place pumps be used. As an alternative, the potential for cross-
contamination can be reduced by performing the more thorough “daily” decontamination
procedures between sampling of each well in addition to the start of each sampling day
(see Section VII, below).
Equipment Failure
Adequate equipment should be on-hand so that equipment failures do not adversely
impact sampling activities.
IV. PLANNING DOCUMENTATION AND EQUIPMENT
Approved site-specific Field Sampling Plan/Quality Assurance Project Plan (QAPP).
This plan must specify the type of pump and other equipment to be used. The
QAPP must also specify the depth to which the pump intake should be lowered in
each well. Generally, the target depth will correspond to the mid-point of the most
permeable zone in the screened interval. Borehole geologic and geophysical logs
can be used to help select the most permeable zone. However, in some cases,
other criteria may be used to select the target depth for the pump intake. In all
cases, the target depth must be approved by the EPA hydrogeologist or EPA project
scientist.
SOP-24: Low Stress Groundwater Purging and Sampling
Revision No.: 0
Date: April 2010
Page 3 of 7
Well construction data, location map, field data from last sampling event.
Polyethylene sheeting.
Flame Ionization Detector (FID) and Photo Ionization Detector (PID).
Adjustable rate, positive displacement ground water sampling pump (e.g., centrifugal
or bladder pumps constructed of stainless steel or Teflon). A peristaltic pump may
only be used for inorganic sample collection.
Interface probe or equivalent device for determining the presence or absence of
NAPL.
Teflon or Teflon-lined polyethylene tubing to collect samples for organic analysis.
Teflon or Teflon-lined polyethylene, PVC, Tygon or polyethylene tubing to collect
samples for inorganic analysis. Sufficient tubing of the appropriate material must be
available so that each well has dedicated tubing.
Water level measuring device, minimum 0.01 foot accuracy, (electronic preferred for
tracking water level drawdown during all pumping operations).
Flow measurement supplies (e.g., graduated cylinder and stop watch or in-line flow
meter).
Power source (generator, nitrogen tank, etc.)
Monitoring instruments for indicator parameters. Eh and dissolved oxygen must be
monitored in-line using an instrument with a continuous readout display. Specific
conductance, pH, and temperature may be monitored either in-line or using separate
probes. A nephalometer is used to measure turbidity.
Decontamination supplies (see Section VII, below).
Logbook (see Section VIII, Below).
Sample bottles.
Sample preservation supplies (as required by the analytical methods).
Sample tags or labels, chain of custody.
V. SAMPLING PROCEDURES
Pre-Sampling Activities
1. Start at the well known or believed to have the least contaminated ground water and
proceed systematically to the well with the most contaminated ground water. Check
the well, the lock, and the locking cap for damage or evidence of tampering. Record
observations.
2. Lay out sheet of polyethylene for placement of monitoring and sampling equipment.
3. Measure VOCs at the rim of the unopened well with a PID and FID instrument and
record the reading in the field log book.
4. Remove well cap.
5. Measure VOCs at the rim of the opened well with a PID and an FID instrument and
record the reading in the field log book.
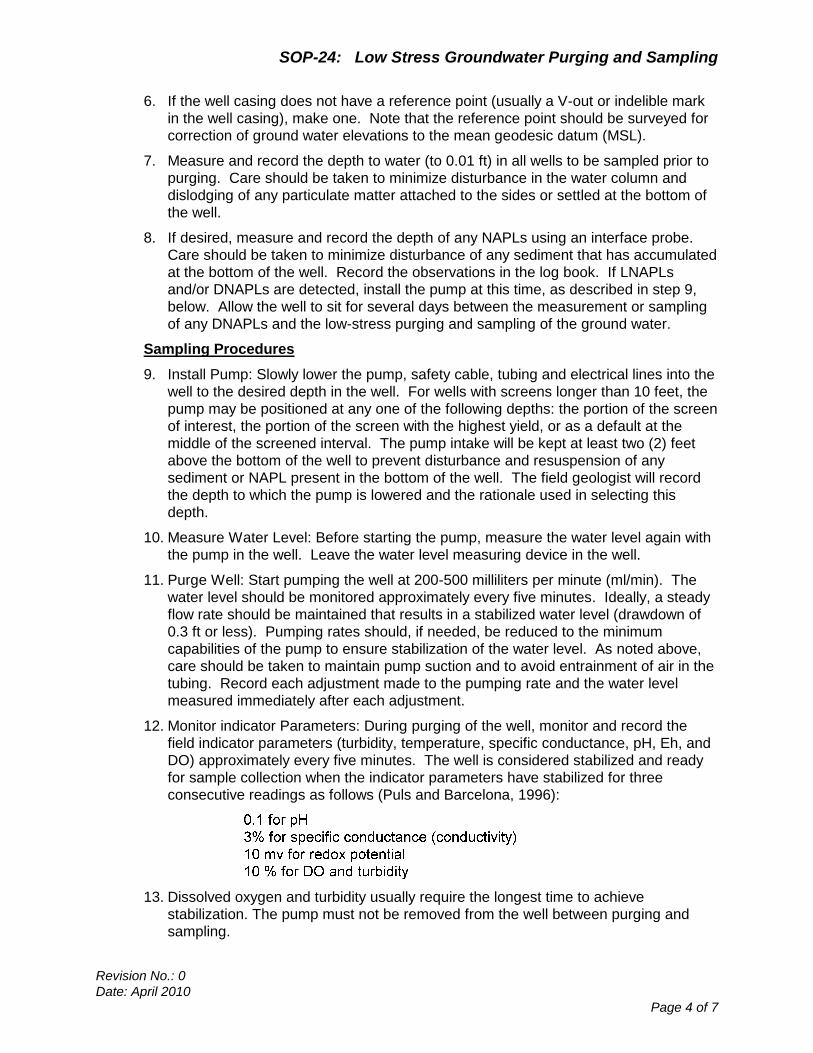
SOP-24: Low Stress Groundwater Purging and Sampling
Revision No.: 0
Date: April 2010
Page 4 of 7
6. If the well casing does not have a reference point (usually a V-out or indelible mark
in the well casing), make one. Note that the reference point should be surveyed for
correction of ground water elevations to the mean geodesic datum (MSL).
7. Measure and record the depth to water (to 0.01 ft) in all wells to be sampled prior to
purging. Care should be taken to minimize disturbance in the water column and
dislodging of any particulate matter attached to the sides or settled at the bottom of
the well.
8. If desired, measure and record the depth of any NAPLs using an interface probe.
Care should be taken to minimize disturbance of any sediment that has accumulated
at the bottom of the well. Record the observations in the log book. If LNAPLs
and/or DNAPLs are detected, install the pump at this time, as described in step 9,
below. Allow the well to sit for several days between the measurement or sampling
of any DNAPLs and the low-stress purging and sampling of the ground water.
Sampling Procedures
9. Install Pump: Slowly lower the pump, safety cable, tubing and electrical lines into the
well to the desired depth in the well. For wells with screens longer than 10 feet, the
pump may be positioned at any one of the following depths: the portion of the screen
of interest, the portion of the screen with the highest yield, or as a default at the
middle of the screened interval. The pump intake will be kept at least two (2) feet
above the bottom of the well to prevent disturbance and resuspension of any
sediment or NAPL present in the bottom of the well. The field geologist will record
the depth to which the pump is lowered and the rationale used in selecting this
depth.
10. Measure Water Level: Before starting the pump, measure the water level again with
the pump in the well. Leave the water level measuring device in the well.
11. Purge Well: Start pumping the well at 200-500 milliliters per minute (ml/min). The
water level should be monitored approximately every five minutes. Ideally, a steady
flow rate should be maintained that results in a stabilized water level (drawdown of
0.3 ft or less). Pumping rates should, if needed, be reduced to the minimum
capabilities of the pump to ensure stabilization of the water level. As noted above,
care should be taken to maintain pump suction and to avoid entrainment of air in the
tubing. Record each adjustment made to the pumping rate and the water level
measured immediately after each adjustment.
12. Monitor indicator Parameters: During purging of the well, monitor and record the
field indicator parameters (turbidity, temperature, specific conductance, pH, Eh, and
DO) approximately every five minutes. The well is considered stabilized and ready
for sample collection when the indicator parameters have stabilized for three
consecutive readings as follows (Puls and Barcelona, 1996):
13. Dissolved oxygen and turbidity usually require the longest time to achieve
stabilization. The pump must not be removed from the well between purging and
sampling.
SOP-24: Low Stress Groundwater Purging and Sampling
Revision No.: 0
Date: April 2010
Page 5 of 7
14. Collect Samples: Collect samples at a flow rate between 100 and 250 ml/min and
such that drawdown of the water level within the well does not exceed the maximum
allowable drawdown of 0.3 ft. VOC samples must be collected first and directly into
sample containers. All sample containers should be filled with minimal turbulence by
allowing the ground water to flow from the tubing gently down the inside of the
container.
15. Ground water samples to be analyzed for volatile organic compounds (VOCs)
require pH adjustment. The appropriate EPA Program Guidance should be
consulted to determine whether pH adjustment is necessary. If pH adjustment is
necessary for VOC sample preservation, the amount of acid to be added to each
sample vial prior should be determined, drop by drop, on a separate and equal
volume of water (e.g., 40 ml). Ground water purged from the well prior to sampling
can be used for this purpose.
16. Remove Pump Tubing: After collection of the samples, the tubing, unless
permanently installed, must be properly discarded or dedicated to the well for
resampling by hanging the tubing inside the well.
17. Measure and record well depth.
18. Close and lock the well.
VI. FIELD QUALITY CONTROL SAMPLES
Quality control samples must be collected to determine if sample collection and handling
procedures have adversely affected the quality of the ground water samples. The
frequency of collecting field quality control samples is provided in Section 8 of the SAP.
All field quality control samples must be prepared exactly as regular investigation
samples with regard to sample volume, containers, and preservation. The following
quality control samples should be collected during the sampling event:
Field duplicates (collect native sample and then immediately collect duplicate
sample)
Trip blanks for VOCs only
Equipment blank (not necessary if equipment is dedicated to the well)
As noted above, ground water samples should be collected systematically from wells
with the lowest levels of contamination through to wells with highest level of
contamination. The equipment blank should be collected after sampling from the most
contaminated well.
VII. DECONTAMINATION
Non-disposable sampling equipment, including the pump and support cable and
electrical wires which contact the sample, must be decontaminated thoroughly each day
before use (“daily decon”) and after each well is sampled (“between-well decon”).
Dedicated, in-place pumps and tubing must be thoroughly decontaminated using “daily
decon” procedures (see below) prior to their initial use. For centrifugal pumps, it is
strongly recommended that non-disposable sampling equipment, including the pump
and support cable and electrical wires in contact with the sample, be decontaminated
thoroughly each day before use (“daily decon”).
SOP-24: Low Stress Groundwater Purging and Sampling
Revision No.: 0
Date: April 2010
Page 6 of 7
EPA’s field experience indicates that the life of centrifugal pumps may be extended by
removing entrained grit. This also permits inspection and replacement of the cooling
water in centrifugal pumps. All non-dedicated sampling equipment (pumps, tubing, etc.)
must be decontaminated after each well is sampled (“between-well decon” see below).
Daily Decon
A. Pre-rinse: Operate pump in a deep basin containing 8 to 10 gallons of potable
water for 5 minutes and flush other equipment with potable water for 5 minutes.
B. Wash: Operate pump in a deep basin containing 8 to 10 gallons of a non-
phosphate detergent solution, such as Liquinox, for 5 minutes and flush other
equipment with fresh detergent solution for 5 minutes. Use the detergent
sparingly.
C. Rinse: Operate pump in a deep basin of potable water for 5 minutes and flush
other equipment with potable water for 5 minutes.
D. Disassemble pump.
E. Wash pump parts: Place the disassembled parts of the pump into a deep basin
containing 8 to 10 gallons of non-phosphate detergent solution. Scrub all pump
parts with a test tube brush.
F. Rinse pump parts with potable water.
G. Rinse the following pump parts with distilled /deionized water: inlet screen, the
shaft, the section interconnector, the motor lead assembly, and the stator
housing.
H. Place impeller assembly in a large glass beaker and rinse with 1% nitric acid
(HN03).
I. Rinse impeller assembly with potable water.
J. Place impeller assembly in a large glass beaker and rinse with acetone.
K. Rinse impeller assembly with distilled/deionized water.
Between-Well Decon
A. Pre-rinse: Operate pump in a deep basin containing 8 to 10 gallons of potable
water for 5 minutes and flush other equipment with potable water for 5 minutes.
B. Wash: Operate pump in a deep basin containing 8 to 10 gallons of a non-
phosphate detergent solution, such as Liquinox, for 5 minutes and flush other
equipment with fresh detergent solution for 5 minutes. Use the detergent
sparingly.
C. Rinse: Operate pump in a deep basin of potable water for 5 minutes and flush
other equipment with potable water for 5 minutes.
D. Final Rinse: Operate pump in a deep basin of distilled/deionized water to pump
out 1 to 2 gallons of this final rinse water.
SOP-24: Low Stress Groundwater Purging and Sampling
Revision No.: 0
Date: April 2010
Page 7 of 7
VIII. FIELD LOG BOOK
A field log book must be kept each time ground water monitoring activities are
conducted in the field. Complete the attached forms. The field log book should
document the following:
Well identification number and physical condition.
Well depth, and measurement technique.
Static water level depth, date, time, and measurement technique.
Presence and thickness of immiscible liquid layers and detection method.
Collection method for immiscible liquid layers.
Pumping rate, drawdown, indicator parameters values, and clock time, at three to
five minute intervals; calculate or measure total volume pumped.
Well sampling sequence and time of sample collection.
Types of sample bottles used and sample identification numbers.
Preservatives used.
Parameters requested for analysis.
Field observations of sampling event.
Name of sample collector(s).
Weather conditions.
QA/QC data for field instruments.
VIIIA. ADDITIONAL DOCUMENTATION
Refer to SOP on Field Parameter Forms for forms to use on documenting the performed
sampling. These forms include:
Sample Log Sheet
Low-Flow Sampling Data Sheet
IX. REFERENCES
USEPA. Region 2 LOW STRESS (Low Flow) PURGING AND SAMPLING Groundwater
Sampling SOP, FINAL, March 16, 1998.
X. ATTACHMENTS
Low Flow Sampling Data Sheet
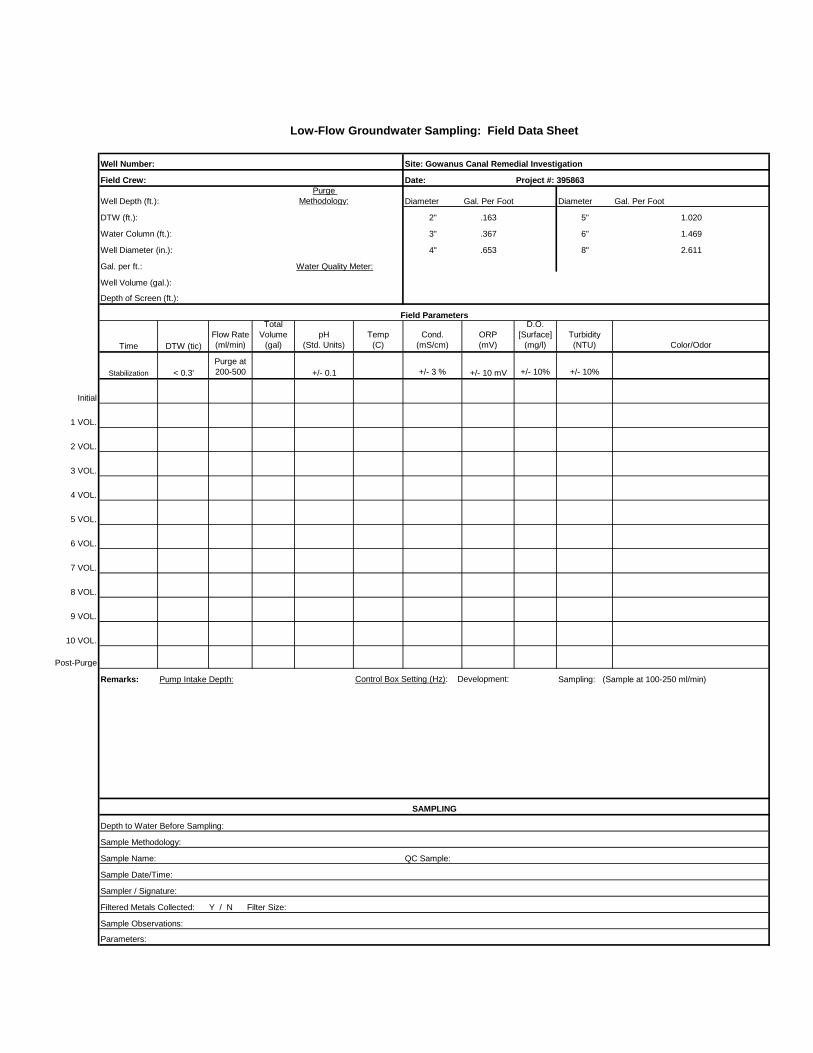
Well Number:
Field Crew: Date: Project #: 395863
Well Depth (ft.):
Purge
Methodology: Diameter Gal. Per Foot Diameter Gal. Per Foot
DTW (ft.): 2" .163 5" 1.020
Water Column (ft.): 3" .367 6" 1.469
Well Diameter (in.): 4" .653 8" 2.611
Gal. per ft.: Water Quality Meter:
Well Volume (gal.):
Depth of Screen (ft.):
Field Parameters
Time DTW (tic)
Flow Rate
(ml/min)
Total
Volume
(gal)
pH
(Std. Units)
Temp
(C)
Cond.
(mS/cm)
ORP
(mV)
D.O.
[Surface]
(mg/l)
Turbidity
(NTU) Color/Odor
Stabilization < 0.3'
Purge at
200-500 +/- 0.1 +/- 3 % +/- 10 mV +/- 10% +/- 10%
Initial
1 VOL.
2 VOL.
3 VOL.
4 VOL.
5 VOL.
6 VOL.
7 VOL.
8 VOL.
9 VOL.
10 VOL.
Post-Purge
Remarks: Pump Intake Depth: Control Box Setting (Hz): Development: Sampling: (Sample at 100-250 ml/min)
SAMPLING
Depth to Water Before Sampling:
Sample Methodology:
Sample Name: QC Sample:
Sample Date/Time:
Sampler / Signature:
Filtered Metals Collected: Y / N Filter Size:
Sample Observations:
Parameters:
Low-Flow Groundwater Sampling: Field Data Sheet
Site: Gowanus Canal Remedial Investigation
SOP No.: 25 Water Level and Well-Depth Measurements in Conventional Wells
Revision No.: 0 Date: April 2010
Page 1 of 3
STANDARD OPERATING PROCEDURE WATER LEVEL AND WELL- DEPTH MEASUREMENTS IN
CONVENTIONAL WELLS 1.0 Scope and Application
The purpose of this Standard Operating Procedure (SOP) is to describe the protocol for measuring water level and well-depths in conventional monitoring wells. In this SOP, the term well is used to designate both wells and piezometers.
2.0 Materials
a. Water-level/ Interface Indicator with cable measured at 0.01 foot increments b. Plastic sheeting c. Folding ruler or pocket steel tape d. Field logbook e. Photoionization detector (PID) f. Squirt bottle with DI water and paper towel
3.0 Procedure
3.1 Preliminary Steps
3.1.1 Locate the well and verify its position on the site map. Record whether positive identification was obtained, including the well number and any identifying marks or codes contained on the well casing or protective casing.
3.1.2 Remove the well cap and check for organic vapors using a PID.
3.1.3 Locate and record the specified benchmark or survey point for the well, which may be a mark at the top of the casing or surveyors pin embedded in the protective structure. Determine from the records and record in the field logbook the elevation of this point. Measure and record the vertical distance from the bench mark to the top of the well casing, to the nearest 0.01 feet. Measure and record the metal casing stick-up (the distance between the top of the casing and nominal ground (level).
3.1.4 Record any observations and remarks regarding the completion characteristics and well condition, such as evidence of cracked casing or surface seals, security of the well (locked cap), and evidence of tampering.
3.1.5 Keep all equipment and supplies protected from contamination. Keep the water level indicator probe in its protective case when not in use.
SOP No.: 25 Water Level and Well-Depth Measurements in Conventional Wells
Revision No.: 0 Date: April 2010
Page 2 of 3
3.2 Operation
3.2.1 Remove the water level indicator probe from the case, turn on the sounder, and test check the battery and sensitivity scale by pushing the red button. Adjust the sensitivity scale until you can hear the buzzer.
3.2.2 Slowly lower the probe and cable into the well, allowing the cable reel to unwind. Continue lowering until the meter buzzes. Very slowly, raise and lower the probe until the point is reached where the meter just begins to buzz. Marking the spot by grasping the cable with the thumb and forefingers at the top of the casing, withdraw the cable and record the depth.
If LNAPL is present, the interface probe will intermittently beep at the top of the product.
Record this depth in the field logbook and record form.
Continue to lower the probe until the solid buzz is heard, which is the water level/ LNAPL interface. Record this depth in the field logbook and record form.
3.2.3 To measure the well depth, lower the probe until slack is noted in the cable. Very slowly raise and lower the cable until the exact bottom of the well is "felt." Measure and record the depth. Note that there is a protective tip on the sonde between the electrical sensor and tip of the probe. The length of this protective tip must be added into the total measured length when measuring well depth.
3.2.4 Withdraw the cable and probe, and decontaminate.
3.3 Data Recording and Manipulation
Record the following computations:
casing elevation = bench mark elevation + casing stick-up top of product elevation = casing elevation - depth to product thickness of product = depth to water – depth to product water level elevation = casing elevation - depth to water well bottom elevation = casing elevation - depth to bottom
4.0 Maintenance
4.1 Check the batteries of the water level/interface indicator each time the instrument is used.
5.0 Precautions
5.1 Refer to the Health and Safety Plan for appropriate health and safety precautions.
SOP No.: 25 Water Level and Well-Depth Measurements in Conventional Wells
Revision No.: 0 Date: April 2010
Page 3 of 3
6.0 References
None
7.0 Attachments
Water level measurement record
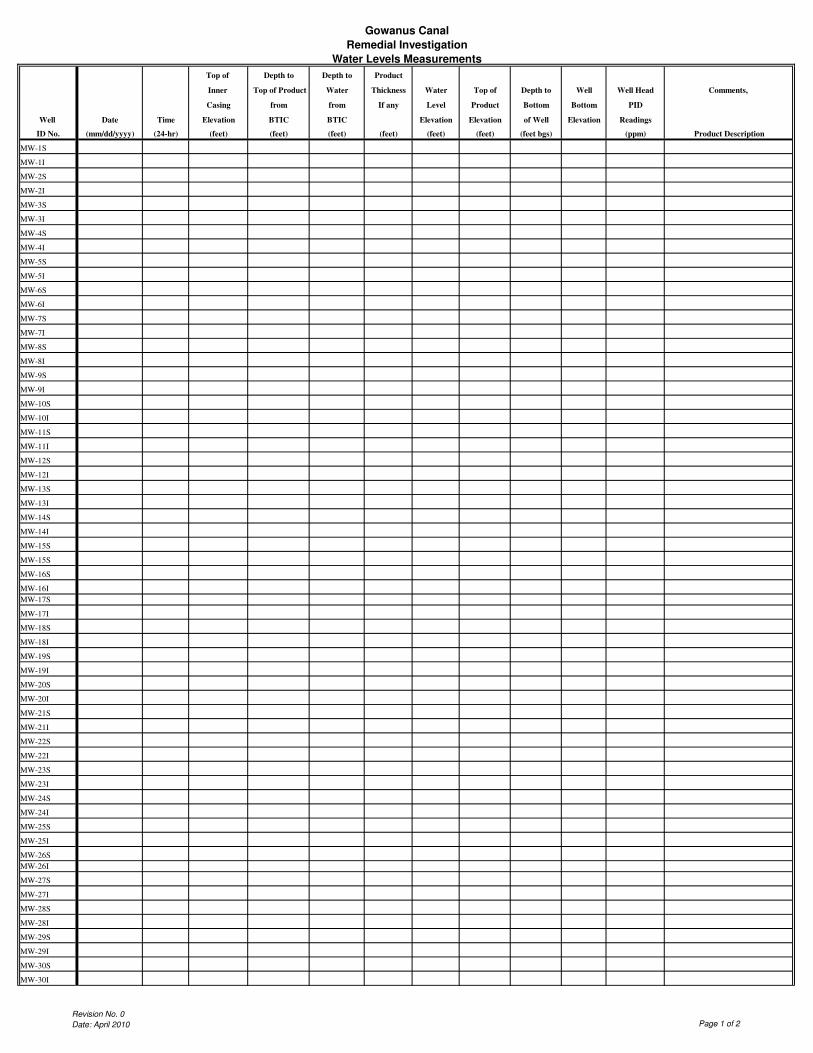
Gowanus Canal
Remedial Investigation
Water Levels Measurements
Top of Depth to Depth to Product
Inner Top of Product Water Thickness Water Top of Depth to Well Well Head Comments,
Casing from from If any Level Product Bottom Bottom PID
Well Date Time Elevation BTIC BTIC Elevation Elevation of Well Elevation Readings
ID No. (mm/dd/yyyy) (24-hr) (feet) (feet) (feet) (feet) (feet) (feet) (feet bgs) (ppm) Product Description
MW-1S
MW-1I
MW-2S
MW-2I
MW-3S
MW-3I
MW-4S
MW-4I
MW-5S
MW-5I
MW-6S
MW-6I
MW-7S
MW-7I
MW-8S
MW-8I
MW-9S
MW-9I
MW-10S
MW-10I
MW-11S
MW-11I
MW-12S
MW-12I
MW-13S
MW-13I
MW-14S
MW-14I
MW-15S
MW-15S
MW-16S
MW-16I
MW-17S
MW-17I
MW-18S
MW-18I
MW-19S
MW-19I
MW-20S
MW-20I
MW-21S
MW-21I
MW-22S
MW-22I
MW-23S
MW-23I
MW-24S
MW-24I
MW-25S
MW-25I
MW-26S
MW-26I
MW-27S
MW-27I
MW-28S
MW-28I
MW-29S
MW-29I
MW-30S
MW-30I
Revision No. 0
Date: April 2010 Page 1 of 2
Gowanus Canal
Remedial Investigation
Water Levels Measurements
Top of Depth to Depth to Product
Inner Top of Product Water Thickness Water Top of Depth to Well Well Head Comments,
Casing from from If any Level Product Bottom Bottom PID
Well Date Time Elevation BTIC BTIC Elevation Elevation of Well Elevation Readings
ID No. (mm/dd/yyyy) (24-hr) (feet) (feet) (feet) (feet) (feet) (feet) (feet bgs) (ppm) Product Description
MW-31S
MW-31I
MW-32S
MW-32I
MW-33S
MW-33I
MW-34S
MW-34I
MW-35S
MW-35I
MW-36S
MW-36I
MW-37S
MW-37I
MW-38S
MW-38I
MW-39S
MW-39I
MW-40S
MW-40I
MW-41S
MW-41I
MW-42S
MW-42I
MW-43S
MW-43I
MW-44S
MW-44I
MW-45S
MW-45S
Revision No. 0
Date: April 2010 Page 2 of 2

SOP No.: 26 Monitoring Well Development
Revision No.: 0 Date: April 2010
Page 1 of 3
STANDARD OPERATING PROCEDURE MONITORING WELL AND PIEZOMETER DEVELOPMENT
1.0 Scope and Application
This Standard Operating Procedure (SOP) provides technical guidance for the development of permanent groundwater monitoring wells. This SOP also provides a list of the equipment that will be used in the development of the monitoring wells.
This SOP is based on the US EPA’s Ground Water Forum guidance document “Monitoring Well Development Guidelines for Superfund Project Managers”, March 1992.
2.0 Materials
a. Drill rig
b. Photoionization Detector (PID) (provided by CH2M HILL)
c. Combustible Gas Indicator (CGI) (provided by CH2M HILL)
d. Water Level Indicator (provided by CH2M HILL)
e. Submersible pump; Redi-flow 2 or equivalent
f. Horiba® U-10 / U-22 or similar instrument for measuring pH, temperature, conductivity, and turbidity (provided by CH2M HILL)
g. Polyethylene tubing (does NOT have to be Teflon lined)
h. Portable polyethylene tank or other large container for well development water
i. Surge Block for shallower wells
j. Well Development Form (provided and completed by CH2M HILL)
NOTE: All materials to be provided by CH2M HILL are indicated. Remaining materials are to be provided by drilling Contractor.
3.0 Procedure
3.1 Monitoring Well
3.1.1 Development will begin no sooner than 48 hours, but no later than seven days after construction of the well and surface completion.
3.1.2 Development of groundwater monitoring wells will be recorded on the attached Well Development Form. The following data will be recorded for development:
Well designation
Date of well installation
Date of development

SOP No.: 26 Monitoring Well Development
Revision No.: 0 Date: April 2010
Page 2 of 3
Static water level before development
Quantity of standing water in well prior to development
Conductivity, temperature, pH, and turbidity measurements will be taken during each consecutive well volume purged
Depth from top of well casing to bottom of well
Screen length
Depth from top of well casing to top of sediment inside well, before and after development
Physical character of removed water, including changes during development in clarity, color, particulate matter, and odor
Type and size/capacity of pump and/or bailer used
Description of surge technique, if used
Height of well casing below ground surface
Quantity of water removed and removal time
3.1.3 Development will be by pumping the groundwater with a stainless-steel electric-powered submersible pump. The submersible pump intake will be placed within the screened interval of the well. Initially, the pump will be placed approximately 1 foot above the bottom of the well, and later moved to the middle and top portions of the screen. The pump will be surged to facilitate the removal of fine sediments from the well.
3.1.4 Polyethylene tubing, connected to the pump with stainless-steel clamps, will be used for purging. New tubing will be attached to the pump for each monitor well and will be disposed of after use. Teflon lined tubing will not be required for development.
3.1.5 Water will not be added to the well to aid in development, nor will any type of air-lift technique be used.
3.1.6 Development will proceed until one of the following conditions is met and the sediment thickness remaining in the well is less than five percent of the screen length (e.g.: 6 inches of sediment in a 10 foot screen):
Stabilization of water quality parameters. Stabilization will be defined as less than 10 percent variance between the removal of two successive well volumes. Turbidity measurements are the most critical development criteria, with a target level of 15 NTUs or lower.
SOP No.: 26 Monitoring Well Development
Revision No.: 0 Date: April 2010
Page 3 of 3
Five well volumes have been purged (including the saturated filter material in the annulus) plus the volume of water added during the drilling process (if any) have been removed from the well, regardless of stabilization of the water quality parameters.
CH2M HILL field personnel will measure and record water quality parameters and make the determination on when well development is complete.
3.2 Collection and Disposal of Development Water.
3.2.1 The drilling contractor will be responsible for containerizing development water in a portable tank and for transporting it to the designated location. CH2M HILL will arrange for the disposal of the containerized well development water along with any other IDW water.
4.0 Maintenance
4.1 The water quality meter should be maintained in accordance with the manufacturer's instructions.
5.0 Precautions
5.1 Refer to the Health and Safety Plan for appropriate health and safety precautions.
6.0 References
USEPA – Office of Solid Waste and Emergency Response, March 1992, Ground Water Forum: Monitoring Well Development Guidelines for Superfund Project Managers.
USATHAMA, 1987. Geotechnical Requirements for Drilling, Monitoring Wells, Data Acquisition, and Reports. March 1987.
7.0 Attachments
Well and Piezometer Development Form
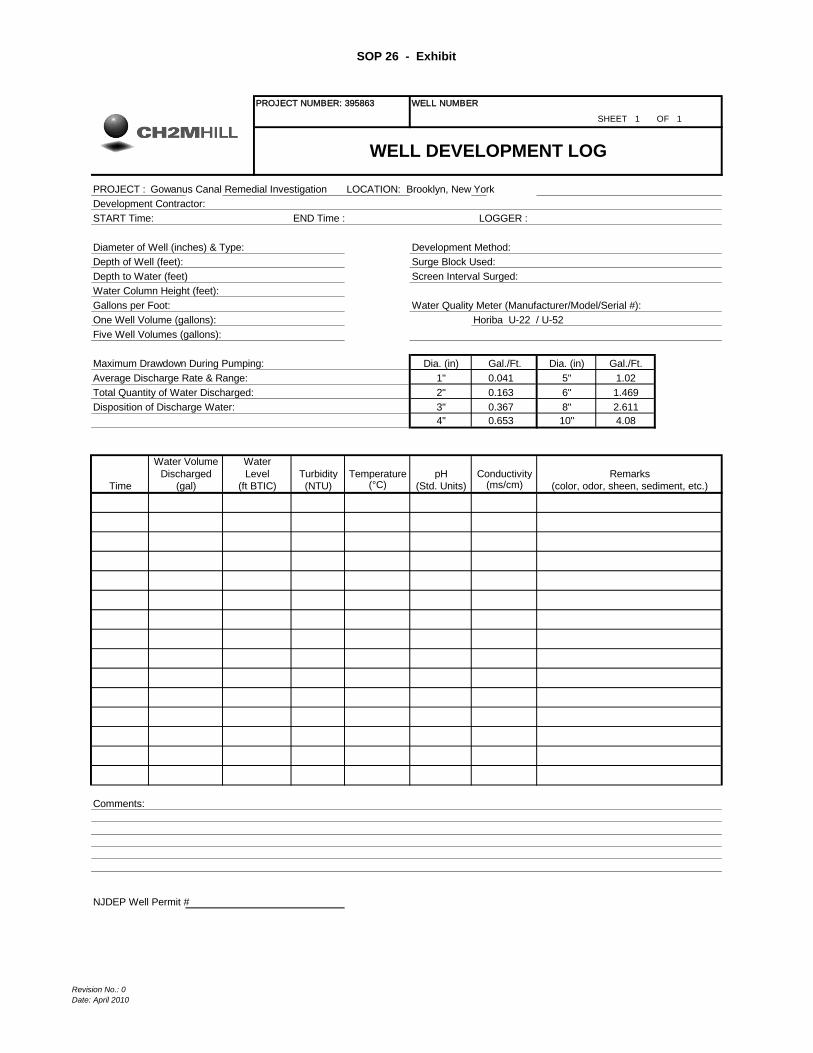
SOP 26 - Exhibit
PROJECT NUMBER: 395863 WELL NUMBER
SHEET 1 OF 1
WELL DEVELOPMENT LOG
PROJECT : Gowanus Canal Remedial Investigation LOCATION: Brooklyn, New York
Development Contractor:
START Time: END Time : LOGGER :
Diameter of Well (inches) & Type: Development Method:
Depth of Well (feet): Surge Block Used:
Depth to Water (feet) Screen Interval Surged:
Water Column Height (feet):
Gallons per Foot: Water Quality Meter (Manufacturer/Model/Serial #):
One Well Volume (gallons): Horiba U-22 / U-52
Five Well Volumes (gallons):
Maximum Drawdown During Pumping: Dia. (in) Gal./Ft. Dia. (in) Gal./Ft.
Average Discharge Rate & Range: 1" 0.041 5" 1.02
Total Quantity of Water Discharged: 2" 0.163 6" 1.469
Disposition of Discharge Water: 3" 0.367 8" 2.611
4" 0.653 10" 4.08
Water Volume Water
Discharged Level Turbidity Temperature pH Conductivity Remarks
Time (gal) (ft BTIC) (NTU) (°C) (Std. Units) (ms/cm) (color, odor, sheen, sediment, etc.)
Comments:
NJDEP Well Permit #
Revision No.: 0
Date: April 2010
SOP No.: 27 Collection of Filtered Water Samples
Revision No.: 0 Date: April 2010
Page 1 of 2
STANDARD OPERATING PROCEDURE COLLECTION OF FILTERED WATER SAMPLES
1.0 Scope and Application
The purpose of this Standard Operating Procedure (SOP) is to describe protocols for filtering groundwater and surface water samples.
2.0 Materials
a. Laboratory pre-preserved sample containers
b. In-line cartridge filters (0.45 um)
c. Hand pump or peristaltic pump and appropriate sized silicone or Tygon tubing
d. Ice
e. pH paper
f. Safety glasses
3.0 Procedure
3.1 Groundwater and surface water samples will be collected in the order of decreasing compound volatility. Collect sample for TAL dissolved metals last. Surface water samples will initially be collected into an unpreserved HDPE or Teflon bottle, either by way of a discrete sampler or direct fill method. The sample will be pumped from that container, through a filter, into a bottle with the appropriate preservative.
Note: Surface water samples will also be filtered for dissolved cyanide analysis. Groundwater and CSO water samples WILL NOT be filtered for dissolved cyanide.
3.2 Filtering
A. Low Turbidity Water Samples
- Water samples for dissolved metals analyses will be filtered using disposable 0.45 µM In-Line Filter Cartridges.
- Connect the filter cartridge directly to the discharge tubing from the pump. Allow some water to flow through and discard.
- Collect sample from the filter discharge nozzle.
- Dispose of in-line cartridge.
B. High Turbidity Water Samples
- A sample of raw water with high turbidity may be collected into an unpreserved, 1 liter HDPE bottle.
SOP No.: 27 Collection of Filtered Water Samples
Revision No.: 0 Date: April 2010
Page 2 of 2
- Allow the bottle to stand, undisturbed, for approximately 5 minutes to allow the entrained sediment to settle to the bottom of the bottle.
- Using a peristaltic pump with dedicated silicone tubing with a filter attached to the end, skim the raw water from the bottle into an appropriately preserved bottle for TAL dissolved metals analysis.
4.0 Maintenance
Not Applicable.
5.0 Precautions
Verify that discharge tubing is connected to the correct end of the in-line filter as indicated by the embossed arrow
6.0 References
None
7.0 Attachments
None
SOP-28: CSO Sample Collection
Revision No.: 1 Date: June 2010
Page 1 of 7
STANDARD OPERATING PROCEDURE CSO SAMPLE COLLECTION
1.0 Introduction This Standard Operating Procedure (SOP) describes protocols for site reconnaisance, and collecting and processing water and sediment samples from combined (sanitary and storm water) sewers. The combined sewer system and treatment works are owned and operated by New York City Environmental Protection (NYCEP). Dry and wet weather sampling will be performed at the Gowanus Pump Station and sewers that discharge to Gowanus Canal via combined sewer overflows (CSO) during wet weather. Sewage water and sewer sediment samples will be collected. This SOP also includes descriptions of sampling materials and quality assurance/quality control procedures using equipment and field blanks.
2.0 Materials The following materials are needed for CSO water and sediment sample collection and processing:
− Crow bar or J-bar for opening manholes and sewer access panels
− 2 shovels with pointed ends
− Sledge hammer
− Traffic cones
− Fluorescent spray paint
− Field logbook
− Sampling pole (10-foot fixed or telescopic pole)
− Bottleware, labels, and appropriate preservatives for samples
− PPE – gloves, safety glasses
− Kemmerer sampler, Van Dorn bottles, or other appropriate discrete water sampler
− ISCO automatic sampler
− Water quality collection instrument and calibration solutions (e.g. Horiba or YSI unit) with sensors for pH, salinity, temperature, specific conductivity, turbidity, dissolved oxygen and ORP.
− Ziploc bags
− Ice
− Decontamination solutions
− Digital camera
3.0 Site Reconnaissance for Sampling Verification All monitoring locations will be inspected prior to any data collection activities to verify the sampling location, assess health and safety conditions, traffic situation and identify any issues that will interfere with sampling. Sampling will be conducted at/in the Gowanus Pump Station and at manholes or other access points to sewers, requiring separate verification and sampling procedures.
3.1. Gowanus Pump Station Reconnaissance
The Gowanus Pump Station will be accessed with NYCEP personnel. A suitable sampling location will be identified according to the following:
SOP-28: CSO Sample Collection
Revision No.: 1 Date: June 2010
Page 2 of 7
• The location must facilitate automatic sampling of sewage entering the pump station during dry and wet weather.
• The location must facilitate safe and accessible positioning of an ISCO automatic sampler that will both monitor sewage flow conditions in the pump station and draw samples during dry and wet weather.
• Sewage flow monitoring must enable identification of higher flows above the diurnal sewage flow condition that will indicate that wet weather conditions are occurring and automated sampling shall begin.
• The flow monitoring and sampler locations must be verified with NYCEP personnel to confirm that there are no conflicts with operations, health and safety, etc. at the pump station and that the monitoring location is suitable to achieve data quality goals.
The following will be performed to mark and record the locations:
1. The flow monitoring and sampler locations will be marked with fluorescent paint or other markers acceptable to NYCEP personnel.
2. Photographs shall be taken (if allowed by NYCEP) of the flow monitoring, sampling, and sampler location.
3. Sketches shall be recorded depicting a flow schematic of the facility with the flow monitoring, sampler and sampling locations. Detailed sketches shall be recorded of the specific locations as appropriate.
3.2. Sewer Sampling Reconnaissance
Sewer sampling will be performed at manholes, regulator chambers or other sewer access points to the sewer system during dry weather to verify the intended sampling location. Upon arrival at the sampling location, all traffic control and health and safety procedures will be followed for preparing the site for verification. Manholes or other sewer access will be opened following the manhole opening procedure and traffic control applied in accordance with the procedures in the Health and Safety Plan. At no time will entry be made into the manhole or sewer access and personnel shall stand upwind of the open manholes to avoid inhalation of potentially trapped gasses. Site reconnaissance will be performed as follows:
1. The access point will be opened and inspected to verify that the sewage flow and accumulated sediment at the bottom of the sewer (if any) can be sampled safely from the street surface using a sampling pole.
2. If the location has been identified upstream of a regulator, then verify that flowing sewage is visible in the sewer to also verify the location.
3. The sampling pole will be used to estimate the thickness of sediment, if any, at the bottom of the sewer and the invert (bottom) elevation of the sewer relative to the street surface.
4. Photographs shall be taken of the inside of the sewer via the access point, the street surface, and surrounding area to document the location.
5. Sketches shall be recorded to depict the sample location, sewers entering and exiting the access point, surface streets, and landmarks.
6. The following shall also be recorded: location reference (street address / landmarks, location within street/intersection, reference to other nearby manholes in street that may cause confusion during subsequent visits) estimated sewer diameter, estimated

SOP-28: CSO Sample Collection
Revision No.: 1 Date: June 2010
Page 3 of 7
invert elevation of sewer relative to the street surface, estimated depth of flow in the sewer, recorded thickness of sediment in the sewer, traffic conditions.
4.0 Dry Weather Sample Collection Procedure Dry weather CSO samples will be collected at the Gowanus Pump Station and at all sewer monitoring locations.
4.1. Gowanus Pump Station Dry Weather Sample Collection Procedure
Sampling will be performed at the Gowanus Pump Station to collect a 24-hour composite sample using an ISCO automatic sampler. The minimum following information must be recorded in the field log book by the project team representative each and every time on site:
• Station location
• Date and time of sample collection start and finish
• General weather conditions
• Estimated depth of flowing sewage in the pump station
• General description of observed sewage (color, clarity, turbidity/particulates)
• Note any problems with sample collection (e.g., number of attempts needed to collect an adequate sample)
• Analytical samples collected
The ISCO sampler and flow monitoring hardware will be installed at the locations marked during the site reconnaissance.
1. The ISCO sampling tube will be secured so the intake will be submerged in the sewage flow at all times.
2. The sampler will be set and started for composite sampling on an hourly basis for 24 hours.
3. The housing of the ISCO sampler will be taped and sealed shut and a custody seal affixed to provide indication if the sampler was opened or disturbed during the sampling event.
After 24 hours, the ISCO sampler will be stopped and samples collected with the following specific steps:
1. Collect and record from the ISCO sampler composite tub the following water quality parameters with a probe: pH, salinity, temperature, specific conductivity, turbidity, dissolved oxygen, and ORP.
2. Using the prepared bottle sets, transfer samples from the sampler composite tub to the appropriate sample container.
3. Be sure to use special attachments available on some discrete samplers to distribute small volumes at low flow rates (e.g., VOCs at 100 to 200 mL/ min).
The ISCO sampler and flow monitoring hardware will be removed from the pump station unless wet weather sampling is imminently anticipated.
4.2. Dry Weather Sewer Sample Collection Procedure
SOP-28: CSO Sample Collection
Revision No.: 1 Date: June 2010
Page 4 of 7
The minimum following information must be recorded in the field log book by the project team representative at the time of sampling:
• Station location
• Date and time of sample collection
• General weather conditions
• General description of observed sewage (color, clarity, turbidity/particulates)
• Estimated depth of flowing sewage
• Note any problems with sample collection (e.g., number of attempts needed to collect an adequate sample)
• Analytical samples collected
Upon arrival at the sampling location, all traffic control and health and safety procedures will be followed for preparing the site to sample. Confirm that the correct manhole location is being opened as marked from the reconnaissance. Manholes or other sewer access will be opened following the manhole opening procedure. At no time will entry be made into the manhole or sewer access. A sewage water sample will be collected manually with the following specific steps:
1. A clean glass, stainless steel, or poly ethylene container will be mounted on the end of the sampling pole.
2. Using the sampling pole, submerge the container on the end of the pole into the flowing sewage. Care will be taken to avoid disturbing sewer sediments.
3. Withdraw the sampling pole and record in-situ water quality parameters (pH, salinity, temperature, specific conductivity, turbidity, dissolved oxygen and ORP) sample container.
4. Empty the container into the manhole and again collect a sample by submerging the container on the end of the pole into the flowing sewage. Care will again be taken to avoid disturbing sewer sediments.
5. When retrieved, the bottle is tightly capped and removed from the sampling pole. 6. Remove the cap and transfer the sample to sample bottles. 7. Be sure to use special attachments available on some discrete samplers to distribute
small volumes at low flow rates (e.g., VOCs at 100 to 200 mL/ min).
A sewer sediment sample will be collected manually with the following specific steps: 1. Using the sampling pole, submerge the container on the end of the pole into the
sediment in the bottom of the sewer and retrieve a sample. 2. Transfer the sample to sample bottles.
Manholes and other sewer access will be replaced and all traffic controls will be removed following health and safety procedures.
5.0 Wet Weather Sample Collection Procedure Wet weather CSO samples will be collected at the Gowanus Pump Station and at all sewer monitoring locations.
5.1. Gowanus Pump Station Wet Weather Sample Collection Procedure
SOP-28: CSO Sample Collection
Revision No.: 1 Date: June 2010
Page 5 of 7
Sampling will be performed at the Gowanus Pump Station to collect a 24-hour composite sample using an ISCO automatic sampler. The minimum following information must be recorded in the field log book by the project team representative each and every time on site:
• Station location
• Date and time of sample collection start and finish
• General weather conditions
• General description of observed sewage (color, clarity, turbidity/particulates)
• Estimated depth of flowing sewage in the pump station
• Note any problems with sample collection (e.g., number of attempts needed to collect an adequate sample)
• Analytical samples collected
The ISCO sampler and flow monitoring hardware will be installed at the locations marked during the site reconnaissance.
1. The ISCO sampling tube will be secured so the intake will be submerged in the sewage flow at all times.
2. The sampler will be set and started for composite sampling on an hourly basis for 24 hours.
3. The housing of the ISCO sampler will be taped and sealed shut and a custody seal affixed to provide indication if the sampler was opened or disturbed during the sampling event.
After 24 hours, the ISCO sampler will be stopped and samples collected with the following specific steps:
1. Collect and record from the ISCO sampler composite tub the water quality parameters with a probe: pH, salinity, temperature, specific conductivity, turbidity, dissolved oxygen and ORP.
2. Using the prepared bottle sets, transfer samples from the sampler composite tub to the appropriate sample container.
3. Be sure to use special attachments available on some discrete samplers to distribute small volumes at low flow rates (e.g., VOCs at 100 to 200 mL/ min).
The ISCO sampler and flow monitoring hardware will be removed from the pump station unless additional wet weather sampling is imminently anticipated.
5.2. Wet Weather Sewer Sample Collection Procedure
The minimum following information must be recorded in the field log book by the project team representative at the time of sampling:
• Station location
• Date and time of sample collection
• General weather conditions
• Estimated depth of flowing sewage
• General description of observed sewage (color, clarity, turbidity/particulates)
• Note any problems with sample collection (e.g., number of attempts needed to collect an adequate sample)
SOP-28: CSO Sample Collection
Revision No.: 1 Date: June 2010
Page 6 of 7
• Analytical samples collected
Upon arrival at the sampling location, all traffic control and health and safety procedures will be followed for preparing the site to sample. Confirm that the correct manhole is being opened as marked from the reconnaissance. Manholes or other sewer access will be opened following the manhole opening procedure. At no time will entry be made into the manhole or sewer access. A sewage water sample will be collected manually with the following specific steps:
1. A clean glass, stainless steel, or poly ethylene container will be mounted on the end of the sampling pole.
2. Using the sampling pole, submerge the container on the end of the pole into the flowing sewage. Care will be taken to avoid disturbing sewer sediments.
3. Withdraw the sampling pole record in-situ water quality parameters (pH, salinity, temperature, specific conductivity, turbidity, dissolved oxygen and ORP) sample container.
4. Empty the container into the manhole and again collect a sample by submerging the container on the end of the pole into the flowing sewage. Care will again be taken to avoid disturbing sewer sediments.
5. When retrieved, the bottle is tightly capped and removed from the sampling pole. 6. Remove the cap and transfer the sample to sample bottles. 7. Be sure to use special attachments available on some discrete samplers to distribute
small volumes at low flow rates (e.g., VOCs at 100 to 200 mL/ min).
Manholes and other sewer access will be replaced and all traffic controls will be removed following health and safety procedures.
6.0 Equipment Blank Collection Equipment blanks will be collected by passing aliquots of the Type II Deionized (DI) water supplied by an environmental sampling supply company through a decontaminated sampling device (or unused dedicated sampling equipment if only disposable materials are used) then decanted into the appropriate bottleware for submittal to the laboratories. Equipment blanks will be analyzed for TAL/TCL parameters and total suspended solids (TSS). Equipment blanks will be collected daily.
7.0 Field Ambient Blank Collection Field ambient blanks will be collected by transferring aliquots of the Type II DI water supplied by an environmental sampling supply company to the appropriate bottleware for submittal to the laboratories. The purpose of the Field Blank is to assess potential cross-contamination present in the work environment. The transfer of water should be performed in a cascading method between jars to allow for entrainment of potential contaminants. Field blanks will be analyzed for TAL/TCL parameters and TSS. Field blanks will be collected once per week or once per sampling event for short duration sampling events.
SOP-28: CSO Sample Collection
Revision No.: 1 Date: June 2010
Page 7 of 7
8.0 Maintenance Not applicable.
9.0 Precautions Sample preservatives may include acids or bases and require use of nitrile gloves and safety glasses. Sampling devices with “snap-top” designs can pose a pinch hazard and care should be taken when setting the devices.
10.0 Attachments CSO Sample Collection Record
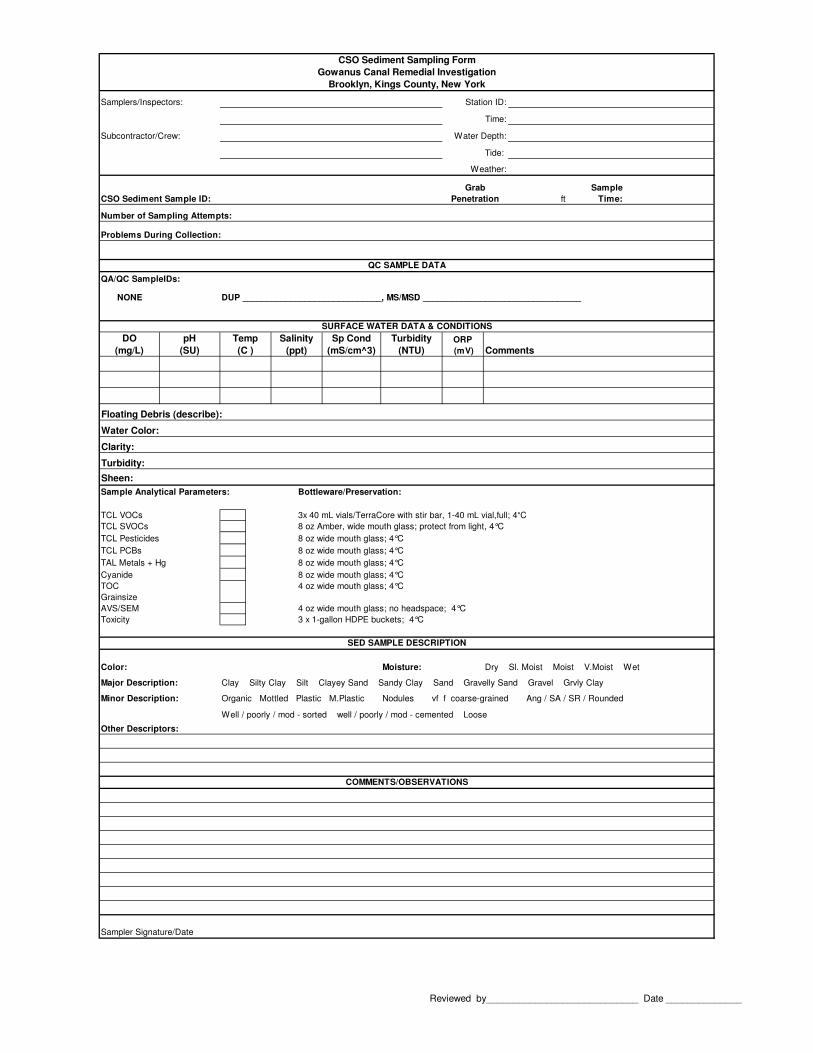
Samplers/Inspectors: Station ID:
Time:
Subcontractor/Crew: Water Depth:
Tide:
Weather:
CSO Sediment Sample ID: ft
Sample
Time:
Number of Sampling Attempts:
QA/QC SampleIDs:
NONE DUP _____________________________, MS/MSD _________________________________
DO
(mg/L)
pH
(SU)
Turbidity
(NTU)ORP
(mV)
Floating Debris (describe):
Water Color:
Clarity:
Turbidity:
Sheen:
Sample Analytical Parameters: Bottleware/Preservation:
3x 40 mL vials/TerraCore with stir bar, 1-40 mL vial,full; 4°C
8 oz Amber, wide mouth glass; protect from light, 4°C
8 oz wide mouth glass; 4°C
8 oz wide mouth glass; 4°C
8 oz wide mouth glass; 4°C
8 oz wide mouth glass; 4°C
4 oz wide mouth glass; 4°C
4 oz wide mouth glass; no headspace; 4°C
3 x 1-gallon HDPE buckets; 4°C
Color: Moisture: Dry Sl. Moist Moist V.Moist Wet
Major Description:
Minor Description: Organic Mottled Plastic M.Plastic Nodules vf f coarse-grained Ang / SA / SR / Rounded
Other Descriptors:
Sampler Signature/Date
Grab
Penetration
CSO Sediment Sampling Form
Gowanus Canal Remedial Investigation
Brooklyn, Kings County, New York
QC SAMPLE DATA
Problems During Collection:
SURFACE WATER DATA & CONDITIONS
COMMENTS/OBSERVATIONS
Toxicity
Temp
(C )
Salinity
(ppt)
Sp Cond
(mS/cm^3) Comments
Clay Silty Clay Silt Clayey Sand Sandy Clay Sand Gravelly Sand Gravel Grvly Clay
Well / poorly / mod - sorted well / poorly / mod - cemented Loose
Grainsize
AVS/SEM
SED SAMPLE DESCRIPTION
Cyanide
TOC
TCL VOCs
TCL SVOCs
TCL Pesticides
TCL PCBs
TAL Metals + Hg
Reviewed by____________________________ Date ______________
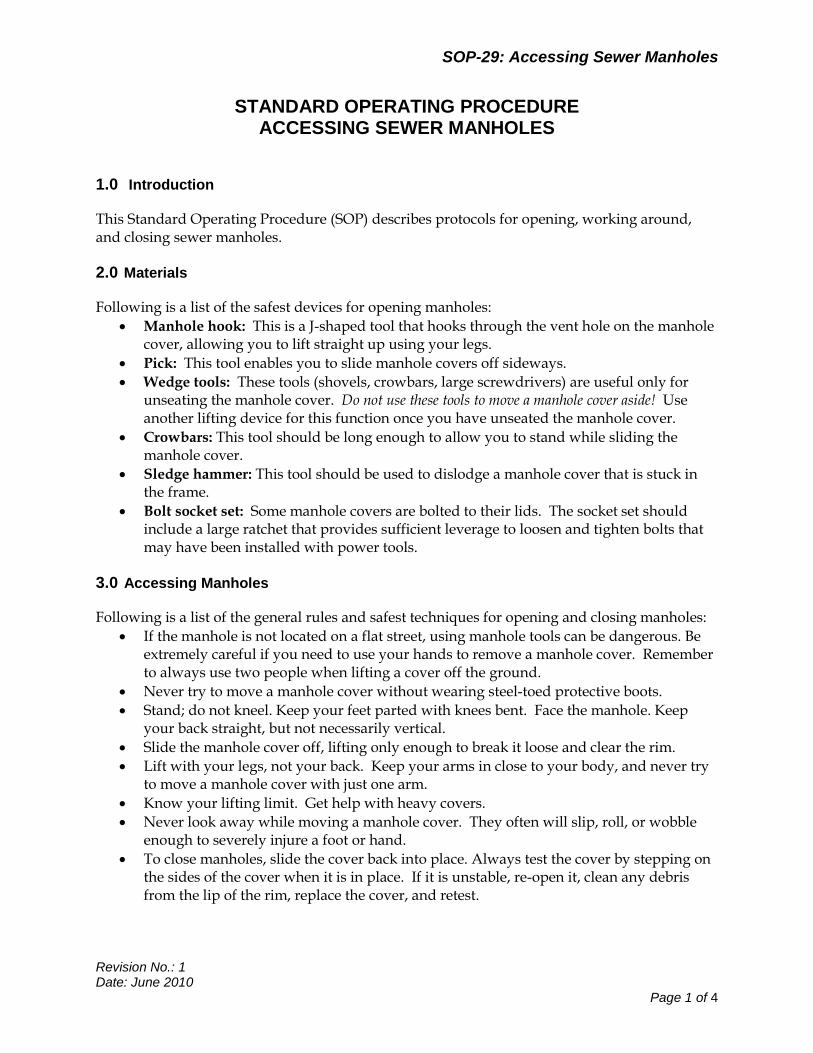
SOP-29: Accessing Sewer Manholes
Revision No.: 1 Date: June 2010
Page 1 of 4
STANDARD OPERATING PROCEDURE ACCESSING SEWER MANHOLES
1.0 Introduction This Standard Operating Procedure (SOP) describes protocols for opening, working around, and closing sewer manholes.
2.0 Materials
Following is a list of the safest devices for opening manholes: • Manhole hook: This is a J-shaped tool that hooks through the vent hole on the manhole
cover, allowing you to lift straight up using your legs. • Pick: This tool enables you to slide manhole covers off sideways. • Wedge tools: These tools (shovels, crowbars, large screwdrivers) are useful only for
unseating the manhole cover. Do not use these tools to move a manhole cover aside! Use another lifting device for this function once you have unseated the manhole cover.
• Crowbars: This tool should be long enough to allow you to stand while sliding the manhole cover.
• Sledge hammer: This tool should be used to dislodge a manhole cover that is stuck in the frame.
• Bolt socket set: Some manhole covers are bolted to their lids. The socket set should include a large ratchet that provides sufficient leverage to loosen and tighten bolts that may have been installed with power tools.
3.0 Accessing Manholes Following is a list of the general rules and safest techniques for opening and closing manholes:
• If the manhole is not located on a flat street, using manhole tools can be dangerous. Be extremely careful if you need to use your hands to remove a manhole cover. Remember to always use two people when lifting a cover off the ground.
• Never try to move a manhole cover without wearing steel-toed protective boots. • Stand; do not kneel. Keep your feet parted with knees bent. Face the manhole. Keep
your back straight, but not necessarily vertical. • Slide the manhole cover off, lifting only enough to break it loose and clear the rim. • Lift with your legs, not your back. Keep your arms in close to your body, and never try
to move a manhole cover with just one arm. • Know your lifting limit. Get help with heavy covers. • Never look away while moving a manhole cover. They often will slip, roll, or wobble
enough to severely injure a foot or hand. • To close manholes, slide the cover back into place. Always test the cover by stepping on
the sides of the cover when it is in place. If it is unstable, re-open it, clean any debris from the lip of the rim, replace the cover, and retest.
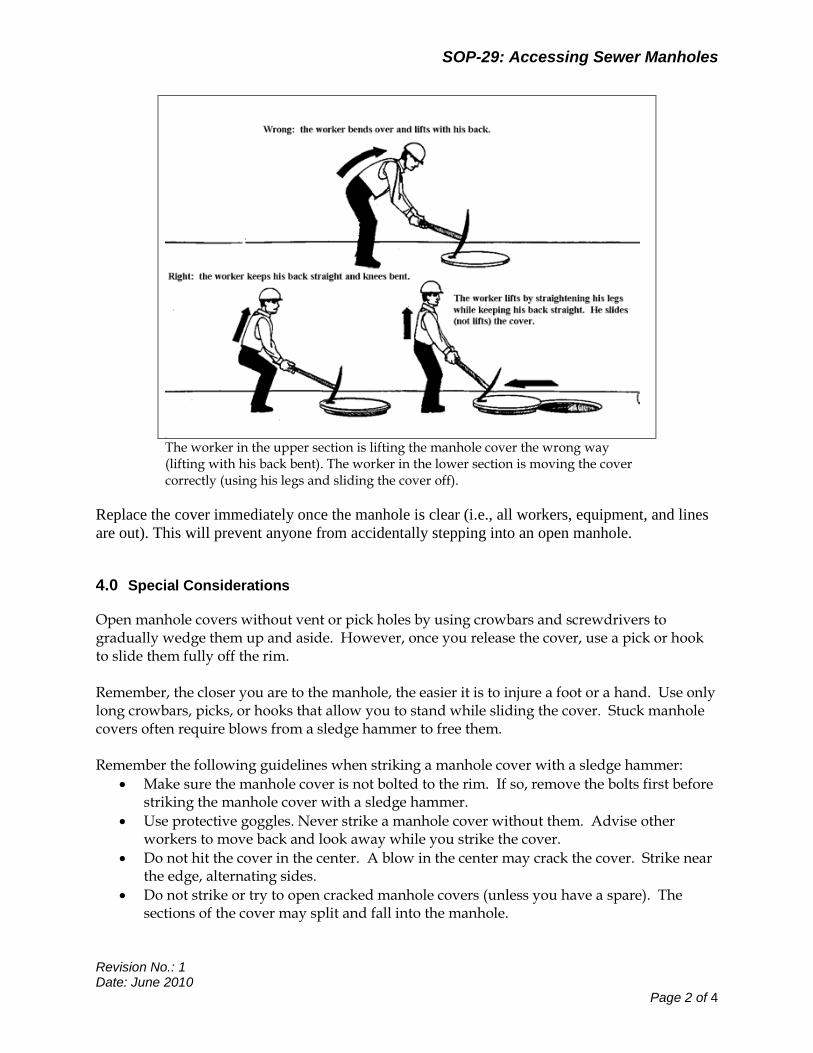
SOP-29: Accessing Sewer Manholes
Revision No.: 1 Date: June 2010
Page 2 of 4
The worker in the upper section is lifting the manhole cover the wrong way (lifting with his back bent). The worker in the lower section is moving the cover correctly (using his legs and sliding the cover off).
Replace the cover immediately once the manhole is clear (i.e., all workers, equipment, and lines are out). This will prevent anyone from accidentally stepping into an open manhole.
4.0 Special Considerations
Open manhole covers without vent or pick holes by using crowbars and screwdrivers to gradually wedge them up and aside. However, once you release the cover, use a pick or hook to slide them fully off the rim. Remember, the closer you are to the manhole, the easier it is to injure a foot or a hand. Use only long crowbars, picks, or hooks that allow you to stand while sliding the cover. Stuck manhole covers often require blows from a sledge hammer to free them. Remember the following guidelines when striking a manhole cover with a sledge hammer:
• Make sure the manhole cover is not bolted to the rim. If so, remove the bolts first before striking the manhole cover with a sledge hammer.
• Use protective goggles. Never strike a manhole cover without them. Advise other workers to move back and look away while you strike the cover.
• Do not hit the cover in the center. A blow in the center may crack the cover. Strike near the edge, alternating sides.
• Do not strike or try to open cracked manhole covers (unless you have a spare). The sections of the cover may split and fall into the manhole.

SOP-29: Accessing Sewer Manholes
Revision No.: 1 Date: June 2010
Page 3 of 4
Report any manhole covers that are cracked, missing, or have missing pieces to authorities immediately. Never leave a manhole with a missing or partial cover in the roadway without traffic warnings (i.e., signs, barriers, or cones). The covers on raised manholes are especially difficult to remove and handle. Once the cover is ajar, slide it back partially and then removed it by hand to avoid dropping it off the manhole. Communicate to everyone involved how to lift the cover and where to place it before attempting to remove it. Resetting the lid also is hazardous because you often cannot stand on it to seat it. In this case, take your time and use the tools available (e.g., a crowbar) to seat the cover.
Manhole lids pose particular risks to fingers and feet. The worker on the left tried to lift a manhole cover with his hands; he should have used an opening tool. On the right, a manhole cover rolled several feet from the manhole onto the foot of a coworker. Steel-toed boots and alertness could have prevented this accident.
5.0 Carrying and Storing Tools at the Worksite
Use the following guidelines for carrying and storing tools at the worksite:
• Never carry picks or opening tools on your shoulder. Carry them alongside your hip. Hold picks where the wooden handle meets the metal head.
• Store all opening tools in the vehicle (or well away from the manhole) when they are not in use. Do not leave them hooked in the manhole cover. Someone could accidentally kick them into the manhole. Keep hand tools at least 24 to 36 inches away from the manhole.
• Keep all tools and equipment away from the cone perimeter. Never place tools or crowbars in cones. A car striking a cone or straying into the perimeter could send these tools flying into the air, potentially causing serious property damage or injury.
SOP-29: Accessing Sewer Manholes
Revision No.: 1 Date: June 2010
Page 4 of 4
6.0 Precautions
The following precautions must be observed: • Use proper lifting techniques (i.e., positioning/assistance). Use mechanical lifting
equipment (magnetic puller.) if feasible. Ensure this equipment is properly maintained and inspected prior to use.
• Use leather gloves that are wear-abrasion resistant when handling manhole covers. Ensure good grip on manhole notch to prevent slippage when opening a manhole cover.
• Be aware of potential pinch points and adjust handling/operation techniques to prevent occurrence. Use care when removing and replacing manhole covers to prevent pinching of hands.
• Be aware of your position and surroundings at all times to prevent falling into cover. Install manhole guard / fall protection around open manhole after removing a manhole cover. Ensure good housekeeping practices to avoid trip hazards with cords and materials.
• Use rubber/nitrile gloves under leather gloves to minimize exposure to biohazards. Use sanitizing gel if exposure occurs and wash exposed areas as soon as possible when exposure occurs. Dispose of contaminated PPE properly and in a timely manner;
• After opening a manhole cover, allow it to naturally ventilate before crouching down and over the open manhole.
• Never attempt to enter in to a manhole without obtaining a Confined Space Entry Permit (CSEP).
7.0 Attachments None.
SOP-30: Weather Monitoring and Planning
Revision No.: 0 Date: April 2010
Page 1 of 3
STANDARD OPERATING PROCEDURE Weather Monitoring and Planning
1.0 Introduction
This Standard Operating Procedure (SOP) describes protocols for monitoring weather in the vicinity of the Gowanus Canal and making informed field planning decisions based on weather forecasts. This SOP will be used on a daily basis to determine when wet or dry weather sampling events will be performed.
2.0 Roles and Responsibilities
The following staff, their roles, and responsibilities will be involved in weather monitoring and planning for Phase 3 field investigations:
Staff Role Responsibility Phone Email
David Reamer Weather Monitor
Monitor weather reports and forecasts
Desk: 973.316.3547
Mobile: 908.410.5999
Bill McMillin Lead Technologist
Weather-related sampling recommendations
Desk: 973.316.3530
Mobile: 973.493.9653
Andy Judd Remedial Investigation Lead
Direct sampling activities
Desk: 973.316.3523
Mobile: 973.769.1473
Juliana Hess Project Manager
Overall project management
Desk: 973.316.3520
Mobile: 201.602.1557
3.0 Daily Weather Monitoring and Field Planning Procedure
This procedure will be executed on a daily basis Phase 3 field investigations are being conducted.
3.1. Morning Data and Forecast Compilation
Weather data and forecast compilation shall be performed every morning by the Weather Monitor during field investigations. The following steps will be executed:
3.1.1 Hourly weather data for the preceding 24 hours shall be collected from the following National Weather Service reporting sites:
New York City, Central Park, NY:
http://weather.noaa.gov/weather/current/KNYC.html
New York, Kennedy International Airport, NY: http://weather.noaa.gov/weather/current/KJFK.html
New York, La Guardia Airport, NY:
http://weather.noaa.gov/weather/current/KLGA.html
SOP-30: Weather Monitoring and Planning
Revision No.: 0 Date: April 2010
Page 2 of 3
3.1.2 Each report shall be downloaded and saved as an electronic text file by the Weather Monitor.
3.1.3 The reports shall be reviewed by the Weather Monitor to determine if more than a trace of precipitation has occurred in the preceding 24 hours between the three data locations.
3.1.4 The New York City area weather forecast and tide prediction for that day and the next shall be compiled from the following resources:
National Weather Service graphical forecasts and probabilities: http://forecast.weather.gov/MapClick.php?lat=40.720800&lon=-73.982200&FcstType=digital
http://forecast.weather.gov/MapClick.php?lat=40.681158743999&lon=-73.98399353027344&site=okx&smap=1&marine=0&unit=0&lg=en&FcstType=text The Weather Channel forecast: http://www.weather.com/weather/today/Brooklyn+NY+11231 AccuWeather forecast: http://www.accuweather.com/us/ny/brooklyn/11231/city-weather-forecast.asp NOAA Tide Prediction for Gowanus Bay: http://tidesandcurrents.noaa.gov/noaatidepredictions/NOAATidesFacade.jsp?Stationid=8517921
3.1.5 Precipitation probabilities and forecasts, and high/low tide prediction relative to
forecasted wet weather will be recorded in a spreadsheet log.
3.2. Morning Weather Planning
Weather and tide information will be reported to project leaders to determine and direct daily sampling activities as follows:
3.2.1 The Weather Monitor will conference call the Lead Technologist, Remedial Investigation Lead, and the Project Manager to report the following:
Local precipitation times and amounts in the past 24 hours.
Local precipitation forecast and probabilities.
Gowanus Bay tide predictions of when high and low tide will occur.
3.2.2 The Lead Technologies will recommend the sampling course of action for the next 48 hours as follows:
When dry weather sampling is being conducted:
If more than 0.10 inches of rainfall has fallen in the past 24-hours, dry weather sampling is to be suspended.
If no precipitation has fallen, and no rain is forecasted to occur in the next 24 hours, dry weather sampling may continue that day.
If precipitation is forecasted in the next 48 hours, the project team will be notified that dry weather may be suspended and wet weather sampling may be initiated relative to low tide predictions. Equipment
SOP-30: Weather Monitoring and Planning
Revision No.: 0 Date: April 2010
Page 3 of 3
and supplies will be prepared to switch to wet weather sampling. If at the completion of wet weather preparations it has not begun to rain, then dry weather sampling may continue that day until precipitation begins at which time dry weather sampling will be stopped.
When wet weather sampling is ongoing or planned to be conducted that day:
If precipitation is forecasted to occur, then wet weather sampling will proceed or continue relative to predicted low tide to maximize the potential of sampling during a combined sewer overflow.
If forecasted wet weather has not occurred, and wet weather sampling has not been initiated, wet weather sampling will be cancelled.
3.2.3 The Lead Technologist, Remedial Investigation Lead, and the Project Manager will then determine and direct sampling activities for the next 48 hours.
3.2.4 The Weather Monitor will record the recommendations and who was notified in the spreadsheet log.
3.3. Afternoon Weather Data Compilation and Planning
The Weather Monitor will check weather data and forecasts every afternoon using the same data locations and forecast resources listed in 3.1 above to confirm that the sampling recommendations made in the morning will still be carried out as per the following:
3.3.1 If precipitation has fallen that was not forecasted, or if the forecast for the next 24 hours has changed, the Lead Technologist, Remedial Investigation Lead, and the Project Manager will be conferenced with the information listed in 3.2.1 above.
3.3.2 The Lead Technologist will make a sampling recommendation following the guidelines listed in 3.2.2 above.
3.3.3 The Lead Technologist, Remedial Investigation Lead, and the Project Manager will determine and direct sampling activities for the next 48 hours.
3.3.4 The Weather Monitor will record the recommendations and who was notified in the spreadsheet log.

Gowanus Canal Superfund SitePhase 3 - RI/FS
Daily Weather Tracking Morning Report La Guardia, NY Kennedy Airport, NY Central Park, NY
Date: HourPrecip
Potential (%) HourPrecip Potential
(%) HourPrecip
Potential (%)Time: Date Date Date
7 7 7Actual Precipitation 8 8 8Field Office - Date of last significantsainfall event (greater than 0.1"): 9 9 9La Guardia - Date of last significant rainfall event (greater than 0.1"): 10 10 10Last 24 hours (Field Office): 11 11 11Last 24 hours (Central Park): 12 12 12Last 24 hours (La Quardia): 13 13 13Last 24 hours (Kennedy): 14 14 14
15 15 15Owls Head and Red Hook Pump Stations 17 17 17Owls Head WPCP average flow rate during last 24 hours (GPM): 18 18 18Owl's Head: Wet / Dry Flows during last 24 hours?: 19 19 19Red Hook WPCP average flow rate during last 24 hours (GPM): 20 20 20Red Hook: Wet / Dry Flows during last 24 hours?: 22 22 22
23 23 23Today's Tide Schedule Date Date DateLow Tide 1 - 1 1 1High Tide 1 2 2 2Low Tide 2 3 3 3High Tide 2 4 4 4
5 5 5Pump Station Updates (throughout the day as needed) 6 6 6
Afternoon Report La Guardia, NY Kennedy Airport, NY Central Park, NY
HourPrecip Potential (%) Hour
Precip Potential (%) Hour
Precip Potential (%)
Precipication During Last 8 hours (Field Office): Date Date Date15 15 15
Gowanus and Red Hook Pump Station 17 17 17Gowanus pump station average flow rate during last 8 hours (GPM): 18 18 18Wet / Dry Flows during last 8 hours?: 19 19 19Red Hook pump station average flow rate during last 8 hours (GPM): 20 20 20Wet / Dry Flows during last 8 hours?: 22 22 22
23 23 23 Date Date Date
0 0 01 1 12 2 23 3 34 4 45 5 56 6 67 7 78 8 89 9 910 10 1011 11 1112 12 1213 13 1314 14 1415 15 15
AM Forecast
PM Forecast


![[List University Name] Quality Assurance Program ... Assurance Foms/University... · [List University Name] Quality Assurance Program Description Document ... Quality Assurance Program](https://img.pdfslide.us/doc/110x75/5ab8c3d37f8b9aa6018d08ac/list-university-name-quality-assurance-program-assurance-fomsuniversitylist.jpg)