Embed Size (px)
Citation preview

ISO-NE PUBLIC
Fred Ninotti
NEPOOL Load Forecast Committee Teleconference
Draft Final 2018 CELT ISO-NE and States Annual Energy and Seasonal Peak Forecasts
M A R C H 2 8 , 2 0 1 8

ISO-NE PUBLIC
Outline
• Introduction / Overview
• Energy Forecast (Region and States)
• Summer Peak Demand Forecast (Region and States)
• Winter Peak Demand Forecast (Region and States)
• Next Steps
• Appendix (State Energy and Demand Tables)
2

ISO-NE PUBLIC 3
Introduction Explanation of Gross and Net Load Forecasts • The ISO annually develops 10-year forecasts of load that are published as part
of the Capacity, Energy, Loads, and Transmission (CELT) report; the ISO also publishes additional forecast information as part of the annual forecast process, which is made available at: https://www.iso-ne.com/system-planning/system-forecasting/load-forecast/
• ISO first develops “gross” load forecasts that reflect a forecast of load without reductions from passive demand resources (PDR) and behind-the-meter PV (BTM PV)
– PDR and BTM PV are reconstituted into historical hourly loads used to estimate gross load forecast models
– This ensures the proper accounting of PDR and BTM PV, which are both forecast separately
– Reconstitution also includes load reductions from active demand resources
• In this presentation, PDR will be referred to as energy efficiency (EE)
• “Net” load forecasts are developed by subtracting EE and BTM PV from the gross forecasts
– Historical net loads include reconstitution of load reductions from active demand resources only
– Net loads are intended to be representative of energy and loads observed in New England in real-time
ISO-NE PUBLIC 4
Introduction Categorization of Forecast Changes
• In general, changes reflected in the draft 2018 load forecast relative to the 2017 CELT can be divided into the following three components: 1. Gross load forecast updates:
a) Updated macroeconomic forecast from Moody’s b) Updated historical data used to estimate gross load forecasts
2. Changes to the EE forecast 3. Changes to the BTM PV forecast

ISO-NE PUBLIC 5
2018 Load Forecast Development Timeline • Activities completed to date:
– October 2017 – Received Moody’s Macroeconomic Forecast – November 2017 – Published Moody’s forecast to LFC website
• https://www.iso-ne.com/static-assets/documents/2017/11/econ_variable_comp_2017fcst_vs_2016fcst.xlsx – November 16, 2017 – Moody’s presentation at Planning Advisory Committee (PAC)
• https://www.iso-ne.com/static-assets/documents/2017/11/a3_moodys_2017_economic_update.pdf – December 13, 2017 – Moody’s forecast, draft energy forecast, 2017 summer peak review
• https://www.iso-ne.com/static-assets/documents/2017/12/2018_prelim_energy.pdf – February 7, 2018 – Draft of 2018 Annual Energy and Summer Peak Forecast presented to LFC
• https://www.iso-ne.com/static-assets/documents/2018/02/02.07.18.lfc.mtg.exhibit.pdf – March 15, 2018 – Draft 2018 CELT ISO-NE Annual Energy and Summer Peak Forecast
presented to PAC • https://www.iso-ne.com/static-assets/documents/2018/03/a3_draft_2018_celt_iso_ne_annual_energy_and_summer_peak_forecast.pdf
• LFC meetings – TODAY – 2018 CELT ISO-NE Annual Energy and Summer/Winter Peak Forecast, ISO-NE and
states – July 2018 – Summer LFC meeting (date TBD)
• PAC meetings – April 26, 2018
• May 1, 2018 – Final forecast published in 2018 CELT report

ISO-NE PUBLIC 6
2018 Gross Energy Forecast
• Energy models were estimated using annual energy from 1990-2017 (28 years)
• Energy models use the updated Moody’s macroeconomic forecast published in October 2017
• The energy forecast is an input into the peak demand forecast
• Regional forecast model details and statistics will be posted on the Load Forecast website – File will be named “2018 Regional and State Energy & Peak Model
Details.xlsx” and will be available at: https://www.iso-ne.com/system-planning/system-forecasting/load-forecast

ISO-NE PUBLIC 7
2018 Draft Peak Demand Forecast
• Same peak demand model structure as 2017 CELT forecast
• Regional peak demand model was estimated with daily peaks from January 1, 2003 to January 31, 2018 (15 years) – July and August are combined for summer seasonal peak models – December and January are combined for winter seasonal peak models
• Regional forecast model details and statistics will be posted on the Load Forecast website – Refer to slide 6 for link & filename

ISO-NE PUBLIC 8
Draft 2018 CELT Forecast Highlights • Compared to 2017 CELT forecasts, changes reflected in the draft
2018 CELT include: – Macroeconomic outlook forecasts approximately the same economic
growth in New England as last year
– Gross load forecasts: • Annual energy is approximately 0.3% higher in 2026 • Summer 50/50 is approximately 2.7% lower in 2026 • Summer 90/10 is approximately 2.8% lower in 2026
– The BTM PV forecast is approximately 0.4% lower in 2026
– The EE summer forecast is approximately 12.9% higher in 2026
– Net load forecasts • Annual energy forecast is approximately 3.7% lower in 2026 • Summer 50/50 forecast is approximately 5.4% lower in 2026 • Summer 90/10 forecast is approximately 5.3% lower in 2026

ISO-NE PUBLIC ISO-NE PUBLIC
GROSS AND NET ENERGY FORECASTS
New England and States
9

ISO-NE PUBLIC 10
ISO-NE Gross Energy - Historical and Forecast
2018 (+0.3%, +410 GWh) 2022 (+0.3%, +411 GWh) 2026 (+0.3%, +479 GWh)
100,000
110,000
120,000
130,000
140,000
150,000
160,000
1990
1991
1992
1993
1994
1995
1996
1997
1998
1999
2000
2001
2002
2003
2004
2005
2006
2007
2008
2009
2010
2011
2012
2013
2014
2015
2016
2017
2018
2019
2020
2021
2022
2023
2024
2025
2026
2027
GW
h
Historical Fcst_2018 CELT_2017

ISO-NE PUBLIC 11
Draft 2018 CELT ISO-NE Energy Forecast
100,000
110,000
120,000
130,000
140,000
150,000
160,000
2018 2019 2020 2021 2022 2023 2024 2025 2026 2027
GW
h
Gross Gross-BTM PV Net

ISO-NE PUBLIC 12
New England Forecast Comparison: Annual Energy Draft 2018 CELT and 2017 CELT
Year Gross BTM PV EE Net Gross BTM PV EE Net Gross BTM PV EE Net2018 142,488 2,162 16,074 124,252 142,078 2,373 13,279 126,426 410 -211 2,795 -2,1742019 143,820 2,558 18,764 122,498 143,447 2,800 14,911 125,736 373 -242 3,853 -3,2382020 144,634 2,906 21,332 120,395 144,611 3,133 17,038 124,440 23 -227 4,294 -4,0452021 146,009 3,233 23,827 118,949 145,799 3,381 19,441 122,977 210 -148 4,386 -4,0282022 147,538 3,540 26,128 117,870 147,127 3,609 21,659 121,859 411 -69 4,469 -3,9892023 149,100 3,834 28,228 117,039 148,507 3,830 23,683 120,994 593 4 4,545 -3,9552024 150,485 4,115 30,121 116,249 149,884 4,027 25,508 120,349 601 88 4,613 -4,1002025 151,766 4,361 31,811 115,594 151,233 4,185 27,137 119,911 533 176 4,674 -4,3172026 153,072 4,575 33,302 115,196 152,593 4,338 28,575 119,680 479 237 4,727 -4,4842027 154,364 4,783 34,601 114,981
Draft 2018 CELT (GWh) 2017 CELT (GWh) Change (GWh)

ISO-NE PUBLIC 13
Gross Energy - Historical and Forecast Massachusetts
2018 (+0.6%, +369 GWh) 2022 (+0.5%, +380 GWh) 2026 (+0.6%, +458 GWh)
40,000
45,000
50,000
55,000
60,000
65,000
70,000
75,000
80,000
1990
1992
1994
1996
1998
2000
2002
2004
2006
2008
2010
2012
2014
2016
2018
2020
2022
2024
2026
GWh
Historical Fcst_2018 CELT_2017

ISO-NE PUBLIC 14
Draft 2018 CELT Energy Forecast Massachusetts
40,000
45,000
50,000
55,000
60,000
65,000
70,000
75,000
80,000
2018 2019 2020 2021 2022 2023 2024 2025 2026 2027
GWh
Gross Gross-BTM PV Net

ISO-NE PUBLIC 15
Gross Energy - Historical and Forecast Connecticut
2018 (-0.5%, -185 GWh) 2022 (-0.5%, -173 GWh) 2026 (-0.6%, -223 GWh)
25,000
27,500
30,000
32,500
35,000
37,500
40,000
1990
1992
1994
1996
1998
2000
2002
2004
2006
2008
2010
2012
2014
2016
2018
2020
2022
2024
2026
GWh
Historical Fcst_2018 CELT_2017

ISO-NE PUBLIC 16
Draft 2018 CELT Energy Forecast Connecticut
25,000
27,500
30,000
32,500
35,000
37,500
40,000
2018 2019 2020 2021 2022 2023 2024 2025 2026 2027
GWh
Gross Gross-BTM PV Net

ISO-NE PUBLIC 17
Gross Energy - Historical and Forecast Maine
2018 (+0.9%, +110 GWh) 2022 (+0.7%, +90 GWh) 2026 (+1.1%, +157 GWh)
8,000
9,000
10,000
11,000
12,000
13,000
14,000
15,000
1990
1992
1994
1996
1998
2000
2002
2004
2006
2008
2010
2012
2014
2016
2018
2020
2022
2024
2026
GW
h
Historical Fcst_2018 CELT_2017

ISO-NE PUBLIC 18
Draft 2018 CELT Energy Forecast Maine
8,000
9,000
10,000
11,000
12,000
13,000
14,000
15,000
2018 2019 2020 2021 2022 2023 2024 2025 2026 2027
GWh
Gross Gross-BTM PV Net

ISO-NE PUBLIC 19
Gross Energy - Historical and Forecast New Hampshire
2018 (+0.0%, +2 GWh) 2022 (+0.3%, +38 GWh) 2026 (+0.4%, +57 GWh)
8,000
9,000
10,000
11,000
12,000
13,000
14,000
15,000
1990
1992
1994
1996
1998
2000
2002
2004
2006
2008
2010
2012
2014
2016
2018
2020
2022
2024
2026
GWh
Historical Fcst_2018 CELT_2017

ISO-NE PUBLIC 20
Draft 2018 CELT Energy Forecast New Hampshire
9,000
10,000
11,000
12,000
13,000
14,000
15,000
2018 2019 2020 2021 2022 2023 2024 2025 2026 2027
GWh
Gross Gross-BTM PV Net

ISO-NE PUBLIC 21
Gross Energy - Historical and Forecast Rhode Island
2018 (+0.7%, +682 GWh) 2022 (+0.2%, +21 GWh) 2026 (+0.1%, +10 GWh)
6,000
7,000
8,000
9,000
10,000
11,000
1990
1992
1994
1996
1998
2000
2002
2004
2006
2008
2010
2012
2014
2016
2018
2020
2022
2024
2026
GWh
Historical Fcst_2018 CELT_2017
ISO-NE PUBLIC 22
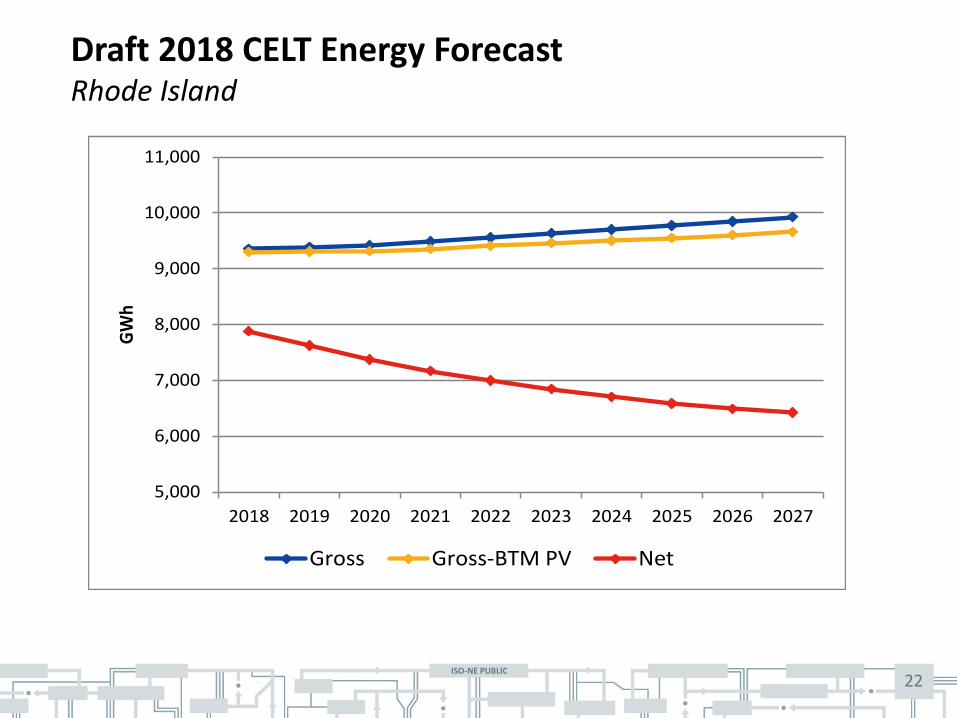
Draft 2018 CELT Energy Forecast Rhode Island
5,000
6,000
7,000
8,000
9,000
10,000
11,000
2018 2019 2020 2021 2022 2023 2024 2025 2026 2027
GWh
Gross Gross-BTM PV Net

ISO-NE PUBLIC 23
Gross Energy - Historical and Forecast Vermont
2018 (+0.7%, +47 GWh) 2022 (+0.8%, +55 GWh) 2026 (+0.3%, +20 GWh)
5,000
5,500
6,000
6,500
7,000
7,500
8,000
1990
1992
1994
1996
1998
2000
2002
2004
2006
2008
2010
2012
2014
2016
2018
2020
2022
2024
2026
GWh
Historical Fcst_2018 CELT_2017

ISO-NE PUBLIC 24
Draft 2018 CELT Energy Forecast Vermont
4,000
4,500
5,000
5,500
6,000
6,500
7,000
7,500
8,000
2018 2019 2020 2021 2022 2023 2024 2025 2026 2027
GWh
Gross Gross-BTM PV Net

ISO-NE PUBLIC ISO-NE PUBLIC
2018 SUMMER PEAK DEMAND FORECAST New England and States
25

ISO-NE PUBLIC 26
Draft 2018 CELT Gross Summer 50/50 Peak Demand Forecast New England
2018 (-1.3%, -394 MW) 2022 (-2.1%, -629 MW) 2026 (-2.7%, -863 MW)
22,000
24,000
26,000
28,000
30,000
32,000
34,000
2001
2002
2003
2004
2005
2006
2007
2008
2009
2010
2011
2012
2013
2014
2015
2016
2017
2018
2019
2020
2021
2022
2023
2024
2025
2026
2027
MW
Historical Fcst_2018 CELT 2017

ISO-NE PUBLIC 27
Draft 2018 CELT Summer 50/50 Peak Demand Forecast New England
22,000
24,000
26,000
28,000
30,000
32,000
34,000
36,000
2018 2019 2020 2021 2022 2023 2024 2025 2026 2027
MW
Gross Gross-BTM PV Net

ISO-NE PUBLIC 28
Draft 2018 CELT Summer 90/10 Peak Demand Forecast New England
22,000
24,000
26,000
28,000
30,000
32,000
34,000
36,000
2018 2019 2020 2021 2022 2023 2024 2025 2026 2027
MW
Gross Gross-BTM PV Net

ISO-NE PUBLIC 29
Draft 2018 CELT Summer BTM PV Forecast New England
0
200
400
600
800
1,000
1,200
2018 2019 2020 2021 2022 2023 2024 2025 2026 2027
MW
Red
uctio
n
FCST_2018 2017 CELT

ISO-NE PUBLIC 30
Draft 2018 CELT Summer EE Forecast New England
1,000
2,000
3,000
4,000
5,000
6,000
2018 2019 2020 2021 2022 2023 2024 2025 2026 2027
MW
Red
uctio
n
FCST_2018 2017 CELT
ISO-NE PUBLIC 31
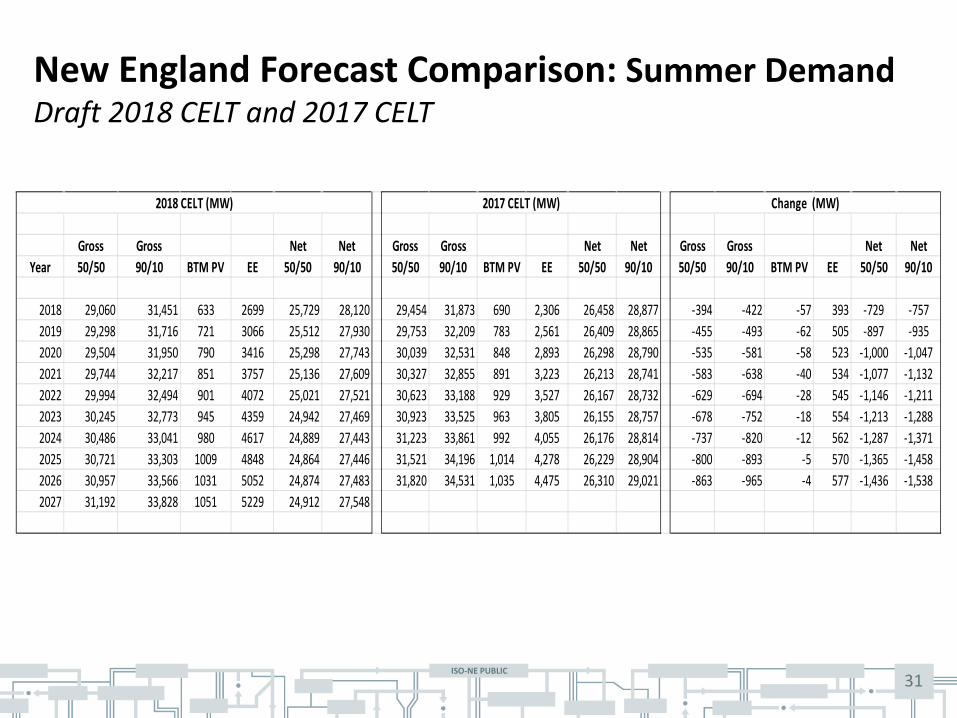
New England Forecast Comparison: Summer Demand Draft 2018 CELT and 2017 CELT
Gross Gross Net Net Gross Gross Net Net Gross Gross Net NetYear 50/50 90/10 BTM PV EE 50/50 90/10 50/50 90/10 BTM PV EE 50/50 90/10 50/50 90/10 BTM PV EE 50/50 90/10
2018 29,060 31,451 633 2699 25,729 28,120 29,454 31,873 690 2,306 26,458 28,877 -394 -422 -57 393 -729 -7572019 29,298 31,716 721 3066 25,512 27,930 29,753 32,209 783 2,561 26,409 28,865 -455 -493 -62 505 -897 -9352020 29,504 31,950 790 3416 25,298 27,743 30,039 32,531 848 2,893 26,298 28,790 -535 -581 -58 523 -1,000 -1,0472021 29,744 32,217 851 3757 25,136 27,609 30,327 32,855 891 3,223 26,213 28,741 -583 -638 -40 534 -1,077 -1,1322022 29,994 32,494 901 4072 25,021 27,521 30,623 33,188 929 3,527 26,167 28,732 -629 -694 -28 545 -1,146 -1,2112023 30,245 32,773 945 4359 24,942 27,469 30,923 33,525 963 3,805 26,155 28,757 -678 -752 -18 554 -1,213 -1,2882024 30,486 33,041 980 4617 24,889 27,443 31,223 33,861 992 4,055 26,176 28,814 -737 -820 -12 562 -1,287 -1,3712025 30,721 33,303 1009 4848 24,864 27,446 31,521 34,196 1,014 4,278 26,229 28,904 -800 -893 -5 570 -1,365 -1,4582026 30,957 33,566 1031 5052 24,874 27,483 31,820 34,531 1,035 4,475 26,310 29,021 -863 -965 -4 577 -1,436 -1,5382027 31,192 33,828 1051 5229 24,912 27,548
2018 CELT (MW) 2017 CELT (MW) Change (MW)

ISO-NE PUBLIC 32
Change in Summer Peak Net Load by Component Draft 2018 CELT and 2017 CELT
-1,000
-800
-600
-400
-200
0
200
2018 2019 2020 2021 2022 2023 2024 2025 2026
MW
Cha
nge
Gross Forecast Update BTM PV EE

ISO-NE PUBLIC 33
2018 (-0.3%, -41 MW) 2022 (-1.1%, -158 MW) 2026 (-1.8%, -272 MW)
2018 CELT Gross Summer 50/50 Peak Demand Forecast Massachusetts
10,000
11,000
12,000
13,000
14,000
15,000
16,000
2001
2002
2003
2004
2005
2006
2007
2008
2009
2010
2011
2012
2013
2014
2015
2016
2017
2018
2019
2020
2021
2022
2023
2024
2025
2026
MW
Historical Fcst_2018 CELT 2017

ISO-NE PUBLIC 34
Draft 2018 CELT Summer 50/50 Peak Demand Forecast Massachusetts
10,000
11,000
12,000
13,000
14,000
15,000
16,000
2018 2019 2020 2021 2022 2023 2024 2025 2026 2027
MW
Gross Gross-BTM PV Net

ISO-NE PUBLIC 35
Draft 2018 CELT Summer 90/10 Peak Demand Forecast Massachusetts
10,000
11,000
12,000
13,000
14,000
15,000
16,000
17,000
2018 2019 2020 2021 2022 2023 2024 2025 2026 2027
MW
Gross Gross-BTM PV Net

ISO-NE PUBLIC 36
2018 (-2.6%, -195 MW) 2022 (-3.0%, -237 MW) 2026 (-3.5%, -282 MW)
2017 CELT Gross Summer 50/50 Peak Demand Forecast Connecticut
6,000
6,500
7,000
7,500
8,000
8,500
2001
2002
2003
2004
2005
2006
2007
2008
2009
2010
2011
2012
2013
2014
2015
2016
2017
2018
2019
2020
2021
2022
2023
2024
2025
2026
2027
MW
Historical Fcst_2018 CELT 2017
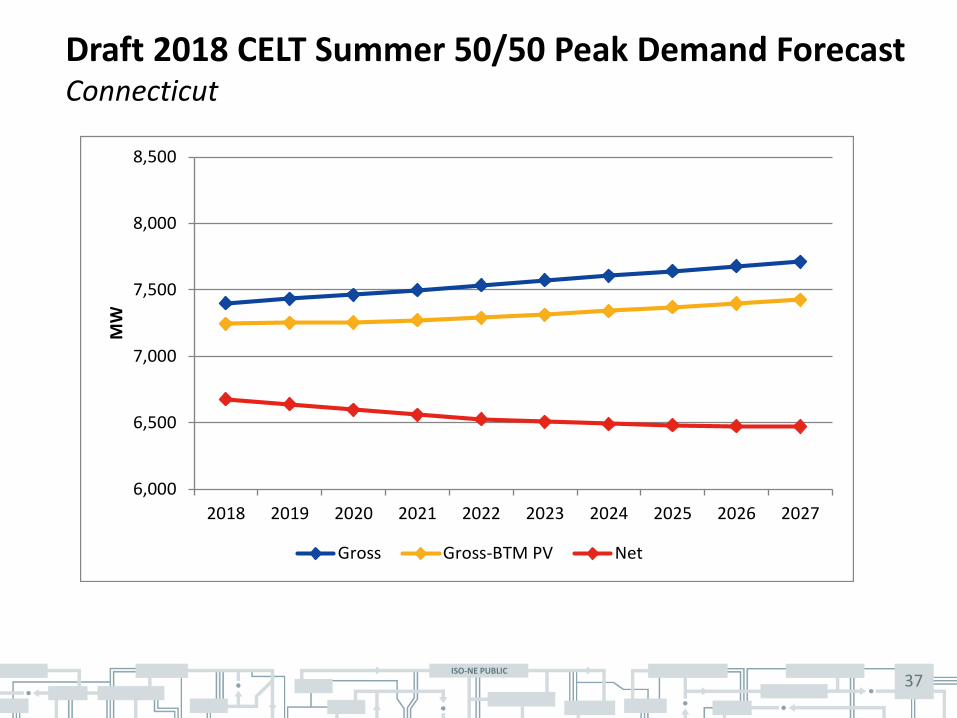
ISO-NE PUBLIC 37
Draft 2018 CELT Summer 50/50 Peak Demand Forecast Connecticut
6,000
6,500
7,000
7,500
8,000
8,500
2018 2019 2020 2021 2022 2023 2024 2025 2026 2027
MW
Gross Gross-BTM PV Net

ISO-NE PUBLIC 38
Draft 2018 CELT Summer 90/10 Peak Demand Forecast Connecticut
7,000
7,500
8,000
8,500
9,000
2018 2019 2020 2021 2022 2023 2024 2025 2026 2027
MW
Gross Gross-BTM PV Net

ISO-NE PUBLIC 39
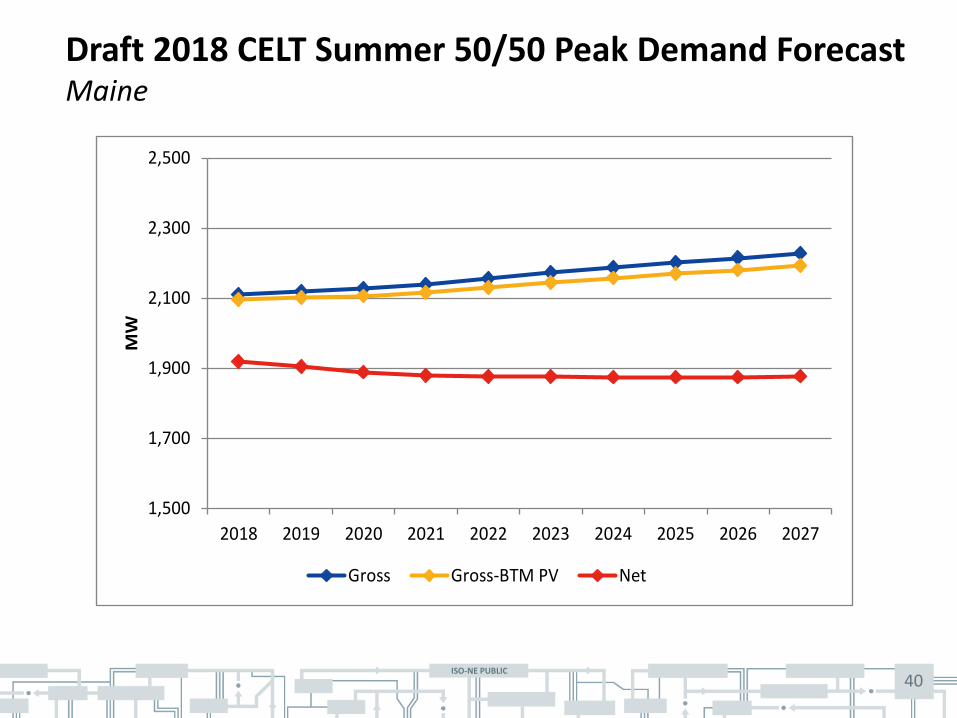
2018 (-2.3%, -49 MW) 2022 (-4.3%, -97 MW) 2026 (-5.7%, -134 MW)
2018 CELT Gross Summer 50/50 Peak Demand Forecast Maine
1,500
1,700
1,900
2,100
2,300
2,500
2001
2002
2003
2004
2005
2006
2007
2008
2009
2010
2011
2012
2013
2014
2015
2016
2017
2018
2019
2020
2021
2022
2023
2024
2025
2026
MW
Historical Fcst_2018 CELT 2017
ISO-NE PUBLIC 40
Draft 2018 CELT Summer 50/50 Peak Demand Forecast Maine
1,500
1,700
1,900
2,100
2,300
2,500
2018 2019 2020 2021 2022 2023 2024 2025 2026 2027
MW
Gross Gross-BTM PV Net

ISO-NE PUBLIC 41
Draft 2018 CELT Summer 90/10 Peak Demand Forecast Maine
1,700
1,900
2,100
2,300
2,500
2,700
2018 2019 2020 2021 2022 2023 2024 2025 2026 2027
MW
Gross Gross-BTM PV Net

ISO-NE PUBLIC 42
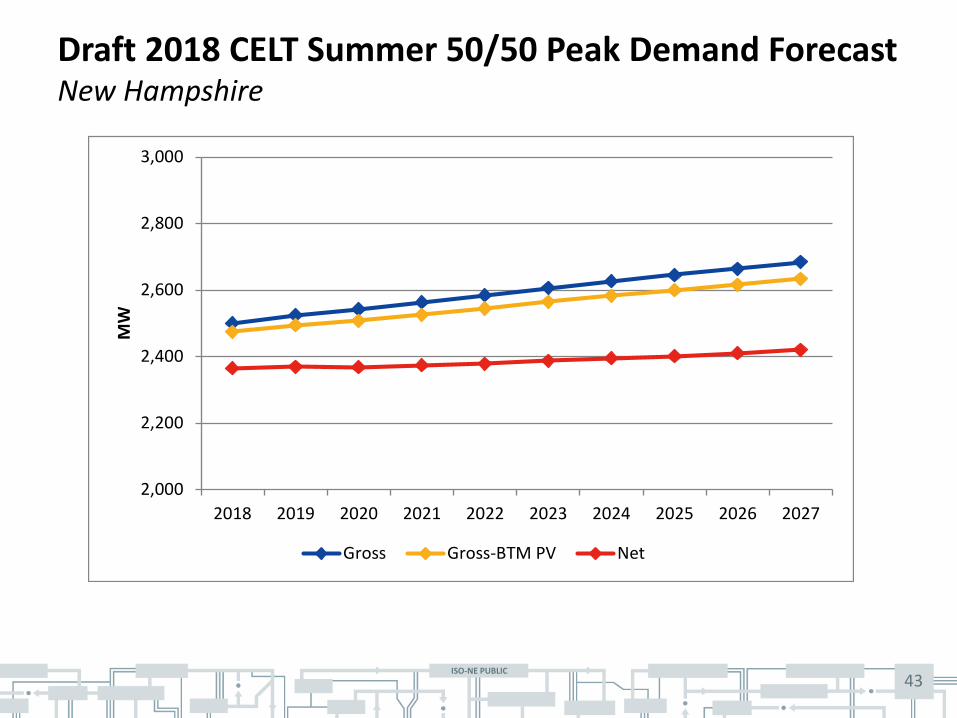
2018 (-4.2%, -110 MW) 2022 (-4.9%, -133 MW) 2026 (-5.6%, -158 MW)
2018 CELT Gross Summer 50/50 Peak Demand Forecast New Hampshire
2,000
2,200
2,400
2,600
2,800
3,000
2001
2002
2003
2004
2005
2006
2007
2008
2009
2010
2011
2012
2013
2014
2015
2016
2017
2018
2019
2020
2021
2022
2023
2024
2025
2026
MW
Historical Fcst_2018 CELT 2017
ISO-NE PUBLIC 43
Draft 2018 CELT Summer 50/50 Peak Demand Forecast New Hampshire
2,000
2,200
2,400
2,600
2,800
3,000
2018 2019 2020 2021 2022 2023 2024 2025 2026 2027
MW
Gross Gross-BTM PV Net

ISO-NE PUBLIC 44
Draft 2018 CELT Summer 90/10 Peak Demand Forecast New Hampshire
2,200
2,400
2,600
2,800
3,000
3,200
2018 2019 2020 2021 2022 2023 2024 2025 2026 2027
MW
Gross Gross-BTM PV Net

ISO-NE PUBLIC 45
2018 (1.0%, 20 MW) 2022 (0.6%, 14 MW) 2026 (0.4%, 9 MW)
2018 CELT Gross Summer 50/50 Peak Demand Forecast Rhode Island
1,500
1,750
2,000
2,250
2,500
2001
2002
2003
2004
2005
2006
2007
2008
2009
2010
2011
2012
2013
2014
2015
2016
2017
2018
2019
2020
2021
2022
2023
2024
2025
2026
MW
Historical Fcst_2018 CELT 2017

ISO-NE PUBLIC 46
Draft 2018 CELT Summer 50/50 Peak Demand Forecast Rhode Island
1,500
1,750
2,000
2,250
2,500
2018 2019 2020 2021 2022 2023 2024 2025 2026 2027
MW
Gross Gross-BTM PV Net

ISO-NE PUBLIC 47
Draft 2018 CELT Summer 90/10 Peak Demand Forecast Rhode Island
1,750
2,000
2,250
2,500
2,750
2018 2019 2020 2021 2022 2023 2024 2025 2026 2027
MW
Gross Gross-BTM PV Net

ISO-NE PUBLIC 48
2018 (-0.7%, -8 MW) 2022 (-1.4%, -16 MW) 2026 (-2.1%, -25 MW)
2018 CELT Gross Summer 50/50 Peak Demand Forecast Vermont
800
900
1,000
1,100
1,200
1,300
2001
2002
2003
2004
2005
2006
2007
2008
2009
2010
2011
2012
2013
2014
2015
2016
2017
2018
2019
2020
2021
2022
2023
2024
2025
2026
MW
Historical Fcst_2018 CELT 2017

ISO-NE PUBLIC 49
Draft 2018 CELT Summer 50/50 Peak Demand Forecast Vermont
700
800
900
1,000
1,100
1,200
1,300
2018 2019 2020 2021 2022 2023 2024 2025 2026 2027
MW
Gross Gross-BTM PV Net
ISO-NE PUBLIC 50
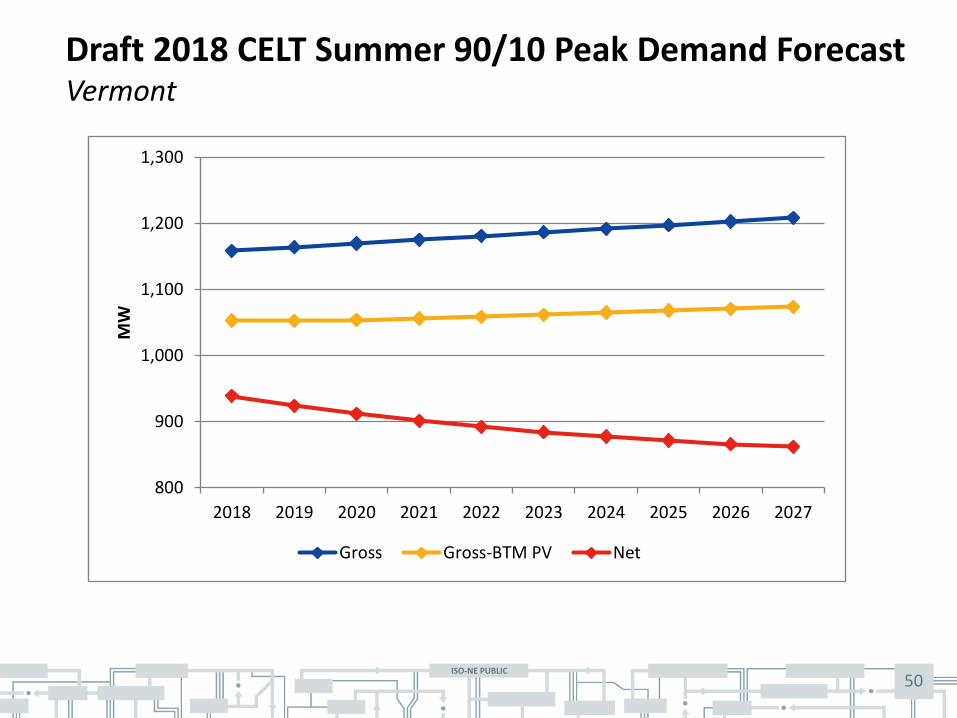
Draft 2018 CELT Summer 90/10 Peak Demand Forecast Vermont
800
900
1,000
1,100
1,200
1,300
2018 2019 2020 2021 2022 2023 2024 2025 2026 2027
MW
Gross Gross-BTM PV Net

ISO-NE PUBLIC ISO-NE PUBLIC
2018 WINTER PEAK DEMAND FORECAST New England and States
51

ISO-NE PUBLIC 52
2017 CELT Gross Winter 50/50 Peak Demand Forecast New England
2018 (-0.7%, -154 MW) 2022 (-1.0%, -241 MW) 2026 (-1.4%, -329 MW)
19,000
20,000
21,000
22,000
23,000
24,000
25,000
2002
2003
2004
2005
2006
2007
2008
2009
2010
2011
2012
2013
2014
2015
2016
2017
2018
2019
2020
2021
2022
2023
2024
2025
2026
2027
MW
Historical Fcst_2018 CELT 2017

ISO-NE PUBLIC 53
Draft 2018 CELT Winter 50/50 Peak Demand Forecast New England
17,000
18,000
19,000
20,000
21,000
22,000
23,000
24,000
25,000
2018 2019 2020 2021 2022 2023 2024 2025 2026 2027
MW
Gross Gross-BTM PV Net

ISO-NE PUBLIC 54
Draft 2018 CELT Winter 90/10 Peak Demand Forecast New England
18,000
19,000
20,000
21,000
22,000
23,000
24,000
25,000
26,000
2018 2019 2020 2021 2022 2023 2024 2025 2026 2027
MW
Gross Gross-BTM PV Net
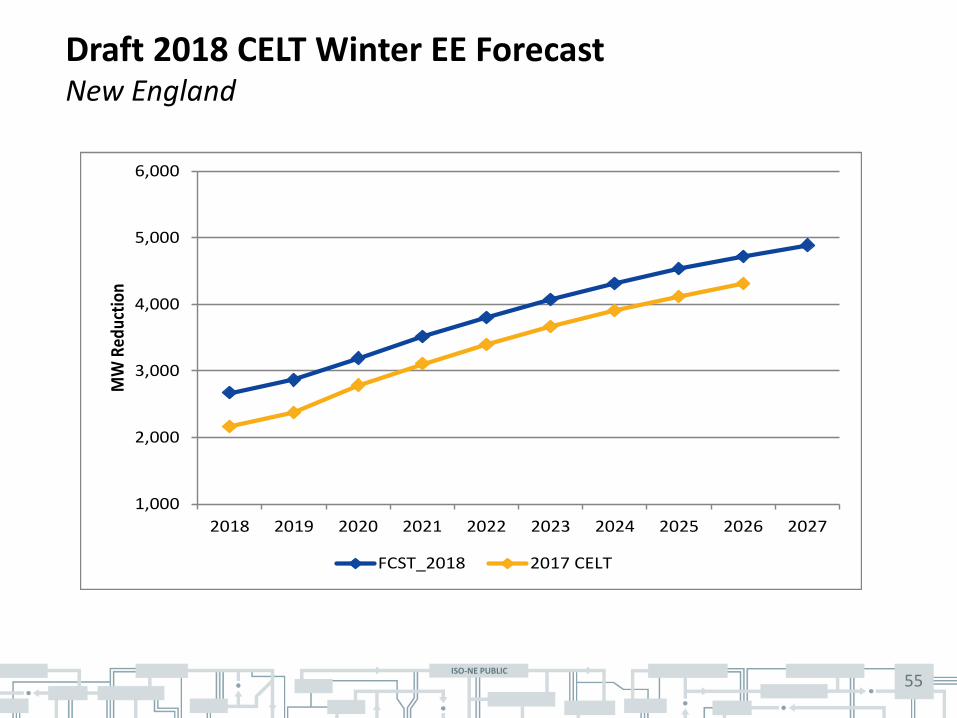
ISO-NE PUBLIC 55
Draft 2018 CELT Winter EE Forecast New England
1,000
2,000
3,000
4,000
5,000
6,000
2018 2019 2020 2021 2022 2023 2024 2025 2026 2027
MW
Red
uctio
n
FCST_2018 2017 CELT

ISO-NE PUBLIC 56
New England Forecast Comparison: Winter Demand Draft 2018 CELT and 2017 CELT
Gross Gross Net Net Gross Gross Net Net Gross Gross Net NetYear 50/50 90/10 BTM PV EE 50/50 90/10 50/50 90/10 BTM PV EE 50/50 90/10 50/50 90/10 BTM PV EE 50/50 90/10
2018 23,026 23,725 0 2669 20,357 21,057 23,180 23,878 0 2,171 21,009 21,707 -154 -153 0 498 -652 -6502019 23,138 23,837 0 2865 20,272 20,972 23,318 24,017 0 2,371 20,947 21,646 -180 -180 0 494 -675 -6742020 23,206 23,906 0 3194 20,012 20,712 23,436 24,135 0 2,788 20,648 21,347 -230 -229 0 406 -636 -6352021 23,322 24,021 0 3513 19,808 20,508 23,556 24,255 0 3,105 20,451 21,150 -234 -234 0 408 -643 -6422022 23,450 24,150 0 3808 19,642 20,342 23,691 24,389 0 3,398 20,293 20,991 -241 -239 0 410 -651 -6492023 23,581 24,281 0 4076 19,505 20,205 23,830 24,529 0 3,666 20,164 20,863 -249 -248 0 410 -659 -6582024 23,698 24,397 0 4318 19,380 20,079 23,970 24,668 0 3,907 20,063 20,761 -272 -271 0 411 -683 -6822025 23,805 24,505 0 4534 19,271 19,971 24,106 24,805 0 4,122 19,984 20,683 -301 -300 0 412 -713 -7122026 23,915 24,615 0 4725 19,190 19,890 24,244 24,942 0 4,312 19,932 20,630 -329 -327 0 413 -742 -7402027 24,024 24,723 0 4891 19,133 19,833
2018 CELT (MW) 2017 CELT (MW) Change (MW)

ISO-NE PUBLIC 57
Change in Winter Peak Net Load by Component Draft 2018 CELT and 2017 CELT
-600
-500
-400
-300
-200
-100
02018 2019 2020 2021 2022 2023 2024 2025 2026
MW
Cha
nge
Gross Forecast Update BTM PV EE

ISO-NE PUBLIC 58
2018 CELT Gross Winter 50/50 Peak Demand Forecast Massachusetts
2018 (-1.0%, -108 MW) 2022 (-1.6%, -178 MW) 2026 (-2.2%, -248 MW)
8,000
8,500
9,000
9,500
10,000
10,500
11,000
11,500
12,000
2001
2002
2003
2004
2005
2006
2007
2008
2009
2010
2011
2012
2013
2014
2015
2016
2017
2018
2019
2020
2021
2022
2023
2024
2025
2026
2027
MW
Historical Fcst_2018 CELT 2017

ISO-NE PUBLIC 59
Draft 2018 CELT Winter 50/50 Peak Demand Forecast Massachusetts
7,000
8,000
9,000
10,000
11,000
12,000
2018 2019 2020 2021 2022 2023 2024 2025 2026 2027
MW
Gross Gross-BTM PV Net

ISO-NE PUBLIC 60
Draft 2018 CELT Winter 90/10 Peak Demand Forecast Massachusetts
7,000
8,000
9,000
10,000
11,000
12,000
2018 2019 2020 2021 2022 2023 2024 2025 2026 2027
MW
Gross Gross-BTM PV Net

ISO-NE PUBLIC 61
2018 CELT Gross Winter 50/50 Peak Demand Forecast Connecticut
2018 (-1.6%, -93 MW) 2022 (-1.8%, -105 MW) 2026 (-2.2%, -129 MW)
4,500
4,750
5,000
5,250
5,500
5,750
6,000
6,250
6,500
2001
2002
2003
2004
2005
2006
2007
2008
2009
2010
2011
2012
2013
2014
2015
2016
2017
2018
2019
2020
2021
2022
2023
2024
2025
2026
2027
MW
Historical Fcst_2018 CELT 2017

ISO-NE PUBLIC 62
Draft 2018 CELT Winter 50/50 Peak Demand Forecast Connecticut
4,500
4,750
5,000
5,250
5,500
5,750
6,000
6,250
6,500
2018 2019 2020 2021 2022 2023 2024 2025 2026 2027
MW
Gross Gross-BTM PV Net

ISO-NE PUBLIC 63
Draft 2018 CELT Winter 90/10 Peak Demand Forecast Connecticut
4,500
4,750
5,000
5,250
5,500
5,750
6,000
6,250
6,500
2018 2019 2020 2021 2022 2023 2024 2025 2026 2027
MW
Gross Gross-BTM PV Net

ISO-NE PUBLIC 64
2018 CELT Gross Winter 50/50 Peak Demand Forecast Maine
2018 (+2.4%, +48 MW) 2022 (+2.8%, +57 MW) 2026 (+3.7%, +79 MW)
1,500
1,700
1,900
2,100
2,300
2,500
2001
2002
2003
2004
2005
2006
2007
2008
2009
2010
2011
2012
2013
2014
2015
2016
2017
2018
2019
2020
2021
2022
2023
2024
2025
2026
2027
MW
Historical Fcst_2018 CELT 2017
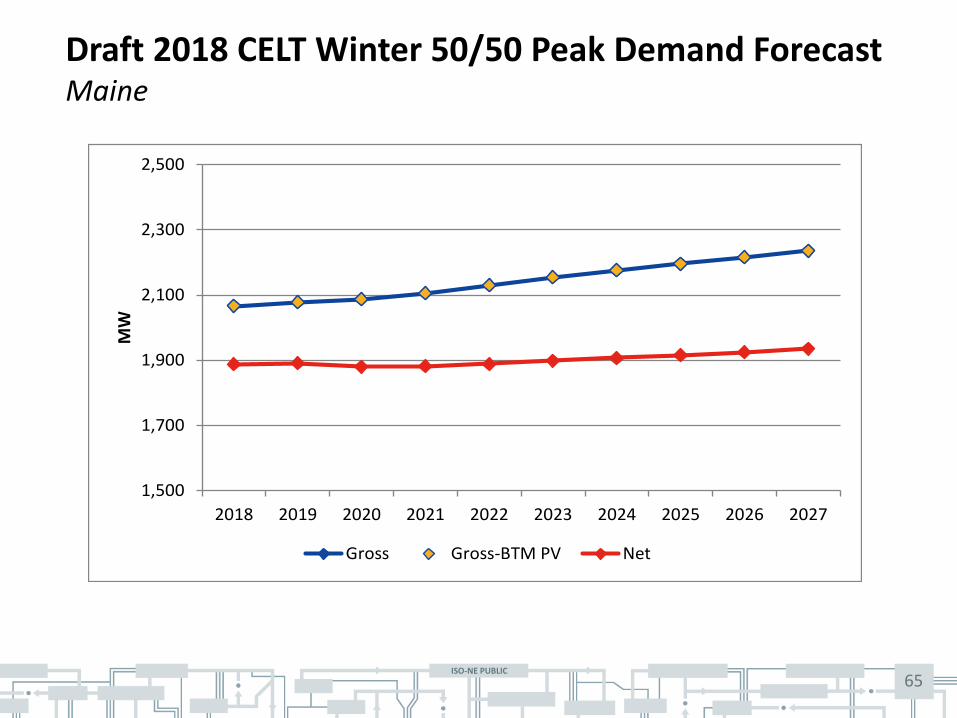
ISO-NE PUBLIC 65
Draft 2018 CELT Winter 50/50 Peak Demand Forecast Maine
1,500
1,700
1,900
2,100
2,300
2,500
2018 2019 2020 2021 2022 2023 2024 2025 2026 2027
MW
Gross Gross-BTM PV Net

ISO-NE PUBLIC 66
Draft 2018 CELT Winter 90/10 Peak Demand Forecast Maine
1,500
1,700
1,900
2,100
2,300
2,500
2018 2019 2020 2021 2022 2023 2024 2025 2026 2027
MW
Gross Gross-BTM PV Net

ISO-NE PUBLIC 67
2018 CELT Gross Winter 50/50 Peak Demand Forecast New Hampshire
2018 (-1.2%, -25 MW) 2022 (-1.4%, -30 MW) 2026 (-1.7%, -37 MW)
1,600
1,700
1,800
1,900
2,000
2,100
2,200
2,300
2,400
2001
2002
2003
2004
2005
2006
2007
2008
2009
2010
2011
2012
2013
2014
2015
2016
2017
2018
2019
2020
2021
2022
2023
2024
2025
2026
2027
MW
Historical Fcst_2018 CELT 2017

ISO-NE PUBLIC 68
Draft 2018 CELT Winter 50/50 Peak Demand Forecast New Hampshire
1,600
1,700
1,800
1,900
2,000
2,100
2,200
2,300
2,400
2018 2019 2020 2021 2022 2023 2024 2025 2026 2027
MW
Gross Gross-BTM PV Net

ISO-NE PUBLIC 69
Draft 2018 CELT Winter 90/10 Peak Demand Forecast New Hampshire
1,600
1,700
1,800
1,900
2,000
2,100
2,200
2,300
2,400
2018 2019 2020 2021 2022 2023 2024 2025 2026 2027
MW
Gross Gross-BTM PV Net

ISO-NE PUBLIC 70
2018 CELT Gross Winter 50/50 Peak Demand Forecast Rhode Island
2018 (+1.7%, +24 MW) 2022 (+1.2%, +17 MW) 2026 (+0.8%, +12 MW)
1,000
1,100
1,200
1,300
1,400
1,500
1,600
1,700
1,800
2001
2002
2003
2004
2005
2006
2007
2008
2009
2010
2011
2012
2013
2014
2015
2016
2017
2018
2019
2020
2021
2022
2023
2024
2025
2026
2027
MW
Historical Fcst_2018 CELT 2017

ISO-NE PUBLIC 71
Draft 2018 CELT Winter 50/50 Peak Demand Forecast Rhode Island
900
1,000
1,100
1,200
1,300
1,400
1,500
1,600
1,700
2018 2019 2020 2021 2022 2023 2024 2025 2026 2027
MW
Gross Gross-BTM PV Net

ISO-NE PUBLIC 72
Draft 2018 CELT Winter 90/10 Peak Demand Forecast Rhode Island
900
1,000
1,100
1,200
1,300
1,400
1,500
1,600
1,700
2018 2019 2020 2021 2022 2023 2024 2025 2026 2027
MW
Gross Gross-BTM PV Net

ISO-NE PUBLIC 73
2018 CELT Gross Winter 50/50 Peak Demand Forecast Vermont
2018 (+0.1%, +1 MW) 2022 (+0.2%, +2 MW) 2026 (-0.4%, -5 MW)
800
900
1,000
1,100
1,200
1,300
2001
2002
2003
2004
2005
2006
2007
2008
2009
2010
2011
2012
2013
2014
2015
2016
2017
2018
2019
2020
2021
2022
2023
2024
2025
2026
2027
MW
Historical Fcst_2018 CELT 2017

ISO-NE PUBLIC 74
Draft 2018 CELT Winter 50/50 Peak Demand Forecast Vermont
800
900
1,000
1,100
1,200
1,300
2018 2019 2020 2021 2022 2023 2024 2025 2026 2027
MW
Gross Gross-BTM PV Net
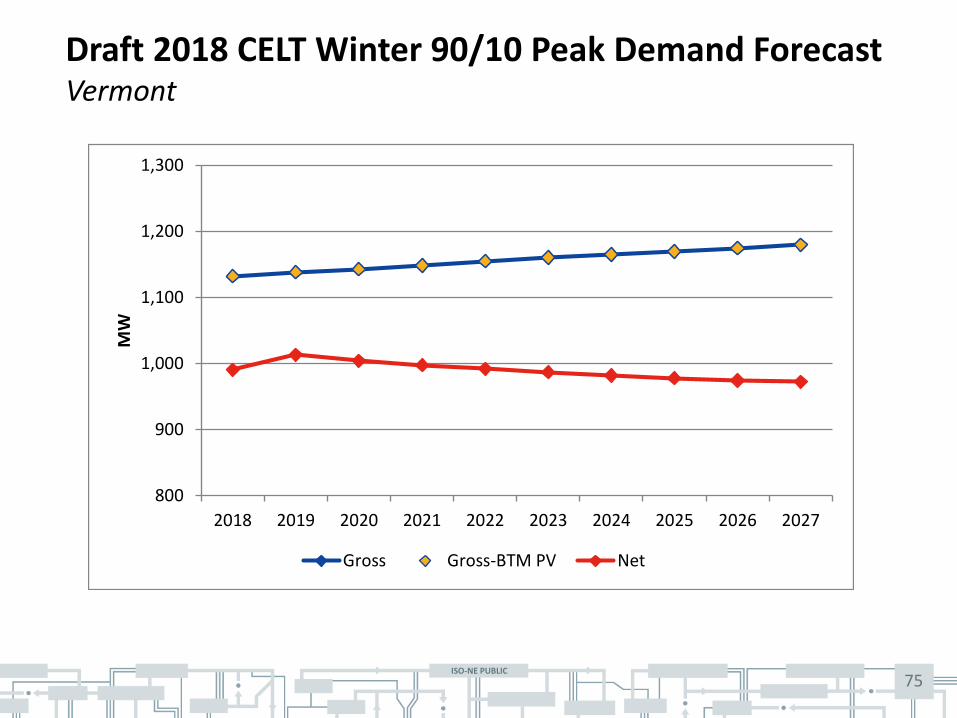
ISO-NE PUBLIC 75
Draft 2018 CELT Winter 90/10 Peak Demand Forecast Vermont
800
900
1,000
1,100
1,200
1,300
2018 2019 2020 2021 2022 2023 2024 2025 2026 2027
MW
Gross Gross-BTM PV Net

ISO-NE PUBLIC 76
Next Steps
• The final forecast will be published as part of the 2018 CELT by May 1st
• ISO encourages LFC members to suggest topics of interest for the summer LFC meeting in July

ISO-NE PUBLIC 77

ISO-NE PUBLIC ISO-NE PUBLIC
APPENDIX Energy and Demand Tables by State
78

ISO-NE PUBLIC 79
Massachusetts Forecast Comparison: Annual Energy Draft 2018 CELT and 2017 CELT
Year Gross BTM PV EE Net Gross BTM PV EE Net Gross BTM PV EE Net2018 66,532 1,085 8,640 56,807 66,163 1,262 7,017 57,884 369 -177 1,623 -1,0772019 67,347 1,272 10,374 55,701 66,996 1,434 7,941 57,621 351 -162 2,433 -1,9202020 67,891 1,418 12,005 54,468 67,706 1,557 9,269 56,880 185 -139 2,736 -2,4122021 68,675 1,556 13,522 53,596 68,400 1,677 10,716 56,007 274 -121 2,806 -2,4112022 69,527 1,691 14,918 52,919 69,147 1,793 12,046 55,308 380 -102 2,872 -2,3902023 70,401 1,824 16,186 52,391 69,919 1,906 13,255 54,758 482 -82 2,931 -2,3672024 71,196 1,960 17,327 51,909 70,691 1,997 14,342 54,352 505 -37 2,985 -2,4432025 71,935 2,070 18,340 51,525 71,453 2,051 15,308 54,094 483 19 3,032 -2,5692026 72,685 2,148 19,231 51,306 72,227 2,102 16,158 53,967 458 46 3,073 -2,6622027 73,422 2,222 20,006 51,193
Draft 2018 CELT (GWh) 2017 CELT (GWh) Change (GWh)

ISO-NE PUBLIC 80
Massachusetts Forecast Comparison: Summer Demand Draft 2018 CELT and 2017 CELT
Gross Gross Net Net Gross Gross Net Net Gross Gross Net NetYear 50/50 90/10 BTM PV EE 50/50 90/10 50/50 90/10 BTM PV EE 50/50 90/10 50/50 90/10 BTM PV EE 50/50 90/10
2018 13,836 14,951 316 1485 12,035 13,150 13,877 14,936 367 1,077 12,433 13,492 -41 15 -51 408 -398 -3422019 13,982 15,114 356 1726 11,900 13,032 14,056 15,133 400 1,233 12,423 13,500 -74 -19 -44 493 -523 -4682020 14,113 15,261 384 1952 11,777 12,925 14,225 15,321 421 1,388 12,416 13,512 -112 -60 -37 564 -639 -5872021 14,257 15,422 408 2163 11,687 12,851 14,392 15,506 442 1,533 12,417 13,531 -135 -84 -34 630 -730 -6802022 14,405 15,586 429 2356 11,620 12,801 14,563 15,696 462 1,669 12,432 13,565 -158 -110 -33 687 -812 -7642023 14,555 15,751 448 2532 11,575 12,771 14,736 15,887 480 1,795 12,461 13,612 -181 -136 -32 737 -886 -8412024 14,699 15,913 465 2690 11,544 12,757 14,909 16,079 492 1,913 12,504 13,674 -210 -166 -27 777 -960 -9172025 14,841 16,071 477 2831 11,533 12,762 15,081 16,269 497 2,022 12,562 13,750 -240 -198 -20 809 -1,029 -9882026 14,983 16,229 483 2955 11,546 12,792 15,255 16,462 501 2,123 12,631 13,838 -272 -233 -18 832 -1,085 -1,0462027 15,125 16,387 487 3062 11,576 12,838
2017 CELT (MW) Change (MW)2018 CELT (MW)

ISO-NE PUBLIC 81
Massachusetts Forecast Comparison: Winter Demand Draft 2018 CELT and 2017 CELT
Gross Gross Net Net Gross Gross Net Net Gross Gross Net NetYear 50/50 90/10 BTM PV EE 50/50 90/10 50/50 90/10 BTM PV EE 50/50 90/10 50/50 90/10 BTM PV EE 50/50 90/10
2018 10,652 10,973 0 1,502 9,150 9,471 10,760 11,086 0 1,153 9,607 9,933 -108 -113 0 349 -457 -4622019 10,723 11,044 0 1,626 9,097 9,418 10,853 11,178 0 1,272 9,581 9,906 -130 -134 0 354 -484 -4882020 10,771 11,092 0 1,840 8,931 9,252 10,931 11,257 0 1,547 9,384 9,710 -160 -165 0 293 -453 -4582021 10,838 11,159 0 2,038 8,800 9,121 11,007 11,333 0 1,742 9,265 9,591 -169 -174 0 296 -465 -4702022 10,911 11,232 0 2,221 8,690 9,011 11,089 11,415 0 1,921 9,168 9,494 -178 -183 0 300 -478 -4832023 10,985 11,307 0 2,387 8,599 8,920 11,174 11,500 0 2,084 9,090 9,416 -189 -193 0 303 -491 -4962024 11,053 11,374 0 2,536 8,517 8,839 11,259 11,585 0 2,231 9,028 9,354 -206 -211 0 305 -511 -5152025 11,116 11,437 0 2,668 8,448 8,769 11,343 11,668 0 2,361 8,982 9,307 -227 -231 0 307 -534 -5382026 11,180 11,502 0 2,785 8,395 8,717 11,428 11,753 0 2,475 8,953 9,278 -248 -251 0 310 -558 -5612027 11,243 11,564 0 2,886 8,357 8,678
2018 CELT (MW) 2017 CELT (MW) Change (MW)

ISO-NE PUBLIC 82
Connecticut Forecast Comparison: Annual Energy Draft 2018 CELT and 2017 CELT
Year Gross BTM PV EE Net Gross BTM PV EE Net Gross BTM PV EE Net2018 34,206 539 3,367 30,300 34,390 612 2,428 31,350 -185 -73 939 -1,0502019 34,412 657 3,663 30,093 34,587 789 2,970 30,828 -175 -132 693 -7352020 34,489 775 3,971 29,743 34,733 928 3,607 30,198 -244 -153 364 -4552021 34,707 886 4,358 29,462 34,909 995 4,038 29,876 -203 -109 320 -4142022 34,956 984 4,718 29,254 35,128 1,054 4,439 29,635 -173 -70 279 -3812023 35,209 1,069 5,048 29,091 35,359 1,112 4,807 29,440 -150 -43 241 -3492024 35,419 1,139 5,348 28,932 35,586 1,167 5,141 29,278 -167 -28 207 -3462025 35,604 1,202 5,616 28,786 35,802 1,221 5,440 29,141 -197 -19 176 -3552026 35,794 1,265 5,854 28,675 36,018 1,273 5,705 29,040 -223 -8 149 -3652027 35,981 1,325 6,063 28,593
Draft 2018 CELT (GWh) 2017 CELT (GWh) Change (GWh)

ISO-NE PUBLIC 83
Connecticut Forecast Comparison: Summer Demand Draft 2018 CELT and 2017 CELT
Gross Gross Net Net Gross Gross Net Net Gross Gross Net NetYear 50/50 90/10 BTM PV EE 50/50 90/10 50/50 90/10 BTM PV EE 50/50 90/10 50/50 90/10 BTM PV EE 50/50 90/10
2018 7,400 8,037 155 570 6,676 7,313 7,595 8,276 178 459 6,958 7,639 -195 -239 -23 111 -282 -3262019 7,435 8,076 182 612 6,642 7,283 7,639 8,327 221 533 6,885 7,573 -204 -251 -39 79 -243 -2902020 7,463 8,107 207 655 6,600 7,245 7,682 8,377 251 643 6,788 7,483 -219 -270 -44 12 -188 -2382021 7,499 8,146 229 710 6,559 7,207 7,727 8,429 262 702 6,763 7,465 -228 -283 -33 8 -204 -2582022 7,536 8,188 246 761 6,529 7,180 7,773 8,482 271 756 6,746 7,455 -237 -294 -25 5 -217 -2752023 7,574 8,229 259 808 6,507 7,162 7,820 8,536 280 807 6,733 7,449 -246 -307 -21 1 -226 -2872024 7,609 8,268 266 851 6,492 7,151 7,867 8,590 287 853 6,727 7,450 -258 -322 -21 -2 -235 -2992025 7,643 8,305 273 889 6,481 7,143 7,913 8,643 296 894 6,723 7,453 -270 -338 -23 -5 -242 -3102026 7,678 8,343 280 923 6,475 7,140 7,960 8,696 304 930 6,726 7,462 -282 -353 -24 -7 -251 -3222027 7,712 8,381 286 952 6,473 7,142
2017 CELT (MW) Change (MW)2018 CELT (MW)

ISO-NE PUBLIC 84
Connecticut Forecast Comparison: Winter Demand Draft 2018 CELT and 2017 CELT
Gross Gross Net Net Gross Gross Net Net Gross Gross Net NetYear 50/50 90/10 BTM PV EE 50/50 90/10 50/50 90/10 BTM PV EE 50/50 90/10 50/50 90/10 BTM PV EE 50/50 90/10
2018 5,669 5,842 0 511 5,158 5,331 5,762 5,950 0 423 5,339 5,527 -93 -108 0 88 -181 -1962019 5,682 5,855 0 550 5,132 5,305 5,777 5,965 0 495 5,282 5,470 -95 -110 0 55 -150 -1652020 5,686 5,859 0 590 5,096 5,269 5,788 5,976 0 634 5,154 5,342 -102 -117 0 -44 -58 -732021 5,699 5,872 0 639 5,059 5,233 5,802 5,990 0 692 5,110 5,298 -103 -118 0 -53 -51 -652022 5,714 5,887 0 685 5,029 5,202 5,819 6,007 0 746 5,073 5,261 -105 -120 0 -61 -44 -592023 5,729 5,902 0 727 5,002 5,175 5,838 6,026 0 796 5,042 5,230 -109 -124 0 -69 -40 -552024 5,741 5,915 0 766 4,976 5,149 5,857 6,045 0 841 5,016 5,204 -116 -130 0 -75 -40 -552025 5,752 5,925 0 800 4,952 5,125 5,874 6,062 0 881 4,993 5,181 -122 -137 0 -81 -41 -562026 5,763 5,936 0 830 4,933 5,106 5,892 6,080 0 917 4,975 5,163 -129 -144 0 -87 -42 -572027 5,774 5,947 0 857 4,917 5,090
2018 CELT (MW) 2017 CELT (MW) Change (MW)

ISO-NE PUBLIC 85
Maine Forecast Comparison: Annual Energy Draft 2018 CELT and 2017 CELT
Year Gross BTM PV EE Net Gross BTM PV EE Net Gross BTM PV EE Net2018 12,878 50 1,216 11,613 12,768 42 1,226 11,500 110 8 -10 1132019 12,976 63 1,377 11,536 12,885 51 1,263 11,571 91 12 114 -352020 13,042 77 1,529 11,437 13,003 60 1,178 11,765 40 17 351 -3282021 13,195 90 1,670 11,436 13,137 68 1,330 11,739 59 22 340 -3032022 13,380 102 1,800 11,478 13,291 76 1,469 11,746 90 26 331 -2672023 13,576 115 1,918 11,543 13,453 84 1,596 11,773 123 31 322 -2292024 13,749 127 2,024 11,598 13,611 92 1,710 11,809 138 35 314 -2112025 13,909 139 2,118 11,651 13,763 99 1,812 11,852 146 40 306 -2012026 14,067 152 2,201 11,715 13,910 107 1,901 11,902 157 45 300 -1882027 14,222 164 2,273 11,785
Draft 2018 CELT (GWh) 2017 CELT (GWh) Change (GWh)

ISO-NE PUBLIC 86
Maine Forecast Comparison: Summer Demand Draft 2018 CELT and 2017 CELT
Gross Gross Net Net Gross Gross Net Net Gross Gross Net NetYear 50/50 90/10 BTM PV EE 50/50 90/10 50/50 90/10 BTM PV EE 50/50 90/10 50/50 90/10 BTM PV EE 50/50 90/10
2018 2,111 2,244 15 176 1,921 2,054 2,168 2,308 12 181 1,975 2,115 -57 -64 3 -5 -54 -612019 2,120 2,254 18 197 1,905 2,039 2,187 2,328 14 183 1,990 2,131 -67 -74 4 14 -85 -922020 2,127 2,261 21 217 1,889 2,023 2,207 2,349 16 155 2,036 2,178 -80 -88 5 62 -147 -1552021 2,140 2,275 24 236 1,881 2,015 2,228 2,371 18 172 2,038 2,181 -88 -96 6 64 -157 -1662022 2,156 2,291 26 253 1,877 2,012 2,253 2,397 20 189 2,044 2,188 -97 -106 6 64 -167 -1762023 2,173 2,308 28 268 1,876 2,011 2,278 2,423 21 204 2,053 2,198 -105 -115 7 64 -177 -1872024 2,188 2,323 31 282 1,875 2,011 2,303 2,449 23 217 2,063 2,209 -115 -126 8 65 -188 -1982025 2,202 2,338 32 295 1,874 2,011 2,327 2,473 24 229 2,074 2,220 -125 -135 8 66 -200 -2092026 2,216 2,352 34 306 1,875 2,012 2,350 2,498 26 240 2,084 2,232 -134 -146 8 66 -209 -2202027 2,229 2,366 36 315 1,878 2,015
2017 CELT (MW) Change (MW)2018 CELT (MW)

ISO-NE PUBLIC 87
Maine Forecast Comparison: Winter Demand Draft 2018 CELT and 2017 CELT
Gross Gross Net Net Gross Gross Net Net Gross Gross Net NetYear 50/50 90/10 BTM PV EE 50/50 90/10 50/50 90/10 BTM PV EE 50/50 90/10 50/50 90/10 BTM PV EE 50/50 90/10
2018 2,067 2,125 0 179 1,888 1,946 2,019 2,075 0 171 1,848 1,904 48 50 0 8 40 422019 2,079 2,137 0 188 1,891 1,949 2,030 2,087 0 194 1,836 1,893 49 50 0 -6 55 562020 2,087 2,145 0 207 1,880 1,938 2,043 2,099 0 183 1,860 1,916 44 46 0 24 20 222021 2,106 2,164 0 224 1,882 1,940 2,056 2,113 0 198 1,858 1,915 50 51 0 26 24 252022 2,129 2,187 0 241 1,889 1,947 2,072 2,129 0 211 1,861 1,918 57 58 0 30 28 292023 2,154 2,212 0 255 1,899 1,957 2,089 2,146 0 224 1,865 1,922 65 66 0 31 34 352024 2,176 2,234 0 269 1,907 1,965 2,106 2,162 0 235 1,871 1,927 70 72 0 34 36 382025 2,196 2,254 0 281 1,915 1,974 2,121 2,178 0 246 1,875 1,932 75 76 0 35 40 422026 2,216 2,274 0 291 1,925 1,983 2,137 2,193 0 256 1,881 1,937 79 81 0 35 44 462027 2,235 2,293 0 300 1,935 1,993
2018 CELT (MW) 2017 CELT (MW) Change (MW)

ISO-NE PUBLIC 88
New Hampshire Forecast Comparison: Annual Energy Draft 2018 CELT and 2017 CELT
Year Gross BTM PV EE Net Gross BTM PV EE Net Gross BTM PV EE Net2018 12,559 88 634 11,837 12,557 93 583 11,881 1 -5 51 -442019 12,688 104 742 11,842 12,679 106 620 11,953 9 -2 122 -1112020 12,749 120 844 11,785 12,767 115 706 11,946 -18 5 138 -1612021 12,855 135 939 11,781 12,845 124 774 11,947 9 11 165 -1672022 12,971 150 1,027 11,794 12,933 132 839 11,962 38 18 188 -1682023 13,089 165 1,109 11,816 13,028 141 899 11,988 62 24 210 -1722024 13,189 180 1,183 11,826 13,122 149 953 12,020 67 31 230 -1942025 13,277 194 1,251 11,832 13,215 156 1,002 12,057 61 38 249 -2252026 13,368 208 1,310 11,849 13,311 164 1,046 12,101 57 44 264 -2512027 13,461 223 1,363 11,875
Draft 2018 CELT (GWh) 2017 CELT (GWh) Change (GWh)
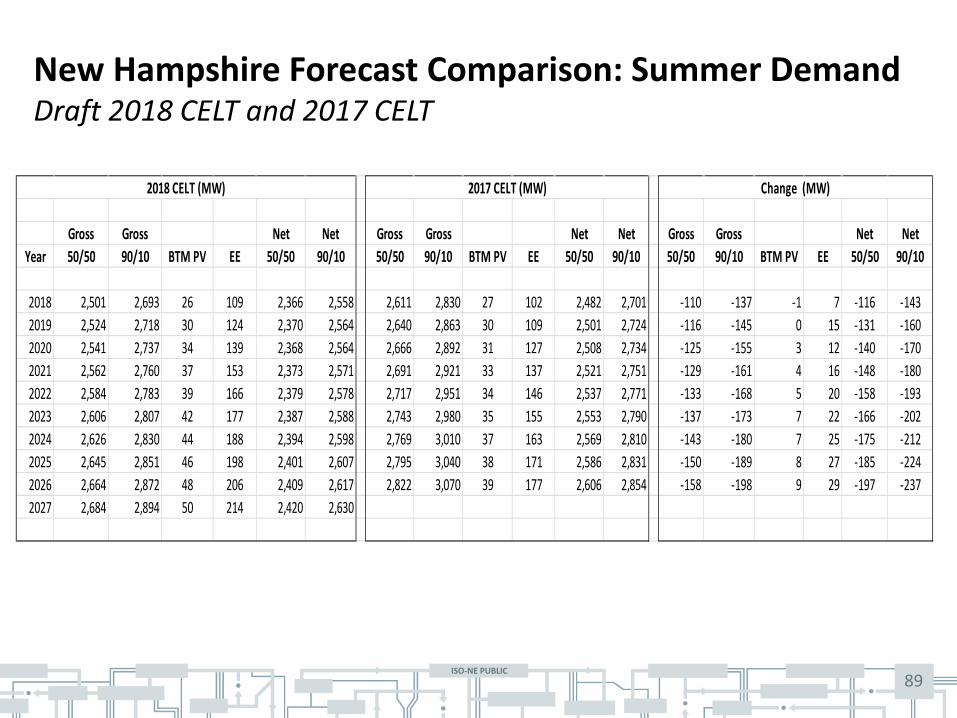
ISO-NE PUBLIC 89
New Hampshire Forecast Comparison: Summer Demand Draft 2018 CELT and 2017 CELT
Gross Gross Net Net Gross Gross Net Net Gross Gross Net NetYear 50/50 90/10 BTM PV EE 50/50 90/10 50/50 90/10 BTM PV EE 50/50 90/10 50/50 90/10 BTM PV EE 50/50 90/10
2018 2,501 2,693 26 109 2,366 2,558 2,611 2,830 27 102 2,482 2,701 -110 -137 -1 7 -116 -1432019 2,524 2,718 30 124 2,370 2,564 2,640 2,863 30 109 2,501 2,724 -116 -145 0 15 -131 -1602020 2,541 2,737 34 139 2,368 2,564 2,666 2,892 31 127 2,508 2,734 -125 -155 3 12 -140 -1702021 2,562 2,760 37 153 2,373 2,571 2,691 2,921 33 137 2,521 2,751 -129 -161 4 16 -148 -1802022 2,584 2,783 39 166 2,379 2,578 2,717 2,951 34 146 2,537 2,771 -133 -168 5 20 -158 -1932023 2,606 2,807 42 177 2,387 2,588 2,743 2,980 35 155 2,553 2,790 -137 -173 7 22 -166 -2022024 2,626 2,830 44 188 2,394 2,598 2,769 3,010 37 163 2,569 2,810 -143 -180 7 25 -175 -2122025 2,645 2,851 46 198 2,401 2,607 2,795 3,040 38 171 2,586 2,831 -150 -189 8 27 -185 -2242026 2,664 2,872 48 206 2,409 2,617 2,822 3,070 39 177 2,606 2,854 -158 -198 9 29 -197 -2372027 2,684 2,894 50 214 2,420 2,630
2017 CELT (MW) Change (MW)2018 CELT (MW)
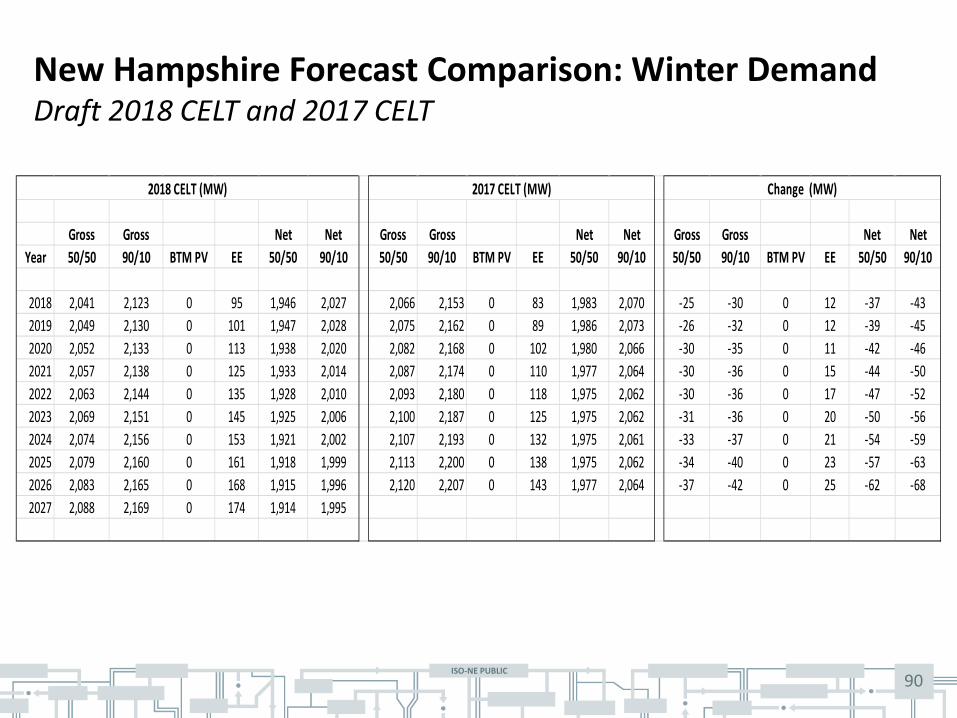
ISO-NE PUBLIC 90
New Hampshire Forecast Comparison: Winter Demand Draft 2018 CELT and 2017 CELT
Gross Gross Net Net Gross Gross Net Net Gross Gross Net NetYear 50/50 90/10 BTM PV EE 50/50 90/10 50/50 90/10 BTM PV EE 50/50 90/10 50/50 90/10 BTM PV EE 50/50 90/10
2018 2,041 2,123 0 95 1,946 2,027 2,066 2,153 0 83 1,983 2,070 -25 -30 0 12 -37 -432019 2,049 2,130 0 101 1,947 2,028 2,075 2,162 0 89 1,986 2,073 -26 -32 0 12 -39 -452020 2,052 2,133 0 113 1,938 2,020 2,082 2,168 0 102 1,980 2,066 -30 -35 0 11 -42 -462021 2,057 2,138 0 125 1,933 2,014 2,087 2,174 0 110 1,977 2,064 -30 -36 0 15 -44 -502022 2,063 2,144 0 135 1,928 2,010 2,093 2,180 0 118 1,975 2,062 -30 -36 0 17 -47 -522023 2,069 2,151 0 145 1,925 2,006 2,100 2,187 0 125 1,975 2,062 -31 -36 0 20 -50 -562024 2,074 2,156 0 153 1,921 2,002 2,107 2,193 0 132 1,975 2,061 -33 -37 0 21 -54 -592025 2,079 2,160 0 161 1,918 1,999 2,113 2,200 0 138 1,975 2,062 -34 -40 0 23 -57 -632026 2,083 2,165 0 168 1,915 1,996 2,120 2,207 0 143 1,977 2,064 -37 -42 0 25 -62 -682027 2,088 2,169 0 174 1,914 1,995
2018 CELT (MW) 2017 CELT (MW) Change (MW)

ISO-NE PUBLIC 91
Rhode Island Forecast Comparison: Annual Energy Draft 2018 CELT and 2017 CELT
Year Gross BTM PV EE Net Gross BTM PV EE Net Gross BTM PV EE Net2018 9,357 57 1,420 7,881 9,290 53 1,170 8,067 68 4 250 -1862019 9,390 83 1,687 7,620 9,347 75 1,311 7,961 43 8 376 -3412020 9,422 109 1,943 7,370 9,410 95 1,549 7,766 13 14 394 -3962021 9,488 132 2,186 7,170 9,472 110 1,737 7,625 15 22 449 -4562022 9,563 154 2,410 6,999 9,542 118 1,909 7,515 21 36 501 -5162023 9,636 177 2,615 6,845 9,611 124 2,064 7,423 25 53 551 -5792024 9,702 199 2,800 6,703 9,685 130 2,204 7,351 18 69 596 -6482025 9,771 221 2,966 6,584 9,760 137 2,327 7,296 11 84 639 -7122026 9,846 243 3,113 6,490 9,836 143 2,436 7,257 10 100 677 -7662027 9,926 264 3,241 6,420
Draft 2018 CELT (GWh) 2017 CELT (GWh) Change (GWh)

ISO-NE PUBLIC 92
Rhode Island Forecast Comparison: Summer Demand Draft 2018 CELT and 2017 CELT
Gross Gross Net Net Gross Gross Net Net Gross Gross Net NetYear 50/50 90/10 BTM PV EE 50/50 90/10 50/50 90/10 BTM PV EE 50/50 90/10 50/50 90/10 BTM PV EE 50/50 90/10
2018 2,099 2,367 16 245 1,838 2,106 2,079 2,338 15 204 1,860 2,119 20 29 1 41 -22 -132019 2,118 2,390 23 278 1,817 2,089 2,100 2,364 21 227 1,852 2,116 18 26 2 51 -35 -272020 2,137 2,414 29 311 1,797 2,074 2,122 2,391 26 267 1,829 2,098 15 23 3 44 -32 -242021 2,158 2,439 34 341 1,783 2,064 2,143 2,418 29 293 1,821 2,096 15 21 5 48 -38 -322022 2,179 2,464 39 369 1,771 2,056 2,165 2,445 30 317 1,818 2,098 14 19 9 52 -47 -422023 2,200 2,490 43 395 1,762 2,052 2,187 2,472 31 339 1,817 2,102 13 18 12 56 -55 -502024 2,220 2,515 47 418 1,755 2,050 2,209 2,499 32 358 1,819 2,109 11 16 15 60 -64 -592025 2,241 2,540 50 439 1,752 2,051 2,231 2,526 33 375 1,823 2,118 10 14 17 64 -71 -672026 2,262 2,566 54 457 1,751 2,054 2,253 2,553 34 391 1,828 2,128 9 13 20 66 -77 -742027 2,284 2,592 57 474 1,753 2,061
2017 CELT (MW) Change (MW)2018 CELT (MW)

ISO-NE PUBLIC 93
Rhode Island Forecast Comparison: Winter Demand Draft 2018 CELT and 2017 CELT
Gross Gross Net Net Gross Gross Net Net Gross Gross Net NetYear 50/50 90/10 BTM PV EE 50/50 90/10 50/50 90/10 BTM PV EE 50/50 90/10 50/50 90/10 BTM PV EE 50/50 90/10
2018 1,482 1,531 0 240 1,242 1,291 1,458 1,484 0 198 1,260 1,286 24 47 0 42 -18 52019 1,484 1,533 0 274 1,210 1,258 1,462 1,489 0 218 1,244 1,271 22 44 0 56 -34 -132020 1,486 1,535 0 306 1,180 1,229 1,468 1,494 0 268 1,200 1,226 18 41 0 38 -20 32021 1,491 1,539 0 336 1,155 1,203 1,473 1,499 0 295 1,178 1,204 18 40 0 41 -23 -12022 1,496 1,544 0 364 1,132 1,181 1,479 1,505 0 319 1,160 1,186 17 39 0 45 -28 -52023 1,501 1,549 0 389 1,112 1,160 1,484 1,511 0 341 1,143 1,170 17 38 0 48 -31 -102024 1,506 1,554 0 412 1,094 1,142 1,491 1,517 0 360 1,131 1,157 15 37 0 52 -37 -152025 1,510 1,559 0 432 1,078 1,126 1,497 1,523 0 378 1,119 1,145 13 36 0 54 -41 -192026 1,516 1,564 0 450 1,065 1,114 1,504 1,530 0 393 1,111 1,137 12 34 0 57 -46 -232027 1,521 1,570 0 466 1,055 1,103
2018 CELT (MW) 2017 CELT (MW) Change (MW)

ISO-NE PUBLIC 94
Vermont Forecast Comparison: Annual Energy Draft 2018 CELT and 2017 CELT
Year Gross BTM PV EE Net Gross BTM PV EE Net Gross BTM PV EE Net2018 6,956 345 797 5,815 6,910 311 855 5,744 47 34 -58 712019 7,007 380 922 5,706 6,953 345 806 5,802 55 35 116 -962020 7,040 408 1,040 5,593 6,992 377 729 5,886 48 31 311 -2932021 7,090 434 1,151 5,505 7,035 407 847 5,781 55 27 304 -2762022 7,140 459 1,255 5,426 7,085 435 958 5,692 55 24 297 -2672023 7,188 484 1,351 5,353 7,137 464 1,062 5,611 51 20 289 -2582024 7,230 510 1,439 5,281 7,189 492 1,158 5,539 40 18 281 -2582025 7,270 535 1,519 5,216 7,240 521 1,248 5,471 30 14 271 -2552026 7,311 559 1,592 5,160 7,291 549 1,330 5,412 20 10 262 -2522027 7,353 584 1,654 5,115
Draft 2018 CELT (GWh) 2017 CELT (GWh) Change (GWh)

ISO-NE PUBLIC 95
Vermont Forecast Comparison: Summer Demand Draft 2018 CELT and 2017 CELT
Gross Gross Net Net Gross Gross Net Net Gross Gross Net NetYear 50/50 90/10 BTM PV EE 50/50 90/10 50/50 90/10 BTM PV EE 50/50 90/10 50/50 90/10 BTM PV EE 50/50 90/10
2018 1,113 1,159 105 114 894 940 1,121 1,166 90 126 905 950 -8 -7 15 -12 -11 -102019 1,118 1,165 112 129 878 925 1,128 1,174 96 120 912 958 -10 -9 16 9 -34 -332020 1,123 1,170 116 142 865 912 1,134 1,182 102 98 934 982 -11 -12 14 44 -69 -702021 1,128 1,176 119 155 854 902 1,141 1,190 107 112 922 971 -13 -14 12 43 -68 -692022 1,133 1,182 122 167 844 893 1,149 1,198 112 125 912 961 -16 -16 10 42 -68 -682023 1,138 1,187 125 178 836 885 1,156 1,206 117 137 902 952 -18 -19 8 41 -66 -672024 1,143 1,193 127 187 828 878 1,163 1,214 121 149 893 944 -20 -21 6 38 -65 -662025 1,148 1,198 129 197 822 872 1,170 1,223 126 160 884 937 -22 -25 3 37 -62 -652026 1,153 1,204 132 205 816 867 1,178 1,231 131 169 878 931 -25 -27 1 36 -62 -642027 1,158 1,209 134 212 812 863
2017 CELT (MW) Change (MW)2018 CELT (MW)

ISO-NE PUBLIC 96
Vermont Forecast Comparison: Winter Demand Draft 2018 CELT and 2017 CELT
Gross Gross Net Net Gross Gross Net Net Gross Gross Net NetYear 50/50 90/10 BTM PV EE 50/50 90/10 50/50 90/10 BTM PV EE 50/50 90/10 50/50 90/10 BTM PV EE 50/50 90/10
2018 1,115 1,132 0 142 973 990 1,113 1,130 0 119 994 1,011 2 2 0 23 -21 -212019 1,121 1,139 0 125 995 1,013 1,118 1,136 0 114 1,004 1,022 3 3 0 11 -9 -92020 1,125 1,143 0 139 986 1,004 1,123 1,141 0 98 1,025 1,043 2 2 0 41 -39 -392021 1,131 1,149 0 151 980 998 1,129 1,146 0 112 1,017 1,034 2 3 0 39 -37 -362022 1,137 1,155 0 163 974 992 1,135 1,153 0 125 1,010 1,028 2 2 0 38 -36 -362023 1,142 1,160 0 173 969 987 1,142 1,160 0 137 1,005 1,023 0 0 0 36 -36 -362024 1,147 1,165 0 183 964 982 1,149 1,166 0 149 1,000 1,017 -2 -1 0 34 -36 -352025 1,152 1,170 0 192 960 978 1,156 1,173 0 160 996 1,013 -4 -3 0 32 -36 -352026 1,157 1,175 0 200 957 974 1,162 1,180 0 169 993 1,011 -5 -5 0 31 -36 -372027 1,162 1,179 0 207 955 972
2018 CELT (MW) 2017 CELT (MW) Change (MW)