Embed Size (px)
Citation preview
1This document was formerly titled Draft Region 4 Approach to Natural Attenuation of Chlorinated Solvents
11/18/00(4:57PM)C:\kay\r4mna.wpd;version 3.0
Draft EPA Region 4 Suggested Practices for Evaluation of a Site For NaturalAttenuation (Biological Degradation) of Chlorinated Solvents1
November, 1999http://www.epa.gov/region4/
Version 3.1
21/18/00(4:57PM)C:\kay\r4mna.wpd;version 3.0
Table of Contents
Overview of the Technical Protocol ........................................................ Page 5
Overview of Chlorinated Aliphatic Hydrocarbon Biodegradation ............ Page 7
Mechanisms of Chlorinated Aliphatic Hydrocarbon Biodegradation ...... Page 8
Behavior of Chlorinated Solvent Plumes ................................................. Page 9
Protocol for Quantifying Biological Degradation During the RemedialInvestigation Process .............................................................................. Page 10
Determining Whether Biodegradation is Occurring ...................... Page 13
Groundwater Characterization ...................................................... Page 18
Refine the Conceptual Model, Complete Premodeling Calculations, and Document Indicators of Biological Degradation ..................................... Page 21
References ............................................................................................. Page 23
Appendix ................................................................................................. Page 27
2This document was formerly titled Draft Region 4 Approach to Natural Attenuation of Chlorinated Solvents
3Air Force Center for Environmental Excellence
31/18/00(4:57PM)C:\kay\r4mna.wpd;version 3.0
Draft EPA Region 4 Suggested Practices for Evaluation of a Site For NaturalAttenuation (Biological Degradation) of Chlorinated Solvents2
This document is an amalgamation of technical information obtained from the Draft AFCEE3 Protocolfor Evaluation of Natural Attenuation of Chlorinated
Solvents in Ground Water, articles in professional journals, and meeting presentations by experts inthe field (see references).
Preface
The intent of this document is to provide a resource for the characterization of sites where natural attenuation(biological degradation) is being proposed or considered. Region 4 wishes to specify that the Draft InterimFinal OSWER Directive on Monitored Natural Attenuation (OSWER Directive 9200.4-17 available on the webat http://www.epa.gov/swerust1/directiv/d9200417.htm). The Directive is a complement to thisdocument. The hope within EPA nationwide is that a guidance document will be put forth from EPA’s Office ofResearch and Development that will also compliment or supersede this document. This document is nowavailable at ftp://ftp.epa.gov/pub/ada/reports/protocol.pdf
The Draft EPA Region 4 Suggested Practices for Evaluation of a Site for Natural Attenuation (BiologicalDegradation) of Chlorinated Solvents is being provided by U.S. EPA Region 4 in DRAFT form due to theevolving nature of the research being performed in labs and on sites on the biological degradation ofchlorinated solvents in ground water. In addition, on sites where natural attenuation is being implementedand/or considered, site characterization methods, analytical methods and sampling techniques are changingrapidly. The site characterization for karst and fractured rock would be subject to additional requirements.
At a minimum U.S. EPA Region 4 expects the following in a natural attenuation demonstration report: 1) a sitecharacterization presented and supported, 2) remedial action for the ‘source’ to be provided 3) a long termmonitoring (including O&M) plan provided, 4) a comparison of the natural attenuation remedy (if this is anappropriate determination for the site) to an engineered remedy, 5) the enumeration of institutional controls thatare currently operational and enforceable for the site and 6) determination of the carbon source and it’ssustainability for chlorinated solvent degradation.
If you have comments or questions concerning this document contact Kay Wischkaemper at 404-562-8641 [email protected]. The web page location ishttp://www.epa.gov/region4/wastepgs/oftecser/protoexp.pdf.
Introduction
Region 4 acknowledges that natural attenuation due to advection, adsorption, biological degradation,dispersion, and volatilization can effectively reduce contaminant toxicity, mobility, or volume to levels that areprotective of human health and the ecosystem. Natural attenuation in conjunction with source treatment can bethe sole remedial alternative for many sites in Region 4. The framework behind the evaluation requirements inthis document are The National Contingency Plan (NCP) citations which are the basis for Natural Attenuationremedy selections made in EPA Region 4.
‘...Natural attenuation is generally recommended only when active restoration is not
41/18/00(4:57PM)C:\kay\r4mna.wpd;version 3.0
practicable, cost effective or warranted because of site-specific conditions (e.g.,Class III ground water or ground water which is unlikely to be used in the foreseeablefuture and there fore can be remediated over an extended period of time) or wherenatural attenuation is expected to reduce the concentration of contaminants in theground water to the remediation goals-levels determined to be protective of humanhealth and sensitive ecological environments--in a reasonable time-frame. Further,in situations where there would be little likelihood of exposure due to the remotenessof the site, alternate points of compliance may be considered, providedcontamination in the aquifer is controlled from further migrations. Theselection of natural attenuation by EPA does not mean that the ground water hasbeen written off and not cleaned up but rather that biodegradation, dispersion,dilution, and adsorption will effectively reduce contaminants in the ground water toconcentrations protective of human health in a time frame comparable to that whichcould be achieved through active restoration (p.8734).
Another NCP citation stating EPA’s position on ground water that is not a current source of drinking water buthas the ability to be used for drinking water purposes is:
...It is EPA policy to consider the beneficial use of the water and to protect againstcurrent and future exposures. Ground water is a valuable resource and should beprotected and restored if necessary and practicable...(p. 8733)
The expectation of EPA in the above citations is that ground water will be restored and when naturalattenuation and source treatment are determined to be the appropriate remedial alternative, or part of aremedial alternative for site ground water, the following provisions are understood.
C Measures are taken to “cut off” continued addition of contaminants to ground water and controlmigration of contaminants in ground water. This embodies removing, remediating, and/or containingthe source (see NCP and OSWER Directive No. 9283.1-2).
C All portions of the plume within the area of attainment shall be remediated to the ground waterprotection standard’s which are MCL’s, non-zero MCLG’s and health-based standards for current andpotential sources of drinking water. An onsite (within the site property boundary) downgradientcompliance boundary will be established beyond which accepted limits cannot be exceeded so thatfurther degradation of large expanses of uncontaminated ground water will be prevented. In otherwords, the condition in which the property boundary is at a significant distance from the plume thecompliance boundary must be located near the existing terminus of the plume. Additionally the area ofcontamination that exceeds the standards may not be allowed to increase prior to attenuation ordischarge into surface water (see NCP and OSWER Directive No. 9283.1-2).
Institutional controls are required to ensure that such ground waters are not used before levels protective ofhuman health are reached. On DOE and some DoD sites the enforceable institutional control issue is moreeasily provided for; whereas on RCRA and CERCLA sites this poses a considerable problem.
Another issue that is of concern regulatorily is the condition where plume ‘starvation’ occurs. In short, this iswhere the carbon source necessary for biological degradation of chlorinated solvents runs out and the plume isback to the concentrations that could exceed the ground water protection standards. This ‘starvation’ issueforces the need for identifying what that carbon source is and making a prediction about the ability of thecarbon source to sustain biological degradation of the solvent plume. When identifying the carbon source isnot possible, then long term monitoring will be the sole method of ensuring that biological degradation willcontinue until the contaminant concentrations are below the ground water protection standard. This poses aproblem with predicting the length of time for biological degradation to occur and the ultimate cost of usingintrinsic degradation as part of the final remedial alternative.
The U.S. Environmental Protection Agency's (EPA) Office of Research and Development and Office of SolidWaste and Emergency Response define natural attenuation as:
The biodegradation, dispersion, dilution, sorption, volatilization, and/or chemical and biochemical stabilization of contaminants to effectively reduce contaminant toxicity, mobility, or volume to
51/18/00(4:57PM)C:\kay\r4mna.wpd;version 3.0
levels that are protective of human health and the ecosystem.
Natural attenuation processes, such as biodegradation, can often be dominant factors in the fate and transportof contaminants. Thus, consideration and quantification of biodegradation processes is essential to morethoroughly understand contaminant fate and transport.
This paper presents suggested practices for data collection and analysis for the evaluation of a remedial optionof natural attenuation (through biological degradation processes). In some cases, the information collectedusing this protocol will show that natural attenuation processes, with or without source removal, will reduce theconcentrations of these contaminants to below risk-based corrective action criteria or will attain regulatorystandards within an acceptable, site-specific time period.
Overview of the Technical Protocol
Natural attenuation in ground-water systems results from the integration of several subsurface attenuationmechanisms that are classified as either destructive or nondestructive. Biodegradation is the most importantdestructive attenuation mechanism. Nondestructive attenuation mechanisms include sorption, dispersion,dilution from recharge, and volatilization.
Biodegradation of fuel hydrocarbons, especially benzene, toluene, ethyl benzene, and xylenes (BTEX), ismainly limited by electron acceptor availability, and biodegradation of these compounds generally will proceeduntil all of the contaminants are destroyed. In the experience of many researchers, there appears to be aninexhaustible supply of electron acceptors in most, if not all, hydrogeologic environments. On the other hand,the more highly chlorinated solvents (e.g., perchloroethene and trichloroethene) typically are biodegradedunder natural conditions via reductive dechlorination, a process that requires both electron acceptors (thechlorinated aliphatic hydrocarbons) and an adequate supply of electron donors. Electron donors include fuelhydrocarbons or other types of anthropogenic carbon (e.g., landfill leachate, BTEX, or natural organic carbon). If the subsurface environment is depleted of electron donors before the chlorinated aliphatic hydrocarbons areremoved, reductive dechlorination will cease, and natural attenuation may no longer be protective of humanhealth and the environment. The need for adequate electron donors is the most significant difference betweenthe processes of fuel hydrocarbon and chlorinated aliphatic hydrocarbon biodegradation. For this reason, it ismore difficult to predict the long-term behavior of chlorinated aliphatic hydrocarbon plumes than fuelhydrocarbon plumes. Thus, it is important to have a thorough understanding of the operant natural attenuationmechanisms.
In addition to having a better understanding of the processes of advection, dispersion, dilution from recharge,and sorption, it is necessary to better quantify biodegradation. Quantification of biodegradation requires a thor-ough understanding of the interactions between chlorinated aliphatic hydrocarbons, anthropogenic/naturalcarbon, and inorganic electron acceptors at the site. Detailed site characterization is required to adequatelyunderstand these processes.
The proponent must scientifically demonstrate that biodegradation of site contaminants is occurring at ratessufficient to be protective of human health and the environment in order to support remediation by naturalattenuation. Three lines of evidence can be used to support biological degradation of chlorinated solvents:
1. Observed reduction in contaminant concentrations along the flow path downgradient from thesource of contamination;
2. Documented loss of contaminant mass at the field scale:
- Using chemical and geochemical analytical data (e.g., decreasing parent compoundconcentrations, increasing daughter compound concentrations, depletion of electronacceptors and donors, and increasing metabolic byproduct concentrations);
- A conservative tracer and a rigorous estimate of residence time along the flow path todocument contaminant mass reduction and to calculate biological decay rates at thefield scale.
4Microcosm studies are strongly influenced by the nature of the geologic material submitted forstudy, the physical properties of the microcosm, the sampling strategy, and the duration of the study. Noted here is that some researchers feel that microcosm studies for low levels of contamination aredifficult to perform. In some cases the microcosm is ‘killed’ prior to any data being obtained to evaluaterate constants. Some researchers feel that rate constants obtained from microcosm studies aresignificant underestimates of actual conditions and therefore in some cases are not useful. In othercases microcosm studies are a productive tool with the following stipulation: if additional evidence(beyond contaminant and geochemical data and supporting calculations) supporting biologicaldegradation is required, a microcosm study using site-specific aquifer materials and contaminants can beundertaken. An overall suggestion is that because microcosm studies are time-consuming andexpensive, they should be undertaken only at sites where there is considerable uncertainty concerningthe biodegradation of contaminants.
61/18/00(4:57PM)C:\kay\r4mna.wpd;version 3.0
3. Microbiological laboratory4 or field data that support the occurrence of biodegradation and giverates of biodegradation.
In an evaluation for the demonstration of biological contaminant degradation, the investigator must obtaineither the first two lines of evidence.
The second and third lines of evidence are crucial to the natural attenuation demonstration of biodegradationbecause they provide biodegradation rate constants. The biodegradation rate constants are used in conjunctionwith the other fate-and-transport parameters to predict contaminant concentrations and to assess risk atdowngradient points of compliance.
The first line of evidence is simply an observed reduction in the concentration of released contaminants down-gradient from the NAPL source area along the groundwater flow path. The observed reduction does not provethat contaminants are being destroyed because the reduction in contaminant concentration could be the resultof advection, dispersion, dilution from recharge, sorption, and volatilization with no loss of contaminant mass. Conversely, an increase in the concentrations of some contaminants, most notably degradation products suchas vinyl chloride, could be indicative of natural attenuation.
The second line of evidence relies on chemical and physical data to show that contaminant mass is beingdestroyed via biodegradation, not just diluted. The second line of evidence is divided into two components. The first component is the use of chemical analytical data in mass balance calculations to show that decreasesin contaminant and electron acceptor and donor concentrations can be directly correlated to increases inmetabolic end products and daughter compounds. The mass balance calculation can be used to show thatelectron acceptor and donor concentrations in ground water are sufficient to facilitate degradation of dissolvedcontaminants. Solute fate-and-transport models can be used to aid mass balance calculations and to collateinformation on degradation. The second component is the use of measured concentrations of contaminantsand/or biologically recalcitrant tracers in conjunction with aquifer hydrogeologic parameters, such as seepagevelocity and dilution, to show that a reduction in contaminant mass is occurring at the site and to calculatebiodegradation rate constants.
The third line of evidence, microbiological laboratory data, can be used to provide additional evidence thatindigenous biota are capable of degrading site contaminants at a particular rate. The most useful type ofmicrobiological laboratory data is the microcosm study, because it is necessary to show that biodegradation isoccurring and to obtain biodegradation rate constants.
This paper presents a technical course of data gathering that allows converging lines of evidence to be used toscientifically document the occurrence and quantify the rates of natural attenuation. Ideally, the first two linesof evidence should be used in the natural attenuation demonstration. To further document natural attenuation,or at sites with complex hydrogeology, obtaining a field-scale biodegradation rate may not be possible; in thiscase, microbiological laboratory data can be used. Such a “weight-of-evidence" approach will greatly increasethe likelihood of successfully verifying natural attenuation at sites where natural processes are restoring theenvironmental quality of ground water.
Collection of an adequate database during the iterative site characterization process is an important step in thedocumentation of natural attenuation. Site characterization should provide data on the location, nature, andextent of contaminant sources. Site characterization also should provide information on the location, extent,
5Among the available models are MT3D, BIOMOD3D, BioREDOX, RT3D and others.
71/18/00(4:57PM)C:\kay\r4mna.wpd;version 3.0
and concentrations of dissolved contamination; ground-water geochemical data; geologic information on thetype and distribution of subsurface materials; and hydrogeologic parameters such as hydraulic conductivity,hydraulic gradients, and potential contaminant migration pathways to human or ecological receptor exposurepoints. The data collected during site characterization can be used to simulate the fate and transport ofcontaminants in the subsurface. Such simulation allows prediction of the future extent and concentrations ofthe dissolved contaminant plume. Several models5 can be used to simulate dissolved contaminant transportand attenuation. The natural attenuation modeling effort has three primary objectives: 1) to predict the futureextent and concentration of a dissolved contaminant plume by simulating the combined effects of advection,dispersion, sorption, and biodegradation; 2) to assess the potential for downgradient receptors to be exposed tocontaminant concentrations that exceed regulatory or risk-based levels intended to be protective of humanhealth and the environment; and 3) to provide technical support for the natural attenuation remedial option atpostmodeling regulatory negotiations to help design a more accurate verification and monitoring strategy and tohelp identify early source removal strategies.
Upon completion of the fate-and-transport modeling effort, model predictions can be used in an exposurepathways analysis. If natural attenuation is sufficient to mitigate risks to potential receptors, the proponent ofnatural attenuation has a reasonable basis for negotiating this option with regulators. The exposure pathwaysanalysis allows the proponent to show that potential exposure pathways to receptors will not be completed.
Overview of Chlorinated Aliphatic Hydrocarbon Biodegradation
An accurate estimate of the potential for natural biodegradation is important to obtain when determiningwhether ground-water contamination presents a substantial threat to human health and the environment,because biodegradation is the most important process acting to remove contaminants from ground water, . The information also is useful when selecting the remedial alternative that will be most cost-effective ineliminating or abating these threats should natural attenuation not prove to be sufficient.
Over the past two decades, numerous laboratory and field studies have demonstrated that subsurface micro-organisms can degrade a variety of hydrocarbons and chlorinated solvents (3, 23). Whereas fuel hydrocarbonsare biodegraded through use as a primary substrate (electron donor), chlorinated aliphatic hydrocarbons mayundergo biodegradation through three different pathways: through use as an electron acceptor, through use asan electron donor, or through co-metabolism, where degradation of the chlorinated organic is fortuitous andthere is no benefit to the microorganism. Although at many sites the use of chlorinated aliphatic hydrocarbonsas electron acceptors appears to be most important, under natural conditions at a given site, one or all of theseprocesses may be operating (Figure 1). For example, Figure 1 shows vinyl chloride can aerobically mineralizeto C02, aerobically cometabolize to C02 in the presence of toluene, aerobically cometabolize to C02 in thepresence of methane, and reductively dechlorinate to ethene. In general, but in the electron acceptor pathwayespecially, biodegradation of chlorinated solvents will be an electron-donor-limited process. Conversely,biodegradation of fuel hydrocarbons is an electron-acceptor-limited process.
In a pristine aquifer, native organic carbon is used as an electron donor, and dissolved oxygen (DO) is usedfirst as the prime electron acceptor. Where anthropogenic carbon (e.g., fuel hydrocarbon) is present, it also willbe used as an electron donor. Following DO consumption, anaerobic microorganisms typically use additionalelectron acceptors (as available) in the following order of preference: nitrate, ferric iron oxyhydroxide, sulfate,and finally carbon dioxide. Evaluation of the distribution of these electron accepting compounds can provideevidence of where and how chlorinated aliphatic hydrocarbon biodegradation is occurring. In addition, becausechlorinated aliphatic hydrocarbons may be used as electron acceptors or electron donors (in competition withother acceptors or donors), isopleth maps showing the distribution of the electron acceptor/donor compoundscan provide evidence of the mechanisms of biodegradation working. As with BTEX, the driving force behindoxidation-reduction reactions resulting in chlorinated aliphatic hydrocarbon degradation is electron transfer. Although thermodynamically favorable, most of the reactions involved in chlorinated aliphatic hydrocarbonreduction and oxidation do not proceed abiotically. Microorganisms are capable of carrying out the reactions,but they will facilitate only those oxidation reduction reactions that have a net yield of energy.
81/18/00(4:57PM)C:\kay\r4mna.wpd;version 3.0
Mechanisms of Chlorinated Aliphatic Hydrocarbon Biodegradation
Electron Acceptor Reactions (Reductive Dechlorination)
The most important process for the natural biodegradation of the more highly chlorinated solvents is reductivedechlorination. During the reductive dechlorination, the chlorinated hydrocarbon is used as an electronacceptor, not as a source of carbon, and a chlorine atom is removed and replaced with a hydrogen atom. Ingeneral, reductive dechlorination occurs by sequential dechlorination, for example, reductive dechlorinationfrom perchloroethene to trichloroethene to dichloroethene to vinyl chloride to ethene. Depending onenvironmental conditions, the reductive dechlorination process sequence may be interrupted, with otherprocesses then acting on the products. Reductive dechlorination of chlorinated solvent compounds isassociated with all accumulation of daughter products and an increase in the concentration of chloride ions.
Reductive dechlorination affects each of the chlorinated ethenes differently. Of the chlorinated ethenecompounds, perchloroethene is the most susceptible to reductive dechlorination because it is the mostoxidized. Conversely, vinyl chloride is the least susceptible to reductive dechlorination because it is the leastoxidized of these compounds. The rate of reductive dechlorination also has been observed to decrease as thedegree of chlorination decreases (24, 25). Murray and Richardson (26) have postulated that this rate decreasemay explain the accumulation of vinyl chloride in perchloroethene and trichloroethene plumes that areundergoing reductive dechlorination.
Reductive dechlorination has been demonstrated under nitrate-reducing and sulfate-reducing conditions, butthe most rapid biodegradation rates, affecting the widest range of chlorinated aliphatic hydrocarbons, occurunder methanogenic conditions (24). Nitrate/sulfate-reducing condition discussion will be presented in greaterdetail in subsequent parts of this document. Because chlorinated aliphatic hydrocarbon compounds are usedas electron acceptors during reductive dechlorination, there must be an appropriate source of carbon formicrobial growth to occur (24). Potential carbon sources include natural organic matter, fuel hydrocarbons, orother organic compounds such as those found in landfill leachate.
Electron Donor Reactions
Murray and Richardson (26) write that microorganisms are generally believed to be incapable of growth usingtrichloroethene and perchloroethene as a primary substrate (i.e., electron donor). Under aerobic and someanaerobic conditions, the less-oxidized chlorinated aliphatic hydrocarbons (e.g., vinyl chloride) can be used asthe primary substrate in biologically mediated redox reactions (22). In the electron donor reaction, thefacilitating microorganism obtains energy and organic carbon from the degraded chlorinated aliphatichydrocarbon. Fuel hydrocarbons are biodegraded by the electron donor process.
In contrast to reactions in which the chlorinated aliphatic hydrocarbon is used as an electron acceptor, only theleast oxidized chlorinated aliphatic hydrocarbons can be used as electron donors in biologically mediated redoxreactions. McCarty and Semprini (22) describe investigations in which vinyl chloride and 1,2-dichloroethanewere shown to serve as primary substrates under aerobic conditions. These authors also document that dichlo-romethane has the potential to function as a primary substrate under either aerobic or anaerobic environments. In addition, Bradley and Chapelle (27) show evidence of mineralization of vinyl chloride under iron reducingconditions so long as there is sufficient bioavailable iron(III). Aerobic metabolism of vinyl chloride may becharacterized by a loss of vinyl chloride mass and a decreasing molar ratio of vinyl chloride to other chlorinatedaliphatic hydrocarbon compounds.
Co-metabolism
When a chlorinated aliphatic hydrocarbon is biodegraded via co-metabolism, the degradation is catalyzed byan enzyme or cofactor that is fortuitously produced by the organisms for other purposes. The organismreceives no known benefit from the degradation of the chlorinated aliphatic hydrocarbon; in fact, the co-metabolic degradation of the chlorinated aliphatic hydrocarbon may be harmful to the microorganismresponsible for the production of the enzyme or cofactor (22).
Co-metabolism is best documented in aerobic environments, although it could occur under anaerobic condi-tions. It has been reported that under aerobic conditions chlorinated ethenes, with the exception of perchlo-roethene, are susceptible to co-metabolic degradation (22, 23, 26). Vogel (23) further elaborates that the co--
91/18/00(4:57PM)C:\kay\r4mna.wpd;version 3.0
metabolism rate increases as the degree of dechlorination decreases. During co-metabolism, trichloroethene isindirectly transformed by bacteria as they use BTEX or another substrate to meet their energy requirements. Therefore, trichloroethene does not enhance the degradation of BTEX or other carbon sources, nor will its co-metabolism interfere with the use of electron acceptors involved in the oxidation of those carbon sources.
Behavior of Chlorinated Solvent Plumes
Chlorinated solvent plumes can exhibit three types of behavior depending on the amount of solvent, theamount of biologically available organic carbon in the aquifer, the distribution and concentration of naturalelectron acceptors, and the types of electron acceptors being used. It must be noted that individual plumesmay exhibit all three types of behavior in different portions of the plume. The different types of plume behaviorare summarized below.
Type 1 Behavior
Type 1 behavior occurs where the primary substrate is anthropogenic carbon (e.g., BTEX or landfill leachate),and this anthropogenic carbon drives reductive dechlorination. When evaluating natural attenuation of a plumeexhibiting Type 1, behavior the following questions must be answered:
1. Is the electron donor supply adequate to allow microbial reduction of the chlorinated organiccompounds? In other words, will the microorganisms “strangle" before they "starve”, will theyrun out of chlorinated aliphatic hydrocarbons (electron acceptors) before they run out ofelectron donors?
2. What is the role of competing electron acceptors (e.g., DO, nitrate, iron(Ill), and sulfate)?
3. Is vinyl chloride oxidized, or is it reduced?
Type 1 behavior results in the rapid and extensive degradation of the highly chlorinated solvents such as per-chloroethene, trichloroethene, and dichloroethene.
Type 2 Behavior
Type 2 behavior dominates in areas that are characterized by relatively high concentrations of biologicallyavailable native organic carbon. This natural carbon source drives reductive dechlorination (i.e., is the primarysubstrate for microorganism growth). When evaluating natural attenuation of a Type 2 chlorinated solventplume, the same questions as those posed for Type 1 behavior must be answered. Type 2 behavior generallyresults in slower biodegradation of the highly chlorinated solvents than Type 1 behavior, but under the rightconditions (e.g., areas with high natural organic carbon contents) this type of behavior also can result in rapiddegradation of chlorinated solvent compounds.
Type 3 Behavior
Type 3 behavior dominates in areas that are characterized by low concentrations of native and/or anthropo-genic carbon and by DO concentrations greater than 1.0 milligrams per liter. Under these aerobic conditions,reductive dechlorination will not occur; thus, there is no removal of perchloroethene, trichloroethene, anddichloroethene. Advection, dispersion, and sorption are the most significant natural attenuation mechanismsfor perchloroethene, trichloroethene, and dichloroethene in this setting. However, vinyl chloride can be rapidlyoxidized under these conditions.
Mixed Behavior
A single chlorinated solvent plume can exhibit all three types of behavior in different portions of the plume. This can be beneficial for natural biodegradation of chlorinated aliphatic hydrocarbon plumes. For example,Wiedemeier et al. (28) describe a plume at Plattsburgh Air Force Base, New York, that exhibits Type 1behavior in the source area and Type 3 behavior downgradient from the source. The most fortuitous scenarioinvolves a plume in which perchloroethene, trichloroethene, and dichloroethene are reductively dechlorinated
101/18/00(4:57PM)C:\kay\r4mna.wpd;version 3.0
(Type 1 or 2 behavior), then vinyl chloride is oxidized (Type 3 behavior) either aerobically or via iron reduction. Vinyl chloride is oxidized to carbon dioxide in this type of plume and does not accumulate. The following se-quence of reactions occurs in a plume that exhibits this type of mixed behavior:
Perchloroethene 6 Trichloroethene 6Dichloroethene 6 Vinyl chloride 6 Carbon dioxide
The trichloroethene, dichloroethene, and vinyl chloride may attenuate at approximately the same rate, and thusthese reactions may be confused with simple dilution. Note that no ethene is produced during this reaction. Vinyl chloride is removed from the system much faster under these conditions than it is under vinyl chloride-re-ducing conditions.
A less desirable scenario, but one in which all contaminants may be entirely biodegraded, involves a plume inwhich all chlorinated aliphatic hydrocarbons are reductively dechlorinated via Type 1 or Type 2 behavior. Vinylchloride is chemically reduced to ethene, which may be further reduced to ethane or methane. The followingsequence of reactions occurs in this type of plume:
Perchloroethene 6 Trichloroethene 6Dichloroethene 6 Vinyl chloride 6 Ethene 6 Ethane
This sequence has been investigated by Freedman and Gosseft (13). In this type of plume, vinyl chloridedegrades more slowly than trichloroethene and thus vinyl chloride tends to accumulate.
Protocol for Quantifying Natural Attenuation During the Remedial InvestigationProcess
The primary objective of the natural attenuation investigation is to show that natural processes of contaminantdegradation will reduce contaminant concentrations in ground water to below risk-based corrective action orregulatory levels within an acceptable distance and/or time frame. The natural attenuation investigationrequires a prediction of the potential extent and concentration of the contaminant plume in time and space. The prediction should be based on historic variations in, and the current extent and concentrations of, thecontaminant plume, as well as the measured rates of contaminant attenuation. Because of the inherentuncertainty associated with such predictions, the investigator must provide sufficient evidence to demonstratethat the mechanisms of natural attenuation will reduce contaminant concentrations to acceptable levels beforepotential receptors are reached. The demonstration requires the use of conservative solute fate-and-transportmodel input parameters and numerous sensitivity analyses so that consideration is given to all plausiblecontaminant migration scenarios. When possible, both historical data and modeling should be used to provideinformation that collectively and consistently supports the natural reduction and removal of the dissolvedcontaminant plume.
Figure 2 outlines the steps involved in the natural attenuation demonstration. Figure 2 also shows theimportant regulatory decision points in the process of implementing natural attenuation. Predicting the fate of acontaminant plume requires the quantification of solute transport and transformation processes.
Quantification of contaminant migration and attenuation rates and successful implementation of the naturalattenuation remedial option requires completion of the following steps:
1. Review available site data, and develop a preliminary conceptual model.
2. Screen the site, and assess the potential for natural attenuation.
3. Collect additional site characterization data to support natural attenuation, as required.
4. Refine the conceptual model, complete premodeling calculations, and document indicators ofnatural attenuation.
5. Simulate natural attenuation using analytical or numerical solute fate-and-transport models thatallow incorporation of a biodegradation term, as necessary.
6. Identify current and future receptors, and conduct an exposure-pathway analysis.
7. Determine whether source treatment will be remediation, removal, containment or acombination of these.
111/18/00(4:57PM)C:\kay\r4mna.wpd;version 3.0
8. If natural attenuation (after source treatment) is acceptable, prepare a long-term monitoringplan.
9. Present findings to regulatory agencies.
Review Available Site Data, and Develop a Preliminary Groundwater Flow and Transport ConceptualModel
Existing site characterization data should be reviewed and used to develop a site-specific conceptual model. The preliminary conceptual model will help identify any shortcomings in the data and will allow placement ofadditional data collection points in the most scientifically advantageous and cost-effective manner. A site-specific conceptual model is a three-dimensional representation of the ground-water flow and solute transportsystem based on available geological, biological, geochemical, hydrological, climatological, and analytical data. This type of conceptual model differs from the conceptual site models that risk assessors commonly use thatqualitatively consider the location of contaminant sources, release mechanisms, transport pathways, exposurepoints, and receptors. The groundwater system conceptual model, however, facilitates identification of theserisk-assessment elements for the exposure pathways analysis. After development, the conceptual model canbe used to help determine optimal placement of additional data collection points (as necessary) to aid in thenatural attenuation investigation and to develop the solute fate-and-transport model.
Contracting and management controls must be flexible enough to allow for the potential for revisions to theconceptual model and thus the data collection effort. In cases where little or questionable site-specific data areavailable, all future site characterization activities should be designed to collect the data necessary to screenthe site to determine the potential for remediation by natural attenuation. The data collected in support of natu-ral attenuation can be used to design and support other remedial measures.
Table 1A. lists a standard set of methods, while Table 1B. lists methods that are under development and/orconsideration for the soil and ground water analytical protocol for natural attenuation of chlorinated aliphatichydrocarbons and/or fuel hydrocarbons. Any plan to collect additional ground-water and soil quality data shouldinclude targeting the analytes listed in Table 1A., and Table 1B., where the technique is finalized.
Screen the Site, and Assess the Potential for Natural Attenuation
After reviewing available site data and developing a preliminary groundwater flow and transport conceptualmodel, an assessment of the potential for natural attenuation must be made. As stated previously, existingdata can be useful in determining whether natural attenuation will be sufficient to prevent a dissolvedcontaminant plume from completing exposure pathways, or from reaching a predetermined point ofcompliance, in concentrations above applicable regulatory or risk-based corrective action standards. Deter-mining the likelihood of exposure pathway completion is an important component of the natural attenuation in-vestigation. The determination is achieved by estimating the migration and future extent of the plume basedon contaminant properties, including volatility, sorptive properties, and biodegradability; aquifer properties,including hydraulic gradient, hydraulic conductivity, effective porosity, and total organic carbon (TOC) content;and the location of the plume and contaminant source relative to potential receptors (i.e., the distance betweenthe leading edge of the plume and the potential receptor exposure points). These parameters (estimated oractual) are used in the example that follows to make a preliminary assessment of the effectiveness of naturalattenuation in reducing contaminant concentrations.
If, after completing the steps outlined in this Quantification of biological natural attenuation section, it appearsthat natural attenuation will be a significant factor in contaminant removal, detailed site characterizationactivities in support of the natural attenuation remediation is necessary. If exposure pathways have alreadybeen completed and contaminant concentrations exceed regulatory levels, or if such completion is likely, otherremedial measures should be considered, possibly in conjunction with natural attenuation. Even so, thecollection of data in support of the natural attenuation option can be integrated into a comprehensive remedial
121/18/00(4:57PM)C:\kay\r4mna.wpd;version 3.0
plan and may help reduce the cost and duration of other remedial measures, such as intensive source removaloperations or pump-and-treat technologies. For example, dissolved iron concentrations can have a profoundinfluence on the design of pump-and-treat systems.
The screening process presented in this Quantification of biological natural attenuation section is outlined inFigure 3. The screening process allows the investigator to determine whether natural attenuation is likely to bea viable remedial alternative before additional time and money are expended. The data required to make thepreliminary assessment of natural attenuation can also be used to aid the design of an engineered remedialsolution, should the screening process suggest that natural attenuation alone is not feasible. The followinginformation is required for the screening process:
C The chemical and geochemical data presented in Table 2 for monitoring wells located in zonesupgradient, within the plume and downgradient. Figures 4A and 4B show the approximate locations ofdata collection points all of which are substantiated in the appropriate flow and contaminant siteinvestigation. If other contaminants are suspected, then data on the concentration and distribution ofthese compounds also must be obtained.
C Locations of source(s) and receptor(s).
C An estimate of the contaminant transport velocity and direction of ground-water flow.
Once these data have been collected, the screening process can be undertaken. The following steps sum-marize the screening process:
1. Determine whether biodegradation is occurring using geochemical data. If biodegradation isoccurring, proceed to Step 2. If it is not, assess the amount and types of data available. If dataare insufficient to determine whether biodegradation is occurring, collect supplemental data.
2. Determine ground-water flow and solute transport parameters. Hydraulic conductivity andeffective porosity may be estimated, but the ground-water gradient and flow direction may not. The investigator should use the highest hydraulic conductivity measured at the site during thepreliminary screening because solute plumes tend to follow the path of least resistance (i.e.,highest hydraulic conductivity). This will give the "worst case" estimate of solute migrationover a given period.
3. Locate sources and current and future receptor exposure points.
4. Estimate the biodegradation rate constant. In ideal cases, biodegradation rate constants canbe estimated using a conservative tracer found co-mingled with the contaminant plume, asdescribed by Wiedemeier et al. (36). When dealing with a plume that contains only chlorinatedsolvents, this procedure will have to be modified to use chloride as a tracer. Rate constantsderived from microcosm studies can also be used. If it is not possible to estimate thebiodegradation rate using these procedures, then use a range of accepted literature values forbiodegradation of the contaminants of concern.
5. Compare the rate of transport to the rate of attenuation, using analytical solutions or ascreening model such as BIOSCREEN .
6. Determine whether the screening criteria are met.
Each step is described in detail below.
Step 1: Determine Whether Biodegradation Is Occurring
The first step in the screening process is to sample a minimum of six nested well location areas that arerepresentative of the contaminant flow system and to analyze the samples for the parameters listed in Table 2.Samples should be taken 1) from the most contaminated portion of the aquifer (within or as close to the sourcearea as possible); 2) downgradient from the source area, in the dissolved contaminant plume (2 samplelocations); 3) downgradient from the dissolved contaminant plume; and 4) from upgradient and lateral locationsthat are not affected by the plume.
Samples collected in the Source Area allow determination of the dominant terminal electron-acceptingprocesses at the site. Figure 5 is supplied in order to illustrate the hierarchy of the terminal electron-accepting
131/18/00(4:57PM)C:\kay\r4mna.wpd;version 3.0
process. In conjunction with samples collected in the Source Area, samples collected in the DissolvedContaminant Plume downgradient from the Source Area allow the investigator to determine whether the plumeis degrading with distance along the flow path and what the distribution of electron acceptors and donors andmetabolic byproducts might be along the flow path. The sample collected downgradient from the DissolvedContaminant Plume aids in plume delineation and allows the investigator to determine whether metabolicbyproducts are present in an area of ground water that has apparently been unaffected by the source. Theupgradient and lateral samples allow delineation of the plume and indicate background concentrations of theelectron acceptors and donors.
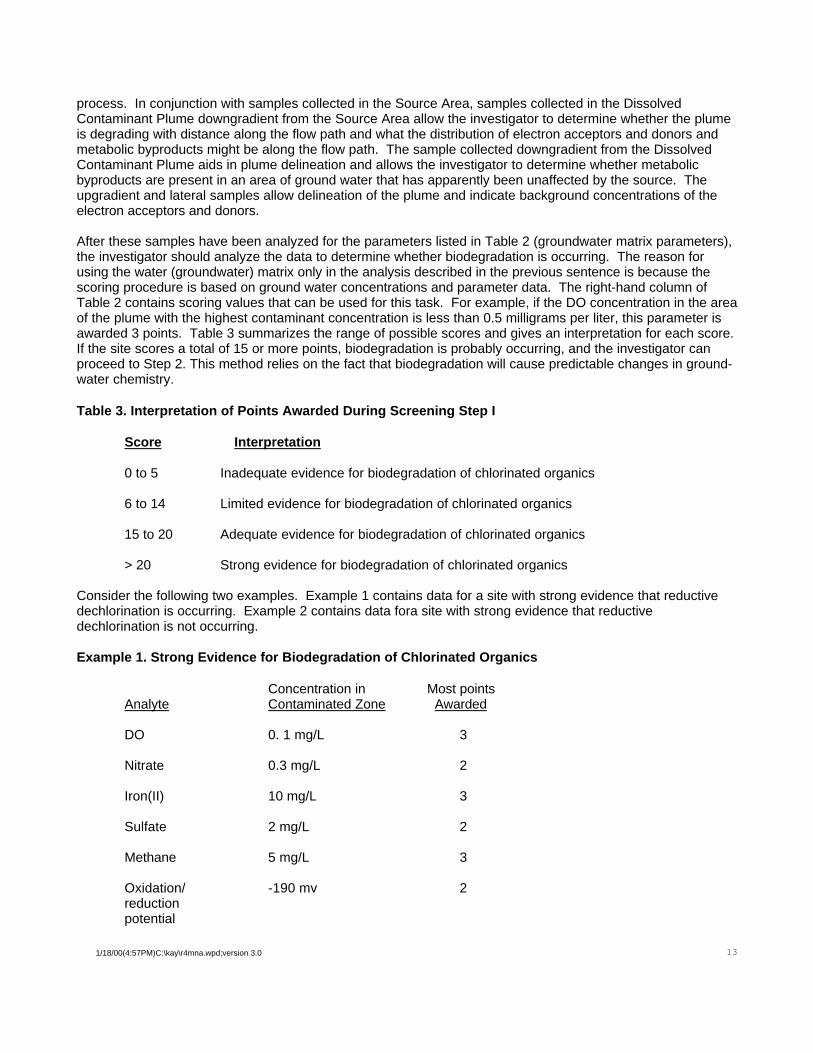
After these samples have been analyzed for the parameters listed in Table 2 (groundwater matrix parameters),the investigator should analyze the data to determine whether biodegradation is occurring. The reason forusing the water (groundwater) matrix only in the analysis described in the previous sentence is because thescoring procedure is based on ground water concentrations and parameter data. The right-hand column ofTable 2 contains scoring values that can be used for this task. For example, if the DO concentration in the areaof the plume with the highest contaminant concentration is less than 0.5 milligrams per liter, this parameter isawarded 3 points. Table 3 summarizes the range of possible scores and gives an interpretation for each score. If the site scores a total of 15 or more points, biodegradation is probably occurring, and the investigator canproceed to Step 2. This method relies on the fact that biodegradation will cause predictable changes in ground-water chemistry.
Table 3. Interpretation of Points Awarded During Screening Step I
Score Interpretation
0 to 5 Inadequate evidence for biodegradation of chlorinated organics
6 to 14 Limited evidence for biodegradation of chlorinated organics
15 to 20 Adequate evidence for biodegradation of chlorinated organics
> 20 Strong evidence for biodegradation of chlorinated organics
Consider the following two examples. Example 1 contains data for a site with strong evidence that reductivedechlorination is occurring. Example 2 contains data fora site with strong evidence that reductivedechlorination is not occurring.
Example 1. Strong Evidence for Biodegradation of Chlorinated Organics
Concentration in Most pointsAnalyte Contaminated Zone Awarded
DO 0. 1 mg/L 3
Nitrate 0.3 mg/L 2
Iron(II) 10 mg/L 3
Sulfate 2 mg/L 2
Methane 5 mg/L 3
Oxidation/ -190 mv 2reduction
potential
141/18/00(4:57PM)C:\kay\r4mna.wpd;version 3.0
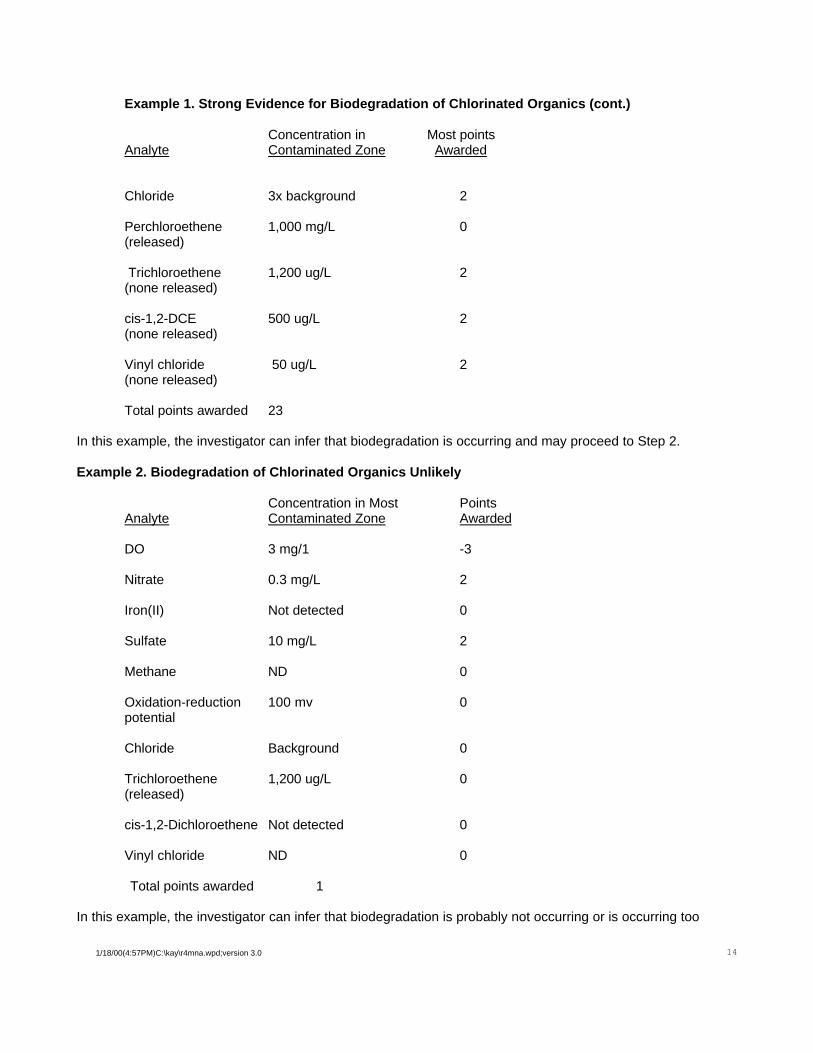
Example 1. Strong Evidence for Biodegradation of Chlorinated Organics (cont.)
Concentration in Most pointsAnalyte Contaminated Zone Awarded
Chloride 3x background 2
Perchloroethene 1,000 mg/L 0(released)
Trichloroethene 1,200 ug/L 2(none released)
cis-1,2-DCE 500 ug/L 2(none released)
Vinyl chloride 50 ug/L 2(none released)
Total points awarded 23
In this example, the investigator can infer that biodegradation is occurring and may proceed to Step 2.
Example 2. Biodegradation of Chlorinated Organics Unlikely
Concentration in Most PointsAnalyte Contaminated Zone Awarded
DO 3 mg/1 -3
Nitrate 0.3 mg/L 2
Iron(II) Not detected 0
Sulfate 10 mg/L 2
Methane ND 0
Oxidation-reduction 100 mv 0potential
Chloride Background 0
Trichloroethene 1,200 ug/L 0(released)
cis-1,2-Dichloroethene Not detected 0
Vinyl chloride ND 0
Total points awarded 1
In this example, the investigator can infer that biodegradation is probably not occurring or is occurring too
151/18/00(4:57PM)C:\kay\r4mna.wpd;version 3.0
slowly to be a viable remedial option. In this case, the investigator cannot proceed to Step 2 and will likelyhave to implement an engineered remediation system.
This scoring system was developed by Dr. John Wilson at EPA’s RSKERC and Todd Wiedemeier of ParsonsEngineering and has been peer reviewed.
Step 2: Determine Groundwater Flow and Solute Transport Parameters
If the interpretation of the score indicates biodegradation is occurring, it is important to quantify groundwaterflow and solute transport parameters. U.S. EPA strongly recommends obtaining site specific parameter datafor supporting natural attenuation to the fullest extent possible. Parameter Quantification will make it possibleto use a solute transport model to quantitatively estimate the concentration of the plume and its direction andrate of travel. To use an analytical model, it is necessary to know the hydraulic gradient and hydraulicconductivity for the site and to have estimates of the effective porosity and dispersivity. The coefficient ofretardation also is helpful to know. Quantification of these parameters is discussed by Wiedemeier et al. (1);the textbook Contaminant Hydrogeology (Fetter, 1992), The Soil Chemistry of Hazardous Materials (Dragun,1988), Basics of Pump-and-Treat Ground-Water Remediation Technology (Mercer et al, 1990), Principles ofGroundwater Engineering (Walton, 1991), and Ground Water Issue Paper Basic Concepts of OrganicContaminant Sorption at Hazardous Waste Sites (Piwoni et al, 1990) also contain information on thesevariables.
To make modeling as accurate as possible, the investigator must have site-specific hydraulic gradient and hy-draulic conductivity data. To determine the ground-water flow and solute transport direction, the site must haveat least three accurately surveyed wells, for the most simplistic site hydrogeologic conditions. The effectiveporosity and dispersivity are generally estimated using accepted literature values for the types of sedimentsfound at the site. If the investigator does not have total organic carbon data for soil, the coefficient ofretardation can still be estimated using default literature values for total organic carbon, soil bulk density, andthe aquifer effective porosity; however, assuming that the solute transport and ground-water velocities are thesame is usually conservative.
Step 3: Locate Sources and Receptor Exposure Points
To determine the length of flow for the predictive modeling conducted in Step 5, it is important to know thedistance between the source of contamination, the downgradient end of the dissolved plume, and any potentialdowngradient or cross-gradient receptors.
Step 4: Estimate the Biodegradation Rate Constant
Estimated biodegradation rates can be used only after biodegradation has been shown to be occurring (seeStep 1). The biodegradation rate is one of the most important model input parameters. Biodegradation ofchlorinated aliphatic hydrocarbons can commonly be represented as a first-order rate constant. Site-specificbiodegradation rates are required due to the sensitivity of this parameter to modeling results and because of thedependence biological degradation has on the physical properties of the site. If gathering site specificdegradation rates is absolutely not possible the a method for obtaining this value should be negotiated with thetechnical parties for U.S. EPA.
Step 5: Compare the Rate of Transport to the Rate of Attenuation
At this early stage in the natural attenuation demonstration, comparison of the rate of solute transport to therate of attenuation is best accomplished using an analytical model. Several analytical models are available,but the BIOSCREEN model is probably the simplest currently available model to use. BIOSCREEN wasdeveloped to simulate biological degradation of hydrocarbons and the suggestions below should beincorporated into running the model for use on chlorinated solvent plumes. The model is nonproprietary and isavailable from the Robert S. Kerr Laboratory's home page on the Internet (www.epa.gov/ada/kerriab.html). The
161/18/00(4:57PM)C:\kay\r4mna.wpd;version 3.0
BIOSCREEN model is based on Domenico's solution to the advection dispersion equation (38), and allows useof either a first-order biodegradation rate or an instantaneous reaction between contaminants and electronacceptors to simulate the effects of biodegradation. To model transport of chlorinated aliphatic hydrocarbonsusing BIOSCREEN, only the first-order decay rate option should be used. The model BIOCHLOR is underdevelopment by the Technology Transfer Division of Air Force Center for Environmental Excellence (AFCEE). The BIOCHLOR model will be geared towards evaluating transport of chlorinated compounds under theinfluence of biodegradation. BIOPLUME III is currently being peer reviewed by U.S. EPA and will be anumerical model that will simulate biological decay of organic compounds. Other models exist and a literaturesearch for these models is recommended.
The primary purpose of comparing the rate of transport with the rate of attenuation is to determine whether theresidence time along the flow path is adequate to be protective of human health and the environment (i.e., toqualitatively estimate whether the contaminant is attenuating at a rate fast enough to allow degradation of thecontaminant to acceptable concentrations before receptors, or potential receptors, are reached). It is importantto perform a sensitivity analysis to help evaluate the confidence in the preliminary screening modeling effort. Ifmodeling indicates that natural attenuation may attain remedial action objectives, then the screening criteriaare met, and the investigator can proceed with the natural attenuation feasibility study.
Step 6: Determine Whether the Screening Criteria Are Met
Before proceeding with the full-scale natural attenuation feasibility study, the investigator should ensure that theanswers to all of the following criteria are "yes":
C Has the plume moved a distance less than expected, based on the known (or estimated) time since thecontaminant release and the contaminant velocity, as calculated from site-specific measurements ofhydraulic conductivity and hydraulic gradient, as well as estimates of effective porosity andcontaminant retardation? The time of release is often difficult to ascertain and it is recommended thatconferring with the regulatory and facility parties involved with the site be performed in order to preventcostly time and effort with an unsuitable time.
C Is it likely that the contaminant mass is attenuating at rates sufficient to be protective of human healthand the environment at a compliance point, or point of discharge to a sensitive environmentalreceptor?
C Is the plume going to attenuate to concentrations less than risk-based corrective action guidelines orregulatory criteria before reaching potential receptors, or a compliance point?
Collect Additional Site Characterization Data To Support Natural Attenuation, As Required
Detailed site characterization is necessary to document the potential for natural attenuation. Review of existingsite characterization data is particularly useful before initiating site characterization activities. Such reviewshould allow identification of data gaps and guide the most effective placement of additional data collectionpoints. There are two goals during the site characterization phase of a natural attenuation investigation. Thefirst is to collect the data needed to determine whether natural mechanisms of contaminant attenuation areoccurring at rates sufficient to protect human health and the environment. The second is to provide sufficientsite-specific data to allow prediction of the future extent and concentration of a contaminant plume throughsolute fate and transport modeling. Because the burden of proof for natural attenuation is on the proponent,detailed site characterization is required to achieve these goals and to support this remedial option. Adequatesite characterization in support of natural attenuation requires that the following site-specific parameters bedetermined:
C The extent and type of soil and ground-water contamination.
C The location and extent of contaminant source area(s) (i.e., areas containing mobile or residual
171/18/00(4:57PM)C:\kay\r4mna.wpd;version 3.0
NAPL).
C The potential for a continuing source due to leaking tanks or pipelines.
C Aquifer geochemical parameters.
C Regional hydrogeology, including ground water that is a current or potential source of drinking water or discharges into an ecologically sensitive area and regional confining units.
C Local and site-specific hydrogeology, including local drinking water supplies; location of industrial,agricultural, and domestic water wells; patterns of ground water use (current and future); lithology; sitestratigraphy, including identification of transmissive and nontransmissive units; grain-size distribution(sand versus silt versus clay); partitioning coefficients; aquifer hydraulic conductivity; groundwaterhydraulic information; preferential flow paths; locations and types of surface water bodies; and areas oflocal ground-water recharge and discharge.
C Identification of potential exposure pathways and receptors.
The following sections describe the methodologies that should be implemented to allow successful sitecharacterization in support of natural attenuation. Additional information can be obtained from Wiedemeier etal. (1, 37).
Soil Characterization
To adequately define the subsurface hydrogeologic system and to determine the amount and three-dimensionaldistribution of contaminant mass that can act as a continuing source of ground-water contamination, extensivesoil characterization must be completed. Soil characterization may have been completed during previousremedial investigation activities. The results of soils characterization will be used as input into a solute fate-and-transport model to help define a contaminant source term and to support the natural attenuationinvestigation.
The analytical protocol to be used for soil, aquifer matrix and soil gas sample analysis is presented in Table 1A.and 1B. The analytical methods includes all of the parameters necessary to document natural attenuation,including the effects of sorption and biodegradation. Knowledge of the location, distribution, concentration, andtotal mass of contaminants of regulatory concern in soils or present as residual and/or mobile NAPL is requiredto calculate the mass transfer rate from the contaminant source to the ground water. Knowledge of the TOCcontent of the aquifer matrix is important for sorption and solute-retardation calculations. TOC samples shouldbe collected from a background location in the stratigraphic horizon(s) where most contaminant transport isexpected to occur. Oxygen and carbon dioxide measurements of soil gas can be used to find areas in theunsaturated zone where biodegradation is occurring. Knowledge of the distribution of contaminants in soil gascan be used as a cost-effective way to estimate the extent of soil volatile organic compound contamination.
Groundwater Characterization
To adequately determine the amount and three-dimensional distribution of dissolved contamination and todocument the occurrence of natural attenuation, ground-water samples must be collected and analyzed. Biodegradation of organic compounds, whether natural or anthropogenic, brings about measurable changes inthe chemistry of ground water in the affected area. By measuring these changes, documentation and quantita-tive evaluation of natural attenuation's importance at a site are possible.
Groundwater sampling is conducted to determine the concentrations and distribution of contaminants, daughterproducts, and ground-water geochemical parameters. The analytical protocol for ground-water sample analysisis presented in Table 1A. and 1B. The analytical protocol includes all of the parameters necessary to documentnatural attenuation, including the effects of sorption and biodegradation. Data obtained from the analysis of
181/18/00(4:57PM)C:\kay\r4mna.wpd;version 3.0
ground water for these analytes is used to scientifically document natural attenuation and can be used as inputinto a solute fate-and-transport model. The following paragraphs describe each ground-water analytical pa-rameter and the use of each analyte in the natural attenuation demonstration.
Volatile organic compound analysis (by Method SW8260a) is used to determine the types, concentrations, anddistributions of contaminants and daughter products in the aquifer. Figure 1 (44) is included in the text forillustrative purposes. DO is the electron acceptor most thermodynamically favored by microbes for the biode-gradation of organic carbon, whether natural or anthropogenic. Reductive dechlorination will not occur,however, if DO concentrations are above approximately 0.5 milligrams per liter. During aerobic biodegradationof a substrate, DO concentrations decrease because of the microbial oxygen demand. After DO depletion, an-aerobic microbes will use nitrate containing compounds as an electron acceptor, followed by iron(III) containingcompounds, then sulfate containing compounds, and finally carbon dioxide (methanogenesis). Each sequentialreaction drives the oxidation-reduction potential of the ground water further toward conditions that favorreductive dechlorination. The oxidation-reduction potential range of su!fate reduction and methanogenesis isoptimal, but reductive dechlorination may occur under nitrate- and iron(Ill)-reducing conditions as well. Be-cause reductive dechlorination works best in the sulfate reduction and methanogenesis oxidation-reductionpotential range, competitive exclusion between microbial sulfate reducers, methanogens, and reductivedechlorinators can occur.
After DO has been depleted in the area of the plume where chlorinated aliphatic compounds are beinganaerobically remediated (treatment zone), nitrate-containing compounds may be used as an electron acceptorfor anaerobic biodegradation via denitrification. In some cases iron(Ill)-containing compounds are used as anelectron acceptors during anaerobic biodegradation of electron donors. During this process, iron(III) is reducedto the more soluble iron(lI). Iron(II) concentrations can thus be used as an indicator of anaerobic degradation offuel compounds. After DO, nitrate, and bioavailable iron(III) have been depleted in the area of the plumewhere chlorinated aliphatic compounds are being anaerobically remediated, sulfate-containing compounds maybe used as an electron acceptor for anaerobic biodegradation. This process is termed sulfate reduction andresults in the production of sulfide-containing compounds. During methanogenesis (an anaerobicbiodegradation process), carbon dioxide (or acetate)-containing compounds are used as an electron acceptors,and methane is produced. Methanogenesis generally occurs after oxygen, nitrates, bioavailable iron(Ill)s, andsulfates have been depleted in the treatment zone. The presence of methane in ground water is indicative ofstrongly reducing conditions. Because methane is not present in fuel, the presence of methane in ground waterabove background concentrations in contact with fuels is indicative of microbial degradation of fuelhydrocarbons.
The total alkalinity of a ground-water system is indicative of a water's capacity to neutralize acid. Alkalinityresults from the presence of hydroxides, carbonates, and bicarbonates of elements such as calcium,magnesium, sodium, potassium, or ammonia. Alkalinity is important in the maintenance of ground-water pHbecause it buffers the ground-water system against acids generated during both aerobic and anaerobicbiodegradation.
In general, areas contaminated by fuel hydrocarbons exhibit a total alkalinity that is higher than that seen inbackground areas. This is expected because the microbially mediated reactions causing biodegradation of fuelhydrocarbons cause an increase in the total alkalinity in the system. Changes in alkalinity are most pronouncedduring aerobic respiration, denitrification, iron reduction, and sulfate reduction, and are less pronounced duringmethanogenesis (40). In addition, Willey et al. (41) show that short-chain aliphatic acid ions produced duringbiodegradation of fuel hydrocarbons can contribute to alkalinity in ground water.
The oxidation-reduction potential of ground water is a measure of electron activity and an indicator of therelative tendency of a solution to accept or transfer electrons. Redox reactions in ground water containingorganic compounds (natural or anthropogenic) are usually biologically mediated; therefore, the oxidation-reduction potential of a ground-water system depends on and influences rates of biodegradation. Knowledge ofthe oxidation-reduction potential of ground water also is important because some biological processes operateonly within a prescribed range of redox conditions. The oxidation-reduction potential of ground water generally
191/18/00(4:57PM)C:\kay\r4mna.wpd;version 3.0
ranges from -400 to 800 millivolts (mV). Figure 6 shows the typical redox conditions for ground water when dif-ferent electron acceptors are used.
Oxidation-reduction potential can be used to provide real-time data on the location of the contaminant plume,especially in areas undergoing anaerobic biodegradation. Mapping the oxidation-reduction potential of theground water while in the field helps the field scientist to determine the approximate location of the contaminantplume. To perform this task, it is important to have at least one redox measurement (preferably more) from awell located upgradient from the plume. Oxidation-reduction potential measurements should be taken duringwell purging and immediately before and after sample acquisition using a direct-reading meter. Because mostwell purging techniques can allow aeration of collected ground-water samples (which can affect oxidation-reduction potential measurements), it is important to minimize potential aeration.
Dissolved hydrogen (gas) concentrations can be used to determine the dominant terminal electron-acceptingprocess in an aquifer. Table 4 and Figure 5 are presented to respectively present the range of hydrogenconcentrations for a given terminal electron-accepting process and the hierarchical scheme for diagnosing theterminal electron-accepting process. Much research has been done on the topic of using hydrogenmeasurements to delineate terminal electron-accepting processes (42,44). Because the efficiency of reductivedechlorination differs for methanogenic, sulfate-reducing, iron(Ill)-reducing, or denitrifying conditions, it ishelpful to have hydrogen concentrations to help delineate redox conditions when evaluating the potential fornatural attenuation of chlorinated ethenes in ground-water systems. Collection and analysis of ground-watersamples for dissolved hydrogen content is not yet commonplace or standardized.
Table 4. Range of Hydrogen Concentrations for a Given Terminal Electron-Accepting Process
Terminal Electron- Hydrogen ConcentrationAccepting Process (nanomoles per liter)
Denitrification < 0.1
lron(III) reduction 0.2 to 0.8
Sulfate reduction 1 to 4
Methanogenesis > 5
Because the pH, temperature, and conductivity of a ground-water sample can change significantly shortlyfollowing sample acquisition, these parameters must be measured in the field in unfiltered, unpreserved, "fresh"water collected by the same technique as the samples taken for DO and redox analyses. The measurementsshould be made in a clean glass container separate from those intended for laboratory analysis, and the meas-ured values should be recorded in the ground-water sampling record.
The pH of ground water has an effect on the presence and activity of microbial populations in the ground water. This is especially true for methanogens. Microbes capable of degrading chlorinated aliphatic hydrocarbons andpetroleum hydrocarbon compounds generally prefer pH values varying from 6 to 8 standard units. Ground-water temperature directly affects the solubility of oxygen and other geochemical species. The solubility of DOis temperature dependent, being more soluble in cold water than in warm water. Ground-water temperaturealso affects the metabolic activity of bacteria. Rates of hydrocarbon biodegradation roughly double for every100C increase in temperature ("Q"10 rule) over the temperature range between 50C and 250C. Ground-watertemperatures less than about 50C tend to inhibit biodegradation, and slow rates of biodegradation are generallyobserved in such waters.
Conductivity is a measure of the ability of a solution to conduct electricity. The conductivity of ground water isdirectly related to the concentration of ions in solution; conductivity increases as ion concentration increases. Conductivity measurements are used to ensure that ground water samples collected at a site are representative
201/18/00(4:57PM)C:\kay\r4mna.wpd;version 3.0
of the water in the saturated zone containing the dissolved contamination. If the conductivities of samplestaken from different sampling points are radically different, the waters may be from different hydrogeologiczones.
Elemental chlorine is the most abundant of the halogens. Although chlorine can occur in oxidation statesranging from Cl- to Cl+7, the chloride form (C -) is the only form of major significance in natural waters (45). Chloride forms ion pairs or complexations with some of the cations present in natural waters, but thesecomplexes are not strong enough to be of significance in the chemistry of fresh water (45). Chloride ionsgenerally do not enter into oxidation-reduction reactions, form no important solute complexes with other ionsunless the chloride concentration is extremely high, do not form salts of low solubility, are not significantlyadsorbed on mineral surfaces, and play few vital biochemical roles (45). Thus, physical processes control themigration of chloride ions in the subsurface, and chloride is an effective conservative tracer of ground-watercontaminant plume migration.
During biodegradation of chlorinated hydrocarbons dissolved in ground water, chloride is released into theground water. This process results in chloride concentrations in the ground water of the contaminant plumethat are elevated relative to background concentrations. Because of the nonreactive behavior of chloride, itcan be used as a conservative tracer to estimate biodegradation rates using methods similar to those discussedby Wiedemeier et al. (36).
Field Measurement of Aquifer Hydraulic Parameters
The properties of an aquifer that have the greatest impact on contaminant fate and transport include hydraulicconductivity, hydraulic gradient, effective porosity, and dispersivity. Estimating hydraulic conductivity andgradient in the field is fairly straightforward, but obtaining field-scale information on effective porosity anddispersivity can be difficult.
Therefore, most investigators rely on field data for hydraulic conductivity and hydraulic gradient and on litera-ture values for effective porosity and dispersivity for the types of sediments present at the site. Methods forfield measurement of aquifer hydraulic parameters are described by Wiedemeier et al. (1, 37). Additionalsources of information is found in Groundwater (Freeze & Cherry, 1979), Applied Hydrogeology (Fetter, 1988),and Contaminant Hydrogeology (Fetter, 1993).
Microbiological Laboratory Data
Microcosm studies are used to show that the microorganisms necessary for biodegradation are present and tohelp quantify rates of biodegradation. If properly designed, implemented, and interpreted, microcosm studiescan provide very convincing documentation of the occurrence of biodegradation. The most common techniqueused to show explicitly that microorganisms capable of degrading contaminants present at a site is themicrocosm study. The results of a well-designed microcosm study will be easy for decision-makers withnontechnical backgrounds to interpret. Results of such studies are strongly influenced by the nature of thegeological material submitted for study, the physical properties of the microcosm, the sampling strategy, andthe duration of the study. Because microcosm studies are time-consuming and expensive, they should be un-dertaken only at sites where there is considerable uncertainty concerning the biodegradation of contaminants.
Biodegradation rate constants determined by microcosm studies often are much greater than rates achieved inthe field. Microcosms are most appropriate as indicators of the potential for natural bioremediation and toprove that losses are biological, but it may be inappropriate to use them to generate rate constants. Thepreferable method of contaminant biodegradation rate-constant determination is in situ field measurement. The collection of material for the microcosm study, the procedures used to set up and analyze the microcosm,and the interpretation of the results of the microcosm study are presented by Wiedemeier et al. (1).
211/18/00(4:57PM)C:\kay\r4mna.wpd;version 3.0
Refine the Conceptual Model, Complete Premodeling Calculations, and DocumentIndicators of Biological Degradation
Site investigation data should first be used to refine the conceptual model and quantify ground-water flow, sorp-tion, dilution, and biodegradation. The results of these calculations are used to scientifically document theoccurrence and rates of natural attenuation and to help simulate natural attenuation over time. Because theburden of proof is on the proponent, all available data must be integrated in such a way that the evidence issufficient to support the conclusion that natural attenuation is occurring.
Conceptual Model Refinement
Conceptual model refinement involves integrating newly gathered site characterization data to refine thepreliminary conceptual model that was developed based on previously existing site-specific data. Duringconceptual model refinement, all available site-specific data should be integrated to develop an accurate three-dimensional representation of the hydrogeologic and contaminant transport system. This conceptual model canthen be used for contaminant fate-and-transport modeling. Conceptual model refinement consists of severalsteps, including preparation of geologic logs, hydrogeologic sections, potentiometric surface/water table maps,contaminant contour (isopleth) maps, and electron acceptor and metabolic byproduct contour (isopleth) maps. Refinement of the conceptual model is described by Wiedemeier et al. (1).
Premodeling Calculations
Several calculations must be made prior to implementation of the solute fate-and-transport model. These cal-culations include sorption and retardation calculations, NAPL water-partitioning calculations, ground-water flowvelocity calculations, and biodegradation rate-constant calculations. Each of these calculations is discussed inthe following sections. Most of the specifics of each calculation are presented in the fuel hydrocarbon naturalattenuation technical protocol by Wiedemeier et al. (1), and all will be presented in the protocol incorporatingchlorinated aliphatic hydrocarbon attenuation (37).
Biodegradation Rate Constant Calculations
Biodegradation rate constants are necessary to simulate accurately the fate and transport of contaminantsdissolved in ground water. In many cases, biodegradation of contaminants can be approximated using first-or-der kinetics. To calculate first-order biodegradation rate constants, the apparent degradation rate must be nor-malized for the effects of dilution and volatilization. Two methods for determining first-order rate constants aredescribed by Wiedemeier et al. (36). One method involves the use of a biologically recalcitrant compoundfound in the dissolved contaminant plume that can be used as a conservative tracer. The other method, pro-posed by Buscheck and Alcantar (47) involves interpretation of a steady-state contaminant plume and is basedon the one-dimensional steady-state analytical solution to the advection-dispersion equation presented by Bear(48). The first-order biodegradation rate constants for chlorinated aliphatic hydrocarbons are also presented (J.Wilson et al., Dallas Symposium Notes).
Simulate Natural Attenuation Using Solute Fate-and-Transport Models
Simulating natural attenuation using a solute fate and transport model allows prediction of the migration andattenuation of the contaminant plume through time. Natural attenuation modeling is a tool that allows site-specific data to be used to predict the fate and transport of solutes under governing physical, chemical, andbiological processes. Hence, the results of the modeling effort are not in themselves sufficient proof thatnatural attenuation is occurring at a given site. The results of the modeling effort are only as good as theoriginal data input into the model; therefore, an investment in thorough site characterization will improve thevalidity of the modeling results. In some cases, straightforward analytical models of contaminant attenuationare adequate to simulate natural attenuation.
221/18/00(4:57PM)C:\kay\r4mna.wpd;version 3.0
Several well-documented and widely accepted solute fate-and-transport models are available for simulating thefate-and-transport of contaminants under the influence of advection, dispersion,'sorption, and biodegradation. The use of solute fate-and-transport modeling in the natural attenuation investigation is described byWiedemeier et al. (1).
Identify Potential Receptors, and Conduct an Exposure-Pathway Analysis
After the rates of natural attenuation have been documented and predictions of the future extent and concen-trations of the contaminant plume have been made using the appropriate solute fate-and-transport model, thecase for natural attenuation should combine all available data and information to present the basis for using this as a remedial option. Supporting the natural attenuation option generally will involve performing areceptor exposure-pathway analysis. This analysis includes identifying potential human and ecological recep-tors and points of exposure under current and future land and ground-water use scenarios and the 9 criteria inthe Feasibility Study. The results of solute fate-and-transport modeling are central to the exposure pathwaysanalysis. If conservative model input parameters are used, the solute fate-and-transport model should giveconservative estimates of contaminant plume migration. From this information, the potential for impacts onhuman health and the environment from contamination present at the site can be estimated.
Evaluate Source Control
Source removal, treatment or containment will be necessary to reduce plume expansion. Several technologiessuitable for source reduction or removal are listed in Figure 2. Other technologies may also be used as dictatedby site conditions and local regulatory requirements. Source removal can be very effective at limiting plumemigration and decreasing the remediation time frame, especially at sites where biodegradation is contributing tonatural attenuation of a dissolved contaminant plume.
Present Findings and Obtain Consensus for Remediation by Natural Attenuation
A natural attenuation remedial alternative will be evaluated using the nine criteria used to evaluate otherremedial alternatives. All available site-specific data and information developed during the sitecharacterization, conceptual model development, premodeling calculations, biodegradation rate calculation,ground-water modeling, model documentation, and long-term monitoring plan preparation phases of the naturalattenuation investigation should be presented in a consistent and complementary manner during the FeasibilityStudy (FS)/ Corrective Measures Study (CMS) process. Evidence that natural aftenuation is occurring at ratessufficient to meet regulatory requirements, and to protect human health and the environment will be presentedduring the FS/CMS or Remedial Design/Remedial Action (RD/RA) or Corrective Remedial Action (CRA) stageof site work. A "weight-of-evidence" argument is necessary to support this remedial option. For this reason, allmodel assumptions should be conservative, and all available evidence in support of natural attenuation mustbe presented with regulatory requirements in mind.
Acknowlegements
The following individuals have participated in the various iterations of review of this document: Curt Black, JimBarksdale, Paul Osborne, Rich Muza, John Wilson, and Bill O’Steen. The Superfund/RCRA Ground WaterForum Solvents Workgroup comments on the AFCEE Protocol for Evaluation of Natural Attenuation ofChlorinated Solvents in Ground Water have also been valuable in the production of this document.
231/18/00(4:57PM)C:\kay\r4mna.wpd;version 3.0
References
1. Wiedemeier, TH., J.T. Wilson, D.H. Kampbell, R.N. Miller, and J.E. Hansen. 1995. Technical protocol forimplementing intrinsic remediation with long-term monitoring for natural attenuation of fuel contaminationdissolved in groundwater. San Antonio, TX: U.S. Air Force Center for Environmental Excellence.
2. National Research Council. 1993. In-situ bioremediation: When does it work? Washington, DC: NationalAcademy Press.
3. Bouwer, E.J., B.E. Rittman, and RL. McCarty. 1981. Anaerobic degradation of halogenated I - and 2-carbon organic compounds. Environ. Sci. Technol. 15 (5):596-599.
4. Wilson, J.T, and B.H. Wilson. 1985. Biotransformation of trichloroethylene in soil. Appl. Environ. Microbiol. 49(l):242-243.
5. Miller, R.E., and F.R Guengedch. 1982. Oxidation of trichloroethylene by liver microsomal cytochrome P-450: Evidence for chlorine migration in a transition state not involving trichloroethylene oxide. Biochemistry 21:1090-1097.
6. Nelson, M.J.K., S.O. Montgomery, E.J. O'Neille, and P.H. Pritchard. 1986. Aerobic metabolism oftrichloroethylene by a bacterial isolate. Appi. Environ. Microbiol. 52 (2):949-954.
7. Bouwer, E.J., and J.P. Wright. 1988. Transformations of trace halogenated aliphatics in anoxic biofilmcolumns. J. Contam. Hydrol. 2:155-169.
8. Lee, M.D. 1988. Biorestoration of aquifers contaminated with organic compounds. CRC Crit. Rev. Environ. Control 18:29-89.
9. Litde, C.D., A.V. Palumbo, S.E. Herbes, M.E. Lidstrom, R.L. Tyndall, and P.J. Gilmer. 1988. Trichloroethylene biodegradation by a methane-oxidizing bacterium. Appl. Environ. Microbiol. 54(4):951-956.
10. Mayer, K.R, D. Grbi-Gaii, L. Semprini, and P.L. McCarty. 1988. Degradation of trichloroethylene bymethanotrophic bacteria in a laboratory column of saturated aquifer material. Water Sci. Tech.20(11/12):175-178.
11. Arciero, D., T. Vannelli, M. Logan, and A.B. Hooper. 1989. Degradation of trichloroethylene by theammonia-oxidizing bacterium Nitrosomonas europaea. Biochem. Biophys. Res. Commun. 159:640-643.
12. Cline, RV., and J.J. Delfino. 1989. Transformation kinetics of 1,1,1-trichloroethane to the stable product1,1-Dichloroethene. In: Biohazards of drinking water treatment. Chelsea, MI: Lewis Publishers.
13. Freedman, D.L., and J.M. Gossett. 1989. Biological reductive dechlorination of tetrachloroethylene andtrichloroethylene to ethylene under methanogenic conditions. Appi. Environ. Microbial. 55:2144-2151.
14. Folsom, B.R., P.J. Chapman, and P.H. Pritchard. 1990. Phenol and trichloroethylene degradation byPseudomonas cepacia G4: Kinetics and interactions between substrates. Appl. Environ. Microbial.56(5):1279-1285.
15. Harker, A.R., and Y. Kim 1990. Trichloroethylene degradation by two independent aromatic-degradingpathways in Alcaligenes eutrophus JMP134. Appi. Environ. Microbial. 56(4):1179-1181.
16. Alvarez-Cohen, L.M., and P.L. McCarty. 1991. Effects of toxicity, aeration, and reductant supply ontrichloroethylene transformation by a mixed methanotrophic culture. Appl. Environ. Microbial. 57(l):228-
241/18/00(4:57PM)C:\kay\r4mna.wpd;version 3.0
235.
17. Alvarez-Cohen, L.M., and P.L. McCarty. 1991. Product toxicity and cometabolic competitive inhibitionmodeling of chloroform and trichloroethylene transformation by methanotrophic resting cells. Appl. Environ. Microbial. 57(4):1031-1037.
18. DeStefano, T.D, J.M. Gossen, and SH. Zinder. 1991. Reductive dehalogenation of high concentrations oftetrachloroethene to ethene by an anaerobic enrichment culture in the absence of methanogenesis. Appi. Environ. Microbial. 57(8):2287-2292.
19. Henry, S.M. 1991. Transformation of trichloroethylene by methanotrophs from a groundwater aquifer. Ph.D. thesis. Stanford University, Palo Alto, CA.
20. McCarty, P.L., P.V. Roberts, M. Reinhard, and G. Hopkins. 1992. Movement and transformations ofhalogenated aliphatic compounds in natural systems. In: Schnoor, J.L., ed. Fate of pesticides andchemicals in the environment. New York, NY: John Wiley & Sons.
21. Hartmans, S., and J.A.M. de Bont 1992. Aerobic vinyl chloride metabolism in Mycobacterium aurum Li. Appl. Environ. Microbiol. 58(4):1220-1226.
22. McCarty, P.L., and L. Semprini. 1994. Ground-water treatment for chlorinated solvents, In: Norris, R.D.,R.E. Hinchee, R. Brown, P.L. McCarty, L. Semprini, J.T Wilson, D.H. Kampbell, M. Reinhard, E.J. Bouwer,R.C. Borden, T.M. Vogel, J.M. Thomas, and C.H. Ward, eds. Handbook of bioremediation. Boca Raton,FL: Lewis Publishers.
23. Vogel, T.M. 1994. Natural bioremediation of chlorinated solvents. In: Norris, R.D., R.E. Hinchee, R.Brown, P.L. McCarty, L. Semprini, J.T. Wilson, D.H. Kampbell, M. Reinhard, E.J. Bouwer, R.C. Borden,T.M. Vogel, J.M. Thomas, and C.H. Ward, eds. Handbook of bioremediation. Boca Raton, FL: LewisPublishers.
24. Bouwer, E.J. 1994. Bioremediation of chlorinated solvents using alternate electron acceptors. In: Norris,R.D., R.E. Hinchee, R. Brown, P.L. McCarty, L. Semprini, J.T. Wilson, D.H. Kampbell, M. Reinhard, E.J.Bouwer, R.C. Borden, T.M. Vogel, J.M. Thomas, and C.H. Ward, eds. Handbook of bioremediation. BocaRaton, FL: Lewis Publishers.
25. Vogel, T.M., and P.L. McCarty. 1985. Biotransformation of tetrachloroethylene to trichloroethylene,dichloroethylene, vinyl chloride, and carbon dioxide under methanogenic conditions. Appl. Environ. Microbiol. 49(5):1080-1083.
26. Murray, W.D., and M. Richardson. 1993. Progress toward the biological treatment of Cl and C2halogenated hydrocarbons. Crit. Rev. Environ. Sci. Technol. 23(3):195-217.
27. Bradley, P.M., and F.H. Chapelle. 1996. Anaerobic mineralization of vinyl chloride in Fe(Ill)-reducingaquifer sediments. Environ. Sci. Technol. 40:2084-2086.
28. Wiedemeier, T.H., L.A. Benson, J.T. Wilson, D.H. Kampbell, J.E. Hansen, and R. Miknis. 1996. Patternsof natural attenuation of chlorinated aliphatic hydrocarbons at Plattsburgh Air Force Base, New York. Platform abstracts presented at the Conference on Intrinsic Remediation of Chlorinated Solvents, SaltLake City, UT, April 2.
29. U.S. EPA. 1986. Test methods for evaluating solid waste, physical and chemical methods, 3rd ed. SW-846. Washington, DC.
30. U.S. EPA. 1983. Methods for chemical analysis of water and wastes. EPA/16020-07-71. Cincinnati, OH.
251/18/00(4:57PM)C:\kay\r4mna.wpd;version 3.0
31. Hach Co. 1990. Hach Company Catalog: Products for Analysis. Ames, IA.
32. American Public Health Association. 1992. Standard methods for the examination of water andwastewater, 18th ed. Washington, DC.
33. AFCEE. 1993. Handbook to support the Installation Restoration Program (IRP) remedial investigationsand feasibility studies (RI/FS). U.S. Air Force Center for Environmental Excellence. September. BrooksAir Force Base, TX.
34. AFCEE. 1992. Environmental chemistry function Installation Restoration Program analytical protocols. June.
35. Kampbell, D.H., J.T. Wilson, and S.A. Vandegrift. 1989. Dissolved oxygen and methane in water by a GCheadspace equilibrium technique. Int. J. Environ. Anal. Chem. 36:249-257.
36. Wiedemeier, T.H., M.A. Swanson, J.T Wilson, D.H. Kampbell, R.N. Miller, and J.E. Hansen. 1996. Approximation of biodegradation rate constants for monoaromatic hydrocarbons (BTEX) in groundwater. Ground Water Monitoring and Remediation. In press.
37. Wiedemeier, T.H., M.A. Swanson, D.E. Moutoux, J.T. Wilson, D.H. Kampbell, J.E. Hansen, P. Haas, andF.H. Chapelle. 1996. Technical protocol for natural attenuation of chlorinated solvents in groundwater. San Antonio, TX: U.S. Air Force Center for Environmental Excellence. In preparation.
38. Domenico, RA. 1987. An analytical model for multidimensional transport of a decaying contaminantspecies. J. Hydrol. 91:49-58.
39. Domenico, P.A., and F.W. Schwartz. 1990. Physical and chemical hydrogeology New York, NY: JohnWiley and Sons.
40. Morel, F.M.M., and J.G. Hering. 1993. Principles and applications of aquatic chemistry. New York, NY:John Wiley & Sons.
41. Willey, L.M., Y.K. Kharaka, T.S. Presser, J.B. Rapp, and 1. Barnes.1975. Short chain aliphatic acidanions in oil field waters and their contribution to the measured alkalinity. Geochim. Cosmochim. Acta39:1707-1711.
42. Lovley, D.R., and S. Goodwin. 1988. Hydrogen concentrations as an indicator of the predominant terminalelectron-accepting reaction in aquatic sediments. Geochim. Cosmochim. Acta 52:2993-3003.
43. Lovley, D.R., F.H. Chapelle, and J.C. Woodward. 1994. Use of dissolved H2 concentrations to determinedistribution of microbially catalyzed redox reactions in anoxic groundwater. Environ. Sci. Technol.28(7):1205-1210.
44. Chapelle, F.H., P.B. McMahon, N.M. Dubrovsky, R.F. Fujii, E.T. Oaksford, and D.A. Vroblesky. 1995. Deducing the distribution of terminal electron-accepting processes in hydrologically diverse groundwatersystems. Water Resour. Res. 31:359-371.
45. Hem, J.D. 1985. Study and interpretation of the chemical characteristics of natural water. U.S. GeologicalSurvey Water Supply Paper 2254.
46. Kaufman, W.J., and G.T Orlob. 1956. Measuring ground water movement with radioactive and chemicaltracers. Am. Water Works Assn. J. 48:559-572.
47. Buscheck, T.E.G., and C.M. Alcantar. 1995. Regression techniques and analytical solutions to
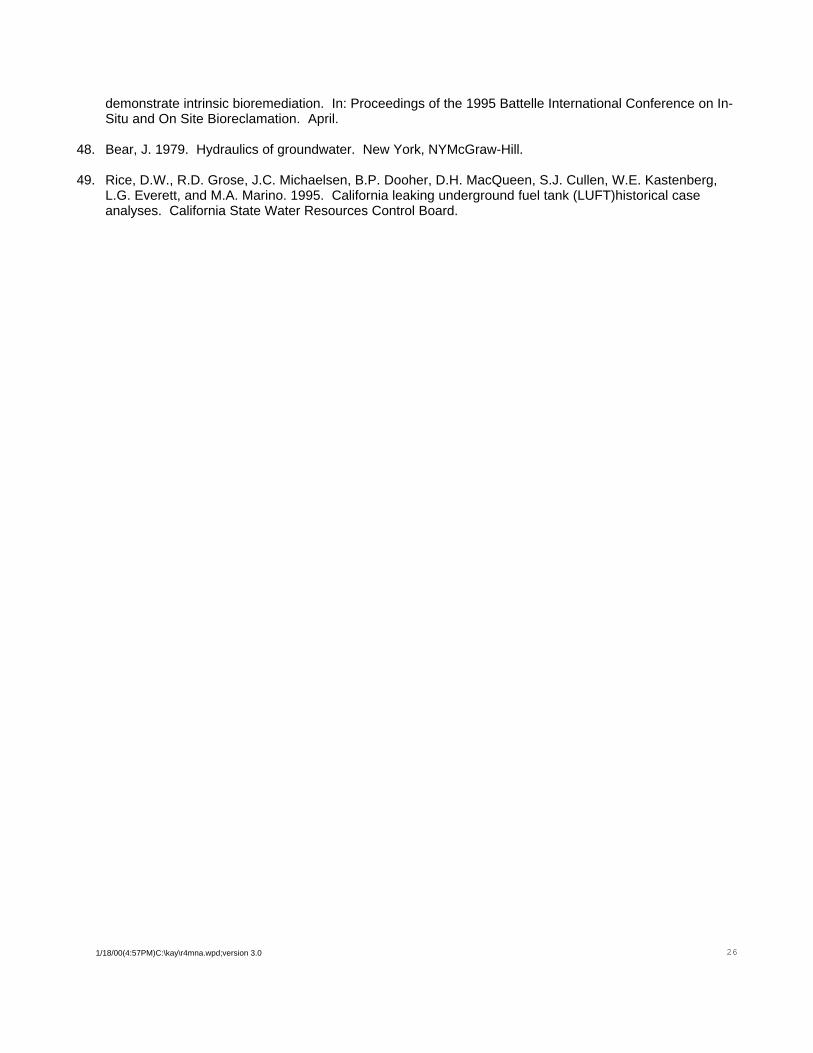
261/18/00(4:57PM)C:\kay\r4mna.wpd;version 3.0
demonstrate intrinsic bioremediation. In: Proceedings of the 1995 Battelle International Conference on In-Situ and On Site Bioreclamation. April.
48. Bear, J. 1979. Hydraulics of groundwater. New York, NYMcGraw-Hill.
49. Rice, D.W., R.D. Grose, J.C. Michaelsen, B.P. Dooher, D.H. MacQueen, S.J. Cullen, W.E. Kastenberg,L.G. Everett, and M.A. Marino. 1995. California leaking underground fuel tank (LUFT)historical caseanalyses. California State Water Resources Control Board.

271/18/00(4:57PM)C:\kay\r4mna.wpd;version 3.0
APPENDIX
Figures and Tables
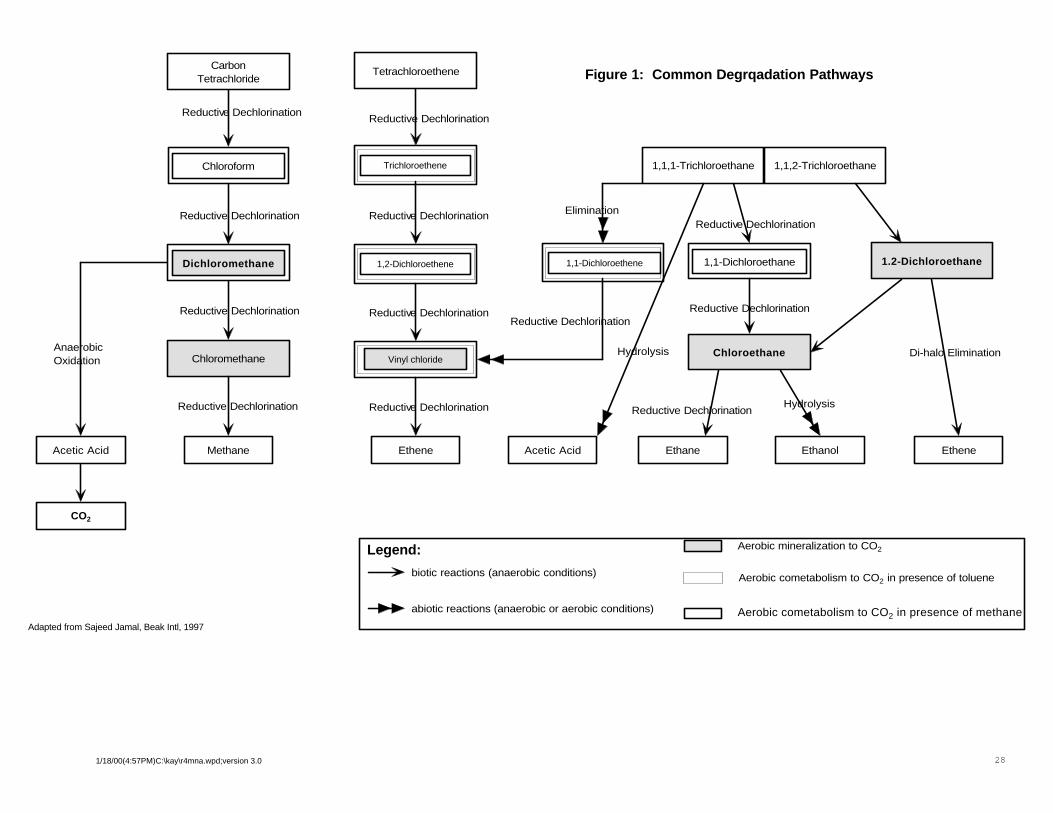
281/18/00(4:57PM)C:\kay\r4mna.wpd;version 3.0
CarbonTetrachloride
Chloromethane
Methane
Tetrachloroethene
Acetic Acid
CO2
1.2-Dichloroethane
1,1,1-Trichloroethane 1,1,2-Trichloroethane
Chloroethane
EtheneEthanolEthaneAcetic AcidEthene
Reductive Dechlorination
Reductive Dechlorination
Reductive Dechlorination
Reductive Dechlorination
AnaerobicOxidation
Reductive Dechlorination
Reductive Dechlorination
Reductive Dechlorination
Reductive DechlorinationReductive Dechlorination
Reductive Dechlorination
Reductive Dechlorination
Reductive Dechlorination
Elimination
Hydrolysis
Hydrolysis
Di-halo Elimination
Figure 1: Common Degrqadation Pathways
biotic reactions (anaerobic conditions)
abiotic reactions (anaerobic or aerobic conditions)
Aerobic mineralization to CO2
Aerobic cometabolism to CO2 in presence of toluene
Aerobic cometabolism to CO2 in presence of methane
Legend:
Adapted from Sajeed Jamal, Beak Intl, 1997
Chloroform
1,1-DichloroethaneDichloromethane
Vinyl chloride
1,2-Dichloroethene
Trichloroethene
1,1-Dichloroethene
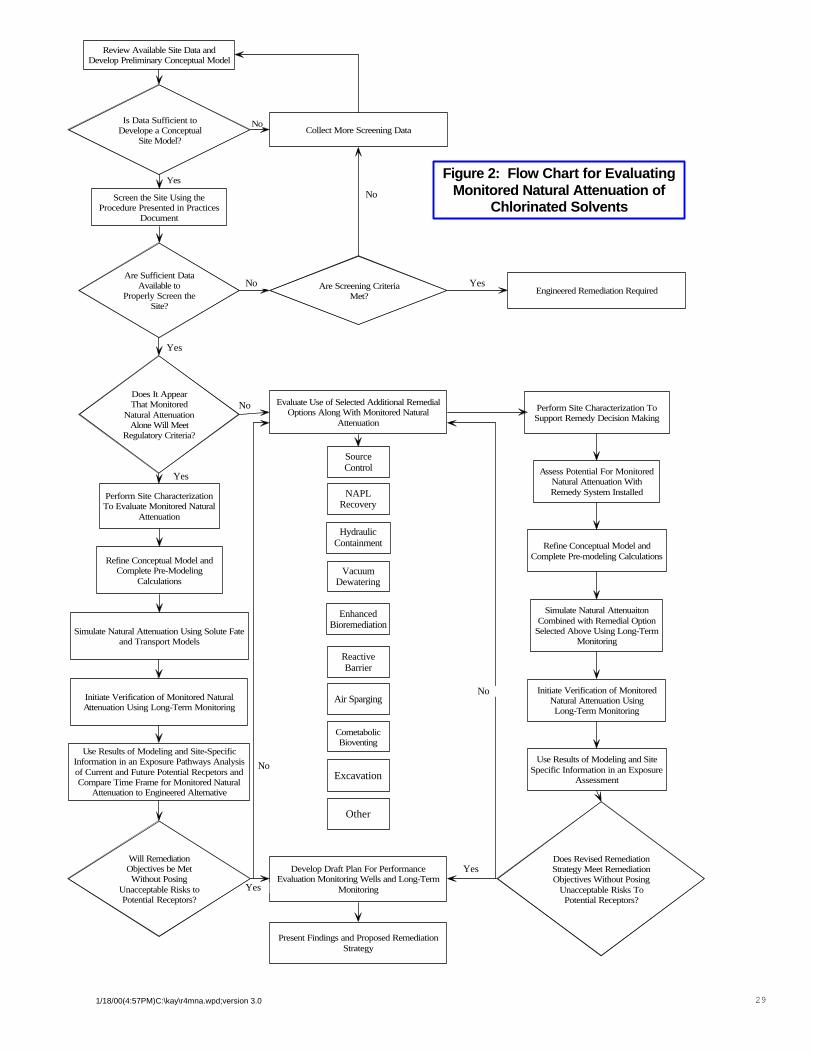
291/18/00(4:57PM)C:\kay\r4mna.wpd;version 3.0
Figure 2: Flow Chart for EvaluatingMonitored Natural Attenuation of
Chlorinated Solvents
Engineered Remediation Required
Perform Site Characterization ToSupport Remedy Decision Making
Assess Potential For MonitoredNatural Attenuation WithRemedy System Installed
Refine Conceptual Model andComplete Pre-modeling Calculations
Simulate Natural AttenuaitonCombined with Remedial Option
Selected Above Using Long-TermMonitoring
Use Results of Modeling and SiteSpecific Information in an Exposure
Assessment
Initiate Verification of MonitoredNatural Attenuation UsingLong-Term Monitoring
Does Revised RemediationStrategy Meet RemediationObjectives Without Posing
Unacceptable Risks ToPotential Receptors?
Are Screening CriteriaMet?
Collect More Screening Data
Evaluate Use of Selected Additional RemedialOptions Along With Monitored Natural
Attenuation
Develop Draft Plan For PerformanceEvaluation Monitoring Wells and Long-Term
Monitoring
Present Findings and Proposed RemediationStrategy
Yes
Yes
Yes
No
SourceControl
NAPLRecovery
HydraulicContainment
VacuumDewatering
EnhancedBioremediation
ReactiveBarrier
Air Sparging
CometabolicBioventing
Excavation
Other
Is Data Sufficient toDevelope a Conceptual
Site Model?
Screen the Site Using theProcedure Presented in Practices
Document
Does It AppearThat Monitored
Natural AttenuationAlone Will Meet
Regulatory Criteria?
Perform Site CharacterizationTo Evaluate Monitored Natural
Attenuation
Refine Conceptual Model andComplete Pre-Modeling
Calculations
Simulate Natural Attenuation Using Solute Fateand Transport Models
Initiate Verification of Monitored NaturalAttenuation Using Long-Term Monitoring
Use Results of Modeling and Site-SpecificInformation in an Exposure Pathways Analysisof Current and Future Potential Recpetors andCompare Time Frame for Monitored Natural
Attenuation to Engineered Alternative
Will RemediationObjectives be MetWithout Posing
Unacceptable Risks toPotential Receptors?
Review Available Site Data andDevelop Preliminary Conceptual Model
Are Sufficient DataAvailable to
Properly Screen theSite?
Yes
No
No
Yes
Yes
No
No
No
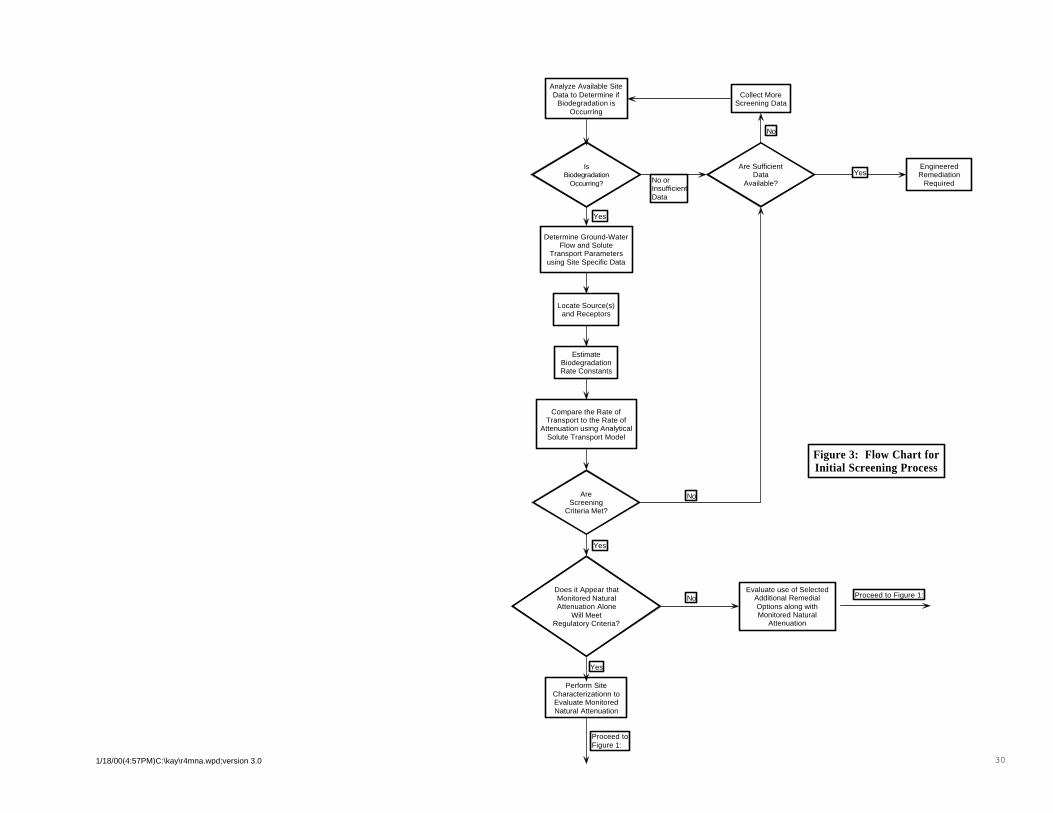
301/18/00(4:57PM)C:\kay\r4mna.wpd;version 3.0
Figure 3: Flow Chart forInitial Screening Process
Are SufficientData
Available?
Analyze Available SiteData to Determine if
Biodegradation isOccurring
IsBiodegradation
Occurring?
Determine Ground-WaterFlow and Solute
Transport Parametersusing Site Specific Data
Collect MoreScreening Data
EngineeredRemediation
Required
Locate Source(s)and Receptors
EstimateBiodegradationRate Constants
Compare the Rate ofTransport to the Rate of
Attenuation using AnalyticalSolute Transport Model
AreScreening
Criteria Met?
Does it Appear thatMonitored NaturalAttenuation Alone
Will MeetRegulatory Criteria?
Perform SiteCharacterizationn toEvaluate MonitoredNatural Attenuation
Evaluate use of SelectedAdditional RemedialOptions along withMonitored Natural
Attenuation
No orInsufficientData
No
Yes
Yes
No
Yes
Yes
No Proceed to Figure 1:
Proceed toFigure 1:
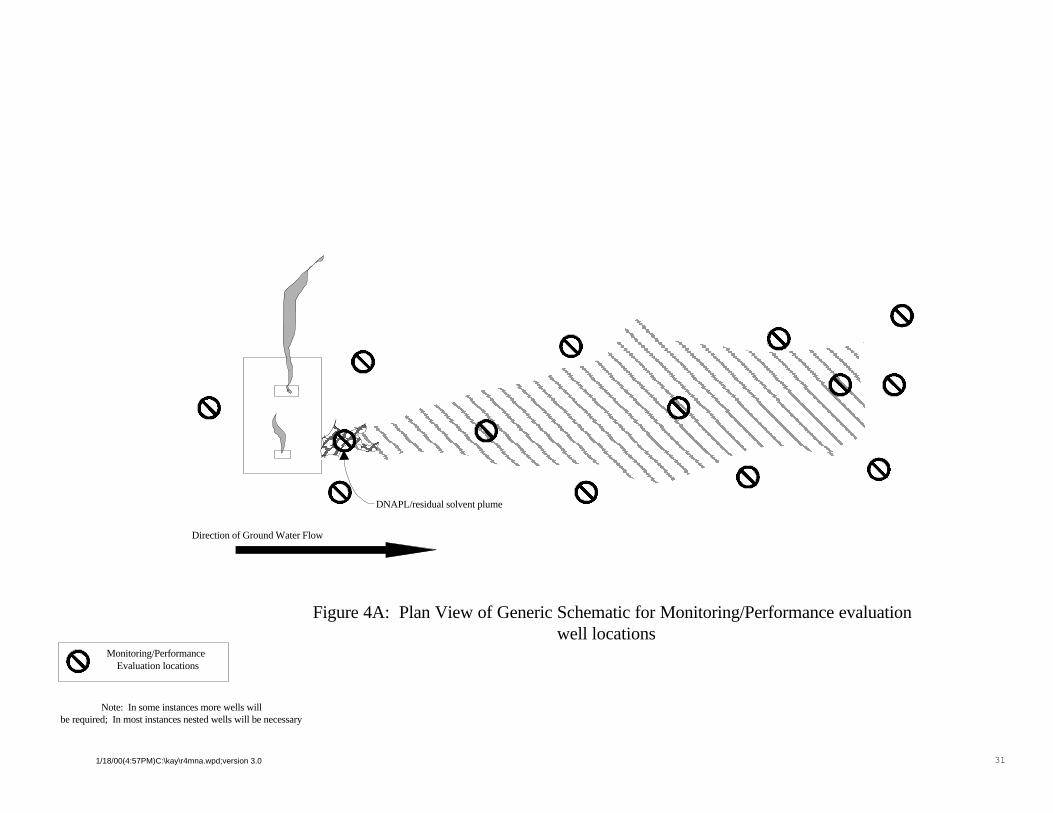
311/18/00(4:57PM)C:\kay\r4mna.wpd;version 3.0
Figure 4A: Plan View of Generic Schematic for Monitoring/Performance evaluationwell locations
Note: In some instances more wells will be required; In most instances nested wells will be necessary
DNAPL/residual solvent plume
Direction of Ground Water Flow
Monitoring/Performance Evaluation locations
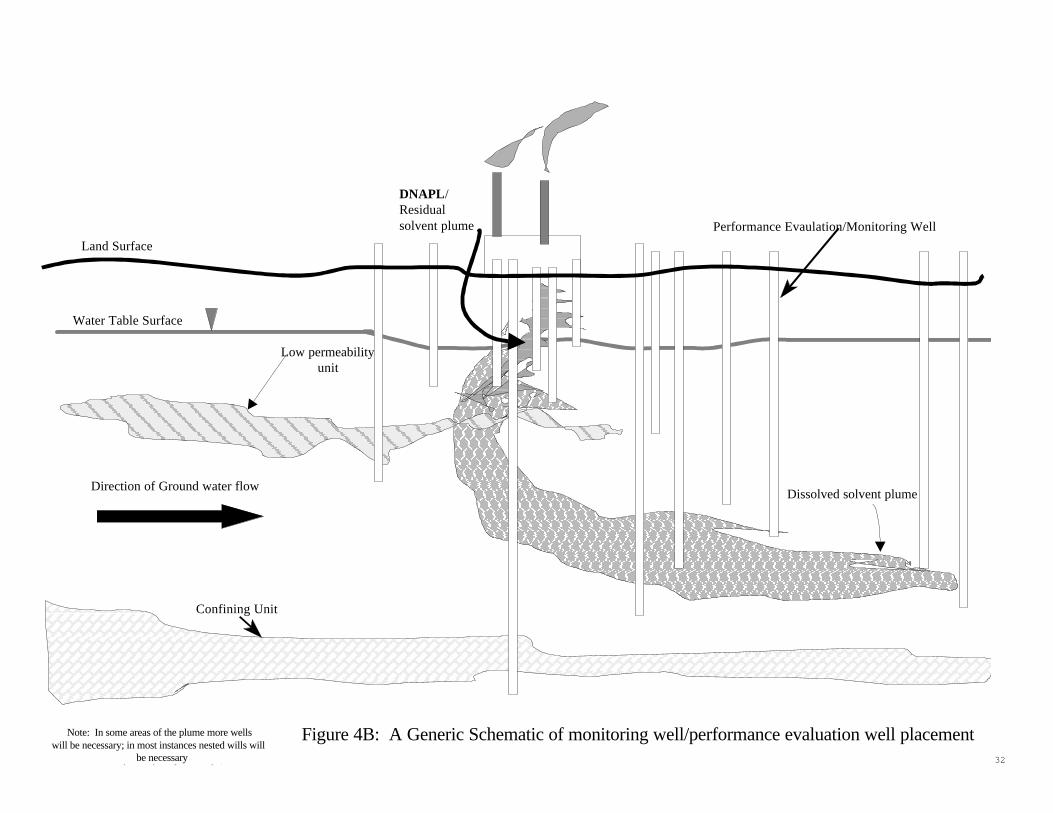
321/18/00(4:57PM)C:\kay\r4mna.wpd;version 3.0
Direction of Ground water flowDissolved solvent plume
DNAPL/Residualsolvent plume
Low permeabilityunit
Figure 4B: A Generic Schematic of monitoring well/performance evaluation well placementNote: In some areas of the plume more wellswill be necessary; in most instances nested wills will
be necessary
Water Table Surface
Land Surface
Performance Evaulation/Monitoring Well
Confining Unit
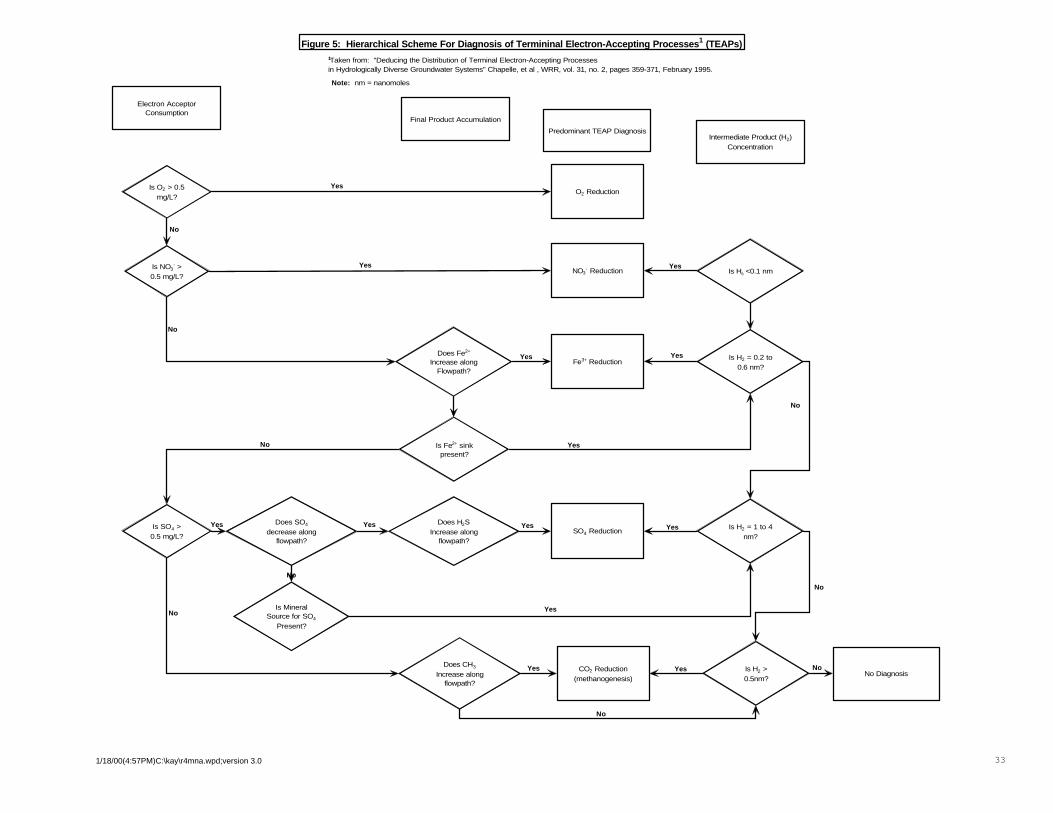
331/18/00(4:57PM)C:\kay\r4mna.wpd;version 3.0
Figure 5: Hierarchical Scheme For Diagnosis of Termininal Electron-Accepting Processes1 (TEAPs)
Electron AcceptorConsumption
Is O2 > 0.5mg/L?
Is NO3- >
0.5 mg/L?
Is SO4 >0.5 mg/L?
Does CH3
Increase alongflowpath?
Final Product Accumulation
Does Fe2+
Increase alongFlowpath?
Is Fe2+ sinkpresent?
Does H2SIncrease along
flowpath?
Predominant TEAP Diagnosis
O2 Reduction
NO3- Reduction
Fe3+ Reduction
SO4 Reduction
CO2 Reduction(methanogenesis)
Intermediate Product (H2)Concentration
Is Hs <0.1 nm
Is H2 = 0.2 to0.6 nm?
Is H2 = 1 to 4nm?
Is H2 >0.5nm?
No Diagnosis
Does SO4
decrease alongflowpath?
Is MineralSource for SO4
Present?
No
No
No
No
No
No
No
Yes
Yes Yes
YesYes
Yes
Yes Yes Yes Yes
Yes
Yes Yes
No
No
Note: nm = nanomoles
1Taken from: "Deducing the Distribution of Terminal Electron-Accepting Processesin Hydrologically Diverse Groundwater Systems" Chapelle, et al , WRR, vol. 31, no. 2, pages 359-371, February 1995.
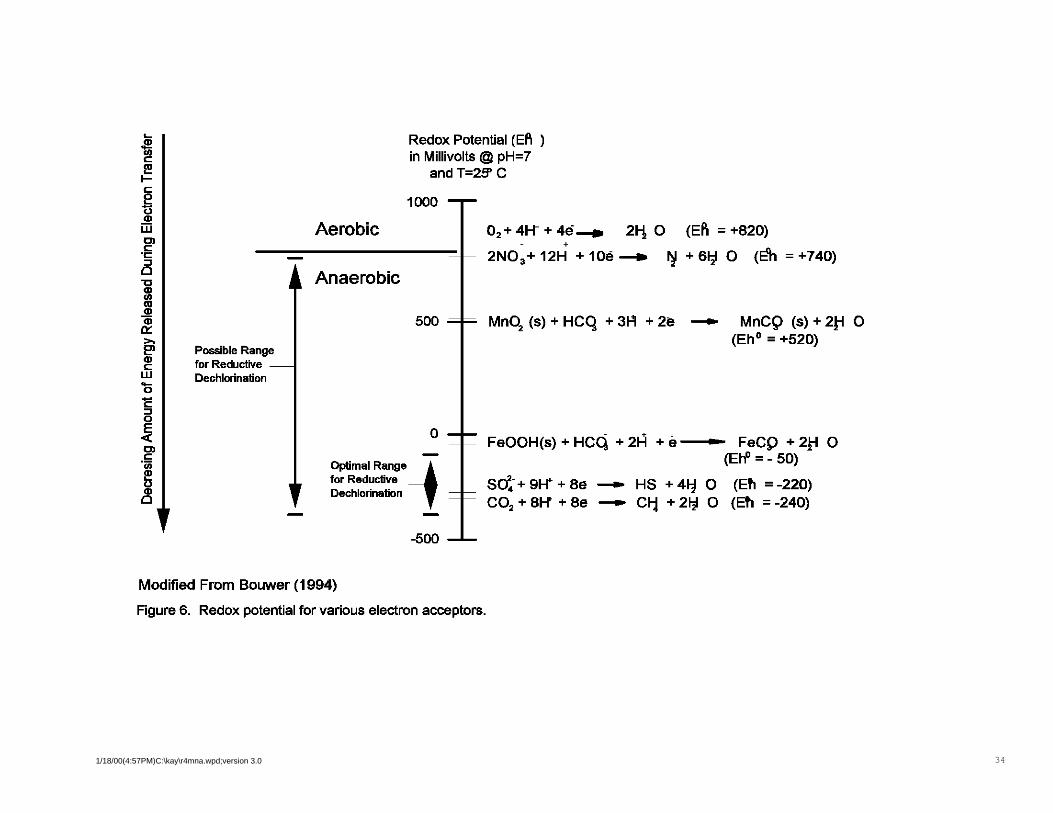
341/18/00(4:57PM)C:\kay\r4mna.wpd;version 3.0
Possible Range for Reductive Dechlorination
Aerobic
Anaerobic
Redox Potential (Ell ) in Millivolts @ pH=7
and T=2B' C
1000
O2 + 4H' + 4e _ 21-j, 0 (Efl = +820) +
2N0 3 + 12H + 10e _ ~ + 61;1 0 (Eh = +740)
500 Mn02 (s) + HCq + 31-'1 + 2e - MnC9 (s) + 2tl 0 (Eho = +520)
o - + FeOOH(s) + HCq + 2H + e - .... - FeCp + 2£1 0
Optimal Rangei for Reductive Dechlorination
(Elf = - 50)
sd.- + 9H'" + 8e - HS + 4~ 0 (Efl = -220) CO, + 8H' + 8e - Cli + 21;1 0 (Eti = -240)
-500
Modified From Bouwer (1994)
Figure 6. Redox potential for various electron acceptors.
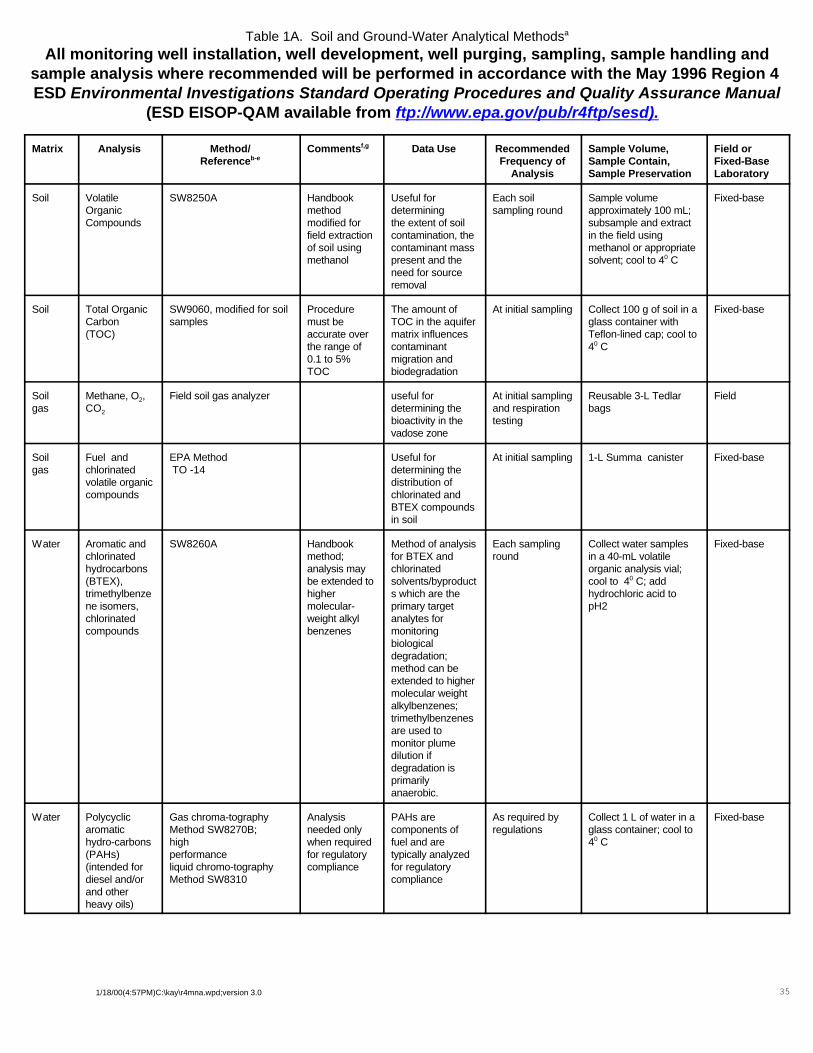
351/18/00(4:57PM)C:\kay\r4mna.wpd;version 3.0
Table 1A. Soil and Ground-Water Analytical Methodsa
All monitoring well installation, well development, well purging, sampling, sample handling andsample analysis where recommended will be performed in accordance with the May 1996 Region 4 ESD Environmental Investigations Standard Operating Procedures and Quality Assurance Manual
(ESD EISOP-QAM available from ftp://www.epa.gov/pub/r4ftp/sesd).
Matrix Analysis Method/Referenceb-e
Commentsf,g Data Use RecommendedFrequency of
Analysis
Sample Volume,Sample Contain,Sample Preservation
Field orFixed-BaseLaboratory
Soil VolatileOrganicCompounds
SW8250A Handbookmethodmodified forfield extractionof soil usingmethanol
Useful fordeterminingthe extent of soil contamination, thecontaminant masspresent and theneed for sourceremoval
Each soilsampling round
Sample volumeapproximately 100 mL;subsample and extractin the field usingmethanol or appropriatesolvent; cool to 40 C
Fixed-base
Soil Total OrganicCarbon(TOC)
SW9060, modified for soilsamples
Proceduremust beaccurate overthe range of0.1 to 5%TOC
The amount ofTOC in the aquifermatrix influencescontaminantmigration andbiodegradation
At initial sampling Collect 100 g of soil in aglass container withTeflon-lined cap; cool to40 C
Fixed-base
Soilgas
Methane, O2,CO2
Field soil gas analyzer useful fordetermining thebioactivity in thevadose zone
At initial samplingand respirationtesting
Reusable 3-L Tedlarbags
Field
Soilgas
Fuel andchlorinatedvolatile organiccompounds
EPA Method TO -14
Useful fordetermining thedistribution ofchlorinated andBTEX compoundsin soil
At initial sampling 1-L Summa canister Fixed-base
Water Aromatic andchlorinatedhydrocarbons(BTEX),trimethylbenzene isomers,chlorinated compounds
SW8260A Handbookmethod;analysis maybe extended tohighermolecular-weight alkylbenzenes
Method of analysisfor BTEX andchlorinatedsolvents/byproducts which are theprimary targetanalytes formonitoringbiologicaldegradation;method can beextended to highermolecular weightalkylbenzenes;trimethylbenzenesare used tomonitor plumedilution ifdegradation isprimarilyanaerobic.
Each samplinground
Collect water samplesin a 40-mL volatileorganic analysis vial;cool to 40 C; addhydrochloric acid topH2
Fixed-base
Water Polycyclicaromatichydro-carbons(PAHs)(intended fordiesel and/orand otherheavy oils)
Gas chroma-tographyMethod SW8270B;highperformanceliquid chromo-tographyMethod SW8310
Analysisneeded onlywhen requiredfor regulatorycompliance
PAHs arecomponents offuel and aretypically analyzedfor regulatorycompliance
As required byregulations
Collect 1 L of water in aglass container; cool to 40 C
Fixed-base
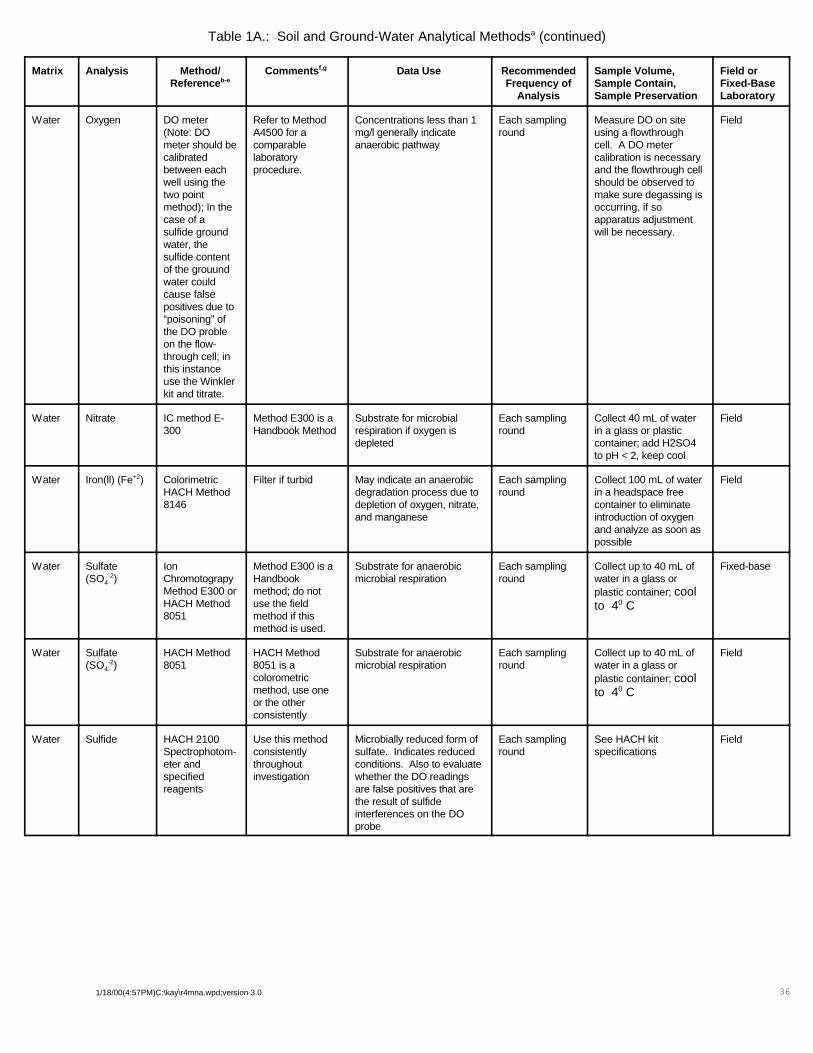
361/18/00(4:57PM)C:\kay\r4mna.wpd;version 3.0
Table 1A.: Soil and Ground-Water Analytical Methodsa (continued)
Matrix Analysis Method/Referenceb-e
Commentsf,g Data Use RecommendedFrequency of
Analysis
Sample Volume,Sample Contain,Sample Preservation
Field orFixed-BaseLaboratory
Water Oxygen DO meter(Note: DOmeter should becalibratedbetween eachwell using thetwo pointmethod); In thecase of asulfide groundwater, thesulfide contentof the grouundwater couldcause falsepositives due to“poisoning” ofthe DO probleon the flow-through cell; inthis instanceuse the Winklerkit and titrate.
Refer to MethodA4500 for acomparablelaboratoryprocedure.
Concentrations less than 1mg/l generally indicateanaerobic pathway
Each samplinground
Measure DO on siteusing a flowthroughcell. A DO metercalibration is necessaryand the flowthrough cellshould be observed tomake sure degassing isoccurring, if soapparatus adjustmentwill be necessary.
Field
Water Nitrate IC method E-300
Method E300 is aHandbook Method
Substrate for microbialrespiration if oxygen isdepleted
Each samplinground
Collect 40 mL of waterin a glass or plasticcontainer; add H2SO4to pH < 2, keep cool
Field
Water Iron(ll) (Fe+2) ColorimetricHACH Method 8146
Filter if turbid May indicate an anaerobicdegradation process due todepletion of oxygen, nitrate,and manganese
Each samplinground
Collect 100 mL of waterin a headspace freecontainer to eliminateintroduction of oxygenand analyze as soon aspossible
Field
Water Sulfate(SO4
-2)IonChromotograpyMethod E300 orHACH Method8051
Method E300 is aHandbookmethod; do notuse the fieldmethod if thismethod is used.
Substrate for anaerobicmicrobial respiration
Each samplinground
Collect up to 40 mL ofwater in a glass orplastic container; coolto 40 C
Fixed-base
Water Sulfate(SO4
-2)HACH Method8051
HACH Method8051 is acolorometricmethod, use oneor the otherconsistently
Substrate for anaerobicmicrobial respiration
Each samplinground
Collect up to 40 mL ofwater in a glass orplastic container; coolto 40 C
Field
Water Sulfide HACH 2100Spectrophotom-eter andspecifiedreagents
Use this methodconsistentlythroughoutinvestigation
Microbially reduced form ofsulfate. Indicates reducedconditions. Also to evaluatewhether the DO readingsare false positives that arethe result of sulfideinterferences on the DOprobe
Each samplinground
See HACH kitspecifications
Field
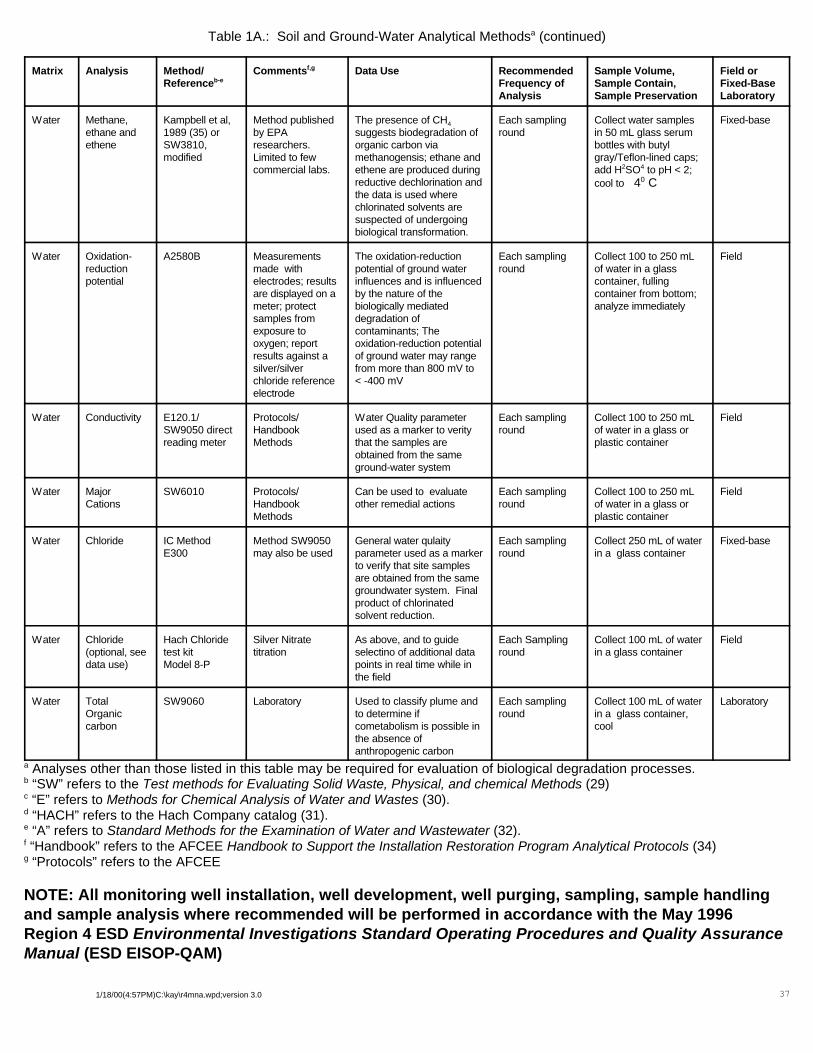
371/18/00(4:57PM)C:\kay\r4mna.wpd;version 3.0
Table 1A.: Soil and Ground-Water Analytical Methodsa (continued)
Matrix Analysis Method/Referenceb-e
Commentsf,g Data Use RecommendedFrequency ofAnalysis
Sample Volume,Sample Contain,Sample Preservation
Field orFixed-BaseLaboratory
Water Methane,ethane andethene
Kampbell et al,1989 (35) orSW3810,modified
Method publishedby EPAresearchers. Limited to fewcommercial labs.
The presence of CH4
suggests biodegradation oforganic carbon viamethanogensis; ethane andethene are produced duringreductive dechlorination andthe data is used wherechlorinated solvents aresuspected of undergoingbiological transformation.
Each samplinground
Collect water samplesin 50 mL glass serumbottles with butylgray/Teflon-lined caps;add H2SO4 to pH < 2;cool to 40 C
Fixed-base
Water Oxidation-reductionpotential
A2580B Measurementsmade withelectrodes; resultsare displayed on ameter; protectsamples fromexposure tooxygen; reportresults against asilver/silverchloride referenceelectrode
The oxidation-reductionpotential of ground waterinfluences and is influencedby the nature of thebiologically mediateddegradation ofcontaminants; Theoxidation-reduction potentialof ground water may range from more than 800 mV to< -400 mV
Each samplinground
Collect 100 to 250 mLof water in a glasscontainer, fullingcontainer from bottom;analyze immediately
Field
Water Conductivity E120.1/SW9050 directreading meter
Protocols/HandbookMethods
Water Quality parameterused as a marker to veritythat the samples areobtained from the sameground-water system
Each samplinground
Collect 100 to 250 mLof water in a glass orplastic container
Field
Water MajorCations
SW6010 Protocols/HandbookMethods
Can be used to evaluateother remedial actions
Each samplinground
Collect 100 to 250 mLof water in a glass orplastic container
Field
Water Chloride IC MethodE300
Method SW9050may also be used
General water qulaityparameter used as a markerto verify that site samplesare obtained from the samegroundwater system. Finalproduct of chlorinatedsolvent reduction.
Each samplinground
Collect 250 mL of waterin a glass container
Fixed-base
Water Chloride(optional, seedata use)
Hach Chloridetest kit Model 8-P
Silver Nitratetitration
As above, and to guideselectino of additional datapoints in real time while inthe field
Each Samplinground
Collect 100 mL of waterin a glass container
Field
Water TotalOrganiccarbon
SW9060 Laboratory Used to classify plume andto determine ifcometabolism is possible inthe absence ofanthropogenic carbon
Each samplinground
Collect 100 mL of waterin a glass container,cool
Laboratory
a Analyses other than those listed in this table may be required for evaluation of biological degradation processes.b “SW” refers to the Test methods for Evaluating Solid Waste, Physical, and chemical Methods (29)c “E” refers to Methods for Chemical Analysis of Water and Wastes (30).d “HACH” refers to the Hach Company catalog (31).e “A” refers to Standard Methods for the Examination of Water and Wastewater (32).f “Handbook” refers to the AFCEE Handbook to Support the Installation Restoration Program Analytical Protocols (34)g “Protocols” refers to the AFCEE
NOTE: All monitoring well installation, well development, well purging, sampling, sample handlingand sample analysis where recommended will be performed in accordance with the May 1996Region 4 ESD Environmental Investigations Standard Operating Procedures and Quality AssuranceManual (ESD EISOP-QAM)
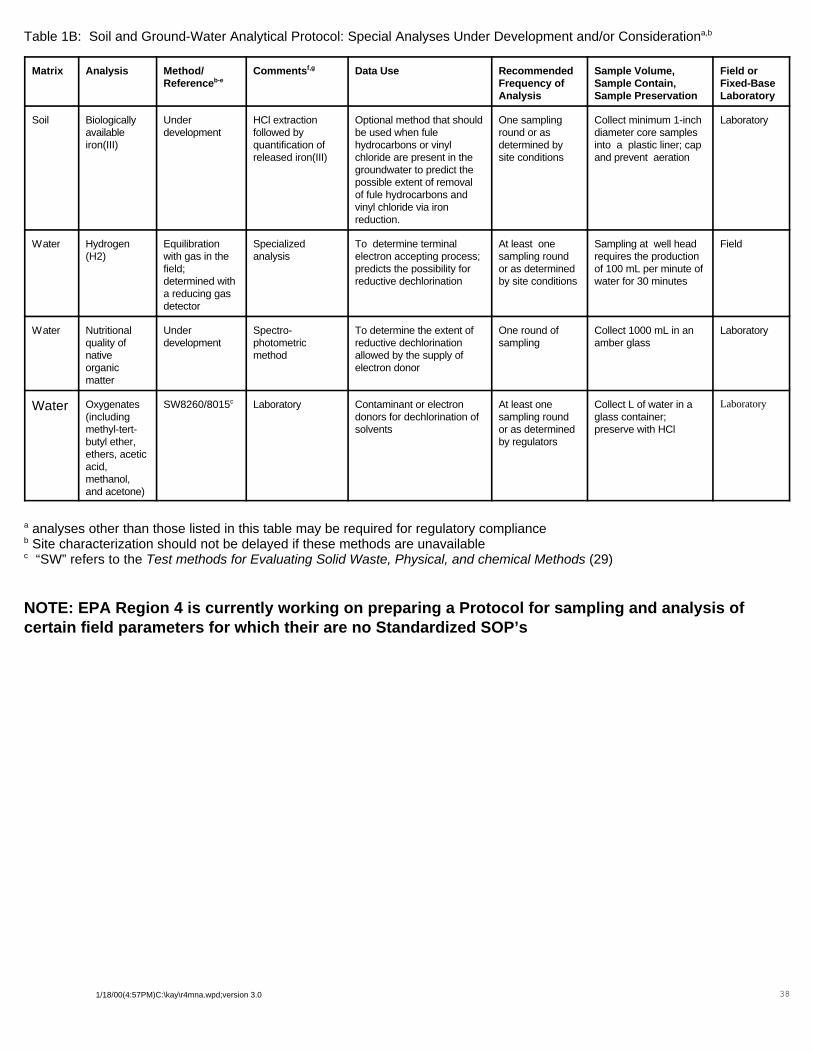
381/18/00(4:57PM)C:\kay\r4mna.wpd;version 3.0
Table 1B: Soil and Ground-Water Analytical Protocol: Special Analyses Under Development and/or Considerationa,b
Matrix Analysis Method/Referenceb-e
Commentsf,g Data Use RecommendedFrequency ofAnalysis
Sample Volume,Sample Contain,Sample Preservation
Field orFixed-BaseLaboratory
Soil Biologicallyavailableiron(III)
Underdevelopment
HCl extractionfollowed byquantification ofreleased iron(III)
Optional method that shouldbe used when fulehydrocarbons or vinylchloride are present in thegroundwater to predict thepossible extent of removalof fule hydrocarbons andvinyl chloride via ironreduction.
One samplinground or asdetermined bysite conditions
Collect minimum 1-inchdiameter core samplesinto a plastic liner; capand prevent aeration
Laboratory
Water Hydrogen(H2)
Equilibrationwith gas in thefield;determined witha reducing gasdetector
Specializedanalysis
To determine terminalelectron accepting process;predicts the possibility forreductive dechlorination
At least onesampling roundor as determinedby site conditions
Sampling at well headrequires the productionof 100 mL per minute ofwater for 30 minutes
Field
Water Nutritionalquality ofnativeorganicmatter
Underdevelopment
Spectro-photometricmethod
To determine the extent ofreductive dechlorinationallowed by the supply ofelectron donor
One round ofsampling
Collect 1000 mL in anamber glass
Laboratory
Water Oxygenates(includingmethyl-tert-butyl ether,ethers, aceticacid,methanol,and acetone)
SW8260/8015c Laboratory Contaminant or electrondonors for dechlorination ofsolvents
At least onesampling roundor as determinedby regulators
Collect L of water in aglass container;preserve with HCl
Laboratory
a analyses other than those listed in this table may be required for regulatory complianceb Site characterization should not be delayed if these methods are unavailablec “SW” refers to the Test methods for Evaluating Solid Waste, Physical, and chemical Methods (29)
NOTE: EPA Region 4 is currently working on preparing a Protocol for sampling and analysis ofcertain field parameters for which their are no Standardized SOP’s
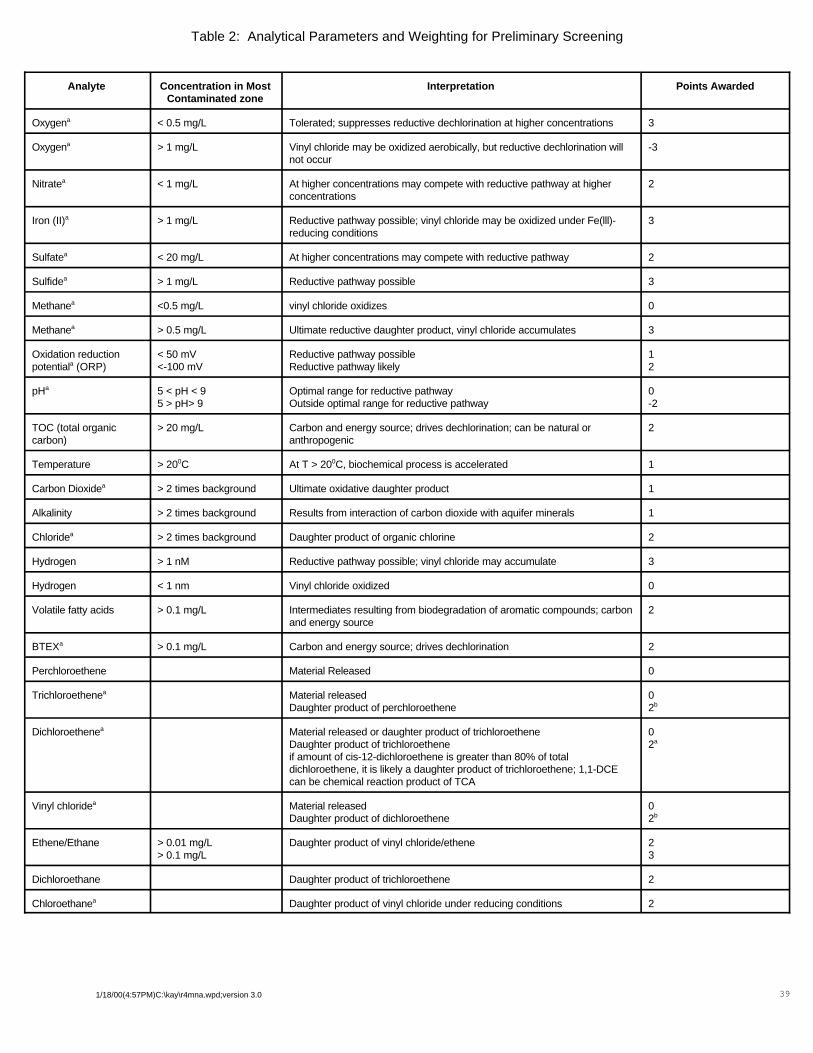
391/18/00(4:57PM)C:\kay\r4mna.wpd;version 3.0
Table 2: Analytical Parameters and Weighting for Preliminary Screening
Analyte Concentration in MostContaminated zone
Interpretation Points Awarded
Oxygena < 0.5 mg/L Tolerated; suppresses reductive dechlorination at higher concentrations 3
Oxygena > 1 mg/L Vinyl chloride may be oxidized aerobically, but reductive dechlorination willnot occur
-3
Nitratea < 1 mg/L At higher concentrations may compete with reductive pathway at higherconcentrations
2
Iron (II)a > 1 mg/L Reductive pathway possible; vinyl chloride may be oxidized under Fe(lll)-reducing conditions
3
Sulfatea < 20 mg/L At higher concentrations may compete with reductive pathway 2
Sulfidea > 1 mg/L Reductive pathway possible 3
Methanea <0.5 mg/L vinyl chloride oxidizes 0
Methanea > 0.5 mg/L Ultimate reductive daughter product, vinyl chloride accumulates 3
Oxidation reductionpotentiala (ORP)
< 50 mV<-100 mV
Reductive pathway possibleReductive pathway likely
12
pHa 5 < pH < 95 > pH> 9
Optimal range for reductive pathwayOutside optimal range for reductive pathway
0-2
TOC (total organic carbon)
> 20 mg/L Carbon and energy source; drives dechlorination; can be natural oranthropogenic
2
Temperature > 200C At T > 200C, biochemical process is accelerated 1
Carbon Dioxidea > 2 times background Ultimate oxidative daughter product 1
Alkalinity > 2 times background Results from interaction of carbon dioxide with aquifer minerals 1
Chloridea > 2 times background Daughter product of organic chlorine 2
Hydrogen > 1 nM Reductive pathway possible; vinyl chloride may accumulate 3
Hydrogen < 1 nm Vinyl chloride oxidized 0
Volatile fatty acids > 0.1 mg/L Intermediates resulting from biodegradation of aromatic compounds; carbonand energy source
2
BTEXa > 0.1 mg/L Carbon and energy source; drives dechlorination 2
Perchloroethene Material Released 0
Trichloroethenea Material releasedDaughter product of perchloroethene
02b
Dichloroethenea Material released or daughter product of trichloroetheneDaughter product of trichloroetheneif amount of cis-12-dichloroethene is greater than 80% of totaldichloroethene, it is likely a daughter product of trichloroethene; 1,1-DCEcan be chemical reaction product of TCA
02a
Vinyl chloridea Material releasedDaughter product of dichloroethene
02b
Ethene/Ethane > 0.01 mg/L> 0.1 mg/L
Daughter product of vinyl chloride/ethene 23
Dichloroethane Daughter product of trichloroethene 2
Chloroethanea Daughter product of vinyl chloride under reducing conditions 2

Analyte Concentration in MostContaminated zone
Interpretation Points Awarded
401/18/00(4:57PM)C:\kay\r4mna.wpd;version 3.0
1,1,1-TrichloroethaneaMaterial Released 0
Chloroform Material ReleasedDaughter product of Carbon Tetrachloride
02
Carbon Tetrachloride Material Released 0
Dichloromethane Material ReleasedDaughter product of chloroform
02
a Required Analysisb Points awarded only if it can be shown that the compound is a daughter product (i.e., not a constituent of the source NAPL).