Embed Size (px)
Citation preview

Transportation/Traffic
JOHN WAYNE AIRPORT SETTLEMENT AGREEMENT AMENDMENT 4.8-1 ENVIRONMENTAL IMPACT REPORT
4.8 TRANSPORTATION/TRAFFIC This section discusses Project-related impacts associated with transportation and circulation, specifically with respect to vehicular traffic impacts on the roadway circulation system surrounding the Project site. The potential impacts of the Project were evaluated in detail in the John Wayne Airport Transportation Impact Analysis (Fehr & Peers, 2014). The findings of this technical report are summarized in this section. The technical report is provided as Appendix G of this EIR. The Project does not propose any construction of improvements at the Airport; therefore, increased hazards due to a design feature; inadequate emergency access; or conflict with adopted policies, plan or programs regarding public transit, bicycle, or pedestrian facilities, or otherwise decrease the performance or safety of such facilities were determined not to be applicable. Therefore, these topics are not discussed in this section (refer to the Notice of Preparation [“NOP”]/Initial Study in Appendix A). 4.8.1 REGULATORY SETTING
REGIONAL REGULATIONS Orange County Congestion Management Program The Orange County Congestion Management Program (“CMP”) was originally adopted in 1991 and updated most recently in 2011. The goals of the Orange County CMP are to support regional mobility and air quality objectives by reducing traffic congestion; provide a mechanism for coordinating land use and development decisions that support the regional economy; and determine gas tax fund eligibility. To meet these goals, the CMP contains a number of policies designed to monitor and address system performance issues. The Orange County Transportation Authority (“OCTA”) was designated as the Congestion Management Agency (“CMA”) for the County. As a result, OCTA is responsible for the development, monitoring, and biennial updating of Orange County’s CMP. A key element of the current Land Use Analysis Program of the CMP is the preparation by local jurisdictions of a Traffic Impact Analysis Study (“TIS”). The TIS reports are designed to provide an improved basis for assessing the impacts of land use decisions on the regional transportation system, both within and outside the permitting jurisdiction, by providing a consistent format to identify impacts and mitigations, and to evaluate mitigation costs. A CMP TIS has additional requirements and evaluations compared to a typical traffic study. A TIS report helps to determine appropriate mitigation measures and financial responsibilities for resolution of the ongoing CMP system impacts and for developing appropriate mitigations for future development projects. General Plan Policies The General Plans for the local jurisdictions contain policies on providing a balanced land use and transportation network. Many of these General Plans outline level of service standards. Where applicable these standards have been incorporated into the thresholds of significance for determining if the Project would result in a significant impact. The goals and policies applicable to JWA from the General Plans for the County of Orange and cities of Newport Beach, Irvine, Costa Mesa, Santa Ana, and Tustin have been addressed in Section 4.5, Land Use and Planning.

Transportation/Traffic
4.8-2 JOHN WAYNE AIRPORT SETTLEMENT AGREEMENT AMENDMENT ENVIRONMENTAL IMPACT REPORT
4.8.2 METHODOLOGY The study area was identified through an iterative process in cooperation with the local jurisdictions surrounding the Airport. As a starting point, the study area from the previous Settlement Agreement Amendment (completed in 2001) was utilized. This study area was then provided to the following state, regional, and local agencies for their review and comment: • OCTA • City of Costa Mesa • City of Irvine • County of Orange • City of Newport Beach • California Department of Transportation (“Caltrans”) • Transportation Corridor Agencies (“TCA”) The study area was modified to include additional study locations requested by the local jurisdictions. The City of Irvine requested a four-step process for determining the intersections that required evaluation in the traffic analysis. The process requested by the City of Irvine, which is discussed in Appendix B of the Transportation Impact Analysis (the full report is provided in Appendix G), identified those locations that would carry more than 50 peak hour Project-related trips and were identified in the comprehensive study for the Irvine Business Complex (“IBC”) as operating at a deficient level of service in either a near-term or longer-term scenario. These locations were added to the traffic study area. Exhibit 4.8-1 depicts the final recommended study area and study intersections. Exhibit 4.8-2 identifies the area within the IBC.
TRAFFIC MODELING AND PERFORMANCE MEASURES The Orange County Transportation Analysis Model (“OCTAM”) was used to project future traffic levels on the roadways within the study area. OCTAM is maintained by OCTA for use in regional transportation studies. The key reason for using OCTAM was that the Airport is a regional facility and OCTAM distributes traffic throughout Orange County and the larger region. Additionally, it incorporates the latest available land use forecasts for Orange County, Orange County Projections 20121. The traffic analyses focuses on the morning and afternoon peak period when traffic is heaviest. Trips during non-peak hours would not have the same adverse impacts because there would be greater capacity available on the roadway network. The peak periods 1 City of Irvine Citywide Travel Demand Model (“ITAM”) is derived from OCTAM but includes additional data within the City of Irvine. An additional review was conducted to determine whether the use of ITAM would result in the identification of any significant impacts at locations within the City of Irvine not otherwise identified with use of the OCTAM. As part of this review, the results from a version of ITAM for 2017 were compared against the 2016 No Project and With Project results. This comparison determined that the LOS was similar between the two models at the common intersections and that the ITAM results were often the same as the OCTAM results. This review of OCTAM to ITAM for the same time period indicated that the use of ITAM would not result in the identification of any additional significant impacts in the City of Irvine; therefore OCTAM was utilized for the entire study area for consistency purposes.

Analyzed Intersections and Project Study Area Exhibit 4.8-1John Wayne Airport Settlement Agreement Amendment
Map not to scale (04/07/2014 CJS) R:\Projects\JWA\J003\Graphics\EIR\Ex_trffc_study_area.pdf
D:\P
roje
cts\
JWA
\J00
3\G
raph
ics\
Ex_
trffc
_stu
dy_a
rea.
ai
!
!
!
!
!
!
!
!
!
!
!
!
!
!
!
!
!
!!
!
!
!
!
!
!
!
!
!
!
!
!
!
!
!
!
!
!
!
!
!
!
!
!
!
!
!
!
!
!
!
!
!
!
!
!
!
!
!
!
¥§̈405
¥§̈405
Ä55
Ä73
Ä261
Main St
Har
vard
Ave
MacArthur Blvd
Fa i
rvie
wS
t
Mai
nS
t
Bo ni ta Canyo nDr
New
por t Coast
Dr
22nd StUpper
Newport Bay
San JoaquinReservoir
SBirch St
Von Karm
anAve
Quail St
Birch S
t
Mesa DrDel Mar Ave
20th St
Bay
view
Pl
Br is tolSt
Bayv iew
Wy
B ison Ave
Paular ino Ave
Airpor t
Wy
Jam
boree
Rd
Baker St
University Dr
MichelsonDr
Red Hil l
Ave
17th St
Santa A
na Ave
Walnut Ave
Irvin
eAve
Fai
rvie
w R
d
Cam
pus Dr
19th St
Warner Ave
Dyer Rd
Barranca Pkwy
r
Shady Canyon D rFord R d
Gra
nd
A
ve
Br i
s to
lS
t
Dov
erDr
Mac
Art
hur
B
lvd
Culver
Dr
San
t iag
oDr
Yale
Loop
Eastb
luff D r
Turt le Rock Dr
TustinSantaAna
NewportBeach
Irvine
CostaMesa
¬!1¬!2
¬!3
¬!4
¬!5
¬!6
¬!7
¬!8
¬!9
¬!10
¬!11
¬!12¬!13
¬!14
¬!15
¬!16
¬!17¬!18 ¬!19¬!20
¬!21
¬!22
¬!23
¬!24
¬!25 ¬!26
¬!27
¬!28
¬!29
¬!30
¬!31
¬!32¬!33
¬!34¬!35
¬!36
¬!37
¬!38
¬!39
¬!40
¬!41
¬!44
¬!45
¬!42
¬!43
¬!46
¬!47
¬!59
¬!48 ¬!52
¬!53
¬!54
¬!58
¬!49
¬!50
¬!51
¬!55
¬!56
¬!57
Source: Transportation Impact Analysis, Fehr & Peers, 2014
Alton Pkwy
Alton Pkwy
Alton Pkwy
Alton Pkwy

Irvine Business Complex BoundaryJohn Wayne Airport Settlement Agreement Amendment
Exhibit 4.8-2
¥§̈405
¥§̈405
¥§̈5
Ä55
Ä73
Ä261
Edinger Ave
Main St
Harv
ard
Ave
MacArthur Blvd
Fairv
iew
St
Main
S t
Bo n it a Can y on Dr Newp ort Coast D r
22nd StUpper
Newport Bay
Sant
a Ana
Rive
r
San JoaquinReservoir
SouthLake
Irvine Center Dr
Jeffre
y Rd
Coast Hwy
Irvine Blvd
Irvine Blvd
Alton Pkwy
Red Hill A
ve
Jambor
ee Rd
University Dr
Von
Karm
an A
ve
Jamb
oree
Rd
Baker St
Michelson Dr
Red Hill Ave
17th St
Santa Ana A
ve
Newport Ave
Walnut Ave
Irvine Ave
Campus Dr
19th St
Warner Ave
1st St
Dyer Rd
Barranca Pkwy
Shady Canyon DrFord Rd
Gran
d A
ve
B ris t
o lS t
Dover
Dr
MacAr
thur
B
lvd
Culver Dr
Sant
iago
Dr
YaleL
oop
Eastb
luf
f Dr
Turtle Rock Dr
TustinSantaAna
NewportBeach
Irvine
CostaMesa
D:\Pr
ojects
\JWA\J
003\M
XDs\E
x_trff
c_IBC
_surv
ey.m
xd
6,000 0 6,0003,000Feet²
Airport BoundaryIrvine Business Complex Boundary

Transportation/Traffic
JOHN WAYNE AIRPORT SETTLEMENT AGREEMENT AMENDMENT 4.8-5 ENVIRONMENTAL IMPACT REPORT
for the Project area are 7:00 AM to 9:00 AM and 4:00 PM to 6:00 PM. More detail on the traffic modeling process is provided in Appendix G, Section 4.3. The effectiveness of traffic operations on a transportation facility is measured in terms of level of service (“LOS”) with LOS A representing the best operating conditions and LOS F representing the worst. There are two main approaches used for intersection LOS including: • Intersection Capacity Utilization (“ICU”) - ICU approaches are commonly used throughout Orange County including agencies such as the OCTA, and the cities of Newport Beach, Irvine, and Costa Mesa. ICU evaluates the capacity of an intersection as compared to the volume of traffic traveling through the intersection. • Highway Capacity Manual (“HCM”) - HCM methodologies are required by Caltrans. LOS for signalized intersections under HCM methodology is determined based on average delay, while unsignalized intersection LOS is based on worse case approach delay. Delay calculations incorporate traffic volumes, intersection configuration, traffic control (signal, stop sign), and other related items. Delay (in seconds) was calculated at each study intersection in Caltrans jurisdiction using Trafficware Synchro software v.7, and compared to the LOS thresholds outlined in the HCM 2001. Table 4.8-1 provides the LOS ranges for the ICU volume/capacity analysis, the HCM signalized delay analysis, and the HCM unsignalized delay analysis.
TABLE 4.8-1 INTERSECTION AND ROADWAY SEGMENT LOS CRITERIA
Level of
Service Description
ICU Volume / Capacity
HCM Signalized
Delay (Seconds)
HCM Unsignalized
Delay (Seconds)
A Operations with very low delay occurring with favorable progression and/or short cycle length. <0.60 < 10.0 < 10.0 B Operations with low delay occurring with good progression and/or short cycle lengths. 0.61–0.70 > 10.0 to 20.0 >10.0 to 15.0 C Operations with average delays resulting from fair progression and/or longer cycle lengths. Individual cycle failures begin to appear. 0.71–0.80 > 20.0 to 35.0 >15.0 to 25.0 D
Operations with longer delays due to a combination of unfavorable progression, long cycle lengths, or high V/C ratios. Many vehicles stop and individual cycle failures are noticeable. 0.81–0.90 > 35.0 to 55.0 >25.0 to 35.0

Transportation/Traffic
4.8-6 JOHN WAYNE AIRPORT SETTLEMENT AGREEMENT AMENDMENT ENVIRONMENTAL IMPACT REPORT
TABLE 4.8-1 INTERSECTION AND ROADWAY SEGMENT LOS CRITERIA
Level of
Service Description
ICU Volume / Capacity
HCM Signalized
Delay (Seconds)
HCM Unsignalized
Delay (Seconds)
E Operations with high delay values indicating poor progression, long cycle lengths, and high V/C ratios. Individual cycle failures are frequent occurrences. 0.91–1.00 > 55.0 to 80.0 >35.0 to 50.0 F Operation with delays unacceptable to most drivers occurring due to over saturation, poor progression, or very long cycle lengths. >1.00 > 80.0 >50.0
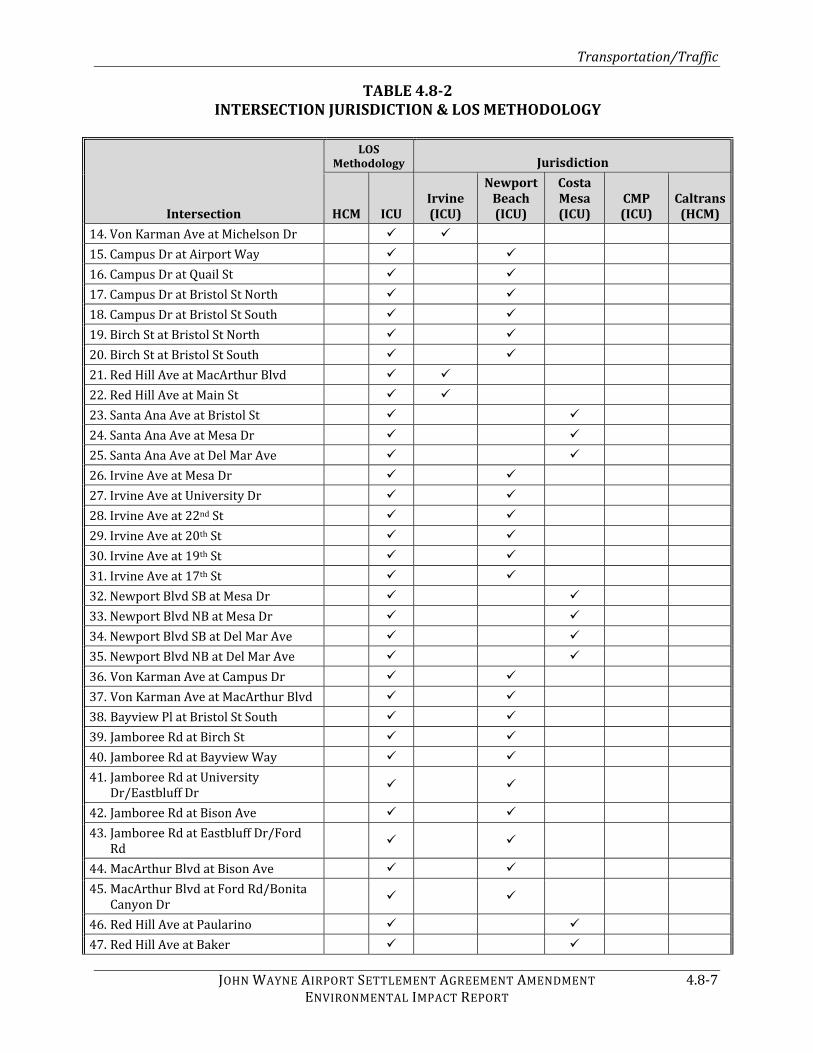
Source: Transportation Impact Analysis, (Table 4-1), Fehr & Peers, 2014. Table 4.8-2 lists each intersection by the jurisdiction and the LOS methodology applied. Several of the intersections have overlapping jurisdictions in which multiple agencies apply different LOS approaches, such as the on-ramps which have shared jurisdiction with Caltrans and the local cities. Three of the intersections also fall within the jurisdiction of the OCTA CMP; therefore, both ICU and HCM methodology was used, as shown in the table. TABLE 4.8-2
INTERSECTION JURISDICTION & LOS METHODOLOGY
Intersection
LOS Methodology Jurisdiction
HCM ICU Irvine (ICU)
Newport Beach (ICU)
Costa Mesa (ICU)
CMP (ICU)
Caltrans (HCM) 1. MacArthur Blvd at Main Street 2. MacArthur Blvd at I-405 NB Ramps 3. MacArthur Blvd at I-405 SB Ramps 4. MacArthur Blvd at Michelson Dr 5. MacArthur Blvd at Campus Dr 6. MacArthur Blvd at Birch St 7. Jamboree Rd at I-405 NB Ramps 8. Jamboree Rd at I-405 SB Ramps 9. Jamboree Rd at Michelson Dr 10. Jamboree Rd at Campus Dr 11. Jamboree Rd at MacArthur Blvd 12. Jamboree Rd at Bristol St North 13. Jamboree Rd at Bristol St South
Transportation/Traffic
JOHN WAYNE AIRPORT SETTLEMENT AGREEMENT AMENDMENT 4.8-7 ENVIRONMENTAL IMPACT REPORT
TABLE 4.8-2 INTERSECTION JURISDICTION & LOS METHODOLOGY
Intersection
LOS Methodology Jurisdiction
HCM ICU Irvine (ICU)
Newport Beach (ICU)
Costa Mesa (ICU)
CMP (ICU)
Caltrans (HCM) 14. Von Karman Ave at Michelson Dr 15. Campus Dr at Airport Way 16. Campus Dr at Quail St 17. Campus Dr at Bristol St North 18. Campus Dr at Bristol St South 19. Birch St at Bristol St North 20. Birch St at Bristol St South 21. Red Hill Ave at MacArthur Blvd 22. Red Hill Ave at Main St 23. Santa Ana Ave at Bristol St 24. Santa Ana Ave at Mesa Dr 25. Santa Ana Ave at Del Mar Ave 26. Irvine Ave at Mesa Dr 27. Irvine Ave at University Dr 28. Irvine Ave at 22nd St 29. Irvine Ave at 20th St 30. Irvine Ave at 19th St 31. Irvine Ave at 17th St 32. Newport Blvd SB at Mesa Dr 33. Newport Blvd NB at Mesa Dr 34. Newport Blvd SB at Del Mar Ave 35. Newport Blvd NB at Del Mar Ave 36. Von Karman Ave at Campus Dr 37. Von Karman Ave at MacArthur Blvd 38. Bayview Pl at Bristol St South 39. Jamboree Rd at Birch St 40. Jamboree Rd at Bayview Way 41. Jamboree Rd at University Dr/Eastbluff Dr 42. Jamboree Rd at Bison Ave 43. Jamboree Rd at Eastbluff Dr/Ford Rd 44. MacArthur Blvd at Bison Ave 45. MacArthur Blvd at Ford Rd/Bonita Canyon Dr 46. Red Hill Ave at Paularino 47. Red Hill Ave at Baker

Transportation/Traffic
4.8-8 JOHN WAYNE AIRPORT SETTLEMENT AGREEMENT AMENDMENT ENVIRONMENTAL IMPACT REPORT
TABLE 4.8-2 INTERSECTION JURISDICTION & LOS METHODOLOGY
Intersection
LOS Methodology Jurisdiction
HCM ICU Irvine (ICU)
Newport Beach (ICU)
Costa Mesa (ICU)
CMP (ICU)
Caltrans (HCM) 48. MacArthur Boulevard at SR-55 NB Ramps 49. Red Hill Avenue at Dyer Road 50. Red Hill Avenue at Alton Parkway 51. Red Hill Avenue at McGaw Avenue 52. Von Karman Avenue at Barranca Parkway 53. Von Karman Avenue at Alton Parkway 54. Von Karman Avenue at Main Street 55. Jamboree Road at Barranca Parkway 56. Jamboree Road at Alton Parkway 57. Jamboree Road at McGaw Avenue 58. Jamboree Road at Main Street 59. Harvard Avenue at Michelson Drive
Source: Transportation Impact Analysis, (Table 4-2), Fehr & Peers, 2014 The HCM also has special methodology for evaluating freeway segments. The analysis factors in the basic or mainline segments, as well as the merge and diverge components (i.e., lane changes to enter and exit the freeway) where capacity constraints typically occur. LOS for each of these segments is defined on the basis of density or passenger cars per mile per lane (“pc/mi/ln”). Table 4.8-3 presents the LOS criteria for basic (or mainline) freeway segments. Table 4.8-4 provides the LOS criteria for merge and diverge segments. TABLE 4.8-3
LOS CRITERIA FOR BASIC OR MAINLINE FREEWAY SEGMENTS
LOS Density (passenger cars per mile per lane) A <11B <11-18C <18-26D <26-35E <35-45F Demand exceeds capacity >45Source: Transportation Impact Analysis, (Table 4-3), Fehr & Peers, 2014

Transportation/Traffic
JOHN WAYNE AIRPORT SETTLEMENT AGREEMENT AMENDMENT 4.8-9 ENVIRONMENTAL IMPACT REPORT
TABLE 4.8-4 LOS CRITERIA FOR MERGE AND DIVERGE SEGMENTS
LOS Density (pc/mi/ln) Comments A <10 Unrestricted operations B >10-20 Merging and diverging maneuvers noticeable to drivers C >20-28 Influence area speeds begin to decline D >28-35 Influence area turbulence becomes intrusive E >35 Turbulence felt by virtually all drivers F Demand exceeds capacity Ramp and freeway queues form Source: Transportation Impact Analysis, (Table 4-4), Fehr & Peers, 2014 AIRPORT TRIP DISTRIBUTION A key aspect of the analysis is the distribution of trips, which refers to the starting point or ending point of trips associated with JWA. As a regional destination, JWA draws traffic from the overall region, although most trips begin or end in Orange County. The trip distribution was quantified through a three step process as defined below:
• First, the traffic engineer ran a select zone/select-link analysis2 using OCTAM for both the Base Year and the future Forecast Year. Distribution was tracked for both inbound and outbound trips for the AM and PM Peak hours. • The distributions for each scenario were compared to each other and were determined to be nearly identical. Therefore, the assumption was made that the same trip distribution would be applied across all analysis years and scenarios. • Lastly, the distribution results were compared against the most recent passenger survey, which identified the most common locations associated with air passengers. This comparison indicated that the major origins and destinations were consistent with the OCTAM results, which were then used in the study.
AIRPORT TRIP GENERATION The anticipated trip generation associated with JWA was developed from a variety of sources including: • Existing traffic counts
2 Select zone/select-link analysis is a tool that allows the evaluator to pick a single zone or point on the roadway network and determine the origin and destination of the traffic that passes through that point.

Transportation/Traffic
4.8-10 JOHN WAYNE AIRPORT SETTLEMENT AGREEMENT AMENDMENT ENVIRONMENTAL IMPACT REPORT
• Projected increases in MAP • Projected increases in the number of flights The trip generation numbers for existing conditions, the Proposed Project and each alternative are presented later in this section. The trip generation numbers considered the following sources of vehicle trips: • Terminal - This location includes rental car, passenger cars parking, and drop-off vehicles. • Main Street Passengers - This location is an off-site location for passenger use only. • Employee Lot - This location is also an off-site location for employee use only. This facility is located near to the Main Street Passenger lot. • Cargo - This driveway provides accessibility for service and cargo facilities located on Paularino Avenue.
4.8.3 EXISTING CONDITIONS
REGIONAL AND LOCAL ACCESS ROUTES Regional access to JWA is provided by Interstate 405 (“I-405”), State Route 55 (“SR-55”), and State Route 73 (“SR-73”). Local access is provided by MacArthur Boulevard, Jamboree Road, Irvine Avenue/Campus Drive, Santa Ana Avenue/Red Hill Avenue, Von Karman Avenue, Birch Street, and Newport Boulevard. (See Exhibit 4.8-1.) The characteristics of these roadways (i.e., number of lanes, posted speed limit, and whether on-street parking is available) are provided in Appendix G. TRANSIT ROUTES The study area is serviced by OCTA, Metrolink, iShuttle and Amtrak. OCTA has two bus routes that provide direct access to JWA—Route 76 and Route 212. Route 76 provides weekday-only service between Huntington Beach and Newport Beach via Talbert Avenue/MacArthur Boulevard. This route provides direct access to John Wayne Airport (“JWA”), with headways of 45-75 minutes. Route 212 provides limited weekday-only service between Irvine and San Juan Capistrano via the I-405 freeway. This route provides direct access to the Airport. Northbound buses arrive at the airport twice in the early morning and southbound buses leave the airport twice in the late afternoon. The Inland Empire-Orange County Line Metrolink line provides north-south service between the cities of San Bernardino and Oceanside. This line runs at 30-45 minute headways during the weekday morning and evening peak hours and limited service during the midday off-peak period. This line provides limited service on weekends. The Orange County Line Metrolink line provides north-south service between the cities Los Angeles (Union Station) and Oceanside. This line runs at 30-50 minute headways during the weekday morning and evening peak hours and limited service during the midday off-peak period. This line provides limited service on weekends. For both Metrolink routes, the closest station to JWA is the Tustin stop, five miles northeast of the airport. The iShuttle (a local commuter shuttle service) Route A serves as a
Transportation/Traffic
JOHN WAYNE AIRPORT SETTLEMENT AGREEMENT AMENDMENT 4.8-11 ENVIRONMENTAL IMPACT REPORT
connection between the Tustin station and the Airport stops on the arrival level near Terminal B. The Amtrak Pacific Surfliner serves major cities from San Luis Obispo south to San Diego along the California coastline. The closest stations to JWA are located in Anaheim, Santa Ana, and Irvine, and are located 10, 7, and 8 miles, respectively, from the Airport. Weekday headways range from 20 to 60 minutes. Numerous lines provide service on Saturday and Sunday. EXISTING INTERSECTION OPERATIONS Traffic counts were collected in the study area using a variety of sources. Intersection traffic counts were collected in September and October 2013. Counts were collected at all intersections during the morning (7:00 AM to 9:00 AM) peak periods and the afternoon (4:00 PM to 6:00 PM) peak periods. These intersection counts are provided in the Transportation Impact Analysis (Appendix G). Table 4.8-5 documents the existing LOS at the study area intersections. LOS D or better generally is considered acceptable operating conditions, although in the City of Irvine, LOS E is an acceptable condition for streets located within the IBC, as is also the case in Newport Beach for streets located inside the JWA area shared with the City of Irvine. As shown in Table 4.8-5, under existing conditions all of the study intersections are operating at an acceptable LOS based on the application of the ICU methodology. Table 4.8-6 documents the intersection LOS using the methodology from the HCM for intersections under the jurisdiction of Caltrans. As shown in that table, under the Existing Conditions (2013) baseline, only the Jamboree Road at I-405 southbound ramps are operating at a deficient LOS (LOS F in the AM peak period).3
3 The intersections shown in Table 4.8-6 are within the jurisdiction of both Caltrans and the City of Irvine. The HCM methodology considers the effects of traffic signal timing and adjacent intersections, which explains why there can be different results than the application of the ICU methodology presented in Table 4.8-5 (Intersections 2, 3, 7 and 8).

Transportation/Traffic
4.8-12 JOHN WAYNE AIRPORT SETTLEMENT AGREEMENT AMENDMENT ENVIRONMENTAL IMPACT REPORT
TABLE 4.8-5 INTERSECTION LEVEL OF SERVICE:
EXISTING (2013) CONDITIONS
Intersection Traffic Control
Peak Hour V/C LOS 1. MacArthur Blvd at Main Street1 Signal AM 0.56 APM 0.730 C2. MacArthur Blvd at I-405 NB Ramps1,4 Signal AM 0.68 BPM 0.64 B3. MacArthur Blvd at I-405 SB Ramps1,4 Signal AM 0.59 APM 0.65 B4. MacArthur Blvd at Michelson Drive1 Signal AM 0.68 BPM 0.89 D5. MacArthur Blvd at Campus Drive1 Signal AM 0.54 APM 0.75 C6. MacArthur Blvd at Birch Street2 Signal AM 0.374 APM 0.490 A7. Jamboree Rd at I-405 NB Ramps1 Signal AM 0.68 BPM 0.79 C8. Jamboree Rd at I-405 SB Ramps1 Signal AM 0.88 DPM 0.78 C9. Jamboree Rd at Michelson Drive1 Signal AM 0.66 BPM 0.82 D10. Jamboree Rd at Campus Drive1 Signal AM 0.58 APM 0.60 A11. Jamboree Rd at MacArthur Boulevard2,4 Signal AM 0.650 BPM 0.714 C12. Jamboree Rd at Bristol Street North2 Signal AM 0.496 APM 0.488 A13. Jamboree Rd at Bristol Street South2 Signal AM 0.610 BPM 0.632 B14. Von Karman Ave at Michelson Drive1 Signal AM 0.49 APM 0.64 B15. Campus Dr at Airport Way2 Signal AM 0.338 APM 0.660 B16. Campus Dr at Quail St2 Signal AM 0.484 APM 0.463 A17. Campus Dr at Bristol St North2 Signal AM 0.596 APM 0.885 D18. Campus Dr at Bristol St South2 Signal AM 0.689 BPM 0.439 A

Transportation/Traffic
JOHN WAYNE AIRPORT SETTLEMENT AGREEMENT AMENDMENT 4.8-13 ENVIRONMENTAL IMPACT REPORT
TABLE 4.8-5 INTERSECTION LEVEL OF SERVICE:
EXISTING (2013) CONDITIONS
Intersection Traffic Control
Peak Hour V/C LOS 19. Birch St at Bristol St North2 Signal AM 0.581 APM 0.581 A20. Birch St at Bristol St South2 Signal AM 0.400 APM 0.434 A21. Red Hill Ave at MacArthur Blvd1 Signal AM 0.61 BPM 0.71 C22. Red Hill Ave at Main St1 Signal AM 0.71 CPM 0.70 C23. Santa Ana Ave at Bristol St3 Signal AM 0.50 APM 0.47 A24. Santa Ana Ave at Mesa Dr3 Signal AM 0.50 APM 0.53 A25. Santa Ana Ave at Del Mar Ave3,5 Stop Controlled l AM 18.7 CPM 19.4 C26. Irvine Ave at Mesa Dr2 Signal AM 0.369 APM 0.573 A27. Irvine Ave at University Dr2 Signal AM 0.641 BPM 0.719 C28. Irvine Ave at 22nd St2 Signal AM 0.619 BPM 0.695 B29. Irvine Ave at 20th St2 Signal AM 0.485 APM 0.624 B30. Irvine Ave at 19th St2 Signal AM 0.528 APM 0.662 B31. Irvine Ave at 17th St2 Signal AM 0.540 APM 0.709 C32. Newport Blvd SB at Mesa Dr3 Signal AM 0.22 APM 0.56 A33. Newport Blvd NB at Mesa Dr3 Signal AM 0.44 APM 0.36 A34. Newport Blvd SB at Del Mar Ave3 Signal AM 0.32 APM 0.43 A35. Newport Blvd NB at Del Mar Ave3 Signal AM 0.82 DPM 0.50 A36. Von Karman Ave at Campus Dr2 Signal AM 0.531 APM 0.681 B

Transportation/Traffic
4.8-14 JOHN WAYNE AIRPORT SETTLEMENT AGREEMENT AMENDMENT ENVIRONMENTAL IMPACT REPORT
TABLE 4.8-5 INTERSECTION LEVEL OF SERVICE:
EXISTING (2013) CONDITIONS
Intersection Traffic Control
Peak Hour V/C LOS 37. Von Karman Ave at MacArthur Blvd2 Signal AM 0.576 APM 0.543 A38. Bayview Pl at Bristol St South2 Signal AM 0.397 APM 0.413 A39. Jamboree Rd at Birch St2 Signal AM 0.488 APM 0.494 A40. Jamboree Rd at Bayview Way2 Signal AM 0.441 APM 0.522 A41. Jamboree Rd at University Dr/Eastbluff Dr2 Signal AM 0.535 APM 0.558 A42. Jamboree Rd at Bison Ave2 Signal AM 0.470 APM 0.498 A43. Jamboree Rd at Eastbluff Dr/Ford Rd2 Signal AM 0.830 DPM 0.707 C44. MacArthur Blvd at Bison Ave2 Signal AM 0.594 APM 0.590 A45. MacArthur Blvd at Ford Rd/Bonita Canyon Dr2 Signal AM 0.764 CPM 0.841 D46. Red Hill Ave at Paularino Ave3 Signal AM 0.54 APM 0.65 B47. Red Hill Ave at Baker St3 Signal AM 0.42 APM 0.61 B48. MacArthur Blvd at SR-55 NB Ramps1 Signal AM 0.76 CPM 0.62 B49. Red Hill Ave at Dyer Rd1 Signal AM 0.52 APM 0.88 D50. Red Hill Ave at Alton Pkwy1 Signal AM 0.52 APM 0.79 C51. Red Hill Ave at McGaw Ave1 Signal AM 0.45 APM 0.74 C52. Von Karman Ave at Barranca Pkwy1 Signal AM 0.70 CPM 0.89 D53. Von Karman Ave at Alton Pkwy1 Signal AM 0.76 CPM 0.880 D54. Von Karman Ave at Main St1 Signal AM 0.60 BPM 0.78 C

Transportation/Traffic
JOHN WAYNE AIRPORT SETTLEMENT AGREEMENT AMENDMENT 4.8-15 ENVIRONMENTAL IMPACT REPORT
TABLE 4.8-5 INTERSECTION LEVEL OF SERVICE:
EXISTING (2013) CONDITIONS
Intersection Traffic Control
Peak Hour V/C LOS 55. Jamboree Road at Barranca Parkway1 Signal AM 0.73 CPM 0.89 D56. Jamboree Rd at Alton Pkwy1 Signal AM 0.78 CPM 0.81 D57. Jamboree Rd at McGaw Ave1 Signal AM 0.64 BPM 0.65 B58. Jamboree Rd at Main St1 Signal AM 0.77 CPM 0.85 D59. Harvard Ave at Michelson Dr1 Signal AM 0.65 BPM 0.82 DNB=Northbound; SB=Southbound Notes: Signalized intersections evaluated using ICU methodology. 1. Based on City of Irvine intersection analysis methodology. 2. Based on City of Newport Beach intersection analysis methodology. 3. Based on City of Costa Mesa intersection analysis methodology. 4. Based on CMP intersection analysis methodology. 5. AWSC = All Way Stop Control; average intersection delay is reported. Source: Transportation Impact Analysis, (Table 3-1), Fehr & Peers, 2014
TABLE 4.8-6 CALTRANS INTERSECTION LEVEL OF SERVICE:
EXISTING (2013) CONDITIONS
Intersection Control AM Peak PM Peak
Delaya LOS Delaya LOSMacArthur Blvd at I-405 NB Ramps Signal 22.1 C 23.3 CMacArthur Blvd at I-405 SB Ramps Signal 21.9 C 22.6 CJamboree Rd at I-405 NB Ramps Signal 15.8 B 20.6 CJamboree Rd at I-405 SB Ramps Signal 90.8 F 30.7 CNB=Northbound; SB=Southbound Intersections operating below acceptable standards are noted in bold. a Delay is provided in seconds.
Source: Transportation Impact Analysis, (Table 3-2), Fehr & Peers, 2014

Transportation/Traffic
4.8-16 JOHN WAYNE AIRPORT SETTLEMENT AGREEMENT AMENDMENT ENVIRONMENTAL IMPACT REPORT
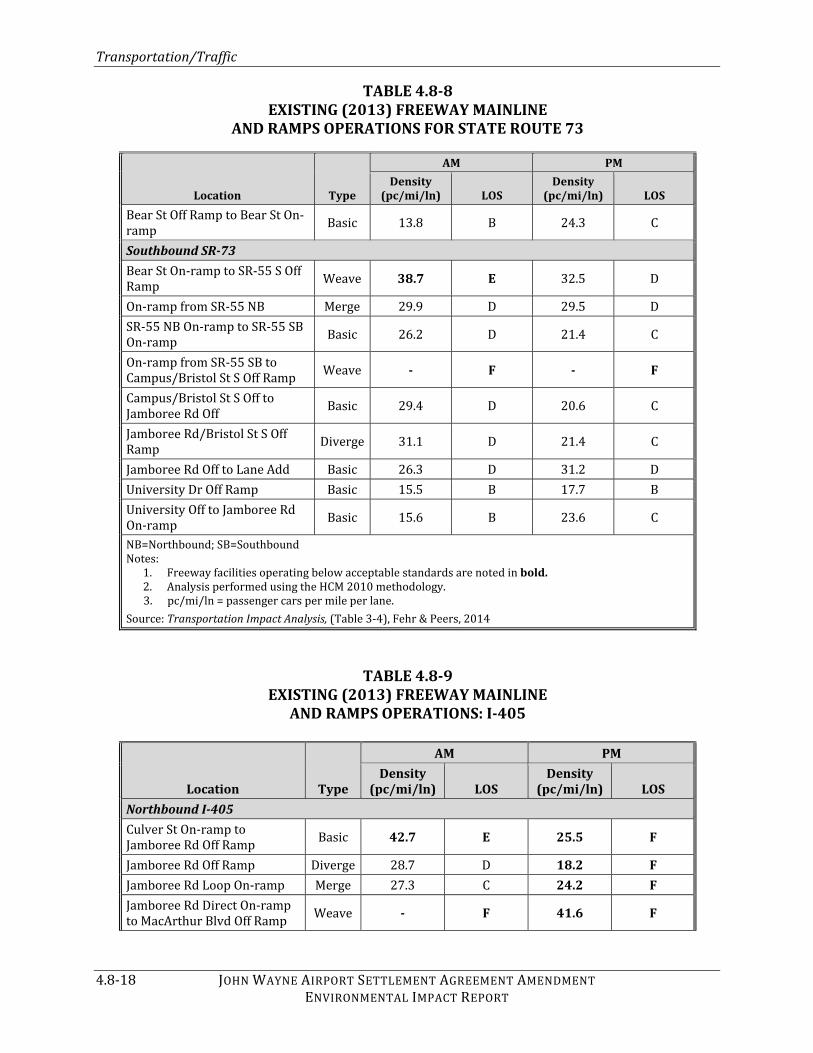
EXISTING FREEWAY AND RAMP OPERATIONS Tables 4.8-7 through 4.8-9 provide the freeway LOS for the mainline, weave, and diverge segments4 for the SR-55, SR-73, and the I-405 in the study area. As shown in these tables, there are numerous locations where the freeways operate deficiently under existing conditions. Large portions of the SR-55 and the I-405 operate at LOS F either in the AM or PM peak hour or both. The Caltrans Transportation Mobility Performance Report indicates that segments of the SR-55 and I-405 adjacent to John Wayne have some of the highest delay in Orange County. TABLE 4.8-7
EXISTING (2013) FREEWAY MAINLINE AND RAMPS OPERATIONS FOR STATE ROUTE 55
Location Type
AM PM Density
(pc/mi/ln) LOS Density
(pc/mi/ln) LOS Northbound SR-55 Fair Dr/Del Mar Ave/Newport Blvd On-ramp to SR-73 Off Ramp Weave - F - F SR-73 Off Ramp to Baker St Off Ramp Basic 28.8 D 10.7 A Baker St Off Ramp Diverge 21.6 C 3.4 ABaker St Off Ramp to SR-73 On-ramp Basic 24.9 F 14.3 B On-ramp from SR-73 NB to Off Ramp to I-405 SB Weave - F 32.8 D Off Ramp to I-405 SB to Paularino Ave On-ramp Basic 28.3 F 16.0 B Paularino Ave On-ramp Merge 29.6 D 14.9 FPaularino Ave On-ramp to I-405 SB On-ramp Basic 34.3 D 15.9 F On-ramp from I-405 SB Basic - F 15.5 FOn-ramp from I-405 NB to MacArthur Blvd Off Ramp Weave - F 23.0 F
Southbound SR-55 MacArthur Blvd Loop On-ramp to MacArthur Blvd Direct On-ramp Basic 34.1 D 36.5 E MacArthur Blvd Direct On-ramp to Off Ramp to I-405 SB Weave - F - F Off Ramp to I-405 NB Diverge 29.1 D 33.7 DI-405 NB Off Ramp to Paularino Ave Off Ramp Basic 23.2 C 25.8 C Paularino Ave Off Ramp Diverge 28.3 D 30.6 D 4 A weave section is where traffic is entering a freeway travel lane from an on-ramp. A diverge segment is where vehicles leave a freeway travel lane to exit a freeway on an off-ramp.

Transportation/Traffic
JOHN WAYNE AIRPORT SETTLEMENT AGREEMENT AMENDMENT 4.8-17 ENVIRONMENTAL IMPACT REPORT
TABLE 4.8-7 EXISTING (2013) FREEWAY MAINLINE
AND RAMPS OPERATIONS FOR STATE ROUTE 55 Location Type
AM PM Density
(pc/mi/ln) LOS Density
(pc/mi/ln) LOS Lane Drop Basic 28.3 D 33.0 DOn-ramp from I-405 NB to Off Ramp to SR-73 SB Weave - F - F Baker St On-ramp Basic 17.0 B 23.7 COn-ramp from SR-73 NB Merge 20.9 C 30.2 DSR-73 NB On-ramp to SR-73 SB On-ramp Basic 20.0 C 30.1 D SR-73 SB On-ramp to Newport Blvd S/Mesa Dr Off Ramp Weave 30.0 D - F Newport Blvd S/Mesa Dr Off to Newport Blvd S/Fair Dr On-ramp Basic 16.5 B 23.5 C Newport Blvd S/Fair Dr On-ramp Merge 17.7 B 22.9 C NB=Northbound; SB=Southbound Notes: 1. Freeway facilities operating below acceptable standards are noted in bold. 2. Analysis performed using the HCM 2010 methodology. 3. pc/mi/ln = passenger cars per mile per lane. Source: Transportation Impact Analysis, (Table 3-3), Fehr & Peers, 2014
TABLE 4.8-8 EXISTING (2013) FREEWAY MAINLINE
AND RAMPS OPERATIONS FOR STATE ROUTE 73 Location Type
AM PM Density
(pc/mi/ln) LOS Density
(pc/mi/ln) LOS Northbound SR-73 Lane Drop to MacArthur Blvd On-ramp Basic 40.3 E 27.6 D MacArthur Blvd On-ramp Basic 36.6 E 28.6 DJamboree Rd On-ramp Merge 34.8 D 32.3 DJamboree Rd On-ramp to Bristol St N Off Ramp Basic 23.7 C 23.3 C Bristol St N Off Ramp Diverge 30.5 D 27.9 CBristol St N On-ramp to SR-55 N Off Ramp Weave 32.1 D - F Off Ramp to SR-55 SB Diverge 24.1 C 35.5 EOn-ramp from SR-55 NB Weave 33.1 D - F
Transportation/Traffic
4.8-18 JOHN WAYNE AIRPORT SETTLEMENT AGREEMENT AMENDMENT ENVIRONMENTAL IMPACT REPORT
TABLE 4.8-8 EXISTING (2013) FREEWAY MAINLINE
AND RAMPS OPERATIONS FOR STATE ROUTE 73 Location Type
AM PM Density
(pc/mi/ln) LOS Density
(pc/mi/ln) LOS Bear St Off Ramp to Bear St On-ramp Basic 13.8 B 24.3 C Southbound SR-73 Bear St On-ramp to SR-55 S Off Ramp Weave 38.7 E 32.5 D On-ramp from SR-55 NB Merge 29.9 D 29.5 DSR-55 NB On-ramp to SR-55 SB On-ramp Basic 26.2 D 21.4 C On-ramp from SR-55 SB to Campus/Bristol St S Off Ramp Weave - F - F Campus/Bristol St S Off to Jamboree Rd Off Basic 29.4 D 20.6 C Jamboree Rd/Bristol St S Off Ramp Diverge 31.1 D 21.4 C Jamboree Rd Off to Lane Add Basic 26.3 D 31.2 DUniversity Dr Off Ramp Basic 15.5 B 17.7 BUniversity Off to Jamboree Rd On-ramp Basic 15.6 B 23.6 C NB=Northbound; SB=Southbound Notes: 1. Freeway facilities operating below acceptable standards are noted in bold. 2. Analysis performed using the HCM 2010 methodology. 3. pc/mi/ln = passenger cars per mile per lane. Source: Transportation Impact Analysis, (Table 3-4), Fehr & Peers, 2014
TABLE 4.8-9 EXISTING (2013) FREEWAY MAINLINE
AND RAMPS OPERATIONS: I-405 Location Type
AM PM Density
(pc/mi/ln) LOS Density
(pc/mi/ln) LOS Northbound I-405 Culver St On-ramp to Jamboree Rd Off Ramp Basic 42.7 E 25.5 F Jamboree Rd Off Ramp Diverge 28.7 D 18.2 FJamboree Rd Loop On-ramp Merge 27.3 C 24.2 FJamboree Rd Direct On-ramp to MacArthur Blvd Off Ramp Weave - F 41.6 F

Transportation/Traffic
JOHN WAYNE AIRPORT SETTLEMENT AGREEMENT AMENDMENT 4.8-19 ENVIRONMENTAL IMPACT REPORT
TABLE 4.8-9 EXISTING (2013) FREEWAY MAINLINE
AND RAMPS OPERATIONS: I-405 Location Type
AM PM Density
(pc/mi/ln) LOS Density
(pc/mi/ln) LOS MacArthur Blvd On-ramp to SR-55 NB & SB Off Ramp Weave 40.8 E - F SR-55 Off Ramp to Bristol St Off Ramp Basic 31.6 D 33.9 F Bristol St/Ave of the Arts Off Ramp Diverge 34.8 D 36.1 F On-ramp from SR-55 SB Basic 27.0 D 27.2 FBristol St N On-ramp Merge 22.9 C 23.9 FBristol St S On-ramp to S Coast Off Weave - F - F
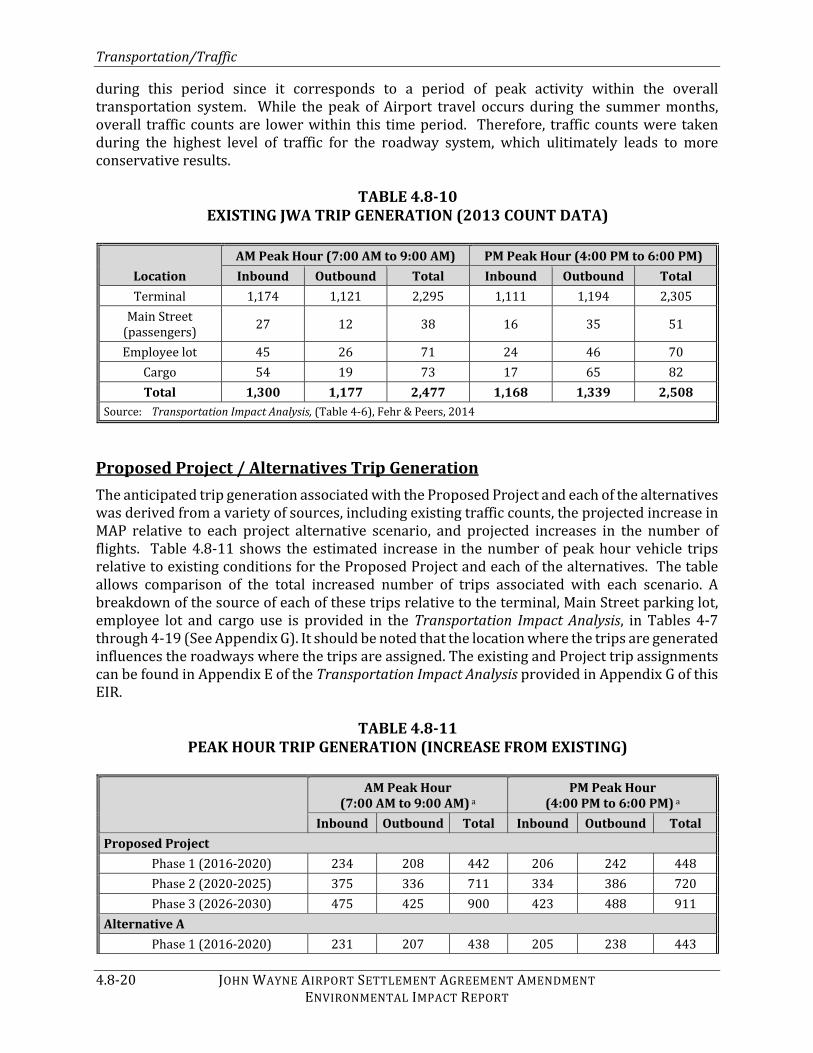
Southbound I-405 Off Ramp to I-405 SB to Fairview Rd On-ramp Basic 30.8 F 19.7 C Fairview Rd On-ramp Merge 34.1 F 25.6 CFairview Rd On-ramp to Bristol St Off Ramp Basic 38.6 F 23.3 C Bristol St Off Ramp Diverge 27.2 F 18.0 BBristol St On-ramp to SR-55 NB Off Ramp Weave - F 29.4 D Lane Drop Basic 36.9 E 25.3 COn-ramp from SR-55 NB Basic 37.0 E 25.6 CSR-55 SB On-ramp to MacArthur Blvd Off Ramp Weave - F 43.6 E MacArthur Blvd On-ramp to Jamboree Rd Off Ramp Weave - F 44.8 E Jamboree Rd Loop On-ramp Merge 18.6 B 21.3 FJamboree Rd Direct On-ramp Merge 17.2 B 21.4 FNB=Northbound; SB=Southbound Notes: 1. Freeway facilities operating below acceptable standards are noted in bold. 2. Analysis performed using the HCM 2010 methodology. 3. pc/mi/ln = passenger cars per mile per lane. Source: Transportation Impact Analysis, (Table 3-5), Fehr & Peers, 2014 EXISTING AIRPORT TRIP GENERATION Existing traffic counts at JWA were taken at various locations in September 2013, a year in which the Airport's annualized passenger levels were 9.17 MAP. This information was used to develop the existing Airport trip generation numbers, which are presented in Table 4.8-10. Traffic counts for study facilities include intersections, ramps, and freeway segments. Count data was taken
Transportation/Traffic
4.8-20 JOHN WAYNE AIRPORT SETTLEMENT AGREEMENT AMENDMENT ENVIRONMENTAL IMPACT REPORT
during this period since it corresponds to a period of peak activity within the overall transportation system. While the peak of Airport travel occurs during the summer months, overall traffic counts are lower within this time period. Therefore, traffic counts were taken during the highest level of traffic for the roadway system, which ulitimately leads to more conservative results. TABLE 4.8-10
EXISTING JWA TRIP GENERATION (2013 COUNT DATA)
Location AM Peak Hour (7:00 AM to 9:00 AM) PM Peak Hour (4:00 PM to 6:00 PM)Inbound Outbound Total Inbound Outbound TotalTerminal 1,174 1,121 2,295 1,111 1,194 2,305Main Street (passengers) 27 12 38 16 35 51 Employee lot 45 26 71 24 46 70Cargo 54 19 73 17 65 82
Total 1,300 1,177 2,477 1,168 1,339 2,508Source: Transportation Impact Analysis, (Table 4-6), Fehr & Peers, 2014 Proposed Project / Alternatives Trip Generation The anticipated trip generation associated with the Proposed Project and each of the alternatives was derived from a variety of sources, including existing traffic counts, the projected increase in MAP relative to each project alternative scenario, and projected increases in the number of flights. Table 4.8-11 shows the estimated increase in the number of peak hour vehicle trips relative to existing conditions for the Proposed Project and each of the alternatives. The table allows comparison of the total increased number of trips associated with each scenario. A breakdown of the source of each of these trips relative to the terminal, Main Street parking lot, employee lot and cargo use is provided in the Transportation Impact Analysis, in Tables 4-7 through 4-19 (See Appendix G). It should be noted that the location where the trips are generated influences the roadways where the trips are assigned. The existing and Project trip assignments can be found in Appendix E of the Transportation Impact Analysis provided in Appendix G of this EIR.
TABLE 4.8-11 PEAK HOUR TRIP GENERATION (INCREASE FROM EXISTING)
AM Peak Hour (7:00 AM to 9:00 AM) a
PM Peak Hour (4:00 PM to 6:00 PM) a
Inbound Outbound Total Inbound Outbound TotalProposed Project Phase 1 (2016-2020) 234 208 442 206 242 448 Phase 2 (2020-2025) 375 336 711 334 386 720 Phase 3 (2026-2030) 475 425 900 423 488 911Alternative A Phase 1 (2016-2020) 231 207 438 205 238 443

Transportation/Traffic
JOHN WAYNE AIRPORT SETTLEMENT AGREEMENT AMENDMENT 4.8-21 ENVIRONMENTAL IMPACT REPORT
TABLE 4.8-11 PEAK HOUR TRIP GENERATION (INCREASE FROM EXISTING)
AM Peak Hour (7:00 AM to 9:00 AM) a
PM Peak Hour (4:00 PM to 6:00 PM) a
Inbound Outbound Total Inbound Outbound Total Phase 2 (2020-2025) 314 283 597 282 323 605 Phase 3 (2026-2030) 459 439 898 435 467 902Alternative B Phase 1 (2016-2020) 231 207 438 206 239 445 Phase 2 (2020-2025) 542 489 1,031 485 559 1,044 Phase 3 (2026-2030) 827 745 1,572 739 853 1,592Alternative C All Phases (2016-2030) 1,100 991 2,091 982 1,134 2,116No Project Alternative All Phases (2016-2030) 234 208 442 206 242 448a The values represent the highest one hour within the two hour peak period.Source: Transportation Impact Analysis, Data from Tables 4-7 through 4-19, Fehr & Peers, 2014
4.8.4 THRESHOLDS OF SIGNIFICANCE The thresholds of significance have been developed in accordance with the County’s Environmental Analysis Checklist. Due to the general nature of the checklist questions and the multiple jurisdictions affected by the Project, the thresholds of significance have been developed to specifically address the performance standards applicable to each jurisdiction. CITY OF IRVINE The Project would result in a significant transportation/traffic impact if any of the following conditions occur in the City of Irvine: Threshold 4.8-1: In the City of Irvine outside of the Irvine Business Complex (“IBC”), the addition of Project-generated trips increases the ICU at a study intersection by 0.01 or more of capacity, causing the intersection to change from an acceptable LOS D to LOS E or LOS F. Threshold 4.8-2: In the City of Irvine inside the IBC, the addition of Project-generated trips increases the ICU at a study intersection by 0.01 or more of capacity, causing the intersection to change from an acceptable LOS E to LOS F. Threshold 4.8-3: In the City of Irvine outside of the IBC, the addition of Project-generated trips increases the ICU by 0.02 or more at a study intersection operating at LOS E or F under baseline conditions.

Transportation/Traffic
4.8-22 JOHN WAYNE AIRPORT SETTLEMENT AGREEMENT AMENDMENT ENVIRONMENTAL IMPACT REPORT
Threshold 4.8-4: In the City of Irvine inside the IBC, the addition of Project-generated trips increases the ICU by 0.02 or more at a study intersection operating at LOS E or F under baseline conditions. CITY OF NEWPORT BEACH The Project would result in a significant transportation/traffic impact if any of the following conditions occur in the City of Newport Beach: Threshold 4.8-5: In the City of Newport Beach outside of the JWA Area shared with the City of Irvine, the addition of Project-generated trips causes the LOS at a study intersection to change from LOS D to LOS E or F. Threshold 4.8-6: In the City of Newport Beach inside the JWA Area shared with the City of Irvine, the addition of Project-generated trips causes the LOS at a study intersection to change from an acceptable LOS E to LOS F. Threshold 4.8-7: In the City of Newport Beach outside of the JWA Area shared with the City of Irvine, the addition of Project-generated trips increases the ICU by 0.010 or more at a study intersection operating at LOS E or F under baseline conditions. Threshold 4.8-8: In the City of Newport Beach inside of the JWA Area shared with the City of Irvine, the addition of Project-generated trips increases the ICU by 0.010 or more at a study intersection operating at LOS F under baseline conditions. CITY OF COSTA MESA The Project would result in a significant transportation/traffic impact if the following conditions occur in the City of Costa Mesa: Threshold 4.8-9: The addition of Project-generated trips causes the LOS at a study intersection within the City of Costa Mesa to change from LOS D to LOS E or F. CALTRANS The Project would result in a significant transportation/traffic impact if any of the following conditions occur at locations within Caltrans jurisdiction: Caltrans Intersections Threshold 4.8-10: The addition of Project-generated trips causes the LOS at a study intersection within Caltrans jurisdiction to degrade from LOS A, B, C, or D to LOS E or F (as measured by the application of the HCM methodologies).
Threshold 4.8-11: The addition of Project-generated trips causes a 2 second or greaterincrease in delay at a study intersection within Caltrans jurisdiction (as measured by the application of HCM methodologies), where the intersection operates at LOS E or LOS F prior to the addition of Project traffic.

Transportation/Traffic
JOHN WAYNE AIRPORT SETTLEMENT AGREEMENT AMENDMENT 4.8-23 ENVIRONMENTAL IMPACT REPORT
Caltrans Freeway Facilities (Mainline, ramp, merge/diverge) Threshold 4.8-12: The addition of Project-generated trips increases the traffic on a freeway mainline, freeway ramp, or merge/diverge section by 2 percent or more, and causes the LOS to degrade from LOS A, B, C, or D to LOS E or F. Threshold 4.8-13: The addition of Project-generated trips increases the traffic on a freeway mainline, freeway ramp, or merge/diverge section by 2 percent or more on a facility operating at LOS E or F prior to the addition of Project traffic. ORANGE COUNTY CONGESTION MANAGEMENT PROGRAM Threshold 4.8-14: The addition of Project-generated trips causes the LOS at a study intersection in the Orange County Transportation Authority Congestion Management Program to change from an acceptable LOS E to LOS F. Threshold 4.8-15: The addition of Project-generated trips increases the ICU by 0.10 or more at a study intersection in the Orange County Transportation Authority Congestion Management Program operating at LOS F under baseline conditions. AIR TRAFFIC PATTERNS Threshold 4.8-16: Would the project result in a change in air traffic patterns, including either an increase in traffic levels or a change in location that result in substantial safety risks?
4.8.5 IMPACT ANALYSIS
INTRODUCTION The analysis evaluated potential traffic impacts on 59 local roadway intersections, as well as the study area freeway ramp intersections and mainline segments. To focus the discussion, the tables in this EIR section only identify those locations where there would be a deficient level of service regardless of whether the deficiency is Project related; that is, locations operating at a deficient condition under either "With Project" or "Without Project" conditions are identified in the tables. Locations operating at acceptable levels of service are not included within the tables, although in each of the tables, there is a reference to the applicable table in the Transportation Impact Analysis (Appendix G) where the level of service information for all the intersections, freeway ramps, and mainline freeway segments can be found. The analysis presented below is arranged first by Project scenario – the Proposed Project is addressed first, followed by Alternatives A, B, and C, and the No Project Alternative. Within the discussion of the Proposed Project and each alternative, an Existing Plus Project analysis is first presented for information purposes, followed by analysis of each Project scenario (Proposed Project, Alternative A, B, C, or No Project) relative to the three analysis phases, Phase 1, Phase 2, and Phase 3. As previously explained in this EIR, the three phases delineate the proposed incremental increases in MAP and ADD levels associated with each scenario..

Transportation/Traffic
4.8-24 JOHN WAYNE AIRPORT SETTLEMENT AGREEMENT AMENDMENT ENVIRONMENTAL IMPACT REPORT
In all cases, it is assumed that the maximum MAP and ADD limits for each phase are reached in the first year of the phase. By assuming the maximum limit is reached in the first year, the EIR identifies the potential significant impacts at the earliest possible time. Following the analysis of the Proposed Project and each of the alternatives, the thresholds of significance are applied on a jurisdiction-by-jurisdiction basis and a determination is made if there is a Project related significant impact. TRAFFIC DATA Proposed Project Existing Plus Project Analyses The Existing Plus Project analysis is a hypothetical scenario that assumes the ultimate Project traffic volumes would be added to existing roadway volumes and infrastructure. The analysis is hypothetical because it incorrectly assumes that the Project would be fully implemented immediately and the corresponding full implementation traffic volumes would be added to existing roadway volumes and infrastructure, even though restrictions would not permit the ultimate MAP and ADD levels until 2026, at the earliest. The Existing Plus Project analysis presumes that the existing environment (existing traffic volumes, existing roadway infrastructure, and existing land uses) will not change over the long-term implementation of the Project. As a result, future increases in traffic volumes attributable to other development projects (i.e., cumulative traffic volumes) are not accounted for in this analysis. This can then result in understating Project impacts because capacity that otherwise would be utilized by future development that precedes a Project is now available to the Project. Conversely, because this analysis does not account for future planned roadway network improvements that would increase roadway capacities, it also potentially can result in overstating Project impacts. Furthermore, because the analysis does not account for future development and related changing land uses, it does not account for the corresponding change in trip distribution patterns that accompany changing land uses. For example, specific to the Proposed Project, the Existing Plus Proposed Project analysis understates impacts as compared to the evaluation of future scenarios. Under Existing Plus Proposed Project, significant impacts are identified at one intersection (Campus Drive/Bristol Street North) and one Caltrans facility (On-ramp from I-405 northbound to MacArthur Blvd Off-ramp). However, under Phase 3 analyses, which takes into account future cumulative traffic as well as Project traffic, the Proposed Project would result in significant impacts at three intersections (MacArthur Boulevard/Michelson Drive, Von Karman Avenue/Alton Parkway, and Campus Drive/Bristol Street North) and one Caltrans (On-ramp from I-405 northbound to MacArthur Blvd Off-ramp). Therefore, the Existing Plus Proposed Project analysis is misleading since it does not identify several impacts, which occur as a result of both Project trips and ambient growth in background traffic. Thus, if used to measure significance as to the Proposed Project, the Existing Plus Proposed Project scenario would understate Project impacts. Therefore, it would be misleading to the public and decision makers to rely on the Existing Plus Project evaluation for purposes of identifying Project impacts and mitigation. These scenarios are included to satisfy CEQA requirements and are provided for disclosure, information, and comparison purposes only.

Transportation/Traffic
JOHN WAYNE AIRPORT SETTLEMENT AGREEMENT AMENDMENT 4.8-25 ENVIRONMENTAL IMPACT REPORT
Significant traffic impacts and recommended mitigation are assessed for each phase of the Project, with Phase 3 representing the long-term cumulative conditions evaluations because those scenarios accurately account for the long-range projected development of the Project within the context of an ever-changing traffic network and associated land uses. Specific to the Proposed Project, Table 4.8-12 shows there is one location under the Existing Plus Proposed Project scenario that would degrade from acceptable conditions to LOS E. This intersection, Campus Drive/Bristol Street North, is located in the City of Newport Beach and the LOS worsens from LOS D to LOS E with the addition of the Proposed Project trips. As such, under this scenario, the Proposed Project would result in a significant impact at this intersection. The evaluation was based on City of Newport Beach intersection analysis methodology. The LOS for each of the 59 study intersections under the Existing Plus Proposed Project evaluation is provided in Appendix G (Table 6-1). TABLE 4.8-12
INTERSECTION OPERATING AT A DEFICIENT LEVEL OF SERVICE EXISTING PLUS PROPOSED PROJECT
Intersection Traffic Control Peak Hour
Existing
Existing Plus Proposed
Project V/C LOS V/C LOS Change17. Campus Dr at Bristol St North Signal AM 0.596 A 0.620 B 0.024PM 0.885 D 0.928 E 0.043
Boldface indicates the intersection is operating below acceptable standards for the applicable jurisdiction. Source: Transportation Impact Analysis, (Full data in Table 6-1), Fehr & Peers, 2014 Of the four intersections under the shared jurisdiction of Caltrans only the Jamboree Road at the I-405 southbound ramps would operate at deficient conditions under the "with project" scenario. However, as shown in Table 4.8-13 because the addition of Project-generated trips would not cause a two second delay increase at an intersection operating at an unacceptable LOS prior to the addition of Project traffic, the Existing Plus Proposed Project would not result in significant impacts at the Caltrans intersections. TABLE 4.8-13
CALTRANS INTERSECTION OPERATING AT A DEFICIENT LEVEL OF SERVICE
EXISTING PLUS PROPOSED PROJECT Intersection
Traffic Control
Existing Existing Plus
Proposed Project Peak Hour Delaya LOS Delaya LOSJamboree Rd at I-405 SB Ramps Signal AM 90.8 F 91.4 FPM 30.7 C 30.9 CNB=Northbound
Boldface indicates the intersection is operating below acceptable standards for the applicable jurisdiction. a Delay is provided in seconds. Source: Transportation Impact Analysis, (Full data in Table 6-2), Fehr & Peers, 2014
Transportation/Traffic
4.8-26 JOHN WAYNE AIRPORT SETTLEMENT AGREEMENT AMENDMENT ENVIRONMENTAL IMPACT REPORT
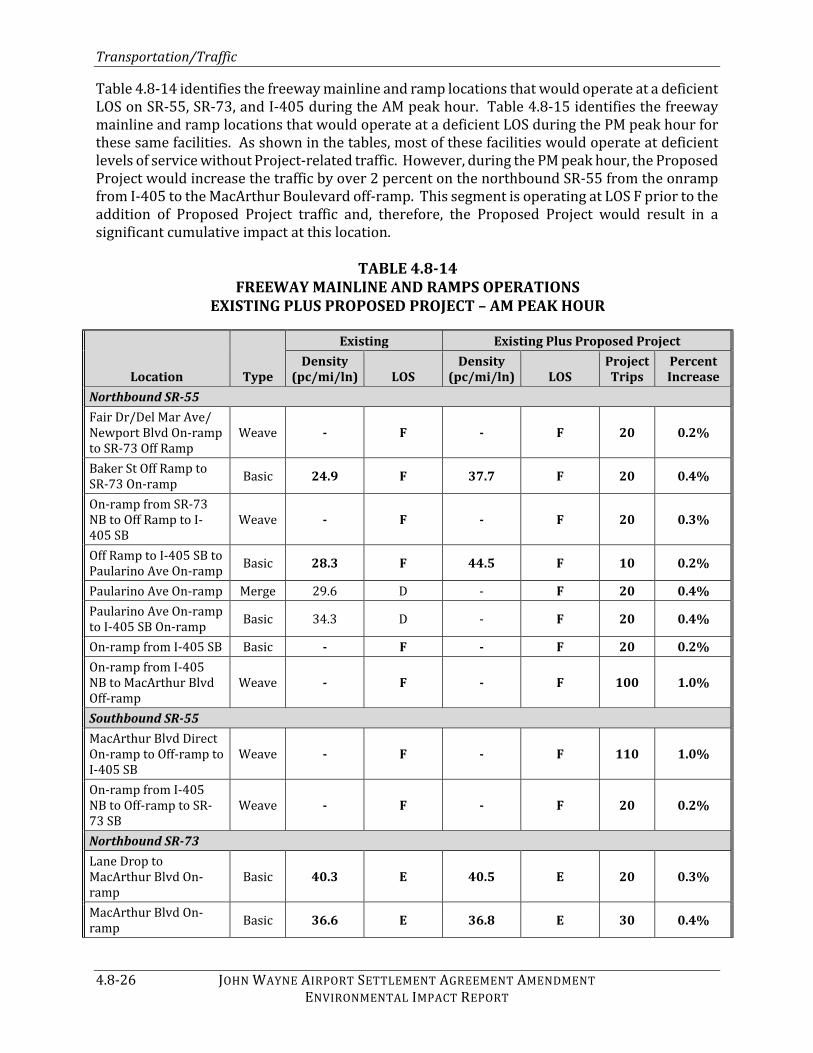
Table 4.8-14 identifies the freeway mainline and ramp locations that would operate at a deficient LOS on SR-55, SR-73, and I-405 during the AM peak hour. Table 4.8-15 identifies the freeway mainline and ramp locations that would operate at a deficient LOS during the PM peak hour for these same facilities. As shown in the tables, most of these facilities would operate at deficient levels of service without Project-related traffic. However, during the PM peak hour, the Proposed Project would increase the traffic by over 2 percent on the northbound SR-55 from the onramp from I-405 to the MacArthur Boulevard off-ramp. This segment is operating at LOS F prior to the addition of Proposed Project traffic and, therefore, the Proposed Project would result in a significant cumulative impact at this location. TABLE 4.8-14
FREEWAY MAINLINE AND RAMPS OPERATIONS EXISTING PLUS PROPOSED PROJECT – AM PEAK HOUR
Location Type
Existing Existing Plus Proposed ProjectDensity
(pc/mi/ln) LOS Density
(pc/mi/ln) LOS Project Trips
Percent Increase
Northbound SR-55 Fair Dr/Del Mar Ave/ Newport Blvd On-ramp to SR-73 Off Ramp Weave - F - F 20 0.2% Baker St Off Ramp to SR-73 On-ramp Basic 24.9 F 37.7 F 20 0.4% On-ramp from SR-73 NB to Off Ramp to I-405 SB Weave - F - F 20 0.3% Off Ramp to I-405 SB to Paularino Ave On-ramp Basic 28.3 F 44.5 F 10 0.2% Paularino Ave On-ramp Merge 29.6 D - F 20 0.4%Paularino Ave On-ramp to I-405 SB On-ramp Basic 34.3 D - F 20 0.4% On-ramp from I-405 SB Basic - F - F 20 0.2%On-ramp from I-405 NB to MacArthur Blvd Off-ramp Weave - F - F 100 1.0%
Southbound SR-55 MacArthur Blvd Direct On-ramp to Off-ramp to I-405 SB Weave - F - F 110 1.0% On-ramp from I-405 NB to Off-ramp to SR-73 SB Weave - F - F 20 0.2%
Northbound SR-73 Lane Drop to MacArthur Blvd On-ramp Basic 40.3 E 40.5 E 20 0.3% MacArthur Blvd On-ramp Basic 36.6 E 36.8 E 30 0.4%

Transportation/Traffic
JOHN WAYNE AIRPORT SETTLEMENT AGREEMENT AMENDMENT 4.8-27 ENVIRONMENTAL IMPACT REPORT
TABLE 4.8-14 FREEWAY MAINLINE AND RAMPS OPERATIONS
EXISTING PLUS PROPOSED PROJECT – AM PEAK HOUR
Location Type
Existing Existing Plus Proposed ProjectDensity
(pc/mi/ln) LOS Density
(pc/mi/ln) LOS Project Trips
Percent Increase Jamboree Rd On-ramp to Bristol St N Off-ramp Basic 23.7 C 43.4 E 40 0.7% Bristol St N Off-ramp Diverge 30.5 D - F 40 0.6%Bristol St N On-ramp to SR-55 N Off-ramp Weave 32.1 D - F 120 1.4% On-ramp from SR-55 NB Weave 33.1 D - F 90 1.7% Bristol St N Off-ramp Diverge 30.5 D - F 40 0.6%Bristol St N On-ramp to SR-55 N Off-ramp Weave 32.1 D - F 120 1.4% On-ramp from SR-55 NB Weave 33.1 D - F 90 1.7%
Southbound SR-73 Bear St On-ramp to SR-55 S Off-ramp Weave 38.7 E 39.1 E 40 0.6% On-ramp from SR-55 SB to Campus/Bristol St S Off-ramp Weave - F - F 60 0.6%
Northbound I-405 Culver St On-ramp to Jamboree Rd Off-ramp Basic 42.7 E 43.2 E 50 0.5% Jamboree Rd Direct On-ramp to MacArthur Blvd Off-ramp Weave - F - F 50 0.4% MacArthur Blvd On-ramp to SR-55 NB & SB Off-ramp Weave 40.8 E 37.6 E 10 0.1% Bristol St S On-ramp to S Coast Off Weave - F - F 0 0.0%
Southbound I-405 Off-ramp to I-405 SB to Fairview Rd On-ramp Basic 30.8 F 31.0 F 40 0.5% Fairview Rd On-ramp Merge 34.1 F 34.3 F 50 0.5%Fairview Rd On-ramp to Bristol St Off-ramp Basic 38.6 F 38.9 F 50 0.5% Bristol St Off-ramp Diverge 27.2 F 27.4 F 50 0.4%Bristol St On-ramp to SR-55 NB Off-ramp Weave - F - F 60 0.5% Lane Drop Basic 36.9 E 34.3 D 60 0.8%On-ramp from SR-55 NB Basic 37.0 E 34.9 D 70 0.7%

Transportation/Traffic
4.8-28 JOHN WAYNE AIRPORT SETTLEMENT AGREEMENT AMENDMENT ENVIRONMENTAL IMPACT REPORT
TABLE 4.8-14 FREEWAY MAINLINE AND RAMPS OPERATIONS
EXISTING PLUS PROPOSED PROJECT – AM PEAK HOUR
Location Type
Existing Existing Plus Proposed ProjectDensity
(pc/mi/ln) LOS Density
(pc/mi/ln) LOS Project Trips
Percent Increase SR-55 SB On-ramp to MacArthur Blvd Off-ramp Weave - F - F 70 0.5% MacArthur Blvd On-ramp to Jamboree Rd Off-ramp Weave - F - F 60 0.5%
Notes: 1. Freeway facilities operating below acceptable standards are noted in bold. 2. Analysis performed using the HCM 2010 methodology. 3. pc/mi/ln = passenger cars per mile per lane. 4. NB=Northbound; SB=Southbound Source: Transportation Impact Analysis, (Full data in Tables 6-3, 6-4, and 6-5), Fehr & Peers, 2014 TABLE 4.8-15
PROJECT FREEWAY MAINLINE AND RAMPS OPERATIONS EXISTING PLUS PROPOSED PROJECT – PM PEAK HOUR
Location Type
Existing Existing Plus Proposed ProjectDensity
(pc/mi/ln) LOS Density
(pc/mi/ln) LOS Project Trips
Percent Increase
Northbound SR-55 Fair Dr/Del Mar Ave/Newport Blvd On-ramp to SR-73 Off-ramp Weave - F - F 30 0.4%
Paularino Ave On-ramp Merge 14.9 F 15.8 F 30 1.0% Paularino Ave On-ramp to I-405 SB On-ramp Basic 15.9 F 16.8 F 30 1.0% On-ramp from I-405 SB Basic 15.5 F 16.2 F 30 0.8% On-ramp from I-405 NB to MacArthur Blvd Off-ramp Weave 23.0 F 26.4 F 140 2.5%
Southbound SR-55 MacArthur Blvd Loop On-ramp to MacArthur Blvd Direct On-ramp Basic 36.5 E 37.0 E 60 0.8% MacArthur Blvd Direct On-ramp to Off-ramp to I-405 SB Weave - F - F 80 0.8%

Transportation/Traffic
JOHN WAYNE AIRPORT SETTLEMENT AGREEMENT AMENDMENT 4.8-29 ENVIRONMENTAL IMPACT REPORT
TABLE 4.8-15 PROJECT FREEWAY MAINLINE AND RAMPS OPERATIONS
EXISTING PLUS PROPOSED PROJECT – PM PEAK HOUR
Location Type
Existing Existing Plus Proposed ProjectDensity
(pc/mi/ln) LOS Density
(pc/mi/ln) LOS Project Trips
Percent Increase On-ramp from I-405 NB to Off-ramp to SR-73 SB Weave - F - F 10 0.1% SR-73 SB On-ramp to Newport Blvd S/Mesa Dr Off-ramp Weave - F - F 20 0.2%
Northbound SR-73 Bristol St N Off-ramp Diverge 27.9 C 35.9 E 30 0.5% Bristol St N On-ramp to SR-55 N Off-ramp Weave - F - F 100 1.1% Off-ramp to SR-55 SB Diverge 35.5 E - F 100 1.3% On-ramp from SR-55 NB Weave - F - F 90 1.3% Southbound SR-73 On-ramp from SR-55 SB to Campus/Bristol St S Off-ramp Weave - F - F 40 0.6% Northbound I-405 Culver St On-ramp to Jamboree Rd Off-ramp Basic 25.5 F 25.6 F 50 0.7% Jamboree Rd Off-ramp Diverge 18.2 F 18.4 F 50 0.6% Jamboree Rd Loop On-ramp Merge 24.2 F 23.7 F 50 0.7% Jamboree Rd Direct On-ramp to MacArthur Blvd Off-ramp Weave 41.6 F 40.4 F 60 0.6% MacArthur Blvd On-ramp to SR-55 NB & SB Off-ramp Weave - F 43.2 F 20 0.2% SR-55 Off-ramp to Bristol St Off-ramp Basic 33.9 F 26.2 F 10 0.1% Bristol St/Ave of the Arts Off-ramp Diverge 36.1 F 30.9 F 10 0.1% On-ramp from SR-55 SB Basic 27.2 F 22.4 F 0 0.0% Bristol St N On-ramp Merge 23.9 F 21.3 F 0 0.0%Bristol St S On-ramp to S Coast Off-ramp Weave - F - F 0 0.0%

Transportation/Traffic
4.8-30 JOHN WAYNE AIRPORT SETTLEMENT AGREEMENT AMENDMENT ENVIRONMENTAL IMPACT REPORT
TABLE 4.8-15 PROJECT FREEWAY MAINLINE AND RAMPS OPERATIONS
EXISTING PLUS PROPOSED PROJECT – PM PEAK HOUR
Location Type
Existing Existing Plus Proposed ProjectDensity
(pc/mi/ln) LOS Density
(pc/mi/ln) LOS Project Trips
Percent Increase
Southbound I-405 SR-55 SB On-ramp to MacArthur Blvd Off-ramp Weave 43.6 E - F 80 0.8% MacArthur Blvd On-ramp to Jamboree Rd Off-ramp Weave 44.8 E 45.1 E 70 0.6% Jamboree Rd Loop On-ramp Merge 21.3 F 22.1 F 70 1.1% Jamboree Rd Direct On-ramp Merge 21.4 F 22.9 F 90 1.3% Notes: 1. Freeway facilities operating below acceptable standards are noted in bold. 2. Analysis performed using the HCM 2010 methodology. 3. pc/mi/ln = passenger cars per mile per lane. 4. NB=Northbound; SB=Southbound Source: Transportation Impact Analysis, (Full data in Tables 6-6, 6-7, and 6-8), Fehr & Peers, 2014 Phase 1 Table 4.8-16 shows there is one location where there is an impact at a local roadway intersection with the Proposed Project in Phase 1. During the PM peak hour, the LOS at the Campus Drive at Bristol Street North intersection in the City of Newport Beach worsens. The change is of sufficient magnitude that it would result in a significant impact at this intersection. The evaluation was based on City of Newport Beach intersection analysis methodology. The LOS for each of the 59 study intersections under the Proposed Project, Phase 1 evaluation is provided in Appendix G (Table 6-9). TABLE 4.8-16
INTERSECTION LEVEL OF SERVICE PHASE 1 PROPOSED PROJECT
Intersection Traffic Control Peak Hour
Without Project With Proposed Project
V/C LOS V/C LOS Change17. Campus Dr at Bristol St North Signal AM 0.614 B 0.626 B 0.012 PM 0.916 E 0.936 E 0.020 Boldface indicates the intersection is operating below acceptable standards for the applicable jurisdiction. Source: Transportation Impact Analysis, (Full data in Table 6-9), Fehr & Peers, 2014

Transportation/Traffic
JOHN WAYNE AIRPORT SETTLEMENT AGREEMENT AMENDMENT 4.8-31 ENVIRONMENTAL IMPACT REPORT
Of the four intersections under the shared jurisdiction of Caltrans only the Jamboree Road at the I-405 southbound ramps would operate at deficient conditions under the "with project" scenario. However, as shown in Table 4.8-17 because the addition of Proposed Project-generated trips would not cause a two second delay increase at an intersection operating at an unacceptable LOS prior to the addition of Project traffic, the Proposed Project, Phase 1 would not result in significant impacts at the Caltrans intersections. TABLE 4.8-17
CALTRANS INTERSECTION LEVEL OF SERVICE PHASE 1 PROPOSED PROJECT
Intersection Traffic Control Peak Hour
Without Project With Proposed
Project Delaya LOS Delaya LOS
Jamboree Rd at I-405 SB Ramps Signal AM 94.7 F 94.7 F PM 31.0 C 31.0 C Boldface indicates the intersection is operating below acceptable standards for the applicable jurisdiction. a Delay is provided in seconds. Source: Transportation Impact Analysis, (Full data in Table 6-10), Fehr & Peers, 2014 Table 4.8-18 identifies the freeway mainline and ramp locations that would operate at a deficient LOS on SR-55, SR-73, and I-405 during the AM peak hour. Table 4.8-19 identifies the freeway mainline and ramp locations that would operate at a deficient LOS during the PM peak hour for these same facilities. As shown in the tables, most of these facilities would operate at deficient levels of service without Proposed Project-related traffic. However, because the addition of Proposed Project trips would not result in a decrease in LOS from acceptable to unacceptable, and because the addition of Proposed Project trips would not increase traffic by 2 percent or more, impacts would be less than significant.
TABLE 4.8-18 FREEWAY MAINLINE AND RAMPS OPERATIONS PHASE 1 PROPOSED PROJECT – AM PEAK HOUR
Location Type
Without Project With Proposed ProjectDensity
(pc/mi/ln) LOSDensity
(pc/mi/ln) LOS Project Trips
Percent Increase
Northbound SR-55 Fair Dr/Del Mar Ave/Newport Blvd On-ramp to SR-73 Off-ramp Weave - F - F 20 0.2% Baker St Off-ramp to SR-73 On-ramp Basic 37.7 F 37.9 F 20 0.3% On-ramp from SR-73 NB to Off-ramp to I-405 SB Weave - F - F 20 0.2% Off-ramp to I-405 SB to Paularino Ave On-ramp Basic 44.5 F 44.7 F 10 0.2% Paularino Ave On-ramp Merge - F - F 20 0.3%

Transportation/Traffic
4.8-32 JOHN WAYNE AIRPORT SETTLEMENT AGREEMENT AMENDMENT ENVIRONMENTAL IMPACT REPORT
TABLE 4.8-18 FREEWAY MAINLINE AND RAMPS OPERATIONS PHASE 1 PROPOSED PROJECT – AM PEAK HOUR
Location Type
Without Project With Proposed ProjectDensity
(pc/mi/ln) LOSDensity
(pc/mi/ln) LOS Project Trips
Percent Increase Paularino Ave On-ramp to I-405 SB On-ramp Basic - F - F 20 0.3% On-ramp from I-405 SB Basic - F - F 20 0.2%On-ramp from I-405 NB to MacArthur Blvd Off-ramp Weave - F - F 60 0.5%
Southbound SR-55 MacArthur Blvd Direct On-ramp to Off-ramp to I-405 SB Weave - F - F 60 0.6% On-ramp from I-405 NB to Off-ramp to SR-73 SB Weave - F - F 20 0.2%
Northbound SR-73 Lane Drop to MacArthur Blvd On-ramp Basic 40.4 E 40.5 E 10 0.2% MacArthur Blvd On-ramp Basic 36.7 E 36.8 E 20 0.3%Jamboree Rd On-ramp Merge 34.9 D 35.1 E 30 0.3%Jamboree Rd On-ramp to Bristol St N Off-ramp Basic 43.2 E 43.5 E 30 0.3% Bristol St N Off-ramp Diverge - F - F 30 0.3%Bristol St N On-ramp to SR-55 N Off-ramp Weave - F - F 70 0.7% On-ramp from SR-55 NB Weave - F - F 50 0.7%Southbound SR-73 Bear St On-ramp to SR-55 S Off-ramp Weave 38.8 E 39.1 E 30 0.5% On-ramp from SR-55 SB to Campus/Bristol St S Off-ramp Weave - F - F 50 0.5%
Northbound I-405 Culver St On-ramp to Jamboree Rd Off-ramp Basic 42.8 E 43.1 E 30 0.3% Jamboree Rd Direct On-ramp to MacArthur Blvd Off-ramp Weave - F - F 30 0.2% MacArthur Blvd On-ramp to SR-55 NB & SB Off-ramp Weave 37.5 E 37.7 E 10 0.1% Bristol St S On-ramp to South Coast Off-ramp Weave - F - F 0 0.0%
Southbound I-405 Off-ramp to I-405 SB to Fairview Rd On-ramp Basic 30.9 F 31.0 F 20 0.2% Fairview Rd On-ramp Merge 34.2 F 34.3 F 30 0.3%

Transportation/Traffic
JOHN WAYNE AIRPORT SETTLEMENT AGREEMENT AMENDMENT 4.8-33 ENVIRONMENTAL IMPACT REPORT
TABLE 4.8-18 FREEWAY MAINLINE AND RAMPS OPERATIONS PHASE 1 PROPOSED PROJECT – AM PEAK HOUR
Location Type
Without Project With Proposed ProjectDensity
(pc/mi/ln) LOSDensity
(pc/mi/ln) LOS Project Trips
Percent Increase Fairview Rd On-ramp to Bristol St Off-ramp Basic 38.8 F 39.0 F 30 0.3% Bristol St Off-ramp Diverge 27.3 F 27.4 F 30 0.3%Bristol St On-ramp to SR-55 NB Off-ramp Weave - F - F 40 0.3% On-ramp from SR-55 NB Basic 34.8 D 35.1 E 50 0.5%SR-55 SB On-ramp to MacArthur Blvd Off-ramp Weave - F - F 50 0.4% MacArthur Blvd On-ramp to Jamboree Rd Off-ramp Weave - F - F 50 0.4% Notes: 1. Freeway facilities operating below acceptable standards are noted in bold. 2. Analysis performed using the HCM 2010 methodology. 3. pc/mi/ln = passenger cars per mile per lane. 4. NB=Northbound; SB=Southbound Source: Transportation Impact Analysis, (Full data in Tables 6-11, 6-12, and 6-13), Fehr & Peers, 2014
TABLE 4.8-19 PROJECT FREEWAY MAINLINE AND RAMPS OPERATIONS
PHASE 1 PROPOSED PROJECT – PM PEAK HOUR
Location Type
Without Project With Proposed ProjectDensity
(pc/mi/ln) LOS Density
(pc/mi/ln) LOS Project Trips
Percent Increase
Northbound SR-55 Fair Dr/Del Mar Ave/ Newport Blvd On-ramp to SR-73 Off-ramp Weave - F - F 20 0.3% Paularino Ave On-ramp Merge 15.7 F 15.8 F 20 0.7%Paularino Ave On-ramp to I-405 SB On-ramp Basic 16.7 F 16.8 F 20 0.7% On-ramp from I-405 SB Basic 16.2 F 16.2 F 20 0.5%On-ramp from I-405 NB to MacArthur Blvd Off-ramp Weave 25.5 F 26.1 F 80 1.3%
Southbound SR-55 MacArthur Blvd Loop On-ramp to MacArthur Blvd Direct On-ramp Basic 36.6 E 36.8 E 30 0.4%

Transportation/Traffic
4.8-34 JOHN WAYNE AIRPORT SETTLEMENT AGREEMENT AMENDMENT ENVIRONMENTAL IMPACT REPORT
TABLE 4.8-19 PROJECT FREEWAY MAINLINE AND RAMPS OPERATIONS
PHASE 1 PROPOSED PROJECT – PM PEAK HOUR
Location Type
Without Project With Proposed ProjectDensity
(pc/mi/ln) LOS Density
(pc/mi/ln) LOS Project Trips
Percent IncreaseMacArthur Blvd Direct On-ramp to Off-ramp to I-405 SB Weave - F - F 50 0.5% On-ramp from I-405 NB to Off-ramp to SR-73 SB Weave - F - F 10 0.1% SR-73 SB On-ramp to Newport Blvd S/Mesa Dr Off-ramp Weave - F - F 20 0.2%
Northbound SR-73 Bristol St N Off-ramp Diverge 35.9 E 36.1 E 30 0.4%Bristol St N On-ramp to SR-55 N Off-ramp Weave - F - F 60 0.6% Off-ramp to SR-55 SB Diverge - F - F 60 0.6%On-ramp from SR-55 NB Weave - F - F 50 0.6%Southbound SR-73 On-ramp from SR-55 SB to Campus/Bristol St S Off-ramp Weave - F - F 30 0.4% Northbound I-405 Culver St On-ramp to Jamboree Rd Off-ramp Basic 25.6 F 25.7 F 30 0.4% Jamboree Rd Off-ramp Diverge 18.3 F 18.4 F 30 0.3%Jamboree Rd Loop On-ramp Merge 23.8 F 23.9 F 30 0.4% Jamboree Rd Direct On-ramp to MacArthur Blvd Off-ramp Weave 40.1 F 40.5 F 40 0.4% MacArthur Blvd On-ramp to SR-55 NB & SB Off-ramp Weave - F - F 20 0.2% SR-55 Off-ramp to Bristol St Off-ramp Basic 26.4 F 26.5 F 10 0.2% Bristol St/Ave of the Arts Off-ramp Diverge 31.0 F 31.2 F 10 0.1% On-ramp from SR-55 SB Basic 22.5 F 22.5 F 0 0.0%Bristol St N On-ramp Merge 21.4 F 21.4 F 0 0.0%Bristol St S On-ramp to South Coast Off-ramp Weave - F - F 0 0.0%

Transportation/Traffic
JOHN WAYNE AIRPORT SETTLEMENT AGREEMENT AMENDMENT 4.8-35 ENVIRONMENTAL IMPACT REPORT
TABLE 4.8-19 PROJECT FREEWAY MAINLINE AND RAMPS OPERATIONS
PHASE 1 PROPOSED PROJECT – PM PEAK HOUR
Location Type
Without Project With Proposed ProjectDensity
(pc/mi/ln) LOS Density
(pc/mi/ln) LOS Project Trips
Percent Increase
Southbound I-405 SR-55 SB On-ramp to MacArthur Blvd Off-ramp Weave - F 44.2 E 60 0.6% MacArthur Blvd On-ramp to Jamboree Rd Off-ramp Weave 44.2 E 45.4 E 60 0.6% Jamboree Rd Loop On-ramp Merge 22.4 F 22.2 F 60 0.9% Jamboree Rd Direct On-ramp Merge 22.6 F 23.0 F 70 0.9% Notes: 1. Freeway facilities operating below acceptable standards are noted in bold. 2. Analysis performed using the HCM 2010 methodology. 3. pc/mi/ln = passenger cars per mile per lane. 4. NB=Northbound; SB=Southbound Source: Transportation Impact Analysis, (Full data in Tables 6-14, 6-15, and 6-16), Fehr & Peers, 2014 Proposed Project Phase 2 Table 4.8-20 shows the locations where there would be a deficient local roadway intersection LOS with the Proposed Project, Phase 2. As shown on the table, Campus Drive at Bristol Street North (Intersection 17) is projected to operate at deficient conditions during the PM peak hour. This would be a significant impact because the ICU would increase by .01 or more. The evaluation for this intersection was based on City of Newport Beach intersection analysis methodology. The LOS for each of the 59 study intersections under the Proposed Project, Phase 2 evaluation is provided in Appendix G (Table 6-17). TABLE 4.8-20
INTERSECTION LEVEL OF SERVICE PHASE 2 PROPOSED PROJECT
Intersection Traffic Control Peak Hour
Without Project With Proposed Project
V/C LOS V/C LOS Chang
e 17. Campus Dr at Bristol St North Signal AM 0.641 B 0.659 B 0.018PM 0.964 E 0.998 E 0.034Boldface indicates the intersection is operating below acceptable standards for the applicable jurisdiction. Source: Transportation Impact Analysis, (Full data in Table 6-17), Fehr & Peers, 2014
Transportation/Traffic
4.8-36 JOHN WAYNE AIRPORT SETTLEMENT AGREEMENT AMENDMENT ENVIRONMENTAL IMPACT REPORT
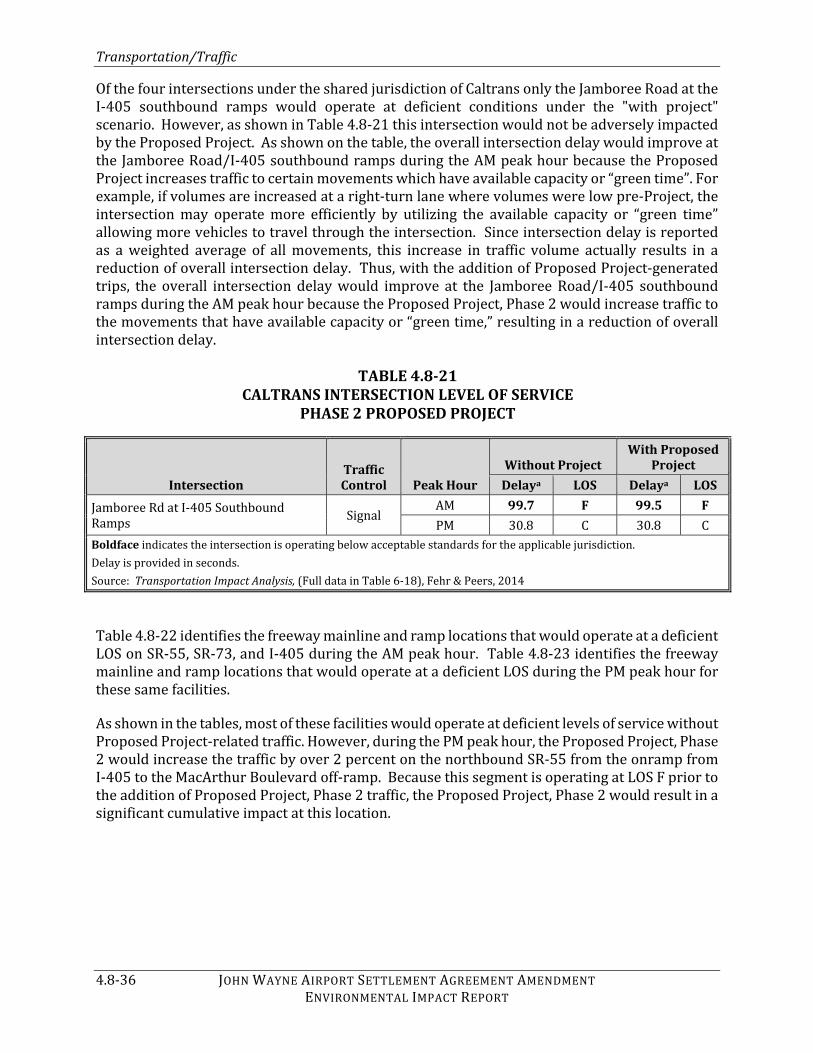
Of the four intersections under the shared jurisdiction of Caltrans only the Jamboree Road at the I-405 southbound ramps would operate at deficient conditions under the "with project" scenario. However, as shown in Table 4.8-21 this intersection would not be adversely impacted by the Proposed Project. As shown on the table, the overall intersection delay would improve at the Jamboree Road/I-405 southbound ramps during the AM peak hour because the Proposed Project increases traffic to certain movements which have available capacity or “green time”. For example, if volumes are increased at a right-turn lane where volumes were low pre-Project, the intersection may operate more efficiently by utilizing the available capacity or “green time” allowing more vehicles to travel through the intersection. Since intersection delay is reported as a weighted average of all movements, this increase in traffic volume actually results in a reduction of overall intersection delay. Thus, with the addition of Proposed Project-generated trips, the overall intersection delay would improve at the Jamboree Road/I-405 southbound ramps during the AM peak hour because the Proposed Project, Phase 2 would increase traffic to the movements that have available capacity or “green time,” resulting in a reduction of overall intersection delay. TABLE 4.8-21
CALTRANS INTERSECTION LEVEL OF SERVICE PHASE 2 PROPOSED PROJECT
Intersection Traffic Control Peak Hour
Without Project With Proposed
Project Delaya LOS Delaya LOSJamboree Rd at I-405 Southbound Ramps Signal AM 99.7 F 99.5 FPM 30.8 C 30.8 C
Boldface indicates the intersection is operating below acceptable standards for the applicable jurisdiction. Delay is provided in seconds. Source: Transportation Impact Analysis, (Full data in Table 6-18), Fehr & Peers, 2014 Table 4.8-22 identifies the freeway mainline and ramp locations that would operate at a deficient LOS on SR-55, SR-73, and I-405 during the AM peak hour. Table 4.8-23 identifies the freeway mainline and ramp locations that would operate at a deficient LOS during the PM peak hour for these same facilities. As shown in the tables, most of these facilities would operate at deficient levels of service without Proposed Project-related traffic. However, during the PM peak hour, the Proposed Project, Phase 2 would increase the traffic by over 2 percent on the northbound SR-55 from the onramp from I-405 to the MacArthur Boulevard off-ramp. Because this segment is operating at LOS F prior to the addition of Proposed Project, Phase 2 traffic, the Proposed Project, Phase 2 would result in a significant cumulative impact at this location.

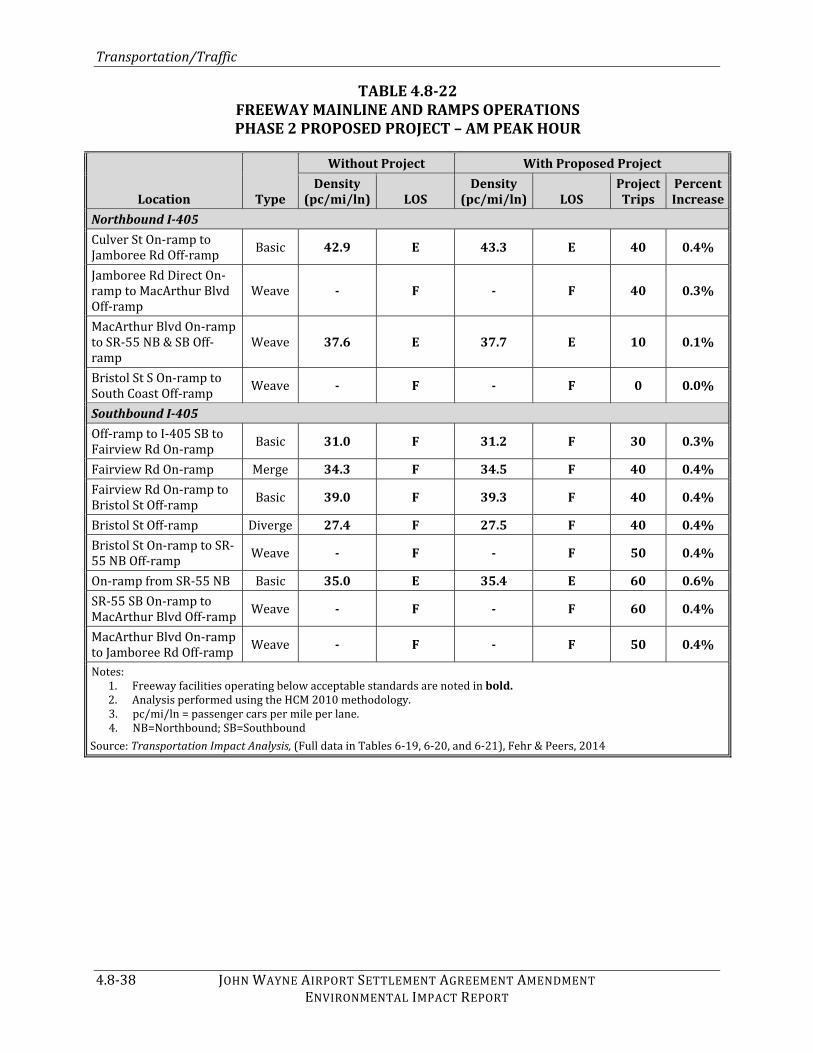
Transportation/Traffic
JOHN WAYNE AIRPORT SETTLEMENT AGREEMENT AMENDMENT 4.8-37 ENVIRONMENTAL IMPACT REPORT
TABLE 4.8-22 FREEWAY MAINLINE AND RAMPS OPERATIONS PHASE 2 PROPOSED PROJECT – AM PEAK HOUR
Location Type
Without Project With Proposed ProjectDensity
(pc/mi/ln) LOS Density
(pc/mi/ln) LOS Project Trips
Percent Increase
Northbound SR-55 Fair Dr/Del Mar Ave/ Newport Blvd On-ramp to SR-73 Off-ramp Weave - F - F 20 0.2% Baker St Off-ramp to SR-73 On-ramp Basic 37.9 F 38.1 F 20 0.3% On-ramp from SR-73 NB to Off-ramp to I-405 SB Weave - F - F 20 0.2% Off-ramp to I-405 SB to Paularino Ave On-ramp Basic 44.8 F 45.0 F 10 0.2% Paularino Ave On-ramp Merge - F - F 20 0.3%Paularino Ave On-ramp to I-405 SB On-ramp Basic - F - F 20 0.3% On-ramp from I-405 SB Basic - F - F 20 0.2%On-ramp from I-405 NB to MacArthur Blvd Off-ramp Weave - F - F 90 0.7%
Southbound SR-55 MacArthur Blvd Direct On-ramp to Off-ramp to I-405 SB Weave - F - F 90 0.8% On-ramp from I-405 NB to Off-ramp to SR-73 SB Weave - F - F 20 0.2%
Northbound SR-73 Lane Drop to MacArthur Blvd On-ramp Basic 40.4 E 40.6 E 20 0.3% MacArthur Blvd On-ramp Basic 36.7 E 36.9 E 30 0.4%Jamboree Rd On-ramp Merge 34.9 D 35.1 E 40 0.5%Jamboree Rd On-ramp to Bristol St N Off-ramp Basic 43.2 E 43.6 E 40 0.5% Bristol St N Off-ramp Diverge - F - F 40 0.4%Bristol St N On-ramp to SR-55 N Off-ramp Weave - F - F 100 1.0% On-ramp from SR-55 NB Weave - F - F 80 1.1%Southbound SR-73 Bear St On-ramp to SR-55 S Off-ramp Weave 38.9 E 39.3 E 40 0.6% On-ramp from SR-55 SB to Campus/Bristol St S Off-ramp Weave - F - F 60 0.6%
Transportation/Traffic
4.8-38 JOHN WAYNE AIRPORT SETTLEMENT AGREEMENT AMENDMENT ENVIRONMENTAL IMPACT REPORT
TABLE 4.8-22 FREEWAY MAINLINE AND RAMPS OPERATIONS PHASE 2 PROPOSED PROJECT – AM PEAK HOUR
Location Type
Without Project With Proposed ProjectDensity
(pc/mi/ln) LOS Density
(pc/mi/ln) LOS Project Trips
Percent Increase
Northbound I-405 Culver St On-ramp to Jamboree Rd Off-ramp Basic 42.9 E 43.3 E 40 0.4% Jamboree Rd Direct On-ramp to MacArthur Blvd Off-ramp Weave - F - F 40 0.3% MacArthur Blvd On-ramp to SR-55 NB & SB Off-ramp Weave 37.6 E 37.7 E 10 0.1% Bristol St S On-ramp to South Coast Off-ramp Weave - F - F 0 0.0%
Southbound I-405 Off-ramp to I-405 SB to Fairview Rd On-ramp Basic 31.0 F 31.2 F 30 0.3% Fairview Rd On-ramp Merge 34.3 F 34.5 F 40 0.4%Fairview Rd On-ramp to Bristol St Off-ramp Basic 39.0 F 39.3 F 40 0.4% Bristol St Off-ramp Diverge 27.4 F 27.5 F 40 0.4%Bristol St On-ramp to SR-55 NB Off-ramp Weave - F - F 50 0.4% On-ramp from SR-55 NB Basic 35.0 E 35.4 E 60 0.6%SR-55 SB On-ramp to MacArthur Blvd Off-ramp Weave - F - F 60 0.4% MacArthur Blvd On-ramp to Jamboree Rd Off-ramp Weave - F - F 50 0.4% Notes: 1. Freeway facilities operating below acceptable standards are noted in bold. 2. Analysis performed using the HCM 2010 methodology. 3. pc/mi/ln = passenger cars per mile per lane. 4. NB=Northbound; SB=Southbound Source: Transportation Impact Analysis, (Full data in Tables 6-19, 6-20, and 6-21), Fehr & Peers, 2014

Transportation/Traffic
JOHN WAYNE AIRPORT SETTLEMENT AGREEMENT AMENDMENT 4.8-39 ENVIRONMENTAL IMPACT REPORT
TABLE 4.8-23 FREEWAY MAINLINE AND RAMPS OPERATIONS PHASE 2 PROPOSED PROJECT – PM PEAK HOUR
Location Type
Without Project With Proposed ProjectDensity
(pc/mi/ln) LOS Density
(pc/mi/ln) LOS Project Trips
Percent Increase
Northbound SR-55 Fair Dr/Del Mar Ave/ Newport Blvd On-ramp to SR-73 Off-ramp Weave - F - F 30 0.4%
Paularino Ave On-ramp Merge 15.7 F 15.9 F 30 1.0% Paularino Ave On-ramp to I-405 SB On-ramp Basic 16.7 F 16.9 F 30 1.0% On-ramp from I-405 SB Basic 16.2 F 16.3 F 30 0.8% On-ramp from I-405 NB to MacArthur Blvd Off-ramp Weave 25.5 F 26.4 F 120 2.0%
Southbound SR-55 MacArthur Blvd Loop On-ramp to MacArthur Blvd Direct On-ramp Basic 36.6 E 37.0 E 50 0.6%
MacArthur Blvd Direct On-ramp to Off-ramp to I-405 SB Weave - F - F 70 0.7% On-ramp from I-405 NB to Off-ramp to SR-73 SB Weave - F - F 10 0.1% SR-73 SB On-ramp to Newport Blvd S/Mesa Dr Off-ramp Weave - F - F 20 0.2%
Northbound SR-73 Bristol St N Off-ramp Diverge 35.9 E 36.1 E 30 0.4%Bristol St N On-ramp to SR-55 N Off-ramp Weave - F - F 80 0.7% Off-ramp to SR-55 SB Diverge - F - F 80 0.9%On-ramp from SR-55 NB Weave - F - F 70 0.8%
Southbound SR-73 On-ramp from SR-55 SB to Campus/Bristol St S Off-ramp Weave - F - F 40 0.5%

Transportation/Traffic
4.8-40 JOHN WAYNE AIRPORT SETTLEMENT AGREEMENT AMENDMENT ENVIRONMENTAL IMPACT REPORT
TABLE 4.8-23 FREEWAY MAINLINE AND RAMPS OPERATIONS PHASE 2 PROPOSED PROJECT – PM PEAK HOUR
Location Type
Without Project With Proposed ProjectDensity
(pc/mi/ln) LOS Density
(pc/mi/ln) LOS Project Trips
Percent Increase
Northbound I-405 Culver St On-ramp to Jamboree Rd Off-ramp Basic 25.6 F 25.8 F 40 0.5% Jamboree Rd Off-ramp Diverge 18.4 F 18.5 F 40 0.5%Jamboree Rd Loop On-ramp Merge 23.9 F 24.0 F 40 0.5% Jamboree Rd Direct On-ramp to MacArthur Blvd Off-ramp Weave 40.2 F 40.7 F 50 0.5%
MacArthur Blvd On-ramp to SR-55 NB & SB Off-ramp Weave - F - F 20 0.2% SR-55 Off-ramp to Bristol St Off-ramp Basic 26.4 F 26.5 F 10 0.2% Bristol St/Ave of the Arts Off-ramp Diverge 31.1 F 31.2 F 10 0.1% On-ramp from SR-55 SB Basic 22.5 F 22.5 F 0 0.0% Bristol St N On-ramp Merge 21.4 F 21.4 F 0 0.0%Bristol St S On-ramp to South Coast Off-ramp Weave - F - F 0 0.0%
Southbound I-405 SR-55 SB On-ramp to MacArthur Blvd Off-ramp Weave - F - F 70 0.7% MacArthur Blvd On-ramp to Jamboree Rd Off-ramp Weave 44.3 E 45.4 E 60 0.6% Jamboree Rd Loop On-ramp Merge 22.4 F 22.2 F 60 0.9% Jamboree Rd Direct On-ramp Merge 22.7 F 23.2 F 70 0.9% Notes: 1. Freeway facilities operating below acceptable standards are noted in bold. 2. Analysis performed using the HCM 2010 methodology. 3. pc/mi/ln = passenger cars per mile per lane. 4. NB=Northbound; SB=Southbound Source: Transportation Impact Analysis, (Full data in Tables 6-22, 6-23, and 6-24), Fehr & Peers, 2014

Transportation/Traffic
JOHN WAYNE AIRPORT SETTLEMENT AGREEMENT AMENDMENT 4.8-41 ENVIRONMENTAL IMPACT REPORT
Phase 3 Table 4.8-24 shows with the Proposed Project, Phase 3 there would be significant Project-related impacts at Intersections 4 (MacArthur Boulevard at Michelson Drive), 17 (Campus Drive at Bristol Street North), and 53 (Von Karman Avenue at Alton Parkway), during the PM peak hour. The evaluation methodology used for assessing the impact corresponds to the jurisdiction in which the intersection is located and is noted in the table. Though Intersection 52 (Von Karman Avenue at Barranca Parkway) is projected to operate at a deficient LOS, it is not considered a significant Project-related impact because the threshold for intersections in the Irvine Business Complex is the Project-generated trips must increase the ICU by 0.02 or more at a study intersection operating at LOS E or F under baseline conditions. The Proposed Project only increases the ICU at this study intersection by 0.01. Similarly, Intersection 25 (Santa Ana Avenue at Del Mar Avenue) is projected to operate at a deficient LOS with or without the Proposed Project in the AM peak hour. Though the intersection would receive additional traffic associated with the Proposed Project, it would not reduce the LOS at this intersection and, therefore, impacts would not be significant. The LOS for each of the 59 study intersections under the Proposed Project, Phase 3 is provided in Appendix G (Table 6-25). TABLE 4.8-24
INTERSECTION LEVEL OF SERVICE PHASE 3 PROPOSED PROJECT
Intersection Traffic Control Peak Hour
Without Project With Proposed Project
V/C LOS V/C LOS Change4. MacArthur Blvd at Michelson Drive1 Signal AM 0.77 C 0.81 D 0.04PM 0.98 E 1.01 F 0.0317. Campus Dr at Bristol St North2 Signal AM 0.666 B 0.692 B 0.026PM 1.009 F 1.053 F 0.04425. Santa Ana Ave at Del Mar Ave3,4 Stop Controlled AM 36.3 E 45.2 E N/APM 28.1 D 33.8 D N/A52. Von Karman Ave at Barranca Pkwy1 Signal AM 0.83 D 0.84 D 0.01PM 1.06 F 1.07 F 0.0153. Von Karman Ave at Alton Pkwy1 Signal AM 0.83 D 0.84 D 0.01PM 0.99 E 1.01 F 0.02Boldface indicates the intersection is operating below acceptable standards for the applicable jurisdiction. Notes: Signalized intersections evaluated using ICU methodology. 1. Based on City of Irvine intersection analysis methodology. 2. Based on City of Newport Beach intersection analysis methodology. 3. Based on City of Costa Mesa intersection analysis methodology. 4. AWSC = All Way Stop Control; average intersection delay is reported. Source: Transportation Impact Analysis, (Full data in Table 6-25), Fehr & Peers, 2014 Of the four intersections under the shared jurisdiction of Caltrans only the Jamboree Road at the I-405 southbound ramps would operate at deficient conditions under the "with project" scenario. However, as shown in Table 4.8-25 this intersection would not be adversely

Transportation/Traffic
4.8-42 JOHN WAYNE AIRPORT SETTLEMENT AGREEMENT AMENDMENT ENVIRONMENTAL IMPACT REPORT
impacted by the Proposed Project, Phase 3. With the addition of Proposed Project-generated trips the overall intersection delay would improve at the Jamboree Road/I-405 southbound ramps during the AM peak hour because the Proposed Project, Phase 3 would increase traffic to the movements that have available capacity or “green time”. As previously indicated, since intersection delay is reported as a weighted average of all movements, this increase in traffic volume actually results in a reduction of overall intersection delay. TABLE 4.8-25
CALTRANS INTERSECTION LEVEL OF SERVICE PHASE 3 PROPOSED PROJECT
Intersection Traffic Control Peak Hour
Without Project With Proposed
Project Delaya LOS Delaya LOSJamboree Rd at I-405 Southbound Ramps Signal AM 106.3 F 106.2 FPM 30.7 C 30.7 C
Boldface indicates the intersection is operating below acceptable standards for the applicable jurisdiction. a Delay is provided in seconds. Source: Transportation Impact Analysis, (Full data in Table 6-26), Fehr & Peers, 2014 Table 4.8-26 identifies the freeway mainline and ramp locations that would operate at a deficient LOS on SR-55, SR-73, and I-405 during the AM peak hour. Table 4.8-27 identifies the freeway mainline and ramp locations that would operate at a deficient LOS during the PM peak hour for these same facilities. As shown in the tables, most of these facilities would operate at deficient levels of service without Proposed Project-related traffic. However, during the PM peak hour, the Proposed Project, Phase 3 would increase the traffic by over 2 percent on the northbound SR-55 from the onramp from I-405 to the MacArthur Boulevard off-ramp. Because this segment is operating at LOS F prior to the addition of Proposed Project traffic, the Proposed Project, Phase 3 would result in a significant cumulative impact at this location.

Transportation/Traffic
JOHN WAYNE AIRPORT SETTLEMENT AGREEMENT AMENDMENT 4.8-43 ENVIRONMENTAL IMPACT REPORT
TABLE 4.8-26 FREEWAY MAINLINE AND RAMPS OPERATIONS PHASE 3 PROPOSED PROJECT – AM PEAK HOUR
Location Type
Without Project With Proposed ProjectDensity
(pc/mi/ln) LOS Density
(pc/mi/ln) LOS Project Trips
Percent Increase
Northbound SR-55 Fair Dr/Del Mar Ave/ Newport Blvd On-ramp to SR-73 Off-ramp Weave - F - F 20 0.2% Baker St Off-ramp to SR-73 On-ramp Basic 38.0 F 38.3 F 20 0.3% On-ramp from SR-73 NB to Off-ramp to I-405 SB Weave - F - F 20 0.2% Off-ramp to I-405 SB to Paularino Ave On-ramp Basic 45.0 F - F 10 0.2% Paularino Ave On-ramp Merge - F - F 20 0.3%Paularino Ave On-ramp to I-405 SB On-ramp Basic - F - F 20 0.3% On-ramp from I-405 SB Basic - F - F 20 0.2%On-ramp from I-405 NB to MacArthur Blvd Off-ramp Weave - F - F 100 0.8%
Southbound SR-55 MacArthur Blvd Direct On-ramp to Off-ramp to I-405 SB Weave - F - F 110 1.0% On-ramp from I-405 NB to Off-ramp to SR-73 SB Weave - F - F 20 0.2%
Northbound SR-73 Lane Drop to MacArthur Blvd On-ramp Basic 40.5 E 40.7 E 20 0.3% MacArthur Blvd On-ramp Basic 36.8 E 37.0 E 30 0.4% Jamboree Rd On-ramp Merge 35.0 D 35.1 E 40 0.5%Jamboree Rd On-ramp to Bristol St N Off-ramp Basic 43.3 E 43.7 E 40 0.5% Bristol St N Off-ramp Diverge - F - F 40 0.4%Bristol St N On-ramp to SR-55 N Off-ramp Weave - F - F 120 1.2% On-ramp from SR-55 NB Weave - F - F 90 1.2%

Transportation/Traffic
4.8-44 JOHN WAYNE AIRPORT SETTLEMENT AGREEMENT AMENDMENT ENVIRONMENTAL IMPACT REPORT
TABLE 4.8-26 FREEWAY MAINLINE AND RAMPS OPERATIONS PHASE 3 PROPOSED PROJECT – AM PEAK HOUR
Location Type
Without Project With Proposed ProjectDensity
(pc/mi/ln) LOS Density
(pc/mi/ln) LOS Project Trips
Percent Increase
Southbound SR-73 Bear St On-ramp to SR-55 S Off-ramp Weave 39.0 E 39.3 E 40 0.6% On-ramp from SR-55 SB to Campus/Bristol St S Off-ramp Weave - F - F 60 0.6%
Northbound I-405 Culver St On-ramp to Jamboree Rd Off-ramp Basic 43.0 E 43.4 E 50 0.5% Jamboree Rd Direct On-ramp to MacArthur Blvd Off-ramp Weave - F - F 50 0.4% MacArthur Blvd On-ramp to SR-55 NB & SB Off-ramp Weave 37.6 E 37.7 E 10 0.1% Bristol St S On-ramp to South Coast Off-ramp Weave - F - F 0 0.0%
Southbound I-405 Off-ramp to I-405 SB to Fairview Rd On-ramp Basic 31.1 F 31.3 F 40 0.4% Fairview Rd On-ramp Merge 34.4 F 34.6 F 50 0.5%Fairview Rd On-ramp to Bristol St Off-ramp Basic 39.0 F 39.4 F 50 0.5% Bristol St Off-ramp Diverge 27.4 F 27.6 F 50 0.4%Bristol St On-ramp to SR-55 NB Off-ramp Weave - F - F 60 0.5% On-ramp from SR-55 NB Basic 35.2 E 35.6 E 70 0.7%SR-55 SB On-ramp to MacArthur Blvd Off-ramp Weave - F - F 70 0.5% MacArthur Blvd On-ramp to Jamboree Rd Off-ramp Weave - F - F 60 0.5%
Notes: 1. Freeway facilities operating below acceptable standards are noted in bold. 2. Analysis performed using the HCM 2010 methodology. 3. pc/mi/ln = passenger cars per mile per lane. 4. NB=Northbound; SB=Southbound Source: Transportation Impact Analysis, (Full data in Tables 6-27, 6-28, and 6-29), Fehr & Peers, 2014

Transportation/Traffic
JOHN WAYNE AIRPORT SETTLEMENT AGREEMENT AMENDMENT 4.8-45 ENVIRONMENTAL IMPACT REPORT
TABLE 4.8-27 FREEWAY MAINLINE AND RAMPS OPERATIONS PHASE 3 PROPOSED PROJECT – PM PEAK HOUR
Location Type
Without Project With Proposed ProjectDensity
(pc/mi/ln) LOS Density
(pc/mi/ln) LOS Project Trips
Percent Increase
Northbound SR-55 Fair Dr/Del Mar Ave/ Newport Blvd On-ramp to SR-73 Off-ramp Weave - F - F 30 0.4% Paularino Ave On-ramp Merge 15.7 F 15.9 F 30 1.0%Paularino Ave On-ramp to I-405 SB On-ramp Basic 16.7 F 16.9 F 30 1.0% On-ramp from I-405 SB Basic 16.2 F 16.3 F 30 0.8%On-ramp from I-405 NB to MacArthur Blvd Off-ramp Weave 25.5 F 26.5 F 140 2.3%
Southbound SR-55 MacArthur Blvd Loop On-ramp to MacArthur Blvd Direct On-ramp Basic 36.7 E 37.2 E 60 0.8% MacArthur Blvd Direct On-ramp to Off-ramp to I-405 SB Weave - F - F 80 0.8% On-ramp from I-405 NB to Off-ramp to SR-73 SB Weave - F - F 10 0.1% SR-73 SB On-ramp to Newport Blvd S/Mesa Dr Off-ramp Weave - F - F 20 0.2%
Northbound SR-73 Bristol St N Off-ramp Diverge 36.0 E 36.2 E 30 0.4%Bristol St N On-ramp to SR-55 N Off-ramp Weave - F - F 100 0.9% Off-ramp to SR-55 SB Diverge - F - F 100 1.1%On-ramp from SR-55 NB Weave - F - F 90 1.0%Southbound SR-73 On-ramp from SR-55 SB to Campus/Bristol St S Off-ramp Weave - F - F 40 0.5%
Northbound I-405 Culver St On-ramp to Jamboree Rd Off-ramp Basic 25.8 F 26.0 F 50 0.7% Jamboree Rd Off-ramp Diverge 18.5 F 18.6 F 50 0.6%Jamboree Rd Loop On-ramp Merge 24.0 F 24.2 F 50 0.7%

Transportation/Traffic
4.8-46 JOHN WAYNE AIRPORT SETTLEMENT AGREEMENT AMENDMENT ENVIRONMENTAL IMPACT REPORT
TABLE 4.8-27 FREEWAY MAINLINE AND RAMPS OPERATIONS PHASE 3 PROPOSED PROJECT – PM PEAK HOUR
Location Type
Without Project With Proposed ProjectDensity
(pc/mi/ln) LOS Density
(pc/mi/ln) LOS Project Trips
Percent IncreaseJamboree Rd Direct On-ramp to MacArthur Blvd Off-ramp Weave 40.5 F 41.1 F 60 0.7% MacArthur Blvd On-ramp to SR-55 NB & SB Off-ramp Weave - F - F 20 0.2% SR-55 Off-ramp to Bristol St Off-ramp Basic 26.5 F 26.6 F 10 0.2% Bristol St/Ave of the Arts Off-ramp Diverge 31.1 F 31.3 F 10 0.1% On-ramp from SR-55 SB Basic 22.6 F 22.6 F 0 0.0%Bristol St N On-ramp Merge 21.5 F 21.5 F 0 0.0%Bristol St S On-ramp to S Coast Off-ramp Weave - F - F 0 0.0%
Southbound I-405 SR-55 SB On-ramp to MacArthur Blvd Off-ramp Weave - F - F 80 0.8% MacArthur Blvd On-ramp to Jamboree Rd Off-ramp Weave 44.4 E 45.5 E 70 0.7% Jamboree Rd Loop On-ramp Merge 22.5 F 22.3 F 70 1.1% Jamboree Rd Direct On-ramp Merge 22.8 F 23.4 F 90 1.2% Notes: 1. Freeway facilities operating below acceptable standards are noted in bold. 2. Analysis performed using the HCM 2010 methodology. 3. pc/mi/ln = passenger cars per mile per lane. 4. NB=Northbound; SB=Southbound Source: Transportation Impact Analysis, (Full data in Tables 6-30, 6-31, and 6-32), Fehr & Peers, 2014 Caltrans Ramp Queue Analysis A 95th percentile queue analysis has been prepared utilizing the Synchro 7 software to determine if adequate queue storage is provided at the off-ramp at MacArthur Boulevard and Jamboree Road under the Proposed Project scenario. Adequate queue storage is forecast to be provided at the Caltrans off-ramp locations. The detailed analysis is provided in Table 11-1 in the Transportation Impact Analysis (Appendix G).

Transportation/Traffic
JOHN WAYNE AIRPORT SETTLEMENT AGREEMENT AMENDMENT 4.8-47 ENVIRONMENTAL IMPACT REPORT
Alternative A Existing Plus Alternative A As previously discussed, the Existing Plus Project analysis often results in either overstating or understating impacts, or both. Specific to Alternative A, the Existing Plus Project analysis understates impacts. As shown below, under the Existing Plus Alternative A analysis, Alternative A would result in significant impacts at one intersection and one Caltrans on-ramp. However, under the Phase 3 analysis, which also takes into account cumulative traffic growth and future road improvements, Alternative A would result in significant impacts at three intersections and one Caltrans on-ramp. Therefore, the results of the Existing Plus Alternative A analysis in this case are misleading and, as such, are presented for information and disclosure purposes only. Table 4.8-28 shows there is one location under the Existing Plus Alternative A scenario where the LOS degrades from acceptable conditions to LOS E. This intersection, Campus Drive/Bristol Street North, located in the City of Newport Beach, worsens from LOS D to LOS E with the addition of the Alternative A trips. As such, under the Existing Plus Alternative A scenario, Alternative A would result in a significant impact at this intersection. The evaluation was based on City of Newport Beach intersection analysis methodology. The LOS for each of the 59 study intersections under the Existing Plus Alternative A scenario is provided in Appendix G (Table 7-1). TABLE 4.8-28
INTERSECTION OPERATING AT A DEFICIENT LEVEL OF SERVICE EXISTING PLUS ALTERNATIVE A
Intersection Traffic Control Peak Hour
Existing Existing PlusAlternative A
V/C LOS V/C LOS Change17. Campus Dr at Bristol St North Signal AM 0.596 A 0.624 B 0.028PM 0.885 D 0.931 E 0.046Boldface indicates the intersection is operating below acceptable standards for the applicable jurisdiction. Source: Transportation Impact Analysis, (Full data in Table 7-1), Fehr & Peers, 2014 Of the four intersections under the shared jurisdiction of Caltrans only the Jamboree Road at the I-405 southbound ramps would operate at deficient conditions under the "with project" scenario. However, as shown in Table 4.8-29 because the addition of Project-generated trips would not cause a two second delay increase at an intersection operating at an unacceptable LOS prior to the addition of Project traffic, Alternative A would not result in significant impacts at the Caltrans intersections.

Transportation/Traffic
4.8-48 JOHN WAYNE AIRPORT SETTLEMENT AGREEMENT AMENDMENT ENVIRONMENTAL IMPACT REPORT
TABLE 4.8-29 CALTRANS INTERSECTION OPERATING AT A DEFICIENT LEVEL OF SERVICE
EXISTING PLUS ALTERNATIVE A
Intersection Traffic Control Peak Hour
Existing Existing Plus Alternative A
Delay a LOS Delay a LOSJamboree Rd at I-405 SB Ramps Signal AM 90.8 F 91.4 FPM 30.7 C 30.9 CNB=Northbound Boldface indicates the intersection is operating below acceptable standards for the applicable jurisdiction. a Delay is provided in seconds. Source: Transportation Impact Analysis, (Full data in Table 7-2), Fehr & Peers, 2014 Table 4.8-30 identifies the freeway mainline and ramp locations that would operate at a deficient LOS on SR-55, SR-73, and I-405 during the AM peak hour. Table 4.8-31 identifies the freeway mainline and ramp locations that would operate at a deficient LOS during the PM peak hour for these same facilities. As shown in the tables, most of these facilities would operate at deficient levels of service without Project-related traffic. In the PM peak hour, the northbound SR-55 onramp from I-405 to the MacArthur Boulevard off-ramp would also experience an increase in traffic by over 2 percent as a result of Alternative A. Since this segment is operating at LOS F prior to the addition of Project-generated traffic, Alternative A would result in a significant cumulative impact at this location.
TABLE 4.8-30 FREEWAY MAINLINE AND RAMPS OPERATIONS
EXISTING PLUS ALTERNATIVE A – AM PEAK HOUR
Location Type
Existing Existing Plus Alternative ADensity
(pc/mi/ln) LOS Density
(pc/mi/ln) LOS Project Trips
Percent Increase
Northbound SR-55 Fair Dr/Del Mar Ave/ Newport Blvd On-ramp to SR-73 Off-ramp Weave - F - F 20 0.2% Baker St Off-ramp to SR-73 On-ramp Basic 24.9 F 37.7 F 20 0.4% On-ramp from SR-73 NB to Off-ramp to I-405 SB Weave - F - F 20 0.3% Off-ramp to I-405 SB to Paularino Ave On-ramp Basic 28.3 F 44.5 F 10 0.2% Paularino Ave On-ramp Merge 29.6 D - F 20 0.4%Paularino Ave On-ramp to I-405 SB On-ramp Basic 34.3 D - F 20 0.4% On-ramp from I-405 SB Basic - F - F 20 0.2%

Transportation/Traffic
JOHN WAYNE AIRPORT SETTLEMENT AGREEMENT AMENDMENT 4.8-49 ENVIRONMENTAL IMPACT REPORT
TABLE 4.8-30 FREEWAY MAINLINE AND RAMPS OPERATIONS
EXISTING PLUS ALTERNATIVE A – AM PEAK HOUR
Location Type
Existing Existing Plus Alternative ADensity
(pc/mi/ln) LOS Density
(pc/mi/ln) LOS Project Trips
Percent IncreaseOn-ramp from I-405 NB to MacArthur Blvd Off-ramp Weave - F - F 110 1.1%
Southbound SR-55 MacArthur Blvd Direct On-ramp to Off-ramp to I-405 SB Weave - F - F 110 1.0% On-ramp from I-405 NB to Off-ramp to SR-73 SB Weave - F - F 20 0.2%
Northbound SR-73 Lane Drop to MacArthur Blvd On-ramp Basic 40.3 E 40.5 E 20 0.3% MacArthur Blvd On-ramp Basic 36.6 E 36.8 E 30 0.4%Jamboree Rd On-ramp to Bristol St N Off-ramp Basic 23.7 C 43.4 E 40 0.7% Bristol St N Off-ramp Diverge 30.5 D - F 40 0.6%Bristol St N On-ramp to SR-55 N Off-ramp Weave 32.1 D - F 130 1.5% On-ramp from SR-55 NB Weave 33.1 D - F 100 1.9%Southbound SR-73 Bear St On-ramp to SR-55 S Off-ramp Weave 38.7 E 39.1 E 40 0.6% On-ramp from SR-55 SB to Campus/Bristol St S Off-ramp Weave - F - F 60 0.6%
Northbound I-405 Culver St On-ramp to Jamboree Rd Off-ramp Basic 42.7 E 43.3 E 60 0.6% Jamboree Rd Direct On-ramp to MacArthur Blvd Off-ramp Weave - F - F 50 0.4% MacArthur Blvd On-ramp to SR-55 NB & SB Off-ramp Weave 40.8 E 37.6 E 10 0.1% Bristol St S On-ramp to South Coast Off-ramp Weave - F - F 0 0.0%
Southbound I-405 Off-ramp to I-405 SB to Fairview Rd On-ramp Basic 30.8 F 31.0 F 50 0.6% Fairview Rd On-ramp Merge 34.1 F 34.3 F 60 0.6%

Transportation/Traffic
4.8-50 JOHN WAYNE AIRPORT SETTLEMENT AGREEMENT AMENDMENT ENVIRONMENTAL IMPACT REPORT
TABLE 4.8-30 FREEWAY MAINLINE AND RAMPS OPERATIONS
EXISTING PLUS ALTERNATIVE A – AM PEAK HOUR
Location Type
Existing Existing Plus Alternative ADensity
(pc/mi/ln) LOS Density
(pc/mi/ln) LOS Project Trips
Percent IncreaseFairview Rd On-ramp to Bristol St Off-ramp Basic 38.6 F 38.9 F 60 0.6% Bristol St Off-ramp Diverge 27.2 F 27.4 F 60 0.5%Bristol St On-ramp to SR-55 NB Off-ramp Weave - F - F 70 0.5% Lane Drop Basic 36.9 E 34.3 D 70 0.9%On-ramp from SR-55 NB Basic 37.0 E 34.9 D 80 0.8%SR-55 SB On-ramp to MacArthur Blvd Off-ramp Weave - F - F 80 0.5% MacArthur Blvd On-ramp to Jamboree Rd Off-ramp Weave - F - F 70 0.5% Notes: 1. Freeway facilities operating below acceptable standards are noted in bold. 2. Analysis performed using the HCM 2010 methodology. 3. pc/mi/ln = passenger cars per mile per lane. 4. NB=Northbound; SB=Southbound Source: Transportation Impact Analysis, (Full data in Tables 7-3, 7-4, and 7-5), Fehr & Peers, 2014
TABLE 4.8-31 PROJECT FREEWAY MAINLINE AND RAMPS OPERATIONS
EXISTING PLUS ALTERNATIVE A – PM PEAK HOUR
Location Type
Existing Existing With Alternative ADensity
(pc/mi/ln) LOS Density
(pc/mi/ln) LOS Project Trips
Percent Increase
Northbound SR-55 Fair Dr/Del Mar Ave/Newport Blvd On-ramp to SR-73 Off-ramp Weave - F - F 30 0.4% Paularino Ave On-ramp Merge 14.9 F 15.8 F 30 1.0%Paularino Ave On-ramp to I-405 SB On-ramp Basic 15.9 F 16.8 F 30 1.0% On-ramp from I-405 SB Basic 15.5 F 16.2 F 30 0.8%On-ramp from I-405 NB to MacArthur Blvd Off-ramp Weave 23.0 F 26.5 F 150 2.7%
Southbound SR-55 On-ramp from I-405 NB to Off-ramp to SR-73 SB Weave - F - F 10 0.1%

Transportation/Traffic
JOHN WAYNE AIRPORT SETTLEMENT AGREEMENT AMENDMENT 4.8-51 ENVIRONMENTAL IMPACT REPORT
TABLE 4.8-31 PROJECT FREEWAY MAINLINE AND RAMPS OPERATIONS
EXISTING PLUS ALTERNATIVE A – PM PEAK HOUR
Location Type
Existing Existing With Alternative ADensity
(pc/mi/ln) LOS Density
(pc/mi/ln) LOS Project Trips
Percent IncreaseSR-73 SB On-ramp to Newport Blvd S/Mesa Dr Off-ramp Weave - F - F 20 0.2%
Northbound SR-73 Bristol St N Off-ramp Diverge 27.9 C 36.0 E 30 0.5%Bristol St N On-ramp to SR-55 N Off-ramp Weave - F - F 90 0.9% Off-ramp to SR-55 SB Diverge 35.5 E - F 90 1.1%On-ramp from SR-55 NB Weave - F - F 80 1.1%Southbound SR-73 On-ramp from SR-55 SB to Campus/Bristol St S Off-ramp Weave - F - F 40 0.6% Northbound I-405 Culver St On-ramp to Jamboree Rd Off-ramp Basic 25.5 F 25.7 F 50 0.7% Jamboree Rd Off-ramp Diverge 18.2 F 18.4 F 50 0.6%Jamboree Rd Loop On-ramp Merge 24.2 F 23.8 F 50 0.7% Jamboree Rd Direct On-ramp to MacArthur Blvd Off-ramp Weave 41.6 F 40.5 F 60 0.6% MacArthur Blvd On-ramp to SR-55 NB & SB Off-ramp Weave - F 43.3 F 10 0.1% SR-55 Off-ramp to Bristol St Off-ramp Basic 33.9 F 26.3 F 0 0.0% Bristol St/Ave of the Arts Off-ramp Diverge 36.1 F 30.9 F 0 0.0% On-ramp from SR-55 SB Basic 27.2 F 22.4 F 0 0.0%Bristol St N On-ramp Merge 23.9 F 21.3 F 0 0.0%Bristol St S On-ramp to South Coast Off-ramp Weave - F - F 0 0.0% Southbound I-405 SR-55 SB On-ramp to MacArthur Blvd Off-ramp Weave 43.6 E - F 80 0.8% MacArthur Blvd On-ramp to Jamboree Rd Off-ramp Weave 44.8 E 45.2 E 60 0.6%
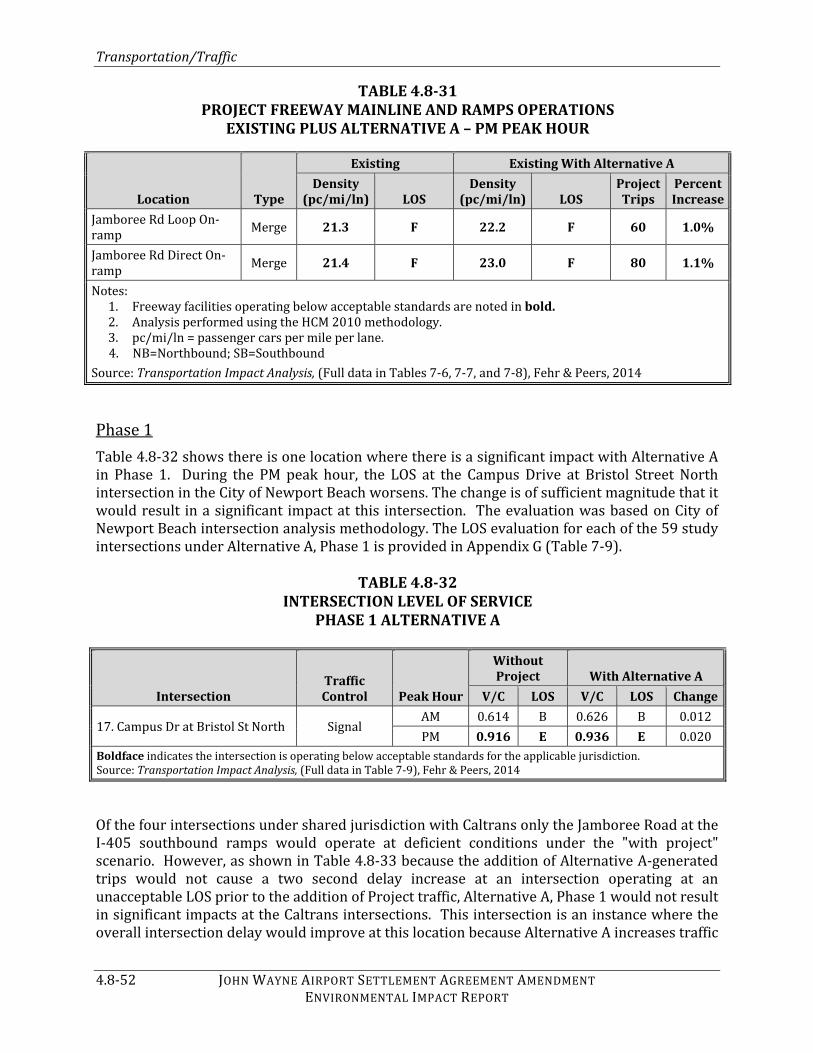
Transportation/Traffic
4.8-52 JOHN WAYNE AIRPORT SETTLEMENT AGREEMENT AMENDMENT ENVIRONMENTAL IMPACT REPORT
TABLE 4.8-31 PROJECT FREEWAY MAINLINE AND RAMPS OPERATIONS
EXISTING PLUS ALTERNATIVE A – PM PEAK HOUR
Location Type
Existing Existing With Alternative ADensity
(pc/mi/ln) LOS Density
(pc/mi/ln) LOS Project Trips
Percent IncreaseJamboree Rd Loop On-ramp Merge 21.3 F 22.2 F 60 1.0% Jamboree Rd Direct On-ramp Merge 21.4 F 23.0 F 80 1.1% Notes: 1. Freeway facilities operating below acceptable standards are noted in bold. 2. Analysis performed using the HCM 2010 methodology. 3. pc/mi/ln = passenger cars per mile per lane. 4. NB=Northbound; SB=Southbound Source: Transportation Impact Analysis, (Full data in Tables 7-6, 7-7, and 7-8), Fehr & Peers, 2014 Phase 1 Table 4.8-32 shows there is one location where there is a significant impact with Alternative A in Phase 1. During the PM peak hour, the LOS at the Campus Drive at Bristol Street North intersection in the City of Newport Beach worsens. The change is of sufficient magnitude that it would result in a significant impact at this intersection. The evaluation was based on City of Newport Beach intersection analysis methodology. The LOS evaluation for each of the 59 study intersections under Alternative A, Phase 1 is provided in Appendix G (Table 7-9).
TABLE 4.8-32 INTERSECTION LEVEL OF SERVICE
PHASE 1 ALTERNATIVE A
Intersection Traffic Control Peak Hour
WithoutProject With Alternative A
V/C LOS V/C LOS Change17. Campus Dr at Bristol St North Signal AM 0.614 B 0.626 B 0.012PM 0.916 E 0.936 E 0.020Boldface indicates the intersection is operating below acceptable standards for the applicable jurisdiction. Source: Transportation Impact Analysis, (Full data in Table 7-9), Fehr & Peers, 2014 Of the four intersections under shared jurisdiction with Caltrans only the Jamboree Road at the I-405 southbound ramps would operate at deficient conditions under the "with project" scenario. However, as shown in Table 4.8-33 because the addition of Alternative A-generated trips would not cause a two second delay increase at an intersection operating at an unacceptable LOS prior to the addition of Project traffic, Alternative A, Phase 1 would not result in significant impacts at the Caltrans intersections. This intersection is an instance where the overall intersection delay would improve at this location because Alternative A increases traffic
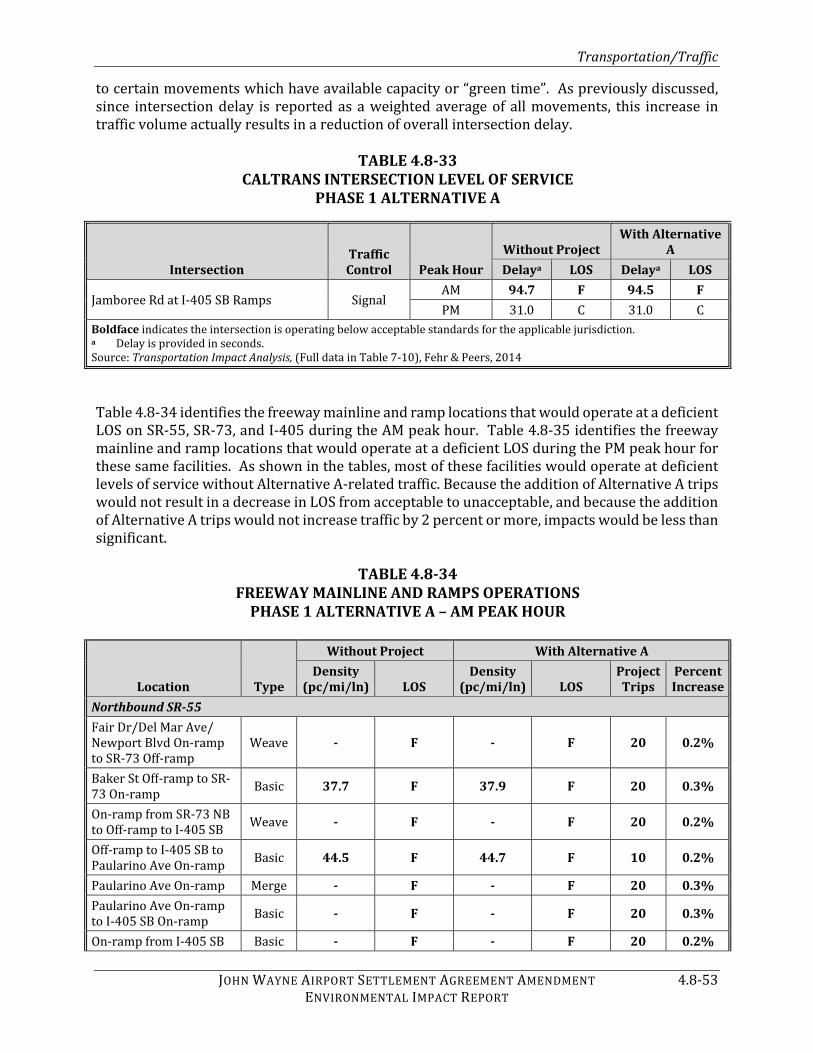
Transportation/Traffic
JOHN WAYNE AIRPORT SETTLEMENT AGREEMENT AMENDMENT 4.8-53 ENVIRONMENTAL IMPACT REPORT
to certain movements which have available capacity or “green time”. As previously discussed, since intersection delay is reported as a weighted average of all movements, this increase in traffic volume actually results in a reduction of overall intersection delay. TABLE 4.8-33
CALTRANS INTERSECTION LEVEL OF SERVICE PHASE 1 ALTERNATIVE A
Intersection Traffic Control Peak Hour
Without Project With Alternative
A Delaya LOS Delaya LOSJamboree Rd at I-405 SB Ramps Signal AM 94.7 F 94.5 FPM 31.0 C 31.0 C
Boldface indicates the intersection is operating below acceptable standards for the applicable jurisdiction. a Delay is provided in seconds. Source: Transportation Impact Analysis, (Full data in Table 7-10), Fehr & Peers, 2014 Table 4.8-34 identifies the freeway mainline and ramp locations that would operate at a deficient LOS on SR-55, SR-73, and I-405 during the AM peak hour. Table 4.8-35 identifies the freeway mainline and ramp locations that would operate at a deficient LOS during the PM peak hour for these same facilities. As shown in the tables, most of these facilities would operate at deficient levels of service without Alternative A-related traffic. Because the addition of Alternative A trips would not result in a decrease in LOS from acceptable to unacceptable, and because the addition of Alternative A trips would not increase traffic by 2 percent or more, impacts would be less than significant.
TABLE 4.8-34 FREEWAY MAINLINE AND RAMPS OPERATIONS
PHASE 1 ALTERNATIVE A – AM PEAK HOUR
Location Type
Without Project With Alternative A Density
(pc/mi/ln) LOS Density
(pc/mi/ln) LOS Project Trips
Percent Increase
Northbound SR-55 Fair Dr/Del Mar Ave/ Newport Blvd On-ramp to SR-73 Off-ramp Weave - F - F 20 0.2% Baker St Off-ramp to SR-73 On-ramp Basic 37.7 F 37.9 F 20 0.3% On-ramp from SR-73 NB to Off-ramp to I-405 SB Weave - F - F 20 0.2% Off-ramp to I-405 SB to Paularino Ave On-ramp Basic 44.5 F 44.7 F 10 0.2% Paularino Ave On-ramp Merge - F - F 20 0.3%Paularino Ave On-ramp to I-405 SB On-ramp Basic - F - F 20 0.3% On-ramp from I-405 SB Basic - F - F 20 0.2%
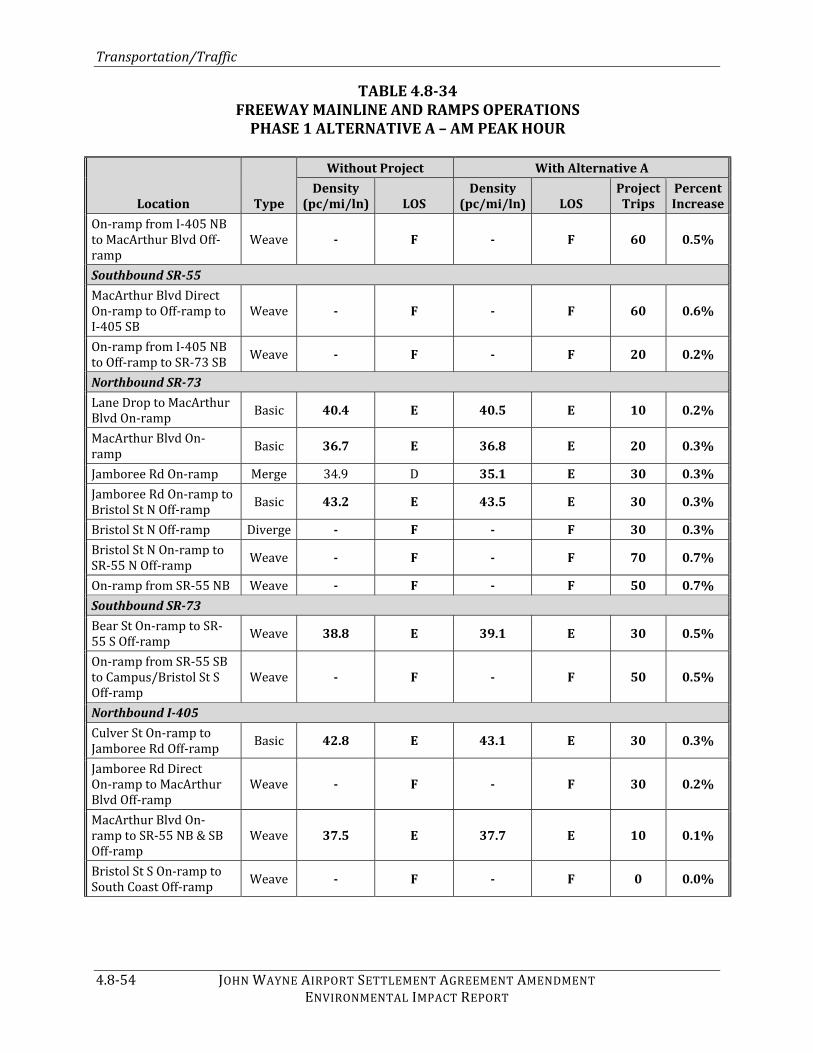
Transportation/Traffic
4.8-54 JOHN WAYNE AIRPORT SETTLEMENT AGREEMENT AMENDMENT ENVIRONMENTAL IMPACT REPORT
TABLE 4.8-34 FREEWAY MAINLINE AND RAMPS OPERATIONS
PHASE 1 ALTERNATIVE A – AM PEAK HOUR
Location Type
Without Project With Alternative A Density
(pc/mi/ln) LOS Density
(pc/mi/ln) LOS Project Trips
Percent IncreaseOn-ramp from I-405 NB to MacArthur Blvd Off-ramp Weave - F - F 60 0.5%
Southbound SR-55 MacArthur Blvd Direct On-ramp to Off-ramp to I-405 SB Weave - F - F 60 0.6% On-ramp from I-405 NB to Off-ramp to SR-73 SB Weave - F - F 20 0.2%
Northbound SR-73 Lane Drop to MacArthur Blvd On-ramp Basic 40.4 E 40.5 E 10 0.2% MacArthur Blvd On-ramp Basic 36.7 E 36.8 E 20 0.3% Jamboree Rd On-ramp Merge 34.9 D 35.1 E 30 0.3%Jamboree Rd On-ramp to Bristol St N Off-ramp Basic 43.2 E 43.5 E 30 0.3% Bristol St N Off-ramp Diverge - F - F 30 0.3%Bristol St N On-ramp to SR-55 N Off-ramp Weave - F - F 70 0.7% On-ramp from SR-55 NB Weave - F - F 50 0.7%Southbound SR-73 Bear St On-ramp to SR-55 S Off-ramp Weave 38.8 E 39.1 E 30 0.5% On-ramp from SR-55 SB to Campus/Bristol St S Off-ramp Weave - F - F 50 0.5%
Northbound I-405 Culver St On-ramp to Jamboree Rd Off-ramp Basic 42.8 E 43.1 E 30 0.3% Jamboree Rd Direct On-ramp to MacArthur Blvd Off-ramp Weave - F - F 30 0.2% MacArthur Blvd On-ramp to SR-55 NB & SB Off-ramp Weave 37.5 E 37.7 E 10 0.1% Bristol St S On-ramp to South Coast Off-ramp Weave - F - F 0 0.0%

Transportation/Traffic
JOHN WAYNE AIRPORT SETTLEMENT AGREEMENT AMENDMENT 4.8-55 ENVIRONMENTAL IMPACT REPORT
TABLE 4.8-34 FREEWAY MAINLINE AND RAMPS OPERATIONS
PHASE 1 ALTERNATIVE A – AM PEAK HOUR
Location Type
Without Project With Alternative A Density
(pc/mi/ln) LOS Density
(pc/mi/ln) LOS Project Trips
Percent Increase
Southbound I-405 Off-ramp to I-405 SB to Fairview Rd On-ramp Basic 30.9 F 31.0 F 20 0.2% Fairview Rd On-ramp Merge 34.2 F 34.3 F 30 0.3%Fairview Rd On-ramp to Bristol St Off-ramp Basic 38.8 F 39.0 F 30 0.3% Bristol St Off-ramp Diverge 27.3 F 27.4 F 30 0.3%Bristol St On-ramp to SR-55 NB Off-ramp Weave - F - F 40 0.3% On-ramp from SR-55 NB Basic 34.8 D 35.1 E 50 0.5%SR-55 SB On-ramp to MacArthur Blvd Off-ramp Weave - F - F 50 0.4% MacArthur Blvd On-ramp to Jamboree Rd Off-ramp Weave - F - F 50 0.4%
Notes: 1. Freeway facilities operating below acceptable standards are noted in bold. 2. Analysis performed using the HCM 2010 methodology. 3. pc/mi/ln = passenger cars per mile per lane. 4. NB=Northbound; SB=Southbound Source: Transportation Impact Analysis, (Full data in Tables 7-11, 7-12, and 7-13), Fehr & Peers, 2014 TABLE 4.8-35
PROJECT FREEWAY MAINLINE AND RAMPS OPERATIONS PHASE 1 ALTERNATIVE A– PM PEAK HOUR
Location Type
Without Project With Alternative A Density
(pc/mi/ln) LOS Density
(pc/mi/ln) LOS Project Trips
Percent Increase
Northbound SR-55 Fair Dr/Del Mar Ave/Newport Blvd On-ramp to SR-73 Off-ramp Weave - F - F 20 0.3% Paularino Ave On-ramp Merge 15.7 F 15.8 F 20 0.7%Paularino Ave On-ramp to I-405 SB On-ramp Basic 16.7 F 16.8 F 20 0.7% On-ramp from I-405 SB Basic 16.2 F 16.2 F 20 0.5%
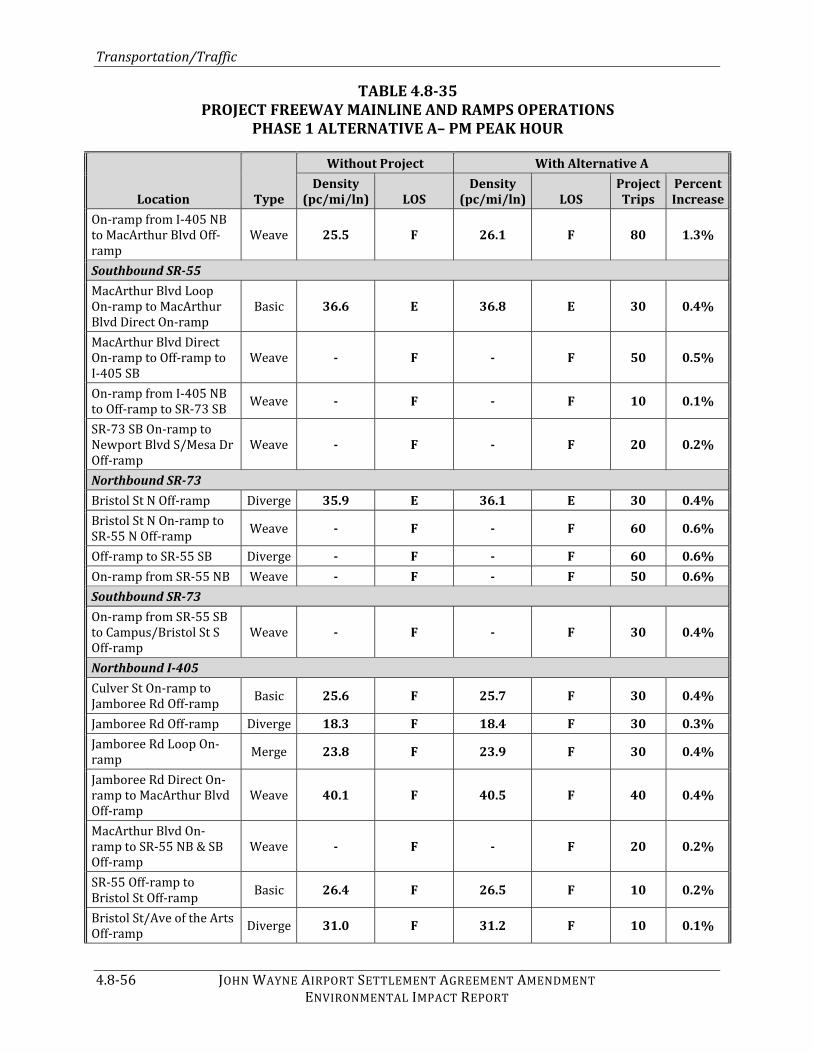
Transportation/Traffic
4.8-56 JOHN WAYNE AIRPORT SETTLEMENT AGREEMENT AMENDMENT ENVIRONMENTAL IMPACT REPORT
TABLE 4.8-35 PROJECT FREEWAY MAINLINE AND RAMPS OPERATIONS
PHASE 1 ALTERNATIVE A– PM PEAK HOUR
Location Type
Without Project With Alternative A Density
(pc/mi/ln) LOS Density
(pc/mi/ln) LOS Project Trips
Percent IncreaseOn-ramp from I-405 NB to MacArthur Blvd Off-ramp Weave 25.5 F 26.1 F 80 1.3%
Southbound SR-55 MacArthur Blvd Loop On-ramp to MacArthur Blvd Direct On-ramp Basic 36.6 E 36.8 E 30 0.4% MacArthur Blvd Direct On-ramp to Off-ramp to I-405 SB Weave - F - F 50 0.5% On-ramp from I-405 NB to Off-ramp to SR-73 SB Weave - F - F 10 0.1% SR-73 SB On-ramp to Newport Blvd S/Mesa Dr Off-ramp Weave - F - F 20 0.2%
Northbound SR-73 Bristol St N Off-ramp Diverge 35.9 E 36.1 E 30 0.4%Bristol St N On-ramp to SR-55 N Off-ramp Weave - F - F 60 0.6% Off-ramp to SR-55 SB Diverge - F - F 60 0.6%On-ramp from SR-55 NB Weave - F - F 50 0.6%Southbound SR-73 On-ramp from SR-55 SB to Campus/Bristol St S Off-ramp Weave - F - F 30 0.4% Northbound I-405 Culver St On-ramp to Jamboree Rd Off-ramp Basic 25.6 F 25.7 F 30 0.4% Jamboree Rd Off-ramp Diverge 18.3 F 18.4 F 30 0.3%Jamboree Rd Loop On-ramp Merge 23.8 F 23.9 F 30 0.4% Jamboree Rd Direct On-ramp to MacArthur Blvd Off-ramp Weave 40.1 F 40.5 F 40 0.4% MacArthur Blvd On-ramp to SR-55 NB & SB Off-ramp Weave - F - F 20 0.2% SR-55 Off-ramp to Bristol St Off-ramp Basic 26.4 F 26.5 F 10 0.2% Bristol St/Ave of the Arts Off-ramp Diverge 31.0 F 31.2 F 10 0.1%

Transportation/Traffic
JOHN WAYNE AIRPORT SETTLEMENT AGREEMENT AMENDMENT 4.8-57 ENVIRONMENTAL IMPACT REPORT
TABLE 4.8-35 PROJECT FREEWAY MAINLINE AND RAMPS OPERATIONS
PHASE 1 ALTERNATIVE A– PM PEAK HOUR
Location Type
Without Project With Alternative A Density
(pc/mi/ln) LOS Density
(pc/mi/ln) LOS Project Trips
Percent IncreaseOn-ramp from SR-55 SB Basic 22.5 F 22.5 F 0 0.0%Bristol St N On-ramp Merge 21.4 F 21.4 F 0 0.0%Bristol St S On-ramp to South Coast Off-ramp Weave - F - F 0 0.0%
Southbound I-405 SR-55 SB On-ramp to MacArthur Blvd Off-ramp Weave - F 44.2 E 60 0.6% MacArthur Blvd On-ramp to Jamboree Rd Off-ramp Weave 44.2 E 45.4 E 60 0.6% Jamboree Rd Loop On-ramp Merge 22.4 F 22.2 F 60 0.9% Jamboree Rd Direct On-ramp Merge 22.6 F 23.0 F 70 0.9% Notes: 1. Freeway facilities operating below acceptable standards are noted in bold. 2. Analysis performed using the HCM 2010 methodology. 3. pc/mi/ln = passenger cars per mile per lane. 4. NB=Northbound; SB=Southbound Source: Transportation Impact Analysis, (Full data in Tables 7-14, 7-15, and 7-16), Fehr & Peers, 2014 Phase 2 Table 4.8-36 shows with Alternative A, Phase 2 there would be a significant impact at Intersection 17, Campus Drive at Bristol Street North, during the PM peak hour. The evaluation for this intersection was based on City of Newport Beach intersection analysis methodology. The LOS evaluation for each of the 59 study intersections under Alternative A, Phase 2 is provided in Appendix G (Table 7-17). TABLE 4.8-36
INTERSECTION LEVEL OF SERVICE PHASE 2 ALTERNATIVE A
Intersection Traffic Control Peak Hour
Without Project With Alternative AV/C LOS V/C LOS Change17. Campus Dr at Bristol St North Signal AM 0.641 B 0.657 B 0.016PM 0.964 E 0.992 E 0.028
Boldface indicates the intersection is operating below acceptable standards for the applicable jurisdiction. Source: Transportation Impact Analysis, (Full data in Table 7-17), Fehr & Peers, 2014

Transportation/Traffic
4.8-58 JOHN WAYNE AIRPORT SETTLEMENT AGREEMENT AMENDMENT ENVIRONMENTAL IMPACT REPORT
As with the Proposed Project, with Alternative A, Phase 2 the only intersection under shared jurisdiction with Caltrans that would operate at deficient conditions under the "with project" scenario would be the Jamboree Road at the I-405 southbound ramps. However, as shown in Table 4.8-37 this intersection would not be adversely impacted by Alternative A. With the addition of Alternative A-generated trips the overall intersection delay would improve at the Jamboree Road/I-405 southbound ramps during the AM peak hour because Alternative A, Phase 2 would increase traffic to the movements that have available capacity or “green time”. As previously indicated, since intersection delay is reported as a weighted average of all movements, this increase in traffic volume actually results in a reduction of overall intersection delay. TABLE 4.8-37
CALTRANS INTERSECTION LEVEL OF SERVICE PHASE 2 ALTERNATIVE A
Intersection Traffic Control Peak Hour
Without Project With Alternative ADelaya LOS Delaya LOSJamboree Rd at I-405 Southbound Ramps Signal AM 99.7 F 99.5 FPM 30.8 C 30.8 C
Boldface indicates the intersection is operating below acceptable standards for the applicable jurisdiction. a Delay is provided in seconds. Source: Transportation Impact Analysis, (Full data in Table 7-18), Fehr & Peers, 2014 Table 4.8-38 identifies the freeway mainline and ramp locations that would operate at a deficient LOS on SR-55, SR-73, and I-405 during the AM peak hour. Table 4.8-39 identifies the freeway mainline and ramp locations that would operate at a deficient LOS during the PM peak hour for these same facilities. As shown in the tables, most of these facilities would operate at deficient levels of service without Alternative A-related traffic. However, because the addition of Project trips would not result in a decrease in LOS from acceptable to unacceptable, and because the addition of the Alternative A, Phase 2 trips would not increase traffic by 2 percent or more, impacts would be less than significant.

Transportation/Traffic
JOHN WAYNE AIRPORT SETTLEMENT AGREEMENT AMENDMENT 4.8-59 ENVIRONMENTAL IMPACT REPORT
TABLE 4.8-38 FREEWAY MAINLINE AND RAMPS OPERATIONS
PHASE 2 ALTERNATIVE A – AM PEAK HOUR Location Type
Without Project With Alternative A Density
(pc/mi/ln) LOS Density
(pc/mi/ln) LOS Project Trips
Percent Increase
Northbound SR-55 Fair Dr/Del Mar Ave/ Newport Blvd On-ramp to SR-73 Off-ramp Weave - F - F 20 0.2% Baker St Off-ramp to SR-73 On-ramp Basic 37.9 F 38.1 F 20 0.3% On-ramp from SR-73 NB to Off-ramp to I-405 SB Weave - F - F 20 0.2% Off-ramp to I-405 SB to Paularino Ave On-ramp Basic 44.8 F 45.0 F 10 0.2% Paularino Ave On-ramp Merge - F - F 20 0.3%Paularino Ave On-ramp to I-405 SB On-ramp Basic - F - F 20 0.3% On-ramp from I-405 SB Basic - F - F 20 0.2%On-ramp from I-405 NB to MacArthur Blvd Off-ramp Weave - F - F 80 0.6%
Southbound SR-55 MacArthur Blvd Direct On-ramp to Off-ramp to I-405 SB Weave - F - F 80 0.7% On-ramp from I-405 NB to Off-ramp to SR-73 SB Weave - F - F 20 0.2%
Northbound SR-73 Lane Drop to MacArthur Blvd On-ramp Basic 40.4 E 40.6 E 20 0.3% MacArthur Blvd On-ramp Basic 36.7 E 36.9 E 30 0.4% Jamboree Rd On-ramp Merge 34.9 D 35.1 E 40 0.5%Jamboree Rd On-ramp to Bristol St N Off-ramp Basic 43.2 E 43.6 E 40 0.5% Bristol St N Off-ramp Diverge - F - F 40 0.4%Bristol St N On-ramp to SR-55 N Off-ramp Weave - F - F 90 0.9% On-ramp from SR-55 NB Weave - F - F 70 1.0%
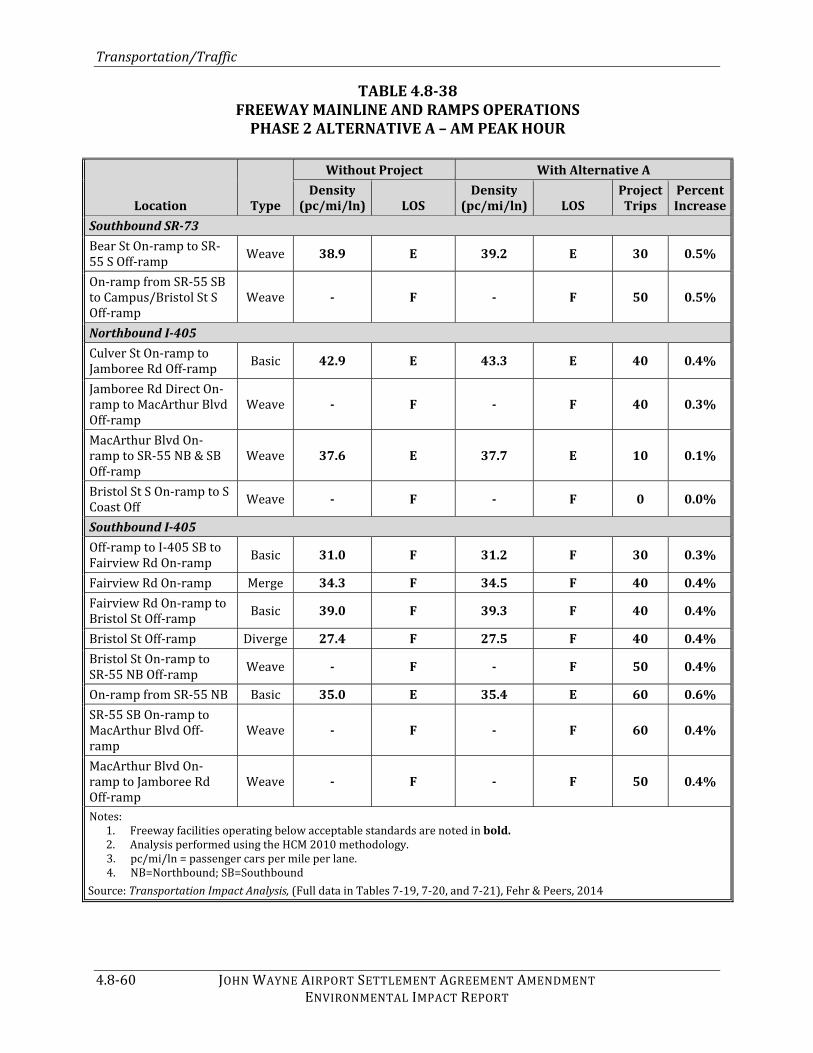
Transportation/Traffic
4.8-60 JOHN WAYNE AIRPORT SETTLEMENT AGREEMENT AMENDMENT ENVIRONMENTAL IMPACT REPORT
TABLE 4.8-38 FREEWAY MAINLINE AND RAMPS OPERATIONS
PHASE 2 ALTERNATIVE A – AM PEAK HOUR Location Type
Without Project With Alternative A Density
(pc/mi/ln) LOS Density
(pc/mi/ln) LOS Project Trips
Percent Increase
Southbound SR-73 Bear St On-ramp to SR-55 S Off-ramp Weave 38.9 E 39.2 E 30 0.5% On-ramp from SR-55 SB to Campus/Bristol St S Off-ramp Weave - F - F 50 0.5%
Northbound I-405 Culver St On-ramp to Jamboree Rd Off-ramp Basic 42.9 E 43.3 E 40 0.4% Jamboree Rd Direct On-ramp to MacArthur Blvd Off-ramp Weave - F - F 40 0.3% MacArthur Blvd On-ramp to SR-55 NB & SB Off-ramp Weave 37.6 E 37.7 E 10 0.1% Bristol St S On-ramp to S Coast Off Weave - F - F 0 0.0%
Southbound I-405 Off-ramp to I-405 SB to Fairview Rd On-ramp Basic 31.0 F 31.2 F 30 0.3% Fairview Rd On-ramp Merge 34.3 F 34.5 F 40 0.4%Fairview Rd On-ramp to Bristol St Off-ramp Basic 39.0 F 39.3 F 40 0.4% Bristol St Off-ramp Diverge 27.4 F 27.5 F 40 0.4%Bristol St On-ramp to SR-55 NB Off-ramp Weave - F - F 50 0.4% On-ramp from SR-55 NB Basic 35.0 E 35.4 E 60 0.6%SR-55 SB On-ramp to MacArthur Blvd Off-ramp Weave - F - F 60 0.4% MacArthur Blvd On-ramp to Jamboree Rd Off-ramp Weave - F - F 50 0.4%
Notes: 1. Freeway facilities operating below acceptable standards are noted in bold. 2. Analysis performed using the HCM 2010 methodology. 3. pc/mi/ln = passenger cars per mile per lane. 4. NB=Northbound; SB=Southbound Source: Transportation Impact Analysis, (Full data in Tables 7-19, 7-20, and 7-21), Fehr & Peers, 2014

Transportation/Traffic
JOHN WAYNE AIRPORT SETTLEMENT AGREEMENT AMENDMENT 4.8-61 ENVIRONMENTAL IMPACT REPORT
TABLE 4.8-39 FREEWAY MAINLINE AND RAMPS OPERATIONS
PHASE 2 ALTERNATIVE A – PM PEAK HOUR Location Type
Without Project With Alternative A Density
(pc/mi/ln) LOS Density
(pc/mi/ln) LOS Project Trips
Percent Increase
Northbound SR-55 Fair Dr/Del Mar Ave/ Newport Blvd On-ramp to SR-73 Off-ramp Weave - F - F 30 0.4% Paularino Ave On-ramp Merge 15.7 F 15.9 F 30 1.0%Paularino Ave On-ramp to I-405 SB On-ramp Basic 16.7 F 16.9 F 30 1.0% On-ramp from I-405 SB Basic 16.2 F 16.3 F 30 0.8%On-ramp from I-405 NB to MacArthur Blvd Off-ramp Weave 25.5 F 26.3 F 110 1.8%
Southbound SR-55 MacArthur Blvd Loop On-ramp to MacArthur Blvd Direct On-ramp Basic 36.6 E 36.9 E 40 0.5% MacArthur Blvd Direct On-ramp to Off-ramp to I-405 SB Weave - F - F 60 0.6% On-ramp from I-405 NB to Off-ramp to SR-73 SB Weave - F - F 10 0.1% SR-73 SB On-ramp to Newport Blvd S/Mesa Dr Off-ramp Weave - F - F 20 0.2%
Northbound SR-73 Bristol St N Off-ramp Diverge 35.9 E 36.1 E 30 0.4%Bristol St N On-ramp to SR-55 N Off-ramp Weave - F - F 70 0.6% Off-ramp to SR-55 SB Diverge - F - F 70 0.8%On-ramp from SR-55 NB Weave - F - F 60 0.7%Southbound SR-73 On-ramp from SR-55 SB to Campus/Bristol St S Off-ramp Weave - F - F 40 0.5%
Northbound I-405 Culver St On-ramp to Jamboree Rd Off-ramp Basic 25.6 F 25.8 F 30 0.4% Jamboree Rd Off-ramp Diverge 18.4 F 18.5 F 30 0.3%Jamboree Rd Loop On-ramp Merge 23.9 F 24.0 F 30 0.4%
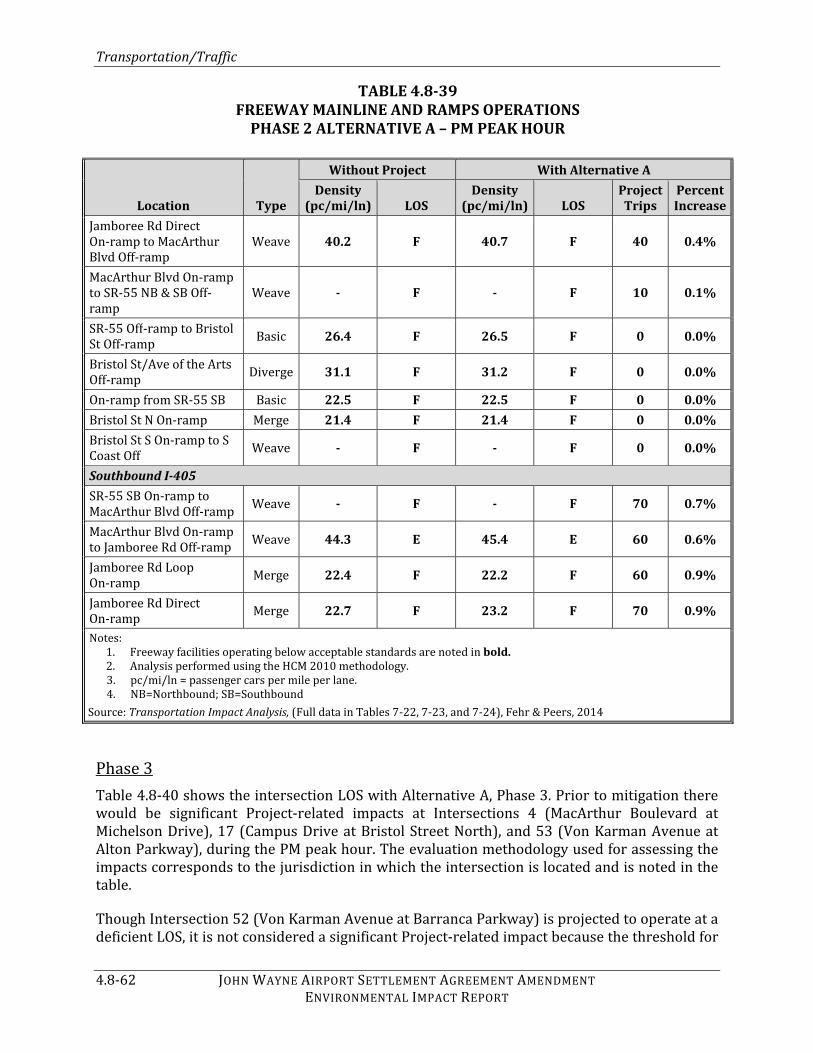
Transportation/Traffic
4.8-62 JOHN WAYNE AIRPORT SETTLEMENT AGREEMENT AMENDMENT ENVIRONMENTAL IMPACT REPORT
TABLE 4.8-39 FREEWAY MAINLINE AND RAMPS OPERATIONS
PHASE 2 ALTERNATIVE A – PM PEAK HOUR Location Type
Without Project With Alternative A Density
(pc/mi/ln) LOS Density
(pc/mi/ln) LOS Project Trips
Percent IncreaseJamboree Rd Direct On-ramp to MacArthur Blvd Off-ramp Weave 40.2 F 40.7 F 40 0.4% MacArthur Blvd On-ramp to SR-55 NB & SB Off-ramp Weave - F - F 10 0.1% SR-55 Off-ramp to Bristol St Off-ramp Basic 26.4 F 26.5 F 0 0.0% Bristol St/Ave of the Arts Off-ramp Diverge 31.1 F 31.2 F 0 0.0% On-ramp from SR-55 SB Basic 22.5 F 22.5 F 0 0.0%Bristol St N On-ramp Merge 21.4 F 21.4 F 0 0.0%Bristol St S On-ramp to S Coast Off Weave - F - F 0 0.0%
Southbound I-405 SR-55 SB On-ramp to MacArthur Blvd Off-ramp Weave - F - F 70 0.7% MacArthur Blvd On-ramp to Jamboree Rd Off-ramp Weave 44.3 E 45.4 E 60 0.6% Jamboree Rd Loop On-ramp Merge 22.4 F 22.2 F 60 0.9% Jamboree Rd Direct On-ramp Merge 22.7 F 23.2 F 70 0.9% Notes: 1. Freeway facilities operating below acceptable standards are noted in bold. 2. Analysis performed using the HCM 2010 methodology. 3. pc/mi/ln = passenger cars per mile per lane. 4. NB=Northbound; SB=Southbound Source: Transportation Impact Analysis, (Full data in Tables 7-22, 7-23, and 7-24), Fehr & Peers, 2014 Phase 3 Table 4.8-40 shows the intersection LOS with Alternative A, Phase 3. Prior to mitigation there would be significant Project-related impacts at Intersections 4 (MacArthur Boulevard at Michelson Drive), 17 (Campus Drive at Bristol Street North), and 53 (Von Karman Avenue at Alton Parkway), during the PM peak hour. The evaluation methodology used for assessing the impacts corresponds to the jurisdiction in which the intersection is located and is noted in the table. Though Intersection 52 (Von Karman Avenue at Barranca Parkway) is projected to operate at a deficient LOS, it is not considered a significant Project-related impact because the threshold for
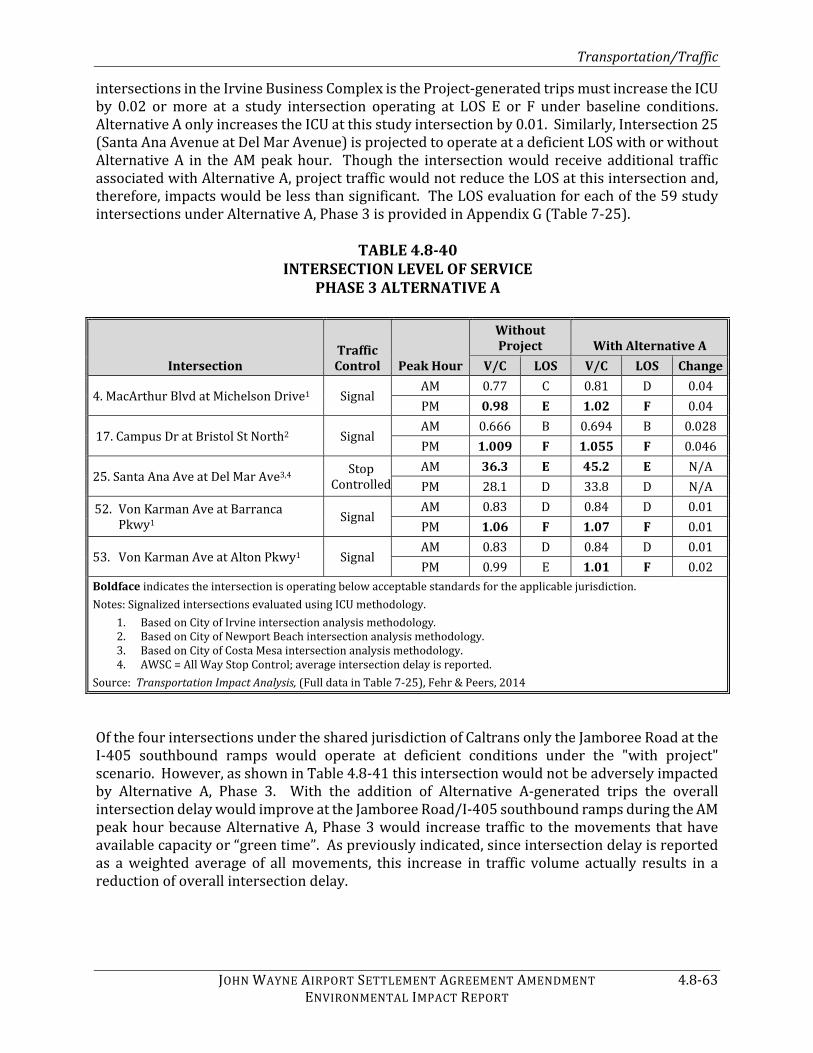
Transportation/Traffic
JOHN WAYNE AIRPORT SETTLEMENT AGREEMENT AMENDMENT 4.8-63 ENVIRONMENTAL IMPACT REPORT
intersections in the Irvine Business Complex is the Project-generated trips must increase the ICU by 0.02 or more at a study intersection operating at LOS E or F under baseline conditions. Alternative A only increases the ICU at this study intersection by 0.01. Similarly, Intersection 25 (Santa Ana Avenue at Del Mar Avenue) is projected to operate at a deficient LOS with or without Alternative A in the AM peak hour. Though the intersection would receive additional traffic associated with Alternative A, project traffic would not reduce the LOS at this intersection and, therefore, impacts would be less than significant. The LOS evaluation for each of the 59 study intersections under Alternative A, Phase 3 is provided in Appendix G (Table 7-25). TABLE 4.8-40
INTERSECTION LEVEL OF SERVICE PHASE 3 ALTERNATIVE A
Intersection Traffic Control Peak Hour
Without Project With Alternative A
V/C LOS V/C LOS Change4. MacArthur Blvd at Michelson Drive1 Signal AM 0.77 C 0.81 D 0.04PM 0.98 E 1.02 F 0.04 17. Campus Dr at Bristol St North2 Signal AM 0.666 B 0.694 B 0.028PM 1.009 F 1.055 F 0.04625. Santa Ana Ave at Del Mar Ave3,4 Stop Controlled AM 36.3 E 45.2 E N/APM 28.1 D 33.8 D N/A52. Von Karman Ave at Barranca Pkwy1 Signal AM 0.83 D 0.84 D 0.01PM 1.06 F 1.07 F 0.0153. Von Karman Ave at Alton Pkwy1 Signal AM 0.83 D 0.84 D 0.01PM 0.99 E 1.01 F 0.02Boldface indicates the intersection is operating below acceptable standards for the applicable jurisdiction. Notes: Signalized intersections evaluated using ICU methodology. 1. Based on City of Irvine intersection analysis methodology. 2. Based on City of Newport Beach intersection analysis methodology. 3. Based on City of Costa Mesa intersection analysis methodology. 4. AWSC = All Way Stop Control; average intersection delay is reported. Source: Transportation Impact Analysis, (Full data in Table 7-25), Fehr & Peers, 2014 Of the four intersections under the shared jurisdiction of Caltrans only the Jamboree Road at the I-405 southbound ramps would operate at deficient conditions under the "with project" scenario. However, as shown in Table 4.8-41 this intersection would not be adversely impacted by Alternative A, Phase 3. With the addition of Alternative A-generated trips the overall intersection delay would improve at the Jamboree Road/I-405 southbound ramps during the AM peak hour because Alternative A, Phase 3 would increase traffic to the movements that have available capacity or “green time”. As previously indicated, since intersection delay is reported as a weighted average of all movements, this increase in traffic volume actually results in a reduction of overall intersection delay.

Transportation/Traffic
4.8-64 JOHN WAYNE AIRPORT SETTLEMENT AGREEMENT AMENDMENT ENVIRONMENTAL IMPACT REPORT
TABLE 4.8-41 CALTRANS INTERSECTION LEVEL OF SERVICE
PHASE 3 ALTERNATIVE A Intersection
Traffic Control Peak Hour
Without Project With Alternative
A Delaya LOS Delaya LOSJamboree Rd at I-405 Southbound Ramps Signal AM 106.3 F 106.2 FPM 30.7 C 30.7 C
Boldface indicates the intersection is operating below acceptable standards for the applicable jurisdiction. a Delay is provided in seconds. Source: Transportation Impact Analysis, (Full data in Table 7-26), Fehr & Peers, 2014 Table 4.8-42 identifies the freeway mainline and ramp locations that would operate at a deficient LOS on SR-55, SR-73, and I-405 during the AM peak hour. Table 4.8-43 identifies the freeway mainline and ramp locations that would operate at a deficient LOS during the PM peak hour for these same facilities. As shown in the tables, most of these facilities would operate at deficient levels of service without Alternative A-related traffic. However, during the PM peak hour, Alternative A, Phase 3 would increase the traffic by over 2 percent on the northbound SR-55 from the onramp from I-405 to the MacArthur Boulevard off-ramp. Because this segment is operating at LOS F prior to the addition of Alternative A traffic, Alternative A, Phase 3 would result in a significant cumulative impact at this location.
TABLE 4.8-42 FREEWAY MAINLINE AND RAMPS OPERATIONS
PHASE 3 ALTERNATIVE A – AM PEAK HOUR Location Type
Without Project With Alternative A Density
(pc/mi/ln) LOS Density
(pc/mi/ln) LOS Project Trips
Percent Increase
Northbound SR-55 Fair Dr/Del Mar Ave/ Newport Blvd On-ramp to SR-73 Off-ramp Weave - F - F 20 0.2% Baker St Off-ramp to SR-73 On-ramp Basic 38.0 F 38.3 F 20 0.3% On-ramp from SR-73 NB to Off-ramp to I-405 SB Weave - F - F 20 0.2% Off-ramp to I-405 SB to Paularino Ave On-ramp Basic 45.0 F - F 10 0.2% Paularino Ave On-ramp Merge - F - F 20 0.3%Paularino Ave On-ramp to I-405 SB On-ramp Basic - F - F 20 0.3% On-ramp from I-405 SB Basic - F - F 20 0.2%

Transportation/Traffic
JOHN WAYNE AIRPORT SETTLEMENT AGREEMENT AMENDMENT 4.8-65 ENVIRONMENTAL IMPACT REPORT
TABLE 4.8-42 FREEWAY MAINLINE AND RAMPS OPERATIONS
PHASE 3 ALTERNATIVE A – AM PEAK HOUR Location Type
Without Project With Alternative A Density
(pc/mi/ln) LOS Density
(pc/mi/ln) LOS Project Trips
Percent IncreaseOn-ramp from I-405 NB to MacArthur Blvd Off-ramp Weave - F - F 110 0.9%
Southbound SR-55 MacArthur Blvd Direct On-ramp to Off-ramp to I-405 SB Weave - F - F 110 1.0% On-ramp from I-405 NB to Off-ramp to SR-73 SB Weave - F - F 20 0.2%
Northbound SR-73 Lane Drop to MacArthur Blvd On-ramp Basic 40.5 E 40.7 E 20 0.3% MacArthur Blvd On-ramp Basic 36.8 E 37.0 E 30 0.4%Jamboree Rd On-ramp Merge 35.0 D 35.1 E 40 0.5%Jamboree Rd On-ramp to Bristol St N Off-ramp Basic 43.3 E 43.7 E 40 0.5% Bristol St N Off-ramp Diverge - F - F 40 0.4%Bristol St N On-ramp to SR-55 N Off-ramp Weave - F - F 130 1.3% On-ramp from SR-55 NB Weave - F - F 100 1.4%Southbound SR-73 Bear St On-ramp to SR-55 S Off-ramp Weave 39.0 E 39.3 E 40 0.6% On-ramp from SR-55 SB to Campus/Bristol St S Off-ramp Weave - F - F 60 0.6%
Northbound I-405 Culver St On-ramp to Jamboree Rd Off-ramp Basic 43.0 E 43.5 E 60 0.6% Jamboree Rd Direct On-ramp to MacArthur Blvd Off-ramp Weave - F - F 50 0.4% MacArthur Blvd On-ramp to SR-55 NB & SB Off-ramp Weave 37.6 E 37.7 E 10 0.1% Bristol St S On-ramp to South Coast Off-ramp Weave - F - F 0 0.0%
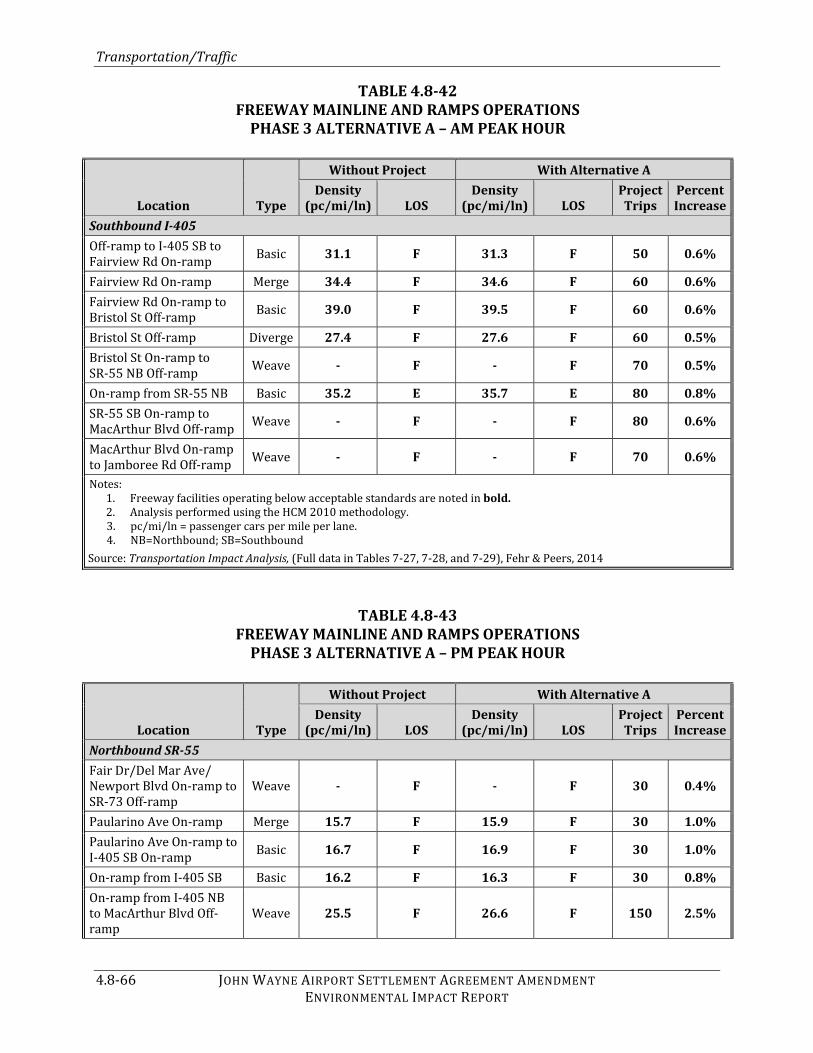
Transportation/Traffic
4.8-66 JOHN WAYNE AIRPORT SETTLEMENT AGREEMENT AMENDMENT ENVIRONMENTAL IMPACT REPORT
TABLE 4.8-42 FREEWAY MAINLINE AND RAMPS OPERATIONS
PHASE 3 ALTERNATIVE A – AM PEAK HOUR Location Type
Without Project With Alternative A Density
(pc/mi/ln) LOS Density
(pc/mi/ln) LOS Project Trips
Percent Increase
Southbound I-405 Off-ramp to I-405 SB to Fairview Rd On-ramp Basic 31.1 F 31.3 F 50 0.6% Fairview Rd On-ramp Merge 34.4 F 34.6 F 60 0.6%Fairview Rd On-ramp to Bristol St Off-ramp Basic 39.0 F 39.5 F 60 0.6% Bristol St Off-ramp Diverge 27.4 F 27.6 F 60 0.5%Bristol St On-ramp to SR-55 NB Off-ramp Weave - F - F 70 0.5% On-ramp from SR-55 NB Basic 35.2 E 35.7 E 80 0.8%SR-55 SB On-ramp to MacArthur Blvd Off-ramp Weave - F - F 80 0.6% MacArthur Blvd On-ramp to Jamboree Rd Off-ramp Weave - F - F 70 0.6% Notes: 1. Freeway facilities operating below acceptable standards are noted in bold. 2. Analysis performed using the HCM 2010 methodology. 3. pc/mi/ln = passenger cars per mile per lane. 4. NB=Northbound; SB=Southbound Source: Transportation Impact Analysis, (Full data in Tables 7-27, 7-28, and 7-29), Fehr & Peers, 2014 TABLE 4.8-43
FREEWAY MAINLINE AND RAMPS OPERATIONS PHASE 3 ALTERNATIVE A – PM PEAK HOUR
Location Type
Without Project With Alternative A Density
(pc/mi/ln) LOS Density
(pc/mi/ln) LOS Project Trips
Percent Increase
Northbound SR-55 Fair Dr/Del Mar Ave/ Newport Blvd On-ramp to SR-73 Off-ramp Weave - F - F 30 0.4% Paularino Ave On-ramp Merge 15.7 F 15.9 F 30 1.0%Paularino Ave On-ramp to I-405 SB On-ramp Basic 16.7 F 16.9 F 30 1.0% On-ramp from I-405 SB Basic 16.2 F 16.3 F 30 0.8%On-ramp from I-405 NB to MacArthur Blvd Off-ramp Weave 25.5 F 26.6 F 150 2.5%

Transportation/Traffic
JOHN WAYNE AIRPORT SETTLEMENT AGREEMENT AMENDMENT 4.8-67 ENVIRONMENTAL IMPACT REPORT
TABLE 4.8-43 FREEWAY MAINLINE AND RAMPS OPERATIONS
PHASE 3 ALTERNATIVE A – PM PEAK HOUR Location Type
Without Project With Alternative A Density
(pc/mi/ln) LOS Density
(pc/mi/ln) LOS Project Trips
Percent Increase
Southbound SR-55 MacArthur Blvd Loop On-ramp to MacArthur Blvd Direct On-ramp Basic 36.7 E 37.2 E 70 0.9% MacArthur Blvd Direct On-ramp to Off-ramp to I-405 SB Weave - F - F 90 0.9% On-ramp from I-405 NB to Off-ramp to SR-73 SB Weave - F - F 10 0.1% SR-73 SB On-ramp to Newport Blvd S/Mesa Dr Off-ramp Weave - F - F 20 0.2%
Northbound SR-73 Bristol St N Off-ramp Diverge 36.0 E 36.2 E 30 0.4%Bristol St N On-ramp to SR-55 N Off-ramp Weave - F - F 90 0.8% Off-ramp to SR-55 SB Diverge - F - F 90 1.0%On-ramp from SR-55 NB Weave - F - F 80 0.9%Southbound SR-73 On-ramp from SR-55 SB to Campus/Bristol St S Off-ramp Weave - F - F 40 0.5%
Northbound I-405 Culver St On-ramp to Jamboree Rd Off-ramp Basic 25.8 F 26.0 F 50 0.7% Jamboree Rd Off-ramp Diverge 18.5 F 18.6 F 50 0.6%Jamboree Rd Loop On-ramp Merge 24.0 F 24.2 F 50 0.7% Jamboree Rd Direct On-ramp to MacArthur Blvd Off-ramp Weave 40.5 F 41.1 F 60 0.7% MacArthur Blvd On-ramp to SR-55 NB & SB Off-ramp Weave - F - F 10 0.1% SR-55 Off-ramp to Bristol St Off-ramp Basic 26.5 F 26.6 F 0 0.0% Bristol St/Ave of the Arts Off-ramp Diverge 31.1 F 31.2 F 0 0.0% On-ramp from SR-55 SB Basic 22.6 F 22.6 F 0 0.0%Bristol St N On-ramp Merge 21.5 F 21.5 F 0 0.0%

Transportation/Traffic
4.8-68 JOHN WAYNE AIRPORT SETTLEMENT AGREEMENT AMENDMENT ENVIRONMENTAL IMPACT REPORT
TABLE 4.8-43 FREEWAY MAINLINE AND RAMPS OPERATIONS
PHASE 3 ALTERNATIVE A – PM PEAK HOUR Location Type
Without Project With Alternative A Density
(pc/mi/ln) LOS Density
(pc/mi/ln) LOS Project Trips
Percent IncreaseBristol St S On-ramp to S Coast Off Weave - F - F 0 0.0%
Southbound I-405 SR-55 SB On-ramp to MacArthur Blvd Off-ramp Weave - F - F 80 0.8% MacArthur Blvd On-ramp to Jamboree Rd Off-ramp Weave 44.4 E 45.5 E 60 0.6% Jamboree Rd Loop On-ramp Merge 22.5 F 22.2 F 60 0.9% Jamboree Rd Direct On-ramp Merge 22.8 F 23.4 F 80 1.1% Notes: 1. Freeway facilities operating below acceptable standards are noted in bold. 2. Analysis performed using the HCM 2010 methodology. 3. pc/mi/ln = passenger cars per mile per lane. 4. NB=Northbound; SB=Southbound Source: Transportation Impact Analysis, (Full data in Tables 7-30, 7-31, and 7-32), Fehr & Peers, 2014 Caltrans Ramp Queue Analysis A 95th percentile queue analysis has been prepared utilizing the Synchro 7 software to determine if adequate queue storage is provided at the off-ramp at MacArthur Boulevard and Jamboree Road under the Alternative A scenario. Adequate queue storage is forecast to be provided at the Caltrans off-ramp locations. The detailed analysis is provided in Table 11-2 in the Transportation Impact Analysis (Appendix G). Alternative B Existing Plus Alternative B As previously discussed, the Existing Plus Project analysis often results in either overstating or understating impacts, or both. Specific to Alternative B, the Existing Plus Project analysis both understates and overstates impacts. As shown below, under the Existing Plus Alternative B scenario, Alternative B would result in significant impacts at one intersection and three Caltrans facilities. However, under the Phase 3 analysis, which also takes into account cumulative traffic growth and future road improvements, Alternative B would result in significant impacts at four intersections and two Caltrans on-ramps. Thus, if used to measure significance, the Existing Plus Alternative B scenario would both understate and overstate project impacts. Therefore, the results of the Existing Plus Alternative B analysis in this case are misleading and, as such, are presented for information and disclosure purposes only.

Transportation/Traffic
JOHN WAYNE AIRPORT SETTLEMENT AGREEMENT AMENDMENT 4.8-69 ENVIRONMENTAL IMPACT REPORT
Table 4.8-44 shows there is one location under the Existing Plus Alternative B scenario where the LOS degrades from acceptable conditions to LOS E. This intersection, Campus Drive/Bristol Street North, is located in the City of Newport Beach and the LOS worsens from LOS D to LOS E with the addition of the Alternative B trips. As such, under the Existing Plus Alternative B scenario, Alternative B would result in a significant impact at this intersection. The evaluation was based on City of Newport Beach intersection analysis methodology. The LOS for each of the 59 study intersections under the Existing Plus Alternative B scenario is provided in Appendix G (Table 8-1). TABLE 4.8-44
INTERSECTION OPERATING AT A DEFICIENT LEVEL OF SERVICE EXISTING PLUS ALTERNATIVE B
Intersection Traffic Control Peak Hour
Existing Existing PlusAlternative B
V/C LOS V/C LOS Change17. Campus Dr at Bristol St North Signal AM 0.596 A 0.638 B 0.042PM 0.885 D 0.958 E 0.073Boldface indicates the intersection is operating below acceptable standards for the applicable jurisdiction. Source: Transportation Impact Analysis, (Full data in Table 8-1), Fehr & Peers, 2014 Of the four intersections under the shared jurisdiction of Caltrans only the Jamboree Road at the I-405 southbound ramps would operate at deficient conditions under the "with project" scenario. However, as shown in Table 4.8-45 because the addition of Project-generated trips would not cause a two second delay increase at an intersection operating at an unacceptable LOS prior to the addition of Project traffic, Alternative B would not result in significant impacts at the Caltrans intersections.
TABLE 4.8-45 CALTRANS INTERSECTION OPERATING AT A DEFICIENT LEVEL OF SERVICE
EXISTING PLUS ALTERNATIVE B Intersection
Existing Existing Plus Alternative B
Traffic Control Peak Hour Delaya LOS Delaya LOS Jamboree Rd at I-405 SB Ramps Signal AM 90.8 F 91.3 FPM 30.7 C 30.9 CNB=Northbound
Boldface indicates the intersection is operating below acceptable standards for the applicable jurisdiction. a Delay is provided in seconds. Source: Transportation Impact Analysis, (Full data in Table 8-2), Fehr & Peers, 2014

Transportation/Traffic
4.8-70 JOHN WAYNE AIRPORT SETTLEMENT AGREEMENT AMENDMENT ENVIRONMENTAL IMPACT REPORT
Table 4.8-46 identifies the freeway mainline and ramp locations that would operate at a deficient LOS on SR-55, SR-73, and I-405 during the AM peak hour. Table 4.8-47 identifies the freeway mainline and ramp locations that would operate at a deficient LOS during the PM peak hour for these same facilities. As shown in the tables, most of these facilities would operate at deficient levels of service without Alternative B-generated traffic. However, Alternative B would result in an increase of over 2 percent SR-55 on the on-ramp from I-405 northbound to MacArthur Boulevard off-ramp, and two northbound SR-73 segments (Bristol Street North on-ramp to SR-55 north off-ramp and on-ramp from northbound SR-55), therefore, Alternative B would result in a significant cumulative impact at these locations. TABLE 4.8-46
FREEWAY MAINLINE AND RAMPS OPERATIONS EXISTING PLUS ALTERNATIVE B – AM PEAK HOUR
Location Type
Existing Existing With Alternative BDensity
(pc/mi/ln) LOS Density
(pc/mi/ln) LOS Project Trips
Percent Increase
Northbound SR-55 Fair Dr/Del Mar Ave/ Newport Blvd On-ramp to SR-73 Off-ramp Weave - F - F 30 0.3% Baker St Off-ramp to SR-73 On-ramp Basic 24.9 F 37.8 F 30 0.7% On-ramp from SR-73 NB to Off-ramp to I-405 SB Weave - F - F 30 0.4% Off-ramp to I-405 SB to Paularino Ave On-ramp Basic 28.3 F 44.7 F 20 0.4% Paularino Ave On-ramp Merge 29.6 D - F 30 0.6%Paularino Ave On-ramp to I-405 SB On-ramp Basic 34.3 D - F 30 0.6% On-ramp from I-405 SB Basic - F - F 30 0.4%On-ramp from I-405 NB to MacArthur Blvd Off-ramp Weave - F - F 170 1.6%
Southbound SR-55 MacArthur Blvd Loop On-ramp to MacArthur Blvd Direct On-ramp Basic 34.1 D 35.0 E 120 1.6% MacArthur Blvd Direct On-ramp to Off-ramp to I-405 SB Weave - F - F 180 1.7% On-ramp from I-405 NB to Off-ramp to SR-73 SB Weave - F - F 20 0.2%

Transportation/Traffic
JOHN WAYNE AIRPORT SETTLEMENT AGREEMENT AMENDMENT 4.8-71 ENVIRONMENTAL IMPACT REPORT
TABLE 4.8-46 FREEWAY MAINLINE AND RAMPS OPERATIONS
EXISTING PLUS ALTERNATIVE B – AM PEAK HOUR Location Type
Existing Existing With Alternative BDensity
(pc/mi/ln) LOS Density
(pc/mi/ln) LOS Project Trips
Percent Increase
Northbound SR-73 Lane Drop to MacArthur Blvd On-ramp Basic 40.3 E 40.7 E 30 0.5% MacArthur Blvd On-ramp Basic 36.6 E 37.0 E 40 0.5%Jamboree Rd On-ramp Merge 34.8 D 35.1 E 50 0.6%Jamboree Rd On-ramp to Bristol St N Off-ramp Basic 23.7 C 43.6 E 50 0.9% Bristol St N Off-ramp Diverge 30.5 D - F 50 0.7%Bristol St N On-ramp to SR-55 N Off-ramp Weave 32.1 D - F 190 2.3% On-ramp from SR-55 NB Weave 33.1 D - F 150 2.8%Southbound SR-73 Bear St On-ramp to SR-55 S Off-ramp Weave 38.7 E 39.2 E 60 0.9% On-ramp from SR-55 SB to Campus/Bristol St S Off-ramp Weave - F - F 90 1.0%
Northbound I-405 Culver St On-ramp to Jamboree Rd Off-ramp Basic 42.7 E 43.5 E 90 0.8% Jamboree Rd Direct On-ramp to MacArthur Blvd Off-ramp Weave - F - F 80 0.6% MacArthur Blvd On-ramp to SR-55 NB & SB Off-ramp Weave 40.8 E 37.6 E 0 0.0% Bristol St S On-ramp to S Coast Off Weave - F - F 0 0.0%
Southbound I-405 Off-ramp to I-405 SB to Fairview Rd On-ramp Basic 30.8 F 31.2 F 70 0.8% Fairview Rd On-ramp Merge 34.1 F 34.4 F 80 0.8%Fairview Rd On-ramp to Bristol St Off-ramp Basic 38.6 F 39.1 F 80 0.8% Bristol St Off-ramp Diverge 27.2 F 27.5 F 80 0.7%Bristol St On-ramp to SR-55 NB Off-ramp Weave - F - F 90 0.7% Lane Drop Basic 36.9 E 34.5 D 90 1.1%On-ramp from SR-55 NB Basic 37.0 E 35.1 E 100 1.0%

Transportation/Traffic
4.8-72 JOHN WAYNE AIRPORT SETTLEMENT AGREEMENT AMENDMENT ENVIRONMENTAL IMPACT REPORT
TABLE 4.8-46 FREEWAY MAINLINE AND RAMPS OPERATIONS
EXISTING PLUS ALTERNATIVE B – AM PEAK HOUR Location Type
Existing Existing With Alternative BDensity
(pc/mi/ln) LOS Density
(pc/mi/ln) LOS Project Trips
Percent IncreaseSR-55 SB On-ramp to MacArthur Blvd Off-ramp Weave - F - F 100 0.7% MacArthur Blvd On-ramp to Jamboree Rd Off-ramp Weave - F - F 90 0.7% Notes: 1. Freeway facilities operating below acceptable standards are noted in bold. 2. Analysis performed using the HCM 2010 methodology. 3. pc/mi/ln = passenger cars per mile per lane. 4. NB=Northbound; SB=Southbound Source: Transportation Impact Analysis, (Full data in Tables 8-3, 8-4, and 8-5), Fehr & Peers, 2014
TABLE 4.8-47 PROJECT FREEWAY MAINLINE AND RAMPS OPERATIONS
EXISTING PLUS ALTERNATIVE B – PM PEAK HOUR Location Type
Existing Existing With Alternative BDensity
(pc/mi/ln) LOS Density
(pc/mi/ln) LOS Project Trips
Percent Increase
Northbound SR-55 Fair Dr/Del Mar Ave/Newport Blvd On-ramp to SR-73 Off-ramp Weave - F - F 50 0.7% Paularino Ave On-ramp Merge 14.9 F 15.9 F 50 1.7%Paularino Ave On-ramp to I-405 SB On-ramp Basic 15.9 F 16.9 F 50 1.7% On-ramp from I-405 SB Basic 15.5 F 16.3 F 50 1.3%On-ramp from I-405 NB to MacArthur Blvd Off-ramp Weave 23.0 F 27.2 F 250 4.4%
Southbound SR-55 MacArthur Blvd Loop On-ramp to MacArthur Blvd Direct On-ramp Basic 36.5 E 37.4 E 100 1.3% MacArthur Blvd Direct On-ramp to Off-ramp to I-405 SB Weave - F - F 140 1.3% On-ramp from I-405 NB to Off-ramp to SR-73 SB Weave - F - F 10 0.1%
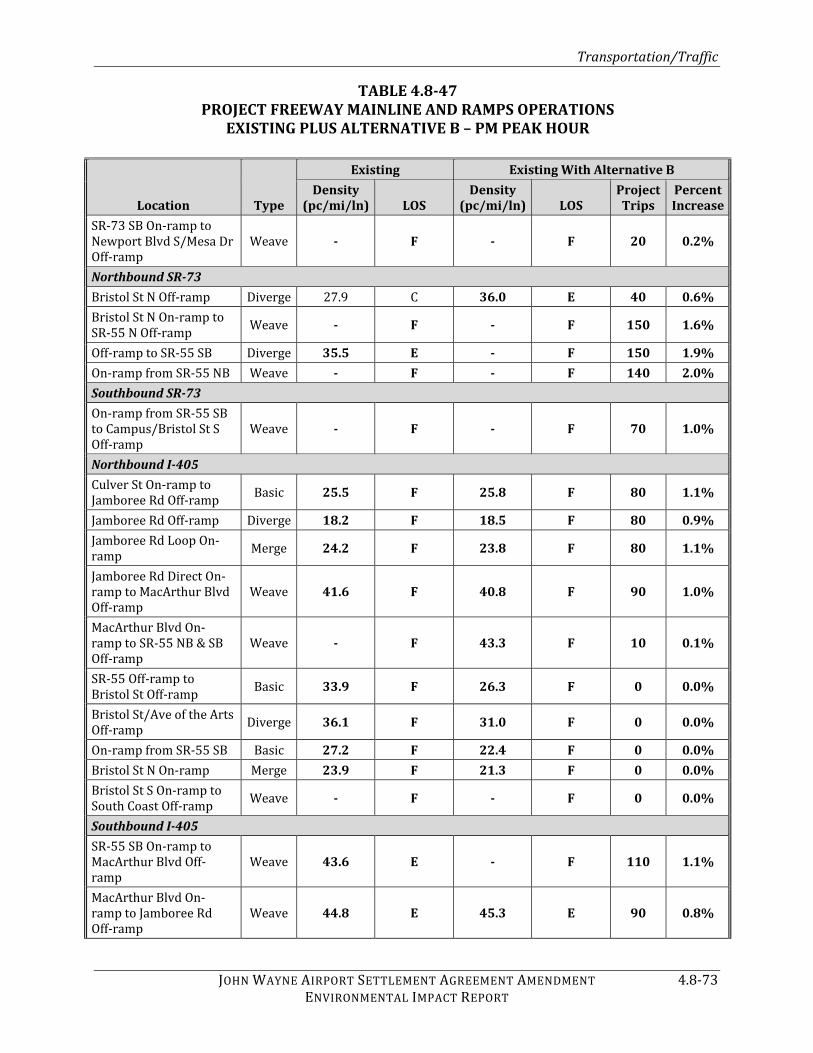
Transportation/Traffic
JOHN WAYNE AIRPORT SETTLEMENT AGREEMENT AMENDMENT 4.8-73 ENVIRONMENTAL IMPACT REPORT
TABLE 4.8-47 PROJECT FREEWAY MAINLINE AND RAMPS OPERATIONS
EXISTING PLUS ALTERNATIVE B – PM PEAK HOUR Location Type
Existing Existing With Alternative BDensity
(pc/mi/ln) LOS Density
(pc/mi/ln) LOS Project Trips
Percent IncreaseSR-73 SB On-ramp to Newport Blvd S/Mesa Dr Off-ramp Weave - F - F 20 0.2%
Northbound SR-73 Bristol St N Off-ramp Diverge 27.9 C 36.0 E 40 0.6%Bristol St N On-ramp to SR-55 N Off-ramp Weave - F - F 150 1.6% Off-ramp to SR-55 SB Diverge 35.5 E - F 150 1.9%On-ramp from SR-55 NB Weave - F - F 140 2.0%Southbound SR-73 On-ramp from SR-55 SB to Campus/Bristol St S Off-ramp Weave - F - F 70 1.0% Northbound I-405 Culver St On-ramp to Jamboree Rd Off-ramp Basic 25.5 F 25.8 F 80 1.1% Jamboree Rd Off-ramp Diverge 18.2 F 18.5 F 80 0.9%Jamboree Rd Loop On-ramp Merge 24.2 F 23.8 F 80 1.1% Jamboree Rd Direct On-ramp to MacArthur Blvd Off-ramp Weave 41.6 F 40.8 F 90 1.0% MacArthur Blvd On-ramp to SR-55 NB & SB Off-ramp Weave - F 43.3 F 10 0.1% SR-55 Off-ramp to Bristol St Off-ramp Basic 33.9 F 26.3 F 0 0.0% Bristol St/Ave of the Arts Off-ramp Diverge 36.1 F 31.0 F 0 0.0% On-ramp from SR-55 SB Basic 27.2 F 22.4 F 0 0.0%Bristol St N On-ramp Merge 23.9 F 21.3 F 0 0.0%Bristol St S On-ramp to South Coast Off-ramp Weave - F - F 0 0.0% Southbound I-405 SR-55 SB On-ramp to MacArthur Blvd Off-ramp Weave 43.6 E - F 110 1.1% MacArthur Blvd On-ramp to Jamboree Rd Off-ramp Weave 44.8 E 45.3 E 90 0.8%

Transportation/Traffic
4.8-74 JOHN WAYNE AIRPORT SETTLEMENT AGREEMENT AMENDMENT ENVIRONMENTAL IMPACT REPORT
TABLE 4.8-47 PROJECT FREEWAY MAINLINE AND RAMPS OPERATIONS
EXISTING PLUS ALTERNATIVE B – PM PEAK HOUR Location Type
Existing Existing With Alternative BDensity
(pc/mi/ln) LOS Density
(pc/mi/ln) LOS Project Trips
Percent IncreaseJamboree Rd Loop On-ramp Merge 21.3 F 22.2 F 90 1.5% Jamboree Rd Direct On-ramp Merge 21.4 F 23.0 F 120 1.7% Notes: 1. Freeway facilities operating below acceptable standards are noted in bold. 2. Analysis performed using the HCM 2010 methodology. 3. pc/mi/ln = passenger cars per mile per lane. 4. NB=Northbound; SB=Southbound Source: Transportation Impact Analysis, (Full data in Tables 8-6, 8-7, and 8-8), Fehr & Peers, 2014 Phase 1 Table 4.8-48 shows there is one location where there is a significant impact with Alternative B in Phase 1. During the PM peak hour, the LOS at the Campus Drive at Bristol Street North intersection in the City of Newport Beach worsens. Though the intersection would operate at LOS E with or without Alternative B, Phase 1, the change is of sufficient magnitude that it would result in a significant impact at this intersection. The evaluation was based on City of Newport Beach intersection analysis methodology. The LOS evaluation for each of the 59 study intersections under Alternative B, Phase 1 is provided in Appendix G (Table 8-9).
TABLE 4.8-48 INTERSECTION LEVEL OF SERVICE
PHASE 1 ALTERNATIVE B Intersection
Traffic Control Peak Hour
Without Project With Alternative B
V/C LOS V/C LOS Change17. Campus Dr at Bristol St North Signal AM 0.614 B 0.626 B 0.012PM 0.916 E 0.936 E 0.020Boldface indicates the intersection is operating below acceptable standards for the applicable jurisdiction. Source: Transportation Impact Analysis, (Full data in Table 8-9), Fehr & Peers, 2014 Of the four intersections under shared jurisdiction with Caltrans only the Jamboree Road at the I-405 southbound ramps would operate at deficient conditions under the "with project" scenario. However, as shown in Table 4.8-49 because the addition of Alternative B-generated trips would not cause a two second delay increase at an intersection operating at an unacceptable LOS prior to the addition of Project traffic, Alternative B, Phase 1 would not result in significant impacts at the Caltrans intersections. This intersection is an instance where the

Transportation/Traffic
JOHN WAYNE AIRPORT SETTLEMENT AGREEMENT AMENDMENT 4.8-75 ENVIRONMENTAL IMPACT REPORT
overall intersection delay would improve at this location because Alternative B increases traffic to certain movements which have available capacity or “green time”. As previously discussed, since intersection delay is reported as a weighted average of all movements, this increase in traffic volume actually results in a reduction of overall intersection delay. TABLE 4.8-49
CALTRANS INTERSECTION LEVEL OF SERVICE PHASE 1 ALTERNATIVE B
Intersection Traffic Control Peak Hour
Without Project With Alternative BDelaya LOS Delaya LOSJamboree Rd at I-405 SB Ramps Signal AM 94.7 F 94.5 FPM 31.0 C 31.0 C
Boldface indicates the intersection is operating below acceptable standards for the applicable jurisdiction. a Delay is provided in seconds. Source: Transportation Impact Analysis, (Full data in Table 8-10), Fehr & Peers, 2014 Table 4.8-50 identifies the freeway mainline and ramp locations that would operate at a deficient LOS on SR-55, SR-73, and I-405 during the AM peak hour. Table 4.8-51 identifies the freeway mainline and ramp locations that would operate at a deficient LOS during the PM peak hour for these same facilities. As shown in the tables, most of these facilities would operate at deficient levels of service without Alternative B-related traffic. Because the addition of Alternative B, Phase 1 trips would not result in a decrease in LOS from acceptable to unacceptable, and because the addition of Alternative B trips would not increase traffic by 2 percent or more, impacts would be less than significant.
TABLE 4.8-50 FREEWAY MAINLINE AND RAMPS OPERATIONS
PHASE 1 ALTERNATIVE B – AM PEAK HOUR Location Type
Without Project With Alternative B Density
(pc/mi/ln) LOS Density
(pc/mi/ln) LOS Project Trips
Percent Increase
Northbound SR-55 Fair Dr/Del Mar Ave/ Newport Blvd On-ramp to SR-73 Off-ramp Weave - F - F 20 0.2% Baker St Off-ramp to SR-73 On-ramp Basic 37.7 F 37.9 F 20 0.3% On-ramp from SR-73 NB to Off-ramp to I-405 SB Weave - F - F 20 0.2% Off-ramp to I-405 SB to Paularino Ave On-ramp Basic 44.5 F 44.7 F 10 0.2% Paularino Ave On-ramp Merge - F - F 20 0.3%Paularino Ave On-ramp to I-405 SB On-ramp Basic - F - F 20 0.3% On-ramp from I-405 SB Basic - F - F 20 0.2%

Transportation/Traffic
4.8-76 JOHN WAYNE AIRPORT SETTLEMENT AGREEMENT AMENDMENT ENVIRONMENTAL IMPACT REPORT
TABLE 4.8-50 FREEWAY MAINLINE AND RAMPS OPERATIONS
PHASE 1 ALTERNATIVE B – AM PEAK HOUR Location Type
Without Project With Alternative B Density
(pc/mi/ln) LOS Density
(pc/mi/ln) LOS Project Trips
Percent IncreaseOn-ramp from I-405 NB to MacArthur Blvd Off-ramp Weave - F - F 60 0.5%
Southbound SR-55 MacArthur Blvd Direct On-ramp to Off-ramp to I-405 SB Weave - F - F 60 0.6% On-ramp from I-405 NB to Off-ramp to SR-73 SB Weave - F - F 20 0.2%
Northbound SR-73 Lane Drop to MacArthur Blvd On-ramp Basic 40.4 E 40.5 E 10 0.2% MacArthur Blvd On-ramp Basic 36.7 E 36.8 E 20 0.3% Jamboree Rd On-ramp Merge 34.9 D 35.1 E 30 0.3%Jamboree Rd On-ramp to Bristol St N Off-ramp Basic 43.2 E 43.5 E 30 0.3% Bristol St N Off-ramp Diverge - F - F 30 0.3%Bristol St N On-ramp to SR-55 N Off-ramp Weave - F - F 70 0.7% On-ramp from SR-55 NB Weave - F - F 50 0.7%Southbound SR-73 Bear St On-ramp to SR-55 S Off-ramp Weave 38.8 E 39.1 E 30 0.5% On-ramp from SR-55 SB to Campus/Bristol St S Off-ramp Weave - F - F 50 0.5%
Northbound I-405 Culver St On-ramp to Jamboree Rd Off-ramp Basic 42.8 E 43.1 E 30 0.3% Jamboree Rd Direct On-ramp to MacArthur Blvd Off-ramp Weave - F - F 30 0.2% MacArthur Blvd On-ramp to SR-55 NB & SB Off-ramp Weave 37.5 E 37.7 E 10 0.1% Bristol St S On-ramp to South Coast Off-ramp Weave - F - F 0 0.0%

Transportation/Traffic
JOHN WAYNE AIRPORT SETTLEMENT AGREEMENT AMENDMENT 4.8-77 ENVIRONMENTAL IMPACT REPORT
TABLE 4.8-50 FREEWAY MAINLINE AND RAMPS OPERATIONS
PHASE 1 ALTERNATIVE B – AM PEAK HOUR Location Type
Without Project With Alternative B Density
(pc/mi/ln) LOS Density
(pc/mi/ln) LOS Project Trips
Percent Increase
Southbound I-405 Off-ramp to I-405 SB to Fairview Rd On-ramp Basic 30.9 F 31.0 F 20 0.2% Fairview Rd On-ramp Merge 34.2 F 34.3 F 30 0.3%Fairview Rd On-ramp to Bristol St Off-ramp Basic 38.8 F 39.0 F 30 0.3% Bristol St Off-ramp Diverge 27.3 F 27.4 F 30 0.3%Bristol St On-ramp to SR-55 NB Off-ramp Weave - F - F 40 0.3% On-ramp from SR-55 NB Basic 34.8 D 35.1 E 50 0.5%SR-55 SB On-ramp to MacArthur Blvd Off-ramp Weave - F - F 50 0.4% MacArthur Blvd On-ramp to Jamboree Rd Off-ramp Weave - F - F 50 0.4%
Notes: 1. Freeway facilities operating below acceptable standards are noted in bold. 2. Analysis performed using the HCM 2010 methodology. 3. pc/mi/ln = passenger cars per mile per lane. 4. NB=Northbound; SB=Southbound Source: Transportation Impact Analysis, (Full data in Tables 8-11, 8-12, and 8-13), Fehr & Peers, 2014 TABLE 4.8-51
PROJECT FREEWAY MAINLINE AND RAMPS OPERATIONS PHASE 1 ALTERNATIVE B– PM PEAK HOUR
Location Type
Without Project With Alternative B Density
(pc/mi/ln) LOS Density
(pc/mi/ln) LOS Project Trips
Percent Increase
Northbound SR-55 Fair Dr/Del Mar Ave/Newport Blvd On-ramp to SR-73 Off-ramp Weave - F - F 20 0.3% Paularino Ave On-ramp Merge 15.7 F 15.8 F 20 0.7%Paularino Ave On-ramp to I-405 SB On-ramp Basic 16.7 F 16.8 F 20 0.7% On-ramp from I-405 SB Basic 16.2 F 16.2 F 20 0.5%

Transportation/Traffic
4.8-78 JOHN WAYNE AIRPORT SETTLEMENT AGREEMENT AMENDMENT ENVIRONMENTAL IMPACT REPORT
TABLE 4.8-51 PROJECT FREEWAY MAINLINE AND RAMPS OPERATIONS
PHASE 1 ALTERNATIVE B– PM PEAK HOUR Location Type
Without Project With Alternative B Density
(pc/mi/ln) LOS Density
(pc/mi/ln) LOS Project Trips
Percent IncreaseOn-ramp from I-405 NB to MacArthur Blvd Off-ramp Weave 25.5 F 26.1 F 80 1.3%
Southbound SR-55 MacArthur Blvd Loop On-ramp to MacArthur Blvd Direct On-ramp Basic 36.6 E 36.8 E 30 0.4% MacArthur Blvd Direct On-ramp to Off-ramp to I-405 SB Weave - F - F 50 0.5% On-ramp from I-405 NB to Off-ramp to SR-73 SB Weave - F - F 10 0.1% SR-73 SB On-ramp to Newport Blvd S/Mesa Dr Off-ramp Weave - F - F 20 0.2%
Northbound SR-73 Bristol St N Off-ramp Diverge 35.9 E 36.1 E 30 0.4%Bristol St N On-ramp to SR-55 N Off-ramp Weave - F - F 60 0.6% Off-ramp to SR-55 SB Diverge - F - F 60 0.6%On-ramp from SR-55 NB Weave - F - F 50 0.6%Southbound SR-73 On-ramp from SR-55 SB to Campus/Bristol St S Off-ramp Weave - F - F 30 0.4% Northbound I-405 Culver St On-ramp to Jamboree Rd Off-ramp Basic 25.6 F 25.7 F 30 0.4% Jamboree Rd Off-ramp Diverge 18.3 F 18.4 F 30 0.3%Jamboree Rd Loop On-ramp Merge 23.8 F 23.9 F 30 0.4% Jamboree Rd Direct On-ramp to MacArthur Blvd Off-ramp Weave 40.1 F 40.5 F 40 0.4% MacArthur Blvd On-ramp to SR-55 NB & SB Off-ramp Weave - F - F 20 0.2% SR-55 Off-ramp to Bristol St Off-ramp Basic 26.4 F 26.5 F 10 0.2% Bristol St/Ave of the Arts Off-ramp Diverge 31.0 F 31.2 F 10 0.1%

Transportation/Traffic
JOHN WAYNE AIRPORT SETTLEMENT AGREEMENT AMENDMENT 4.8-79 ENVIRONMENTAL IMPACT REPORT
TABLE 4.8-51 PROJECT FREEWAY MAINLINE AND RAMPS OPERATIONS
PHASE 1 ALTERNATIVE B– PM PEAK HOUR Location Type
Without Project With Alternative B Density
(pc/mi/ln) LOS Density
(pc/mi/ln) LOS Project Trips
Percent IncreaseOn-ramp from SR-55 SB Basic 22.5 F 22.5 F 0 0.0%Bristol St N On-ramp Merge 21.4 F 21.4 F 0 0.0%Bristol St S On-ramp to South Coast Off-ramp Weave - F - F 0 0.0%
Southbound I-405 SR-55 SB On-ramp to MacArthur Blvd Off-ramp Weave - F 44.2 E 60 0.6% MacArthur Blvd On-ramp to Jamboree Rd Off-ramp Weave 44.2 E 45.4 E 60 0.6% Jamboree Rd Loop On-ramp Merge 22.4 F 22.2 F 60 0.9% Jamboree Rd Direct On-ramp Merge 22.6 F 23.0 F 70 0.9% Notes: 1. Freeway facilities operating below acceptable standards are noted in bold. 2. Analysis performed using the HCM 2010 methodology. 3. pc/mi/ln = passenger cars per mile per lane. 4. NB=Northbound; SB=Southbound Source: Transportation Impact Analysis, (Full data in Tables 8-14, 8-15, and 8-16), Fehr & Peers, 2014 Phase 2 Table 4.8-52 shows with Alternative B, Phase 2 there would be a significant impact at Campus Drive at Bristol Street North (Intersection 17), during the PM peak hour. The evaluation for this intersection was based on City of Newport Beach intersection analysis methodology. The LOS evaluation for each of the 59 study intersections under Alternative B, Phase 2 is provided in Appendix G (Table 8-17).

Transportation/Traffic
4.8-80 JOHN WAYNE AIRPORT SETTLEMENT AGREEMENT AMENDMENT ENVIRONMENTAL IMPACT REPORT
TABLE 4.8-52 INTERSECTION LEVEL OF SERVICE
PHASE 2 ALTERNATIVE B Intersection
Traffic Control Peak Hour
Without Project With Alternative B
V/C LOS V/C LOS Change17. Campus Dr at Bristol St North Signal AM 0.641 B 0.667 B 0.026PM 0.964 E 1.012 F 0.048Boldface indicates the intersection is operating below acceptable standards for the applicable jurisdiction. Source: Transportation Impact Analysis, (Full data in Table 8-17), Fehr & Peers, 2014 As with the Proposed Project, with Alternative B, Phase 2 the only intersection under shared jurisdiction with Caltrans that would operate at deficient conditions under the "with project" scenario would be the Jamboree Road at the I-405 southbound ramps. However, as shown in Table 4.8-53 this intersection would not be adversely impacted by Alternative B. With the addition of Alternative B-generated trips the overall intersection delay would improve at the Jamboree Road/I-405 southbound ramps during the AM peak hour because Alternative B, Phase 2 would increase traffic to the movements that have available capacity or “green time”. As previously indicated, since intersection delay is reported as a weighted average of all movements, this increase in traffic volume actually results in a reduction of overall intersection delay.
TABLE 4.8-53 CALTRANS INTERSECTION LEVEL OF SERVICE
PHASE 2 ALTERNATIVE B Intersection
Traffic Control Peak Hour
Without Project With Alternative BDelaya LOS Delaya LOSJamboree Rd at I-405 Southbound Ramps Signal AM 99.7 F 99.5 FPM 30.8 C 30.8 C
Boldface indicates the intersection is operating below acceptable standards for the applicable jurisdiction. a Delay is provided in seconds. Source: Transportation Impact Analysis, (Full data in Table 8-18), Fehr & Peers, 2014 Table 4.8-54 identifies the freeway mainline and ramp locations that would operate at a deficient LOS on SR-55, SR-73, and I-405 during the AM peak hour. Table 4.8-55 identifies the freeway mainline and ramp locations that would operate at a deficient LOS during the PM peak hour for these same facilities. As shown in the tables, most of these facilities would operate at deficient levels of service without Alternative B-related traffic. However, in the PM peak hour, Alternative B, Phase 2 would result in an increase of over 2 percent at the SR-55 on-ramp from I-405 northbound to MacArthur Boulevard off-ramp, which is projected to operate at LOS F prior to the addition of Project traffic. Therefore, Alternative B, Phase 2 would result in a significant cumulative impact at this location.

Transportation/Traffic
JOHN WAYNE AIRPORT SETTLEMENT AGREEMENT AMENDMENT 4.8-81 ENVIRONMENTAL IMPACT REPORT
TABLE 4.8-54 FREEWAY MAINLINE AND RAMPS OPERATIONS
PHASE 2 ALTERNATIVE B – AM PEAK HOUR Location Type
Without Project With Alternative B Density
(pc/mi/ln) LOS Density
(pc/mi/ln) LOS Project Trips
Percent Increase
Northbound SR-55 Fair Dr/Del Mar Ave/ Newport Blvd On-ramp to SR-73 Off-ramp Weave - F - F 20 0.2% Baker St Off-ramp to SR-73 On-ramp Basic 37.9 F 38.1 F 20 0.3% On-ramp from SR-73 NB to Off-ramp to I-405 SB Weave - F - F 20 0.2% Off-ramp to I-405 SB to Paularino Ave On-ramp Basic 44.8 F 45.0 F 10 0.2% Paularino Ave On-ramp Merge - F - F 20 0.3%Paularino Ave On-ramp to I-405 SB On-ramp Basic - F - F 20 0.3% On-ramp from I-405 SB Basic - F - F 20 0.2%On-ramp from I-405 NB to MacArthur Blvd Off-ramp Weave - F - F 120 0.9%
Southbound SR-55 MacArthur Blvd Direct On-ramp to Off-ramp to I-405 SB Weave - F - F 120 1.1% On-ramp from I-405 NB to Off-ramp to SR-73 SB Weave - F - F 20 0.2%
Northbound SR-73 Lane Drop to MacArthur Blvd On-ramp Basic 40.4 E 40.6 E 20 0.3% MacArthur Blvd On-ramp Basic 36.7 E 36.9 E 30 0.4%Jamboree Rd On-ramp Merge 34.9 D 35.1 E 40 0.5%Jamboree Rd On-ramp to Bristol St N Off-ramp Basic 43.2 E 43.6 E 40 0.5% Bristol St N Off-ramp Diverge - F - F 40 0.4%Bristol St N On-ramp to SR-55 N Off-ramp Weave - F - F 130 1.3% On-ramp from SR-55 NB Weave - F - F 100 1.4%Southbound SR-73 Bear St On-ramp to SR-55 S Off-ramp Weave 38.9 E 39.3 E 50 0.8% On-ramp from SR-55 SB to Campus/Bristol St S Off-ramp Weave - F - F 70 0.7%

Transportation/Traffic
4.8-82 JOHN WAYNE AIRPORT SETTLEMENT AGREEMENT AMENDMENT ENVIRONMENTAL IMPACT REPORT
TABLE 4.8-54 FREEWAY MAINLINE AND RAMPS OPERATIONS
PHASE 2 ALTERNATIVE B – AM PEAK HOUR Location Type
Without Project With Alternative B Density
(pc/mi/ln) LOS Density
(pc/mi/ln) LOS Project Trips
Percent Increase
Northbound I-405 Culver St On-ramp to Jamboree Rd Off-ramp Basic 42.9 E 43.4 E 60 0.6% Jamboree Rd Direct On-ramp to MacArthur Blvd Off-ramp Weave - F - F 50 0.4% MacArthur Blvd On-ramp to SR-55 NB & SB Off-ramp Weave 37.6 E 37.6 E 0 0.0% Bristol St S On-ramp to S Coast Off Weave - F - F 0 0.0%
Southbound I-405 Off-ramp to I-405 SB to Fairview Rd On-ramp Basic 31.0 F 31.3 F 50 0.6% Fairview Rd On-ramp Merge 34.3 F 34.6 F 60 0.6%Fairview Rd On-ramp to Bristol St Off-ramp Basic 39.0 F 39.4 F 60 0.6% Bristol St Off-ramp Diverge 27.4 F 27.6 F 60 0.5%Bristol St On-ramp to SR-55 NB Off-ramp Weave - F - F 70 0.5% On-ramp from SR-55 NB Basic 35.0 E 35.5 E 80 0.8%SR-55 SB On-ramp to MacArthur Blvd Off-ramp Weave - F - F 80 0.6% MacArthur Blvd On-ramp to Jamboree Rd Off-ramp Weave - F - F 70 0.6% Notes: 1. Freeway facilities operating below acceptable standards are noted in bold. 2. Analysis performed using the HCM 2010 methodology. 3. pc/mi/ln = passenger cars per mile per lane. 4. NB=Northbound; SB=Southbound Source: Transportation Impact Analysis, (Full data in Tables 8-19, 8-20, and 8-21), Fehr & Peers, 2014

Transportation/Traffic
JOHN WAYNE AIRPORT SETTLEMENT AGREEMENT AMENDMENT 4.8-83 ENVIRONMENTAL IMPACT REPORT
TABLE 4.8-55 FREEWAY MAINLINE AND RAMPS OPERATIONS
PHASE 2 ALTERNATIVE B – PM PEAK HOUR
Location Type
Without Project With Alternative B Density
(pc/mi/ln) LOS Density
(pc/mi/ln) LOS Project Trips
Percent Increase
Northbound SR-55 Fair Dr/Del Mar Ave/ Newport Blvd On-ramp to SR-73 Off-ramp Weave - F - F 40 0.5% Paularino Ave On-ramp Merge 15.7 F 15.9 F 40 1.3%Paularino Ave On-ramp to I-405 SB On-ramp Basic 16.7 F 16.9 F 40 1.3% On-ramp from I-405 SB Basic 16.2 F 16.3 F 40 1.0%On-ramp from I-405 NB to MacArthur Blvd Off-ramp Weave 25.5 F 26.7 F 170 2.8%
Southbound SR-55 MacArthur Blvd Loop On-ramp to MacArthur Blvd Direct On-ramp Basic 36.6 E 37.2 E 70 0.9% MacArthur Blvd Direct On-ramp to Off-ramp to I-405 SB Weave - F - F 90 0.9% On-ramp from I-405 NB to Off-ramp to SR-73 SB Weave - F - F 10 0.1% SR-73 SB On-ramp to Newport Blvd S/Mesa Dr Off-ramp Weave - F - F 20 0.2%
Northbound SR-73 Bristol St N Off-ramp Diverge 35.9 E 36.2 E 30 0.4%Bristol St N On-ramp to SR-55 N Off-ramp Weave - F - F 100 0.9% Off-ramp to SR-55 SB Diverge - F - F 100 1.1%On-ramp from SR-55 NB Weave - F - F 90 1.0%Southbound SR-73 On-ramp from SR-55 SB to Campus/Bristol St S Off-ramp Weave - F - F 50 0.6%
Northbound I-405 Culver St On-ramp to Jamboree Rd Off-ramp Basic 25.6 F 25.8 F 50 0.7% Jamboree Rd Off-ramp Diverge 18.4 F 18.5 F 50 0.6%Jamboree Rd Loop On-ramp Merge 23.9 F 24.1 F 50 0.7%

Transportation/Traffic
4.8-84 JOHN WAYNE AIRPORT SETTLEMENT AGREEMENT AMENDMENT ENVIRONMENTAL IMPACT REPORT
TABLE 4.8-55 FREEWAY MAINLINE AND RAMPS OPERATIONS
PHASE 2 ALTERNATIVE B – PM PEAK HOUR
Location Type
Without Project With Alternative B Density
(pc/mi/ln) LOS Density
(pc/mi/ln) LOS Project Trips
Percent IncreaseJamboree Rd Direct On-ramp to MacArthur Blvd Off-ramp Weave 40.2 F 40.9 F 60 0.7% MacArthur Blvd On-ramp to SR-55 NB & SB Off-ramp Weave - F - F 10 0.1% SR-55 Off-ramp to Bristol St Off-ramp Basic 26.4 F 26.5 F 0 0.0% Bristol St/Ave of the Arts Off-ramp Diverge 31.1 F 31.2 F 0 0.0% On-ramp from SR-55 SB Basic 22.5 F 22.5 F 0 0.0%Bristol St N On-ramp Merge 21.4 F 21.4 F 0 0.0%Bristol St S On-ramp to S Coast Off Weave - F - F 0 0.0%
Southbound I-405 SR-55 SB On-ramp to MacArthur Blvd Off-ramp Weave - F - F 90 0.8% MacArthur Blvd On-ramp to Jamboree Rd Off-ramp Weave 44.3 E 45.5 E 80 0.7% Jamboree Rd Loop On-ramp Merge 22.4 F 22.3 F 80 1.2% Jamboree Rd Direct On-ramp Merge 22.7 F 23.3 F 100 1.3% Notes: 1. Freeway facilities operating below acceptable standards are noted in bold. 2. Analysis performed using the HCM 2010 methodology. 3. pc/mi/ln = passenger cars per mile per lane. 4. NB=Northbound; SB=Southbound Source: Transportation Impact Analysis, (Full data in Tables 8-22, 8-23, and 8-24), Fehr & Peers, 2014 Phase 3 Table 4.8-56 shows the intersection LOS with Alternative B, Phase 3. Prior to mitigation there would be significant Project-related impacts at Intersections 4 (MacArthur Boulevard at Michelson Drive), 15 (Campus Drive at Airport Way), 17 (Campus Drive at Bristol Street North), and 53 (Von Karman Avenue at Alton Parkway), during the PM peak hour. The evaluation methodology used for assessing the impact corresponds to the jurisdiction in which the intersection is located and is noted in the table. Though Intersection 52 (Von Karman Avenue at Barranca Parkway) is projected to operate at a deficient LOS, it is not considered a Project-related impact because the threshold for

Transportation/Traffic
JOHN WAYNE AIRPORT SETTLEMENT AGREEMENT AMENDMENT 4.8-85 ENVIRONMENTAL IMPACT REPORT
intersections in the Irvine Business Complex is the Project-generated trips must increase the ICU by 0.02 or more at a study intersection operating at LOS E or F under baseline conditions. Alternative B only increases the ICU at this study intersection by 0.01. Similarly, Intersection 25 (Santa Ana Avenue at Del Mar Avenue) is projected to operate at a deficient LOS with or without Alternative B in the AM peak hour. Though the intersection would receive additional traffic associated with the Alternative B, this additional traffic would not reduce the LOS at this intersection and, therefore, impacts would be less than significant. The LOS evaluation for each of the 59 study intersections under Alternative B, Phase 3 is provided in Appendix G (Table 8-25). TABLE 4.8-56
INTERSECTION LEVEL OF SERVICE PHASE 3 ALTERNATIVE B
Intersection Traffic Control Peak Hour
Without Project With Alternative B
V/C LOS V/C LOS Change4. MacArthur Blvd at Michelson Drive1 Signal AM 0.77 C 0.83 D 0.06PM 0.98 E 1.04 F 0.0615. Campus Dr at Airport Way2 Signal AM 0.362 A 0.580 A 0.218PM 0.723 C 0.922 E 0.19917. Campus Dr at Bristol St North2 Signal AM 0.666 B 0.709 C 0.043PM 1.009 F 1.081 F 0.07225. Santa Ana Ave at Del Mar Ave3,5 Stop Controlled AM 36.3 E 45.2 E N/APM 28.1 D 33.8 D N/A 52. Von Karman Ave at Barranca Pkwy1 Signal AM 0.83 D 0.84 D 0.01PM 1.06 F 1.07 F 0.0153. Von Karman Ave at Alton Pkwy1 Signal AM 0.83 D 0.84 D 0.01PM 0.99 E 1.01 F 0.02Boldface indicates the intersection is operating below acceptable standards for the applicable jurisdiction. Notes: Signalized intersections evaluated using ICU methodology. 1. Based on City of Irvine intersection analysis methodology. 2. Based on City of Newport Beach intersection analysis methodology. 3. Based on City of Costa Mesa intersection analysis methodology. 4. AWSC = All Way Stop Control; average intersection delay is reported. Source: Transportation Impact Analysis, (Full data in Table 8-25), Fehr & Peers, 2014 Of the four intersections under the shared jurisdiction of Caltrans only the Jamboree Road at the I-405 southbound ramps would operate at deficient conditions under the "with project" scenario. However, as shown in Table 4.8-57 this intersection would not be adversely impacted by Alternative B, Phase 3. With the addition of Alternative B-generated trips the overall intersection delay would improve at the Jamboree Road/I-405 southbound ramps during the AM peak hour because Alternative B, Phase 3 would increase traffic to the movements that have available capacity or “green time”. As previously indicated, since intersection delay is reported

Transportation/Traffic
4.8-86 JOHN WAYNE AIRPORT SETTLEMENT AGREEMENT AMENDMENT ENVIRONMENTAL IMPACT REPORT
as a weighted average of all movements, this increase in traffic volume actually results in a reduction of overall intersection delay. TABLE 4.8-57
CALTRANS INTERSECTION LEVEL OF SERVICE PHASE 3 ALTERNATIVE B
Intersection Traffic Control Peak Hour
Without Project With Alternative BDelaya LOS Delaya LOSJamboree Rd at I-405 Southbound Ramps Signal AM 106.3 F 106.1 FPM 30.7 C 30.7 C
Boldface indicates the intersection is operating below acceptable standards for the applicable jurisdiction. a Delay is provided in seconds. Source: Transportation Impact Analysis, (Full data in Table 8-26), Fehr & Peers, 2014 Table 4.8-58 identifies the freeway mainline and ramp locations that would operate at a deficient LOS on SR-55, SR-73, and I-405 during the AM peak hour. Table 4.8-59 identifies the freeway mainline and ramp locations that would operate at a deficient LOS during the PM peak hour for these same facilities. As shown in the tables, most of these facilities would operate at deficient levels of service without Alternative A-related traffic. However, during the PM peak hour, Alternative B, Phase 3 would increase the traffic by over 2 percent on the northbound SR-55 from the onramp from I-405 to the MacArthur Boulevard off-ramp, and the northbound SR-73 on-ramp from northbound SR-55. These segments are operating at LOS F prior to the addition of Alternative B traffic. Therefore, Alternative B, Phase 3 would result in a significant cumulative impact at these locations.
TABLE 4.8-58 FREEWAY MAINLINE AND RAMPS OPERATIONS
PHASE 3 ALTERNATIVE B – AM PEAK HOUR Location Type
Without Project With Alternative B Density
(pc/mi/ln) LOS Density
(pc/mi/ln) LOS Project Trips
Percent Increase
Northbound SR-55 Fair Dr/Del Mar Ave/ Newport Blvd On-ramp to SR-73 Off-ramp Weave - F - F 30 0.3% Baker St Off-ramp to SR-73 On-ramp Basic 38.0 F 38.4 F 30 0.5% On-ramp from SR-73 NB to Off-ramp to I-405 SB Weave - F - F 30 0.3% Off-ramp to I-405 SB to Paularino Ave On-ramp Basic 45.0 F - F 20 0.3% Paularino Ave On-ramp Merge - F - F 30 0.4%

Transportation/Traffic
JOHN WAYNE AIRPORT SETTLEMENT AGREEMENT AMENDMENT 4.8-87 ENVIRONMENTAL IMPACT REPORT
TABLE 4.8-58 FREEWAY MAINLINE AND RAMPS OPERATIONS
PHASE 3 ALTERNATIVE B – AM PEAK HOUR Location Type
Without Project With Alternative B Density
(pc/mi/ln) LOS Density
(pc/mi/ln) LOS Project Trips
Percent IncreasePaularino Ave On-ramp to I-405 SB On-ramp Basic - F - F 30 0.4% On-ramp from I-405 SB Basic - F - F 30 0.3%On-ramp from I-405 NB to MacArthur Blvd Off-ramp Weave - F - F 170 1.3%
Southbound SR-55 MacArthur Blvd Loop On-ramp to MacArthur Blvd Direct On-ramp Basic 34.2 D 35.0 E 120 1.6% MacArthur Blvd Direct On-ramp to Off-ramp to I-405 SB Weave - F - F 180 1.7% On-ramp from I-405 NB to Off-ramp to SR-73 SB Weave - F - F 20 0.2%
Northbound SR-73 Lane Drop to MacArthur Blvd On-ramp Basic 40.5 E 40.9 E 30 0.5% MacArthur Blvd On-ramp Basic 36.8 E 37.1 E 40 0.5%Jamboree Rd On-ramp Merge 35.0 D 35.2 E 50 0.6%Jamboree Rd On-ramp to Bristol St N Off-ramp Basic 43.3 E 43.8 E 50 0.6% Bristol St N Off-ramp Diverge - F - F 50 0.5%Bristol St N On-ramp to SR-55 N Off-ramp Weave - F - F 190 1.8% On-ramp from SR-55 NB Weave - F - F 150 2.1%Southbound SR-73 Bear St On-ramp to SR-55 S Off-ramp Weave 39.0 E 39.5 E 60 0.9% On-ramp from SR-55 SB to Campus/Bristol St S Off-ramp Weave - F - F 90 0.9%
Northbound I-405 Culver St On-ramp to Jamboree Rd Off-ramp Basic 43.0 E 43.8 E 90 0.8% Jamboree Rd Direct On-ramp to MacArthur Blvd Off-ramp Weave - F - F 80 0.7% MacArthur Blvd On-ramp to SR-55 NB & SB Off-ramp Weave 37.6 E 37.7 E 0 0.0%

Transportation/Traffic
4.8-88 JOHN WAYNE AIRPORT SETTLEMENT AGREEMENT AMENDMENT ENVIRONMENTAL IMPACT REPORT
TABLE 4.8-58 FREEWAY MAINLINE AND RAMPS OPERATIONS
PHASE 3 ALTERNATIVE B – AM PEAK HOUR Location Type
Without Project With Alternative B Density
(pc/mi/ln) LOS Density
(pc/mi/ln) LOS Project Trips
Percent IncreaseBristol St S On-ramp to South Coast Off-ramp Weave - F - F 0 0.0%
Southbound I-405 Off-ramp to I-405 SB to Fairview Rd On-ramp Basic 31.1 F 31.4 F 70 0.8% Fairview Rd On-ramp Merge 34.4 F 34.7 F 80 0.8%Fairview Rd On-ramp to Bristol St Off-ramp Basic 39.0 F 39.6 F 80 0.8% Bristol St Off-ramp Diverge 27.4 F 27.7 F 80 0.7%Bristol St On-ramp to SR-55 NB Off-ramp Weave - F - F 90 0.7% On-ramp from SR-55 NB Basic 35.2 E 35.8 E 100 1.0%SR-55 SB On-ramp to MacArthur Blvd Off-ramp Weave - F - F 100 0.7% MacArthur Blvd On-ramp to Jamboree Rd Off-ramp Weave - F - F 90 0.7% Notes: 1. Freeway facilities operating below acceptable standards are noted in bold. 2. Analysis performed using the HCM 2010 methodology. 3. pc/mi/ln = passenger cars per mile per lane. 4. NB=Northbound; SB=Southbound Source: Transportation Impact Analysis, (Full data in Tables 8-27, 8-28, and 8-29), Fehr & Peers, 2014 TABLE 4.8-59
FREEWAY MAINLINE AND RAMPS OPERATIONS PHASE 3 ALTERNATIVE B – PM PEAK HOUR
Location Type
Without Project With Alternative B Density
(pc/mi/ln) LOS Density
(pc/mi/ln) LOS Project Trips
Percent Increase
Northbound SR-55 Fair Dr/Del Mar Ave/ Newport Blvd On-ramp to SR-73 Off-ramp Weave - F - F 50 0.7% Paularino Ave On-ramp Merge 15.7 F 16.0 F 50 1.6%Paularino Ave On-ramp to I-405 SB On-ramp Basic 16.7 F 17.0 F 50 1.6% On-ramp from I-405 SB Basic 16.2 F 16.4 F 50 1.3%

Transportation/Traffic
JOHN WAYNE AIRPORT SETTLEMENT AGREEMENT AMENDMENT 4.8-89 ENVIRONMENTAL IMPACT REPORT
TABLE 4.8-59 FREEWAY MAINLINE AND RAMPS OPERATIONS
PHASE 3 ALTERNATIVE B – PM PEAK HOUR Location Type
Without Project With Alternative B Density
(pc/mi/ln) LOS Density
(pc/mi/ln) LOS Project Trips
Percent IncreaseOn-ramp from I-405 NB to MacArthur Blvd Off-ramp Weave 25.5 F 27.3 F 250 4.1%
Southbound SR-55 MacArthur Blvd Loop On-ramp to MacArthur Blvd Direct On-ramp Basic 36.7 E 37.5 E 100 1.3% MacArthur Blvd Direct On-ramp to Off-ramp to I-405 SB Weave - F - F 140 1.3% On-ramp from I-405 NB to Off-ramp to SR-73 SB Weave - F - F 10 0.1% SR-73 SB On-ramp to Newport Blvd S/Mesa Dr Off-ramp Weave - F - F 20 0.2%
Northbound SR-73 Bristol St N Off-ramp Diverge 36.0 E 36.3 E 40 0.5%Bristol St N On-ramp to SR-55 N Off-ramp Weave - F - F 150 1.4% Off-ramp to SR-55 SB Diverge - F - F 150 1.6%On-ramp from SR-55 NB Weave - F - F 140 1.6%Southbound SR-73 On-ramp from SR-55 SB to Campus/Bristol St S Off-ramp Weave - F - F 70 0.9%
Northbound I-405 Culver St On-ramp to Jamboree Rd Off-ramp Basic 25.8 F 26.1 F 80 1.0% Jamboree Rd Off-ramp Diverge 18.5 F 18.7 F 80 0.9%Jamboree Rd Loop On-ramp Merge 24.0 F 24.3 F 80 1.1% Jamboree Rd Direct On-ramp to MacArthur Blvd Off-ramp Weave 40.5 F 41.4 F 90 1.0% MacArthur Blvd On-ramp to SR-55 NB & SB Off-ramp Weave - F - F 10 0.1% SR-55 Off-ramp to Bristol St Off-ramp Basic 26.5 F 26.6 F 0 0.0% Bristol St/Ave of the Arts Off-ramp Diverge 31.1 F 31.2 F 0 0.0%

Transportation/Traffic
4.8-90 JOHN WAYNE AIRPORT SETTLEMENT AGREEMENT AMENDMENT ENVIRONMENTAL IMPACT REPORT
TABLE 4.8-59 FREEWAY MAINLINE AND RAMPS OPERATIONS
PHASE 3 ALTERNATIVE B – PM PEAK HOUR Location Type
Without Project With Alternative B Density
(pc/mi/ln) LOS Density
(pc/mi/ln) LOS Project Trips
Percent IncreaseOn-ramp from SR-55 SB Basic 22.6 F 22.6 F 0 0.0%Bristol St N On-ramp Merge 21.5 F 21.5 F 0 0.0%Bristol St S On-ramp to S Coast Off Weave - F - F 0 0.0%
Southbound I-405 SR-55 SB On-ramp to MacArthur Blvd Off-ramp Weave - F - F 110 1.0% MacArthur Blvd On-ramp to Jamboree Rd Off-ramp Weave 44.4 E 45.6 E 90 0.8% Jamboree Rd Loop On-ramp Merge 22.5 F 22.3 F 90 1.4% Jamboree Rd Direct On-ramp Merge 22.8 F 23.5 F 120 1.6% Notes: 1. Freeway facilities operating below acceptable standards are noted in bold. 2. Analysis performed using the HCM 2010 methodology. 3. pc/mi/ln = passenger cars per mile per lane. 4. NB=Northbound; SB=Southbound Source: Transportation Impact Analysis, (Full data in Tables 8-30, 8-31, and 8-32), Fehr & Peers, 2014 Caltrans Ramp Queue Analysis A 95th percentile queue analysis has been prepared utilizing the Synchro 7 software to determine if adequate queue storage is provided at the off-ramp at MacArthur Boulevard and Jamboree Road under the Alternative B scenario. Adequate queue storage is forecast to be provided at the Caltrans off-ramp locations. The detailed analysis is provided in Table 11-3 in the Transportation Impact Analysis (Appendix G). Alternative C Existing Plus Alternative C For Alternative C, the Existing Plus Project analysis both understates and overstates impacts. As shown below, under the Existing Plus Alternative C scenario, Alternative C would result in significant impacts at two intersections and 11 Caltrans facilities. However, under the Phase 3 analysis, which also takes into account cumulative traffic growth and future road improvements, Alternative C would result in significant impacts at five intersections and eight Caltrans facilities. Thus, if used to measure significance, the Existing Plus Alternative C scenario would both understate and overstate project impacts. Therefore, the results of the Existing Plus Alternative C analysis in this case are misleading and, as such, are presented for information and disclosure purposes only.
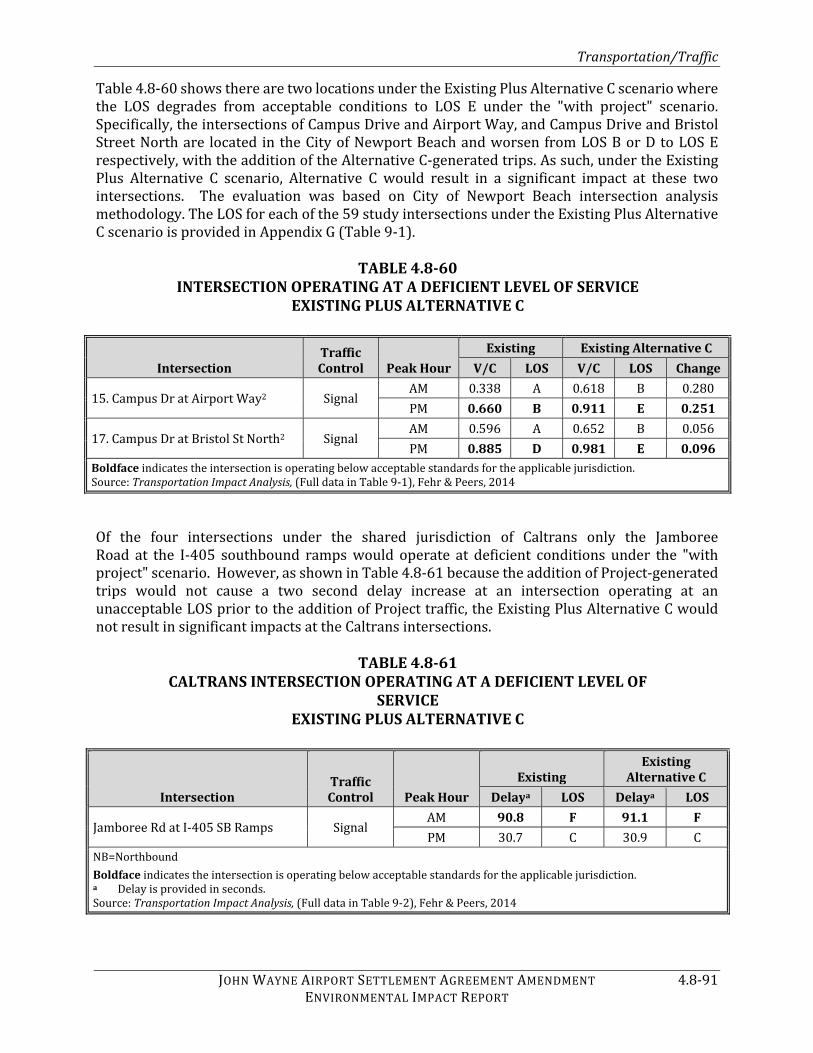
Transportation/Traffic
JOHN WAYNE AIRPORT SETTLEMENT AGREEMENT AMENDMENT 4.8-91 ENVIRONMENTAL IMPACT REPORT
Table 4.8-60 shows there are two locations under the Existing Plus Alternative C scenario where the LOS degrades from acceptable conditions to LOS E under the "with project" scenario. Specifically, the intersections of Campus Drive and Airport Way, and Campus Drive and Bristol Street North are located in the City of Newport Beach and worsen from LOS B or D to LOS E respectively, with the addition of the Alternative C-generated trips. As such, under the Existing Plus Alternative C scenario, Alternative C would result in a significant impact at these two intersections. The evaluation was based on City of Newport Beach intersection analysis methodology. The LOS for each of the 59 study intersections under the Existing Plus Alternative C scenario is provided in Appendix G (Table 9-1). TABLE 4.8-60
INTERSECTION OPERATING AT A DEFICIENT LEVEL OF SERVICE EXISTING PLUS ALTERNATIVE C
Intersection Traffic Control Peak Hour
Existing Existing Alternative CV/C LOS V/C LOS Change15. Campus Dr at Airport Way2 Signal AM 0.338 A 0.618 B 0.280PM 0.660 B 0.911 E 0.25117. Campus Dr at Bristol St North2 Signal AM 0.596 A 0.652 B 0.056PM 0.885 D 0.981 E 0.096
Boldface indicates the intersection is operating below acceptable standards for the applicable jurisdiction. Source: Transportation Impact Analysis, (Full data in Table 9-1), Fehr & Peers, 2014 Of the four intersections under the shared jurisdiction of Caltrans only the Jamboree Road at the I-405 southbound ramps would operate at deficient conditions under the "with project" scenario. However, as shown in Table 4.8-61 because the addition of Project-generated trips would not cause a two second delay increase at an intersection operating at an unacceptable LOS prior to the addition of Project traffic, the Existing Plus Alternative C would not result in significant impacts at the Caltrans intersections. TABLE 4.8-61
CALTRANS INTERSECTION OPERATING AT A DEFICIENT LEVEL OF SERVICE
EXISTING PLUS ALTERNATIVE C Intersection
Traffic Control Peak Hour
Existing Existing
Alternative C Delaya LOS Delaya LOSJamboree Rd at I-405 SB Ramps Signal AM 90.8 F 91.1 FPM 30.7 C 30.9 CNB=Northbound
Boldface indicates the intersection is operating below acceptable standards for the applicable jurisdiction. a Delay is provided in seconds. Source: Transportation Impact Analysis, (Full data in Table 9-2), Fehr & Peers, 2014

Transportation/Traffic
4.8-92 JOHN WAYNE AIRPORT SETTLEMENT AGREEMENT AMENDMENT ENVIRONMENTAL IMPACT REPORT
Table 4.8-62 identifies the freeway mainline and ramp locations that would operate at a deficient LOS on SR-55, SR-73, and I-405 during the AM peak hour. Table 4.8-63 identifies the freeway mainline and ramp locations that would operate at a deficient LOS during the PM peak hour for these same facilities. As shown in the tables, most of these facilities would operate at deficient levels of service without Alternative C-generated traffic. However, as shown on the tables, the Alternative C-generated trips would result in an increase of over 2 percent either causing or worsening a deficient LOS at multiple locations; therefore, there would be a significant cumulative impact under the Existing Plus Alternative C at the following locations: • Southbound SR-55: MacArthur Blvd Loop On-ramp to MacArthur Blvd Direct On-ramp (AM) • Southbound SR-55: MacArthur Blvd Direct On-ramp to Off-ramp to I-405 SB (AM) • Northbound SR-73: Bristol St N On-ramp to SR-55 N Off-ramp (AM) • Northbound SR-73: On-ramp from SR-55 NB (AM) • Northbound SR-55: Paularino Avenue On-ramp (PM) • Northbound SR-55: Paularino Avenue On-ramp to I-405 SB On-ramp (PM) • Northbound SR-55: On-ramp from I-405 NB to MacArthur Blvd Off-ramp (PM) • Northbound SR-73: Off-Ramp to SR-55 SB (PM) • Northbound SR-73: On-ramp From SR-55 NB (PM) • Southbound I-405: Jamboree Loop On-ramp (PM) • Southbound I-405: Jamboree Direct On-ramp (PM)
TABLE 4.8-62 FREEWAY MAINLINE AND RAMPS OPERATIONS
EXISTING PLUS ALTERNATIVE C – AM PEAK HOUR Location Type
Existing Existing With Alternative CDensity
(pc/mi/ln) LOS Density
(pc/mi/ln) LOS Project Trips
Percent Increase
Northbound SR-55 Fair Dr/Del Mar Ave/ Newport Blvd On-ramp to SR-73 Off-ramp Weave - F - F 30 0.3% Baker St Off-ramp to SR-73 On-ramp Basic 24.9 F 37.8 F 30 0.7% On-ramp from SR-73 NB to Off-ramp to I-405 SB Weave - F - F 30 0.4% Off-ramp to I-405 SB to Paularino Ave On-ramp Basic 28.3 F 44.7 F 20 0.4% Paularino Ave On-ramp Merge 29.6 D - F 30 0.6%Paularino Ave On-ramp to I-405 SB On-ramp Basic 34.3 D - F 30 0.6% On-ramp from I-405 SB Basic - F - F 30 0.4%

Transportation/Traffic
JOHN WAYNE AIRPORT SETTLEMENT AGREEMENT AMENDMENT 4.8-93 ENVIRONMENTAL IMPACT REPORT
TABLE 4.8-62 FREEWAY MAINLINE AND RAMPS OPERATIONS
EXISTING PLUS ALTERNATIVE C – AM PEAK HOUR Location Type
Existing Existing With Alternative CDensity
(pc/mi/ln) LOS Density
(pc/mi/ln) LOS Project Trips
Percent IncreaseOn-ramp from I-405 NB to MacArthur Blvd Off-ramp Weave - F - F 220 2.1%
Southbound SR-55 MacArthur Blvd Loop On-ramp to MacArthur Blvd Direct On-ramp Basic 34.1 D 35.3 E 160 2.1% MacArthur Blvd Direct On-ramp to Off-ramp to I-405 SB Weave - F - F 230 2.1% On-ramp from I-405 NB to Off-ramp to SR-73 SB Weave - F - F 20 0.2%
Northbound SR-73 Lane Drop to MacArthur Blvd On-ramp Basic 40.3 E 40.9 E 40 0.6% MacArthur Blvd On-ramp Basic 36.6 E 37.1 E 50 0.6%Jamboree Rd On-ramp Merge 34.8 D 35.1 E 60 0.7%Jamboree Rd On-ramp to Bristol St N Off-ramp Basic 23.7 C 43.7 E 60 1.0% Bristol St N Off-ramp Diverge 30.5 D - F 60 0.9%Bristol St N On-ramp to SR-55 N Off-ramp Weave 32.1 D - F 240 2.8% On-ramp from SR-55 NB Weave 33.1 D - F 180 3.4%Southbound SR-73 Bear St On-ramp to SR-55 S Off-ramp Weave 38.7 E 39.3 E 80 1.2% On-ramp from SR-55 SB to Campus/Bristol St S Off-ramp Weave - F - F 110 1.2%
Northbound I-405 Culver St On-ramp to Jamboree Rd Off-ramp Basic 42.7 E 43.8 E 120 1.1% Jamboree Rd Direct On-ramp to MacArthur Blvd Off-ramp Weave - F - F 100 0.8% MacArthur Blvd On-ramp to SR-55 NB & SB Off-ramp Weave 40.8 E 37.7 E 0 0.0% Bristol St S On-ramp to S Coast Off Weave - F - F 0 0.0%

Transportation/Traffic
4.8-94 JOHN WAYNE AIRPORT SETTLEMENT AGREEMENT AMENDMENT ENVIRONMENTAL IMPACT REPORT
TABLE 4.8-62 FREEWAY MAINLINE AND RAMPS OPERATIONS
EXISTING PLUS ALTERNATIVE C – AM PEAK HOUR Location Type
Existing Existing With Alternative CDensity
(pc/mi/ln) LOS Density
(pc/mi/ln) LOS Project Trips
Percent Increase
Southbound I-405 Off-ramp to I-405 SB to Fairview Rd On-ramp Basic 30.8 F 31.3 F 90 1.0% Fairview Rd On-ramp Merge 34.1 F 34.5 F 100 1.0%Fairview Rd On-ramp to Bristol St Off-ramp Basic 38.6 F 39.3 F 100 1.0% Bristol St Off-ramp Diverge 27.2 F 27.5 F 100 0.9%Bristol St On-ramp to SR-55 NB Off-ramp Weave - F - F 110 0.8% Lane Drop Basic 36.9 E 34.8 D 110 1.4%On-ramp from SR-55 NB Basic 37.0 E 35.3 E 120 1.2%SR-55 SB On-ramp to MacArthur Blvd Off-ramp Weave - F - F 120 0.8% MacArthur Blvd On-ramp to Jamboree Rd Off-ramp Weave - F - F 100 0.8% Notes: 1. Freeway facilities operating below acceptable standards are noted in bold. 2. Analysis performed using the HCM 2010 methodology. 3. pc/mi/ln = passenger cars per mile per lane. 4. NB=Northbound; SB=Southbound Source: Transportation Impact Analysis, (Full data in Tables 9-3, 9-4, and 9-5), Fehr & Peers, 2014 TABLE 4.8-63
PROJECT FREEWAY MAINLINE AND RAMPS OPERATIONS EXISTING PLUS ALTERNATIVE C – PM PEAK HOUR
Location Type
Existing Existing With Alternative CDensity
(pc/mi/ln) LOS Density
(pc/mi/ln) LOS Project Trips
Percent Increase
Northbound SR-55 Fair Dr/Del Mar Ave/Newport Blvd On-ramp to SR-73 Off-ramp Weave - F - F 60 0.8% Paularino Ave On-ramp Merge 14.9 F 15.9 F 60 2.1%Paularino Ave On-ramp to I-405 SB On-ramp Basic 15.9 F 16.9 F 60 2.1% On-ramp from I-405 SB Basic 15.5 F 16.3 F 60 1.6%

Transportation/Traffic
JOHN WAYNE AIRPORT SETTLEMENT AGREEMENT AMENDMENT 4.8-95 ENVIRONMENTAL IMPACT REPORT
TABLE 4.8-63 PROJECT FREEWAY MAINLINE AND RAMPS OPERATIONS
EXISTING PLUS ALTERNATIVE C – PM PEAK HOUR Location Type
Existing Existing With Alternative CDensity
(pc/mi/ln) LOS Density
(pc/mi/ln) LOS Project Trips
Percent IncreaseOn-ramp from I-405 NB to MacArthur Blvd Off-ramp Weave 23.0 F 27.7 F 320 5.7%
Southbound SR-55 MacArthur Blvd Loop On-ramp to MacArthur Blvd Direct On-ramp Basic 36.5 E 37.7 E 140 1.8% MacArthur Blvd Direct On-ramp to Off-ramp to I-405 SB Weave - F - F 180 1.7% On-ramp from I-405 NB to Off-ramp to SR-73 SB Weave - F - F 10 0.1% SR-73 SB On-ramp to Newport Blvd S/Mesa Dr Off-ramp Weave - F - F 30 0.3%
Northbound SR-73 Bristol St N Off-ramp Diverge 27.9 C 36.1 E 40 0.6%Bristol St N On-ramp to SR-55 N Off-ramp Weave - F - F 180 1.9% Off-ramp to SR-55 SB Diverge 35.5 E - F 180 2.3%On-ramp from SR-55 NB Weave - F - F 160 2.3%Southbound SR-73 On-ramp from SR-55 SB to Campus/Bristol St S Off-ramp Weave - F - F 80 1.1% Northbound I-405 Culver St On-ramp to Jamboree Rd Off-ramp Basic 25.5 F 25.9 F 110 1.5% Jamboree Rd Off-ramp Diverge 18.2 F 18.6 F 110 1.3%Jamboree Rd Loop On-ramp Merge 24.2 F 23.9 F 110 1.5% Jamboree Rd Direct On-ramp to MacArthur Blvd Off-ramp Weave 41.6 F 41.0 F 120 1.3% MacArthur Blvd On-ramp to SR-55 NB & SB Off-ramp Weave - F 43.2 F 20 0.2% SR-55 Off-ramp to Bristol St Off-ramp Basic 33.9 F 26.2 F 10 0.1% Bristol St/Ave of the Arts Off-ramp Diverge 36.1 F 31.0 F 10 0.1%

Transportation/Traffic
4.8-96 JOHN WAYNE AIRPORT SETTLEMENT AGREEMENT AMENDMENT ENVIRONMENTAL IMPACT REPORT
TABLE 4.8-63 PROJECT FREEWAY MAINLINE AND RAMPS OPERATIONS
EXISTING PLUS ALTERNATIVE C – PM PEAK HOUR Location Type
Existing Existing With Alternative CDensity
(pc/mi/ln) LOS Density
(pc/mi/ln) LOS Project Trips
Percent IncreaseOn-ramp from SR-55 SB Basic 27.2 F 22.3 F 0 0.0%Bristol St N On-ramp Merge 23.9 F 21.3 F 0 0.0%Bristol St S On-ramp to South Coast Off-ramp Weave - F - F 0 0.0%
Southbound I-405 SR-55 SB On-ramp to MacArthur Blvd Off-ramp Weave 43.6 E - F 140 1.3% MacArthur Blvd On-ramp to Jamboree Rd Off-ramp Weave 44.8 E 45.4 E 120 1.1% Jamboree Rd Loop On-ramp Merge 21.3 F 22.2 F 120 2.0% Jamboree Rd Direct On-ramp Merge 21.4 F 23.1 F 150 2.1% Notes: 1. Freeway facilities operating below acceptable standards are noted in bold. 2. Analysis performed using the HCM 2010 methodology. 3. pc/mi/ln = passenger cars per mile per lane. 4. NB=Northbound; SB=Southbound Source: Transportation Impact Analysis, (Full data in Tables 9-6, 9-7, and 9-8), Fehr & Peers, 2014 Phase 1 Table 4.8-64 shows there are three locations where there is a significant impact with Alternative C in Phase 1. As shown in the table, under this scenario, Alternative C would result in significant impacts at Intersections 4 (MacArthur Blvd. at Michelson Drive), 15 (Campus Drive at Airport Way), and 17 Campus Drive at Bristol Street North) all during the PM peak hour. The LOS evaluation for each of the 59 study intersections under Alternative C, Phase 1 is provided in Appendix G (Table 9-9).

Transportation/Traffic
JOHN WAYNE AIRPORT SETTLEMENT AGREEMENT AMENDMENT 4.8-97 ENVIRONMENTAL IMPACT REPORT
TABLE 4.8-64 INTERSECTION LEVEL OF SERVICE
PHASE 1 ALTERNATIVE C Intersection
Traffic Control Peak Hour
Without Project With Alternative C
V/C LOS V/C LOS Change4. MacArthur Blvd at Michelson Drive1 Signal AM 0.71 C 0.78 C 0.07PM 0.91 E 1.00 F 0.0915. Campus Dr at Airport Way2 Signal AM 0.346 A 0.625 B 0.279PM 0.682 B 0.936 E 0.25417. Campus Dr at Bristol St North Signal AM 0.614 B 0.626 B 0.012PM 0.916 E 1.011 F 0.095Boldface indicates the intersection is operating below acceptable standards for the applicable jurisdiction. Notes: Signalized intersections evaluated using ICU methodology. 1. Based on City of Irvine intersection analysis methodology. 2. Based on City of Newport Beach intersection analysis methodology. Source: Transportation Impact Analysis, (Full data in Table 9-9), Fehr & Peers, 2014 As with the Proposed Project and other alternatives, of the four intersections under shared jurisdiction with Caltrans only the Jamboree Road at the I-405 southbound ramps would operate at deficient conditions under the "with project" scenario. However, as shown in Table 4.8-65 because the addition of Alternative C-generated trips would not cause a two second delay increase at an intersection operating at an unacceptable LOS prior to the addition of Project traffic, Alternative C, Phase 1 would not result in significant impacts at the Caltrans intersections. This intersection is another instance where the overall intersection delay would improve at this location because Alternative C increases traffic to certain movements which have available capacity or “green time”. As previously discussed, since intersection delay is reported as a weighted average of all movements, this increase in traffic volume actually results in a reduction of overall intersection delay.
TABLE 4.8-65 CALTRANS INTERSECTION LEVEL OF SERVICE
PHASE 1 ALTERNATIVE C Intersection
Traffic Control Peak Hour
Without Project With Alternative CDelaya LOS Delaya LOSJamboree Rd at I-405 SB Ramps Signal AM 94.7 F 94.1 FPM 31.0 C 31.0 C
Boldface indicates the intersection is operating below acceptable standards for the applicable jurisdiction. a Delay is provided in seconds. Source: Transportation Impact Analysis, (Full data in Table 9-10), Fehr & Peers, 2014 Table 4.8-66 identifies the freeway mainline and ramp locations that would operate at a deficient LOS on SR-55, SR-73, and I-405 during the AM peak hour. Table 4.8-67 identifies the freeway

Transportation/Traffic
4.8-98 JOHN WAYNE AIRPORT SETTLEMENT AGREEMENT AMENDMENT ENVIRONMENTAL IMPACT REPORT
mainline and ramp locations that would operate at a deficient LOS during the PM peak hour for these same facilities. As shown in the tables, most of these facilities would operate at deficient levels of service without Alternative C-related traffic. However, the Alternative C, Phase 1-generated traffic would result in an increase of over 2 percent either causing or worsening a deficient LOS at several locations; therefore, the project would result in a significant cumulative impact at the following locations: • Southbound SR-55: MacArthur Blvd Loop On-ramp to MacArthur Blvd Direct On-ramp (AM) • Northbound SR-55: Paularino Avenue On-ramp (PM) • Northbound SR-55: Paularino Avenue On-ramp to I-405 SB On-ramp (PM) • Northbound SR-55: On-ramp from I-405 NB to MacArthur Blvd Off-ramp (PM) • Southbound SR-55: MacArthur Blvd Direct On-ramp to Off-ramp to I-405 SB (AM) • Southbound I-405: Jamboree Direct On-ramp (PM)
TABLE 4.8-66 FREEWAY MAINLINE AND RAMPS OPERATIONS
PHASE 1 ALTERNATIVE C – AM PEAK HOUR Location Type
Without Project With Alternative C Density
(pc/mi/ln) LOS Density
(pc/mi/ln) LOS Project Trips
Percent Increase
Northbound SR-55 Fair Dr/Del Mar Ave/ Newport Blvd On-ramp to SR-73 Off-ramp Weave - F - F 30 0.3% Baker St Off-ramp to SR-73 On-ramp Basic 37.7 F 38.0 F 30 0.5% On-ramp from SR-73 NB to Off-ramp to I-405 SB Weave - F - F 30 0.3% Off-ramp to I-405 SB to Paularino Ave On-ramp Basic 44.5 F 44.8 F 20 0.3% Paularino Ave On-ramp Merge - F - F 30 0.4%Paularino Ave On-ramp to I-405 SB On-ramp Basic - F - F 30 0.4% On-ramp from I-405 SB Basic - F - F 30 0.3%On-ramp from I-405 NB to MacArthur Blvd Off-ramp Weave - F - F 220 1.7%
Southbound SR-55 MacArthur Blvd Loop On-ramp to MacArthur Blvd Direct On-ramp Basic 34.2 D 35.3 E 160 2.1% MacArthur Blvd Direct On-ramp to Off-ramp to I-405 SB Weave - F - F 230 2.1%

Transportation/Traffic
JOHN WAYNE AIRPORT SETTLEMENT AGREEMENT AMENDMENT 4.8-99 ENVIRONMENTAL IMPACT REPORT
TABLE 4.8-66 FREEWAY MAINLINE AND RAMPS OPERATIONS
PHASE 1 ALTERNATIVE C – AM PEAK HOUR Location Type
Without Project With Alternative C Density
(pc/mi/ln) LOS Density
(pc/mi/ln) LOS Project Trips
Percent IncreaseOn-ramp from I-405 NB to Off-ramp to SR-73 SB Weave - F - F 20 0.2%
Northbound SR-73 Lane Drop to MacArthur Blvd On-ramp Basic 40.4 E 40.9 E 40 0.6% MacArthur Blvd On-ramp Basic 36.7 E 37.1 E 50 0.6%Jamboree Rd On-ramp Merge 34.9 D 35.2 E 60 0.7%Jamboree Rd On-ramp to Bristol St N Off-ramp Basic 43.2 E 43.8 E 60 0.7% Bristol St N Off-ramp Diverge - F - F 60 0.6%Bristol St N On-ramp to SR-55 N Off-ramp Weave - F - F 240 2.3% On-ramp from SR-55 NB Weave - F - F 180 2.5%Southbound SR-73 Bear St On-ramp to SR-55 S Off-ramp Weave 38.8 E 39.5 E 80 1.2% On-ramp from SR-55 SB to Campus/Bristol St S Off-ramp Weave - F - F 110 1.1%
Northbound I-405 Culver St On-ramp to Jamboree Rd Off-ramp Basic 42.8 E 43.9 E 120 1.1% Jamboree Rd Direct On-ramp to MacArthur Blvd Off-ramp Weave - F - F 100 0.8% MacArthur Blvd On-ramp to SR-55 NB & SB Off-ramp Weave 37.5 E 37.6 E 0 0.0% Bristol St S On-ramp to South Coast Off-ramp Weave - F - F 0 0.0%
Southbound I-405 Off-ramp to I-405 SB to Fairview Rd On-ramp Basic 30.9 F 31.4 F 90 1.0% Fairview Rd On-ramp Merge 34.2 F 34.6 F 100 1.0%Fairview Rd On-ramp to Bristol St Off-ramp Basic 38.8 F 39.5 F 100 1.0% Bristol St Off-ramp Diverge 27.3 F 27.6 F 100 0.9%Bristol St On-ramp to SR-55 NB Off-ramp Weave - F - F 110 0.9% On-ramp from SR-55 NB Basic 34.8 D 35.5 E 120 1.3%

Transportation/Traffic
4.8-100 JOHN WAYNE AIRPORT SETTLEMENT AGREEMENT AMENDMENT ENVIRONMENTAL IMPACT REPORT
TABLE 4.8-66 FREEWAY MAINLINE AND RAMPS OPERATIONS
PHASE 1 ALTERNATIVE C – AM PEAK HOUR Location Type
Without Project With Alternative C Density
(pc/mi/ln) LOS Density
(pc/mi/ln) LOS Project Trips
Percent IncreaseSR-55 SB On-ramp to MacArthur Blvd Off-ramp Weave - F - F 120 0.9% MacArthur Blvd On-ramp to Jamboree Rd Off-ramp Weave - F - F 100 0.8% Notes: 1. Freeway facilities operating below acceptable standards are noted in bold. 2. Analysis performed using the HCM 2010 methodology. 3. pc/mi/ln = passenger cars per mile per lane. 4. NB=Northbound; SB=Southbound Source: Transportation Impact Analysis, (Full data in Tables 9-11, 9-12, and 9-13), Fehr & Peers, 2014
TABLE 4.8-67 PROJECT FREEWAY MAINLINE AND RAMPS OPERATIONS
PHASE 1 ALTERNATIVE C – PM PEAK HOUR
Location Type
Without Project With Alternative C Density
(pc/mi/ln) LOS Density
(pc/mi/ln) LOS Project Trips
Percent Increase
Northbound SR-55 Fair Dr/Del Mar Ave/Newport Blvd On-ramp to SR-73 Off-ramp Weave - F - F 60 0.8% Paularino Ave On-ramp Merge 15.7 F 16.0 F 60 2.0%Paularino Ave On-ramp to I-405 SB On-ramp Basic 16.7 F 17.0 F 60 2.0% On-ramp from I-405 SB Basic 16.2 F 16.4 F 60 1.5%On-ramp from I-405 NB to MacArthur Blvd Off-ramp Weave 25.5 F 27.9 F 320 5.2%
Southbound SR-55 MacArthur Blvd Loop On-ramp to MacArthur Blvd Direct On-ramp Basic 36.6 E 37.7 E 140 1.8% MacArthur Blvd Direct On-ramp to Off-ramp to I-405 SB Weave - F - F 180 1.7% On-ramp from I-405 NB to Off-ramp to SR-73 SB Weave - F - F 10 0.1%

Transportation/Traffic
JOHN WAYNE AIRPORT SETTLEMENT AGREEMENT AMENDMENT 4.8-101 ENVIRONMENTAL IMPACT REPORT
TABLE 4.8-67 PROJECT FREEWAY MAINLINE AND RAMPS OPERATIONS
PHASE 1 ALTERNATIVE C – PM PEAK HOUR
Location Type
Without Project With Alternative C Density
(pc/mi/ln) LOS Density
(pc/mi/ln) LOS Project Trips
Percent IncreaseSR-73 SB On-ramp to Newport Blvd S/Mesa Dr Off-ramp Weave - F - F 30 0.3%
Northbound SR-73 Bristol St N Off-ramp Diverge 35.9 E 36.2 E 40 0.5%Bristol St N On-ramp to SR-55 N Off-ramp Weave - F - F 180 1.7% Off-ramp to SR-55 SB Diverge - F - F 180 1.9%On-ramp from SR-55 NB Weave - F - F 160 1.9%Southbound SR-73 On-ramp from SR-55 SB to Campus/Bristol St S Off-ramp Weave - F - F 80 1.0% Northbound I-405 Culver St On-ramp to Jamboree Rd Off-ramp Basic 25.6 F 26.0 F 110 1.5% Jamboree Rd Off-ramp Diverge 18.3 F 18.6 F 110 1.3%Jamboree Rd Loop On-ramp Merge 23.8 F 24.1 F 110 1.5% Jamboree Rd Direct On-ramp to MacArthur Blvd Off-ramp Weave 40.1 F 41.3 F 120 1.3% MacArthur Blvd On-ramp to SR-55 NB & SB Off-ramp Weave - F - F 20 0.2% SR-55 Off-ramp to Bristol St Off-ramp Basic 26.4 F 26.5 F 10 0.2% Bristol St/Ave of the Arts Off-ramp Diverge 31.0 F 31.2 F 10 0.1% On-ramp from SR-55 SB Basic 22.5 F 22.5 F 0 0.0%Bristol St N On-ramp Merge 21.4 F 21.4 F 0 0.0%Bristol St S On-ramp to South Coast Off-ramp Weave - F - F 0 0.0% Southbound I-405 SR-55 SB On-ramp to MacArthur Blvd Off-ramp Weave - F - F 140 1.3% MacArthur Blvd On-ramp to Jamboree Rd Off-ramp Weave 44.2 E 45.6 E 120 1.1%

Transportation/Traffic
4.8-102 JOHN WAYNE AIRPORT SETTLEMENT AGREEMENT AMENDMENT ENVIRONMENTAL IMPACT REPORT
TABLE 4.8-67 PROJECT FREEWAY MAINLINE AND RAMPS OPERATIONS
PHASE 1 ALTERNATIVE C – PM PEAK HOUR
Location Type
Without Project With Alternative C Density
(pc/mi/ln) LOS Density
(pc/mi/ln) LOS Project Trips
Percent IncreaseJamboree Rd Loop On-ramp Merge 22.4 F 22.3 F 120 1.8% Jamboree Rd Direct On-ramp Merge 22.6 F 23.3 F 150 2.0% Notes: 1. Freeway facilities operating below acceptable standards are noted in bold. 2. Analysis performed using the HCM 2010 methodology. 3. pc/mi/ln = passenger cars per mile per lane. 4. NB=Northbound; SB=Southbound Source: Transportation Impact Analysis, (Full data in Tables 9-14, 9-15, and 9-16), Fehr & Peers, 2014 Phase 2 Table 4.8-68 shows with Alternative C, Phase 2 there would be a significant impact at Intersections 4 (MacArthur Blvd at Michelson Drive), 15 (Campus Drive at Airport Way) and 17 (Campus Drive at Bristol Street North), all during the PM peak hour. The LOS evaluation for each of the 59 study intersections under Alternative C, Phase 2 is provided in Appendix G (Table 9-17).
TABLE 4.8-68 INTERSECTION LEVEL OF SERVICE
PHASE 2 ALTERNATIVE C Intersection
Traffic Control Peak Hour
Without Project With Alternative C
V/C LOS V/C LOS Change4. MacArthur Blvd at Michelson Drive1 Signal AM 0.74 C 0.81 D 0.07PM 0.94 E 1.03 F 0.0915. Campus Dr at Airport Way2 Signal AM 0.354 A 0.633 B 0.279PM 0.703 C 0.957 E 0.25417. Campus Dr at Bristol St North Signal AM 0.641 B 0.694 B 0.053PM 0.964 E 1.059 F 0.095Boldface indicates the intersection is operating below acceptable standards for the applicable jurisdiction. Notes: Signalized intersections evaluated using ICU methodology. 1. Based on City of Irvine intersection analysis methodology. 2. Based on City of Newport Beach intersection analysis methodology. Source: Transportation Impact Analysis, (Full data in Table 9-17), Fehr & Peers, 2014 As with the Proposed Project, with Alternative C, Phase 2 the only intersection under shared jurisdiction with Caltrans that would operate at deficient conditions under the "with project"

Transportation/Traffic
JOHN WAYNE AIRPORT SETTLEMENT AGREEMENT AMENDMENT 4.8-103 ENVIRONMENTAL IMPACT REPORT
scenario would be the Jamboree Road at the I-405 southbound ramps. However, as shown in Table 4.8-69 this intersection would not be adversely impacted by Alternative C. With the addition of Alternative C-generated trips the overall intersection delay would improve at the Jamboree Road/I-405 southbound ramps during the AM peak hour because Alternative C, Phase 2 would increase traffic to the movements that have available capacity or “green time”. As previously indicated, since intersection delay is reported as a weighted average of all movements, this increase in traffic volume actually results in a reduction of overall intersection delay. TABLE 4.8-69
CALTRANS INTERSECTION LEVEL OF SERVICE PHASE 2 ALTERNATIVE C
Intersection Traffic Control Peak Hour
Without Project With
Alternative C Delaya LOS Delaya LOSJamboree Rd at I-405 Southbound Ramps Signal AM 99.7 F 99.2 FPM 30.8 C 30.8 C
Boldface indicates the intersection is operating below acceptable standards for the applicable jurisdiction. a Delay is provided in seconds. Source: Transportation Impact Analysis, (Full data in Table 9-18), Fehr & Peers, 2014 Table 4.8-70 identifies the freeway mainline and ramp locations that would operate at a deficient LOS on SR-55, SR-73, and I-405 during the AM peak hour. Table 4.8-71 identifies the freeway mainline and ramp locations that would operate at a deficient LOS during the PM peak hour for these same facilities. As shown in the tables, most of these facilities would operate at deficient levels of service without Alternative C-generated traffic. However, Alternative C, Phase 2 would result in an increase of over 2 percent either causing or worsening a deficient LOS at several locations; therefore, the Project would result in a significant cumulative impact at the following locations:
• Southbound SR-55: MacArthur Blvd Loop On-ramp to MacArthur Blvd Direct On-ramp (AM) • Northbound SR-55: Paularino Avenue On-ramp (PM) • Northbound SR-55: Paularino Avenue On-ramp to I-405 SB On-ramp (PM) • Northbound SR-55: On-ramp from I-405 NB to MacArthur Blvd Off-ramp (PM) • Southbound SR-55: MacArthur Blvd Direct On-ramp to Off-ramp to I-405 SB (AM) • Northbound SR-73: Bristol St. N On-ramp to SR-55 N Off-ramp (AM) • Northbound SR-73: On-ramp From SR-55 NB (AM) • Southbound I-405: Jamboree Direct On-ramp (PM)
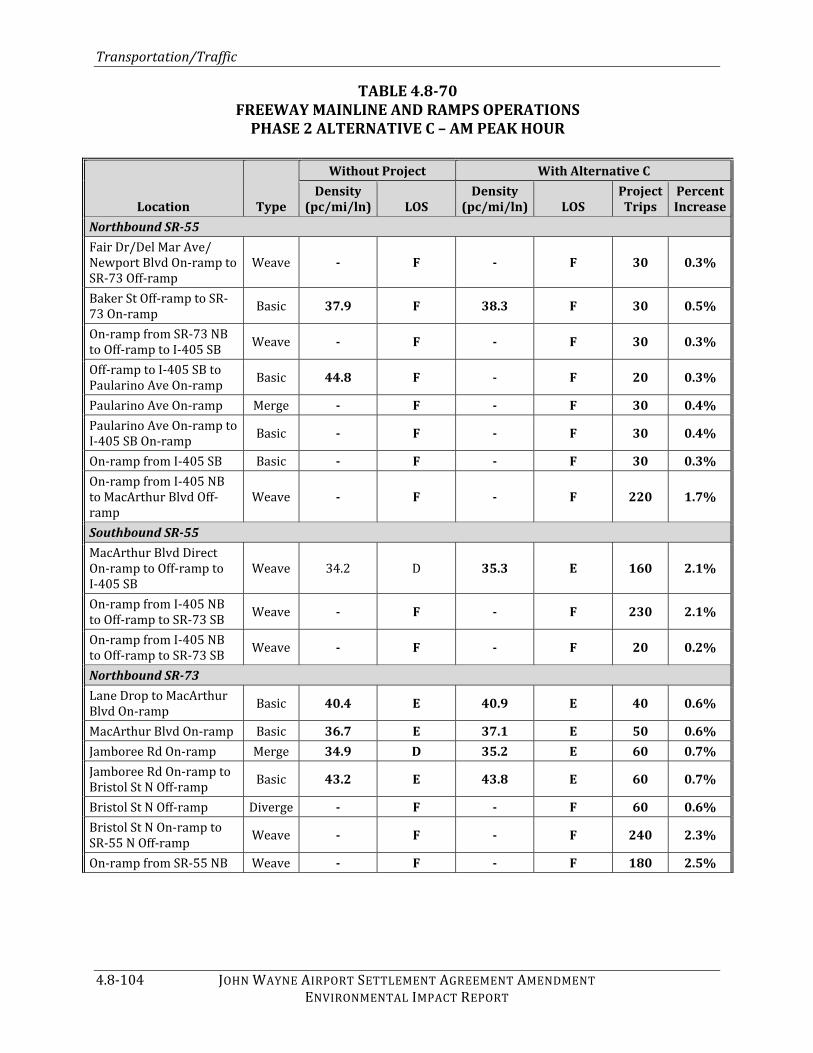
Transportation/Traffic
4.8-104 JOHN WAYNE AIRPORT SETTLEMENT AGREEMENT AMENDMENT ENVIRONMENTAL IMPACT REPORT
TABLE 4.8-70 FREEWAY MAINLINE AND RAMPS OPERATIONS
PHASE 2 ALTERNATIVE C – AM PEAK HOUR Location Type
Without Project With Alternative C Density
(pc/mi/ln) LOS Density
(pc/mi/ln) LOS Project Trips
Percent Increase
Northbound SR-55 Fair Dr/Del Mar Ave/ Newport Blvd On-ramp to SR-73 Off-ramp Weave - F - F 30 0.3% Baker St Off-ramp to SR-73 On-ramp Basic 37.9 F 38.3 F 30 0.5% On-ramp from SR-73 NB to Off-ramp to I-405 SB Weave - F - F 30 0.3% Off-ramp to I-405 SB to Paularino Ave On-ramp Basic 44.8 F - F 20 0.3% Paularino Ave On-ramp Merge - F - F 30 0.4%Paularino Ave On-ramp to I-405 SB On-ramp Basic - F - F 30 0.4% On-ramp from I-405 SB Basic - F - F 30 0.3%On-ramp from I-405 NB to MacArthur Blvd Off-ramp Weave - F - F 220 1.7%
Southbound SR-55 MacArthur Blvd Direct On-ramp to Off-ramp to I-405 SB Weave 34.2 D 35.3 E 160 2.1% On-ramp from I-405 NB to Off-ramp to SR-73 SB Weave - F - F 230 2.1% On-ramp from I-405 NB to Off-ramp to SR-73 SB Weave - F - F 20 0.2%
Northbound SR-73 Lane Drop to MacArthur Blvd On-ramp Basic 40.4 E 40.9 E 40 0.6% MacArthur Blvd On-ramp Basic 36.7 E 37.1 E 50 0.6%Jamboree Rd On-ramp Merge 34.9 D 35.2 E 60 0.7%Jamboree Rd On-ramp to Bristol St N Off-ramp Basic 43.2 E 43.8 E 60 0.7% Bristol St N Off-ramp Diverge - F - F 60 0.6%Bristol St N On-ramp to SR-55 N Off-ramp Weave - F - F 240 2.3% On-ramp from SR-55 NB Weave - F - F 180 2.5%

Transportation/Traffic
JOHN WAYNE AIRPORT SETTLEMENT AGREEMENT AMENDMENT 4.8-105 ENVIRONMENTAL IMPACT REPORT
TABLE 4.8-70 FREEWAY MAINLINE AND RAMPS OPERATIONS
PHASE 2 ALTERNATIVE C – AM PEAK HOUR Location Type
Without Project With Alternative C Density
(pc/mi/ln) LOS Density
(pc/mi/ln) LOS Project Trips
Percent Increase
Southbound SR-73 Bear St On-ramp to SR-55 S Off-ramp Weave 38.9 E 39.6 E 80 1.2% On-ramp from SR-55 SB to Campus/Bristol St S Off-ramp Weave - F - F 110 1.1%
Northbound I-405 Culver St On-ramp to Jamboree Rd Off-ramp Basic 42.9 E 44.0 E 120 1.1% Jamboree Rd Direct On-ramp to MacArthur Blvd Off-ramp Weave - F - F 100 0.8% MacArthur Blvd On-ramp to SR-55 NB & SB Off-ramp Weave 37.6 E 37.6 E 0 0.0% Bristol St S On-ramp to South Coast Off-ramp Weave - F - F 0 0.0%
Southbound I-405 Off-ramp to I-405 SB to Fairview Rd On-ramp Basic 31.0 F 31.5 F 90 1.0% Fairview Rd On-ramp Merge 34.3 F 34.7 F 100 1.0%Fairview Rd On-ramp to Bristol St Off-ramp Basic 39.0 F 39.7 F 100 1.0% Bristol St Off-ramp Diverge 27.4 F 27.7 F 100 0.9%Bristol St On-ramp to SR-55 NB Off-ramp Weave - F - F 110 0.9% Lane Drop Basic 34.4 D 35.2 E 110 1.4%On-ramp from SR-55 NB Basic 35.0 E 35.8 E 120 1.2%SR-55 SB On-ramp to MacArthur Blvd Off-ramp Weave - F - F 120 0.9% MacArthur Blvd On-ramp to Jamboree Rd Off-ramp Weave - F - F 100 0.8% Notes: 1. Freeway facilities operating below acceptable standards are noted in bold. 2. Analysis performed using the HCM 2010 methodology. 3. pc/mi/ln = passenger cars per mile per lane. 4. NB=Northbound; SB=Southbound Source: Transportation Impact Analysis, (Full data in Tables 9-19, 9-20, and 9-21), Fehr & Peers, 2014

Transportation/Traffic
4.8-106 JOHN WAYNE AIRPORT SETTLEMENT AGREEMENT AMENDMENT ENVIRONMENTAL IMPACT REPORT
TABLE 4.8-71 FREEWAY MAINLINE AND RAMPS OPERATIONS
PHASE 2 ALTERNATIVE C – PM PEAK HOUR Location Type
Without Project With Alternative C Density
(pc/mi/ln) LOS Density
(pc/mi/ln) LOS Project Trips
Percent Increase
Northbound SR-55 Fair Dr/Del Mar Ave/ Newport Blvd On-ramp to SR-73 Off-ramp Weave - F - F 60 0.8% Paularino Ave On-ramp Merge 15.7 F 16.0 F 60 2.0%Paularino Ave On-ramp to I-405 SB On-ramp Basic 16.7 F 17.0 F 60 2.0% On-ramp from I-405 SB Basic 16.2 F 16.4 F 60 1.5%On-ramp from I-405 NB to MacArthur Blvd Off-ramp Weave 25.5 F 27.9 F 320 5.2%
Southbound SR-55 MacArthur Blvd Loop On-ramp to MacArthur Blvd Direct On-ramp Basic 36.6 E 37.7 E 140 1.8% MacArthur Blvd Direct On-ramp to Off-ramp to I-405 SB Weave - F - F 180 1.7% On-ramp from I-405 NB to Off-ramp to SR-73 SB Weave - F - F 10 0.1% SR-73 SB On-ramp to Newport Blvd S/Mesa Dr Off-ramp Weave - F - F 30 0.3%
Northbound SR-73 Bristol St N Off-ramp Diverge 35.9 E 36.2 E 40 0.5%Bristol St N On-ramp to SR-55 N Off-ramp Weave - F - F 180 1.7% Off-ramp to SR-55 SB Diverge - F - F 180 1.9%On-ramp from SR-55 NB Weave - F - F 160 1.9%Southbound SR-73 On-ramp from SR-55 SB to Campus/Bristol St S Off-ramp Weave - F - F 80 1.0%
Northbound I-405 Culver St On-ramp to Jamboree Rd Off-ramp Basic 25.6 F 26.1 F 110 1.4% Jamboree Rd Off-ramp Diverge 18.4 F 18.7 F 110 1.3%Jamboree Rd Loop On-ramp Merge 23.9 F 24.2 F 110 1.5%

Transportation/Traffic
JOHN WAYNE AIRPORT SETTLEMENT AGREEMENT AMENDMENT 4.8-107 ENVIRONMENTAL IMPACT REPORT
TABLE 4.8-71 FREEWAY MAINLINE AND RAMPS OPERATIONS
PHASE 2 ALTERNATIVE C – PM PEAK HOUR Location Type
Without Project With Alternative C Density
(pc/mi/ln) LOS Density
(pc/mi/ln) LOS Project Trips
Percent IncreaseJamboree Rd Direct On-ramp to MacArthur Blvd Off-ramp Weave 40.2 F 41.4 F 120 1.3% MacArthur Blvd On-ramp to SR-55 NB & SB Off-ramp Weave - F - F 20 0.2% SR-55 Off-ramp to Bristol St Off-ramp Basic 26.4 F 26.5 F 10 0.2% Bristol St/Ave of the Arts Off-ramp Diverge 31.1 F 31.2 F 10 0.1% On-ramp from SR-55 SB Basic 22.5 F 22.5 F 0 0.0%Bristol St N On-ramp Merge 21.4 F 21.4 F 0 0.0%Bristol St S On-ramp to South Coast Off-ramp Weave - F - F 0 0.0%
Southbound I-405 SR-55 SB On-ramp to MacArthur Blvd Off-ramp Weave - F - F 140 1.3% MacArthur Blvd On-ramp to Jamboree Rd Off-ramp Weave 44.3 E 45.7 E 120 1.1% Jamboree Rd Loop On-ramp Merge 22.4 F 22.3 F 120 1.8% Jamboree Rd Direct On-ramp Merge 22.7 F 23.5 F 150 2.0% Notes: 1. Freeway facilities operating below acceptable standards are noted in bold. 2. Analysis performed using the HCM 2010 methodology. 3. pc/mi/ln = passenger cars per mile per lane. 4. NB=Northbound; SB=Southbound Source: Transportation Impact Analysis, (Full data in Tables 9-22, 9-23, and 9-24), Fehr & Peers, 2014 Phase 3 Table 4.8-72 shows the intersection LOS with Alternative C, Phase 3 and that there would be significant impacts at Intersections 4 (MacArthur Blvd. at Michelson Drive), 15 (Campus Drive at Airport Way), 17 (Campus Drive at Bristol Street North), 25 (Santa Ana Avenue at Del Mar Avenue), and 53 (Von Karman Avenue at Alton Parkway), during the PM peak hour. The evaluation methodology used for assessing the impact corresponds to the jurisdiction in which the intersection is located and is noted in the table. Though Intersection 52 (Von Karman Avenue at Barranca Parkway) is projected to operate at a deficient LOS, it is not considered a significant Project-related impact because the threshold for

Transportation/Traffic
4.8-108 JOHN WAYNE AIRPORT SETTLEMENT AGREEMENT AMENDMENT ENVIRONMENTAL IMPACT REPORT
intersections in the Irvine Business Complex is the Project-generated trips must increase the ICU by 0.02 or more at a study intersection operating at LOS E or F under baseline conditions. Alternative C only increases the ICU at this study intersection by 0.01. Similarly, Intersection 25 (Santa Ana Avenue at Del Mar Avenue) is projected to operate at a deficient LOS with or without Alternative C in the AM peak hour. Though the intersection would receive additional traffic associated with the Alternative C, project traffic would not reduce the LOS at this intersection and, therefore, impacts would be less than significant. The LOS evaluation for each of the 59 study intersections under Alternative C, Phase 3 is provided in Appendix G (Table 9-25). TABLE 4.8-72
INTERSECTION LEVEL OF SERVICE PHASE 3 ALTERNATIVE C
Intersection Traffic Control Peak Hour
Without Project With Alternative C
V/C LOS V/C LOS Change4. MacArthur Blvd at Michelson Drive1 Signal AM 0.77 C 0.84 D 0.07PM 0.98 E 1.07 F 0.0915. Campus Dr at Airport Way2 Signal AM 0.362 A 0.642 B 0.280PM 0.723 C 0.982 E 0.25917. Campus Dr at Bristol St North2 Signal AM 0.666 B 0.721 C 0.055PM 1.009 F 1.105 F 0.09625. Santa Ana Ave at Del Mar Ave3,5 Stop Controlled AM 36.3 E 48.3 E N/APM 28.1 D 35.0 E N/A49. Red Hill Ave at Dyer Rd1 Signal AM 0.55 A 0.57 A 0.02PM 0.92 E 0.92 E 0.0050. Red Hill Ave at Alton Pkwy1 Signal AM 0.87 D 0.88 D 0.01PM 0.90 D 0.91 E 0.0152. Von Karman Ave at Barranca Pkwy1 Signal AM 0.83 D 0.84 D 0.01PM 1.06 F 1.07 F 0.0153. Von Karman Ave at Alton Pkwy1 Signal AM 0.83 D 0.84 D 0.01PM 0.99 E 1.01 F 0.02Boldface indicates the intersection is operating below acceptable standards for the applicable jurisdiction. Notes: Signalized intersections evaluated using ICU methodology. 1. Based on City of Irvine intersection analysis methodology. 2. Based on City of Newport Beach intersection analysis methodology. 3. Based on City of Costa Mesa intersection analysis methodology. 4. AWSC = All Way Stop Control; average intersection delay is reported. Source: Transportation Impact Analysis, (Full data in Table 9-25), Fehr & Peers, 2014 Of the four intersections under the shared jurisdiction of Caltrans only the Jamboree Road at the I-405 southbound ramps would operate at deficient conditions under the "with project" scenario. However, as shown in Table 4.8-73 this intersection would not be impacted by Alternative C, Phase 3. With the addition of Alternative C-generated trips the overall intersection delay would improve at the Jamboree Road/I-405 southbound ramps during the AM peak hour because Alternative C, Phase 3 would increase traffic to the movements that have

Transportation/Traffic
JOHN WAYNE AIRPORT SETTLEMENT AGREEMENT AMENDMENT 4.8-109 ENVIRONMENTAL IMPACT REPORT
available capacity or “green time”. As previously indicated, since intersection delay is reported as a weighted average of all movements, this increase in traffic volume actually results in a reduction of overall intersection delay. Because the addition of Alternative C, Phase 3-generated trips would not cause the LOS to degrade from acceptable to unacceptable LOS, and because Project trips would not cause a 2 second delay increase at an intersection operating at an unacceptable LOS prior to the addition of Project traffic, under this scenario, the Project would not result in significant impacts at the Caltrans intersections. TABLE 4.8-73
CALTRANS INTERSECTION LEVEL OF SERVICE PHASE 3 ALTERNATIVE C
Intersection Traffic Control Peak Hour
Without Project With Alternative CDelaya LOS Delaya LOSJamboree Rd at I-405 Southbound Ramps Signal AM 106.3 F 106.0 FPM 30.7 C 30.7 C
Boldface indicates the intersection is operating below acceptable standards for the applicable jurisdiction. a Delay is provided in seconds. Source: Transportation Impact Analysis, (Full data in Table 9-26), Fehr & Peers, 2014 Table 4.8-74 identifies the freeway mainline and ramp locations that would operate at a deficient LOS on SR-55, SR-73, and I-405 during the AM peak hour. Table 4.8-75 identifies the freeway mainline and ramp locations that would operate at a deficient LOS during the PM peak hour for these same facilities. As shown in the tables, most of these facilities would operate at deficient levels of service without project traffic. However, Alternative C, Phase 3 would result in an increase of over 2 percent either causing or worsening a deficient LOS at several locations; therefore, the project would result in a significant cumulative impact at the following locations:
• Southbound SR-55: MacArthur Blvd Loop On-ramp to MacArthur Blvd Direct On-ramp (AM) • Northbound SR-55: Paularino Avenue On-ramp (PM) • Northbound SR-55: Paularino Avenue On-ramp to I-405 SB On-ramp (PM) • Northbound SR-55: On-ramp from I-405 NB to MacArthur Blvd Off-ramp (PM) • Southbound SR-55: MacArthur Blvd Direct On-ramp to Off-ramp to I-405 SB (AM) • Northbound SR-73: Bristol St. N On-ramp to SR-55 N Off-ramp (AM) • Northbound SR-73: On-ramp From SR-55 NB (AM) • Southbound I-405: Jamboree Direct On-ramp (PM)

Transportation/Traffic
4.8-110 JOHN WAYNE AIRPORT SETTLEMENT AGREEMENT AMENDMENT ENVIRONMENTAL IMPACT REPORT
TABLE 4.8-74 FREEWAY MAINLINE AND RAMPS OPERATIONS
PHASE 3 ALTERNATIVE C – AM PEAK HOUR Location Type
Without Project With Alternative C Density
(pc/mi/ln) LOS Density
(pc/mi/ln) LOS Project Trips
Percent Increase
Northbound SR-55 Fair Dr/Del Mar Ave/ Newport Blvd On-ramp to SR-73 Off-ramp Weave - F - F 30 0.3% Baker St Off-ramp to SR-73 On-ramp Basic 38.0 F 38.4 F 30 0.5% On-ramp from SR-73 NB to Off-ramp to I-405 SB Weave - F - F 30 0.3% Off-ramp to I-405 SB to Paularino Ave On-ramp Basic 45.0 F - F 20 0.3% Paularino Ave On-ramp Merge - F - F 30 0.4%Paularino Ave On-ramp to I-405 SB On-ramp Basic - F - F 30 0.4% On-ramp from I-405 SB Basic - F - F 30 0.3%On-ramp from I-405 NB to MacArthur Blvd Off-ramp Weave - F - F 220 1.7%
Southbound SR-55 MacArthur Blvd Loop On-ramp to MacArthur Blvd Direct On-ramp Basic 34.2 D 35.3 E 160 2.1% MacArthur Blvd Direct On-ramp to Off-ramp to I-405 SB Weave - F - F 230 2.1% On-ramp from I-405 NB to Off-ramp to SR-73 SB Weave - F - F 20 0.2%
Northbound SR-73 Lane Drop to MacArthur Blvd On-ramp Basic 40.5 E 41.0 E 40 0.6% MacArthur Blvd On-ramp Basic 36.8 E 37.2 E 50 0.6%Jamboree Rd On-ramp Merge 35.0 D 35.2 E 60 0.7%Jamboree Rd On-ramp to Bristol St N Off-ramp Basic 43.3 E 44.0 E 60 0.7% Bristol St N Off-ramp Diverge - F - F 60 0.6%Bristol St N On-ramp to SR-55 N Off-ramp Weave - F - F 240 2.3% On-ramp from SR-55 NB Weave - F - F 180 2.5%
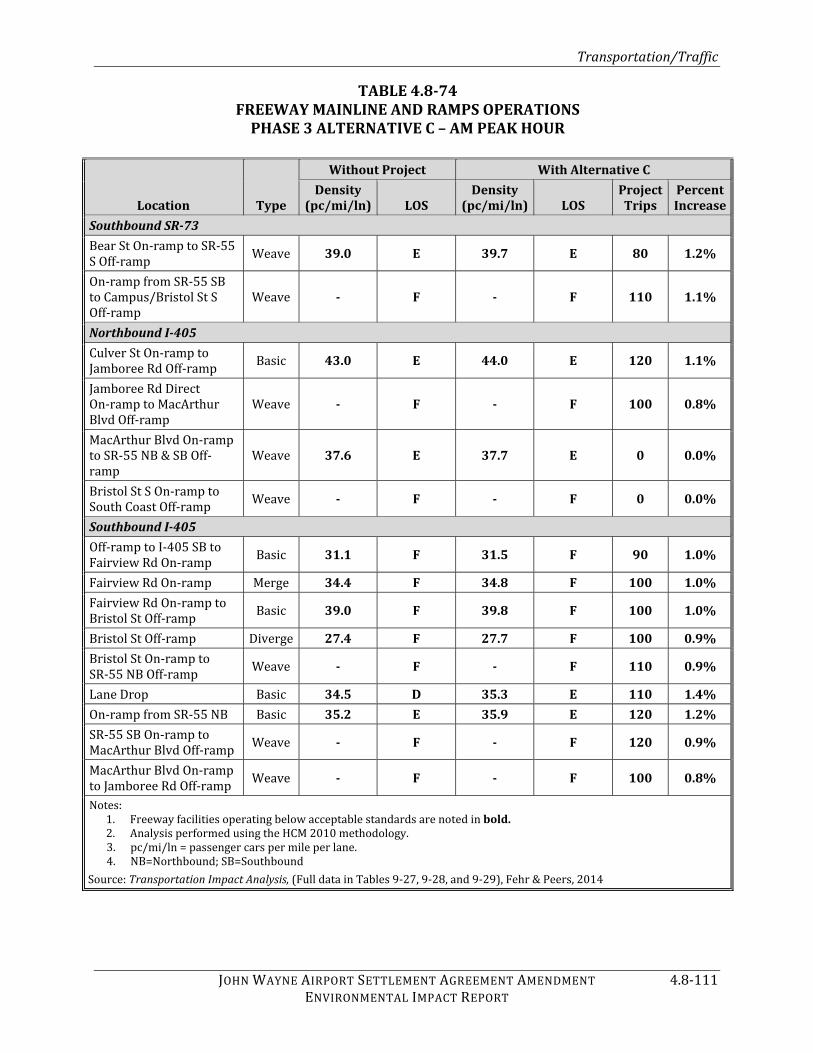
Transportation/Traffic
JOHN WAYNE AIRPORT SETTLEMENT AGREEMENT AMENDMENT 4.8-111 ENVIRONMENTAL IMPACT REPORT
TABLE 4.8-74 FREEWAY MAINLINE AND RAMPS OPERATIONS
PHASE 3 ALTERNATIVE C – AM PEAK HOUR Location Type
Without Project With Alternative C Density
(pc/mi/ln) LOS Density
(pc/mi/ln) LOS Project Trips
Percent Increase
Southbound SR-73 Bear St On-ramp to SR-55 S Off-ramp Weave 39.0 E 39.7 E 80 1.2% On-ramp from SR-55 SB to Campus/Bristol St S Off-ramp Weave - F - F 110 1.1%
Northbound I-405 Culver St On-ramp to Jamboree Rd Off-ramp Basic 43.0 E 44.0 E 120 1.1% Jamboree Rd Direct On-ramp to MacArthur Blvd Off-ramp Weave - F - F 100 0.8% MacArthur Blvd On-ramp to SR-55 NB & SB Off-ramp Weave 37.6 E 37.7 E 0 0.0% Bristol St S On-ramp to South Coast Off-ramp Weave - F - F 0 0.0%
Southbound I-405 Off-ramp to I-405 SB to Fairview Rd On-ramp Basic 31.1 F 31.5 F 90 1.0% Fairview Rd On-ramp Merge 34.4 F 34.8 F 100 1.0%Fairview Rd On-ramp to Bristol St Off-ramp Basic 39.0 F 39.8 F 100 1.0% Bristol St Off-ramp Diverge 27.4 F 27.7 F 100 0.9%Bristol St On-ramp to SR-55 NB Off-ramp Weave - F - F 110 0.9% Lane Drop Basic 34.5 D 35.3 E 110 1.4%On-ramp from SR-55 NB Basic 35.2 E 35.9 E 120 1.2%SR-55 SB On-ramp to MacArthur Blvd Off-ramp Weave - F - F 120 0.9% MacArthur Blvd On-ramp to Jamboree Rd Off-ramp Weave - F - F 100 0.8% Notes: 1. Freeway facilities operating below acceptable standards are noted in bold. 2. Analysis performed using the HCM 2010 methodology. 3. pc/mi/ln = passenger cars per mile per lane. 4. NB=Northbound; SB=Southbound Source: Transportation Impact Analysis, (Full data in Tables 9-27, 9-28, and 9-29), Fehr & Peers, 2014
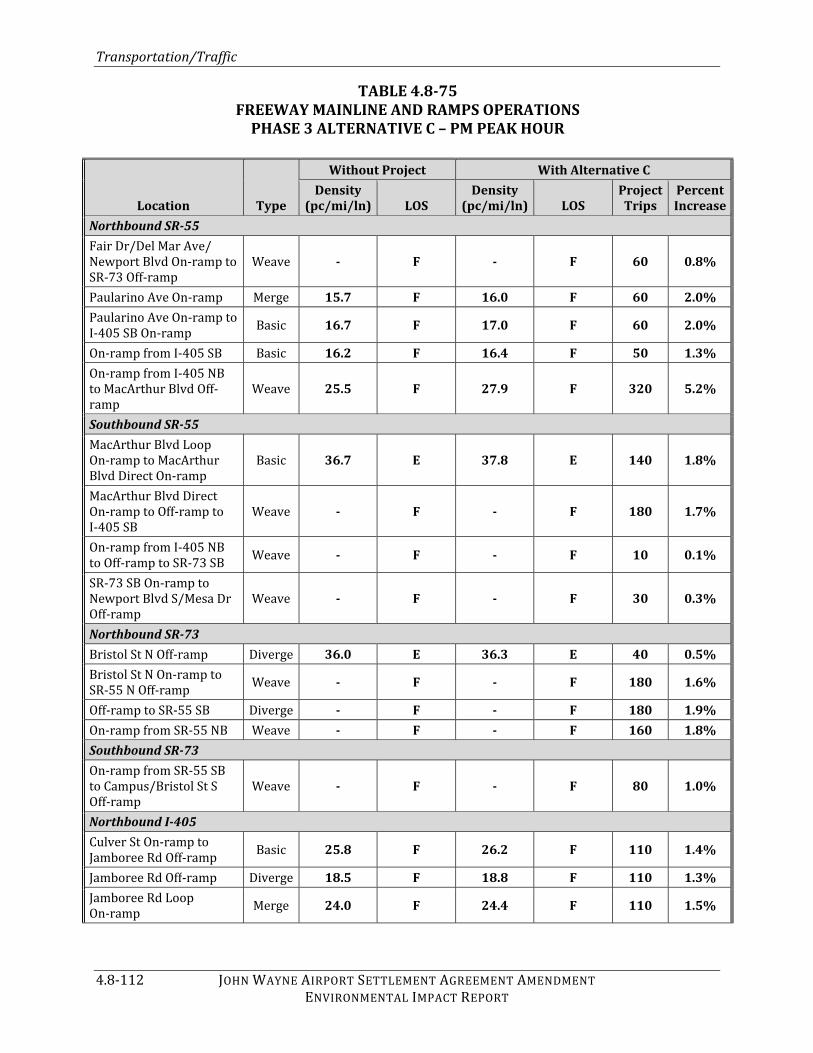
Transportation/Traffic
4.8-112 JOHN WAYNE AIRPORT SETTLEMENT AGREEMENT AMENDMENT ENVIRONMENTAL IMPACT REPORT
TABLE 4.8-75 FREEWAY MAINLINE AND RAMPS OPERATIONS
PHASE 3 ALTERNATIVE C – PM PEAK HOUR Location Type
Without Project With Alternative C Density
(pc/mi/ln) LOS Density
(pc/mi/ln) LOS Project Trips
Percent Increase
Northbound SR-55 Fair Dr/Del Mar Ave/ Newport Blvd On-ramp to SR-73 Off-ramp Weave - F - F 60 0.8% Paularino Ave On-ramp Merge 15.7 F 16.0 F 60 2.0%Paularino Ave On-ramp to I-405 SB On-ramp Basic 16.7 F 17.0 F 60 2.0% On-ramp from I-405 SB Basic 16.2 F 16.4 F 50 1.3%On-ramp from I-405 NB to MacArthur Blvd Off-ramp Weave 25.5 F 27.9 F 320 5.2%
Southbound SR-55 MacArthur Blvd Loop On-ramp to MacArthur Blvd Direct On-ramp Basic 36.7 E 37.8 E 140 1.8% MacArthur Blvd Direct On-ramp to Off-ramp to I-405 SB Weave - F - F 180 1.7% On-ramp from I-405 NB to Off-ramp to SR-73 SB Weave - F - F 10 0.1% SR-73 SB On-ramp to Newport Blvd S/Mesa Dr Off-ramp Weave - F - F 30 0.3%
Northbound SR-73 Bristol St N Off-ramp Diverge 36.0 E 36.3 E 40 0.5%Bristol St N On-ramp to SR-55 N Off-ramp Weave - F - F 180 1.6% Off-ramp to SR-55 SB Diverge - F - F 180 1.9%On-ramp from SR-55 NB Weave - F - F 160 1.8%Southbound SR-73 On-ramp from SR-55 SB to Campus/Bristol St S Off-ramp Weave - F - F 80 1.0%
Northbound I-405 Culver St On-ramp to Jamboree Rd Off-ramp Basic 25.8 F 26.2 F 110 1.4% Jamboree Rd Off-ramp Diverge 18.5 F 18.8 F 110 1.3%Jamboree Rd Loop On-ramp Merge 24.0 F 24.4 F 110 1.5%

Transportation/Traffic
JOHN WAYNE AIRPORT SETTLEMENT AGREEMENT AMENDMENT 4.8-113 ENVIRONMENTAL IMPACT REPORT
TABLE 4.8-75 FREEWAY MAINLINE AND RAMPS OPERATIONS
PHASE 3 ALTERNATIVE C – PM PEAK HOUR Location Type
Without Project With Alternative C Density
(pc/mi/ln) LOS Density
(pc/mi/ln) LOS Project Trips
Percent IncreaseJamboree Rd Direct On-ramp to MacArthur Blvd Off-ramp Weave 40.5 F 41.7 F 120 1.3% MacArthur Blvd On-ramp to SR-55 NB & SB Off-ramp Weave - F - F 20 0.2% SR-55 Off-ramp to Bristol St Off-ramp Basic 26.5 F 26.6 F 10 0.2% Bristol St/Ave of the Arts Off-ramp Diverge 31.1 F 31.3 F 10 0.1% On-ramp from SR-55 SB Basic 22.6 F 22.6 F 0 0.0%Bristol St N On-ramp Merge 21.5 F 21.5 F 0 0.0%Bristol St S On-ramp to S Coast Off Weave - F - F 0 0.0%
Southbound I-405 SR-55 SB On-ramp to MacArthur Blvd Off-ramp Weave - F - F 140 1.3% MacArthur Blvd On-ramp to Jamboree Rd Off-ramp Weave 44.4 E 45.7 E 120 1.1% Jamboree Rd Loop On-ramp Merge 22.5 F 22.4 F 120 1.8% Jamboree Rd Direct On-ramp Merge 22.8 F 23.6 F 150 2.0% Notes: 1. Freeway facilities operating below acceptable standards are noted in bold. 2. Analysis performed using the HCM 2010 methodology. 3. pc/mi/ln = passenger cars per mile per lane. 4. NB=Northbound; SB=Southbound Source: Transportation Impact Analysis, (Full data in Tables 9-30, 9-31, and 9-32), Fehr & Peers, 2014 Caltrans Ramp Queue Analysis A 95th percentile queue analysis has been prepared utilizing the Synchro 7 software to determine if adequate queue storage is provided at the off-ramp at MacArthur Boulevard and Jamboree Road under the Alternative C scenario. Adequate queue storage is forecast to be provided at the Caltrans off-ramp locations. The detailed analysis is provided in Table 11-4 in the Transportation Impact Analysis (Appendix G).

Transportation/Traffic
4.8-114 JOHN WAYNE AIRPORT SETTLEMENT AGREEMENT AMENDMENT ENVIRONMENTAL IMPACT REPORT
No Project Alternative Existing Plus No Project Table 4.8-76 shows there is one location under the Existing Plus No Project Alternative that would degrade from acceptable conditions to LOS E. This intersection, Campus Drive and Bristol Street North, is located in the City of Newport Beach and the LOS worsens from LOS D to LOS E with the addition of the No Project Alternative trips. As such, under this scenario, the No Project Alternative would result in a significant impact at this intersection. The evaluation was based on City of Newport Beach intersection analysis methodology. The LOS for each of the 59 study intersections under the Existing Plus No Project Alternative evaluation is provided in Appendix G (Table 10-1). TABLE 4.8-76
INTERSECTION OPERATING AT A DEFICIENT LEVEL OF SERVICE EXISTING PLUS NO PROJECT ALTERNATIVE
Intersection Traffic Control Peak Hour
Existing Existing Plus No Project
Alternative V/C LOS V/C LOS Change17. Campus Dr at Bristol St North Signal AM 0.596 A 0.610 B 0.014PM 0.885 D 0.908 E 0.023
Boldface indicates the intersection is operating below acceptable standards for the applicable jurisdiction. Source: Transportation Impact Analysis, (Full data in Table 10-1), Fehr & Peers, 2014 Of the four intersections under the shared jurisdiction of Caltrans only the Jamboree Road at the I-405 southbound ramps would operate at deficient conditions under the Existing Plus No Project Alternative scenario. However, as shown in Table 4.8-77 because the addition of No Project Alternative-generated trips would not cause a two second delay increase at an intersection operating at an unacceptable LOS prior to the addition of No Project Alternative traffic, the No Project Alternative would not result in significant impacts at the Caltrans intersections. TABLE 4.8-77
CALTRANS INTERSECTION OPERATING AT A DEFICIENT LEVEL OF SERVICE EXISTING PLUS NO PROJECT ALTERNATIVE
Intersection
Existing
Existing Plus No Project
Alternative Traffic Control Peak Hour Delaya LOS Delaya LOS Jamboree Rd at I-405 SB Ramps Signal AM 90.8 F 91.5 FPM 30.7 C 30.9 CNB=Northbound
Boldface indicates the intersection is operating below acceptable standards for the applicable jurisdiction. a Delay is provided in seconds. Source: Transportation Impact Analysis, (Full data in Table 10-2), Fehr & Peers, 2014

Transportation/Traffic
JOHN WAYNE AIRPORT SETTLEMENT AGREEMENT AMENDMENT 4.8-115 ENVIRONMENTAL IMPACT REPORT
Table 4.8-78 identifies the freeway mainline and ramp locations that would operate at a deficient LOS on SR-55, SR-73, and I-405 during the AM peak hour. Table 4.8-79 identifies the freeway mainline and ramp locations that would operate at a deficient LOS during the PM peak hour for these same facilities. As shown in the tables, most of these facilities would operate at deficient levels of service without the No Project Alternative-related traffic. However, because the addition of the No Project Alternative trips would not result in a decrease in LOS from acceptable to unacceptable, and because the addition of the No Project Alternative trips would not increase traffic by 2 percent or more, impacts would be less than significant. TABLE 4.8-78
FREEWAY MAINLINE AND RAMPS OPERATIONS EXISTING PLUS NO PROJECT ALTERNATIVE – AM PEAK HOUR
Location Type
Existing Existing Plus No Project AlternativeDensity
(pc/mi/ln) LOS Density
(pc/mi/ln) LOS Project Trips
Percent Increase
Northbound SR-55 Fair Dr/Del Mar Ave/Newport Blvd On-ramp to SR-73 Off Ramp Weave - F - F 20 0.2% Baker St Off Ramp to SR-73 On-ramp Basic 24.9 F 37.7 F 20 0.4% On-ramp from SR-73 NB to Off Ramp to I-405 SB Weave - F - F 20 0.3% Off Ramp to I-405 SB to Paularino Ave On-ramp Basic 28.3 F 44.5 F 10 0.2% Paularino Ave On-ramp Merge 29.6 D - F 20 0.4%Paularino Ave On-ramp to I-405 SB On-ramp Basic 34.3 D - F 20 0.4% On-ramp from I-405 SB Basic - F - F 20 0.2%On-ramp from I-405 NB to MacArthur Blvd Off-ramp Weave - F - F 60 0.6%
Southbound SR-55 MacArthur Blvd Direct On-ramp to Off-ramp to I-405 SB Weave - F - F 60 0.6% On-ramp from I-405 NB to Off-ramp to SR-73 SB Weave - F - F 20 0.2%
Northbound SR-73 Lane Drop to MacArthur Blvd On-ramp Basic 40.3 E 40.5 E 10 0.2% MacArthur Blvd On-ramp Basic 36.6 E 36.8 E 20 0.3%Jamboree Rd On-ramp to Bristol St N Off-ramp Basic 23.7 C 43.4 E 30 0.5%

Transportation/Traffic
4.8-116 JOHN WAYNE AIRPORT SETTLEMENT AGREEMENT AMENDMENT ENVIRONMENTAL IMPACT REPORT
TABLE 4.8-78 FREEWAY MAINLINE AND RAMPS OPERATIONS
EXISTING PLUS NO PROJECT ALTERNATIVE – AM PEAK HOUR Location Type
Existing Existing Plus No Project AlternativeDensity
(pc/mi/ln) LOS Density
(pc/mi/ln) LOS Project Trips
Percent IncreaseBristol St N Off-ramp Diverge 30.5 D - F 30 0.4%Bristol St N On-ramp to SR-55 N Off-ramp Weave 32.1 D - F 70 0.8% On-ramp from SR-55 NB Weave 33.1 D - F 50 0.9%Bristol St N Off-ramp Diverge 30.5 D - F 40 0.6%Bristol St N On-ramp to SR-55 N Off-ramp Weave 32.1 D - F 120 1.4% On-ramp from SR-55 NB Weave 33.1 D - F 90 1.7%
Southbound SR-73 Bear St On-ramp to SR-55 S Off-ramp Weave 38.7 E 38.9 E 30 0.5% On-ramp from SR-55 SB to Campus/Bristol St S Off-ramp Weave - F - F 50 0.5%
Northbound I-405 Culver St On-ramp to Jamboree Rd Off-ramp Basic 42.7 E 43.0 E 30 0.3% Jamboree Rd Direct On-ramp to MacArthur Blvd Off-ramp Weave - F - F 30 0.2% MacArthur Blvd On-ramp to SR-55 NB & SB Off-ramp Weave 40.8 E 37.7 E 10 0.1% Bristol St S On-ramp to South Coast Off-ramp Weave - F - F 0 0.0%
Southbound I-405 Off-ramp to I-405 SB to Fairview Rd On-ramp Basic 30.8 F 30.9 F 20 0.2% Fairview Rd On-ramp Merge 34.1 F 34.2 F 30 0.3%Fairview Rd On-ramp to Bristol St Off-ramp Basic 38.6 F 38.8 F 30 0.3% Bristol St Off-ramp Diverge 27.2 F 27.3 F 30 0.3%Bristol St On-ramp to SR-55 NB Off-ramp Weave - F - F 40 0.3% Lane Drop Basic 36.9 E 34.2 D 40 0.5%On-ramp from SR-55 NB Basic 37.0 E 34.8 D 50 0.5%

Transportation/Traffic
JOHN WAYNE AIRPORT SETTLEMENT AGREEMENT AMENDMENT 4.8-117 ENVIRONMENTAL IMPACT REPORT
TABLE 4.8-78 FREEWAY MAINLINE AND RAMPS OPERATIONS
EXISTING PLUS NO PROJECT ALTERNATIVE – AM PEAK HOUR Location Type
Existing Existing Plus No Project AlternativeDensity
(pc/mi/ln) LOS Density
(pc/mi/ln) LOS Project Trips
Percent IncreaseSR-55 SB On-ramp to MacArthur Blvd Off-ramp Weave - F - F 50 0.3% MacArthur Blvd On-ramp to Jamboree Rd Off-ramp Weave - F - F 50 0.4% Notes: 1. Freeway facilities operating below acceptable standards are noted in bold. 2. Analysis performed using the HCM 2010 methodology. 3. pc/mi/ln = passenger cars per mile per lane. 4. NB=Northbound; SB=Southbound Source: Transportation Impact Analysis, (Full data in Tables 10-3, 10-4, and 10-5), Fehr & Peers, 2014
TABLE 4.8-79 PROJECT FREEWAY MAINLINE AND RAMPS OPERATIONS
EXISTING PLUS NO PROJECT ALTERNATIVE – PM PEAK HOUR Location Type
Existing Existing Plus No Project AlternativeDensity
(pc/mi/ln) LOS Density
(pc/mi/ln) LOS Project Trips
Percent Increase
Northbound SR-55 Fair Dr/Del Mar Ave/Newport Blvd On-ramp to SR-73 Off-ramp Weave - F - F 0.3% Paularino Ave On-ramp Merge 14.9 F 15.8 F 0.7%Paularino Ave On-ramp to I-405 SB On-ramp Basic 15.9 F 16.8 F 0.7% On-ramp from I-405 SB Basic 15.5 F 16.2 F 0.5%On-ramp from I-405 NB to MacArthur Blvd Off-ramp Weave 23.0 F 26.0 F 1.4%
Southbound SR-55 MacArthur Blvd Loop On-ramp to MacArthur Blvd Direct On-ramp Basic 36.5 E 36.8 E 30 0.4% MacArthur Blvd Direct On-ramp to Off-ramp to I-405 SB Weave - F - F 50 0.5% On-ramp from I-405 NB to Off-ramp to SR-73 SB Weave - F - F 10 0.1%

Transportation/Traffic
4.8-118 JOHN WAYNE AIRPORT SETTLEMENT AGREEMENT AMENDMENT ENVIRONMENTAL IMPACT REPORT
TABLE 4.8-79 PROJECT FREEWAY MAINLINE AND RAMPS OPERATIONS
EXISTING PLUS NO PROJECT ALTERNATIVE – PM PEAK HOUR Location Type
Existing Existing Plus No Project AlternativeDensity
(pc/mi/ln) LOS Density
(pc/mi/ln) LOS Project Trips
Percent IncreaseSR-73 SB On-ramp to Newport Blvd S/Mesa Dr Off-ramp Weave - F - F 20 0.2%
Northbound SR-73 Bristol St N Off-ramp Diverge 27.9 C 35.9 E 30 0.5%Bristol St N On-ramp to SR-55 N Off-ramp Weave - F - F 60 0.6% Off-ramp to SR-55 SB Diverge 35.5 E - F 60 0.8%On-ramp from SR-55 NB Weave - F - F 50 0.7%Southbound SR-73 On-ramp from SR-55 SB to Campus/Bristol St S Off-ramp Weave - F - F 30 0.4% Northbound I-405 Culver St On-ramp to Jamboree Rd Off-ramp Basic 25.5 F 25.6 F 30 0.4% Jamboree Rd Off-ramp Diverge 18.2 F 18.3 F 30 0.3%Jamboree Rd Loop On-ramp Merge 24.2 F 23.7 F 30 0.4% Jamboree Rd Direct On-ramp to MacArthur Blvd Off-ramp Weave 41.6 F 40.2 F 40 0.4% MacArthur Blvd On-ramp to SR-55 NB & SB Off-ramp Weave - F 43.4 F 20 0.2% SR-55 Off-ramp to Bristol St Off-ramp Basic 33.9 F 26.3 F 10 0.1% Bristol St/Ave of the Arts Off-ramp Diverge 36.1 F 31.0 F 10 0.1% On-ramp from SR-55 SB Basic 27.2 F 22.4 F 0 0.0%Bristol St N On-ramp Merge 23.9 F 21.4 F 0 0.0%Bristol St S On-ramp to South Coast Off-ramp Weave - F - F 0 0.0% Southbound I-405 SR-55 SB On-ramp to MacArthur Blvd Off-ramp Weave 43.6 E 43.9 E 60 0.6% MacArthur Blvd On-ramp to Jamboree Rd Off-ramp Weave 44.8 E 45.1 E 60 0.6%
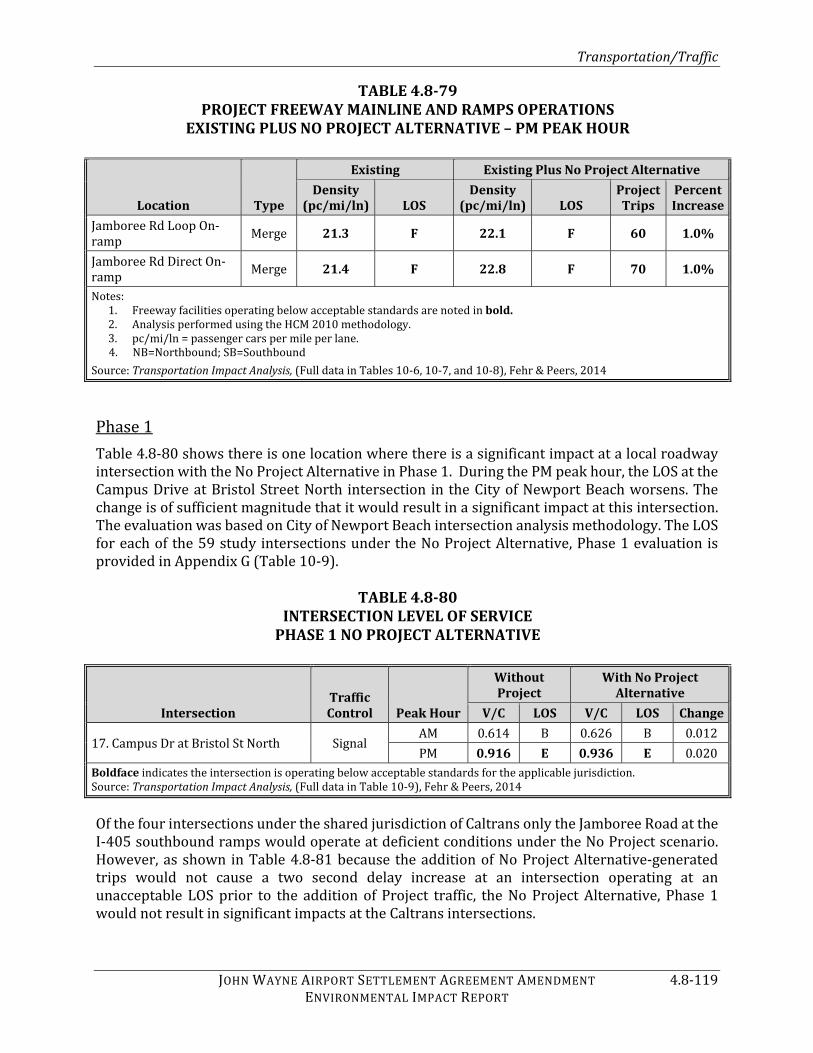
Transportation/Traffic
JOHN WAYNE AIRPORT SETTLEMENT AGREEMENT AMENDMENT 4.8-119 ENVIRONMENTAL IMPACT REPORT
TABLE 4.8-79 PROJECT FREEWAY MAINLINE AND RAMPS OPERATIONS
EXISTING PLUS NO PROJECT ALTERNATIVE – PM PEAK HOUR Location Type
Existing Existing Plus No Project AlternativeDensity
(pc/mi/ln) LOS Density
(pc/mi/ln) LOS Project Trips
Percent IncreaseJamboree Rd Loop On-ramp Merge 21.3 F 22.1 F 60 1.0% Jamboree Rd Direct On-ramp Merge 21.4 F 22.8 F 70 1.0% Notes: 1. Freeway facilities operating below acceptable standards are noted in bold. 2. Analysis performed using the HCM 2010 methodology. 3. pc/mi/ln = passenger cars per mile per lane. 4. NB=Northbound; SB=Southbound Source: Transportation Impact Analysis, (Full data in Tables 10-6, 10-7, and 10-8), Fehr & Peers, 2014 Phase 1 Table 4.8-80 shows there is one location where there is a significant impact at a local roadway intersection with the No Project Alternative in Phase 1. During the PM peak hour, the LOS at the Campus Drive at Bristol Street North intersection in the City of Newport Beach worsens. The change is of sufficient magnitude that it would result in a significant impact at this intersection. The evaluation was based on City of Newport Beach intersection analysis methodology. The LOS for each of the 59 study intersections under the No Project Alternative, Phase 1 evaluation is provided in Appendix G (Table 10-9).
TABLE 4.8-80 INTERSECTION LEVEL OF SERVICE
PHASE 1 NO PROJECT ALTERNATIVE Intersection
Traffic Control Peak Hour
Without Project
With No Project Alternative
V/C LOS V/C LOS Change17. Campus Dr at Bristol St North Signal AM 0.614 B 0.626 B 0.012PM 0.916 E 0.936 E 0.020Boldface indicates the intersection is operating below acceptable standards for the applicable jurisdiction. Source: Transportation Impact Analysis, (Full data in Table 10-9), Fehr & Peers, 2014 Of the four intersections under the shared jurisdiction of Caltrans only the Jamboree Road at the I-405 southbound ramps would operate at deficient conditions under the No Project scenario. However, as shown in Table 4.8-81 because the addition of No Project Alternative-generated trips would not cause a two second delay increase at an intersection operating at an unacceptable LOS prior to the addition of Project traffic, the No Project Alternative, Phase 1 would not result in significant impacts at the Caltrans intersections.

Transportation/Traffic
4.8-120 JOHN WAYNE AIRPORT SETTLEMENT AGREEMENT AMENDMENT ENVIRONMENTAL IMPACT REPORT
TABLE 4.8-81 CALTRANS INTERSECTION LEVEL OF SERVICE
PHASE 1 NO PROJECT ALTERNATIVE Intersection
Traffic Control Peak Hour
Without Project With No Project
Alternative Delaya LOS Delaya LOSJamboree Rd at I-405 SB Ramps Signal AM 94.7 F 94.5 FPM 31.0 C 31.0 C
Boldface indicates the intersection is operating below acceptable standards for the applicable jurisdiction. a Delay is provided in seconds. Source: Transportation Impact Analysis, (Full data in Table 10-10), Fehr & Peers, 2014 Table 4.8-82 identifies the freeway mainline and ramp locations that would operate at a deficient LOS on SR-55, SR-73, and I-405 during the AM peak hour. Table 4.8-83 identifies the freeway mainline and ramp locations that would operate at a deficient LOS during the PM peak hour for these same facilities. As shown in the tables, most of these facilities would operate at deficient levels of service without No Project Alternative-related traffic. However, because the addition of No Project Alternative trips would not result in a decrease in LOS from acceptable to unacceptable, and because the addition of No Project Alternative trips would not increase traffic by 2 percent or more, impacts would be less than significant.
TABLE 4.8-82 FREEWAY MAINLINE AND RAMPS OPERATIONS
PHASE 1 NO PROJECT ALTERNATIVE – AM PEAK HOUR
Location Type
Without Project With No Project AlternativeDensity
(pc/mi/ln) LOS Density
(pc/mi/ln) LOS Project Trips
Percent Increase
Northbound SR-55 Fair Dr/Del Mar Ave/ Newport Blvd On-ramp to SR-73 Off-ramp Weave - F - F 20 0.2% Baker St Off-ramp to SR-73 On-ramp Basic 37.7 F 37.9 F 20 0.3% On-ramp from SR-73 NB to Off-ramp to I-405 SB Weave - F - F 20 0.2% Off-ramp to I-405 SB to Paularino Ave On-ramp Basic 44.5 F 44.7 F 10 0.2% Paularino Ave On-ramp Merge - F - F 20 0.3%Paularino Ave On-ramp to I-405 SB On-ramp Basic - F - F 20 0.3% On-ramp from I-405 SB Basic - F - F 20 0.2%On-ramp from I-405 NB to MacArthur Blvd Off-ramp Weave - F - F 60 0.5%
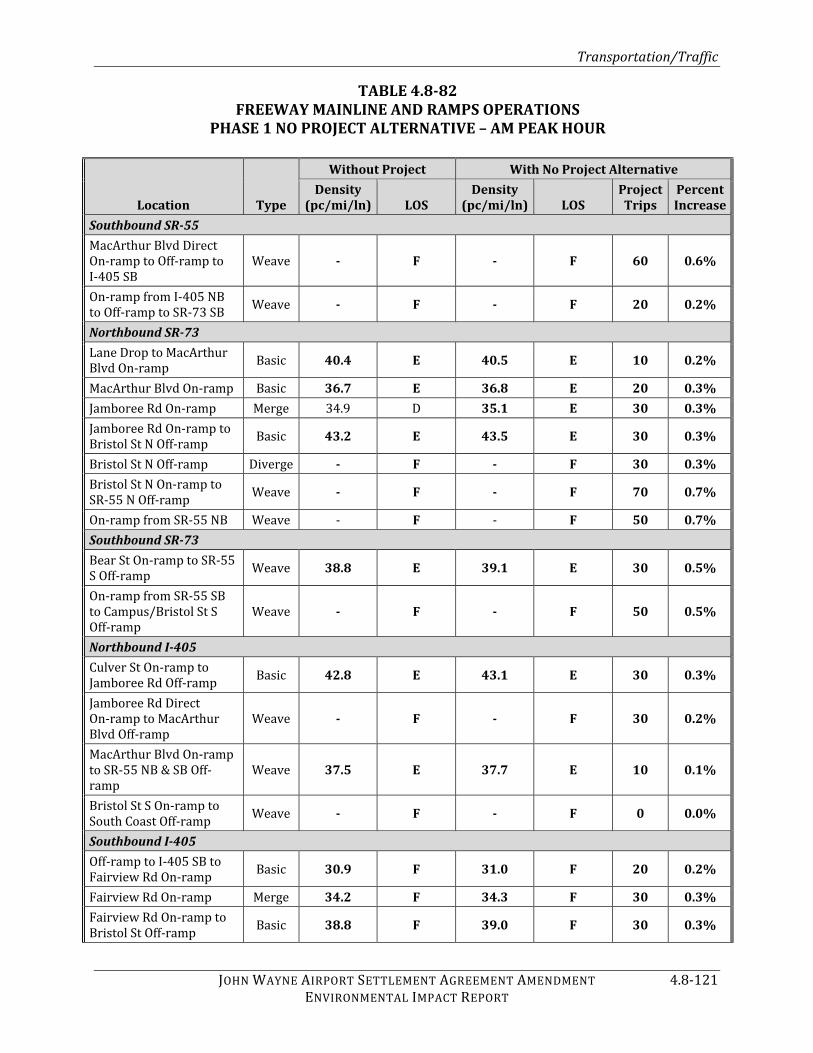
Transportation/Traffic
JOHN WAYNE AIRPORT SETTLEMENT AGREEMENT AMENDMENT 4.8-121 ENVIRONMENTAL IMPACT REPORT
TABLE 4.8-82 FREEWAY MAINLINE AND RAMPS OPERATIONS
PHASE 1 NO PROJECT ALTERNATIVE – AM PEAK HOUR
Location Type
Without Project With No Project AlternativeDensity
(pc/mi/ln) LOS Density
(pc/mi/ln) LOS Project Trips
Percent Increase
Southbound SR-55 MacArthur Blvd Direct On-ramp to Off-ramp to I-405 SB Weave - F - F 60 0.6% On-ramp from I-405 NB to Off-ramp to SR-73 SB Weave - F - F 20 0.2%
Northbound SR-73 Lane Drop to MacArthur Blvd On-ramp Basic 40.4 E 40.5 E 10 0.2% MacArthur Blvd On-ramp Basic 36.7 E 36.8 E 20 0.3%Jamboree Rd On-ramp Merge 34.9 D 35.1 E 30 0.3%Jamboree Rd On-ramp to Bristol St N Off-ramp Basic 43.2 E 43.5 E 30 0.3% Bristol St N Off-ramp Diverge - F - F 30 0.3%Bristol St N On-ramp to SR-55 N Off-ramp Weave - F - F 70 0.7% On-ramp from SR-55 NB Weave - F - F 50 0.7%Southbound SR-73 Bear St On-ramp to SR-55 S Off-ramp Weave 38.8 E 39.1 E 30 0.5% On-ramp from SR-55 SB to Campus/Bristol St S Off-ramp Weave - F - F 50 0.5%
Northbound I-405 Culver St On-ramp to Jamboree Rd Off-ramp Basic 42.8 E 43.1 E 30 0.3% Jamboree Rd Direct On-ramp to MacArthur Blvd Off-ramp Weave - F - F 30 0.2% MacArthur Blvd On-ramp to SR-55 NB & SB Off-ramp Weave 37.5 E 37.7 E 10 0.1% Bristol St S On-ramp to South Coast Off-ramp Weave - F - F 0 0.0%
Southbound I-405 Off-ramp to I-405 SB to Fairview Rd On-ramp Basic 30.9 F 31.0 F 20 0.2% Fairview Rd On-ramp Merge 34.2 F 34.3 F 30 0.3%Fairview Rd On-ramp to Bristol St Off-ramp Basic 38.8 F 39.0 F 30 0.3%

Transportation/Traffic
4.8-122 JOHN WAYNE AIRPORT SETTLEMENT AGREEMENT AMENDMENT ENVIRONMENTAL IMPACT REPORT
TABLE 4.8-82 FREEWAY MAINLINE AND RAMPS OPERATIONS
PHASE 1 NO PROJECT ALTERNATIVE – AM PEAK HOUR
Location Type
Without Project With No Project AlternativeDensity
(pc/mi/ln) LOS Density
(pc/mi/ln) LOS Project Trips
Percent IncreaseBristol St Off-ramp Diverge 27.3 F 27.4 F 30 0.3%Bristol St On-ramp to SR-55 NB Off-ramp Weave - F - F 40 0.3% On-ramp from SR-55 NB Basic 34.8 D 35.1 E 50 0.5%SR-55 SB On-ramp to MacArthur Blvd Off-ramp Weave - F - F 50 0.4% MacArthur Blvd On-ramp to Jamboree Rd Off-ramp Weave - F - F 50 0.4% Notes: 1. Freeway facilities operating below acceptable standards are noted in bold. 2. Analysis performed using the HCM 2010 methodology. 3. pc/mi/ln = passenger cars per mile per lane. 4. NB=Northbound; SB=Southbound Source: Transportation Impact Analysis, (Full data in Tables 10-11, 10-12, and 10-13), Fehr & Peers, 2014
TABLE 4.8-83 PROJECT FREEWAY MAINLINE AND RAMPS OPERATIONS
PHASE 1 NO PROJECT ALTERNATIVE – PM PEAK HOUR Location Type
Without Project With No Project AlternativeDensity
(pc/mi/ln) LOS Density
(pc/mi/ln) LOS Project Trips
Percent Increase
Northbound SR-55 Fair Dr/Del Mar Ave/Newport Blvd On-ramp to SR-73 Off-ramp Weave - F - F 20 0.3% Paularino Ave On-ramp Merge 15.7 F 15.8 F 20 0.7%Paularino Ave On-ramp to I-405 SB On-ramp Basic 16.7 F 16.8 F 20 0.7% On-ramp from I-405 SB Basic 16.2 F 16.2 F 20 0.5%On-ramp from I-405 NB to MacArthur Blvd Off-ramp Weave 25.5 F 26.1 F 80 1.3%
Southbound SR-55 MacArthur Blvd Loop On-ramp to MacArthur Blvd Direct On-ramp Basic 36.6 E 36.8 E 30 0.4% MacArthur Blvd Direct On-ramp to Off-ramp to I-405 SB Weave - F - F 50 0.5%

Transportation/Traffic
JOHN WAYNE AIRPORT SETTLEMENT AGREEMENT AMENDMENT 4.8-123 ENVIRONMENTAL IMPACT REPORT
TABLE 4.8-83 PROJECT FREEWAY MAINLINE AND RAMPS OPERATIONS
PHASE 1 NO PROJECT ALTERNATIVE – PM PEAK HOUR Location Type
Without Project With No Project AlternativeDensity
(pc/mi/ln) LOS Density
(pc/mi/ln) LOS Project Trips
Percent IncreaseOn-ramp from I-405 NB to Off-ramp to SR-73 SB Weave - F - F 10 0.1% SR-73 SB On-ramp to Newport Blvd S/Mesa Dr Off-ramp Weave - F - F 20 0.2%
Northbound SR-73 Bristol St N Off-ramp Diverge 35.9 E 36.1 E 30 0.4%Bristol St N On-ramp to SR-55 N Off-ramp Weave - F - F 60 0.6% Off-ramp to SR-55 SB Diverge - F - F 60 0.6%On-ramp from SR-55 NB Weave - F - F 50 0.6%Southbound SR-73 On-ramp from SR-55 SB to Campus/Bristol St S Off-ramp Weave - F - F 30 0.4% Northbound I-405 Culver St On-ramp to Jamboree Rd Off-ramp Basic 25.6 F 25.7 F 30 0.4% Jamboree Rd Off-ramp Diverge 18.3 F 18.4 F 30 0.3%Jamboree Rd Loop On-ramp Merge 23.8 F 23.9 F 30 0.4%Jamboree Rd Direct On-ramp to MacArthur Blvd Off-ramp Weave 40.1 F 40.5 F 40 0.4% MacArthur Blvd On-ramp to SR-55 NB & SB Off-ramp Weave - F - F 20 0.2% SR-55 Off-ramp to Bristol St Off-ramp Basic 26.4 F 26.5 F 10 0.2% Bristol St/Ave of the Arts Off-ramp Diverge 31.0 F 31.2 F 10 0.1% On-ramp from SR-55 SB Basic 22.5 F 22.5 F 0 0.0%Bristol St N On-ramp Merge 21.4 F 21.4 F 0 0.0%Bristol St S On-ramp to South Coast Off-ramp Weave - F - F 0 0.0% Southbound I-405 SR-55 SB On-ramp to MacArthur Blvd Off-ramp Weave - F 44.2 E 60 0.6% MacArthur Blvd On-ramp to Jamboree Rd Off-ramp Weave 44.2 E 45.4 E 60 0.6% Jamboree Rd Loop On-ramp Merge 22.4 F 22.2 F 60 0.9%

Transportation/Traffic
4.8-124 JOHN WAYNE AIRPORT SETTLEMENT AGREEMENT AMENDMENT ENVIRONMENTAL IMPACT REPORT
TABLE 4.8-83 PROJECT FREEWAY MAINLINE AND RAMPS OPERATIONS
PHASE 1 NO PROJECT ALTERNATIVE – PM PEAK HOUR Location Type
Without Project With No Project AlternativeDensity
(pc/mi/ln) LOS Density
(pc/mi/ln) LOS Project Trips
Percent IncreaseJamboree Rd Direct On-ramp Merge 22.6 F 23.0 F 70 0.9% Notes: 1. Freeway facilities operating below acceptable standards are noted in bold. 2. Analysis performed using the HCM 2010 methodology. 3. pc/mi/ln = passenger cars per mile per lane. 4. NB=Northbound; SB=Southbound Source: Transportation Impact Analysis, (Full data in Tables 10-14, 10-15, and 10-16), Fehr & Peers, 2014 Phase 2 Table 4.8-84 shows the location where there would be a deficient local roadway intersection LOS with the No Project Alternative, Phase 2. As shown, Campus Drive at Bristol Street North (Intersection 17) is projected to operate at deficient conditions during the PM peak hour. This would be a significant impact because the V/C ratio increases by .010 or more. The evaluation for this intersection was based on City of Newport Beach intersection analysis methodology. The LOS for each of the 59 study intersections under the No Project Alternative, Phase 2 evaluation is provided in Appendix G (Table 10-17).
TABLE 4.8-84 INTERSECTION LEVEL OF SERVICE
PHASE 2 NO PROJECT ALTERNATIVE Intersection
Traffic Control Peak Hour
Without Project
With No Project Alternative
V/C LOS V/C LOS Change17. Campus Dr at Bristol St North Signal AM 0.641 B 0.659 B 0.018PM 0.964 E 0.984 E 0.020Boldface indicates the intersection is operating below acceptable standards for the applicable jurisdiction. Source: Transportation Impact Analysis, (Full data in Table 10-17), Fehr & Peers, 2014

Transportation/Traffic
JOHN WAYNE AIRPORT SETTLEMENT AGREEMENT AMENDMENT 4.8-125 ENVIRONMENTAL IMPACT REPORT
Of the four intersections under the shared jurisdiction of Caltrans only the Jamboree Road at the I-405 southbound ramps would operate at deficient conditions under the No Project Alternative. However, as shown in Table 4.8-85 this intersection would not be impacted by the No Project Alternative. With the addition of the No Project Alternative-generated trips the overall intersection delay would improve at the Jamboree Road/I-405 southbound ramps during the AM peak hour because the No Project Alternative, Phase 2 would increase traffic to the movements that have available capacity or “green time”. As previously indicated, since intersection delay is reported as a weighted average of all movements, this increase in traffic volume actually results in a reduction of overall intersection delay. TABLE 4.8-85
CALTRANS INTERSECTION LEVEL OF SERVICE PHASE 2 NO PROJECT ALTERNATIVE
Intersection Traffic Control Peak Hour
Without Project With No Project
Alternative Delaya LOS Delaya LOSJamboree Rd at I-405 Southbound Ramps Signal AM 99.7 F 99.6 FPM 30.8 C 30.8 C
Boldface indicates the intersection is operating below acceptable standards for the applicable jurisdiction. a Delay is provided in seconds. Source: Transportation Impact Analysis, (Full data in Table 10-18), Fehr & Peers, 2014 Table 4.8-86 identifies the freeway mainline and ramp locations that would operate at a deficient LOS on SR-55, SR-73, and I-405 during the AM peak hour. Table 4.8-87 identifies the freeway mainline and ramp locations that would operate at a deficient LOS during the PM peak hour for these same facilities. As shown in the tables, most of these facilities would operate at deficient levels of service without the No Project Alternative-related traffic. However, because the addition of the No Project Alternative-generated trips would not result in a decrease in LOS from acceptable to unacceptable, and because the addition of project trips would not increase traffic by 2 percent or more, impacts would be less than significant.
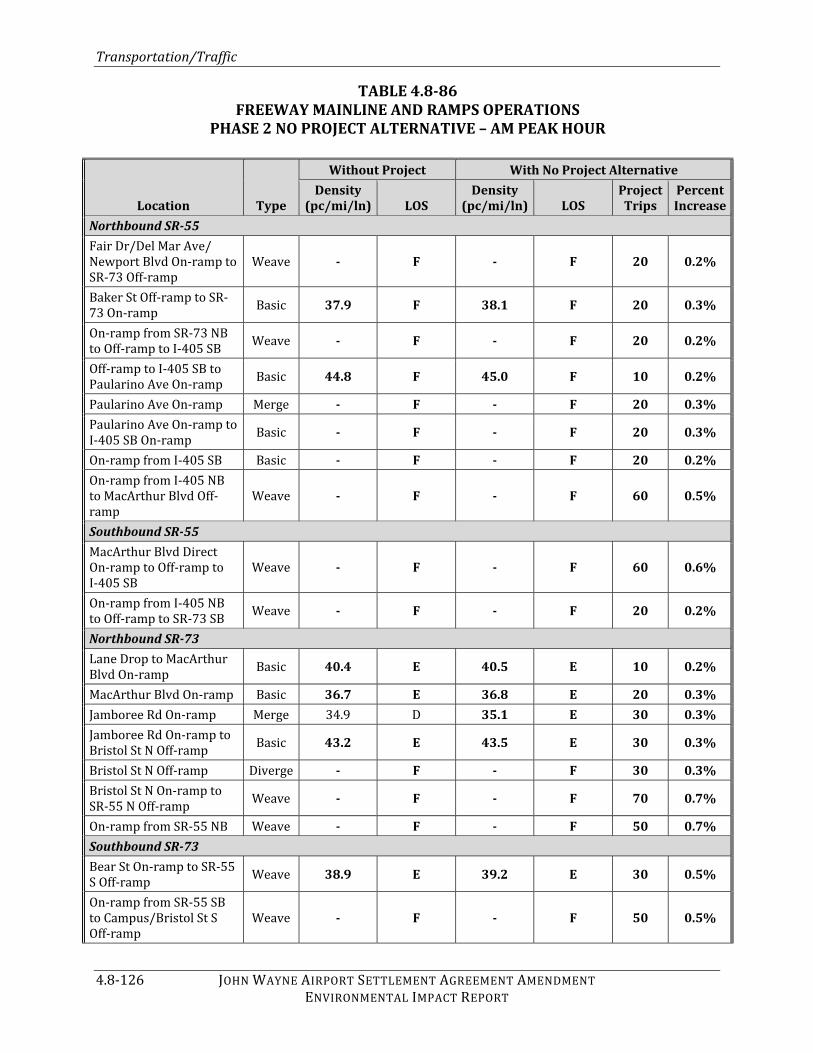
Transportation/Traffic
4.8-126 JOHN WAYNE AIRPORT SETTLEMENT AGREEMENT AMENDMENT ENVIRONMENTAL IMPACT REPORT
TABLE 4.8-86 FREEWAY MAINLINE AND RAMPS OPERATIONS
PHASE 2 NO PROJECT ALTERNATIVE – AM PEAK HOUR Location Type
Without Project With No Project AlternativeDensity
(pc/mi/ln) LOS Density
(pc/mi/ln) LOS Project Trips
Percent Increase
Northbound SR-55 Fair Dr/Del Mar Ave/ Newport Blvd On-ramp to SR-73 Off-ramp Weave - F - F 20 0.2% Baker St Off-ramp to SR-73 On-ramp Basic 37.9 F 38.1 F 20 0.3% On-ramp from SR-73 NB to Off-ramp to I-405 SB Weave - F - F 20 0.2% Off-ramp to I-405 SB to Paularino Ave On-ramp Basic 44.8 F 45.0 F 10 0.2% Paularino Ave On-ramp Merge - F - F 20 0.3%Paularino Ave On-ramp to I-405 SB On-ramp Basic - F - F 20 0.3% On-ramp from I-405 SB Basic - F - F 20 0.2%On-ramp from I-405 NB to MacArthur Blvd Off-ramp Weave - F - F 60 0.5%
Southbound SR-55 MacArthur Blvd Direct On-ramp to Off-ramp to I-405 SB Weave - F - F 60 0.6% On-ramp from I-405 NB to Off-ramp to SR-73 SB Weave - F - F 20 0.2%
Northbound SR-73 Lane Drop to MacArthur Blvd On-ramp Basic 40.4 E 40.5 E 10 0.2% MacArthur Blvd On-ramp Basic 36.7 E 36.8 E 20 0.3%Jamboree Rd On-ramp Merge 34.9 D 35.1 E 30 0.3%Jamboree Rd On-ramp to Bristol St N Off-ramp Basic 43.2 E 43.5 E 30 0.3% Bristol St N Off-ramp Diverge - F - F 30 0.3%Bristol St N On-ramp to SR-55 N Off-ramp Weave - F - F 70 0.7% On-ramp from SR-55 NB Weave - F - F 50 0.7%Southbound SR-73 Bear St On-ramp to SR-55 S Off-ramp Weave 38.9 E 39.2 E 30 0.5% On-ramp from SR-55 SB to Campus/Bristol St S Off-ramp Weave - F - F 50 0.5%
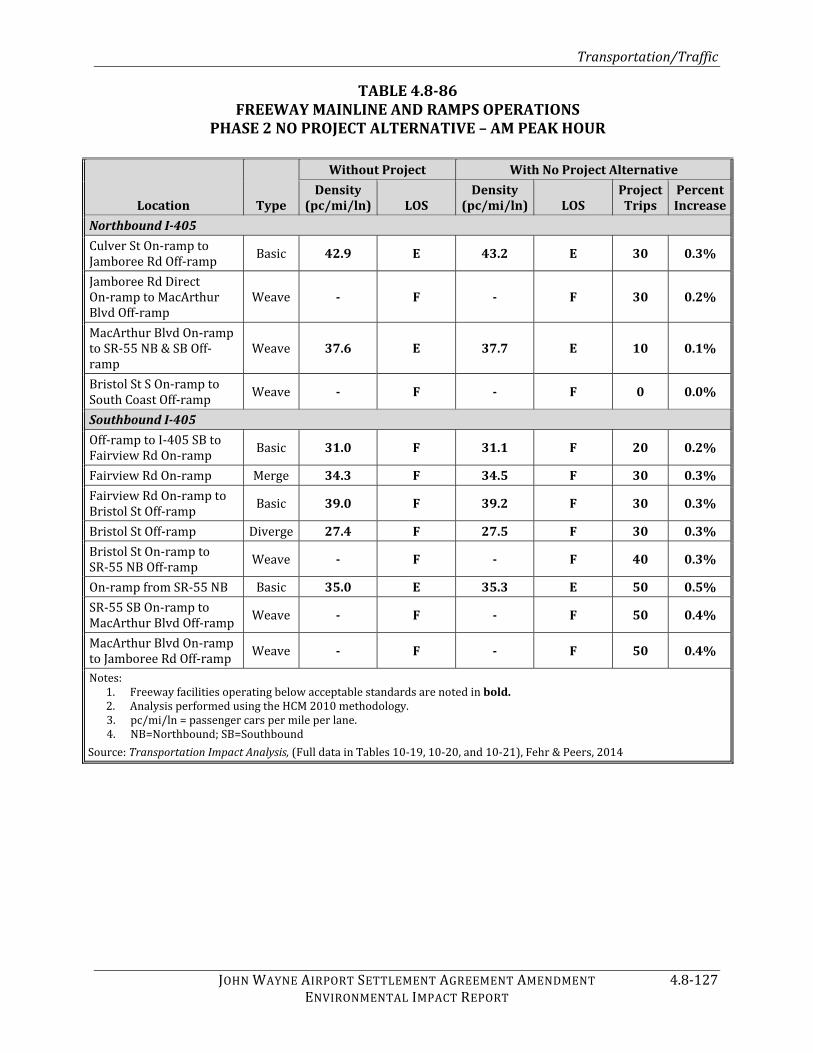
Transportation/Traffic
JOHN WAYNE AIRPORT SETTLEMENT AGREEMENT AMENDMENT 4.8-127 ENVIRONMENTAL IMPACT REPORT
TABLE 4.8-86 FREEWAY MAINLINE AND RAMPS OPERATIONS
PHASE 2 NO PROJECT ALTERNATIVE – AM PEAK HOUR Location Type
Without Project With No Project AlternativeDensity
(pc/mi/ln) LOS Density
(pc/mi/ln) LOS Project Trips
Percent Increase
Northbound I-405 Culver St On-ramp to Jamboree Rd Off-ramp Basic 42.9 E 43.2 E 30 0.3% Jamboree Rd Direct On-ramp to MacArthur Blvd Off-ramp Weave - F - F 30 0.2% MacArthur Blvd On-ramp to SR-55 NB & SB Off-ramp Weave 37.6 E 37.7 E 10 0.1% Bristol St S On-ramp to South Coast Off-ramp Weave - F - F 0 0.0%
Southbound I-405 Off-ramp to I-405 SB to Fairview Rd On-ramp Basic 31.0 F 31.1 F 20 0.2% Fairview Rd On-ramp Merge 34.3 F 34.5 F 30 0.3%Fairview Rd On-ramp to Bristol St Off-ramp Basic 39.0 F 39.2 F 30 0.3% Bristol St Off-ramp Diverge 27.4 F 27.5 F 30 0.3%Bristol St On-ramp to SR-55 NB Off-ramp Weave - F - F 40 0.3% On-ramp from SR-55 NB Basic 35.0 E 35.3 E 50 0.5%SR-55 SB On-ramp to MacArthur Blvd Off-ramp Weave - F - F 50 0.4% MacArthur Blvd On-ramp to Jamboree Rd Off-ramp Weave - F - F 50 0.4% Notes: 1. Freeway facilities operating below acceptable standards are noted in bold. 2. Analysis performed using the HCM 2010 methodology. 3. pc/mi/ln = passenger cars per mile per lane. 4. NB=Northbound; SB=Southbound Source: Transportation Impact Analysis, (Full data in Tables 10-19, 10-20, and 10-21), Fehr & Peers, 2014

Transportation/Traffic
4.8-128 JOHN WAYNE AIRPORT SETTLEMENT AGREEMENT AMENDMENT ENVIRONMENTAL IMPACT REPORT
TABLE 4.8-87 FREEWAY MAINLINE AND RAMPS OPERATIONS
PHASE 2 NO PROJECT ALTERNATIVE – PM PEAK HOUR Location Type
Without Project With No Project AlternativeDensity
(pc/mi/ln) LOS Density
(pc/mi/ln) LOS Project Trips
Percent Increase
Northbound SR-55 Fair Dr/Del Mar Ave/ Newport Blvd On-ramp to SR-73 Off-ramp Weave - F - F 20 0.3% Paularino Ave On-ramp Merge 15.7 F 15.8 F 20 0.7%Paularino Ave On-ramp to I-405 SB On-ramp Basic 16.7 F 16.8 F 20 0.7% On-ramp from I-405 SB Basic 16.2 F 16.2 F 20 0.5%On-ramp from I-405 NB to MacArthur Blvd Off-ramp Weave 25.5 F 26.1 F 80 1.3%
Southbound SR-55 MacArthur Blvd Loop On-ramp to MacArthur Blvd Direct On-ramp Basic 36.6 E 36.8 E 30 0.4% MacArthur Blvd Direct On-ramp to Off-ramp to I-405 SB Weave - F - F 50 0.5% On-ramp from I-405 NB to Off-ramp to SR-73 SB Weave - F - F 10 0.1% SR-73 SB On-ramp to Newport Blvd S/Mesa Dr Off-ramp Weave - F - F 20 0.2%
Northbound SR-73 Bristol St N Off-ramp Diverge 35.9 E 36.1 E 30 0.4%Bristol St N On-ramp to SR-55 N Off-ramp Weave - F - F 60 0.6% Off-ramp to SR-55 SB Diverge - F - F 60 0.6%On-ramp from SR-55 NB Weave - F - F 50 0.6%Southbound SR-73 On-ramp from SR-55 SB to Campus/Bristol St S Off-ramp Weave - F - F 30 0.4%
Northbound I-405 Culver St On-ramp to Jamboree Rd Off-ramp Basic 25.6 F 25.8 F 30 0.4% Jamboree Rd Off-ramp Diverge 18.4 F 18.5 F 30 0.3%Jamboree Rd Loop On-ramp Merge 23.9 F 24.0 F 30 0.4%

Transportation/Traffic
JOHN WAYNE AIRPORT SETTLEMENT AGREEMENT AMENDMENT 4.8-129 ENVIRONMENTAL IMPACT REPORT
TABLE 4.8-87 FREEWAY MAINLINE AND RAMPS OPERATIONS
PHASE 2 NO PROJECT ALTERNATIVE – PM PEAK HOUR Location Type
Without Project With No Project AlternativeDensity
(pc/mi/ln) LOS Density
(pc/mi/ln) LOS Project Trips
Percent IncreaseJamboree Rd Direct On-ramp to MacArthur Blvd Off-ramp Weave 40.2 F 40.6 F 40 0.4% MacArthur Blvd On-ramp to SR-55 NB & SB Off-ramp Weave - F - F 20 0.2% SR-55 Off-ramp to Bristol St Off-ramp Basic 26.4 F 26.5 F 10 0.2% Bristol St/Ave of the Arts Off-ramp Diverge 31.1 F 31.2 F 10 0.1% On-ramp from SR-55 SB Basic 22.5 F 22.5 F 0 0.0%Bristol St N On-ramp Merge 21.4 F 21.4 F 0 0.0%Bristol St S On-ramp to South Coast Off-ramp Weave - F - F 0 0.0%
Southbound I-405 SR-55 SB On-ramp to MacArthur Blvd Off-ramp Weave - F 44.2 E 60 0.6% MacArthur Blvd On-ramp to Jamboree Rd Off-ramp Weave 44.3 E 45.4 E 60 0.6% Jamboree Rd Loop On-ramp Merge 22.4 F 22.2 F 60 0.9% Jamboree Rd Direct On-ramp Merge 22.7 F 23.2 F 70 0.9% Notes: 1. Freeway facilities operating below acceptable standards are noted in bold. 2. Analysis performed using the HCM 2010 methodology. 3. pc/mi/ln = passenger cars per mile per lane. 4. NB=Northbound; SB=Southbound Source: Transportation Impact Analysis, (Full data in Tables 10-22, 10-23, and 10-24), Fehr & Peers, 2014 Phase 3 Table 4.8-88 shows with the No Project Alternative, Phase 3 there would be a significant impact at Intersections 17 (Campus Drive at Bristol Street North), and 53 (Von Karman Avenue at Alton Parkway), during the PM peak hour. The LOS for each of the 59 study intersections under the No Project Alternative, Phase 3 is provided in Appendix G (Table 10-25).

Transportation/Traffic
4.8-130 JOHN WAYNE AIRPORT SETTLEMENT AGREEMENT AMENDMENT ENVIRONMENTAL IMPACT REPORT
TABLE 4.8-88 INTERSECTION LEVEL OF SERVICE
PHASE 3 NO PROJECT ALTERNATIVE Intersection
Traffic Control Peak Hour
Without Project
With No Project Alternative
V/C LOS V/C LOS Change17. Campus Dr at Bristol St North1 Signal AM 0.666 B 0.678 B 0.012PM 1.009 F 1.030 F 0.02125. Santa Ana Ave at Del Mar Ave2,3 Signal AM 36.3 E 36.3 E 0.00PM 28.1 D 29.0 D 0.90Boldface indicates the intersection is operating below acceptable standards for the applicable jurisdiction. Notes: Signalized intersections evaluated using ICU methodology. 1. Based on City of Newport Beach intersection analysis methodology. 2. Based on City of Costa Mesa intersection analysis methodology. 3. AWSC = All Way Stop Control; average intersection delay is reported. Source: Transportation Impact Analysis, (Full data in Table 10-25), Fehr & Peers, 2014 Of the four intersections under the shared jurisdiction of Caltrans only the Jamboree Road at the I-405 southbound ramps would operate at deficient conditions under the with No Project Alternative scenario. However, as shown in Table 4.8-89 this intersection would not be adversely impacted by the No Project Alternative, Phase 3. With the addition of the No Project Alternative-generated trips, the overall intersection delay would improve at the Jamboree Road/I-405 southbound ramps during the AM peak hour because the No Project Alternative, Phase 3 would increase traffic to the movements that have available capacity or “green time”. As previously indicated, since intersection delay is reported as a weighted average of all movements, this increase in traffic volume actually results in a reduction of overall intersection delay.
TABLE 4.8-89 CALTRANS INTERSECTION LEVEL OF SERVICE
PHASE 3 NO PROJECT ALTERNATIVE Intersection
Traffic Control Peak Hour
Without Project With No Project
Alternative Delaya LOS Delaya LOSJamboree Rd at I-405 Southbound Ramps Signal AM 106.3 F 106.3 FPM 30.7 C 30.7 C
Boldface indicates the intersection is operating below acceptable standards for the applicable jurisdiction. a Delay is provided in seconds. Source: Transportation Impact Analysis, (Full data in Table 10-26), Fehr & Peers, 2014 Table 4.8-90 identifies the freeway mainline and ramp locations that would operate at a deficient LOS on SR-55, SR-73, and I-405 during the AM peak hour. Table 4.8-91 identifies the freeway mainline and ramp locations that would operate at a deficient LOS during the PM peak hour for these same facilities.

Transportation/Traffic
JOHN WAYNE AIRPORT SETTLEMENT AGREEMENT AMENDMENT 4.8-131 ENVIRONMENTAL IMPACT REPORT
As shown in the tables, most of these facilities would operate at deficient levels of service without the No Project Alternative-related traffic. However, because the addition of the No Project Alternative would not result in a decrease in LOS from acceptable to unacceptable, and because the addition of project trips would not increase traffic by 2 percent or more, impacts would be less than significant. TABLE 4.8-90
FREEWAY MAINLINE AND RAMPS OPERATIONS PHASE 3 NO PROJECT ALTERNATIVE – AM PEAK HOUR
Location Type
Without Project Plus No Project AlternativeDensity
(pc/mi/ln) LOS Density
(pc/mi/ln) LOS Project Trips
Percent Increase
Northbound SR-55 Fair Dr/Del Mar Ave/ Newport Blvd On-ramp to SR-73 Off-ramp Weave - F - F 20 0.2% Baker St Off-ramp to SR-73 On-ramp Basic 38.0 F 38.3 F 20 0.3% On-ramp from SR-73 NB to Off-ramp to I-405 SB Weave - F - F 20 0.2% Off-ramp to I-405 SB to Paularino Ave On-ramp Basic 45.0 F - F 10 0.2% Paularino Ave On-ramp Merge - F - F 20 0.3%Paularino Ave On-ramp to I-405 SB On-ramp Basic - F - F 20 0.3% On-ramp from I-405 SB Basic - F - F 20 0.2%On-ramp from I-405 NB to MacArthur Blvd Off-ramp Weave - F - F 60 0.5%
Southbound SR-55 MacArthur Blvd Direct On-ramp to Off-ramp to I-405 SB Weave - F - F 60 0.6% On-ramp from I-405 NB to Off-ramp to SR-73 SB Weave - F - F 20 0.2%
Northbound SR-73 Lane Drop to MacArthur Blvd On-ramp Basic 40.5 E 40.6 E 10 0.2% MacArthur Blvd On-ramp Basic 36.8 E 36.9 E 20 0.3%Jamboree Rd On-ramp Merge 35.0 D 35.1 E 30 0.3%Jamboree Rd On-ramp to Bristol St N Off-ramp Basic 43.3 E 43.6 E 30 0.3% Bristol St N Off-ramp Diverge - F - F 30 0.3%Bristol St N On-ramp to SR-55 N Off-ramp Weave - F - F 70 0.7% On-ramp from SR-55 NB Weave - F - F 50 0.7%

Transportation/Traffic
4.8-132 JOHN WAYNE AIRPORT SETTLEMENT AGREEMENT AMENDMENT ENVIRONMENTAL IMPACT REPORT
TABLE 4.8-90 FREEWAY MAINLINE AND RAMPS OPERATIONS
PHASE 3 NO PROJECT ALTERNATIVE – AM PEAK HOUR Location Type
Without Project Plus No Project AlternativeDensity
(pc/mi/ln) LOS Density
(pc/mi/ln) LOS Project Trips
Percent Increase
Southbound SR-73 Bear St On-ramp to SR-55 S Off-ramp Weave 39.0 E 39.3 E 30 0.5% On-ramp from SR-55 SB to Campus/Bristol St S Off-ramp Weave - F - F 50 0.5%
Northbound I-405 Culver St On-ramp to Jamboree Rd Off-ramp Basic 43.0 E 43.4 E 30 0.3% Jamboree Rd Direct On-ramp to MacArthur Blvd Off-ramp Weave - F - F 30 0.2% MacArthur Blvd On-ramp to SR-55 NB & SB Off-ramp Weave 37.6 E 37.7 E 10 0.1% Bristol St S On-ramp to South Coast Off-ramp Weave - F - F 0 0.0%
Southbound I-405 Off-ramp to I-405 SB to Fairview Rd On-ramp Basic 31.1 F 31.2 F 20 0.2% Fairview Rd On-ramp Merge 34.4 F 34.5 F 30 0.3%Fairview Rd On-ramp to Bristol St Off-ramp Basic 39.0 F 39.3 F 30 0.3% Bristol St Off-ramp Diverge 27.4 F 27.5 F 30 0.3%Bristol St On-ramp to SR-55 NB Off-ramp Weave - F - F 40 0.3% On-ramp from SR-55 NB Basic 35.2 E 35.5 E 50 0.5%SR-55 SB On-ramp to MacArthur Blvd Off-ramp Weave - F - F 50 0.4% MacArthur Blvd On-ramp to Jamboree Rd Off-ramp Weave - F - F 50 0.4% Notes: 1. Freeway facilities operating below acceptable standards are noted in bold. 2. Analysis performed using the HCM 2010 methodology. 3. pc/mi/ln = passenger cars per mile per lane. 4. NB=Northbound; SB=Southbound Source: Transportation Impact Analysis, (Full data in Tables 10-27, 10-28, and 10-29), Fehr & Peers, 2014

Transportation/Traffic
JOHN WAYNE AIRPORT SETTLEMENT AGREEMENT AMENDMENT 4.8-133 ENVIRONMENTAL IMPACT REPORT
TABLE 4.8-91 FREEWAY MAINLINE AND RAMPS OPERATIONS
PHASE 3 NO PROJECT ALTERNATIVE – PM PEAK HOUR Location Type
Without Project With No Project AlternativeDensity
(pc/mi/ln) LOS Density
(pc/mi/ln) LOS Project Trips
Percent Increase
Northbound SR-55 Fair Dr/Del Mar Ave/ Newport Blvd On-ramp to SR-73 Off-ramp Weave - F - F 20 0.3% Paularino Ave On-ramp Merge 15.7 F 15.8 F 20 0.7%Paularino Ave On-ramp to I-405 SB On-ramp Basic 16.7 F 16.8 F 20 0.7% On-ramp from I-405 SB Basic 16.2 F 16.2 F 20 0.5%On-ramp from I-405 NB to MacArthur Blvd Off-ramp Weave 25.5 F 26.1 F 80 1.3%
Southbound SR-55 MacArthur Blvd Loop On-ramp to MacArthur Blvd Direct On-ramp Basic 36.7 E 36.9 E 30 0.4% MacArthur Blvd Direct On-ramp to Off-ramp to I-405 SB Weave - F - F 50 0.5% On-ramp from I-405 NB to Off-ramp to SR-73 SB Weave - F - F 10 0.1% SR-73 SB On-ramp to Newport Blvd S/Mesa Dr Off-ramp Weave - F - F 20 0.2%
Northbound SR-73 Bristol St N Off-ramp Diverge 36.0 E 36.2 E 30 0.4%Bristol St N On-ramp to SR-55 N Off-ramp Weave - F - F 60 0.5% Off-ramp to SR-55 SB Diverge - F - F 60 0.6%On-ramp from SR-55 NB Weave - F - F 50 0.6%Southbound SR-73 On-ramp from SR-55 SB to Campus/Bristol St S Off-ramp Weave - F - F 30 0.4%
Northbound I-405 Culver St On-ramp to Jamboree Rd Off-ramp Basic 25.8 F 25.9 F 30 0.4% Jamboree Rd Off-ramp Diverge 18.5 F 18.6 F 30 0.3%Jamboree Rd Loop On-ramp Merge 24.0 F 24.2 F 30 0.4%

Transportation/Traffic
4.8-134 JOHN WAYNE AIRPORT SETTLEMENT AGREEMENT AMENDMENT ENVIRONMENTAL IMPACT REPORT
TABLE 4.8-91 FREEWAY MAINLINE AND RAMPS OPERATIONS
PHASE 3 NO PROJECT ALTERNATIVE – PM PEAK HOUR Location Type
Without Project With No Project AlternativeDensity
(pc/mi/ln) LOS Density
(pc/mi/ln) LOS Project Trips
Percent IncreaseJamboree Rd Direct On-ramp to MacArthur Blvd Off-ramp Weave 40.5 F 40.9 F 40 0.4% MacArthur Blvd On-ramp to SR-55 NB & SB Off-ramp Weave - F - F 20 0.2% SR-55 Off-ramp to Bristol St Off-ramp Basic 26.5 F 26.6 F 10 0.2% Bristol St/Ave of the Arts Off-ramp Diverge 31.1 F 31.3 F 10 0.1% On-ramp from SR-55 SB Basic 22.6 F 22.6 F 0 0.0%Bristol St N On-ramp Merge 21.5 F 21.5 F 0 0.0%Bristol St S On-ramp to S Coast Off Weave - F - F 0 0.0%
Southbound I-405 SR-55 SB On-ramp to MacArthur Blvd Off-ramp Weave - F - F 60 0.6% MacArthur Blvd On-ramp to Jamboree Rd Off-ramp Weave 44.4 E 44.9 E 60 0.6% Jamboree Rd Loop On-ramp Merge 22.5 F 22.0 F 60 0.9% Jamboree Rd Direct On-ramp Merge 22.8 F 23.1 F 70 0.9% Notes: 1. Freeway facilities operating below acceptable standards are noted in bold. 2. Analysis performed using the HCM 2010 methodology. 3. pc/mi/ln = passenger cars per mile per lane. 4. NB=Northbound; SB=Southbound Source: Transportation Impact Analysis, (Full data in Tables 10-30, 10-31, and 10-32), Fehr & Peers, 2014 Caltrans Ramp Queue Analysis A 95th percentile queue analysis has been prepared utilizing the Synchro 7 software to determine if adequate queue storage is provided at the off-ramp at MacArthur Boulevard and Jamboree Road under the No Project Alternative scenario. Adequate queue storage is forecast to be provided at the Caltrans off-ramp locations. The detailed analysis is provided in Table 11-1 in the Transportation Impact Analysis (Appendix G).
Transportation/Traffic
JOHN WAYNE AIRPORT SETTLEMENT AGREEMENT AMENDMENT 4.8-135 ENVIRONMENTAL IMPACT REPORT
THRESHOLD EVALUATION This section provides a summary of the analyses presented above relative to the Proposed Project and each of the project alternatives, including application of the significance thresholds to the identified impacts, and is organized on a jurisdictional basis. City of Irvine Threshold 4.8-1: In the City of Irvine outside of the Irvine Business Complex (“IBC”), the addition of Project-generated trips increases the ICU at a study intersection by 0.01 or more of capacity, causing the intersection to change from an acceptable LOS D to LOS E or LOS F. Threshold 4.8-2: In the City of Irvine inside the IBC, the addition of Project-generated trips increases the ICU at a study intersection by 0.01 or more of capacity, causing the intersection to change from an acceptable LOS E to LOS F. Threshold 4.8-3: In the City of Irvine outside of the IBC, the addition of Project-generated trips increases the ICU by 0.02 more at a study intersection operating at LOS E or F under baseline conditions. Threshold 4.8-4: In the City of Irvine inside the IBC, the addition of Project-generated trips increases the ICU by 0.02 more at a study intersection operating at LOS E or F under baseline conditions. Proposed Project There would be no significant impacts associated with any of the above thresholds within the City of Irvine under the Existing Plus Proposed Project and the future years scenarios, Proposed Project, Phases 1 and 2. However, with the Proposed Project in Phase 3, operations at the intersection of MacArthur Boulevard/Michelson Drive in the City of Irvine would decrease from LOS E to LOS F with the addition of Proposed Project traffic, with an increase in V/C ratio of 0.03. Additionally, in Phase 3, operations at the intersection of Von Karman Avenue/Alton Parkway in the City of Irvine would decrease from LOS E to LOS F with the addition of Project traffic, with an increase in V/C ratio of 0.02. These intersections are in the IBC and an increase in ICU greater than 0.01 concurrent with this degradation in LOS, is considered a significant impact (Threshold 4.8-2). As shown in Table 4.8-24, with Phase 3 of the Proposed Project there would be a significant impact for Phase 3; however, there would not be significant impacts based on the other City of Irvine thresholds. Impact Conclusion: The addition of Project-generated trips associated with the Proposed
Project, Phase 3 would increases the ICU at a study intersection within the IBC by 0.01 or more of capacity, causing the intersection to change from an acceptable LOS E to LOS F. This would be a significant impact.
The addition of Proposed Project-generated trips would not increase the ICU by 0.01 or more of capacity, causing intersections in the City of Irvine outside of the Irvine Business Complex (“IBC”) to change from an acceptable LOS D to LOS E or LOS F. The Proposed Project-generated trips would also not increases the ICU by 0.02 or more at a study intersection in the City of Irvine outside of the IBC operating at LOS E or F under baseline conditions. The

Transportation/Traffic
4.8-136 JOHN WAYNE AIRPORT SETTLEMENT AGREEMENT AMENDMENT ENVIRONMENTAL IMPACT REPORT
Proposed Project-generated trips would not increase the ICU by 0.02 or more at a study intersection in the City of Irvine inside the IBC operating at LOS E or F under baseline conditions. These impacts would be less than significant. Alternative A There would be no significant impacts associated with any of the above thresholds within the City of Irvine under the Existing Plus Alternative A and the future year scenarios Alternative A, Phases 1 and 2. However, in Alternative A, Phase 3 operations at the intersection of MacArthur Boulevard/Michelson Drive in the City of Irvine would decrease from LOS E to LOS F with the addition of Alternative A traffic, with an increase in V/C ratio of 0.03. Additionally, in Phase 3 operations at the intersection of Von Karman Avenue/Alton Parkway in the City of Irvine would decrease from LOS E to LOS F with the addition of Alternative A traffic, with an increase in V/C ratio of 0.02. These intersections are in the IBC and an increase in ICU greater than 0.01 concurrent with this degradation in LOS, is considered a significant impact (Threshold 4.8-2). As shown in Table 4.8-40, with Phase 3 of Alternative A there would be a significant impact for Phase 3; however, there would not be significant impacts based on the other City of Irvine thresholds.
Impact Conclusion: The addition of Project-generated trips associated with Alternative A, Phase 3 would increase the ICU at a study intersection within the IBC by 0.01 or more of capacity, causing the intersection to change from an acceptable LOS E to LOS F. This would be a significant impact.
The addition of Alternative A-generated trips would not increase the ICU by 0.01 or more of capacity, causing intersections in the City of Irvine outside of the Irvine Business Complex (“IBC”) to change from an acceptable LOS D to LOS E or LOS F. The Alternative A-generated trips would also not increase the ICU by 0.02 or more at a study intersection in the City of Irvine outside of the IBC operating at LOS E or F under baseline conditions. The Alternative A-generated trips would not increase the ICU by 0.02 or more at a study intersection in the City of Irvine inside the IBC operating at LOS E or F under baseline conditions. These impacts would be less than significant. Alternative B There would be no significant impacts associated with any of the above thresholds within the City of Irvine under the Existing Plus Alternative B and the future year scenarios Alternative B, Phases 1 and 2. In Alternative B, Phase 3, the intersection of MacArthur Boulevard and Michelson Drive in the City of Irvine would degrade from LOS E to LOS F, with an increase in V/C ratio of 0.06. Since the increase in ICU is greater than 0.01 concurrent with this degradation in LOS, a significant impact occurs. The intersection of Von Karman Avenue and Alton Parkway in the City of Irvine would also degrade from LOS E to LOS F, with an increase in V/C ratio of 0.02. Since the increase in ICU is greater than 0.01 concurrent with this degradation in LOS, this would also be considered a significant impact. However, there would not be significant impacts based on the other City of Irvine thresholds.
Impact Conclusion: The addition of Project-generated trips for the Alternative B, Phase 3 would increase the ICU at two study intersection within the IBC by 0.01 or more of

Transportation/Traffic
JOHN WAYNE AIRPORT SETTLEMENT AGREEMENT AMENDMENT 4.8-137 ENVIRONMENTAL IMPACT REPORT
capacity, causing the intersection to change from an acceptable LOS E to LOS F. This would be a significant impact.
The addition of Alternative B-generated trips would not increase the ICU by 0.01 or more of capacity, causing intersections in the City of Irvine outside of the Irvine Business Complex (“IBC”) to change from an acceptable LOS D to LOS E or LOS F. The Alternative B-generated trips would also not increase the ICU by 0.02 or more at a study intersection in the City of Irvine outside of the IBC operating at LOS E or F under baseline conditions. The Alternative B-generated trips would not increase the ICU by 0.02 or more at a study intersection in the City of Irvine inside the IBC operating at LOS E or F under baseline conditions. These impacts would be less than significant. Alternative C There would be no significant impacts associated with any of the above thresholds within the City of Irvine under the Existing Plus Alternative C scenario. Under the future year scenarios, for all phases of Alternative C, the intersection of MacArthur Boulevard and Michelson Drive in the City of Irvine would degrade from LOS E to LOS F, with an increase in V/C ratio of 0.09. Since the increase in ICU is greater than 0.01 concurrent with this degradation in LOS, a significant impact occurs. Additionally, in Phase 3, the intersection of Von Karman Avenue and Alton Parkway in the City of Irvine would degrade from LOS E to LOS F, with an increase in V/C ratio of 0.02. Since the increase in ICU is greater than 0.01 concurrent with this degradation in LOS, a significant impact occurs (Threshold 4.8-2) (see Tables 4.8-64, 4.8-68, and 4.8-72, for Phases 1 through 3, respectively). However, there would not be significant impacts based on the other City of Irvine thresholds.
Impact Conclusion: The addition of Project-generated trips associated with Alternative C would increase the ICU at two study intersections within the IBC by 0.01 or more of capacity, causing the intersections to change from an acceptable LOS E to LOS F. This would be a significant impact.
The addition of Alternative C-generated trips would not increase the ICU by 0.01 or more of capacity, causing intersections in the City of Irvine outside of the Irvine Business Complex (“IBC”) to change from an acceptable LOS D to LOS E or LOS F. The Alternative C-generated trips would also not increase the ICU by 0.02 or more at a study intersection in the City of Irvine outside of the IBC operating at LOS E or F under baseline conditions. The Alternative C-generated trips would not increase the ICU by 0.02 or more at a study intersection in the City of Irvine inside the IBC operating at LOS E or F under baseline conditions. These impacts would be less than significant. No Project Alternative Impacts associated with the No Project Alternative would be less than significant for all City of Irvine thresholds for the Existing Plus No Project and all future year phases of the No Project Alternative.

Transportation/Traffic
4.8-138 JOHN WAYNE AIRPORT SETTLEMENT AGREEMENT AMENDMENT ENVIRONMENTAL IMPACT REPORT
Impact Conclusion: The addition of Project-generated trips associated with the No Project Alternative would not increase the ICU at a study intersection within the IBC by 0.01 or more of capacity, causing the intersection to change from an acceptable LOS E to LOS F. No Project Alternative-generated trips would not increase the ICU by 0.01 or more of capacity, causing intersections in the City of Irvine outside of the Irvine Business Complex (“IBC”) to change from an acceptable LOS D to LOS E or LOS F. The No Project Alternative -generated trips would also not increase the ICU by 0.02 or more at a study intersection in the City of Irvine outside of the IBC operating at LOS E or F under baseline conditions. The No Project Alternative-generated trips would not increase the ICU by 0.02 or more at a study intersection in the City of Irvine inside the IBC operating at LOS E or F under baseline conditions. These impacts would be less than significant for all phases of the No Project Alternative.
City of Newport Beach Threshold 4.8-5: In the City of Newport Beach outside of the JWA Area shared with the City of Irvine, the addition of Project-generated trips causes the LOS at a study intersection to change from LOS D to LOS E or F. Threshold 4.8-6: In the City of Newport Beach inside the JWA Area shared with the City of Irvine, the addition of Project-generated trips causes the LOS at a study intersection to change from an acceptable LOS E to LOS F. Threshold 4.8-7: In the City of Newport Beach outside of the JWA Area shared with the City of Irvine, the addition of Project-generated trips increases the ICU by 0.010 or more at a study intersection operating at LOS E or F under baseline conditions. Threshold 4.8-8: In the City of Newport Beach inside of the JWA Area shared with the City of Irvine, the addition of Project-generated trips increases the ICU by 0.010 or more at a study intersection operating at LOS F under baseline conditions. Proposed Project Under the Existing Plus Proposed Project scenario, the LOS at the intersection of Campus Drive/Bristol Street North in the City of Newport Beach worsens from LOS D to LOS E with the addition of Proposed Project-related trips. As this intersection is outside of the JWA area, this degradation of LOS is a significant impact (see Table 4.8-12) (Threshold 4.8-5). However, as previously discussed, the Existing Plus Proposed Project scenario can be misleading and is therefore provided for informational purposes only. Under the future year scenarios, the Campus Drive/ Bristol Street North intersection is projected to operate at LOS E in Phases 1 and 2 with or without the addition of the Proposed Project-related traffic. However, under the Proposed Project, Phase 1, the addition of Project-related traffic causes the ICU at the Campus Drive/ Bristol Street North intersection to increase by 0.020 at an intersection which is projected to operate at LOS E prior to the addition of Proposed Project, Phase 1 traffic. Since this increase in ICU is greater than 0.01, a significant impact occurs. The ICU at this same intersection would increase by 0.034 in Phase 2, and 0.044 in Phase 3 compared to the applicable baseline. In Phase 3, this intersection is projected to operate at LOS F with or

Transportation/Traffic
JOHN WAYNE AIRPORT SETTLEMENT AGREEMENT AMENDMENT 4.8-139 ENVIRONMENTAL IMPACT REPORT
without the Proposed Project traffic. Since these increases in ICU are greater than 0.01, a significant impact occurs in all three phases of the Proposed Project (see Tables 4.8-16, 4.8-20, and 4.8-24, respectively) (Threshold 4.8-7). Impact Conclusion: The addition of Project-generated trips associated with the Proposed Project
would result in the ICU of a study intersection in the City of Newport Beach, outside of the JWA Area shared with the City of Irvine, to increase by 0.010 or more at a location where the intersection is projected to operate at LOS E or F under baseline conditions. This would be a significant impact.
There are no locations in the City of Newport Beach outside of the JWA Area shared with the City of Irvine where the addition of Proposed Project-generated trips would cause the LOS at a study intersection to change from LOS D to LOS E or F. There are no locations in the City of Newport Beach inside the JWA Area shared with the City of Irvine where the addition of Proposed Project-generated trips would cause the LOS at a study intersection to change from an acceptable LOS E to LOS F. There are also no locations in the City of Newport Beach inside of the JWA Area shared with the City of Irvine where the addition of Proposed Project-generated trips would increase the ICU by 0.010 or more at a study intersection operating at LOS F under baseline conditions. These impacts would be less than significant. Alternative A The LOS for the Campus Drive/Bristol Street North intersection, in the City of Newport Beach, would worsen from LOS D to LOS E with the addition of Alternative A-related trips under the Existing Plus Alternative A evaluation. As this intersection is outside of the JWA area, this degradation of LOS is a significant impact (see Table 4.8-28) (Threshold 4.8-5). However, as previously discussed, the Existing Plus Project scenario can be misleading and is provided for informational purposes only. Under the future year scenarios, the Campus Drive/ Bristol Street North intersection is projected to operate at LOS E in Phases 1 and 2 with or without the addition of the Alternative A-related traffic. However, the Phase 1 traffic would cause the ICU to increase by 0.020 at this location. Since this increase in ICU is greater than 0.01, a significant impact occurs. The ICU at this same intersection would increase by 0.034 in Phase 2 and 0.046 in Phase 3 compared to the applicable baseline. In Phase 3, this intersection is projected to operate at LOS F with or without the Alternative A traffic. Since these increases in ICU are greater than 0.01, a significant impact occurs in all three phases of Alternative A (see Tables 4.8-32, 4.8-36, and 4.8-40, respectively) (Threshold 4.8-7).
Impact Conclusion: The addition of Project-generated trips associated with Alternative A would result in the ICU of a study intersection in the City of Newport Beach, outside of the JWA Area shared with the City of Irvine, to increase by 0.010 or more at a location where the intersection is projected to operate at LOS E or F under baseline conditions. This would be a significant impact.
There are no locations in the City of Newport Beach outside of the JWA Area shared with the City of Irvine where the addition of Alternative A-generated

Transportation/Traffic
4.8-140 JOHN WAYNE AIRPORT SETTLEMENT AGREEMENT AMENDMENT ENVIRONMENTAL IMPACT REPORT
trips would cause the LOS at a study intersection to change from LOS D to LOS E or F. There are no locations in the City of Newport Beach inside the JWA Area shared with the City of Irvine where the addition of Alternative A-generated trips would cause the LOS at a study intersection to change from an acceptable LOS E to LOS F. There are also no locations in the City of Newport Beach inside of the JWA Area shared with the City of Irvine where the addition of Alternative A-generated trips would increase the ICU by 0.010 or more at a study intersection operating at LOS F under baseline conditions. These impacts would be less than significant. Alternative B The LOS for the Campus Drive/Bristol Street North intersection, in the City of Newport Beach, would worsen from LOS D to LOS E with the addition of Alternative B-related trips under the Existing Plus Alternative B evaluation. As this intersection is outside of the JWA Area, this degradation of LOS is a significant impact (see Table 4.8-44) (Threshold 4.8-5). However, as previously discussed, the Existing Plus Project scenario can be misleading and is provided for informational purposes only. Under the future year scenarios, the Campus Drive/ Bristol Street North intersection is projected to operate at LOS E in Phases 1 and 2 with or without the addition of the Alternative B-related traffic. However, the Phase 1 traffic would cause the ICU to increase by 0.020 at this location. Since this increase in ICU is greater than 0.01, a significant impact occurs. In Phase 2 this intersection is projected to operate at LOS E without the Alternative B-related traffic. With the projected Alternative B, Phase 2 traffic, the ICU would increase by 0.048 in Phase 2 compared to the without Project baseline and operate at LOS F. In Phase 3 this intersection is projected to operate at LOS F with and without the Alternative B, Phase 3-related traffic. With the projected Alternative B, Phase 3 traffic, the ICU would increase by 0.072 compared to the applicable baseline. Since these increases in ICU are greater than 0.01, a significant impact occurs in all three phases of Alternative B (see Tables 4.8-48, 4.8-52, and 4.8-56, respectively) (Threshold 4.8-7). In addition, the LOS at the intersection of Campus Drive and Airport Way in the City of Newport Beach would degrade from LOS C to LOS E with the addition of the Alternative B, Phase 3 trips; therefore a significant impact occurs at this location (Threshold 4.8-5)(see Table 4.8-56).
Impact Conclusion: The addition of Project-generated trips associated with Alternative B would result in the ICU of a study intersection in the City of Newport Beach, outside of the JWA Area shared with the City of Irvine, to increase by 0.010 or more at a location where the intersection is projected to operate at LOS E or F under baseline conditions. This would be a significant impact.
There are no locations in the City of Newport Beach outside of the JWA Area shared with the City of Irvine where the addition of Alternative B-generated trips would cause the LOS at a study intersection to change from LOS D to LOS E or F. There are no locations in the City of Newport Beach inside the JWA Area shared with the City of Irvine where the addition of Alternative B-generated trips would cause the LOS at a study intersection to change from an acceptable LOS E to LOS F. There are also no locations in the City of Newport Beach inside of the JWA Area shared with the City of Irvine where the addition of Alternative B-generated trips would increase the ICU by

Transportation/Traffic
JOHN WAYNE AIRPORT SETTLEMENT AGREEMENT AMENDMENT 4.8-141 ENVIRONMENTAL IMPACT REPORT
0.010 or more at a study intersection operating at LOS F under baseline conditions. These impacts would be less than significant. Alternative C The LOS for the Campus Drive and Bristol Street North intersection, in the City of Newport Beach, would worsen from LOS D to LOS E with the addition of Alternative C-related trips under the Existing Plus Alternative C evaluation. As this intersection is outside of the JWA Area, this degradation of LOS is a significant impact. In addition, the LOS at the intersection of Campus Drive and Airport Way in the City of Newport Beach would degrade to LOS E with the addition of Alternative C-generated trips. The degradation of the LOS at these two intersections would be considered a significant impact (see Table 4.8-60) (Threshold 4.8-5). However, as previously discussed, the Existing Plus Project scenario can be misleading and is provided for informational purposes only. Under the future year scenarios, for all three phases of Alternative C, the LOS at the intersection of Campus Drive and Airport Way in the City of Newport Beach would degrade to LOS E with the addition of Project trips; therefore, a significant impact occurs (Threshold 4.8-5). Additionally, in all three phases the Project traffic causes the ICU at the Campus Drive and Bristol Street North intersection to increase by more than 0.01 (Phases 1 and 2 would increase by 0.095 and Phase 3 would increase 0.096). Since the intersection is projected to operate at LOS E prior to the addition of Project traffic a significant impact would occur (Threshold 4.8-7). See Tables 4.8-64, 4.8-68, and 4.8-72, for Phases 1 through 3, respectively.
Impact Conclusion: The addition of Project-generated trips associated with Alternative C would result in the ICU of a study intersection in the City of Newport Beach, outside of the JWA Area shared with the City of Irvine to increase by 0.010 or more at a location where the intersection is projected to operate at LOS E or F under baseline conditions. This would be a significant impact.
There are no locations in the City of Newport Beach inside the JWA Area shared with the City of Irvine where the addition of Alternative C-generated trips would causes the LOS at a study intersection to change from an acceptable LOS E to LOS F. There are also no locations in the City of Newport Beach inside of the JWA Area shared with the City of Irvine where the addition of Alternative C-generated trips would increase the ICU by 0.010 or more at a study intersection operating at LOS F under baseline conditions. These impacts would be less than significant. No Project Alternative Under the Existing Plus No Project Alternative scenario, the LOS at the intersection of Campus Drive/Bristol Street North in the City of Newport Beach worsens from LOS D to LOS E with the addition of No Project-related trips. As this intersection is outside of the JWA area, this degradation of LOS is a significant impact (see Table 4.8-76) (Threshold 4.8-5). However, as previously discussed, the Existing Plus Project scenario can be misleading and is therefore provided for informational purposes only. Under the future year scenarios, the Campus Drive and Bristol Street North intersection is projected to operate at LOS E in Phases 1 and 2 with or without the addition of the No Project

Transportation/Traffic
4.8-142 JOHN WAYNE AIRPORT SETTLEMENT AGREEMENT AMENDMENT ENVIRONMENTAL IMPACT REPORT
Alternative-related traffic. In Phase 3, this intersection is projected to operate at LOS F with or without the No Project Alternative traffic. In Phases 1 and 2 of the No Project Alternative, the addition of No Project Alternative-related traffic causes the ICU at the Campus Drive and Bristol Street North intersection to increase by 0.020. In Phase 3, the ICU would be increased by 0.021. For all phases, since this intersection is projected to operate at LOS E prior to the addition of No Project Alternative-generated traffic and the increase in ICU is greater than 0.01, a significant impact occurs. (see Tables 4.8-80, 4.8-84, and 4.8-88 for Phases 1 through 3, respectively) (Threshold 4.8-7). Impact Conclusion: The addition of Project-generated trips associated with the No Project
Alternative would result in the ICU of a study intersection in the City of Newport Beach, outside of the JWA Area shared with the City of Irvine, to increase by 0.010 or more at a location where the intersection is projected to operate at LOS E or F under baseline conditions. This would be a significant impact.
There are no locations in the City of Newport Beach outside of the JWA Area shared with the City of Irvine where the addition of No Project Alternative-generated trips would cause the LOS at a study intersection to change from LOS D to LOS E or F. There are no locations in the City of Newport Beach inside the JWA Area shared with the City of Irvine where the addition of No Project Alternative-generated trips would cause the LOS at a study intersection to change from an acceptable LOS E to LOS F. There are also no locations in the City of Newport Beach inside of the JWA Area shared with the City of Irvine where the addition of No Project Alternative-generated trips would increase the ICU by 0.010 or more at a study intersection operating at LOS F under baseline conditions. These impacts would be less than significant.
City of Costa Mesa Threshold 4.8-9: The addition of Project-generated trips causes the LOS at a study intersection within the City of Costa Mesa to change from LOS D to LOS E or F. Proposed Project Under the Existing Plus Project scenario, there would be no significant impacts under the Proposed Project associated with the above threshold within the City of Costa Mesa. As to the future year scenarios, under the Proposed Project, Phase 3, the Santa Ana Avenue at Del Mar Avenue intersection in the City of Costa Mesa (Intersection 25) is projected to operate at LOS E, with or without Phase 3 of the Proposed Project in the AM peak hour. Though the intersection would receive additional traffic associated with the Proposed Project, the additional traffic would not reduce the LOS at this intersection. The Proposed Project (all phases) would not cause the LOS at any study intersections in the City of Costa Mesa to change from LOS D to LOS E or F. Impact Conclusion: The additional trips generated by the Proposed Project (all phases) would
not cause the LOS at any study intersections in the City of Costa Mesa to

Transportation/Traffic
JOHN WAYNE AIRPORT SETTLEMENT AGREEMENT AMENDMENT 4.8-143 ENVIRONMENTAL IMPACT REPORT
change from LOS D to LOS E or F. The impacts would be less than significant pursuant to this threshold. Alternative A Under the Existing Plus Project scenario, there would be no significant impacts under Alternative A associated with the above threshold within the City of Costa Mesa. As to the future year scenarios, in Alternative A, Phase 3, the Santa Ana Avenue at Del Mar Avenue intersection in the City of Costa Mesa (Intersection 25) is projected to operate at LOS E, with or without the Proposed Project in the AM peak hour. Though the intersection would receive additional traffic associated with Alternative A, the additional traffic would not reduce the LOS at this intersection. Alternative A (all phases) would not cause the LOS at any study intersections in the City of Costa Mesa to change from LOS D to LOS E or F.
Impact Conclusion: The additional trips generated by Alternative A (all phases) would not cause the LOS at any study intersections in the City of Costa Mesa to change from LOS D to LOS E or F. The impacts would be less than significant pursuant to this threshold. Alternative B Under the Existing Plus Project scenario, there would be no significant impacts under Alternative B associated with the above threshold within the City of Costa Mesa. As to the future year scenarios, in Alternative B, Phase 3, the Santa Ana Avenue at Del Mar Avenue intersection in the City of Costa Mesa (Intersection 25) is projected to operate at LOS E, with or without the Proposed Project in the AM peak hour. Though the intersection would receive additional traffic associated with Alternative B, the additional traffic would not reduce the LOS at this intersection. Alternative B (all phases) would not cause the LOS at any study intersections in the City of Costa Mesa to change from LOS D to LOS E or F.
Impact Conclusion: The additional trips generated by Alternative B (all phases) would not cause the LOS at any study intersections in the City of Costa Mesa to change from LOS D to LOS E or F. The impacts would be less than significant pursuant to this threshold. Alternative C Under the Existing Plus Project scenario, there would be no significant impacts under Alternative C associated with the above threshold within the City of Costa Mesa. As to the future year scenarios, in Alternative C, Phase 3 the addition of Project traffic causes the intersection of Santa Ana Avenue and Del Mar Avenue to operate at LOS E during the PM Peak Hour. As this LOS result exceeds the LOS D threshold, a significant impact occurs in the City of Costa Mesa.
Impact Conclusion: The additional trips generated by Alternative C, Phase 3 would cause the LOS at a study intersection in the City of Costa Mesa to change from LOS D to LOS E. This would be a significant impact pursuant to this threshold.

Transportation/Traffic
4.8-144 JOHN WAYNE AIRPORT SETTLEMENT AGREEMENT AMENDMENT ENVIRONMENTAL IMPACT REPORT
No Project Alternative Under the Existing Plus Project scenario, there would be no significant impacts under the No Project Alternative associated with the above threshold within the City of Costa Mesa. As to the future year scenarios, under the No Project Alternative, Phase 3, the Santa Ana Avenue at Del Mar Avenue intersection in the City of Costa Mesa (Intersection 25) is projected to operate at LOS E, with or without the Proposed Project in the AM peak hour. Though the intersection would receive additional traffic associated with the No Project Alternative, the additional traffic would not reduce the LOS at this intersection. The No Project Alternative (all phases) would not cause the LOS at any study intersections in the City of Costa Mesa to change from LOS D to LOS E or F. Impact Conclusion: The additional trips generated by the No Project Alternative (all phases)
would not cause the LOS at any study intersections in the City of Costa Mesa to change from LOS D to LOS E or F. The impacts would be less than significant pursuant to this threshold.
Caltrans Threshold 4.8-10: The addition of Project-generated trips causes the LOS at a study intersection within Caltrans jurisdiction to degrade from LOS A, B, C, or D to LOS E or F (as measured by the application of the HCM methodologies).
Threshold 4.8-11: The addition of Project-generated trips causes a two second or greater increase in delay at a study intersection within Caltrans jurisdiction (as measured by the application of HCM methodologies), where the intersection operates at LOS E or LOS F prior to the addition of Project traffic. Threshold 4.8-12: The addition of Project-generated trips increases the traffic on a freeway mainline, freeway ramp, or merge/diverge section by 2 percent or more, and causes the LOS to degrade from LOS A, B, C, or D to LOS E or F. Threshold 4.8-13: The addition of Project-generated trips increases the traffic on a freeway mainline, freeway ramp, or merge/diverge section by 2 percent or more on a facility operating at LOS E or F prior to the addition of Project traffic. Proposed Project With the Existing Plus Proposed Project scenario, the Project results in an increase in traffic volume of over 2 percent on the northbound SR-55 from the onramp from I-405 to the MacArthur Boulevard off-ramp. This segment operates at LOS F prior to the addition of the Proposed Project traffic. Therefore, based on Threshold 4.8-13, the Proposed Project would result in a significant cumulative impact under the Existing Plus Project scenario (see Table 4.8-15). As previously discussed, the Existing Plus Proposed Project scenario can be misleading and is therefore provided for informational purposes only. However, under the future year scenarios, with the Proposed Project, Phases 2 and 3, this same segment of northbound SR-55 would experience an over 2 percent increase in traffic volume from the Proposed Project. Therefore, the Proposed Project would result in a significant cumulative impact at this location (see Tables 4.8-23 and 4.8-27 for Phases 2 and 3, respectively).

Transportation/Traffic
JOHN WAYNE AIRPORT SETTLEMENT AGREEMENT AMENDMENT 4.8-145 ENVIRONMENTAL IMPACT REPORT
For all phases of the Proposed Project, the impacts associated for the other thresholds would be less than significant. Impact Conclusion: Traffic generated by the Proposed Project, Phases 2 and 3 would increase
traffic volume by more than 2 percent on a Caltrans freeway facility operating at LOS E or F prior to the addition of Proposed Project traffic. This would be a significant cumulative impact.
For all phases, the addition of Proposed Project-generated trips would not cause the LOS at study intersections within Caltrans jurisdiction to degrade from LOS A, B, C, or D to LOS E or F. The addition of Proposed Project-generated trips would not cause a two second or greater increase in delay at a study intersection within Caltrans jurisdiction where the intersection operates at LOS E or LOS F prior to the addition of Proposed Project traffic. The addition of Proposed Project-generated trips would not increase the traffic volume on a freeway mainline, freeway ramp, or merge/diverge section by 2 percent or more, and cause the LOS to degrade from LOS A, B, C, or D to LOS E or F. These impacts would be less than significant. Alternative A As with the Proposed Project, under the Existing Plus Alternative A scenario, the Project results in an increase in traffic volume of over 2 percent on the northbound SR-55 from the onramp from I-405 to the MacArthur Boulevard off-ramp. This segment operates at LOS F prior to the addition of the Alternative A traffic. Therefore, based on Threshold 4.8-13, Alternative A would result in a significant cumulative impact (see Table 4.8-31). As previously discussed, the Existing Plus Project scenario can be misleading and is therefore provided for informational purposes only. However, under the future year scenarios, with Alternative A, Phase 3, this same segment of northbound SR-55 would experience an over 2 percent increase in traffic volume compared to the applicable baseline. Therefore, Alternative A, Phase 3 would result in a significant cumulative impact at this location (see Table 4.8-43). For all phases of Alternative A, the impacts associated for the other thresholds would be less than significant.
Impact Conclusion: Traffic generated by Alternative A, Phase 3 would increase the traffic volume by more than 2 percent on a Caltrans freeway facility operating at LOS E or F prior to the addition of Alternative A traffic. This would be a significant cumulative impact.
For all phases, the addition of Alternative A-generated trips would not cause the LOS at study intersections within Caltrans jurisdiction to degrade from LOS A, B, C, or D to LOS E or F. The addition of Alternative A-generated trips would not cause a two second or greater increase in delay at a study intersection within Caltrans jurisdiction where the intersection operates at LOS E or LOS F prior to the addition of Alternative A traffic. The addition of Alternative A-generated trips would not increase the traffic volume on a freeway mainline, freeway ramp, or merge/diverge section by 2 percent or more and cause the LOS to degrade from LOS A, B, C, or D to LOS E or F. These impacts would be less than significant.

Transportation/Traffic
4.8-146 JOHN WAYNE AIRPORT SETTLEMENT AGREEMENT AMENDMENT ENVIRONMENTAL IMPACT REPORT
Alternative B Under the Existing Plus Alternative B scenario, the Project traffic causes two segments on the northbound SR-73 to degrade from LOS D to LOS F. The two locations, the Bristol St North on-ramp to SR-55 North off-ramp and the on-ramp from SR 55 northbound, would be affected in the AM peak hour. In both instances, the Project’s contribution to the increase in traffic volume is greater than 2 percent; therefore the project would result in a significant impact at these locations (Threshold 4.8-12) (see Table 4.8-46). There are also two locations where the Alternative B-generated traffic would result in an increase of over 2 percent on facilities operating at LOS E or F. In the PM peak hour, the northbound SR-55 onramp from I-405 to the MacArthur Boulevard off-ramp and the northbound SR-73 on-ramp from SR-55 northbound are both projected to operate at LOS F prior to the addition of the Alternative B-generated traffic. In both of these instances the Existing Plus Alternative B scenario would result in a significant cumulative impact (Threshold 4.8-13) (see Table 4.8-47). As previously discussed, the Existing Plus Project scenario can be misleading and is therefore provided for informational purposes only. Under the future year scenarios, with Alternative B, Phases 2 and 3, the Project results in an increase in traffic volume of over 2 percent on the northbound SR-55 onramp from I-405 to the MacArthur Boulevard off-ramp in the PM peak hour. This segment is projected to operate at LOS F prior to the addition of Project traffic. Therefore, Alternative B, Phases 2 and 3 would result in a significant cumulative impact at this location (Threshold 4.8-13) (see Tables 4.8-55 and 4.8-59 for Phases 2 and 3, respectively). In addition, in the AM peak hour, Alternative B, Phase 3 would result in an increase in traffic volume of over 2 percent on the northbound SR-73 on-ramp from SR-55 northbound, which is projected to operate at LOS F prior to the addition of the Alternative B traffic (see Table 4.8-59). This would result in a significant cumulative impact. For all phases of Alternative B, the impacts associated for the other thresholds would be less than significant. Impact Conclusion: Traffic generated by Alternative B, Phases 2 and 3 would increase the traffic
volume by more than 2 percent on a Caltrans freeway facility operating at LOS E or F prior to the addition of Alternative B traffic. This would be a significant cumulative impact.
For all phases, the addition of Alternative B-generated trips would not cause the LOS at study intersections within Caltrans jurisdiction to degrade from LOS A, B, C, or D to LOS E or F. The addition of Alternative B-generated trips would not cause a two second or greater increase in delay at a study intersection within Caltrans jurisdiction, where the intersection operates at LOS E or LOS F prior to the addition of Alternative B traffic. The addition of Alternative B-generated trips would not increase the traffic volume on a freeway mainline, freeway ramp, or merge/diverge section by 2 percent or more, and causes the LOS to degrade from LOS A, B, C, or D to LOS E or F. These impacts would be less than significant. Alternative C Under the Existing Plus Alternative C scenario, the Project traffic causes two segments on the northbound SR-73 to degrade from LOS D to LOS F. The two locations, the Bristol St North on-

Transportation/Traffic
JOHN WAYNE AIRPORT SETTLEMENT AGREEMENT AMENDMENT 4.8-147 ENVIRONMENTAL IMPACT REPORT
ramp to SR-55 North off-ramp and the on-ramp from SR-55 northbound, would be affected in the AM peak hour. In addition, the Project-generated traffic causes the MacArthur Boulevard Loop On-ramp to MacArthur Blvd Direct On-ramp on the southbound SR-55 to degrade from LOS D to LOS F in the AM peak hour. In each instance, the Project’s contribution to the increase in traffic volume is greater than 2 percent; therefore, under the Existing Plus Alternative C scenario, the Project would result in a significant impact at these locations (Threshold 4.8-12). In addition to the significant impacts identified above, under the Existing Plus Alternative C scenario, Alternative C would result in additional significant impacts at the following locations: The Existing Plus Alternative C scenario would result in an increase of over 2 percent in traffic volume on the following segments of the northbound SR-55 during the PM peak hour, which is projected to operate at LOS F prior to the addition of project traffic: • Paularino Avenue On-ramp • Paularino Avenue On-ramp to I-405 SB On-ramp • On-ramp from I-405 NB to MacArthur Blvd Off-ramp The Existing Plus Alternative C scenario would result in an increase of over 2 percent in traffic volume on the following segment of the southbound SR-55 during the AM peak hour, which is projected to operate at LOS F prior to the addition of project traffic: • MacArthur Blvd Direct On-ramp to Off-ramp to I-405 southbound The Existing Plus Alternative C scenario would result in an increase of over 2 percent in traffic volume on the following segments of the northbound SR-73 during the PM peak hour, which is projected to operate at LOS F prior to the addition of project traffic: • Off-Ramp to SR-55 southbound • On-ramp From SR-55 northbound The Existing Plus Alternative C scenario would result in an increase of over 2 percent in traffic volume on the following segments of the southbound I-405 during the PM peak hour, which is projected to operate at LOS F prior to the addition of project traffic: • Jamboree Loop On-ramp (PM) • Jamboree Direct On-ramp (PM) Since in all instances, the Project’s contribution to the increase in traffic is greater than 2 percent, the Existing Plus Alternative C scenario would result in a significant impact at these locations (Threshold 4.8-13). See Table 4.8-62 for the AM peak hour data and Table 4.8-63 for the PM peak hour data. As previously discussed, the Existing Plus Project scenario can be misleading and is therefore provided for informational purposes only. Under the future year scenarios, project-generated traffic for all phases of Alternative C would result in the LOS on the southbound SR-55 from the MacArthur Blvd Loop On-ramp to MacArthur Blvd Direct On-ramp to degrade from LOS D to LOS F during the AM peak hour. Since the increase

Transportation/Traffic
4.8-148 JOHN WAYNE AIRPORT SETTLEMENT AGREEMENT AMENDMENT ENVIRONMENTAL IMPACT REPORT
in traffic attributable to the Project is greater than 2 percent, a significant cumulative impact occurs. (Threshold 4.8-12). All phases of Alternative C also would result in an increase of over 2 percent in traffic volume on the following segments of the northbound SR-55 during the PM peak hour, which are projected to operate at LOS F prior to the addition of Project traffic: • Paularino Avenue On-ramp • Paularino Avenue On-ramp to I-405 southbound On-ramp • On-ramp from I-405 northbound to MacArthur Blvd Off-ramp All phases of Alternative C also would result in an increase of over 2 percent in traffic volume on the following segment of the southbound SR-55 during the AM peak hour, which is projected to operate at LOS F prior to the addition of Project traffic: • MacArthur Blvd Direct On-ramp to Off-ramp to I-405 southbound All phases of Alternative C would result in an increase of over 2 percent in traffic volume on the following segment of the Southbound I-405 during the PM peak hour, which is projected to operate at LOS F prior to the addition of project traffic: • Jamboree Direct On-ramp In addition, Alternative C, Phase 3 would result in an increase of over 2 percent in traffic volume on the following segments of the northbound SR-73 during the AM peak hour, which are projected to operate at LOS F prior to the addition of project traffic: • Bristol St. N On-ramp to SR-55 N Off-ramp • On-ramp From SR-55 northbound In all instances, Alternative C would add traffic greater than 2 percent to locations operating at less than acceptable conditions prior to the addition of Project-generated traffic. Therefore, Alternative C would result in a significant cumulative impact at these locations (Threshold 4.8-13). See Tables 4.8-66, 4.8-70, and 4.8-74 for AM peak hour data for Phases 1 through 3, respectively, and Tables 4.8-67, 4.8-71, and 4.8-75 for PM peak hour data for Phases 1 through 3, respectively.
Impact Conclusion: Traffic generated by all phases of Alternative C would increase the traffic volume by more than 2 percent on a Caltrans freeway facility and contribute to the LOS being reduced from LOS D to LOS F. Additionally, all phases of Alternative C would increase the traffic volume by more than 2 percent on a Caltrans freeway facility operating at LOS E or F prior to the addition of Alternative C traffic. This would be a significant cumulative impact.
For all phases, the addition of Alternative C-generated trips would not cause the LOS at study intersections within Caltrans jurisdiction to degrade from LOS A, B, C, or D to LOS E or F. The addition of Alternative C-generated trips would not cause a two second or greater increase in delay at a study
Transportation/Traffic
JOHN WAYNE AIRPORT SETTLEMENT AGREEMENT AMENDMENT 4.8-149 ENVIRONMENTAL IMPACT REPORT
intersection within Caltrans jurisdiction, where the intersection operates at LOS E or LOS F prior to the addition of Alternative C traffic. These impacts would be less than significant. No Project Alternative The additional traffic generated by the No Project Alternative (all phases and the Existing Plus No Project Alternative scenario) would not result in an increase of over 2 percent in traffic volume on any Caltrans facilities. Therefore, for all phases of the No Project Alternative, the impacts associated with the Caltrans thresholds would be less than significant.
Impact Conclusion: None of the phases of the No Project Alternative increase the traffic volume by more than 2 percent on a Caltrans facility operating at LOS E or F prior to the addition of No Project Alternative traffic. For all phases, the addition of the No Project Alternative-generated trips would not cause the LOS at study intersections within Caltrans jurisdiction to degrade from LOS A, B, C, or D to LOS E or F. The addition of No Project Alternative-generated trips would not cause a two second or greater increase in delay at a study intersection within Caltrans jurisdiction where the intersection operates at LOS E or LOS F prior to the addition of No Project Alternative traffic. The addition of No Project Alternative-generated trips would not increase the traffic volume on a freeway mainline, freeway ramp, or merge/diverge section by 2 percent or more and cause the LOS to degrade from LOS A, B, C, or D to LOS E or F. These impacts would be less than significant.
Orange County Transportation Authority Congestion Management Program Threshold 4.8-14: The addition of Project-generated trips causes the LOS at a study intersection in the Orange County Transportation Authority Congestion Management Program to change from an acceptable LOS E to LOS F. Threshold 4.8-15: The addition of Project-generated trips increases the ICU by 0.10 or more at a study intersection in the Orange County Transportation Authority Congestion Management Program operating at LOS F under baseline conditions. Proposed Project As shown in Table 4.8-2, the following three study area intersections are in the CMP:
• MacArthur Boulevard at I-405 northbound ramps • MacArthur Boulevard at I-405 southbound ramps • Jamboree Road at MacArthur Boulevard The Proposed Project would not result in significant impacts to these intersections.
Impact Conclusion: Proposed Project-generated trips would not cause the LOS at a study intersection under the jurisdiction of OCTA CMP to change from an acceptable LOS E to LOS F. Additionally, Proposed Project-generated trips would not increase the ICU by 0.10 or more at a CMP study intersection

Transportation/Traffic
4.8-150 JOHN WAYNE AIRPORT SETTLEMENT AGREEMENT AMENDMENT ENVIRONMENTAL IMPACT REPORT
operating at LOS F under baseline conditions. Impacts would be less than significant. Alternative A Alternative A would not result in significant impacts to the CMP intersections.
Impact Conclusion: Alternative A-generated trips would not cause the LOS at a study intersection under the jurisdiction of OCTA CMP to change from an acceptable LOS E to LOS F. Additionally, Alternative A-generated trips would not increase the ICU by 0.10 or more at a CMP study intersection operating at LOS F under baseline conditions. Impacts would be less than significant. Alternative B Alternative B would not result in significant impacts to the CMP intersections.
Impact Conclusion: Alternative B-generated trips would not cause the LOS at a study intersection under the jurisdiction of OCTA CMP to change from an acceptable LOS E to LOS F. Additionally, Alternative B-generated trips would not increase the ICU by 0.10 or more at a CMP study intersection operating at LOS F under baseline conditions. Impacts would be less than significant. Alternative C Alternative C would not result in significant impacts to the CMP intersections.
Impact Conclusion: Alternative C-generated trips would not cause the LOS at a study intersection under the jurisdiction of OCTA CMP to change from an acceptable LOS E to LOS F. Additionally, Alternative C-generated trips would not increase the ICU by 0.10 or more at a CMP study intersection operating at LOS F under baseline conditions. Impacts would be less than significant. No Project Alternative The No Project Alternative would not result in significant impacts to the CMP intersections.
Impact Conclusion: The No Project Alternative-generated trips would not cause the LOS at a study intersection under the jurisdiction of OCTA CMP to change from an acceptable LOS E to LOS F. Additionally, the No Project Alternative-generated trips would not increase the ICU by 0.10 or more at a CMP study intersection operating at LOS F under baseline conditions. Impacts would be less than significant.
Air Traffic Patterns Threshold 4.8-16: Would the project result in a change in air traffic patterns, including either an increase in traffic levels or a change in location that result in substantial safety risks? Proposed Project and All Alternatives The Proposed Project and all the alternatives would increase the number of flights at JWA. However, they would not change the air traffic patterns. The Airport has no control over the air
Transportation/Traffic
JOHN WAYNE AIRPORT SETTLEMENT AGREEMENT AMENDMENT 4.8-151 ENVIRONMENTAL IMPACT REPORT
traffic patterns; that is the responsibility of the Federal Aviation Administration (“FAA”). As such, a change in air traffic patterns is neither a component of the Proposed Project or any of its alternatives, nor is it a component of the Settlement Agreement. The flight levels proposed by the Proposed Project or any of the alternatives would not result in substantial safety risks. All flights would be required to abide by FAA safety regulations governing flights and directions of the JWA control tower. Since the air traffic patterns would not be modified, the flights would not conflict with the air space associated with other airports, such as Los Angeles International Airport. Therefore, impacts would be less than significant. The automobile traffic levels associated with the increased flights have been addressed through the Thresholds 4.8-1 through 4.8-15. The Project does not propose any physical improvements that would result in safety risks associated with automobile traffic. Impact Conclusion: The Proposed Project, Alternatives A, B, or C; and the No Project Alternative
would increase the number of flights at JWA; however, they would not change the air traffic patterns or a change in location. Therefore, the potential for a substantial increase in safety risks is less than significant.
IMPACT SUMMARY The following tables provide a summary of the intersections and freeway locations that would be significantly impacted either directly or indirectly (i.e., cumulatively) by one or more of the scenarios. Table 4.8-92, Intersection Impact Summary, identifies the five roadway intersections that would be significantly impacted by alternative and phase. Table 4.8-93, Freeway Impact Summary, identifies the freeway locations that would be significantly impacted directly or indirectly by alternative and phase.

Transportation/Traffic
4.8-152 JOHN WAYNE AIRPORT SETTLEMENT AGREEMENT AMENDMENT ENVIRONMENTAL IMPACT REPORT
TABLE 4.8-92 INTERSECTION IMPACT SUMMARY
Proposed Project Alternative A Alternative B Alternative C No Project
Exis
ting
+
Proj
ect
Phas
e 1
Phas
e 2
Phas
e 3
Exis
ting
+
Proj
ect
Phas
e 1
Phas
e 2
Phas
e 3
Exis
ting
+
Proj
ect
Phas
e 1
Phas
e 2
Phas
e 3
Exis
ting
+
Proj
ect
Phas
e 1
Phas
e 2
Phas
e 3
Exis
ting
+
Proj
ect
Phas
e 1
Phas
e 2
Phas
e 3
# Intersection Locations AM PM AM PM AM PM AM PM AM PM AM PM AM PM AM PM AM PM AM PM AM PM AM PM AM PM AM PM AM PM AM PM AM PM AM PM AM PM AM PM
4 MacArthur & Michelson
D D D D D D 15 Campus & Airport D D D D D 17 Campus & Bristol
N. D C C C D C C C D C C C D C C C D C C C 25 Santa Ana & Del
Mar D 53 Von Karman &
Alton D D D D Notes: D = Direct Impact; C = Cumulative Impact; Ex.+ Proj. = Existing Plus ProjectSource: Transportation Impact Analysis, (Tables 12-1), Fehr & Peers, 2014

Transportation/Traffic
JOHN WAYNE AIRPORT SETTLEMENT AGREEMENT AMENDMENT 4.8-153 ENVIRONMENTAL IMPACT REPORT
TABLE 4.8-93 FREEWAY IMPACT SUMMARY
Proposed Project Alternative A Alternative B Alternative C No Project
Exis
ting
+
Proj
ect
Phas
e 1
Phas
e 2
Phas
e 3
Exis
ting
+
Proj
ect
Phas
e 1
Phas
e 2
Phas
e 3
Exis
ting
+
Proj
ect
Phas
e 1
Phas
e 2
Phas
e 3
Exis
ting
+
Proj
ect
Phas
e 1
Phas
e 2
Phas
e 3
Exis
ting
+
Proj
ect
Phas
e 1
Phas
e 2
Phas
e 3
Intersection Locations AM PM AM PM AM PM AM PM AM PM AM PM AM PM AM PM AM PM AM PM AM PM AM PM AM PM AM PM AM PM AM PM AM PM AM PM AM PM AM PM Northbound SR-55 Paularino Ave On Ramp C C C C Paularino Ave On Ramp to I-405 SB On Ramp C C C C On Ramp from I-405 NB to MacArthur Blvd Off Ramp C C C C C C C C C C C C Southbound SR-55 MacArthur Blvd Loop On Ramp to MacArthur Blvd Direct On Ramp D D D D MacArthur Blvd Direct On Ramp to Off Ramp to I-405 SB C C C C Northbound SR-73 Jamboree Rd On Ramp Jamboree Rd On Ramp to Bristol St N Off Ramp Bristol St N On Ramp to SR-55 N Off Ramp D D C C Off Ramp to SR-55 SB C On Ramp from SR-55 NB D C D C C C Southbound SR-73
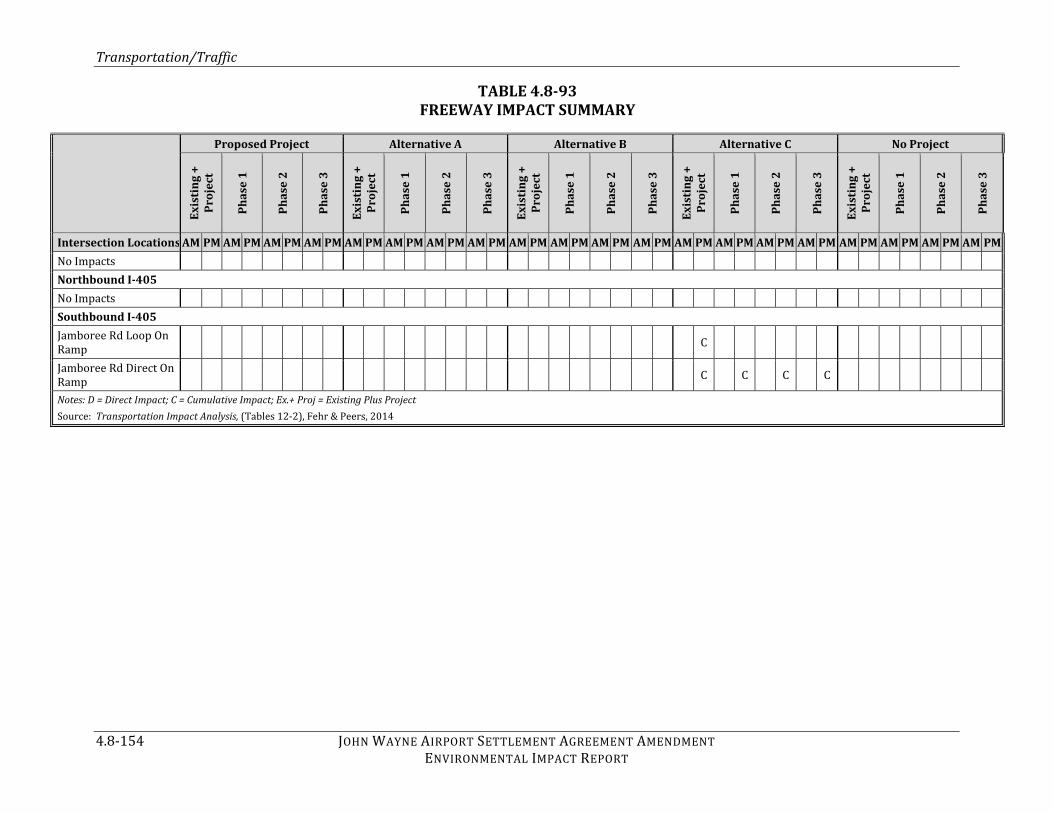
Transportation/Traffic
4.8-154 JOHN WAYNE AIRPORT SETTLEMENT AGREEMENT AMENDMENT ENVIRONMENTAL IMPACT REPORT
TABLE 4.8-93 FREEWAY IMPACT SUMMARY
Proposed Project Alternative A Alternative B Alternative C No Project
Exis
ting
+
Proj
ect
Phas
e 1
Phas
e 2
Phas
e 3
Exis
ting
+
Proj
ect
Phas
e 1
Phas
e 2
Phas
e 3
Exis
ting
+
Proj
ect
Phas
e 1
Phas
e 2
Phas
e 3
Exis
ting
+
Proj
ect
Phas
e 1
Phas
e 2
Phas
e 3
Exis
ting
+
Proj
ect
Phas
e 1
Phas
e 2
Phas
e 3
Intersection Locations AM PM AM PM AM PM AM PM AM PM AM PM AM PM AM PM AM PM AM PM AM PM AM PM AM PM AM PM AM PM AM PM AM PM AM PM AM PM AM PM No Impacts Northbound I-405 No Impacts Southbound I-405 Jamboree Rd Loop On Ramp C Jamboree Rd Direct On Ramp C C C C Notes: D = Direct Impact; C = Cumulative Impact; Ex.+ Proj = Existing Plus Project Source: Transportation Impact Analysis, (Tables 12-2), Fehr & Peers, 2014

Transportation/Traffic
JOHN WAYNE AIRPORT SETTLEMENT AGREEMENT AMENDMENT 4.8-155 ENVIRONMENTAL IMPACT REPORT
4.8.6 MITIGATION PROGRAM
ROADWAY INTERSECTIONS The following mitigation measures have been developed to address the significant impacts resulting from implementation of the Proposed Project and project alternatives. As explained below, each mitigation measure is applicable to a varying collective of the Proposed Project and project alternatives dependent upon the identification of a significant impact. Following each measure is a brief description of what is involved with implementation of the measure and an assessment of the type of environmental impacts, if any, that would be associated with implementation of the mitigation measure. MacArthur Boulevard and Michelson Drive The intersection of MacArthur Boulevard and Michelson Drive would be significantly impacted under the Proposed Project and Alternatives A, B, and C. The following mitigation measure is recommended for implementation with the Proposed Project and Alternatives A, B, and C: T-1 The County of Orange/JWA shall coordinate with the City of Irvine and, once agreement is reached as to costs and parameters of design, pay to the City the fullcost of converting the traffic signal at the intersection of MacArthur Boulevard / Michelson Drive so that the signal for the westbound right-turn lane under overlap phasing conditions is fully operational prior to JWA serving 12.5 MAP. Implementation: Mitigating this impact will require converting the traffic signal for the westbound right-turn lane to operate under overlap conditions. The traffic signal currently can accommodate overlap phasing but the phasing is not currently implemented. This impact is a direct impact in that the Project causes the intersection to operate deficiently. This intersection is under the jurisdiction of the City of Irvine. As no physical improvement is required, JWA will coordinate with the City of Irvine to implement the phasing such that it is fully operational prior to JWA reaching 12.5 MAP. Since this impact is directly attributable to incremental traffic from the Project, JWA would pay for the full cost of this signal timing change. The City of Irvine would then be responsible for implementing the improvement. With implementation of this measure, an LOS D would be achieved with the Proposed Project, Alternative A, and Alternative B. LOS E would be achieved with Alternative C. However, because full implementation of the subject improvement is outside the jurisdiction and control of the County of Orange/JWA and, therefore, implementation cannot be assured, in the event the improvement is not fully operational prior to JWA serving 12.5 MAP, the Project’s impacts at the intersection would remain significant and unavoidable as there is no other feasible mitigation that would fully reduce the identified impacts to less than significant. No environmental impacts are anticipated with the implementation of this mitigation measure. Campus Drive and Airport Way The intersection of Campus Drive and Airport Way would be significantly impacted under Alternatives B and C. The following mitigation measure is recommended for implementation with Alternatives B and C: T-2 The County of Orange/JWA shall coordinate with the City of Newport Beach and, once agreement is reached as to costs and parameters of design, pay to the City the full cost of

Transportation/Traffic
4.8-156 JOHN WAYNE AIRPORT SETTLEMENT AGREEMENT AMENDMENT ENVIRONMENTAL IMPACT REPORT
adding a second northbound left-turn lane at the intersection of Campus Drive / Airport Way that is fully operational prior to JWA serving 15.0 MAP. Implementation: Mitigating this impact will require the addition of a second northbound left-turn lane. This impact is a direct impact as the addition of Project traffic causes the intersection to degrade from acceptable to unacceptable levels. This intersection is under the jurisdiction of the City of Newport Beach. JWA would be responsible for paying to the City of Newport Beach the cost of the improvement in a manner that would ensure the improvement is fully constructed and operational prior to JWA reaching the 15.0 MAP level. The City of Newport Beach would then be responsible for the construction of this mitigation measure. With implementation of this measure, a LOS C would be achieved with Alternative B and LOS D would be achieved with Alternative C. However, because full implementation of the subject improvement is outside the jurisdiction and control of the County of Orange/JWA and, therefore, implementation cannot be assured, in the event the improvement is not fully operational prior to JWA serving 15.0 MAP, the Project’s impacts at the intersection would remain significant and unavoidable as there is no other feasible mitigation that would fully reduce the identified impacts to less than significant. The current width of the northbound approach is approximately 65 feet including a portion of a median, four travel lanes, and a bike lane. Based on a preliminary assessment, an additional left-turn lane could be accommodated within the existing curb-to-curb width by removing the median and reducing lane width for the other lanes (Exhibit G-1, showing the lane widths, is provided at the end of Appendix G.). However, there is the potential that additional right-of-way r from the Airport or from the private properties in the City of Newport Beach would be required. In addition, this mitigation measure would result in construction-related impacts, such as air emissions, noise, and short-term traffic delays. Campus Drive/Bristol Street North The intersection of Campus Drive and Bristol Street North would be significantly impacted under the Proposed Project, Alternatives A, B, and C, and the No Project Alternative. The following mitigation measure is recommended for implementation with the Proposed Project, Alternatives A, B, and C and the No Project Alternative: T-3 The County of Orange/JWA shall coordinate with the City of Newport Beach and construct a third southbound right-turn lane at the intersection of Campus Drive and Bristol Street North that is fully operational prior to JWA serving 10.8 MAP. Implementation: Mitigating this impact will require the addition of a third southbound right-turn lane. This proposed mitigation measure is identical to one identified in the traffic analysis prepared in connection with the previous Settlement Agreement Amendment (EIR 582). This impact is a cumulative impact, which the Project contributes to but is not fully responsible for as this intersection operates at a deficient LOS prior to the introduction of Project traffic. This impact is therefore different from the impact identified in EIR 582, which was an impact directly attributable to the project. Growth in background traffic volumes since the previous analysis was completed have worsened conditions at this intersection such that the additional traffic from JWA is now contributing to an already deficient condition rather than creating a new (i.e., direct project impact) deficient condition. The typical approach for mitigating a project’s cumulative impact is the payment of a fair share contribution. In this instance, however, pursuant to its mitigation obligation under EIR 582, JWA

Transportation/Traffic
JOHN WAYNE AIRPORT SETTLEMENT AGREEMENT AMENDMENT 4.8-157 ENVIRONMENTAL IMPACT REPORT
presently is implementing this additional right-turn lane through consultations with Orange County and the City of Newport Beach. JWA has completed planning studies for this improvement and is currently in the process of preparing construction plans, which are approximately 70 percent complete as of March 2014. JWA has also agreed to fund necessary ancillary construction work at this location, including any utility relocation that might be required. Given these previous commitments, no additional mitigation is required. This improvement is currently scheduled to be completed by 2016, which is the first year in which the impact would occur. With implementation of this measure, an LOS D would be achieved with the Proposed Project and Alternative A, and LOS E would be achieved with Alternative B and Alternative C; therefore, impacts would be reduced to less than significant. Since this measure was identified in EIR 582, it would also apply to the No Project Alternative, which would achieve a LOS D. Environmental impacts associated with this improvement were addressed in the Supplement to EIR 582 and include impacts to the JWA maintenance building and construction impacts. Santa Ana Avenue and Del Mar Avenue The intersection of Santa Ana Avenue and Del Mar Avenue would be significantly impacted under Alternative C. The following mitigation measure is recommended with the implementation of Alternative C, which would reduce the impacts to less than significant: T-4 The County of Orange/JWA shall coordinate with the City of Costa Mesa and, once an agreement is reached as to costs and parameters of design, pay to the City the full cost of adding a traffic signal at the intersection of Santa Ana Avenue and Del Mar Avenue that is fully operational prior to JWA serving 16.9 MAP. Implementation: Mitigating this impact will require the addition of a traffic signal. This impact is a direct impact which occurs as the result of additional project traffic causing an intersection to degrade from acceptable to unacceptable conditions. This intersection is under the jurisdiction of the City of Costa Mesa. JWA would pay for the cost of installing the traffic signal, which would be implemented by the City of Costa Mesa, in a manner that would ensure the improvement would be fully constructed and operational prior to reaching 16.9 MAP. With implementation of this measure, an LOS B would be achieved. However, because full implementation of the subject improvement is outside the jurisdiction and control of the County of Orange/JWA and, therefore, implementation cannot be assured, in the event the improvement is not fully operational prior to JWA serving 16.9 MAP, the Project’s impacts at the intersection would remain significant and unavoidable as there is no other feasible mitigation that would fully reduce the identified impacts to less than significant. Environmental impacts would be limited to construction impacts. Von Karman Avenue and Alton Parkway The intersection of Von Karman Avenue and Alton Parkway would be significantly impacted under the Proposed Project and Alternatives A, B, and C. The following mitigation measure is recommended for implementation with the Proposed Project and Alternatives A, B, and C, which would reduce the impacts to less than significant: T-5 The County of Orange/JWA shall coordinate with the City of Irvine and, once agreement is reached as to costs and parameters of design, pay to the City the full cost of adding a

Transportation/Traffic
4.8-158 JOHN WAYNE AIRPORT SETTLEMENT AGREEMENT AMENDMENT ENVIRONMENTAL IMPACT REPORT
northbound right-turn lane at the intersection of Von Karman Avenue and Alton Parkway that is fully operational prior to JWA serving 12.5 MAP. Implementation: Mitigating this impact will require the addition of a northbound right-turn lane. This impact is a direct impact as the addition of project traffic causes the intersection to degrade from acceptable to unacceptable levels. This intersection is under the jurisdiction of the City of Irvine. JWA would be responsible for paying to the City of Irvine the cost of the improvement prior to reaching the 12.5 MAP threshold, which is the lowest threshold at which this impact would occur. The City of Irvine would then be responsible for the construction of this mitigation measure. With implementation of this measure, an LOS D would be achieved with the Proposed Project, Alternative A, Alternative B, and Alternative C. However, because full implementation of the subject improvement is outside the jurisdiction and control of the County of Orange/JWA and, therefore, implementation cannot be assured, in the event the improvement is not fully operational prior to JWA serving 12.5 MAP, the Project’s impacts at the intersection would remain significant and unavoidable as there is no other feasible mitigation that would fully reduce the identified impacts to less than significant. It is anticipated this mitigation measure would have minimal environmental impacts, which would be limited to short-term construction-related impacts. The current width of the northbound shared through/right-turn lane is approximately 22 feet. Therefore, a restripe within the existing curb-to-curb width would be feasible providing an 11-foot through lane and 11-foot right turn lane. FREEWAY MITIGATION MEASURES As shown in Table 4.8-93, the majority of the identified significant freeway impacts attributable to the Proposed Project and alternatives would result from a cumulative condition in that traffic from JWA is added to facilities which would operate at a deficient level even without Project traffic. As shown in the previous tables, the contribution of additional traffic volume by JWA (i.e., the Proposed Project and alternatives) to these segments is minimal, and ranges from 2 percent to 5 percent. It also is noted that both FAA and SCAG projections indicate that forecasted passenger demand at JWA exceeds the current Settlement Agreement limits of 10.8 MAP, and that FAA projections anticipate unconstrained passenger demand at JWA reaching 12.8 MAP by 2030. (See the Capacity Analysis Technical Report, Section 7, provided in Appendix F [AECOM, 2014].) As JWA currently serves approximately 9.2 million annual passengers, allowing an increase in MAP to only 10.8 MAP likely would cause residents of Orange County to divert to other airports in the region to satisfy their air travel needs. (Id.) This diversion of workers and residents to other facilities, such as Los Angeles International Airport (LAX), Long Beach Airport, or Ontario, likely would result in additional travel on the regional roadway system, which could result in additional congestion, vehicle miles traveled (VMT) and emissions for these longer distance trips. As such, by increasing the MAP limit at JWA, the Proposed Project, as well as Alternatives A, B, or C, likely would eliminate the need for a certain number of air passengers to travel to another airport, thereby reducing congestion on the regional freeway system. In terms of physical improvements necessary to increase freeway capacity, mitigating the identified significant impacts to the freeway and mainline segments would require a complete reconstruction of the SR-55, SR-73, and the I-405 freeways to add travel lanes and upgrade each of the deficient ramp locations. Since the freeways in the study area are interconnected systems,

Transportation/Traffic
JOHN WAYNE AIRPORT SETTLEMENT AGREEMENT AMENDMENT 4.8-159 ENVIRONMENTAL IMPACT REPORT
it would not be possible, nor effective, to provide isolated spot improvements of one segment of the freeway where deficient operations are observed. OCTA is currently finalizing a comprehensive study of the SR-55 to evaluate potential improvements through the Caltrans Project Report/Environmental Document process. This study has tentatively identified improvements to the SR-55 to add a mainline lane and also improve several interchanges. However; no additional travel lanes have been proposed for the segment between I-405 and MacArthur Boulevard as of April 2014. Additionally there is no dedicated funding for these proposed improvements. The Regional Transportation Plan indicates that this improvement could be funded in 2035, which would be an insufficient timeframe to address impacts that might occur as early as 2026, and in the case of the Proposed Project as early as 2021. OCTA is also currently evaluating various proposals to improve operations on I-405 throughout the study area. Various concepts have been evaluated including a toll lane, a general use travel lane, or some combination of the two. Regardless of the proposed improvement, it would not provide for sufficient capacity to fully mitigate the impacts identified along I-405. No improvements are pending for SR-73 at this time (April 2014). In summary, the physical improvements necessary to provide the additional capacity for the Proposed Project would require the addition of general purpose travel lanes and no definitive plans identifying such additional lanes are currently available as of April 2014. While OCTA, Caltrans, and other agencies are currently studying potential improvements to SR-55 through the Caltrans Project Report/Environmental Document process, widening the SR-55 between I-405 and the MacArthur Boulevard off-ramp to add a general purpose travel lane is not being considered at this time. Because the improvements necessary to mitigate the identified significant freeway impacts (i.e., providing increased capacity) are beyond the jurisdiction and control of the County, and because the agencies with jurisdiction and control over these facilities (i.e., Caltrans and OCTA) have no present plans to construct the necessary improvements within the timeframe necessary to mitigate the identified significant impacts, there is no mechanism by which the project can contribute its fair-share towards the necessary improvements and, consequently, there is no evidence that even with a fair-share payment the necessary improvements would be constructed. As such, the mitigation necessary to reduce the identified significant impacts is infeasible and the impacts are significant and unavoidable. 4.8.7 LEVEL OF SIGNIFICANCE AFTER MITIGATION With implementation of the mitigation measures identified above, the impacts to roadway intersections can be reduced to less than significant for the Proposed Project and Alternatives A, B, and C. However, because full implementation of the subject improvement is outside the jurisdiction and control of the County of Orange/JWA, implementation cannot be assured. Therefore, as noted above, the Project’s impacts at the local intersection outside of the County of Orange jurisdiction would remain significant and unavoidable. Similarly, though the Proposed Project has committed to contribute its fair-share towards necessary freeway improvements to address the identified significant cumulative impact, because the improvements necessary to mitigate the identified freeway impacts (i.e., providing increased capacity) are neither planned

Transportation/Traffic
4.8-160 JOHN WAYNE AIRPORT SETTLEMENT AGREEMENT AMENDMENT ENVIRONMENTAL IMPACT REPORT
nor funded, and there is no current mechanism by which the Project can contribute its fair-share. As such, mitigation is infeasible and the impacts are significant and unavoidable. Table 4.8-94 provides a summary of the findings of significance after implementation of the mitigation measures for each threshold for each alternative under the future year scenarios, Phase 1, Phase 2, and Phase 3. TABLE 4.8-94
SUMMARY OF SIGNIFICANCE OF TRAFFIC IMPACTS AFTER MITIGATION
Threshold Proposed
Project Alternative A Alternative B Alternative C No Project Alternative
City of Irvine Threshold 4.8-1 Less than significant impact (All Phases) Less than significant impact (All Phases)
Less than significant impact (All Phases) Less than significant impact (All Phases)
Less than significant impact (All Phases) Threshold 4.8-2 Less than significant impact (Phases 1 and 2) Significant unavoidable impact (Phase 3)
Less than significant impact (Phases 1 and 2) Significant unavoidable impact (Phase 3)
Less than significant impact (Phases 1 and 2) Significant unavoidable impact (Phase 3)
Significant unavoidable impact (All Phases) Less than significant impact (All Phases)
Threshold 4.8-3 Less than significant impact (All Phases) Less than significant impact (All Phases)
Less than significant impact (All Phases) Less than significant impact (All Phases)
Less than significant impact (All Phases) Threshold 4.8-4 Less than significant impact (All Phases) Less than significant impact (All Phases)
Less than significant impact (All Phases) Less than significant impact (All Phases)
Less than significant impact (All Phases) City of Newport Beach Threshold 4.8-5 Less than significant impact (All Phases)
Less than significant impact (All Phases) Less than significant impact (Phases 1 and 2) Significant unavoidable impact(Phase 3)
Significant unavoidable impact (All Phases) Less than significant impact (All Phases)
Threshold 4.8-6 Less than significant impact (All Phases) Less than significant impact (All Phases)
Less than significant impact (All Phases) Less than significant impact (All Phases)
Less than significant impact (All Phases) Threshold 4.8-7 Less than significant with mitigation impact (All Phases) Less than significant with mitigation impact (All Phases)
Less than significant with mitigation impact (All Phases) Less than significant with mitigation impact (All Phases)
Less than significant with mitigation impact (All Phases)

Transportation/Traffic
JOHN WAYNE AIRPORT SETTLEMENT AGREEMENT AMENDMENT 4.8-161 ENVIRONMENTAL IMPACT REPORT
TABLE 4.8-94 SUMMARY OF SIGNIFICANCE OF TRAFFIC IMPACTS
AFTER MITIGATION
Threshold Proposed
Project Alternative A Alternative B Alternative C No Project Alternative Threshold 4.8-8 Less than significant (All Phases) Less than significant (All Phases) Less than significant (All Phases) Less than significant (All Phases) Less than significant (All Phases)
City of Costa Mesa Threshold 4.8-9 Less than significant impact (All Phases) Less than significant impact (All Phases)
Less than significant impact (All Phases) Less than significant impact (Phases 1 and 2) Significant unavoidable (Phase 3)
Less than significant impact (All Phases) Caltrans Threshold 4.8-10 Less than significant impact (All Phases)
Less than significant impact (All Phases) Less than significant impact (All Phases)
Less than significant impact (All Phases) Less than significant impact (All Phases) Threshold 4.8-11 Less than significant impact (All Phases)
Less than significant impact (All Phases) Less than significant impact (All Phases)
Less than significant impact (All Phases) Less than significant impact (All Phases) Threshold 4.8-12 Less than significant impact (All Phases)
Less than significant impact (All Phases) Less than significant impact (All Phases)
Significant unavoidable impact (All Phases) Less than significant impact (All Phases) Threshold 4.8-13 Less than significant impact (Phase 1) Significant unavoidable impact (Phases 2 and 3)
Less than significant impact (Phases 1 and 2) Significant unavoidable impact (Phase 3)
Less than significant impact (Phase 1) Significant impact unavoidable (Phases 2 and 3)
Significant unavoidable impact (All Phases) Less than significant impact (All Phases)
Orange County Transportation Authority Congestion Management PlanThreshold 4.8-14 Less than significant impact (All Phases) Less than significant impact (All Phases)
Less than significant impact (All Phases) Less than significant impact (All Phases)
Less than significant impact (All Phases) Threshold 4.8-15 Less than significant impact (All Phases) Less than significant impact (All Phases)
Less than significant impact (All Phases) Less than significant impact (All Phases)
Less than significant impact (All Phases) Air Traffic Patterns Threshold 4.8-16 Less than significant impact (All Phases)
Less than significant impact (All Phases) Less than significant impact (All Phases)
Less than significant impact (All Phases) Less than significant impact (All Phases)
Transportation/Traffic
4.8-162 JOHN WAYNE AIRPORT SETTLEMENT AGREEMENT AMENDMENT ENVIRONMENTAL IMPACT REPORT
4.8.8 REFERENCES AECOM. 2014 (April). John Wayne Airport Settlement Agreement Amendment Environmental Impact Report Capacity Analysis Technical Report. Orange, CA: AECOM (Appendix F). Fehr & Peers. 2014 (April). John Wayne Airport Transportation Impact Analysis Report. Anaheim, CA: Fehr & Peers (Appendix G).
R:\Projects\JWA\J003\Draft EIR\Admin Draft\4.8 Traffic-051914.docx