Embed Size (px)
Citation preview

0
Bridging the Discontinuity In Adolescent Literacy:
Evidence of an Effective Middle Grades Intervention
Shaun M. Dougherty
Harvard University
DRAFT – DO NOT CITE
Acknowledgements: I would like to thank Marty West, Larry Katz, Stephen Lipscomb, Matthew
Kraft and John Willet, for the insights and feedback on this draft. All mistakes or omissions are
my own.

1
Bridging the Discontinuity In Adolescent Literacy:
Evidence of an Effective Middle Grades Intervention
Abstract:
The development of strong literacy skills is crucial to ensuring an individual’s future educational
and economic success. Existing evidence suggests that the transition from elementary to middle
school is a particularly crucial period for a child’s literacy development and requires sustained
support through this transition. In this paper I investigated the impact of a “double dose” of
literacy instruction in a large suburban school district on subsequent measures of student literacy.
I capitalize on the existence of a natural experiment born out of the district’s use of an
exogenously-determined cutoff in Iowa Test scores in 5th
grade to assign students to an
additional literacy course in middle school. My findings suggest that an additional semester of
exposure to this instructional intervention generates notable increases in students’ state
standardized reading test scores (0.2 SD), and positive effects (0.1 SD) on their percentile
ranking on the reading portion of the Iowa Test in 8th
grade. Most research that uses student test
score outcomes finds positive effects of intervention in mathematics, but often not in reading.
My findings suggest that using a double dose of literacy instruction in middle school is an
effective way of increasing student understanding in literacy for students in the middle of the 5th
-
grade distribution of literacy ability.

2
Literacy in Transition: Regression-Discontinuity
Evidence of an Effective Literacy Intervention in Middle School
The capacity of school districts to support the ongoing development of their students’
literacy skills plays a critical role in enhancing their academic and labor-market outcomes.
Students who do not develop adequate literacy skills by the end of elementary school are at
higher risk of dropping out of school and face inferior labor-market options (National
Governor’s Association, 2005; Vignoles, De Coulon, & Marcenaro-Gutierrez, 2011). Though
fourth graders’ reading scores on the National Assessment of Educational Progress have been
trending higher, Snow and Moje (2010) point out that score trends are flat among 8th
and 12th
graders, (Lee, Grigg, & Donohue, 2007, p.3). These trends underscore the need for literacy
support at the critical transition between elementary and secondary schooling (Chall & Jacobs,
2003).
Schools and districts seeking to improve their adolescent literacy outcomes face resource
constraints. Recent budget crises and mounting pressure from the requirements of No Child Left
Behind (NCLB) necessitate that schools find ways to leverage existing resources and generate
results in short time frames. Prior work has documented the variety of strategies taken by
districts to improve the academic performance of their students (Chamberlain, Daniels, Madden,
& Slavin, 2007; Hong & Raudenbush, 2007; Jacob & Lefgren, 2004; Kemple, Herlihy, & Smith,
2005; Neal & Schanzenbach, 2009; Sims, 2008).
One widely-used though under-evaluated method for improving student outcomes is
through providing a “double dose” of instruction in subject areas tested for the purposes of
NCLB, most notably, reading and mathematics. Recent evidence from Chicago suggests that
these double-dose strategies with algebra instruction can have positive short-term impacts on
3
student’s academic performance, as well as positive longer-run impacts on high-school
graduation and post-secondary enrollment. (Nomi & Allensworth, 2009; Cortes, Goodman, &
Nomi, 2012). Other recent work examining the effects of double dose strategies in mathematics
have shown similarly positive effects (Taylor, unpublished). However, little is known about the
effectiveness of the double dose strategy for boosting literacy outcomes despite evidence that
double-dose strategies have been and are used throughout the country (Cavanagh, 2006;
Mazzolini & Morley, 2006; Paglin, 2003; Wanzek & Vaughn, 2008; Durham Public Schools,
n.d). The paucity of good evidence on the effectiveness of literacy interventions at the crucial
transition from elementary to middle grades is particularly notable in that the little evidence that
exists is not causal.
I fill this gap in the literature by providing causal evidence for the effectiveness of a
double dose of literacy instruction in middle school. I focus on an intervention where the second
dose of literacy instruction uses research-based instructional strategies, and I show that this
instruction leads to systematic improvement in adolescent reading comprehension. Using a rich
set of data from school districts that enrolls over 90,000 students, I estimate the impact of a
district-developed, classroom-based literacy intervention in middle school on both immediate
and medium-term student test scores. Specifically, I investigated whether — and by how much
— participation in a supplementary reading class in middle school improved student test scores
in reading.
The site for my study provided an ideal setting to evaluate the impact of a research-based
and district-designed literacy intervention. In the district, student assignment to the supplemental
reading class was made using a cutoff rule based on a student’s 5th
grade test score, allowing me
to use a regression-discontinuity approach to obtain an unbiased estimate of the causal impact of

4
the intervention on student outcomes. The student’s position relative to this cutoff provided an
indicator of intent-to-treat, which I used to instrument for their “take-up” of the supplementary
reading intervention. Thus, I was able to identify the causal impact of enrollment in the program
for students near, but on opposite sides of the cutoff.
I find that there was a positive and statistically significant improvement in student
reading state test scores in 6th
grade, for students in the immediate vicinity of the cut-off, with
smaller effects in 7th
grade, and complete fade out of the effect by 8th
grade. In addition, I find
that the intervention had a small positive impact on student percentile rank on the reading portion
of the Iowa Test of Basic Skills in grade 8, indicating that the measured learning gains suggest
real learning and not an artifact of potential teaching to the test.
I have laid out the rest of the paper in four sections. In the next section, I consider the
district’s theory of action with respect to the extant literature on effective instructional strategies
that promote adolescent literacy, and describe the school district setting and their implementation
of the supplementary reading program itself. In section three, I present my research design,
including a description of my data collection and data-analytic strategy, followed by my results
in section four. In the final section of the paper, I discuss potential threats to both the internal and
external validity of my findings and review the implications of my findings for practice and
future research.
2. Background and Context
2.1 Background on the Intervention:
For the last twenty years, the Hampton County Public School (HCPS) district has adapted
its approach to meeting the instructional needs of its students in literacy, as the policy

5
environment has shifted around it.1 Initially, the district employed the use of a supplementary
reading program as a means to improve the literacy skills of its students as they transition from
primary to secondary schooling. The district-maintained reading lab was designed to provide
instructional support in literacy for students in the late elementary and early secondary grades.
This lab supported students outside of their regular course of instruction, but in the 1990s the
district moved to embed literacy support within an established course of instruction. Some of
this change was motivated by standards-based reforms that changed the way that instructional
targets, or standards, were defined (Darling-Hammond, 2004; McLaughlin & Shepard, 1995).
The importance of the course was further underscored when the policy landscape was modified
again in 2001 by the passage of the federal No Child Left Behind (NCLB) act and the
implementation of high-stakes, standards-based testing that began in the 2002-2003 school year.
In response to these changes, HCPS has revised its instructional strategy to meet the needs of its
students and to ensure that its schools satisfy, among other things, the adequate yearly progress
(AYP) provision of NCLB.
Each of the district’s twenty middle schools serves students in grades 6 through 8. In all
district middle schools, students must earn a passing grade in a language-arts course to fulfill
their annual English requirement. Language-arts courses address all of the state standards’
domains: reading, writing, literary conventions, listening, speaking, and viewing. To address
these domains, the language-arts classes use a literature anthology, a grammar text, and selected
novels assigned specifically by grade level. The supplementary reading course was designed to
complement a student’s language arts curriculum, and to improve the development student’s
literacy skills to levels that are consistent with grade-level expectations by focusing only on the
1 Per my agreement with the district I have replaced the actual district and program names with pseudonyms when
referring to them in print.

6
reading standards, and the standards for writing in response to reading. Teachers address the
reading standards in the supplementary reading classes using grade-level-appropriate non-fiction
texts and novels.
2.2 Theory of Change and Recent Literature
The theory of change employed by HCPS is that enrolling students who have
demonstrated a need for additional literacy support in a course that was designed to employ
research-proven strategies is likely to improve literacy outcomes for those students. Specifically,
this district drew on research from Dole, Duffy, Roehler, and Pearson (1991), and designed the
supplementary reading class to explicitly dwell on seven “basic” reading strategies: activating
background knowledge, questioning the text, drawing inferences, determining importance,
creating mental images, repairing understanding when meaning breaks down, and synthesizing
information. In addition, the district also encouraged the use of writing activities to support each
of these seven reading strategies.
Though the research from Dole and colleagues is more than twenty years old, more
recent research continues to substantiate the use of these strategies, particularly with adolescents.
A meta-analysis on the effectiveness of reading interventions for struggling readers in grades six
through twelve revealed that many of the same strategies suggested by Dole and colleagues were
used across the thirteen studies that could be included in that meta-analysis (Edmonds, Vaughn,
Wexler, Reutebuch, Cable, Klinger Tackett, Schnakenberg, 2009). This meta-analysis found a
large effect size of 0.89 SD for reading comprehension outcomes. Evidence from another recent
meta-analysis on writing to read, further supports the strategies employed by HCPS. Graham &
Hebert (2012) found that writing to read strategies improve student reading comprehension by
about 0.37 SD. In yet another teacher-delivered intervention, Vaughn, Klingner, Swanson,

7
Boardman, Roberts, Mohammed, & Stillman-Spisak (2011) performed an experimental
evaluation of collaborative strategic reading (CSR) with middle school students, where English-
language arts teachers provided a multicomponent reading comprehension instruction twice a
week for 18 weeks, and found modest positive effects on reading comprehension. All of this
more recent evidence suggests that the research used to design the supplementary reading class
continues to be valid and relevant.
2.3 Assignment to the Supplementary Reading Program
Students in HCPS were assigned to receive supplementary reading instruction in middle
school based on how they scored on the Iowa Test of Basic Skills (ITBS) in reading during their
5th
grade year. Students who scored below the nationally-defined 60th
percentile on ITBS in
reading were assigned, by rule, to complete the supplementary reading program in middle
school. The HCPS policy was designed to enroll students in the supplementary reading course
for all three (grades 6, 7, and 8) years of middle school, with the goal of preparing students to
meet proficiency requirements on the criterion-referenced 8th
grade state test in reading (used in
making decisions about grade promotion), and on the norm-referenced 8th
grade administration
of the ITBS in reading. Students not identified to participate in the reading intervention could
elect to take a reading course or enrolled in an exploratory foreign-language course.
Prior to this study, HCPS had never explored whether participating in a supplementary
reading course in middle school actually improved students’ literacy outcomes. The program’s
perceived low cost and the knowledge of the importance of literacy skills were sufficient
justification for offering the supplementary reading course. The potential effectiveness of the
HSPC reading intervention has implications beyond the district’s own interests. Understanding

8
how and whether similar literacy interventions improve student outcomes is important for
making both local and state-level decisions regarding literacy instruction. In particular, there are
a growing number of computer-based forms of literacy interventions that schools may choose to
purchase and implement, some of which have been shown to produce learning gains (Rouse &
Krueger, 2004). By knowing the impact of a district-developed, teacher-delivered literacy
intervention, schools and districts will have some means for deciding whether existing human
capital can produce results comparable to those possible through programs available for
purchase.
3. Research Design:
3.1 Site, Dataset, and Sample:
My study is situated in a large (over 80,000 students Pre-K through grade 12) suburban
school district in the southeastern United States. My data are drawn from a comprehensive
administrative data set covering all students enrolled in the district during the school years of
1999-2000 through 2009-2010. This dataset contains test scores and enrollment data for students
in middle school and follows them longitudinally within the district into high school. The data
include course enrollment data, mandated state accountability test scores in reading, literature
and mathematics, ITBS scores from grades five and eight, high school end-of-course
examinations, and SAT scores. HCPS resembles the changing demographic structure of many
suburban settings, with substantial racial and socioeconomic variation. The student population is
43% white, 36% African American, 10% Latino/a, 8% Asian, and 3% other race. Forty-three
percent of students receive free- or reduced-price lunch, 8% are English-Language Learners, and
18% have an Individualized Education Program.

9
The district is comprised of schools classified as traditional, charter, converted charter,
and alternative schools. Both traditional and conversion charter schools are subject to district
policies while alternative and other charters are exempt. I restrict my analysis to students who go
through one of the 20 traditional or conversion charter middle schools that serve HCPS students
in grades 6 through 8. My sample includes all students from the seven cohorts who took the 5th
grade ITBS reading test in the school years 2002-2003 through 2008-2009. The students I retain
in my sample are representative of the students in both the traditional and conversion charter
schools.
3.2 Measures
My academic outcomes of interest are state test scores in reading in grades six through
eight (READ6, READ7, READ8). For each of these outcomes I wish to estimate the effect of
participating in the supplementary reading intervention which I measure as the number of
semesters of enrollment in the supplementary course (SUPREAD). This variable has a minimum
at zero for students who enroll in no semesters of the supplementary reading course, and a
maximum of six for those who participate for all six semesters of their three years in middle
school. Because student eligibility for the reading intervention is conditional on their 5th
grade
ITBS percentile score, I also include this measure (ITBS5) as the forcing variable – or the
variable used to dictate the offer of intervention - , as well as a binary indicator (ELIG) equal to
one if a student scored at or below the 60th
percentile on the 5th
grade ITBS, and is therefore
eligible to receive the supplementary reading instruction. To improve the precision of my
estimates I also include a vector of student covariates, . This vector includes student state test
scores in reading and mathematics from 5th
grade (READ5, MATH5), as well as indicators for

10
sex, race, free and reduced lunch status, special education status, and English Language Learner
status. Despite designing the literacy intervention as a district-level policy, the application of the
policy may vary based on the individual behavior of school administrators. For instance,
individual schools may be more or less stringent in their requirement that students who are
eligible for supplementary reading take-up the treatment. Likewise, adherence to a long-standing
policy may experience drift over time. To control for potential differences in the implementation
of the literacy intervention across schools and cohorts of students, I additionally include fixed-
effects for school ( and cohort ( .
3.3 Statistical Model:
I employ a two-stage least squares (2SLS) approach to estimate the causal effect of
participating in an additional semester of supplementary reading while in middle school. Because
take up of the supplementary reading instruction is potentially endogenous, I use the random
offer of eligibility in the program, generated by a student’s position relative to the 60th
-percentile
cutoff, to isolate the exogenous variation in participation. In my first stage, I fit the following
statistical model:
( )
(1)
I model the number of semesters that a student is enrolled in the supplementary reading
course ( ), for student i in school j in grade g and cohort s. I estimate this
participation variable as a function of students’ 5th
-grade ITBS score re-centered at the 60th
percentile cutoff score ( , the exogenous instrument, , the vector of

11
student-level covariates ( ), and fixed effects for school and cohort. To allow the relationship
between supplementary reading score and 5th
grade ITBS score to vary on either side of the
exogenous cutoff, I also include the interaction term ( ). Following the
example of Dee (2004) and the suggestion of Murnane and Willett (2011), I also interact
pretreatment indicators for whether a student is black and whether they had an individualized
educational program (IEP) with the indicator for supplementary reading eligibility, to create two
additional instrumental variables ( ) which I include in my
preferred model specification. I model the error structure to account for the clustering of students
within schools and use Huber-White adjusted standard errors to account for potential deviations
from normality assumptions.
In the second stage of my estimation, I use the following statistical model:
)
(2)
In this model I estimate , a generic placeholder for my several outcomes of interest, as a
function of the re-centered 5th
-grade ITBS score, student exposure to the supplementary reading
course, as well as a vector of student covariates and fixed effects for school and cohort. As in my
first stage, I also allow the slope of relationship between ITBS score and the outcome to vary on
either side of the cutoff. Importantly, because the take-up of supplementary reading is
endogenous, I use the fitted values of from my first-stage model to isolate that the
variation in this treatment that is exogenous, to estimate the causal effect of an additional
semester of supplemental reading on the student outcome, . As in the first stage, I also

12
cluster standard errors at the school level, and apply a Huber-White adjustment for violations of
homoskedasticity assumptions.
The coefficient that answers my research question is , which represents the causal
effect of experiencing an additional semester of the literacy intervention for a student who fell
just shy of the required passing score on the 5th
-grade ITBS compared to students who scored
just above this score threshold on the 5th
grade test.
Following the suggestion of Imbens & Lemiux (2008), I model the relationship between
5th
grade ITBS score and the outcome in each stage as “locally linear”. I chose an optimal
bandwidth according to their suggestion of minimizing the mean square error of models fit
across analytic windows of varying width. The results of this process suggest a symmetric
window of 10 percentile points for fitting all models. To verify the robustness of my results, I
also fit these models across multiple bandwidths.
3.4 Verifying Assumptions for Regression-Discontinuity
All regression discontinuities have the potential to be undermined by failures of
important assumptions, most notably discontinuities in other variables, or discontinuities in the
forcing variables at unexpected locations. In my study, it is crucial to establish that my findings
are not driven by discontinuities in control variables, that the instrument is working the way that
it was intended, and that the only discontinuity in student exposure to the treatment is at the point
of the cutoff designated by the school district.
To verify the soundness of my regression discontinuity design, I employ several checks
on my model. Following the example of McCrary (2008), I first investigated whether any
evidence existed to suggest manipulation of the forcing variable.1 Manipulation of student’s
position relative to the district-defined cutoff is highly implausible. For instance, students can not

13
manipulate their position relative to the cutoff since the percentile rank is generated from a
nationally-normed sample. And district administrators may likewise not manipulate the
eligibility of students with respect to the exogenously-chosen cutoff, which lessens the potential
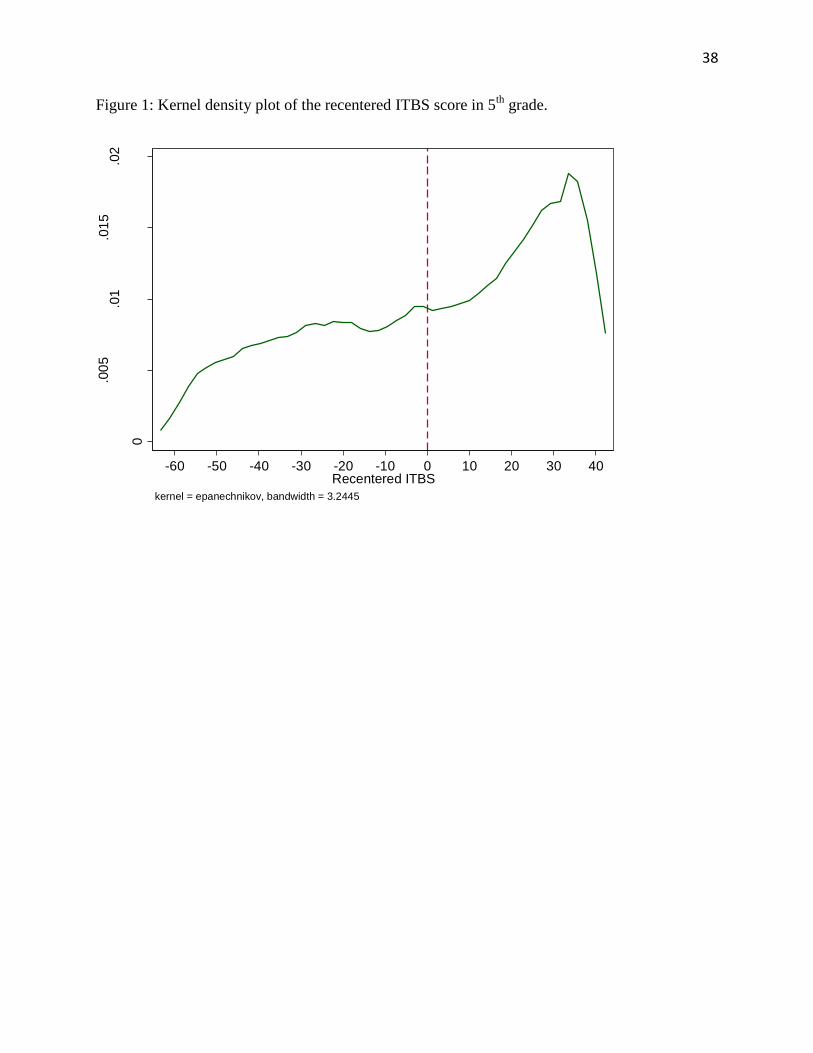
threat to the RD design. Despite absence of a real threat to the validity of my forcing variable, in
Figure 1, I present the empirical distribution of the forcing variable, 5th
-grade ITBS score, to
illustrate that it is smooth across the whole distribution, and in particular around the discontinuity
used for assigning students to the supplementary reading (denoted by the vertical red line). The
empirical distribution that I present in Figure 1 does not show evidence of particularly high
densities of individuals on either side of the cutoff which might suggest evidence of
manipulation.
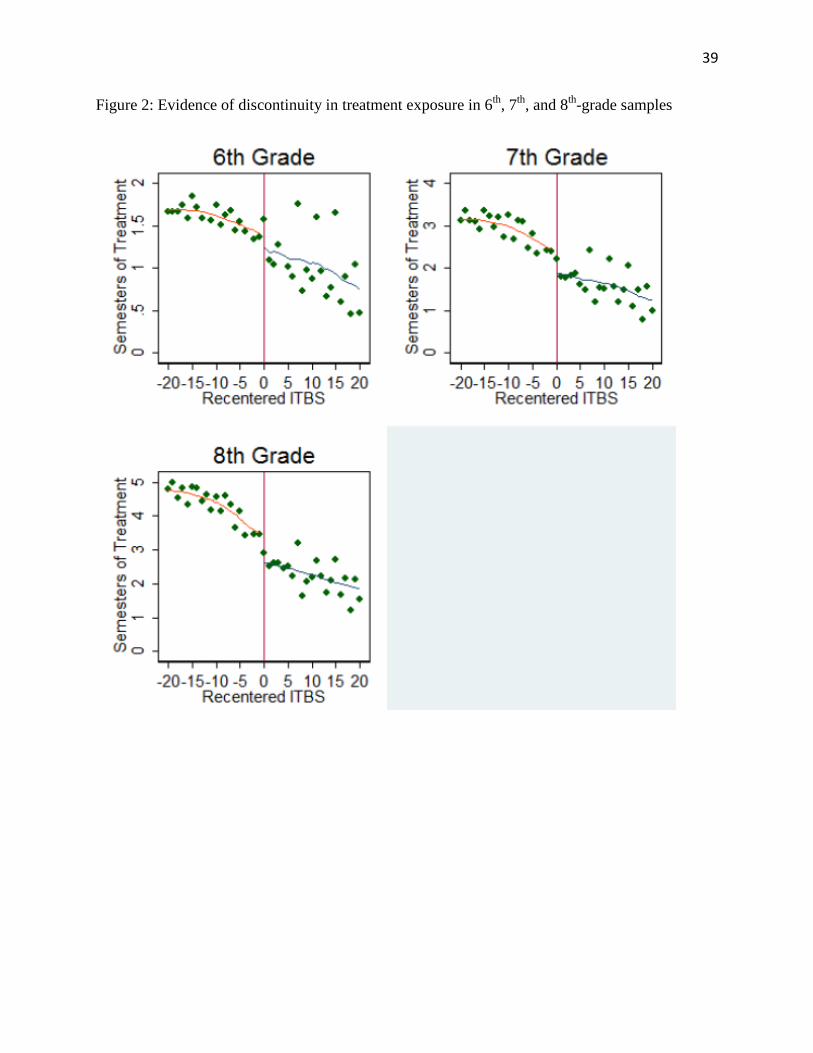
To further attest to the validity of the RD approach, I display in Figure 2 evidence of a
discontinuity in exposure to treatment at the exogenously-determined cutoff in ITBS score. Each
of the three graphs depicts evidence of a modest discontinuity in the number of semesters of the
reading support that students on either side of the eligibility cutoff received. The gap shown
between the trends at the cutoff score suggests that exposure to treatment does change
discontinuously at this ITBS score. The smaller magnitude in the discontinuity motivated my
choice (above) to use multiple instruments in the first stage of my estimation.
As a final check on the appropriateness of my RD approach, I examined the distributions
of covariates that I used as control variables to ensure that no other discontinuities existed which
might have generated my results. To examine potential discontinuities, I fit the model:
. I fit this model across multiple bandwidths
to confirm that, near the cutoff, there are no discontinuities in the covariates and that students
who are eligible for assignment to supplementary reading are equal in expectation to those who

14
are not eligible based on their 5th
grade ITBS score. Evidence that this assumption is upheld is
demonstrated by my failing to reject the null hypothesis that is equal 0 for each of the
covariates. I display the results of this specification check in Table 1. These results suggest that
there is no evidence of discontinuities in the conditional distributions of these covariates in any
of the eight panels, which suggests that there is no reason to believe that any effects found in my
regression analyses would be driven by discontinuities in these other variables.
4. Results:
I find evidence that the reading intervention appears to boost reading performance as
measured by both the state standardized test and the percentile score of the 8th
grade ITBS. The
effect sizes for an additional semester of reading get smaller across successive grades, and
become statistically insignificant by 8th
grade.
4.1 Reduced-form OLS results
In Table 2 I present my reduced-form estimates of the effect of supplementary reading
exposure on subsequent student test scores. To fit the reduced-form models, I used all available
data in my sample and regressed the outcome on the forcing variable, 5th
-grade ITBS scores, the
measure of exposure to supplementary reading, demographic controls, and fixed-effects for
cohort and school. To avoid having to make strong assumptions about the functional form of the
relationship between my forcing variables and the outcomes of interest, I allow the relationship
between the forcing variable and the outcome to be a flexible polynomial and include terms up to
a quartic in 5th
-grade ITBS scores.2 For the purposes of illustration, and I include the reduced-
form estimates for two of my outcomes of interest, standardized reading scores in 6th
and 8th
2 I also modeled the relationship as linear, quadratic, and cubic with no substantive change in the results

15
grade. The results were similar for the other outcome. In the first row of each column of Table 2,
I present the respective reduced-form estimates for 6th
- grade state reading scores, and 8th
-grade
ITBS percentile. The coefficients in the first row represent the estimated effect of receiving the
offer of a spot in a supplementary reading course on the respective outcomes. I interpret the
coefficient in row one of column (1), 0.03, as suggesting that receiving the random offer to
participate in supplementary reading in 6th
grade, on average, is associated with a three-
hundredths of a standard deviation increase in scores on the 6th
-grade state reading test, though
this relationship is not statistically significant. In fact, the coefficients on ELIG in each of these
two reduced-form models is not significant, and therefore these estimates suggest that the offer
of supplementary reading alone has no effect on these later measures of reading performance.
My reduced-form estimates constitute the intent-to-treat (ITT) estimates of the offer of
eligibility for supplementary reading. If take up of the supplementary reading program was
perfectly predicted by eligibility for the program these estimates would be the estimates of
greatest policy interest, since they apply to the whole distribution of reading ability. However,
because take-up of the treatment, conditional on eligibility, is not perfect I contrast my ITT
estimates with the instrumental-variable estimates from my regression-discontinuity analysis
below, and emphasize in the discussion the implications this has for research and practice. These
IV estimates constitute the treatment-on-the-treated (TOT) effects of supplementary reading,
which are of arguably larger importance in answering the question of whether those who
experienced the treatment actually benefited from it.
4.2 TOT Estimates of Supplementary Reading

16
I find that exposure to an additional semester of supplementary reading has positive and
statistically-significant effects on student test scores in 6th
and 7th
grade, with the marginal effects
fading out by 8th
grade. In column (1) of Table 3 the coefficient of 0.265 (p=0.03) in the first row
of column (1) suggests that for 6th
graders, experiencing an additional semester of
supplementary reading increases student’s 6th
-grade state reading test scores by just over a
quarter of a standard deviation. If the effect of each semester of exposure is equal, then the
maximum positive effect of participating in supplementary reading for both semesters of 6th
grade is just over 0.5 standard deviations. In 7th
grade I estimate the effect of an additional
semester of supplementary reading on 7th
-grade state reading scores. The coefficient of 0.103
(p=0.03) suggests that an additional semester of supplementary reading increases reading test
scores in 7th
-grade by just over a tenth of standard deviation. If the effect of the intervention is
additive and linear, then the maxmimum exposure (all four semesters) to the reading intervention
by the end of 7th
grade is about 0.4 standard deviations. My estimate of the effect of an additional
semester of supplementary reading on 8th
-grade state reading test is not statistically-significant,
however, my point estimate for the effect of one semester suggests that the cumulative effect of
maximum exposure to supplementary reading (six semesters) may be as high as 0.12 standard
deviations. Notably, I report an effect of 2.4 percentile points on the national percentile ranking
on the 8th
-grade ITBS as evidence of a statistically-significant relationship between the
intervention and 8th
-grade ITBS percentile.
For all four outcomes the corresponding first-stage results provide confidence in the
strength of my instrumental variables. As I present in row one of Panel B in Table 3, the statistics
for the omnibus F-test in the first stage well exceed the conventionally-accepted measure of
adequate instruments of F equal to ten or more.

17
As a further presentation of these results I exhibit simultaneously in Figure 4 the
discontinuity in exposure to the supplementary reading treatment and its subsequent impact on
student test scores. Panels A and B in Figure 4, illustrate both the treatment and outcome trends
for 6th
-grade reading scores and 8th
-grade ITBS percentile, respectively. In each of these two
graphs I present the y-axis on the left-hand side as the outcome of interest, and the y-axis on the
right-hand side as the measure of total semesters of exposure to treatment. The x-axis in both
graphs corresponds to the re-centered 5th
-grade ITBS score, and I include a dashed reference line
at the point of the exogenously imposed cutoff in 5th
-grade ITBS score. The trends
corresponding to the left-hand access show the modest effect on the outcome of an additional
semester of exposure to supplementary reading, while the trends corresponding to the right-hand
axis show the discontinuity in the exposure to the treatment.
5. Discussion:
5.1 Threats to Validity
There are several potential threats to the validity of my findings, some of which are
methodological, and others that are related to program implementation. The chief
methodological threats to the validity of my findings are that they may be sensitive to my choice
of bandwidth, and that a linear specification of the relationship between the forcing variable and
my outcomes may not be appropriate. My analyses could also be threatened by selective attrition
from the treatment group over time. I consider each of these threats below, beginning with the
methodological threats.
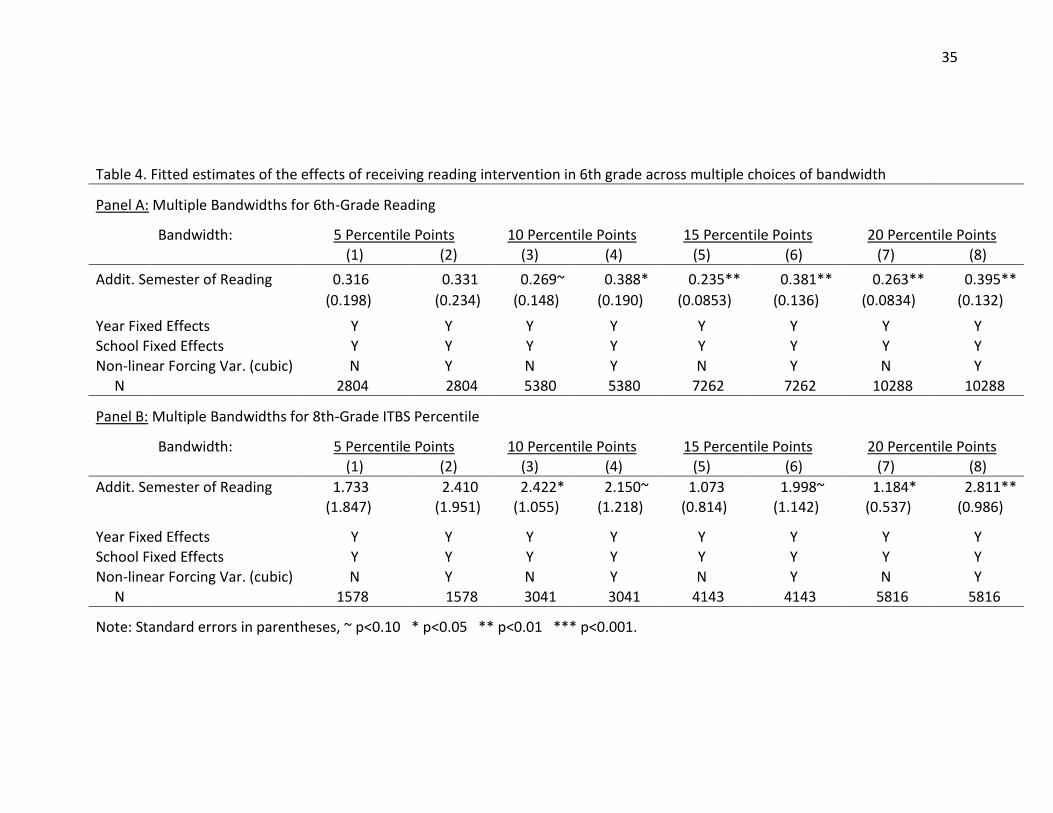
In Table 4, I display the results of fitting models across multiple bandwidths, using both a
linear and cubic specification of the forcing variable. Panel A contains estimates where 6th
-grade
state reading scores are the outcome, Panel B presents estimates where 8th
-grade ITBS percentile

18
is the outcome. For each outcome, I present a pair of columns for a given bandwidth, where in
the even columns I have used a linear specification of the forcing variable, and in the odd
columns I have included up to a cubic term in the forcing variable. For instance, the value in row
one, column one of Panel A estimates of the effect of an additional semester of supplementary
reading on 6th
-grade reading scores using a symmetric bandwidth of 5 percentile points around
the cutoff score in the forcing variable. The parameter estimate 0.316 suggests that an additional
semester of supplementary reading is associated, on average, with a three-tenths standard
deviation increase in 6th
-grade reading score however this relationship is not statistically-
significant. In this same panel and row, but in column (2), I present the analogous estimate of the
effect of supplementary reading, but with my up-to-a-cubic specification of the forcing variable.
The relationship here is also not statistically-significant.
What is striking, and most important, about the results in Table 4, is that the parameter
estimates are relatively stable across choices of bandwidth, and across model specification. Also
important is that the relationships exhibited in models where the bandwidth is ten percentile
points or greater are consistently statistically significant. The statistical significance and stability
of these relationships across the two outcomes presented in Table 4 suggest that these effects are
not sensitive to bandwidth choice.
The results in Table 4 also appear to address the potential threat of a non-linear
relationship between the forcing variable and my outcomes. To further counter this threat, Table
4 presents the results of fitting several specifications of the forcing variable at a bandwidth of ten
percentile points.3 As with other tables, Table 5 is laid out as two panels that differ only in the
outcome variable used. In both panels, columns represent estimates of the effect of an additional
3 The results present in Table 4 are illustrative of the insensitivity of my findings to non-linear model specifications,
and generalize to other choices of bandwidth. For simplicity I present only these results here, but can furnish more upon request.

19
semester of supplementary reading for different model specifications. Column (1) presents
estimates using a linear specification of the forcing variable, column (2) includes up to a
quadratic term, in (3) I include up to a cubic, and in (4) I include up to a quartic term in the
forcing variable. Though my parameter estimates for the effect of supplementary reading on each
outcome are not identical across specifications they do not differ widely – in fact, the linear
specification provides a lower bound on point estimates - and the statistical significance of the
relationship they represent is also stable. The robustness of my findings with respect to
bandwidth choice and functional form of the relationship between the outcomes and the forcing
variable, provide evidence that these potential concerns do not threaten the validity of my
inferences.
A substantive threat to the validity of my findings concerns the attrition of students from
the treatment to the control groups across years. While the school district’s policy is designed to
keep eligible students who enroll in supplementary reading in 6th
grade in the course across all
three years of middle school, district officials have stated that parents and administrators
sometimes agree to allow students to not participate or to stop participating after a period of
time. The chief threat posed by the loss of students from the sample comes from whether the rate
of attrition differs across treatment and control groups. Disproportionate attrition from either
treatment or control groups undermines the assumptions of randomly-equivalent groups and
could invalidate the inference I would make based on my estimate of the treatment effect
To respond to the threat of attrition, I analyze my sample attrition in a manner consistent
with the evidence standards for regression-discontinuity designs established by the What Works
Clearninghouse (WWC) (Schochet, Cook, Deke, Imbens, Lockwood, Porter, & Smith, 2010).
My analyses focus on three analytical samples; those cohorts of students who are observed

20
between 5th
and 8th
grade, those observed 5th
through 7th
, and those observed in5th and 6th
grade.
For the purposes of analyzing attrition, I define the students who scored within ten points of the
cutoff score on the ITBS-Reading in 5th
grade as the focal group for each of my three analytic
cohorts. I consider, in turn, the attrition of both “treatment” (those eligible for the literacy
instruction) and “control” (those not eligible) from 5th
grade through the last year that they are
observed. As suggested by the WWC, differential attrition from the treatment and control groups
would undermine the validity of my findings since such attrition could bias my estimates.
I find no evidence of differential attrition from my treatment and control groups in any of
the three analytic samples I consider. In Table 6, I display the total number of students defining
the sample based on their 5th
-grade scores, the division of this sample across treatment and
control and the rates of attrition from both treatment and control for each sample. For instance, in
column one I present the analysis for students who I include in my analyses of 6th
-grade
outcomes. There are 6,689 students in this sample in 5th
grade with only 332 (about 5% of the
original sample) leaving the initial sample by 6th
grade. Among those who attrite, 51% were in
the treatment group with the remaining in control. The rate and distribution of attrition is
comparable in 7th
and 8th
grades with 11 and 16 percent leaving their respective samples, and just
over half of that attrition coming from the treatment group. The slight differential in the rate of
attrition (more from treatment than control) is not sufficient to undermine the quality of the
inference that I can make from these data.
5.2 Interpreting Findings
My findings have several implications, both clear and suggestive, for how HCPS and
other districts could consider using their supplementary reading programs in the future. The
clearest finding in my study is that there is a boost to student performance on state reading

21
assessments for those students who participate in supplementary reading. I estimated the effect of
an additional semester of supplementary reading to be about 0.2 standard deviations per semester
in 6th
grade, suggesting that students who participated for both semesters of 6th
grade could score
up to half a standard deviation better on the 6th
-grade reading test than those who took no
supplementary reading. While the marginal effect of supplementary reading may not be strictly
additive, if effects ranged between 0.3 and 0.5 standard deviations for a full year of participation
they would be considered large by social-science standards.
Despite the moderate-to-large effects of supplementary reading on 6th
-grade reading
scores the effect the effects of supplementary reading will likely not be the same across the
subsequent two years of middle school. For instance, in 7th
grade the benefit of an additional
semester of supplementary reading is one-tenth of a standard deviation, suggesting that the upper
bound on the effect of four semesters of reading would be about 0.4 SD compared to
experiencing zero semesters of supplementary reading. In 8th
grade the point estimates of the
effect of supplementary reading on state reading test scores, and the implied cumulative potential
benefit were even smaller (0.02 and 0.12 SD, respectively) but the relationship between the
intervention and the outcome was no longer statistically significant.
One explanation for the decline in the marginal and cumulative effect of the
supplementary reading program may relate to students who drop out of the intervention – though
are retained in the sample - over time. In Table 7, I display the cumulative exposure to
supplementary reading for the students in my sample. It is notable that in 6th
grade that roughly
75 percent of those students who are within the analytic window and eligible for supplementary
reading take up the offer of both semesters, though by 7th
grade those receiving maximum
exposure has fallen to fewer than half of eligible students. If the students who remain in the full-
22
exposure group are those that were lower performing on the 6th
-grade examination, then by
design those remaining in treatment are of lower ability, and those who left treatment are now
counted among the control group. This switching behavior is likely to suppress both the
magnitude and significance of any marginal differences in 7th
or 8th
grade.
There are also several other potential explanations for the smaller and insignificant effect
in eighth grade. First, curricular changes in grades 7 and 8, and differences in the skill content
tested on the state standardized tests may also alter the extent to which I could observe a
statistically-significant marginal effect of participating in supplementary reading. Alternatively,
the difference between having three semesters of additional reading instruction or four semesters,
compared to someone with zero may not register as significant if the content that is tested is not
well-aligned with the skills that are being taught in the additional semester. And finally, the
absence of a statistically-significant effect may also be explained by a simple plateauing of
effect. That is, there are likely diminishing returns to an additional semester of reading.
One concern that these apparent positive effects might raise, is that supplementary-
reading teachers in emphasize test preparation exercises as a way to produce the positive results
in 6th
and 7th
grade. The possibility of coaching to tests, or “score inflation” is a phenomenon
noted in other scholarly work, and a possibility that schools and districts would do well to make
attempts to mitigate (Hamilton & Koretz, 2002; Jennings & Bearak, 2010; Koretz, 2003, 2005).
As an informal check on whether score inflation is the likely cause of the positive effects, I used
an audit test, in the form of the 8th
-grade ITBS reading test, as one of my outcomes. In Table 4,
the coefficient on the dosage variable for 8th
-grade ITBS percentile rank is positive. The sign and

23
magnitude of these coefficients is consistent with real learning (i.e. – positive effects on a
generalized test of literacy standards).4
A limitation on the interpretability of my findings is posed by their external validity. By
construction, the effects I estimated in my study apply only to those students who were just
below the cutoff and eligible for the treatment, in comparison to those who were just above and
not eligible. Though these treatment-on-the-treated estimates are helpful, it does not answer the
ITT question of the average effect of supplementary reading for all those students who were
eligible and participated. Importantly, the reduced-form estimates that I presented suggest that
the ITT effects may be smaller, and that the relationship between supplementary reading and
later test scores may not be statistically-significant in my sample. If only ITT estimates were
used to measure the effect of this supplementary reading program it may have been modified or
cancelled based on those null findings.
5.3 Policy Alternatives
Beyond the apparent academic benefits of providing a supplementary reading course, it
may also have other attractive qualities such as cost neutrality. For example, it may be no more
expensive for HCPS to offer supplementary reading course than to provide no such course. The
zero net cost difference is likely to arise from the fact that, by not taking supplementary reading
students would otherwise take an elective course in its place, often a foreign-language course. If
true, the total number of teachers employed by the school district is likely the same whether they
offer or do not offer supplementary reading. In addition, there is no reason to suspect that the
cost of course materials for these two types of courses would not be comparable. An implicit cost
of supplying this supplementary reading class is the opportunity cost to the student of being
4 I also performed this check using 8
th-grade ITBS test score, rather than percentile rank, as the outcome. The
coefficient of interest in this fitting was positive, though not statistically significant. Despite the insignificance, the sign and magnitude in both of these instances seems indicative of real learning.

24
enrolled in the reading class rather than a course of their choosing. For the district, however, they
must examine whether the cost of providing the reading teacher is higher relative to the foreign-
language classes. Teacher costs could differ if teachers of supplementary reading have a higher
probability of having a master’s degree than their counterparts in foreign language, or other
plausible alternative to supplementary reading.
Supplementary reading may also appear attractive when compared to proven alternatives
to generating positive impacts on reading outcomes. A review of the evidence provided through
the What Works Clearinghouse (WWC) revealed that of the ten experimental or quasi-
experimental programs reviewed that promote effective adolescent literacy interventions, six of
them are copyrighted or registered trademarks, and one other is available through a major
educational publishing company (WWC, 2012, see also Rouse & Krueger, 2004). In each case,
these copyrighted programs are available for purchase to school districts that wish to implement
them. These purchasable programs may be particularly enticing for schools operating within a
tier of the school-improvement cycle enforced by states when schools fail to meet aspects of the
NLCB adequate yearly progress (AYP) provision (NCLB, 2002). However, districts may face
this increased incentive to purchase programs at a time when they are already financially
constrained. In the case of computer-based learning, these programs require purchases of site
licenses, professional development, and both infrastructure (computers and networks) as well as
technological support (likely some fraction of one IT staff member). Such programs result in
costs above and beyond those associated with hiring the classroom teacher to monitor and
implement them. By comparison, one reading teacher, teaching five classes of 20 students each
can reach one hundred students.

25
Another alternative, curricular reform, may also be comparatively expensive. Purchase of
new materials, professional development, and (at least in the short run) the potential loss of
efficiencies in instruction as teachers learn a new system, all contribute to the increased cost of
choosing curricular reform as a means to improve literacy outcomes. Though the conclusions of
cost deliberations will vary by district, if the average annual cost of a reading teacher is $70,000,
it may very well prove to be the most flexible and affordable option available. Moreover, if
schools can leverage their existing human capital, rather than purchasing alternative programs,
they may have greater flexibility to adapt over time, and be poised to better address the needs of
their students.
5.4 Conclusion
In an era of high-stakes testing and school accountability, schools care as much now as at
any time in the past about improving the literacy skills of their students. For the students, there is
nothing more important to their long-term success than their ability to participate in their lives,
and the economy, as fully-literate individuals. My findings suggest that a research-based
supplementary reading course in middle school can boost short-term measures of student’s
reading comprehension. These findings are particularly impressive in that they were achieved by
deploying this “double dose” strategy across twenty individual middle schools, and taught by
more than twenty individual teachers. The potential for heterogeneity in the delivery of this
intervention made it doubtful that any effects might be found. And even if the benefits of the
course are limited to those students who were just below the cutoff used for assigning students to
the course, there is likely sufficient evidence to warrant its continuation. These findings are
encouraging, and suggest that adopting assignment rules when deciding who to assign to support
courses could be fruitful in other school districts (Schlotter, Schwerdt, &Woessmann, 2011).
26
Such rules allow for the estimation of causal estimates and can reduce the continuation of
ineffective program, and help districts develop or switch to interventions that have been proven
to be effective. These results may also encourage districts to modify either their assignment
rules, or their curriculum. Changing the threshold used to make assignment to supplementary
courses allows for the examination of the effectiveness of the program at different margins.
Analogously, modifying curricula while maintaining the existing cutoffs can provide evidence
for whether program effects can be enhanced to induce larger effects.
Choosing cutoff scores to assign students to academic interventions is not without risk,
however, and the determination of whether and where to apply these rules warrants careful
consideration. Though there are clear merits to the ability to assess the effectiveness of
interventions that are deployed in a way that allows quasi-experimental evaluation, the potential
for rationing of inputs could have deleterious effects. Cutoff scores must be chosen, and
interventions designed, in such a way as to be consistent with the needs of the population it is
intended to impact. In HCPS, all students scoring below the 60th
percentile were eligible for
supplementary reading however, this evaluation only addresses the impact of those who were
eligible but near the cutoff. Other means of evaluation, and perhaps interventions tailored to
learners who scored in lower percentiles, is necessary if we are to achieve equitable outcomes in
education. It bears further note that simply because a program is successful on one margin, it
need not necessarily maintain its impact when extended to students on other margins and of
different abilities.
School and district officials may find it valuable to use my results to impact their own
decisions about policy and practice. As schools and districts make decisions about how to
allocate funding for literacy programs, they may find it advantageous to develop and deploy a

27
second dose of literacy instruction that resembles the structure used in HCPS. This double dose
approach is appealing for several reasons. First, there is a well-defined literature about what
practices are effective in literacy instruction, and the HCPS example provides a concrete
example of how this may be done. Second, deploying the intervention using district employees
allows for flexibility in scheduling teachers and classes within and across schools and school
years. Third, teachers that are credentialed to teach a literacy class are likely equally well-
qualified to teach more traditional language arts and English curricula which provides additional
flexibility. Fourth, a double dose approach is likely to have has strong face validity among
stakeholders in the community. Most groups will find it hard to argue with the idea of using
research-proven instruction to supplement traditional curricula, as a way to bolster literacy skills.
And finally and most importantly, I have illustrated that this approach can be effective. While
other literacy interventions have produced mixed results, there is now credible evidence that this
approach to intervening in contexts like HCPS can produce the desired results.
Further research into “double dose” literacy interventions like the one in HCPS is
certainly warranted. Since our ultimate concern is with long-term outcomes that we believe are
associated with measures of adolescent literacy, future research should collect data across more
years so that we may learn whether there are longer-term impacts on SAT scores, high school
graduation, or decisions to apply to or attend college. Establishing the effectiveness of similar
supplementary literacy coursework should be pursued in other research contexts as well. While
the HCPS context is representative of many large changing suburban districts, there may be
factors associated with HCPS that could limit the generalizability of my findings.

28
References
Abdulkadiroglu, A., Angrist, J., Dynarski,S., Kane, T., & Pathak, P. (2009). Accountability and
Flexibility in Public Schools: Evidence from Boston’s Charters and Pilots. NBER Working
Paper 15549, http://www.nber.org.ezp-prod1.hul.harvard.edu/papers/w15549
Cavanagh, S. (2006). Students Double-Dosing on Reading and Math. Education Week, 25(40), 1.
Chall, J. S., & Jacobs, V. A. (2003). Poor Children's Fourth-Grade Slump. American Educator,
27(1), 14-15,44. Retrieved from EBSCOhost.
Chamberlain, A., Daniels, C., Madden, N. A., & Slavin, R. E. (2007). A Randomized Evaluation
of the Success for All Middle School Reading Program. Middle Grades Research Journal,
2(1), 1-21. Retrieved from EBSCOhost.
Christie, K. (2007). Mission possible: States take on adolescent literacy. Phi Delta Kappan,
88(6), 421-422.
Darling-Hammond, L. (2004). Standards, accountability, and school reform. Teachers College
Record, 106, 1047–1085.
Dee, T. (2004). Are there civic returns to education? Journal of Public Economics, 88(9-10),
1697-1720.
Dole, J. A., Duffy, G. G., & Roehler, L. (1991). Moving from the old to the new: research on
reading comprehension instruction. Review of Educational Research, 61239-264. Retrieved
from EBSCOhost
Durham Public Schools (n.d). Key education improvement efforts underway: Double dose
literacy. Retrieved from http://www.dpsnc.net/about-dps/key-education-improvement-
efforts-under-way-in-dps/double-dose-literacy
Edmonds, M., Vaughn, S., Wexler, J., Reutebuch, C., Cable, Klinger Tackett, K., & Schnakenberg, J. (2009). A Synthesis of reading interventions and effects on reading comprehension outcomes for older struggling readers. Review of Educational Research,
79(1), 262-300.
Gamse, B.C., Bloom, H.S., Kemple, J.J., Jacob, R.T., (2008). Reading
First Impact Study: Interim Report (NCEE 2008-4016). Washington, DC: National Center
for Education Evaluation and Regional Assistance, Institute of Education Sciences, U.S.
Department of Education.
Graham, S., & Hebert, M. (2012). A Meta-Analysis of the Impact of Writing and Writing
Instruction on Reading. Harvard Educational Review, 81(4), 710-744.

29
Hamilton, L. S., and Koretz, D. (2002). About tests and their use in test-based accountability
systems. In L. S. Hamilton, B. M. Stecher, and S. P. Klein (Eds.), Making Sense of Test-
Based Accountability in Education. Santa Monica: RAND (MR-1554-EDU).
Hong, G., & Raudenbush, S. W. (2007). Evaluating kindergarten retention policy: A
case study of causal inference for multilevel observational data. Journal of the American
Statistical Association, 101(475), 901–910.
Imbens, G., & Lemieux, T. (2008). Regression discontinuity designs: A guide to practice.
Journal of Econometrics, 142(2), 615–635.
Imbens, G., & Rubin, D. (1997). Estimating Outcome Distributions for Compliers in
Instrumental Variables Models. Review of Economic Studies, 64, 555-574.
Jacob, B. & Lefgren, L. (2004). “Remedial Education and Student Achievement: A Regression-
Discontinuity Analysis." Review of Economics and Statistics, 86(1), 226-244.
Jennings, J., & Bearak, J. (2010). “State Test Predictability and Teaching to the Test: Evidence
from Three States,” Delivered at the Annual Conference of the American Sociological
Association.
Kemple, J., Herlihy, C., Smith, T. (2005). Making Progress Toward Graduation: Evidence from
the Talent Development High School Model. Manpower Demonstration Research Corp.,
N. Y.
Koretz, D. (2003). Using multiple measures to address perverse incentives and score inflation.
Educational Measurement: Issues and Practice 22(2), 18-26.
Koretz, D. (2005). Alignment, high stakes, and the inflation of test scores. In J. Herman and E.
Haertel (Eds.), Uses and misuses of data in accountability testing. Yearbook of the National
Society for the Study of Education, vol. 104, Part 2, 99-118. Malden, MA: Blackwell
Publishing.
Lee, D., & Lemieux, T. (2009). Regression Discontinuity Designs in Economics. NBER Working
Paper 14723, http://www.nber.org/papers/w14723
Lee, J. J., Grigg, W. W., Donahue, P. P., & National Center for Education Statistics (ED), W. C.
(2007).The Nation's Report Card[TM]: Reading 2007. National Assessment of
Educational Progress at Grades 4 and 8. NCES 2007-496. National Center for Education
Statistics, Retrieved from EBSCOhost.
Machin, S., & McNally, S. (2008). The literacy hour. Journal of Public Economics, 92(5/6),
1441-1462. doi:10.1016/j.jpubeco.2007.11.008
Mazzolini, B., & Morley, S. (2006). A Double-Dose of Reading Class at the Middle and High
School Levels. Illinois Reading Council Journal, 34(3), 9-25.

30
McCrary, J. (2008). Manipulation of the running variable in the regression discontinuity design:
A density test. Journal of Econometrics, 142(2), 698-714.
McLaughlin, M. W., Shepard, L. A., (1995). Improving Education through Standards-Based
Reform. A Report by the National Academy of Education Panel on Standards-Based
Education Reform.
Moje, E. B. (2008). Foregrounding the disciplines in secondary literacy teaching and learning: A
call for change. Journal of Adolescent & Adult Literacy, 52(2), 96-107.
Murnane, R. & Willett, J. (2011). Methods Matter. New York, NY: Oxford University Press
National Governor’s Association (2005). Reading to Achieve: A Governor’s Guide to Adolescent
Literacy. National Governor’s Association for Best Practices, Retrieved from www.nga.org
National Institute of Child Health and Human Development. (2000). Report of the National
Reading Panel. Teaching children to read: An evidence-based assessment of the scientific
research literature on reading and its implications for reading instruction (NIH Publication
No 00-4769 and 00-4754). Washington, DC: U.S. Government Printing Office.
Neal, D., Schanzenbach, D., & Urban, I. (2009). Left behind by Design: Proficiency Counts and
Test-Based Accountability. Working Paper. Urban Institute, Retrieved from ERIC
database.
Nomi, T., & Allensworth, E. (2009). "Double-Dose" Algebra as an Alternative Strategy to
Remediation: Effects on Students' Academic Outcomes. Journal of Research on
Educational Effectiveness, 2(2), 111-148. Retrieved from EBSCOhost.
No Child Left Behind Act of 2001.
Paglin, C. (2003). Double Dose: Bethel School District's Intensive Reading Program Adds
Beefed-Up Instruction for At-Risk Readers from Day One. Northwest Education, 8(3), 30-
35.
Porche, M. V., Ross, S. J., & Snow, C. E. (2004). From preschool to middle school: The role of
masculinity in low-income urban adolescent boys' literacy skills and academic achievement.
In N. Way, J. Y. Chu, N. Way & J. Y. Chu (Eds.), Adolescent boys: Exploring diverse
cultures of boyhood. (pp. 338-360). New York, NY US: New York University Press.
Rouse, C. E., & Krueger, A. B. (2004). Putting computerized instruction to the test: A
randomized evaluation of a “scientifically based” reading program. Economics of Education
Review, 23(4), 323–338.
Schochet, P., Cook, T., Deke, J., Imbens, G., Lockwood, J.R., Porter, J., Smith, J. (2010).
Standards for Regression Discontinuity Designs. Retrieved from What Works Clearinghouse
31
website: http://ies.ed.gov/ncee/wwc/pdf/wwc_rd.pdf.
Schlotter, M., Schwerdt, G., & Woessmann, L. (2011). Econometric methods for causal
evaluation of education policies and practices: a non-technical guide. Education Economics,
19(2), 109-137. doi:10.1080/09645292.2010.511821
Sims, D. (2008). Strategic Responses to School Accountability Measures: It's All in the
Timing. Economics of Education Review,27(1), 58-68. Retrieved from ERIC database.
Snow, C. E., Porche, M. V., Tabors, P. O., & Harris, S. R. (2007). Is literacy enough? pathways
to academic success for adolescents. Baltimore, MD US: Paul H Brookes Publishing.
Tatum, A. W. (2008). Toward a More Anatomically Complete Model of Literacy Instruction: A
Focus on African American Male Adolescents and Texts. Harvard Educational Review,
78(1), 155-180. Retrieved from EBSCOhost
Vaughn, S., Klingner, J., Swanson, E., Boardman, A., Roberts, G., Mohammed, S., Stillman-
Spisak, S. (2011). Efficacy of collaborative strategic reading with middle school students.
American Education Research Journal, 48(4), 938-964.
Vignoles, A., De Coulon, A., & Marcenaro-Gutierrez, O. (2011). The value of basic skills in the
british labour market. Oxford Economic Papers, 63(1), 27-48.
Wanzek, J., & Vaughn, S. (2008). Response to Varying Amounts of Time in Reading
Intervention for Students With Low Response to Intervention. Journal Of Learning
Disabilities, 41(2), 126-142.
What Works Clearninghouse, (n.d.)
http://ies.ed.gov/ncee/wwc/FindWhatWorks.aspx?o=6&n=Reading%2fWriting&r=1

32
Tables & Figures: Table 1. Testing the assumption of equality in expectation: Estimates of differences in background variables at the point of the discontinuity
Dep. Variable: Prior Reading Prior Math Black Asian Latino Female ELL FRPL SWD
(1) (2) (3) (4) (5) (7) (8) (9) (10)
ELIG
0.01 0.00113 0.0102 0.00599 0.00941 0.00166 0.00148 0.0104 0.00419
(0.032) (0.0424) (0.0338) (0.0111) (0.0108) (0.0229) (0.0111) (0.0233) (0.0213)
ITBS
0.0278*** 0.0251*** -0.00639* 0.00185 -0.00318~ -0.00157 -0.00147 -0.0114*** -0.00270~
(0.00174) (0.00321) (0.00263) (0.00141) (0.00163) (0.00272) (0.00130) (0.00243) (0.00140)
Intercept -0.0511** -0.0534 0.380*** 0.0704** 0.0920*** 0.523*** 0.0652* 0.433*** 0.159***
(0.0177) (0.0380) (0.0788) (0.0204) (0.0174) (0.0158) (0.0252) (0.0779) (0.0171)
N 5480 5484 6412 6412 6412 6412 6412 6412 6412
Note: Standard errors in parentheses, ~ p<0.10 * p<0.05 ** p<0.01 *** p<0.001. All models fit using a bandwidth of 10 percentile points. Models are specified to allow the slope to vary on both sides of the discontinuity.

33
Table 2. Reduced-form estimates for effect of supplementary reading on 6th-grade reading and 8th-grade ITBS percentile
Outcome: 6th Grade Reading 8th-Grade ITBS %-tile (1) (2)
Additional Semester of Reading 0.0343 0.453 (0.0384) (1.152)
ITBS 0.0084 0.559~ (0.0096) (0.286)
Year Fixed Effects Y Y
School Fixed Effects Y Y Non-linear Forcing Variable Y Y
N 27256 15228 R-sq 0.648 0.789
Note: Standard errors in parentheses, ~ p<0.10 * p<0.05 ** p<0.01 *** p<0.001. All models fit using a bandwidth choice of 10 percentile points on either side of the cut score in 5th-grade ITBS percentile. Models are specified to allow the slope to vary on both sides of the discontinuity.

34
Table 3. Fitted estimates of the effects of supplementary reading on subsequent test scores
Panel A: Second Stage: Marginal Effect of Additional Semester of SUPREAD
Dependent Variable: 6th-Reading 7th-Reading 8th-Reading ITBS - 8th (1) (2) (3) (4)
Additional Semester of Reading 0.265* 0.103* 0.0263 2.422*
(0.133) (0.0494) (0.0442) (1.055)
Year Fixed Effects Y Y Y Y
School Fixed Effects Y Y Y Y
Non-linear Forcing Variable N N N N
Panel B: First stage(Dependent Variable: Supplementary Reading Exposure)
F-Statistic 52.75 55.74 42.73 42.73 N 5380 4100 3074 3074
Note: Standard errors in parentheses, ~ p<0.10 * p<0.05 ** p<0.01 *** p<0.001. All models fit using a bandwidth choice of 10 percentile points on either side of the cut score in 5th-grade ITBS percentile. Models are specified to allow the slope to vary on both sides of the discontinuity. The coefficients reported across columns are not directly comparable because the treatment is measured as total semesters of exposure to the reading intervention. Therefore, the marginal effect of an additional semester is likely to decrease In later years as students have more semesters to participate.
35
Table 4. Fitted estimates of the effects of receiving reading intervention in 6th grade across multiple choices of bandwidth
Panel A: Multiple Bandwidths for 6th-Grade Reading
Bandwidth: 5 Percentile Points 10 Percentile Points 15 Percentile Points 20 Percentile Points
(1) (2) (3) (4) (5) (6) (7) (8)
Addit. Semester of Reading 0.316 0.331 0.269~ 0.388* 0.235** 0.381** 0.263** 0.395**
(0.198) (0.234) (0.148) (0.190) (0.0853) (0.136) (0.0834) (0.132)
Year Fixed Effects Y Y Y Y Y Y Y Y School Fixed Effects Y Y Y Y Y Y Y Y Non-linear Forcing Var. (cubic) N Y N Y N Y N Y
N 2804 2804 5380 5380 7262 7262 10288 10288
Panel B: Multiple Bandwidths for 8th-Grade ITBS Percentile
Bandwidth: 5 Percentile Points 10 Percentile Points 15 Percentile Points 20 Percentile Points (1) (2) (3) (4) (5) (6) (7) (8)
Addit. Semester of Reading 1.733 2.410 2.422* 2.150~ 1.073 1.998~ 1.184* 2.811**
(1.847) (1.951) (1.055) (1.218) (0.814) (1.142) (0.537) (0.986)
Year Fixed Effects Y Y Y Y Y Y Y Y School Fixed Effects Y Y Y Y Y Y Y Y Non-linear Forcing Var. (cubic) N Y N Y N Y N Y
N 1578 1578 3041 3041 4143 4143 5816 5816
Note: Standard errors in parentheses, ~ p<0.10 * p<0.05 ** p<0.01 *** p<0.001.

36
Table 5. Testing the sensitivity of the effects of supplementary reading to non-linear specifications of the forcing variable
Panel A: Dependent Variable, 6th-Grade Reading
Order of Polynomial: Linear Quadratic Cubic Quartic
(1) (2) (3) (4)
Additional Semester of Reading 0.265~ 0.416~ 0.395* 0.487~
(0.146) (0.251) (0.192) (0.280)
N 5380 5380 5380 5380
Panel B: Dependent Variable, 8th-Grade ITBS Percentile
Additional Semester of Reading 2.422* 2.286~ 2.150~ 4.074*
(1.055) (1.371) (1.218) (1.608)
N 3041 3041 3041 3041
Note: Standard errors in parentheses, ~ p<0.10 * p<0.05 ** p<0.01 *** p<0.001. All models fit using a bandwidth choice of 10 percentile points on either side of the cut score in 5th-grade ITBS percentile. Models are specified to allow the slope to vary on both sides of the discontinuity. All models include fixed effects for schools and cohorts.

37
Table 6. Attrition from analytic sample from point of identification for treatment eligibility in 5th grade through the grade of analysis
6th-Grade Sample
7th-Grade Sample
8th-Grade Sample
(1) (2) (3)
Initial Treatment 4,193 3,588 2,910
Iniital Control 2,164 1,446 944
Treatment Units Lost 170 362 394
Control Units Lost 162 317 357
% of Attriters - Treatment 51.2% 53.3% 52.5%
% of Attriters - Control 48.8% 46.7% 47.5%
Table 7. Distributions of Semesters of Exposure to Supplementary Reading for students above and below the ITBS cutoff in each grade sample
Panel A: Enrollment
6th Grade 7th Grade 8th Grade
Below Above Below Above Below Above
Sem. in Supp. Reading (1) (2) (3) (4) (5) (6)
0 22.4% 44.7% 17.9% 38.7% 15.4% 31.5%
1 3.0% 2.7% 2.3% 2.2% 1.5% 1.9%
2 74.5% 52.6% 28.4% 36.1% 23.0% 34.2%
3 - - 5.2% 3.9% 3.2% 2.5%
4 - - 46.1% 19.1% 8.6% 8.5%
5 - - - - 3.7% 3.4%
6 - - - - 44.6% 18.0%
Sample Size 3036 3321 2363 2642 1841 2093
Panel B: Average 6th-Grade Reading Score by Semesters of Participation
6th Grade 7th Grade 8th Grade
Sem. in Supp. Reading (1) (2) (3) 0 -0.01 0.03 0.09 2 -0.11 0.13 0.23 4 - -0.23 -0.16 6 - - -0.17
38
Figure 1: Kernel density plot of the recentered ITBS score in 5th
grade.
0
.00
5.0
1.0
15
.02
Den
sity
-60 -50 -40 -30 -20 -10 0 10 20 30 40Recentered ITBS
kernel = epanechnikov, bandwidth = 3.2445
39
Figure 2: Evidence of discontinuity in treatment exposure in 6th
, 7th
, and 8th
-grade samples

40
Figure 3: Fitted outcomes in 6th
-grade reading and 8th
-grade ITBS percentile overlaid on
evidence of discontinuity in exposure to treatment.
Panel A: 6th
-grade Reading
Panel B: 8th
-grade ITBS Percentile
.81
1.2
1.4
1.6
Se
meste
rs o
f S
upp
. R
ead
ing
-.2
-.1
0.1
.2
6th
Gr
Rea
din
g S
co
re
-10 -5 0 5 105th Grade ITBS Score
1.5
22
.53
3.5
Se
meste
rs o
f S
upp
. R
ead
ing
45
50
55
60
65
8th
Gr
ITB
S P
erc
entile
-10 -5 0 5 105th Grade ITBS Score