Embed Size (px)
Citation preview
UNITED STATES DEPARTMENT OF COMMERCE National Oceanic and Atmospheric Administration National Marine Fisheries Service Southwest Fisheries Science Center 8604 La Jolla Shores Drive La Jolla, CA 92037 31 March 2008
DRAFT CRUISE REPORT
NOAA Ship: NOAA Ship McArthur II Cruise Number: M2-07-08, SWFSC Cruise Number 1634 Cruise Dates: 20 August through 28 November 2007 Cruise Title: Stenella Abundance Research Line Transect and Ecosystem (STAR-LITE) Cruise 2007 – a cetacean and ecosystem assessment survey with one vessel Study Area: A section of the high seas within the eastern tropical Pacific Ocean (ETP) Itinerary: Ship loading and gear preparation: 18-19 AUG 19 AUG: Acoustic calibration at 10th Avenue Terminal Leg 1: 20 AUG- Depart San Diego, CA 14 SEP-Arrive Manzanillo, Mexico Leg 2: 18 SEP- Depart Manzanillo, Mexico 06 OCT- Arrive Manzanillo, Mexico Leg 3: 12 OCT - Depart Manzanillo, Mexico 31 Oct - Arrive Manzanillo, Mexico Leg 4: 04 NOV- Depart Manzanillo, Mexico 29 Nov- Arrive San Diego, CA Tracklines and waypoints are detailed in Appendices 1 and 2 Sponsoring Institution: NOAA/NMFS, Southwest Fisheries Science Center (SWFSC) Protected Resources Division (PRD)
Prepared by: ______________________________ Date: _____________________ Annette E. Henry Survey Coordinator ______________________________ Date: _____________________ Dr. Eric I. Archer Chief Scientist, STAR 2003 Approved by: ______________________________ Date: _____________________ Dr. Lisa T. Ballance Director, Protected Resources Division ______________________________ Date: _____________________ Dr. Norman W. Bartoo. Acting Director, NOAA Fisheries - SWFSC
I. CRUISE DESCRIPTION 1.0 Cruise Description and Objectives - The primary objective of the Stenella Abundance Research Line Transect and Ecosystem cruise was to investigate spatial and temporal variability, and line-transect methodologies in the eastern tropical Pacific Ocean. The project used a multidisciplinary approach. Data on cetacean distribution, school size and school composition were collected to determine cetacean abundance. Oceanographic data were collected to characterize habitat and its variation over time. Data on distribution and abundance of seabirds, flyingfish, and marine turtles collected will further characterize the ecosystem. Skin biopsies of cetaceans provide a database for investigations of stock structure and phylogenetic relationships. Photographs document geographic variation in dolphins and distribution of individual large whales. This project was related to a series of research cruises that have been repeated periodically in the ETP since the 1970s. Recently, a five year series of cruises was conducted from 1986-1990 (Monitoring of Porpoise Stocks) and a three-year series was conducted from 1998 through 2000 (STAR: Stenella Abundance Research) with an additional single-year cruises completed in 2003 and 2006. For additional information about STAR-LITE, please see: http://swfsc.noaa.gov/ prd-star-lite.aspx; for additional information regarding STAR, please see: http://swfsc.noaa.gov/prd-star.aspx. 2.0 Chief Scientist - Eric Archer, SWFSC (858) 546-7121, [email protected]
2
3
II. OPERATIONS
1.0 CETACEAN RESEARCH Weather permitting, visual watches were conducted by observer teams on the flying bridge during all daylight hours (from sunrise to sunset). The Commanding Officer ensured that the flying bridge work area was smoke-free at all times when observers were on watch.
1.1 Cetacean Survey - A daily watch for cetaceans was maintained on the flying bridge during daylight hours (approximately 0600 to 1800) by six mammal observers. Each observer worked in 2-hour rotations, staffing each of the following 3 stations on the flying bridge for 40 minutes: a port side 25x150 binocular station, a center data recorder position, and a starboard 25x150 binocular station. Line-transect survey methods were used. At the beginning of each day, search effort started on the trackline. NOAA Ship McArthur II traveled at 10 knots (through the water) along the designated trackline. While on search effort if the ship's speed through the water deviated from this by more than two knots, the bridge personnel notified the mammal team on watch or the Cruise Leader. Bridge personnel notified the marine mammal team of any course changes.
1.1.1 Logging of Data - A log of observation conditions, watch effort, sightings, and
other required information was entered into a computer, hooked up to the ship's GPS (for course, speed and position information) and SCS (for weather and heading information). All science computers were connected to the same GPS as the ship and networked to the timeserver. An “independent observer” kept a separate watch of animals sighted during the cetacean survey operations during closing mode operations (see section 1.1.4) for later comparison with the observer team’s data.
1.1.2 Breaking Trackline - On sighting a cetacean school or other feature of interest, the
Cruise Leader or marine mammal observer team on watch requested that the vessel be maneuvered to approach the school or feature for investigation. As the ship approached a school, observers made independent estimates of school size. Biopsy and photographic operations may have commenced from the bow based on directions from the Cruise Leader or Senior Marine Mammal Observers. In some instances, the Cruise Leader requested the deployment of a small boat for biopsy, photographic, or other operations (see 3.0). It was occasionally necessary to divert the ship’s course from the established trackline during regular effort due to glare or adverse sea conditions. Under these circumstances, the ship was diverted up to 30 degrees from the established course. This deviation was continued until the ship was 10nm from the trackline, at which point the ship turned back toward the trackline.
1.1.3 Resuming Effort - When the observers completed operations for the sighting, the
ship resumed the same course and speed as prior to the sighting. If the pursuit of the sighting took the ship more than 10 nautical miles from the trackline, the observers were notified. The Cruise Leader or Senior Marine Mammal Observers occasionally requested that the ship take a heading back toward the trackline, rather than proceeding directly toward the next waypoint.
1.1.4 Passing/Closing Mode - On the first day at a new initial waypoint, the survey was
conducted in passing mode and began at sunset -9 hr from the initial waypoint with the ship traveling at 10kt down the trackline, surveying approximately 90nm. Just prior to sunset (approximately 20min before), the visual team went off-effort. The following day was conducted in closing mode, starting at the initial waypoint of the previous day. At sunset, the visual team went off-effort. This two-day procedure was repeated on the next trackline until all eight tracklines are surveyed in passing mode and then closing mode (Appendix 3). Under normal operations, transects were traversed in sequence, however the cruise
4
leader occasionally requested the ship to transit to non-sequential waypoints in light of adverse weather or other operational considerations. Rarely, this led to some oceanographic operations being suspended. While in passing mode, the observers did not request any change in course to approach marine mammal sightings; the ship simply continued down the trackline. Small boat operations were infrequently requested, and only on closing mode days (see 1.3).
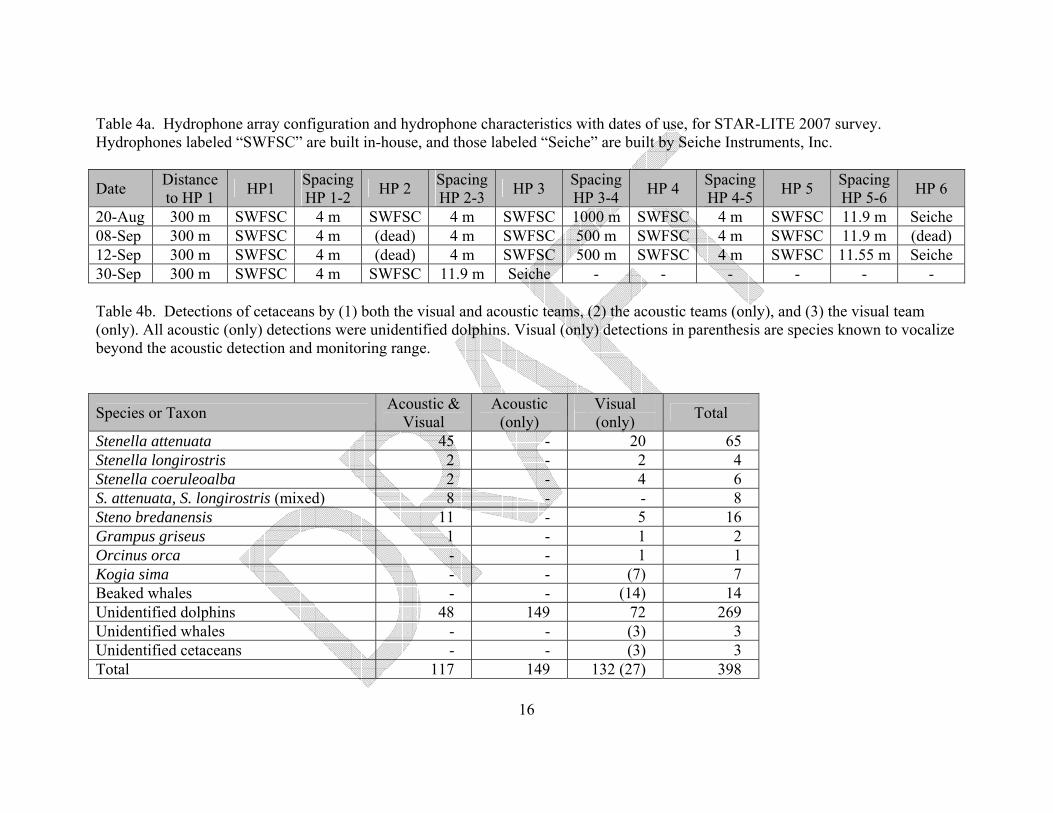
1.2 Biopsy Sampling - Biopsy samples for genetic analyses of cetaceans were collected on an opportunistic basis on closing mode days. Necessary permits were present on the vessel. The animals sampled were 1) approached by the research vessel during normal survey operations, 2) approached the vessel on their own, or 3) approached by a small boat. Samples were collected from animals within 10-30 m of the bow of the ship using a dart fired from a crossbow. 1.3 Photography - Photographs of cetaceans were taken on an opportunistic basis. These will be used to study social behavior and movement patterns of identified individuals, and to study geographic variation. Necessary permits were present on the vessel. The animals to be photographed 1) were approached by the research vessel during normal survey operations; 2) approached the vessel on their own; or 3) were approached by a small boat. 1.4 Acoustics - There were two main goals of the acoustics program during the STAR-LITE survey: (1) to compare acoustic and visual dolphin detections during passing mode; and (2) to test a new hydrophone design with two nodes that allow instantaneous localization of dolphin whistles. In order to address these goals, a hydrophone array was deployed on board NOAA Ship McArthur II for all legs during passing-mode days within the study area. A full-time acoustician was employed for legs 1 and 2 to collect data that are more comprehensive; with the help of other scientists, the array was deployed and recordings were made for the remainder of the survey. A towed hydrophone array was deployed 300 m behind the McArthur II during daylight hours on passing-mode survey days. The initial hydrophone array configuration consisted of two hydrophone nodes separated by 1000 m; each node consisted of three hydrophones with 4 m separation between all but the last hydrophone (11.9 m separation, Table 4a). Hydrophones 1-5 were built in-house and have internal pre-amplification and sensitivity from 1 kHz to 40 kHz (± 5 dB). Hydrophone 6 was built by Seiche Instruments, Inc. This hydrophone had a frequency sensitivity from 1 kHz to 150 kHz. Modifications were made to this array configuration due to technical problems; all array configurations are shown in Table 4a. The array was monitored for cetacean vocalizations aurally and visually, using a spectrographic display, and clear cetacean sounds were recorded on a Tascam DA-38 multi-channel recorder at 48 k samples/sec. Real-time spectrographic displays of sounds were monitored using ISHMAEL software, which allows for localization of vocalizing animals via phone-pair (cross-correlation) algorithms. Successive angles to sound sources obtained using these methods were plotted to a mapping program, Whaltrak. Locations and detection information were input into an Access database. High-frequency recordings were made to hard drive using a MOTU Traveler digital audio interface with Raven software on a desktop computer. Three or four channels were recorded to hard disk at 96 k-samples/sec in 5-minute bins. Recordings from the towed hydrophone array included vocalizations from spinner dolphin (Stenella longirostris), spotted dolphin (S. attenuata), striped dolphin (S. coeruleoalba), rough-toothed dolphin (Steno bredanensis), and Risso’s dolphins (Grampus griseus). All non-sighted acoustic detections were "unidentified dolphins" (Table 4b).
5
There were a total of 398 detections of cetaceans while both the acoustics and visual teams were on effort; 117 of these detections were made by both the visual and acoustic teams (Table 4b). There were a total of 149 detections made by the acoustic team (only), and 132 detections made by the visual team (only). Many of the visual (only) detections were of species known to vocalize outside the range of the acoustics equipment (Kogia sima, beaked whales, and unidentified whales and cetaceans). There were a total of 105 visual (only) detections that were sightings of species known to vocalize within the acoustic detection range. Several hydrophone failures appeared to be caused by the extreme cable tension for these long arrays. The array with 1000m between hydrophones 3 and 4 proved to be unworkable at tow speeds of 8-10 kts. The array with 500m between hydrophones 3 and 4 worked and collected valuable data for a relatively short period before it broke as well. Long arrays, such as these are practical only in when the ship is in passing mode and is not turning to chase dolphin groups, and the 1000m array would only be practical at tow speeds of approximately 5-6 kts 1.4.1 Towed Array - On passing mode days, the array was deployed each morning prior to the start of visual observations, and retrieved each evening after search effort ended. During Leg 1, a team of two acousticians monitored the array, recorded sounds made by cetaceans, and localized their positions; Leg 2 had just one acoustician; during Legs 3 and 4, observers (Yin and Webb) and visiting scientists assisted with deployment and set up computers for recordings. 1.4.2 Sonobuoys - Sonobuoys were infrequently deployed periodically from NOAA Ship McArthur II on an opportunistic basis, at the discretion of the Cruise Leader. 1.5 Salvage of Cetaceans – No cetacean body parts were salvaged. 2.0 ECOSYSTEM STUDIES 2.1 Oceanography - Oceanographic sampling was conducted by two Oceanographers and ship’s Survey Technician, and other scientists as designated by the Cruise Leader. A chronological record of oceanographic and net tow stations was kept by the ship (Marine Operations Log) with dates and times in GMT. The ship provided an electronic copy of this log (with the cruise Weather Log and SCS data) to the Chief Scientist upon completion of the cruise. 2.1.1 Thermosalinograph Sampling - Ship personnel provided and maintained a calibrated thermosalinograph (TSG) for continuous measurement of surface water temperature and salinity. The SCS served as the main data collecting system for the TSG. The Oceanographer provided the ship’s Operations Officer and Electronics Technician with detailed SCS acquisition information. The SCS data acquisition was stopped and restarted weekly by the Electronics Technician so data files could be backed up and checked for errors. All SCS and raw data were provided to the SWFSC Oceanographer following each leg of the cruise. 2.1.2 XBT Drops - There were four XBT drops per day at specific locations along the trackline; each drop was determined by ship position. The Cruise Leader or a member of the oceanographic team notified the bridge prior to launching. An additional XBT drop was conducted at the
6
evening CTD station following closing mode operations twice each leg. This additional XBT drop will allow us to assess the accuracy of our XBT data. 2.1.3 Surface Water Samples - A surface water sample for chlorophyll a analysis and a bucket temperature was collected immediately following each the XBT drop (four drops per day). These samples were taken by a member of the scientific party.
2.1.4 Argo Buoy Deployments – Four Argo buoys were deployed by the oceanographers
with assistance from scientific personnel. The buoys will help fill in the coverage gap in the eastern tropical Pacific Ocean. Argo is a major contributor to the WCRPs Climate Variability and Predictability Experiment (CLIVAR) and to the Global Ocean Data Assimilation Experiment (GODAE). The Argo array is part of the Global Climate Observing System/Global Ocean Observing System GCOS/GOOS.
The Cruise Leader notified and consulted with the Command regarding the times and locations of the buoy deployments. The buoys were deployed off the stern by a member of the scientific party after notifying the Deck Officer.
2.1.5 CTD - The main SeaBird CTD system was provided by the ship and maintained by the Survey Technician. The collection of CTD data, samples, and their processing were conducted by the scientific party and Survey Technician. Morning and evening CTDs were conducted by the Survey Technician. The crew of the vessel operated all deck equipment and were responsible for the termination (and any necessary reterminations) of the CTD cable pigtail to the conducting cable of the winch. To ensure longevity of the CTD and Bottles, the CTD was rinsed completely with fresh water after every cast, and the CTD and rosette were then covered and secured. 2.1.5.1 Deck Pressure Tests for Each Leg – A deck pressure test was conducted at the beginning of each leg. The test was performed by the Oceanographers and the ship’s Survey Technician before leaving the dock; the CTD was in its normal at-sea position on the ship. 2.1.5.2 Initial CTD Cast for Each Leg - An additional CTD cast was performed on the first morning of oceanographic operations for each leg of the cruise. This cast was used to test the agreement among salinity samples collected from all CTD bottles. For this cast, a maximum depth of 700m was needed; all bottles were fired at this depth. The rate of CTD ascent and descent for this cast was 60m per minute. The oceanographer took salinity samples from all bottles before the regular CTD cast was conducted. 2.1.5.3 CTD Stations - Weather permitting, two CTD stations were occupied each night: an evening cast and an early dawn cast (see Appendix 3). CTD data and seawater samples were collected using a SeaBird 9/11+CTD with rosette and Niskin bottles fitted with silicone tubing and o-rings (supplied by the scientific party). All casts were to 1000m, with the descent rate at 30m/min for the first 100m of the cast, then 60m/min after that, including the upcast between bottles. Bottle samples were collected from 12 standard depths on all stations (0, 20, 40, 60, 80, 100, 120, 140, 170, 200, 500, 1000 m). Samples for chlorophyll were collected from all depths ≤ 250m and processed on board. The 265ml chlorophyll samples were filtered onto GF/F filters, placed in 10ml of 90% acetone, refrigerated for 24 hours, and then analyzed on a Turner Designs model 10AU field fluorometer. Both the Survey Technician and Oceanographers participated in sample collection. Analysis of chlorophyll samples were done by the oceanographers. Salinity samples (from all 12 Niskin bottles) will be taken from casts selected by the oceanographer. Analyses were done by the oceanographers. Cast times were subject to change since sunrise and sunset varied during the cruise.
7
2.1.5.4 Morning cast - The morning cast began approximately at sunrise. The exact starting time was determined the evening before, by the Operations Officer or Deck Officer. Samples for chlorophyll were collected as detailed above. 2.1.5.5 Evening Cast - An evening CTD cast was conducted no sooner than one hour after sunset. The exact time was determined by the Deck Officer (by 1800 local ship time that day). Samples for chlorophyll and salinity were collected as detailed above. 2.1.5.6 “CTD Yo-Yo Casts” - On four closing mode nights, one night per leg, CTD yo-yo casts were done. The casts consisted of approximately 10 consecutive CTD casts over a period of 2.5 hr. The casts occurred to a depth of 200m at a rate of 30m/min. No bottle samples were taken; each cast took approximately 15 min. 2.1.5.7 CTD Cast to Measure XBT Variability - Four additional CTD casts were conducted one night per leg. These casts were evenly spaced between the regular evening and morning CTD. The casts occurred to a depth of 200m at a rate of 30m/min and took approximately 15 min to complete.
2.2 Prey Fishes and Squids
2.2.1 Acoustic Backscatter - The scientific EK-60 depth sounder operated at 38, 120, and 200 KHz and interfaced to a data acquisition system to estimate micronekton biomass between 0 and 500m. The vessel's Abyss IES-10 Echo sounder normally remained off while underway in deep waters. None of the ship's navigational depth sounders (ES60 or ABYSS) interfered with the EK-60 scientific sounder. Use of the scientific EK-60 was continuous or at the discretion of the Cruise Leader.
2.2.2 Dipnetting - Dipnetting for surface fauna was conducted by scientific personnel concurrent with the evening CTD station. This station began no sooner than one full hour after sunset and required one full hour of time to complete. One or more deck lights were necessary to illuminate the water surface in the area of dipnet sampling. Samples were preserved, labeled, and stored in the scientific freezer.
2.2.3 Bongo Tow - An oblique Bongo tow (45 minute station time) was conducted for
fifteen minutes immediately following the evening CTD station and dipnetting, to a depth of 200m (wire out 300m on starboard hydro winch). The Bongo has 505-micron mesh on the starboard side, and 333-micron mesh on the port side. The samples were preserved in formalin or frozen, labeled, and stored in containers provided by the SWFSC for post-cruise analysis by FRD in San Diego.
2.2.4 Manta Tow - A surface manta net tow was conducted for fifteen minutes immediately following the evening bongo tow. The manta tow was conducted in the dark; hence, the deck lights were off for the duration of the tow. The net was deployed from the starboard hydro winch. Samples were preserved in formalin, labeled, and stored in containers provided by the SWFSC. Station time for the manta tow was 30 minutes. 2.3 Seabird Research - Weather permitting, visual surveys for seabirds were conducted by seabird observers from the flying bridge during all daylight hours (sunrise to sunset). The Commanding Officer ensured that the flying bridge work area was smoke-free at all times when observers were on watch.
8
2.3.1 Seabird Survey - Visual surveys of seabirds were conducted from the flying bridge during daylight hours by two seabird observers. A log of visibility conditions, effort, sightings, and other required information was entered into a computer interfaced with the ship’s GPS (for course, speed, and position information) and SCS (for weather and heading information). All science computers were connected to the same ship’s GPS. Seabird observers used both handheld and 25x150 binoculars. 2.4 Marine Turtle Research - A visual survey for marine turtles was conducted by the mammal and seabird observers on the flying bridge during all daylight hours. Data were recorded in both mammal and seabird databases. 3.0 SMALL BOAT WORK A small boat was necessary for biopsy sampling, photography, and other ancillary work. Deployment was requested by the Cruise Leader on an opportunistic basis, provided that the Commanding Officer concurred that operating conditions were safe. 4.0 TRANSIT AT NIGHT After a day in passing mode (see 1.1.4), the ship returned at night along the line just surveyed, conducting net tow and evening and morning CTD operations along the way. At sunrise, the ship reversed direction and re-surveyed the same transect in closing mode. The starting point for the effort in closing mode generally began at the same location as the previous day After a day in closing mode, the ship usually moved only a short distance to the next waypoint. On occasion, the Cruise Leader decided to move at night farther along the trackline or to another section of trackline that may have been missed due to weather. The Cruise Leader consulted with the Operations Officer each evening to determine night transit. The Cruise Leader determined the nightly transit length on a daily basis.
9
III. SCIENTIFIC PERSONNEL
1.0 Chief Scientist - Dr. Eric Archer was Chief Scientist for STAR-LITE 2008 as well as Cruise Leader on Leg 4. 1.1 Participating Scientists - Participating scientists are list in the tables below by leg. McArthur II Leg 1: San Diego, CA – Manzanillo, Mexico
Position Name Affiliation Nationality Cruise Leader Tim Gerrodette SWFSC USA
Senior Mammal Observer Jim Cotton SWFSC USA Senior Mammal Observer Richard Rowlett SWFSC USA Biopsy/Mammal Observer Juan Carlos Salinas AFL Mexico
Mammal Observer Suzanne Yin SWFSC USA Mammal Observer Adam Ü SWFSC USA Mammal Observer Ernesto Vazquez AFL Mexico
Senior Seabird Observer Michael Force AFL Canada Seabird Observer Sophie Webb SWFSC USA Oceanographer Candice Hall AFL South Africa/Britain
Oceanographic Tech Ryan Driscoll AFL USA Acoustician Shannon Rankin SWFSC USA
Acoustic Tech Elizabeth Zele AFL USA Visiting Scientist Jay Barlow SWFSC USA Visiting Scientist Eric Lewallen University of Toronto USA
McArthur II Leg 2: Manzanillo, Mexico – Manzanillo, Mexico
Position Name Affiliation Nationality Cruise Leader Susan Chivers SWFSC USA
Senior Mammal Observer Jim Cotton SWFSC USA Senior Mammal Observer Richard Rowlett SWFSC USA Biopsy/Mammal Observer Juan Carlos Salinas AFL Mexico
Mammal Observer Suzanne Yin SWFSC USA Mammal Observer Adam Ü SWFSC USA Mammal Observer Ernesto Vazquez AFL Mexico
Senior Seabird Observer Michael Force AFL Canada Seabird Observer Sophie Webb SWFSC USA Oceanographer Candice Hall AFL South Africa/Britain
Oceanographic Tech Ryan Driscoll AFL USA Acoustician Shannon Rankin SWFSC USA
Visiting Scientist Victoria Pease AFL USA Visiting Scientist Fionna Matheson NOAA Corps/SWFSC USA
10
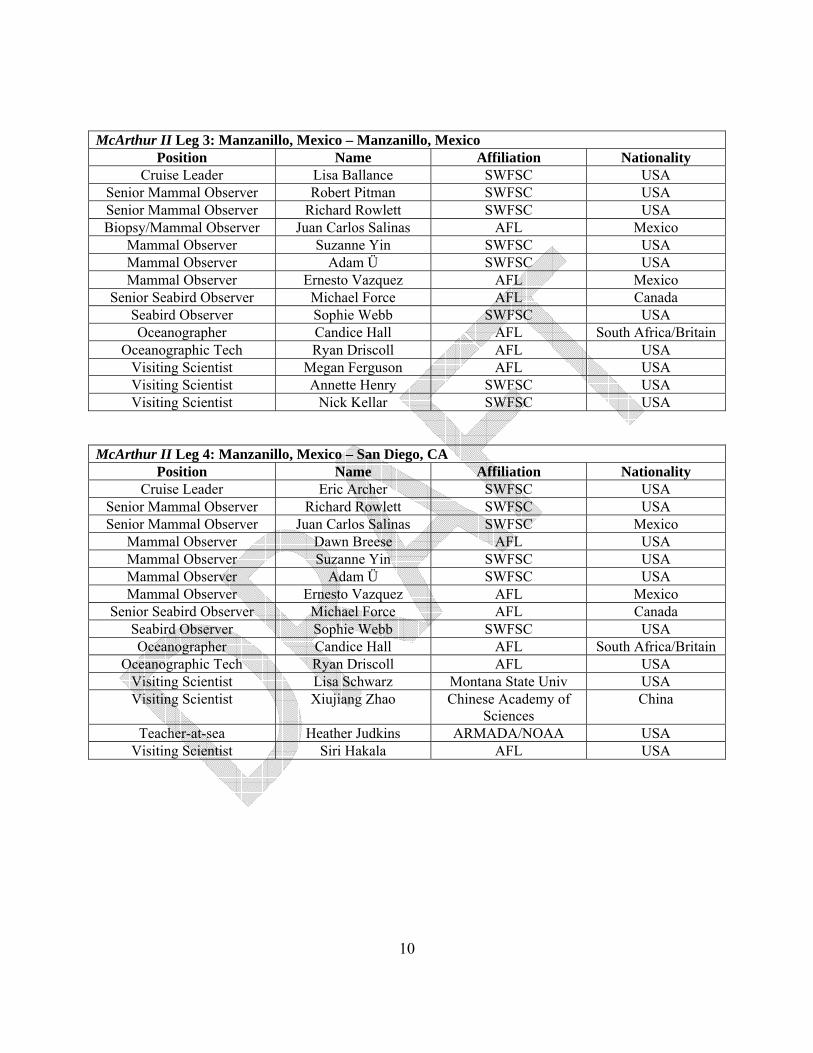
McArthur II Leg 3: Manzanillo, Mexico – Manzanillo, Mexico
Position Name Affiliation Nationality Cruise Leader Lisa Ballance SWFSC USA
Senior Mammal Observer Robert Pitman SWFSC USA Senior Mammal Observer Richard Rowlett SWFSC USA Biopsy/Mammal Observer Juan Carlos Salinas AFL Mexico
Mammal Observer Suzanne Yin SWFSC USA Mammal Observer Adam Ü SWFSC USA Mammal Observer Ernesto Vazquez AFL Mexico
Senior Seabird Observer Michael Force AFL Canada Seabird Observer Sophie Webb SWFSC USA Oceanographer Candice Hall AFL South Africa/Britain
Oceanographic Tech Ryan Driscoll AFL USA Visiting Scientist Megan Ferguson AFL USA Visiting Scientist Annette Henry SWFSC USA Visiting Scientist Nick Kellar SWFSC USA
McArthur II Leg 4: Manzanillo, Mexico – San Diego, CA
Position Name Affiliation Nationality Cruise Leader Eric Archer SWFSC USA
Senior Mammal Observer Richard Rowlett SWFSC USA Senior Mammal Observer Juan Carlos Salinas SWFSC Mexico
Mammal Observer Dawn Breese AFL USA Mammal Observer Suzanne Yin SWFSC USA Mammal Observer Adam Ü SWFSC USA Mammal Observer Ernesto Vazquez AFL Mexico
Senior Seabird Observer Michael Force AFL Canada Seabird Observer Sophie Webb SWFSC USA Oceanographer Candice Hall AFL South Africa/Britain
Oceanographic Tech Ryan Driscoll AFL USA Visiting Scientist Lisa Schwarz Montana State Univ USA Visiting Scientist Xiujiang Zhao Chinese Academy of
Sciences China
Teacher-at-sea Heather Judkins ARMADA/NOAA USA Visiting Scientist Siri Hakala AFL USA
11
IV. DISPOSITION OF DATA All data are currently being analyzed. The final data reports will be completed by February 2009. Marine
mammal data were delivered to Dr. Tim Gerrodette, NOAA Fisheries / SWFSC, for analysis and
distribution. Passive acoustic data were delivered to Dr. Jay Barlow, NOAA Fisheries / SWFSC, for
analysis and distribution. Acoustic backscatter data were delivered to Dr. David Demer, NOAA Fisheries
/ SWFSC, for analysis and distribution. Oceanographic data were delivered to Dr. Paul Fiedler, NOAA
Fisheries / SWFSC, for analysis and distribution. Biopsy samples were delivered to Dr. Barbara Taylor,
NOAA Fisheries / SWFSC, for analysis and distribution. Ecosystem data (net samples) were delivered to
Dr. George Watters, NOAA Fisheries / SWFSC, for analysis and distribution. Ecosystem data (seabird)
were delivered to Dr. Lisa Ballance, NOAA Fisheries / SWFSC, for analysis and distribution.
12
V. RESULTS The area surveyed is shown in Figure 1; the data collected are summarized in the following tables: Table 1. Cetacean sightings and behavioural data Table 2. Cetacean biopsy samples Table 3. Number of cetacean schools or individuals photographed Table 4. Acoustic recordings Table 5. Environmental data Table 6. Seabird sightings
13
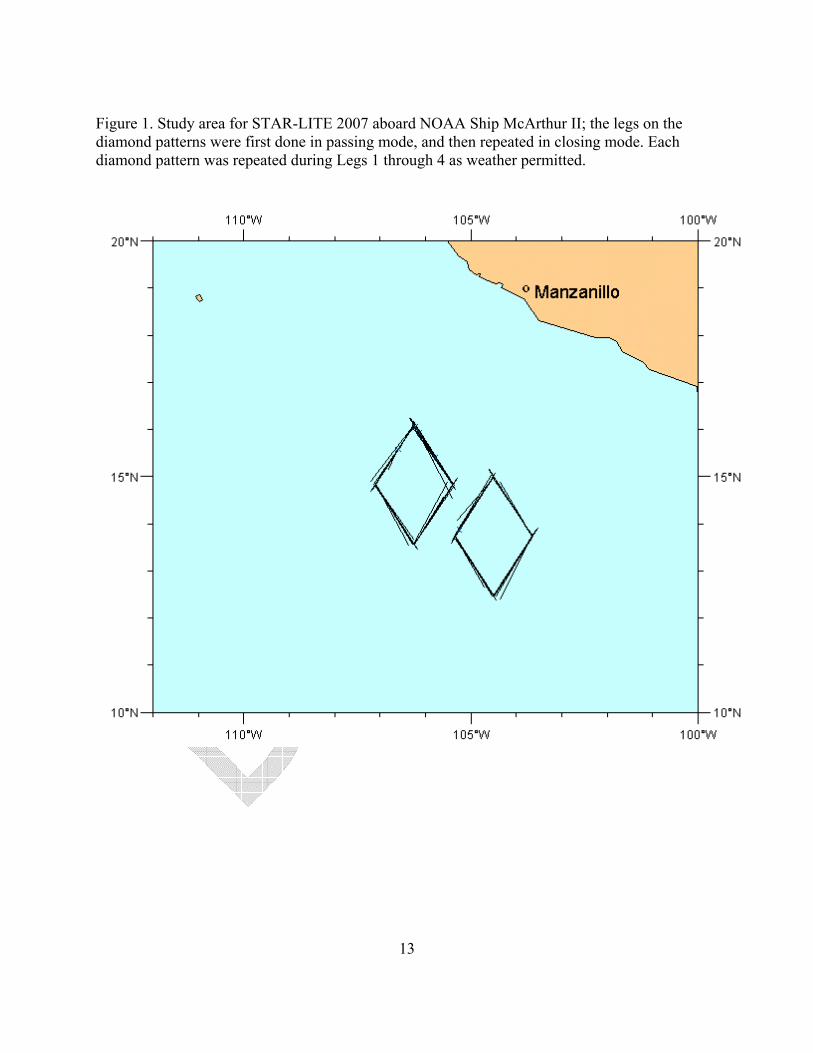
Figure 1. Study area for STAR-LITE 2007 aboard NOAA Ship McArthur II; the legs on the diamond patterns were first done in passing mode, and then repeated in closing mode. Each diamond pattern was repeated during Legs 1 through 4 as weather permitted.
14
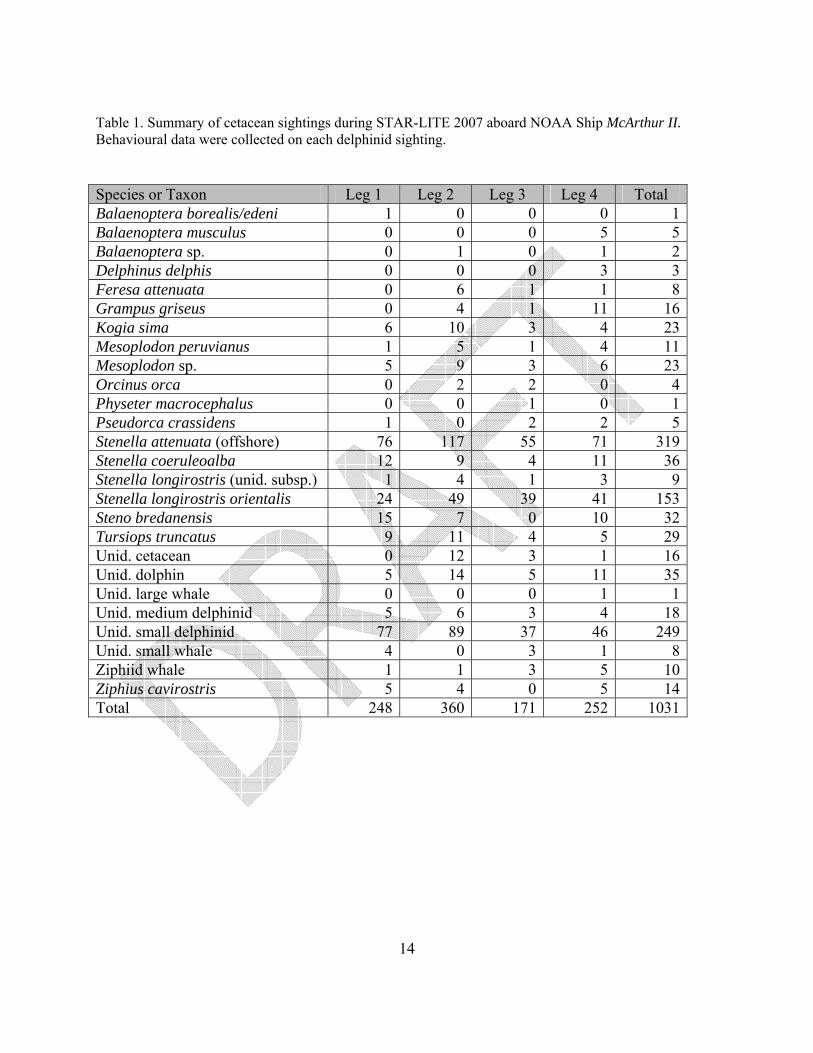
Table 1. Summary of cetacean sightings during STAR-LITE 2007 aboard NOAA Ship McArthur II. Behavioural data were collected on each delphinid sighting. Species or Taxon Leg 1 Leg 2 Leg 3 Leg 4 Total Balaenoptera borealis/edeni 1 0 0 0 1Balaenoptera musculus 0 0 0 5 5Balaenoptera sp. 0 1 0 1 2Delphinus delphis 0 0 0 3 3Feresa attenuata 0 6 1 1 8Grampus griseus 0 4 1 11 16Kogia sima 6 10 3 4 23Mesoplodon peruvianus 1 5 1 4 11Mesoplodon sp. 5 9 3 6 23Orcinus orca 0 2 2 0 4Physeter macrocephalus 0 0 1 0 1Pseudorca crassidens 1 0 2 2 5Stenella attenuata (offshore) 76 117 55 71 319Stenella coeruleoalba 12 9 4 11 36Stenella longirostris (unid. subsp.) 1 4 1 3 9Stenella longirostris orientalis 24 49 39 41 153Steno bredanensis 15 7 0 10 32Tursiops truncatus 9 11 4 5 29Unid. cetacean 0 12 3 1 16Unid. dolphin 5 14 5 11 35Unid. large whale 0 0 0 1 1Unid. medium delphinid 5 6 3 4 18Unid. small delphinid 77 89 37 46 249Unid. small whale 4 0 3 1 8Ziphiid whale 1 1 3 5 10Ziphius cavirostris 5 4 0 5 14Total 248 360 171 252 1031
15
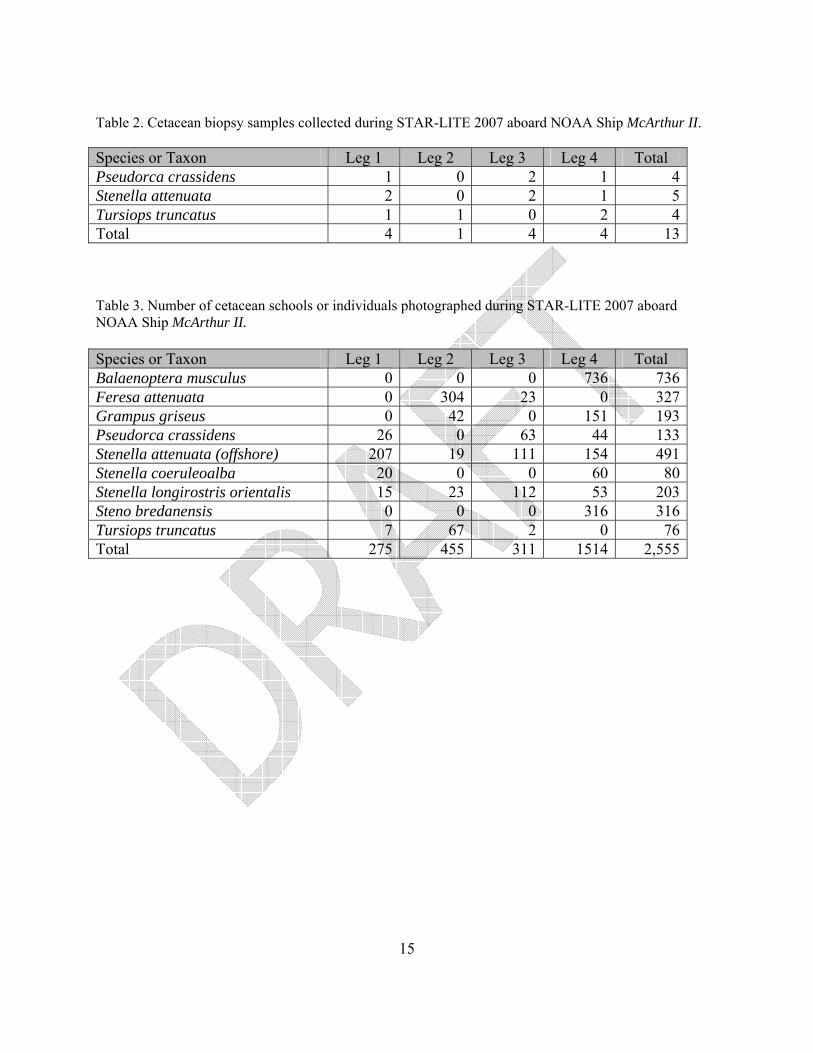
Table 2. Cetacean biopsy samples collected during STAR-LITE 2007 aboard NOAA Ship McArthur II. Species or Taxon Leg 1 Leg 2 Leg 3 Leg 4 Total Pseudorca crassidens 1 0 2 1 4Stenella attenuata 2 0 2 1 5Tursiops truncatus 1 1 0 2 4Total 4 1 4 4 13 Table 3. Number of cetacean schools or individuals photographed during STAR-LITE 2007 aboard NOAA Ship McArthur II. Species or Taxon Leg 1 Leg 2 Leg 3 Leg 4 Total Balaenoptera musculus 0 0 0 736 736Feresa attenuata 0 304 23 0 327Grampus griseus 0 42 0 151 193Pseudorca crassidens 26 0 63 44 133Stenella attenuata (offshore) 207 19 111 154 491Stenella coeruleoalba 20 0 0 60 80Stenella longirostris orientalis 15 23 112 53 203Steno bredanensis 0 0 0 316 316Tursiops truncatus 7 67 2 0 76Total 275 455 311 1514 2,555
16
Table 4a. Hydrophone array configuration and hydrophone characteristics with dates of use, for STAR-LITE 2007 survey. Hydrophones labeled “SWFSC” are built in-house, and those labeled “Seiche” are built by Seiche Instruments, Inc.
Date Distance to HP 1 HP1 Spacing
HP 1-2 HP 2 Spacing HP 2-3 HP 3 Spacing
HP 3-4 HP 4 Spacing HP 4-5 HP 5 Spacing
HP 5-6 HP 6
20-Aug 300 m SWFSC 4 m SWFSC 4 m SWFSC 1000 m SWFSC 4 m SWFSC 11.9 m Seiche 08-Sep 300 m SWFSC 4 m (dead) 4 m SWFSC 500 m SWFSC 4 m SWFSC 11.9 m (dead) 12-Sep 300 m SWFSC 4 m (dead) 4 m SWFSC 500 m SWFSC 4 m SWFSC 11.55 m Seiche 30-Sep 300 m SWFSC 4 m SWFSC 11.9 m Seiche - - - - - - Table 4b. Detections of cetaceans by (1) both the visual and acoustic teams, (2) the acoustic teams (only), and (3) the visual team (only). All acoustic (only) detections were unidentified dolphins. Visual (only) detections in parenthesis are species known to vocalize beyond the acoustic detection and monitoring range.
Species or Taxon Acoustic & Visual
Acoustic (only)
Visual (only) Total
Stenella attenuata 45 - 20 65Stenella longirostris 2 - 2 4Stenella coeruleoalba 2 - 4 6S. attenuata, S. longirostris (mixed) 8 - - 8Steno bredanensis 11 - 5 16Grampus griseus 1 - 1 2Orcinus orca - - 1 1Kogia sima - - (7) 7Beaked whales - - (14) 14 Unidentified dolphins 48 149 72 269Unidentified whales - - (3) 3 Unidentified cetaceans - - (3) 3 Total 117 149 132 (27) 398
17
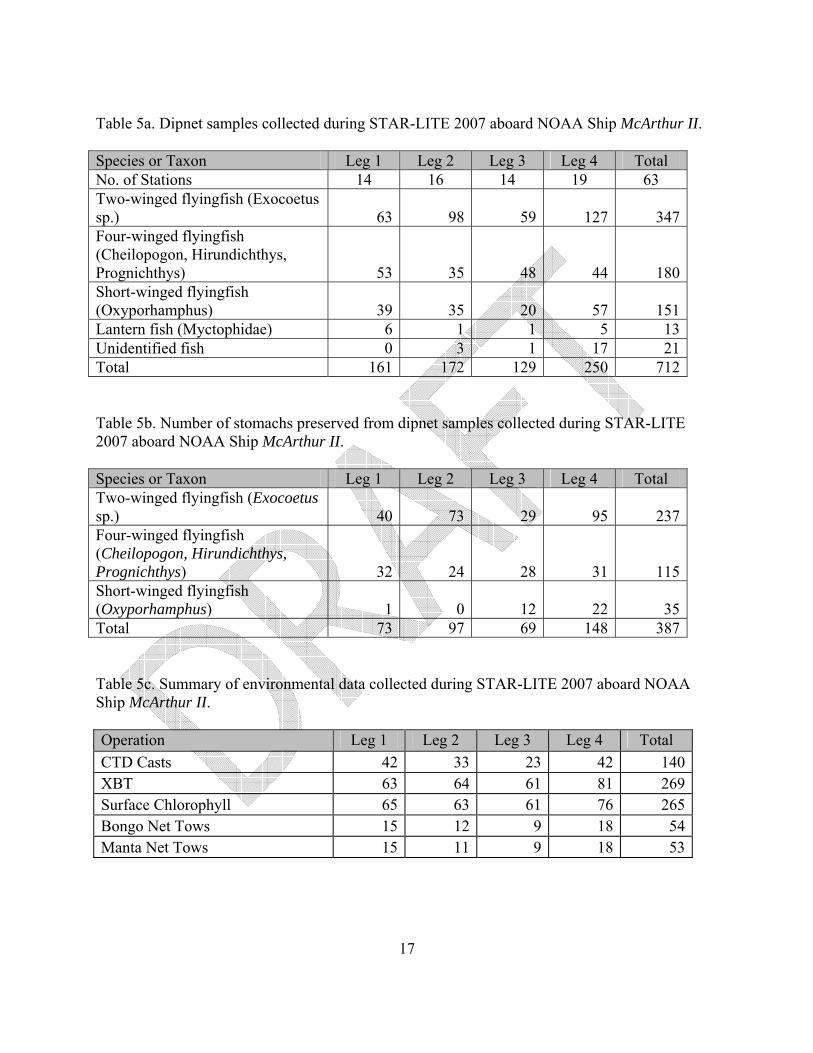
Table 5a. Dipnet samples collected during STAR-LITE 2007 aboard NOAA Ship McArthur II. Species or Taxon Leg 1 Leg 2 Leg 3 Leg 4 Total No. of Stations 14 16 14 19 63 Two-winged flyingfish (Exocoetus sp.) 63 98 59 127 347Four-winged flyingfish (Cheilopogon, Hirundichthys, Prognichthys) 53 35 48 44 180Short-winged flyingfish (Oxyporhamphus) 39 35 20 57 151Lantern fish (Myctophidae) 6 1 1 5 13Unidentified fish 0 3 1 17 21Total 161 172 129 250 712 Table 5b. Number of stomachs preserved from dipnet samples collected during STAR-LITE 2007 aboard NOAA Ship McArthur II. Species or Taxon Leg 1 Leg 2 Leg 3 Leg 4 Total Two-winged flyingfish (Exocoetus sp.) 40 73 29 95 237Four-winged flyingfish (Cheilopogon, Hirundichthys, Prognichthys) 32 24 28 31 115Short-winged flyingfish (Oxyporhamphus) 1 0 12 22 35Total 73 97 69 148 387 Table 5c. Summary of environmental data collected during STAR-LITE 2007 aboard NOAA Ship McArthur II. Operation Leg 1 Leg 2 Leg 3 Leg 4 Total CTD Casts 42 33 23 42 140XBT 63 64 61 81 269Surface Chlorophyll 65 63 61 76 265Bongo Net Tows 15 12 9 18 54Manta Net Tows 15 11 9 18 53

18
Table 6. Seabird sightings during STAR-LITE 2007.
Still awaiting table.