Embed Size (px)
Citation preview
Draft Avoided Cost Forecast and Marginal CO2 Offset Value of
Conservation
Regional Technical Forum
Maury Galbraith
Northwest Power and Conservation Council
April 29, 2008

NorthwestPower andConservation
Council
NorthwestPower andConservation
Council2April 29, 2008
Agenda• Interim Wholesale Power Price Forecast
– Revised AURORAxmp Inputs– Capacity Expansion Results– Base and Sensitivity Case Price Forecasts– Thoughts on Avoided Cost
– Avoided Resources– RPS Mandate– Blended Avoided Costs
• Marginal CO2 Offset Value of Conservation– WECC and PNW Annual CO2 Production Forecasts– Selecting the Region’s Marginal Resource– Average Marginal CO2 Production Rates

NorthwestPower andConservation
Council
NorthwestPower andConservation
Council3April 29, 2008
Interim Wholesale Power Price Forecast
NorthwestPower andConservation
Council
NorthwestPower andConservation
Council4April 29, 2008 4
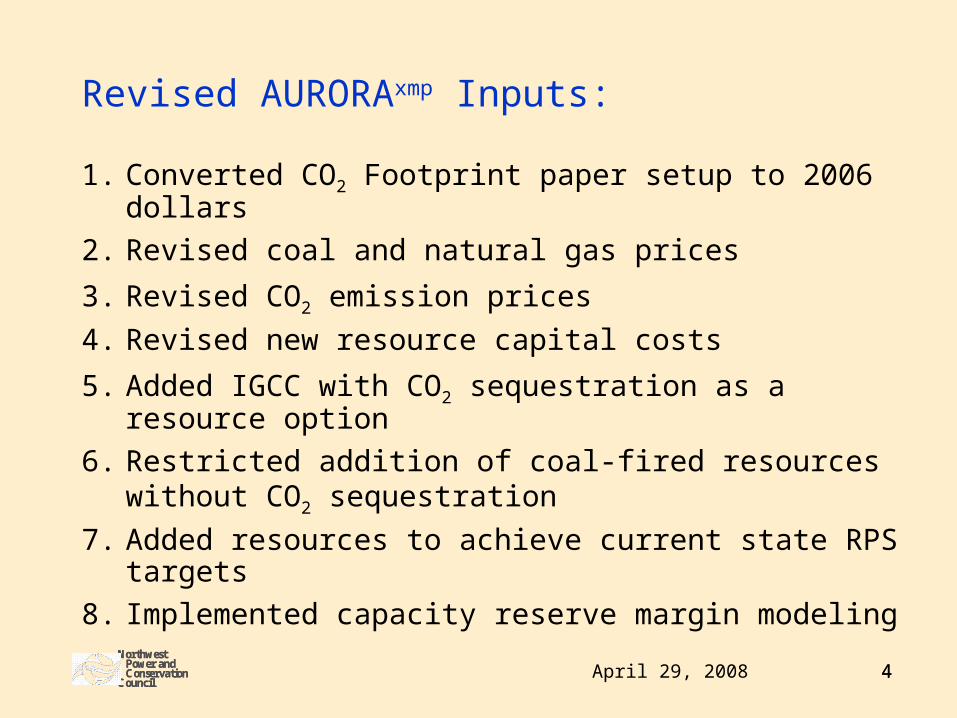
Revised AURORAxmp Inputs:
1. Converted CO2 Footprint paper setup to 2006 dollars
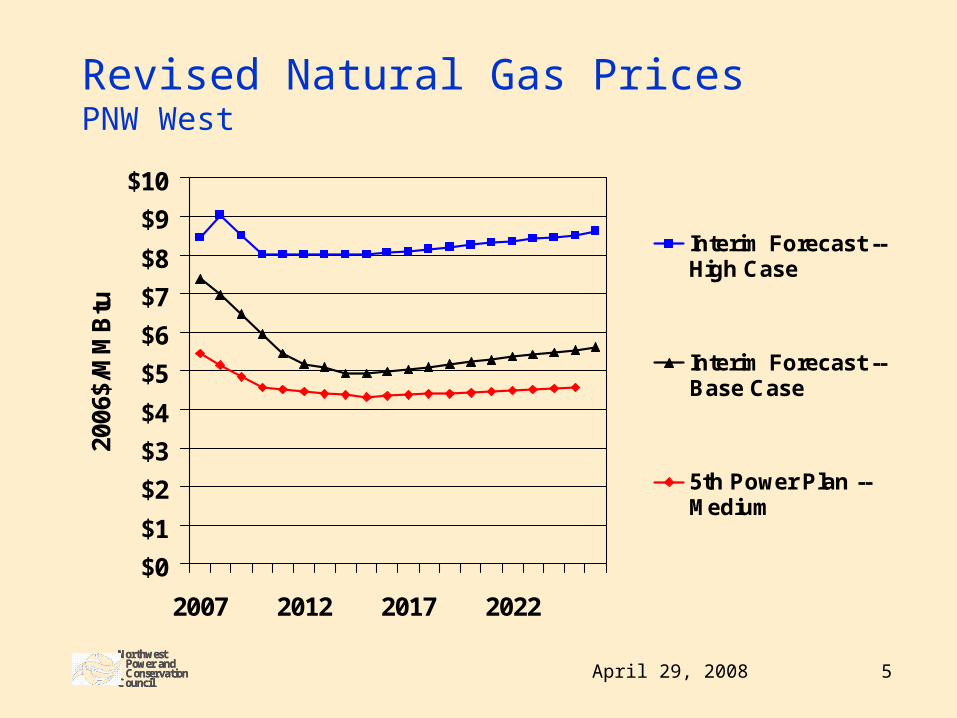
2. Revised coal and natural gas prices
3. Revised CO2 emission prices
4. Revised new resource capital costs
5. Added IGCC with CO2 sequestration as a resource option
6. Restricted addition of coal-fired resources without CO2 sequestration
7. Added resources to achieve current state RPS targets
8. Implemented capacity reserve margin modeling
NorthwestPower andConservation
Council
NorthwestPower andConservation
Council5April 29, 2008
Revised Natural Gas PricesPNW West
$0
$1
$2
$3
$4
$5
$6
$7
$8
$9
$10
2007 2012 2017 2022
2006
$/M
MB
tu
Interim Forecast --High Case
Interim Forecast --Base Case
5th Power Plan --Medium

NorthwestPower andConservation
Council
NorthwestPower andConservation
Council6April 29, 2008
Revised CO2 Emission Prices
$0
$5
$10
$15
$20
$25
$30
$35
$40
$45
2007 2012 2017 2022
2006
$/to
n o
f C
O2
Interim Forecast -High Case
Interim Forecast -Base Case
5th Power Plan -Mean Values
NorthwestPower andConservation
Council
NorthwestPower andConservation
Council7April 29, 2008
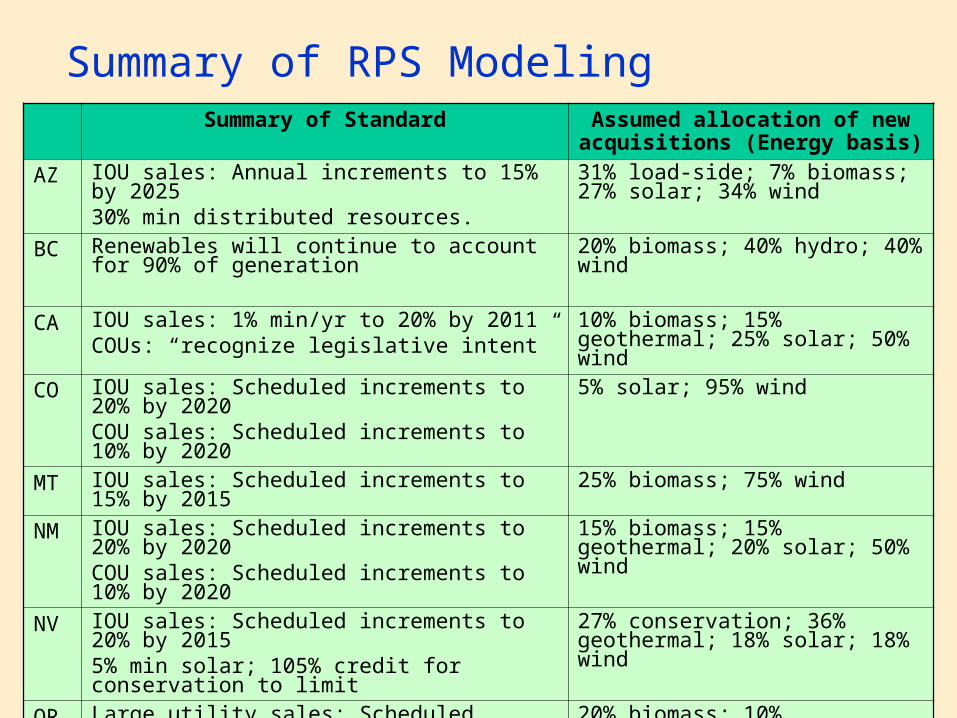
Summary of RPS ModelingSummary of Standard Assumed allocation of new
acquisitions (Energy basis)
AZ IOU sales: Annual increments to 15% by 202530% min distributed resources.
31% load-side; 7% biomass; 27% solar; 34% wind
BC Renewables will continue to account for 90% of generation
20% biomass; 40% hydro; 40% wind
CA IOU sales: 1% min/yr to 20% by 2011COUs: “recognize legislative intent”
10% biomass; 15% geothermal; 25% solar; 50% wind
CO IOU sales: Scheduled increments to 20% by 2020COU sales: Scheduled increments to 10% by 2020
5% solar; 95% wind
MT IOU sales: Scheduled increments to 15% by 2015 25% biomass; 75% wind
NM IOU sales: Scheduled increments to 20% by 2020COU sales: Scheduled increments to 10% by 2020
15% biomass; 15% geothermal; 20% solar; 50% wind
NV IOU sales: Scheduled increments to 20% by 20155% min solar; 105% credit for conservation to limit
27% conservation; 36% geothermal; 18% solar; 18% wind
OR Large utility sales: Scheduled increments to 25% by 2025. (Medium utilities 10%; small 5% by 2025)
20% biomass; 10% geothermal; 5% solar; 65% wind
WA Sales of large utilities (17/~ 84% load): Scheduled increments to 20% by 2020.
20% biomass; 5% hydro; 75% wind
NorthwestPower andConservation
Council
NorthwestPower andConservation
Council8April 29, 2008 8
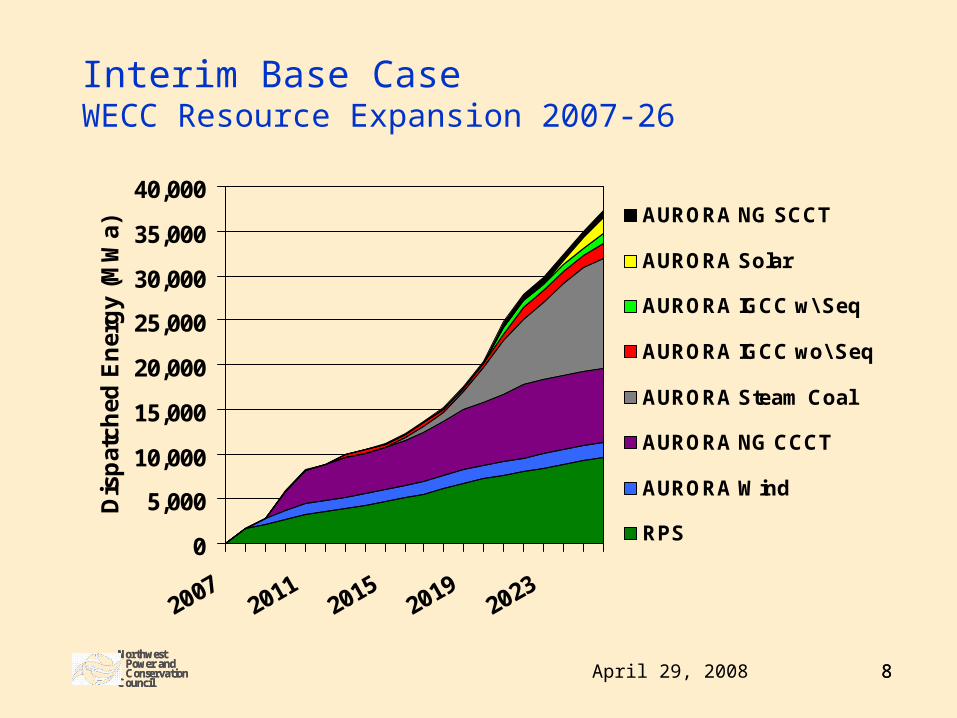
Interim Base CaseWECC Resource Expansion 2007-26
0
5,000
10,000
15,000
20,000
25,000
30,000
35,000
40,000
20072011
20152019
2023
Dis
pat
ched
En
erg
y (M
Wa)
AURORA NG SCCT
AURORA Solar
AURORA IGCC w\ Seq
AURORA IGCC wo\ Seq
AURORA Steam Coal
AURORA NG CCCT
AURORA Wind
RPS

NorthwestPower andConservation
Council
NorthwestPower andConservation
Council9April 29, 2008 9
Interim Base Case PNW Resource Expansion 2007-26
0
400
800
1,200
1,600
2,000
2,400
20072011
20152019
2023
Dis
pat
ched
En
erg
y (M
Wa) RPS Hydro
RPS Solar
RPS Geothermal
RPS Biomass
RPS Wind

NorthwestPower andConservation
Council
NorthwestPower andConservation
Council10April 29, 2008 10
Interim High Capital Cost CaseWECC Resource Expansion 2007-26
0
5,000
10,000
15,000
20,000
25,000
30,000
35,000
40,000
20072011
20152019
2023
Dis
pat
ched
En
erg
y (M
Wa) AURORA NG SCCT
AURORA IGCC wo\ Seq
AURORA NG CCCT
AURORA Wind
RPS

NorthwestPower andConservation
Council
NorthwestPower andConservation
Council11April 29, 2008 11
Interim High Capital Cost Case PNW Resource Expansion 2007-26 (No change!)
0
400
800
1,200
1,600
2,000
2,400
20072011
20152019
2023
Dis
pat
ched
En
erg
y (M
Wa) RPS Hydro
RPS Solar
RPS Geothermal
RPS Biomass
RPS Wind
NorthwestPower andConservation
Council
NorthwestPower andConservation
Council12April 29, 2008 12
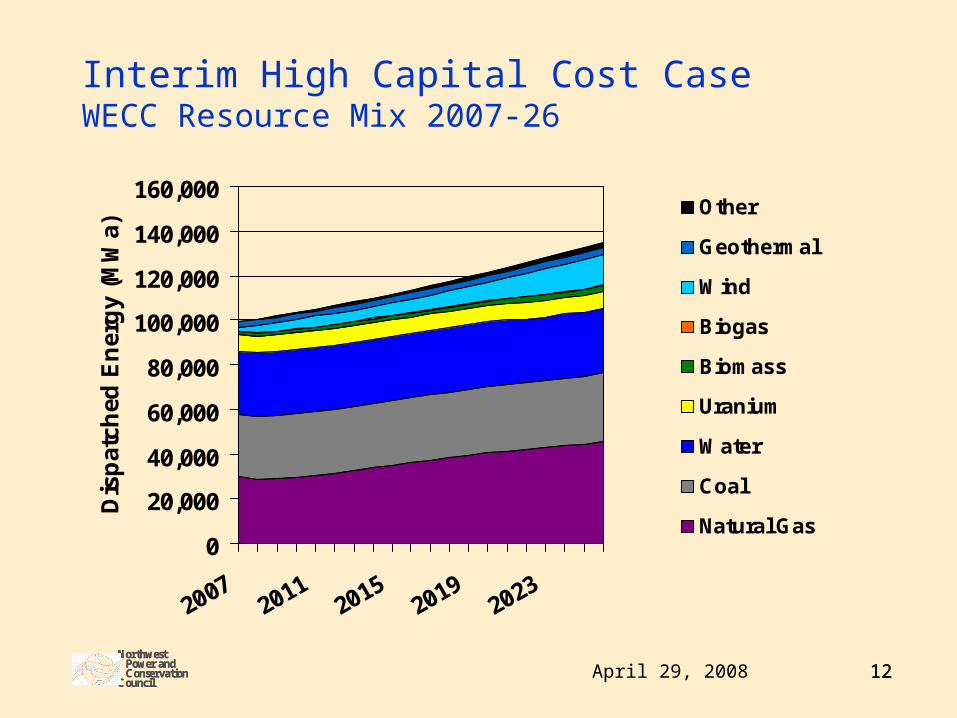
Interim High Capital Cost CaseWECC Resource Mix 2007-26
0
20,000
40,000
60,000
80,000
100,000
120,000
140,000
160,000
20072011
20152019
2023
Dis
pat
ched
En
erg
y (M
Wa)
Other
Geothermal
Wind
Biogas
Biomass
Uranium
Water
Coal
Natural Gas

NorthwestPower andConservation
Council
NorthwestPower andConservation
Council13April 29, 2008 13
Interim High Capital Cost CasePNW Resource Mix 2007-26
0
5,000
10,000
15,000
20,000
25,000
30,000
20072011
20152019
2023
Dis
pat
ched
En
erg
y (M
Wa)
Other
Geothermal
Wind
Biogas
Biomass
Uranium
Water
Coal
Natural Gas

NorthwestPower andConservation
Council
NorthwestPower andConservation
Council14April 29, 2008
Base Case Price ComparisonsMid-C Annual Average Prices
$30
$35
$40
$45
$50
$55
$60
$65
2007 2012 2017 2022
2006
$/M
Wh
5th Plan Final
Biennial Assessment
Draft Interim Base Case
Final Interim Base Case
Interim High Capital CostCase
NorthwestPower andConservation
Council
NorthwestPower andConservation
Council15April 29, 2008
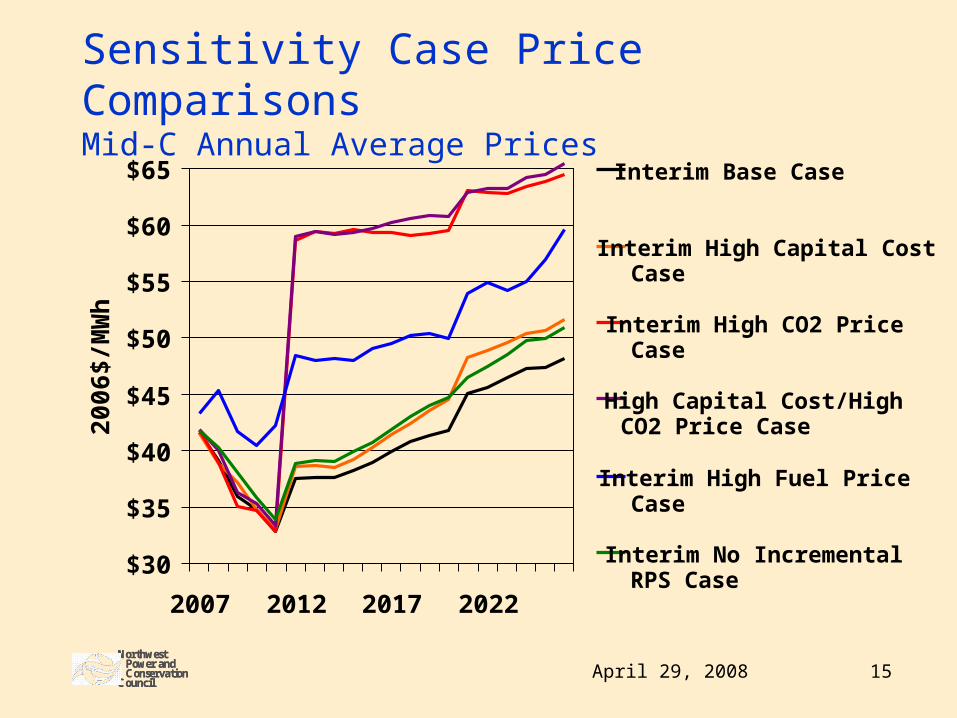
Sensitivity Case Price ComparisonsMid-C Annual Average Prices
$30
$35
$40
$45
$50
$55
$60
$65
2007 2012 2017 2022
2006
$/M
Wh
Interim Base Case
Interim High Capital CostCase
Interim High CO2 PriceCase
High Capital Cost/HighCO2 Price Case
Interim High Fuel PriceCase
Interim No IncrementalRPS Case
NorthwestPower andConservation
Council
NorthwestPower andConservation
Council16April 29, 2008
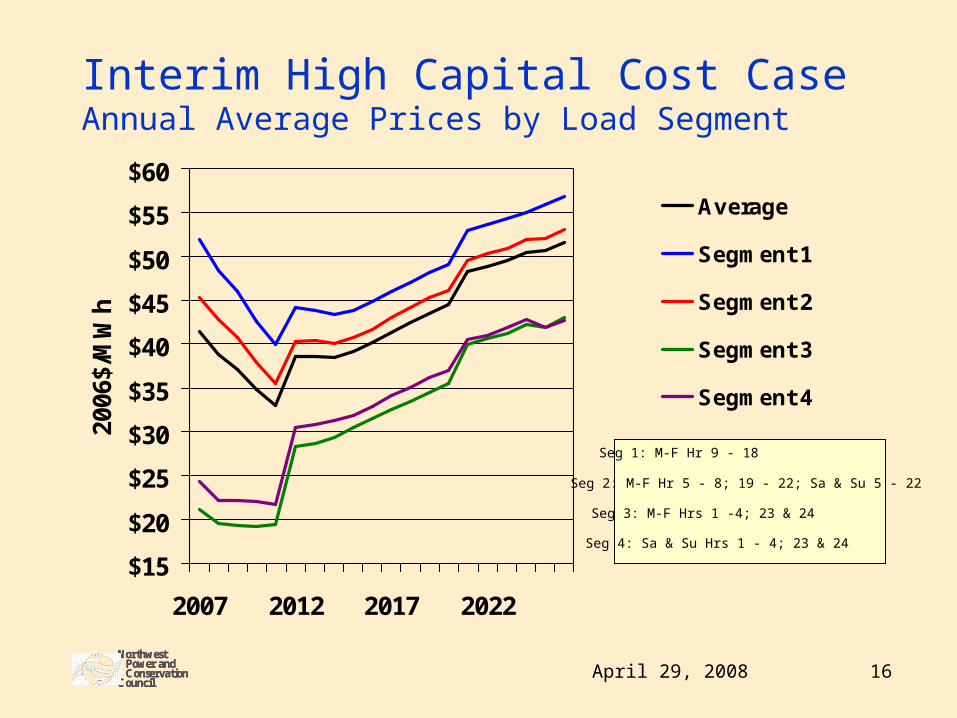
Interim High Capital Cost CaseAnnual Average Prices by Load Segment
$15
$20
$25
$30
$35
$40
$45
$50
$55
$60
2007 2012 2017 2022
2006
$/M
Wh
Average
Segment 1
Segment 2
Segment 3
Segment 4
Seg 1: M-F Hr 9 - 18
Seg 2: M-F Hr 5 - 8; 19 - 22; Sa & Su 5 - 22
Seg 3: M-F Hrs 1 -4; 23 & 24
Seg 4: Sa & Su Hrs 1 - 4; 23 & 24
NorthwestPower andConservation
Council
NorthwestPower andConservation
Council17April 29, 2008
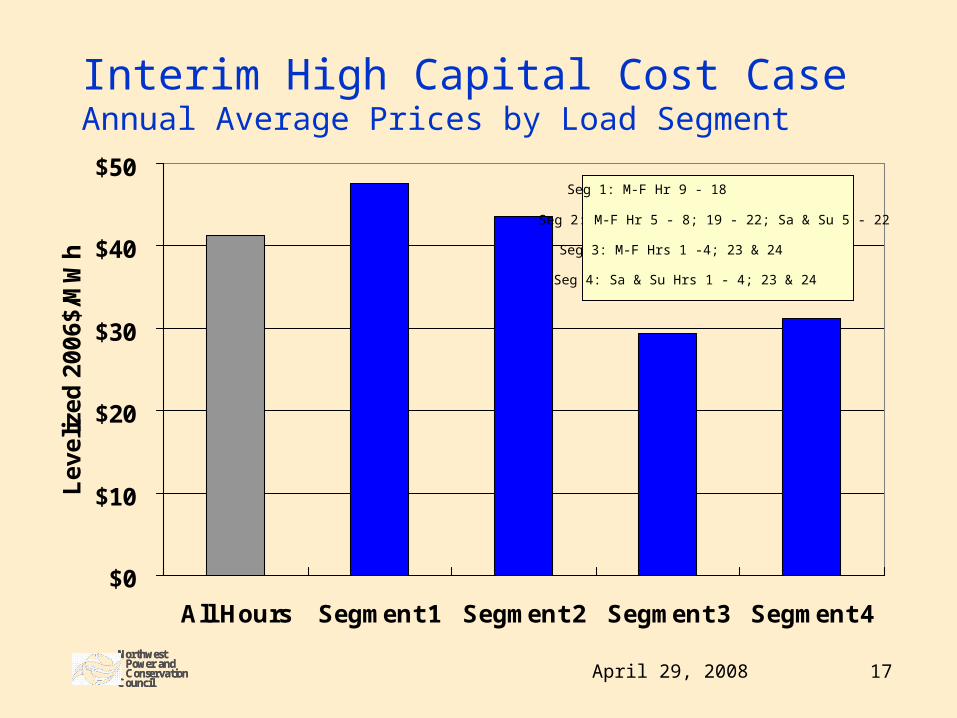
Interim High Capital Cost CaseAnnual Average Prices by Load Segment
$0
$10
$20
$30
$40
$50
All Hours Segment 1 Segment 2 Segment 3 Segment 4
Le
ve
lize
d 2
00
6$
/MW
h
Seg 1: M-F Hr 9 - 18
Seg 2: M-F Hr 5 - 8; 19 - 22; Sa & Su 5 - 22
Seg 3: M-F Hrs 1 -4; 23 & 24
Seg 4: Sa & Su Hrs 1 - 4; 23 & 24

NorthwestPower andConservation
Council
NorthwestPower andConservation
Council18April 29, 2008 18
Thoughts on Avoided Costs
• Avoided costs are associated with avoidable (or planned) resources:
• Logically come after a resource plan
• Guide resource decisions between plans
• Long-term concept
• Depend on load-resource balance
• If “short” resources then plan to acquire resources
• If “long” resources then plan for wholesale sales

NorthwestPower andConservation
Council
NorthwestPower andConservation
Council19April 29, 2008 19
More Thoughts on Avoided Costs• Are RPS Resources Avoidable?
1) RPSMWh = RPS Target% * SalesMWh
2) RPSMWh = RPS Target% * (SalesMWh – EEMWh)
3) RPSMWh = (RPS Target% * SalesMWh)
– (RPS Target% * EEMWh)
• In general, every MWh of EE avoids a fraction of a utility’s required RPS resource development; even though EE is typically a zero GHG emission resource.

NorthwestPower andConservation
Council
NorthwestPower andConservation
Council20April 29, 2008
Blended Avoided Cost Methodology
$0
$10
$20
$30
$40
$50
$60
$70
$80
$90
Lev
eliz
ed 2
006$
/MW
h
Wholesale PowerPrices
Annual Levelized Costof Wind in 2020
Region's AvoidedCost
Seg 1: M-F Hr 9 - 18
Seg 2: M-F Hr 5 - 8; 19 - 22; Sa & Su 5 - 22
Seg 3: M-F Hrs 1 -4; 23 & 24
Seg 4: Sa & Su Hrs 1 - 4; 23 & 24

NorthwestPower andConservation
Council
NorthwestPower andConservation
Council21April 29, 2008
Upcoming AURORAxmp Input Revisions• Demand forecast for Pacific Northwest
• Demand forecasts for other WECC areas
• Revised hydro inputs (i.e., use 70 years of stream flow)
• Revised wind modeling (i.e., improved hourly shape)
• AURORA Version 9.1 (i.e., improved capacity reserve margin logic)
• + Others yet to be identified
NorthwestPower andConservation
Council
NorthwestPower andConservation
Council22April 29, 2008
Marginal CO2 Offset Value of Conservation

NorthwestPower andConservation
Council
NorthwestPower andConservation
Council23April 29, 2008
Sensitivity Case CO2 ProductionWECC Annual Emissions
300
350
400
450
500
550
600
2007 2012 2017 2022
Mil
lio
n T
on
s
Interim Base Case
Interim High Fuel PriceCase
Interim High CO2 PriceCase
Interim No IncrementalRPS Case
Interim High Capital CostCase
High Capital Cost/HighCO2 Price Case
5th Plan Portfolio

NorthwestPower andConservation
Council
NorthwestPower andConservation
Council24April 29, 2008
Sensitivity Case CO2 ProductionNW Annual Emissions
30
35
40
45
50
55
60
65
70
2007 2012 2017 2022
Mil
lio
n T
on
s
Interim Base Case
Interim High CapitalCost Case
High Capital Cost/HighCO2 Price Case
Est. 1990 Level

NorthwestPower andConservation
Council
NorthwestPower andConservation
Council25April 29, 2008
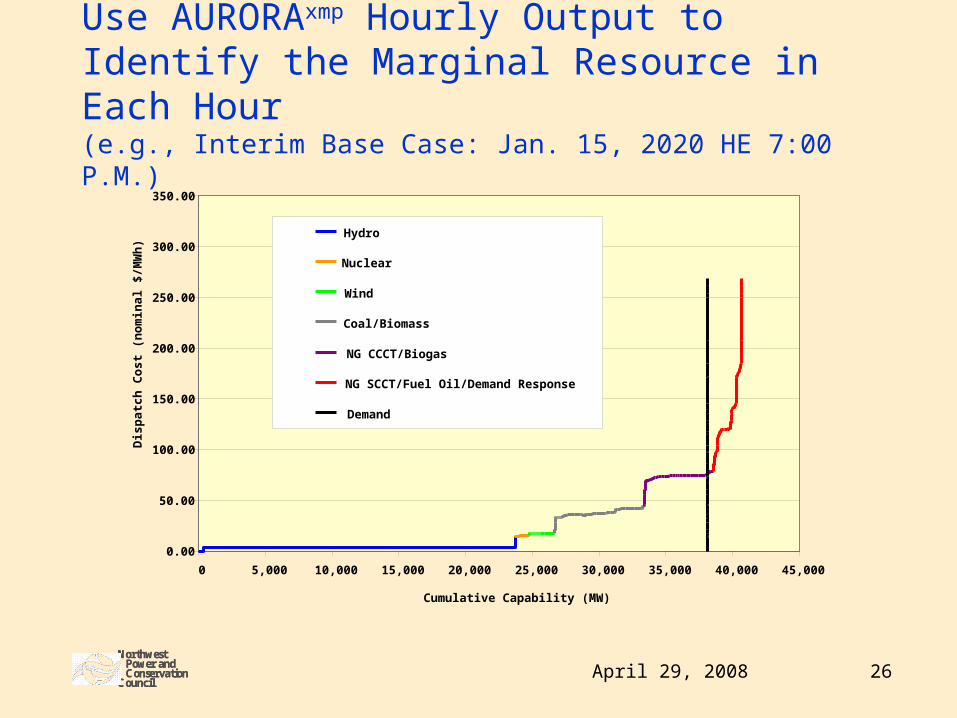
Marginal CO2 Production Rates
• The CO2 emissions rate of the last resource (or marginal resource) brought on-line to supply power during a given hour.
• Measured in pounds of CO2 per kilowatt-hour (lbs. per kWh).
• Power system results are averages of the CO2 production rate of the marginal resources in each hour of the period (e.g., 8,760 marginal resources per year).
NorthwestPower andConservation
Council
NorthwestPower andConservation
Council26April 29, 2008
Use AURORAxmp Hourly Output to Identify the Marginal Resource in Each Hour(e.g., Interim Base Case: Jan. 15, 2020 HE 7:00 P.M.)
0.00
50.00
100.00
150.00
200.00
250.00
300.00
350.00
0 5,000 10,000 15,000 20,000 25,000 30,000 35,000 40,000 45,000
Cumulative Capability (MW)
Dis
pa
tch
Co
st
(no
min
al $
/MW
h)
Hydro
Nuclear
Wind
Coal/Biomass
NG CCCT/Biogas
NG SCCT/Fuel Oil/Demand Response
Demand

NorthwestPower andConservation
Council
NorthwestPower andConservation
Council27April 29, 2008
Interim High Capital Cost CasePNW Marginal Resource Mix
0%
10%
20%
30%
40%
50%
60%
70%
80%
90%
100%
2010 2015 2020 2025
Per
cen
t o
f A
nn
ual
Ho
urs
Demand ResponseNatural GasBiomassCoal

NorthwestPower andConservation
Council
NorthwestPower andConservation
Council28April 29, 2008
Interim High Capital Cost CaseMarginal CO2 Rates Greater Than Average CO2
Rates
0.0
0.1
0.2
0.3
0.4
0.5
0.6
0.7
0.8
0.9
1.0
2010 2015 2020 2025
lbs.
of
CO
2 p
er k
Wh
Marginal RateAverage Rate

NorthwestPower andConservation
Council
NorthwestPower andConservation
Council29April 29, 2008
Interim High Capital Cost CaseMarginal CO2 Production Rates by Load Segment
0.0
0.2
0.4
0.6
0.8
1.0
1.2
2010 2015 2020 2025
lbs.
of
CO
2 p
er k
Wh
Segment 1
Segment 2
Segment 3
Segment 4
All hours
Seg 1: M-F Hr 9 - 18
Seg 2: M-F Hr 5 - 8; 19 - 22; Sa & Su 5 - 22
Seg 3: M-F Hrs 1 -4; 23 & 24
Seg 4: Sa & Su Hrs 1 - 4; 23 & 24
NorthwestPower andConservation
Council
NorthwestPower andConservation
Council30April 29, 2008
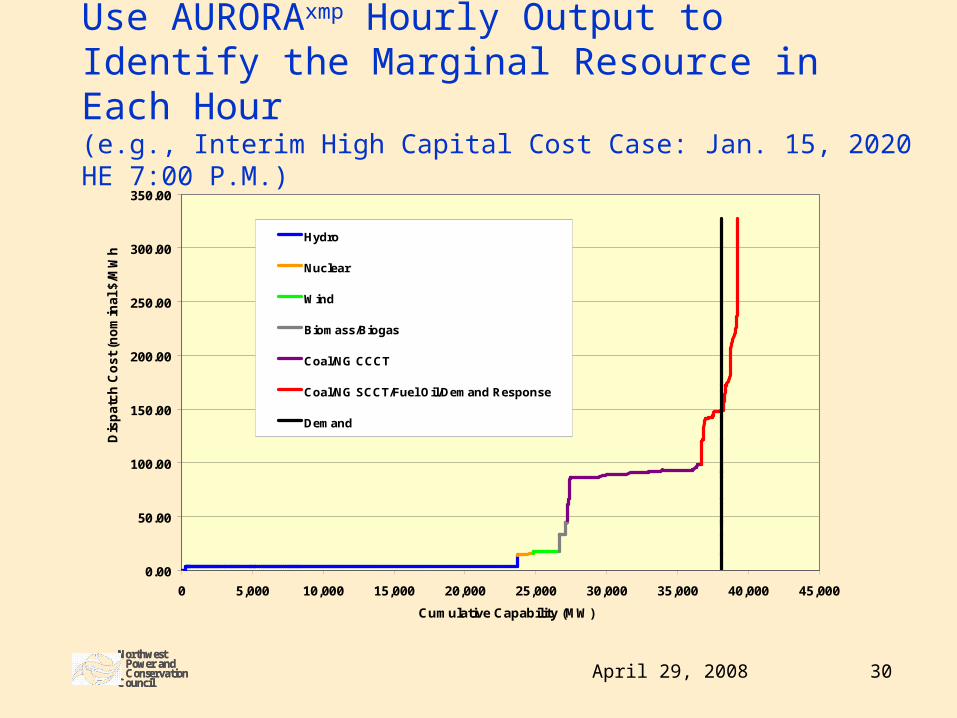
Use AURORAxmp Hourly Output to Identify the Marginal Resource in Each Hour(e.g., Interim High Capital Cost Case: Jan. 15, 2020 HE 7:00 P.M.)
0.00
50.00
100.00
150.00
200.00
250.00
300.00
350.00
0 5,000 10,000 15,000 20,000 25,000 30,000 35,000 40,000 45,000
Cumulative Capability (MW)
Dis
pa
tch
Co
st
(no
min
al
$/M
Wh
)
Hydro
Nuclear
Wind
Biomass/Biogas
Coal/NG CCCT
Coal/NG SCCT/Fuel Oil/Demand Response
Demand

NorthwestPower andConservation
Council
NorthwestPower andConservation
Council31April 29, 2008
High Capital Cost/High CO2 Price CasePNW Marginal Resource Mix
0%
10%
20%
30%
40%
50%
60%
70%
80%
90%
100%
2010 2015 2020 2025
Per
cen
t o
f A
nn
ual
Ho
urs
Demand Response
Natural Gas
Biomass
Coal

NorthwestPower andConservation
Council
NorthwestPower andConservation
Council32April 29, 2008
High Capital Cost/High CO2 Price CaseHigher Marginal CO2 Production Rates
0.0
0.2
0.4
0.6
0.8
1.0
1.2
1.4
1.6
1.8
2.0
2010 2015 2020 2025
lbs.
of
CO
2 p
er k
Wh
Interim High CapitalCost Case
High Capital Cost/HighCO2 Price Case

NorthwestPower andConservation
Council
NorthwestPower andConservation
Council33April 29, 2008
High Capital Cost/High CO2 Price CaseHigher Marginal CO2 Rates But Lower Annual CO2 Emissions
• Higher CO2 emissions prices increase the dispatch costs of coal-fired (and to a lesser extent natural gas-fired) resources.
• Results in coal-fired resources being the marginal resource during more hours of the year. This increases marginal CO2 emission rates.
• Also results in less overall reliance on coal-fired resources (and more reliance on natural gas). This reduces annual CO2 emissions.

NorthwestPower andConservation
Council
NorthwestPower andConservation
Council34April 29, 2008
Final Thoughts on CO2 Offset Value
• Under Interim High Capital Cost Case assumptions, the average marginal CO2 production rate of the Northwest power system is expected to range between 0.7 -- 0.8 lbs. of CO2 per kWh.
• Marginal CO2 production rates vary significantly by hourly load segment (-9% to +33% of all hour average).
• The CO2 offset value of (flat output) conservation ranges between $0 and $5 per MWh under base case CO2 emission price assumptions (in constant 2006 dollars).

NorthwestPower andConservation
Council
NorthwestPower andConservation
Council35April 29, 2008 35