Embed Size (px)
Citation preview

Draft
Efficiency of early selection in Calycophyllum spruceanum
and Guazuma crinita, two fast-growing timber species of the Peruvian Amazon
Journal: Canadian Journal of Forest Research
Manuscript ID cjfr-2017-0407.R1
Manuscript Type: Article
Date Submitted by the Author: 22-Jan-2018
Complete List of Authors: Cornelius, Jonathan; World Agroforestry Centre, Pinedo-Ramírez, Róger; World Agroforestry Centre Sotelo Montes, Carmen; World Agroforestry Centre Ugarte-Guerra, Leoncio; World Agroforestry Centre Weber, John C.; World Agroforestry Centre
Keyword: progeny-test, tree improvement, age-to-age correlation, financial analysis, breeding strategies
Is the invited manuscript for consideration in a Special
Issue? : N/A
https://mc06.manuscriptcentral.com/cjfr-pubs
Canadian Journal of Forest Research
Draft
1
Efficiency of early selection in Calycophyllum spruceanum and Guazuma 1
crinita, two fast-growing timber species of the Peruvian Amazon 2
Jonathan P. Cornelius (World Agroforestry Centre (ICRAF), CIP, Apartado Postal 1558, 3
Lima 12, Peru and College of Marine and Environmental Sciences, James Cook 4
University, P.O. Box 6811, Cairns, QLD 4870, Australia; [email protected]) 5
Roger Pinedo-Ramírez (World Agroforestry Centre (ICRAF), CIP, Apartado Postal 1558, 6
Lima 12, Peru; [email protected]) 7
Carmen Sotelo-Montes (World Agroforestry Centre (ICRAF), CIP, Apartado Postal 8
1558, Lima 12, Peru; [email protected]; 9
L. Julio Ugarte-Guerra (World Agroforestry Centre (ICRAF), CIP, Apartado Postal 1558, 10
Lima 12, Peru, College of Marine and Environmental Sciences, James Cook University, 11
P.O. Box 6811, Cairns, QLD 4870, Australia, [email protected])1 12
John C. Weber (World Agroforestry Centre (ICRAF), CIP, Apartado Postal 1558, Lima 13
12, Peru; [email protected] 14
15
1Currently: Servicio Forestal y de Fauna Silvestre (SERFOR), Avenida 7 N° 229, 16
Rinconada Baja, La Molina, Lima, Peru. 17
Author for correspondence: Jonathan Cornelius, World Agroforestry Centre (ICRAF), 18
CIP, Apartado Postal 1558, Lima 12, phone +51.13496017, email [email protected] 19
20
21
Page 1 of 30
https://mc06.manuscriptcentral.com/cjfr-pubs
Canadian Journal of Forest Research

Draft
2
Abstract 22
'Bolaina' (Guazuma crinita, Malvaceae) and 'capirona' (Calycophyllum spruceanum, 23
Rubiaceae) are fast-growing Amazonian timber trees. In Peru, they are increasingly being 24
used in agroforestry systems and plantations, and interest in developing improved 25
germplasm is growing. However, tree improvement incurs both direct costs and interest 26
costs on investments; because of this, early selection is of interest. We examine the 27
efficiency of early selection at 13 or 17 months after field trial establishment. These are 28
compared with selection after 49 or 53 months using two efficiency metrics: one based on 29
discounted response to selection per unit of present value of cost, the second on net 30
discounted revenues, using discount rates of 5%, 10% and 15%. Our metrics differed 31
from those used in previous studies by taking into account direct costs as well as costs of 32
capital. We found that in most scenarios early selection was attractive, partly due to direct 33
cost savings. We conclude that, in evaluating the efficient of early selection, lack of 34
consideration of direct costs may produce erroneous results. We also explore some 35
general implications of the results. 36
Keywords 37
progeny-test, tree improvement, age-age correlation, financial analysis, breeding 38
strategies 39
40
Page 2 of 30
https://mc06.manuscriptcentral.com/cjfr-pubs
Canadian Journal of Forest Research

Draft
3
Introduction 41
'Bolaina' (Guazuma crinita, Malvaceae) and 'capirona' (Calycophyllum spruceanum, 42
Rubiaceae) are fast-growing timber trees of the Peruvian Amazon. They are increasingly 43
being used in agroforestry systems and plantations in Peru (Sears et al. 2014; Cornelius 44
pers. obs.1). Saw-timber rotations of bolaina in plantations are 6-10 years (Wightman et 45
al. 2006), producing a relatively low density, versatile timber used in interiors, furniture 46
and pallets in the Amazon, and for social and emergency housing in the desert conditions 47
of Lima (Putzel et al. 2013). The strong, dense timber of capirona (Sotelo Montes et al., 48
2006) is one of the most traded on the Peruvian domestic market. The species also has 49
multiple on-farm, non-traded uses, including medicinal applications (Reynel et al., 2003). 50
Expected sawtimber rotations of capirona in plantations are from 15-20 years (Wightman 51
et al. 2006). 52
Both species grow throughout the Amazon basin (Grandtner and Chevrette 2014). 53
Bolaina is a pioneer species found in riparian and non-riparian locations up to 1500 m 54
a.s.l. (Reynel et al. 2003). Capirona is a longer-lived pioneer found in open or disturbed 55
situations in riparian, floodplain, and other types of forest up to 1200m a.s.l. (Reynel et 56
al., 2003; Sotelo Montes et al., 2003). 57
In Peru, there is increasing interest in genetic improvement of both species. Interest 58
charges are a key factor in determining profitability of tree improvement research, and 59
these depend on the time between investment and return. Here we explore the feasibility 60
of reducing this interval in the two species using early selection, which we define as 61
selection at an age � on a given trait, intended to bring about a response to selection in 62
1 June 2013, Pachitea River, Huánuco, Peru.
Page 3 of 30
https://mc06.manuscriptcentral.com/cjfr-pubs
Canadian Journal of Forest Research

Draft
4
the 'same' trait at age �, such that � < �. Early selection reduces costs directly, because it 63
reduces costs of maintaining and monitoring field tests. 64
Lambeth (1980) summed up early thinking on this theme: 'the question has been: how 65
much gain per generation can be sacrificed in the interest of saving time?', and 66
formulated the following efficiency metric: 67
� = ℎ���,ℎ
���
where ℎ� is the square root of the heritability at the younger selection age, ℎ is the square 68
root of the heritability at the older selection age, ��, is the phenotypic correlation between 69
measurements at the two ages (assuming that the phenotypic correlation approximates the 70
genetic correlation), � is the length (years) of a breeding cycle based on later selection, 71
and �� is the length (years) of a breeding cycle based on early selection. 72
The formulation in terms of gain per unit time is not consistent with mainstream 73
approaches to financial analysis, as it implicitly assumes discount rates of zero. 74
Accordingly, McKeand (1988), White and Hodge (1992), Balocchi et al. (1994), and 75
Osorio et al. (2003) used efficiency metrics based on discounted selection responses. 76
However, studies to date did not consider costs of alternative selection strategies (i.e. 77
early v. later selection), other than the cost of capital represented by the discount rate. 78
Metrics that do not take costs into account are valid only if differences in costs of 79
different options are negligible; this seems unlikely, as cost savings (other than interest 80
charges) are a key potential advantage of early selection. The present study differs from 81
earlier ones, in that costs are taken into account in the metrics used. 82
Materials and methods 83
Page 4 of 30
https://mc06.manuscriptcentral.com/cjfr-pubs
Canadian Journal of Forest Research

Draft
5
General approach 84
We examine the feasibility of early selection based on its efficiency in financial terms, 85
using two measures of efficiency. The first is based on discounted response to selection 86
per unit of present value of costs. The second is based on net present values. Below, we 87
first describe the progeny tests on which we based the estimates of response to selection, 88
then the selection options examined, and finally our approach to calculation of selection 89
efficiencies. 90
Progeny tests 91
In 1995, World Agroforestry Centre (ICRAF) scientists surveyed preferences of 92
smallholder farmers in the Peruvian Amazon. They found that farmers considered 93
capirona and bolaina to be among the species of highest priority for participatory 94
domestication (Sotelo Montes and Weber, 1997). In response, ICRAF began a 95
participatory domestication programme (Leakey et al. 2012). Farmers selected 200 96
mother-trees of each of bolaina and capirona in seven provenances within the Aguaytía 97
watershed, Ucayali Region. ICRAF then collected open-pollinated seed from these trees 98
(see respectively Rochon et al. (2007) and Weber et al. (2009) for provenance locations 99
of capirona and bolaina). 100
The procedure and experimental design were the same for both species. Seedlings of the 101
200 families of each species were grown in a randomized block experimental design in 102
the nursery for 15 months before being outplanted in a provenance-progeny test (bolaina: 103
January to April 2001; capirona: February to April 2000). These were located in the 104
lower, middle and upper parts of the Aguaytía watershed (see Weber et al. (2009)). The 105
field experimental design was also a randomized complete block with 15 replications. 106
Each of the 15 nursery blocks corresponded to one of the provenance/progeny test blocks. 107
Page 5 of 30
https://mc06.manuscriptcentral.com/cjfr-pubs
Canadian Journal of Forest Research

Draft
6
Maintenance practices are detailed in Weber et al. (2009). The blocks were established on 108
15 different farms: four in the lower, five in the middle and six in the upper parts of the 109
watershed. The tests were not replicated within farms. In each block, the 200 families 110
were randomly assigned to 200 experimental plots, each plot containing two trees, for a 111
total of 400 trees per block. Spacing was 2.5 by 2.5 meters within and between rows, and 112
two rows of border trees completely surrounded each block. Dead trees were replaced 113
during the first year, but data collected on replacement trees were not included in the 114
analyses. 115
Thinning practice differed between the species and between blocks of each experiment. 116
For capirona, 11 of the blocks were thinned between 38 and 40 months. For bolaina, eight 117
of the 15 blocks were thinned between 30 and 32 months. In each case, one tree per plot 118
was removed (the smallest tree, unless the larger tree was a replacement or affected by 119
pests, diseases or mechanical damage). 120
Selection options 121
The selection options are summarized in Table 1 and detailed in Appendix 1. 122
In Option 1 (early selection), selection is based on progeny test results for total height at 123
13 months (bolaina) and 17 months (capirona). In Option 2, selection is based on results 124
for height at 49 months (bolaina) and 53 months (capirona). These ages correspond to 125
actual measurement ages. In each case, the source of improved germplasm in our model 126
is a seed orchard consisting of the 20 families with the highest height means at the 127
selection age in question, selected from the 200 families included in the field trials. We 128
assume no within-family selection. Seed production is assumed to begin at two (bolaina) 129
Page 6 of 30
https://mc06.manuscriptcentral.com/cjfr-pubs
Canadian Journal of Forest Research

Draft
7
and five (capirona) years after planting. We set orchard life at 10 years; we assume that, 130
subsequently, improved sources of higher quality will supersede the orchards. 131
The target (older) trait is growth rate over the first 48 to 53 months. Selection at these 132
ages would itself be expected to generate a correlated response of <100% of the gain at 133
the harvest age (because we would not expect perfect genetic correlations between age 4 134
to 4.5 and final harvest time), but we do not examine this aspect here. 135
In our analysis, we consider Option 2, i.e. deferral of selection, as a decision to make 136
additional investments (prolongation of field-testing) aimed at achieving additional 137
genetic gain. In evaluating this decision, which is the usual or default one, the relevant 138
costs are those future costs that are either unique to one of the two options (i.e. thinning 139
or trial maintenance subsequent to month 13 or 17), or that are timed differently in the 140
two options. Past costs are relevant to the overall return on investment, but not to the 141
evaluation of future investment decisions, and therefore are not relevant to our analysis. 142
Criteria of selection efficiency 143
Our first efficiency metric (E1) is the ratio of the present value of gain per unit cost for 144
the two options, i.e. the quotient of two benefit : cost ratios, corresponding to the two 145
selection ages: 146
�1 = �����
������
147
where: �� = discounted response to selection in Option 1 (see below for estimation 148
methods), ���= present value of costs of Option 1; ��= discounted response to 149
selection in Option 2; ���= present value of costs of Option 2. 150
[1]
Page 7 of 30
https://mc06.manuscriptcentral.com/cjfr-pubs
Canadian Journal of Forest Research
Draft
8
Our second efficiency metric is the difference between the net present values (i.e. net 151
discounted revenues) of the two options: 152
�2 = ���� − ����
where: 153
���� = ��� − ���
and ���= discounted revenue from Option 1. 154
For a given discount rate, calculation of the 'benefit' components of the metric E1 155
requires only estimates of response to selection, whereas metric E2 requires also 156
estimates of the monetary value of the response. 157
The response to selection at the older age was predicted using standard formulae 158
(Falconer and Mackay 1996) as: 159
�� = ��ℎ����. 160
Response to early selection was predicted as: 161
��� = ����,�ℎ�ℎ���
where: �= selection intensity, �= genetic correlation, ℎ�= family mean heritability, �= 162
phenotypic standard deviation of family means, and subscripts are as defined for 163
Equation 1. 164
We ignore genetic gain from mother-tree selection, as it is likely to be minimal in the 165
case of selection for growth in wild stands (Cornelius 1996; Cornelius et al. 2011). 166
Family heritability was estimated as: 167
Page 8 of 30
https://mc06.manuscriptcentral.com/cjfr-pubs
Canadian Journal of Forest Research
Draft
9
ℎ�� =���
��� + ��� �⁄
where ���= variance component due to families,���= variance component due to block 168
by family interaction (error), b=number of blocks). 169
Variance components were estimated using the SPSS General Linear Model variance 170
components routine (restricted maximum likelihood method) under the following linear 171
model: 172
!"#� = $# + %� + $%#� , where 173
!"#�= mean of family & in block �,$# = random effect of block �, %�= random effect of 174
family &, $%#�= block by family interaction (error). 175
Standard errors were calculated for the heritabilities with Dickerson’s approach (Dieters 176
et al. 1995), using the asymptotic variance-covariacne matrix generated by SPSS. 177
The model confounds provenance and family effects. Previous analyses indicated 178
significant provenance effects on growth in both bolaina and capirona (Sotelo et al 2006; 179
Weber et al. 2011), but in both cases of much smaller magnitude than the family-in-180
provenance effect. We pool them here because we consider that the most likely 181
application of our results is in selecting superior families independent of the respective 182
contributions of the different sources of variation in the genetic hierarchy. All analyses 183
were carried out on observed values standardized by the phenotypic standard deviation of 184
each block, as in Osorio et al. (2003). 185
Genetic correlations cannot be estimated accurately without large amounts of data 186
(Falconer and Mackay 1996). An alternative approach is to use estimates of phenotypic 187
Page 9 of 30
https://mc06.manuscriptcentral.com/cjfr-pubs
Canadian Journal of Forest Research
Draft
10
correlation coefficients as surrogates (Cheverud 1988), as there is strong empirical 188
support for ‘‘Cheverud’s conjecture’’(Roff 1995) that phenotypic correlations are good 189
surrogates for genetic correlations (Cheverud 1988; Waitt and Levin 1998). In the 190
present study, we use phenotypic correlations between family marginal means (i.e. least 191
squares means). We expect these correlations to be closer in value to genetic correlations 192
than individual phenotypic correlations would be, because of their expected high 193
correlation with breeding values. Confidence limits (95%) were calculated for the 194
estimates, using the z-transformation method (Sokal and Rohlf, 1995). 195
We calculate the annual undiscounted revenue from selection as: 196
�' = (∆*+(�ℎ�,�+(-+
where ∆*= percentage response to selection, �ℎ�,�= gross revenue ha-1 from 197
unimproved plantations, A= area (ha) of improved plantations harvested year-1. 198
The percentage genetic gain for Option 2 was calculated as: 199
∆* = (��//̅1+100
where /̅1 = unimproved mean at 49 or 53 months (and analogously for Option 1). 200
Here we assume that the percentage improvement is applicable to harvest age; in practice, 201
as stated above, correlations of age 49 or 53 months with rotation age would be <1, as 202
Option 2 is itself early selection with regard to final rotation. Application of the same 203
proportional decrease in genetic gain for Option 1 and Option 2 (i.e. to reflect this non-204
perfect correlation with final rotation age) would leave E1 unchanged and would slightly 205
reduce E2 (i.e. slightly reducing efficiency of early selection). 206
Page 10 of 30
https://mc06.manuscriptcentral.com/cjfr-pubs
Canadian Journal of Forest Research
Draft
11
The income at harvest time from both species depends not solely on productivity and tree 207
quality but also on the degree of transformation carried out. For example, a typical price 208
for standing timber of bolaina is around US$2.00 tree-1 (with around 200 trees ha-1), 209
around US$3.00 tree-1 if felled and cut into logs, and around US$11.00 tree-1 once 210
transformed into sawntimber (Sears and Pinedo 2014). Here we based our calculations for 211
bolaina on the foregoing price for logs ("tucos"), i.e. R ha1 = $600; for capirona we 212
assume sale price of double that for bolaina, i.e. $1200 ha-1; we refer to these later as the 213
‘base timber values.’ These assumptions on transformation reflect the orientation towards 214
smallholders of the tree improvement activities executed by ICRAF and partners, as 215
smallholders are less likely to engage in production of sawtimber or other more highly 216
transformed products. Congruent with this, we also assume that the seed orchards will 217
support relatively modest plantations programs, i.e. we assume A= 500 ha yr-1. 218
In order to examine the implications of a higher degree of value-adding, we also test an 219
alternative returns scenario under which sale price is four times that indicated above (i.e. 220
$2400 ha-1 for bolaina and $4800 ha-1 for capirona) We refer to these later as ‘high timber 221
values’. 222
We assume constant future real timber prices. 223
We calculated the discounted responses (metric E1) and net present values (E2) as the 224
product of the response to selection itself (E1) or annual undiscounted revenue (E2) and 225
the discounting multiplier (see next section). 226
Discounting multipliers 227
Recurrent annual seed collections from the orchards lead to a series of 3 marginal yields 228
(i.e. yield increases resulting from genetic gain in height or diameter), where 3 = number 229
Page 11 of 30
https://mc06.manuscriptcentral.com/cjfr-pubs
Canadian Journal of Forest Research

Draft
12
of years during which seed is harvested from the seed source in question (set to 10 years 230
for both species). Additionally, the flow of returns cannot begin until time 4, 5 years after 231
establishment of plantations derived from the first year of seed production, where 5= 232
rotation length (set to 16 for capirona and 8 for bolaina). 233
Under our analytical framework, the decision of whether to proceed with early selection 234
is taken following analysis of the data at 13 (bolaina) or 17 (capirona) months, i.e. at 3.17 235
years after program commencement for capirona and 2.83 years for bolaina (Table A1). 236
Time 4 is then respectively 24.67-3.17 and 27.66-3.17 for capirona (Option 1 and Option 237
2) and 13.33-2.83 and 16.33-2.83 for bolaina (that is: for capirona, 21.5 (Option 1) and 238
24.5 (Option 2) after the decision point and discounting base year and 10.5 and 13.5 years 239
for bolaina (Table A1)). Consequently, the flow of annual returns will initiate at a time 240
6 = 4 − 3.17 for capirona and 6 = 4 − 2.83 for bolaina. The multiplier for the present 241
value of a series of 3 constant annual returns starting at time 6 is: 242
= ((1 + �+; − 1+1 + ��(1 + �+;(1 + �+<
where �= discount rate in decimals (e.g. 5% = 0.05) (Cornelius and Morgenstern 1986). 243
For bolaina, the respective present value multipliers were therefore: 244
�= =((1 + �+�> − 1+1 + ��(1 + �+�>(1 + �+�>.?
@A =((1 + �+�> − 1+1 + ��(1 + �+�>(1 + �+�=.?
In the case of capirona, the respective present value multipliers were therefore: 245
�B =((1 + �+�> − 1+1 + ��(1 + �+�>(1 + �+��.?
Page 12 of 30
https://mc06.manuscriptcentral.com/cjfr-pubs
Canadian Journal of Forest Research

Draft
13
246
?=C((1 + �+�> − 1+1 + ��(1 + �+�>(1 + �+�@.?
We used three different discount rates (5%, 10% and 15%). As we assume zero inflation 247
in timber prices, these can be considered as real interest rates. The higher rate would be 248
appropriate for private investment (e.g. for example, Peru's Agricultural Bank 249
(Agrobanco) is currently offering credit for timber tree planting in coffee agroforestry 250
systems at 16.5%-17.0%, while annual inflation is at around 3%-4%). The lower value 251
can be considered as a social discount rate, applicable, for example, to development 252
projects. 253
Costs 254
We estimated the cost of each option based on ICRAF records and our experience of 255
carrying out the different component activities (Table 2: estimations were made in 2015 256
PEN (Peruvian new soles), converted to USA dollars at PEN3.00 $US-1). We then 257
calculated the discounted costs for each option, based on the specifications in Table 1 and 258
Appendix 1 (see Results), excluding costs common to and incurred at the same time in 259
both options. Salary costs were assumed to be equal to the non-salary cost of each option. 260
Although not exact, we considered this approach to be preferable to attempting to 261
attribute fractions of scientist and technician time to specific activities. It corresponds to 262
typical ‘project’ budget ratios of 1:1 (salaries:operations). 263
Results 264
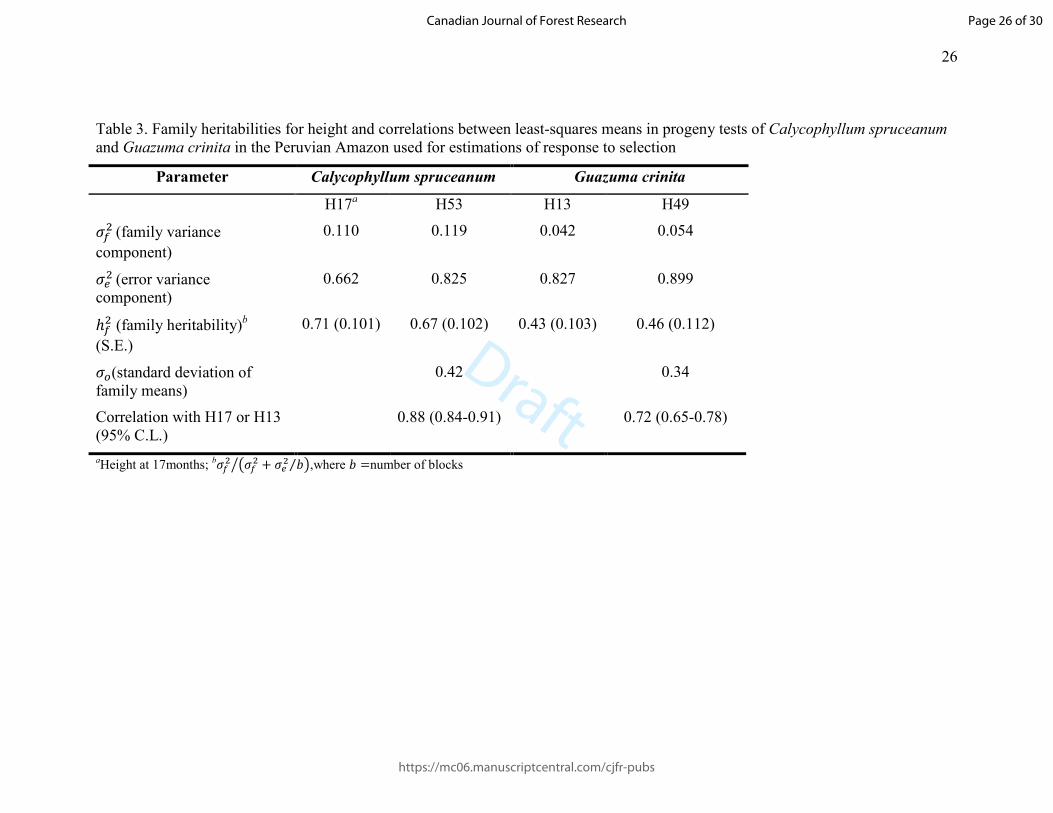
Mean height at months 53 (C. spruceanum) and 49 (G. crinita) were respectively 7.8 m 265
(s.e. = 0.06 m) and 11.7 m (s.e. = 0.08 m). Estimates of genetic and phenotypic 266
parameters are presented in Table 3. Family heritabilities were around 0.70 for capirona 267
Page 13 of 30
https://mc06.manuscriptcentral.com/cjfr-pubs
Canadian Journal of Forest Research

Draft
14
and around 0.45 for bolaina; standard errors were around 0.1 in all cases, indicating 268
relatively precise estimates. Age-age correlations were 0.88 (95% C.L. 0.84-0.91) for 269
capirona and 0.72 (95% C.L. 0.65-0.78) for bolaina (Table 3). 270
Discounted Costs 271
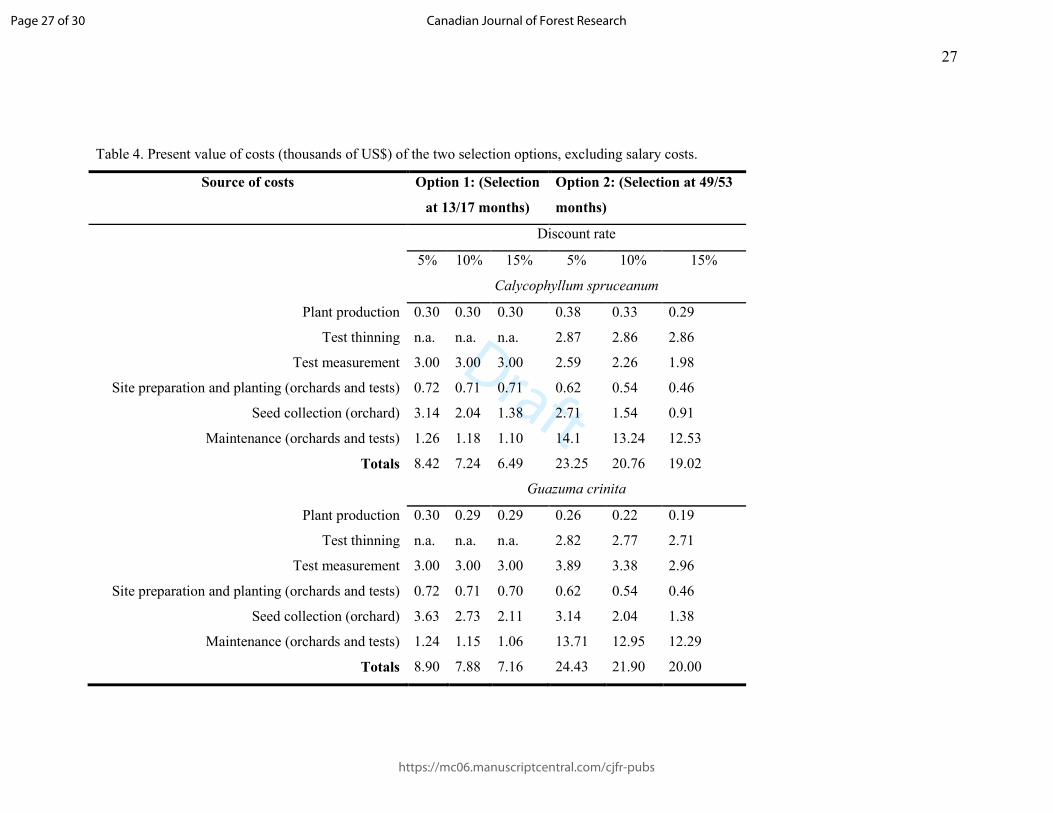
The present values of non-salary costs are summarized in Table 4. They were inversely 272
proportional to the discount rate for both selection options (this is axiomatic, as all costs 273
were discounted, not compounded). Over both species and options, total costs at the 5% 274
discount rate were ∼22-26% higher than those at 15% discount rate. At each discount 275
rate, Option 2 was roughly three times as expensive as Option 1, which is in accordance 276
with the basic rationale for early selection (i.e. it is cheaper). The higher cost of Option 2 277
is due principally to the prolongation of test maintenance and to the need for thinning. 278
Response to selection, efficiencies 279
Results with respect to selection response and efficiencies are summarized below and 280
detailed in Tables 5 and 6. 281
Response to selection 282
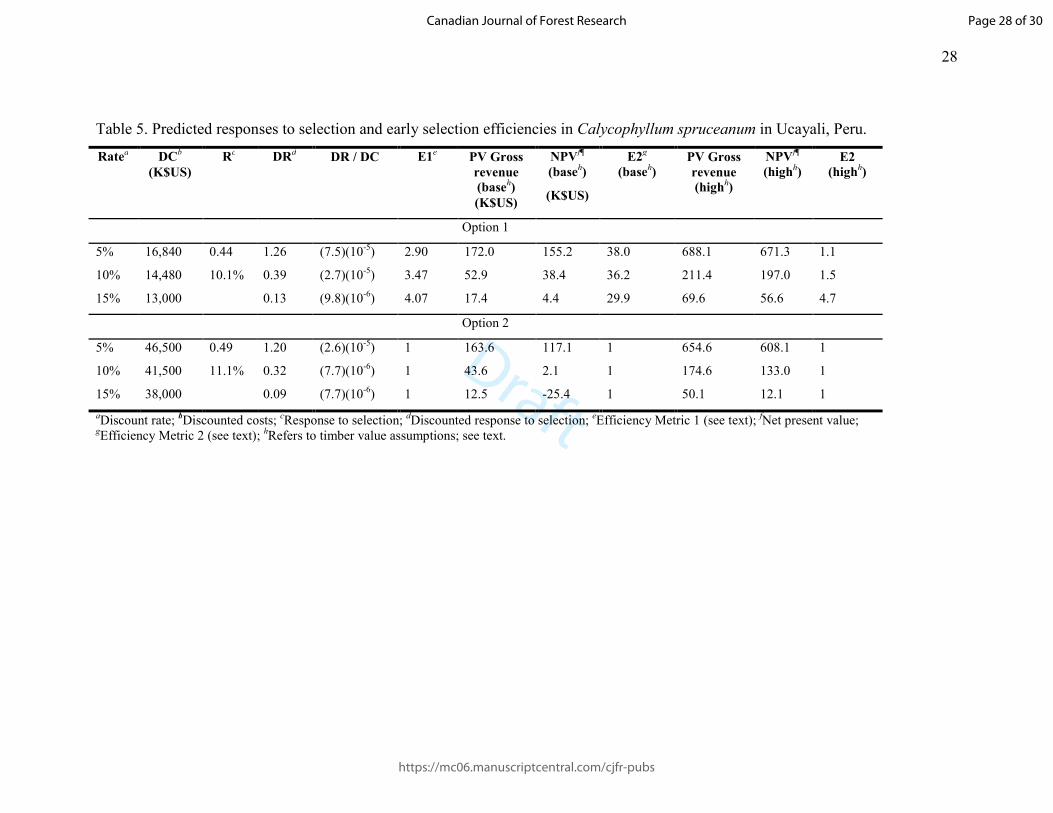
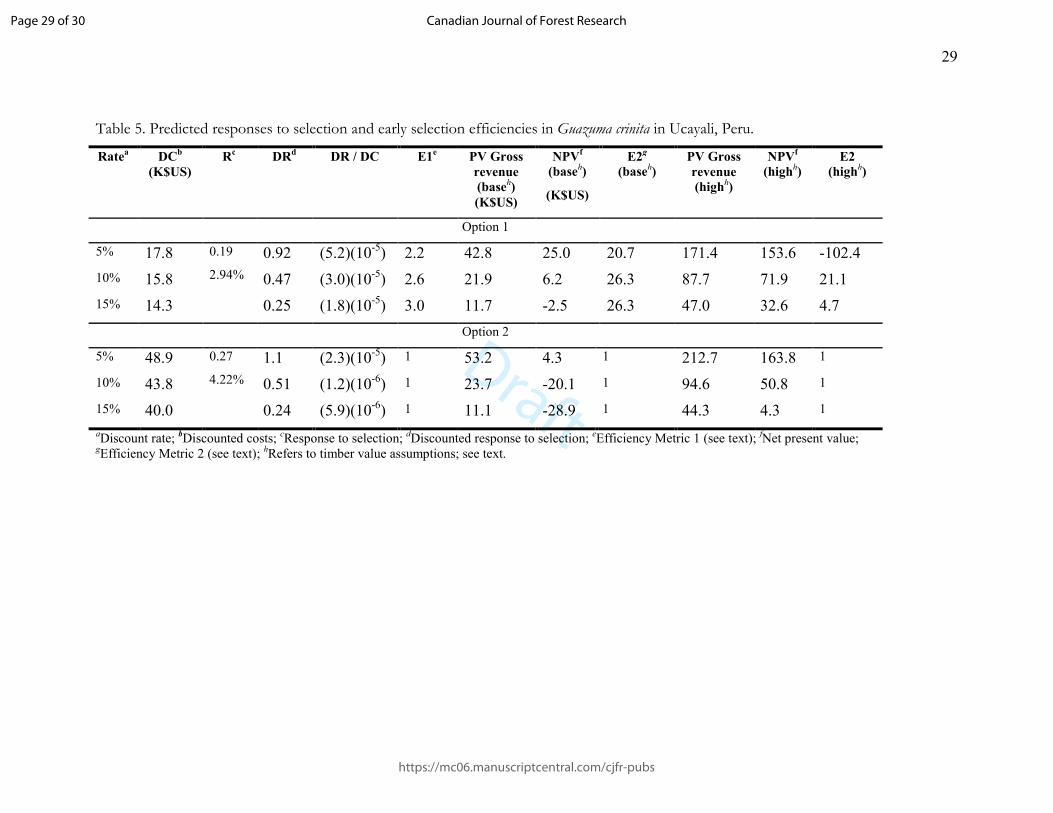
The predicted response to selection in capirona was notably higher than in bolaina (>3 283
times larger for Option 1 and >2 as large for Option 2). However, in bolaina the marginal 284
gain due to deferral of selection (i.e. Option 2) was proportionally larger than in capirona 285
(about 10% more v. about 43% more). 286
As is axiomatic, discounted response to selection was inversely proportional to the 287
discount rate: for capirona, about nine times greater at 5% than at 15% for Option 1 and 288
about 12 times greater at 5% than at 15% for Option 2. For bolaina, it was about three 289
Page 14 of 30
https://mc06.manuscriptcentral.com/cjfr-pubs
Canadian Journal of Forest Research

Draft
15
times greater for Option 1 and about four times greater for Option 2 (5% v. 15%). 290
Discounted response in capirona was lower than discounted response in bolaina except at 291
5% discount rate. For capirona, discounted response was higher for Option 1, whereas for 292
bolaina it was higher for Option 2, except at 15% discount rate. 293
Selection efficiency (E1) 294
For both species, as is axiomatic, discounted genetic gain per unit of present value of 295
costs was inversely proportional to the discount rate for Option 1 and Option 2. For both 296
species, efficiency metric E1 was always >1 (that is, early selection was always more 297
efficient) and was higher at higher discount rates. As measured by E1, Option 1 was more 298
efficient in capirona than in bolaina at all discount rates; in both species, E1 at 15% 299
discount rate was about 40% higher than at 5% discount rate. 300
Gross and net present values and selection efficiencies (E2) 301
Gross present values from selection, axiomatically higher at lower discount rates, were 302
notably higher in capirona than bolaina. The difference in values at higher and lower 303
discount rates was notably greater in capirona than bolaina (>ten times v. four to five 304
times). In capirona, gross present values were always higher for Option 1, whereas for 305
bolaina they were higher for Option 2, except at 15%. Net present values were also 306
notably higher in capirona than bolaina and were higher at lower discount rates. 307
For both species, selection efficiency as measured by metric E2 was higher for Option 1, 308
with broadly similar values for the two species. For capirona, E2 was higher at lower 309
discount rates, whereas for bolaina E2 was lowest at 5%. Under the high timber value 310
scenarios, Option 1 was still more efficient, except for bolaina at 5%. 311
Discussion 312
Page 15 of 30
https://mc06.manuscriptcentral.com/cjfr-pubs
Canadian Journal of Forest Research

Draft
16
We found that for both species, in general, early selection (Option 1) is more attractive 313
than deferred selection. For capirona, an analysis based on discounted returns alone (but 314
not on gain year-1) would have reached this same conclusion. However, for bolaina, 315
Option 2 would have appeared to be more attractive had costs not been considered. We 316
therefore conclude that, in evaluating the efficient of early selection, analyses that fail to 317
consider direct costs (and not just the cost of capital) may produce erroneous results. 318
At the base timber values, efficiency as measured by E2 shows the same trends as for E1. 319
Under the higher timber value assumption, the same result holds for capirona – early 320
selection remains more efficient, due to the small difference in response between Option 321
1 and Option 2 and the strong discounting effect produced by the longer discounting 322
period (a consequence of the longer rotation). In the case of bolaina, however, the 323
doubling of the timber price, coupled with the larger difference in gain between Option 1 324
and Option 2, is enough to offset the higher cost of Option 2—but only at the lowest 325
discount rate. This merely underscores the point that results of such an analysis will 326
depend on the specifics of each situation. The same applies to other possible scenarios 327
regarding the magnitude of genetic parameters, as these affect revenues in the same way 328
as do changes in price assumptions. 329
In spite of this specificity, some general points—in addition to the importance of taking 330
costs into account—may be made. 331
First, the time of decision is clearly fundamental, as this has a major effect on the cost of 332
deferring selection. In the present case, early selection avoids substantial trial 333
maintenance and thinning costs. It is possible to envisage other situations in which costs 334
of earlier and later selection will be more similar: for example, a comparison between 335
Page 16 of 30
https://mc06.manuscriptcentral.com/cjfr-pubs
Canadian Journal of Forest Research

Draft
17
selection following first thinning and 'site capture' versus later selection closer to final 336
rotation age. Under such circumstances, future costs would be more similar and the 337
returns component of the efficiency metrics E1 and E2 may exert a stronger influence 338
than the costs component. However, this would depend also on the relative values of the 339
genetic parameters at the two ages. 340
Second, early selection is likely to be more attractive in the private sector, where higher, 341
market rates of interest apply, rather than in development-oriented activities where lower, 342
social discount rates may apply. For both sectors, other things being equal, early selection 343
will be more attractive for higher-value precious timber than for 'fastwood', because of 344
the longer rotations. As seen in the case of the higher-value timber price scenario with 345
bolaina, higher prices, value-adding, or larger-scale planting programs may all act to 346
make deferral of selection the preferred option, particularly at lower interest rates 347
applicable to development-oriented activities. However, higher degrees of value-adding 348
and larger-scale planting may be less common in the case of such activities. 349
Finally, such point-in-time analyses should not be confused with an overall financial 350
analysis of a given breeding program. However, the parameters that affect relative 351
advantages of different selection strategies, including values of genetic correlations 352
(Lambeth et al. 1980; Matheson et al. 1994) and costs, can be estimated or modeled and 353
taken into account in the initial design phase. This is important as the design, and 354
therefore the costs, of short-term genetic tests aimed at informing juvenile selection may 355
not be the same as the design of longer-term tests. 356
Acknowledgments 357
Page 17 of 30
https://mc06.manuscriptcentral.com/cjfr-pubs
Canadian Journal of Forest Research
Draft
18
We gratefully acknowledge the support of CGIAR Fund Donors to the CGIAR Research 358
Program on Forests, Trees and Agroforestry (FTA) and to the CGIAR Genebank 359
Platform, under which programs the research reported here was carried out. For a full list 360
of CGIAR Fund Donors, see: http://www.cgiar.org/our-funders/. In addition we thank the 361
following agencies for their support in implementation of the trials described: the 362
Interamerican Development Bank, the Government of Spain, the Governments of 363
Netherlands and Norway as part of the CGIAR Global Initiative for Alternatives to Slash 364
and Burn, the Department for International Development of the United Kingdom, and 365
Winrock International as part of the USAID Alternative Development Program. The 366
logistical support of INIA (National Institute for Agricultural Innovation, Peru) is also 367
gratefully acknowledged.368
Page 18 of 30
https://mc06.manuscriptcentral.com/cjfr-pubs
Canadian Journal of Forest Research

Draft
19
References
Balocchi, C.E., Bridgwater F.E., and Bryant R. 1994. Selection efficiency in a
nonselected population of loblolly pine. For. Sci. 40: 452–473
Cheverud, J.M. 1988. A comparison of genetic and phenotypic correlations. Evolution
42(5): 958-968.
Cornelius, J.P. 1994. Heritabilities and additive genetic coefficients of variation in forest
trees. Can. J. For. Res. 24: 372-379.
Cornelius, J.P. 1996. The effectiveness of plus-tree selection for yield. For. Ecol.
Manage. 67: 22-34.
Cornelius, J.P., and Morgenstern, E.K. 1986 An economic analysis of black spruce
breeding in New Brunswick. Can. J. For. Res. 16(3): 476-483.
Cornelius, J.P., C. Sotelo Montes, J. Ugarte, and Weber, J.C. 2011. The effectiveness of
phenotypic selection in natural populations: a case study from the Peruvian Amazon.
Silvae Genet. 60(5): 205-209
Dieters, M.J., White, T.L., Littell, R.C., Hodge, G.R. 1995. Application of approximate
variance of variance components and their ratios in genetic tests. Theor Appl Genet
(1995) 91:15-24
Falconer, D.S. and Mackay, T.F.C. 1996. Introduction to quantitative genetics. 4th ed.
Longman, Harlow, UK.
Grandtner, M.M., and Chevrette, J., 2014. Dictionary of trees Vol. 2. South America
Nomenclature, Taxonomy and Ecology. 1st ed. Elsevier, London, UK.
Page 19 of 30
https://mc06.manuscriptcentral.com/cjfr-pubs
Canadian Journal of Forest Research

Draft
20
Isik, K., Kleinschmit, J., and Steiner, W. 2010. Age-age correlations and early selection
for height in a clonal genetic test for Norway spruce. For. Sci. 56(2): 212-221.
Lambeth, CC. 1980. Juvenile-mature correlations in Pinaceae and implications for early
selection. For. Sci. 26(4): 571-580.
Leakey, R.R.B., Weber, J.C., Page, T., Cornelius, J.P., Akinnifesi, F.K., Roshetko, J.,
Tchoundjeu, Z., and Jamnadass, R. 2012. Tree domestication in agroforestry: progress in
the second decade (2003-2012). In Agroforestry - the future of global land use (Advances
in Agroforestry 9). Edited by P.K.R. Nair and D. Garrity D. Springer, Dordrecht,
Germany, pp. 145-173.
Matheson, A.C., Spencer, D.J., and Magnussen, D. 1994. Optimum selection age for
selection in Pinus radiata using basal area under bark for age:age correlations. Silvae
Genet. 43(5-6): 352-357.
McKeand, S.E. 1988. Optimum age for family selection for growth in genetic tests of
loblolly pine. For. Sci. 34:400–411.
Osorio, L.F., White, T.L., and Huber, D.A. 2003. Age--age and trait-trait correlations for
Eucalyptus grandis Hill ex maiden and their implications for optimal selection age and
design of clonal trials. Theor. Appl. Genet. 106:735-743.
Putzel, L., Cronkleton, P., Larson, A.M., Pinedo-Vasquez, M., Putzel, L., Salazar, O., and
Sears, R. 2013. Peruvian smallholder production and marketing of bolaina (Guazuma
crinita), a fast-growing Amazonian timber species: Call for a pro-livelihoods policy
environment. CIFOR Brief Vol 23. Bogor, Indonesia, CIFOR
(DOI: 10.17528/cifor/004257) [accessed 11th October 2017]
Page 20 of 30
https://mc06.manuscriptcentral.com/cjfr-pubs
Canadian Journal of Forest Research
Draft
21
Reynel, C., Pennington, T.D., Pennington, R.T., Flores, C., and Daza, A. 2003. Arboles
útiles de la Amazonia peruana y sus usos. 1st ed. Universidad Nacional Agraria La
Molina, Lima, Peru.
Rochon, C., Margolis, H.A., and Weber, J.C. 2007 Genetic variation in growth of
Guazuma crinita (Mart.) trees at an early age in the Peruvian Amazon. For. Ecol.
Manage. 243(2-3): 291-298.
Roff, D.A. 1995 The estimation of genetic correlations from phenotypic correlations: a
test of Cheverud's conjecture. Heredity 74: 481-490.
Sears, R.R., and Pinedo-Vásquez, M. 2014. From fallow timber to urban housing: family
forestry and tablilla production in Peru. In The Social Lives of Forests: Past, present, and
future of woodland resurgence. Edited by S.B. Hecht, K.D. Morrison, and C. Padoch C.
Chicago University Press, Chicago. pp. 336-347.
Sears, R., Cronkleton, P., Pérez-Ojeda del Arco, M., Robiglio, V., Putzel, L., and
Cornelius, J. 2014. Producción de madera en sistemas agroforestales de pequeños
productores. CIFOR, Bogor, Center for International Forestry Research (CIFOR). Policy
brief, 8pp. DOI: 10.17528/cifor/005103 [accessed 9th September 2017]
Searle, S. 1961 Phenotypic, genetic and environmental correlations. Biometrics 17: 474-
480.
Sokal, R.F. and Rohlf, F.J. 1995. Biometry. 3rd ed. Freeman, New York, USA.
Sotelo Montes, C., and Weber, J.C. 1997. Priorización de especies arbóreas para sistemas
agroforestales en la selva baja del Perú. Agroforestería en las Américas 4: 12-17
Page 21 of 30
https://mc06.manuscriptcentral.com/cjfr-pubs
Canadian Journal of Forest Research

Draft
22
Sotelo Montes, C., Vidaurre, H., and Weber, J.C. 2003. Variation in stem-growth and
branch-wood traits among provenances of Calycophyllum spruceanum Benth. from the
Peruvian Amazon. New Forests 26:1–16
Sotelo Montes, C., Hernández, R., Beaulieu, J., and Weber, J.C. 2006. Genetic variation
and correlations between growth and wood density of Calycophyllum spruceanum Benth.
at an early age in the Peruvian Amazon. Silvae Genet. 55:217-228
Waitt, D.E., and Levin, D.A. 1998. Genetic and phenotypic correlations in plants: a
botanical test of Cheverud's conjecture. Heredity 80:310-319.
Weber, J.C., Sotelo Montes, C., Ugarte, J., and Simons, A.J. 2009. Phenotypic selection
of Calycophyllum spruceanum on farms in the Peruvian Amazon: evaluating a low-
intensity selection strategy. Silvae Genet. 58:172-179
Weber, J.C., Sotelo Montes, C., Cornelius, J.P., and Ugarte, J. 2011. Genetic variation in
tree growth, stem form and mortality of Guazuma crinita in slower- and faster-growing
plantations in the Peruvian Amazon. Silvae Genet. 60:70-78.
White T.L., Adams, W.T., and Neale, D.B. 2007. Forest Genetics. 1st ed. CABI,
Cambridge MA, USA.
White, T.L., and Hodge, G.R. 1992. Test designs and optimal age for parental selection in
an advanced-generation test. Silvae Genet. 41:293–302.
Wightman, K.E., Cornelius, J.P., and Ugarte-Guerra, L.J. 2006. ¡Plantemos madera¡
Manual sobre el establecimiento, manejo y aprovechamiento de plantaciones maderables
para productores de la Amazonía peruana. Lima, Peru. World Agroforestry Centre
Page 22 of 30
https://mc06.manuscriptcentral.com/cjfr-pubs
Canadian Journal of Forest Research

Draft
23
(ICRAF), 193pp. Available from http://www.icrafamericalatina.org/nuestros-
productos/plantemos-madera.html [accessed 11th October 2017]
Page 23 of 30
https://mc06.manuscriptcentral.com/cjfr-pubs
Canadian Journal of Forest Research

Draft
24
Table 1. Selection options analyzed in the present study (see Appendix, Table 1A for details)
Option and description
Calycophyllum spruceanum
Guazuma crinita OPTION 1. EARLY SELECTION
Number of families in tests: 200
Selection criterion: Best 20 families in field trial after 13 months (selection intensity = 1.7422)
Best 20 families in field trial after 17 months (selection intensity = 1.7422)
Source of improved seed: Seed orchard of the 20 families, established following field test analysis in Year 3
Start of seed production: Year 8 Year 5
First harvest of plantations from improved seed:
Year 24 Year 12
Seed orchard life: 10 years
OPTION 2. LATER FIELD SELECTION
Number of families in tests 200
Selection criterion Best 20 families in field trial after 49 months (selection intensity = 1.7422)
Best 20 families in field trial after 53 months (selection intensity = 1.7422)
Source of improved seed Seed orchard of the 20 families, established in Year 6 following test analysis
Start of seed production Year 11 Year 8
First harvest of plantations from improved seed
= Commencement of seed production + rotation length (16 years) = 27.41 years after first seed collections from founding mother-
trees (see Appendix 1)
= Commencement of seed production + rotation length (8 years) = 16.08 years after first seed collections from founding mother-trees (see
Appendix 1)
Seed orchard life 10 years 10 years
Page 24 of 30
https://mc06.manuscriptcentral.com/cjfr-pubs
Canadian Journal of Forest Research

Draft
25
Table 2. Unit costs of field and nursery activities (excluding salary costs)
Activity Unit costa,b
Mother-tree location and collection $104 tree-1
Plant production $0.33 seedling-1
Measurement in nursery $0.03 seedling-1
Selection and transportation of plants $73 test-1 or orchard-1
Site preparation and planting $656 test-1 or orchard-1
Seed collection in orchards $500 collection-1
Test and orchard weeding $114 test-1 occasion-1
Test thinning $192 test-1
Measurement in field $200 test-1
a2015 Peruvian new soles (PEN), converted to United States dollars (USD) at PEN 3.00 USD-1; bRounded to nearest USD
Page 25 of 30
https://mc06.manuscriptcentral.com/cjfr-pubs
Canadian Journal of Forest Research
Draft
26
Table 3. Family heritabilities for height and correlations between least-squares means in progeny tests of Calycophyllum spruceanum and Guazuma crinita in the Peruvian Amazon used for estimations of response to selection
Parameter Calycophyllum spruceanum Guazuma crinita
H17a H53 H13 H49
��� (family variance
component)
0.110 0.119 0.042 0.054
��� (error variance component)
0.662 0.825 0.827 0.899
ℎ�� (family heritability)b
(S.E.)
0.71 (0.101) 0.67 (0.102) 0.43 (0.103) 0.46 (0.112)
��(standard deviation of family means)
0.42 0.34
Correlation with H17 or H13 (95% C.L.)
0.88 (0.84-0.91) 0.72 (0.65-0.78)
aHeight at 17months; b��� D��� + ��� �⁄ EF ,where � =number of blocks
Page 26 of 30
https://mc06.manuscriptcentral.com/cjfr-pubs
Canadian Journal of Forest Research
Draft
27
Table 4. Present value of costs (thousands of US$) of the two selection options, excluding salary costs.
Source of costs Option 1: (Selection
at 13/17 months)
Option 2: (Selection at 49/53
months)
Discount rate
5% 10% 15% 5% 10% 15%
Calycophyllum spruceanum
Plant production 0.30 0.30 0.30 0.38 0.33 0.29
Test thinning n.a. n.a. n.a. 2.87 2.86 2.86
Test measurement 3.00 3.00 3.00 2.59 2.26 1.98
Site preparation and planting (orchards and tests) 0.72 0.71 0.71 0.62 0.54 0.46
Seed collection (orchard) 3.14 2.04 1.38 2.71 1.54 0.91
Maintenance (orchards and tests) 1.26 1.18 1.10 14.1 13.24 12.53
Totals 8.42 7.24 6.49 23.25 20.76 19.02
Guazuma crinita
Plant production 0.30 0.29 0.29 0.26 0.22 0.19
Test thinning n.a. n.a. n.a. 2.82 2.77 2.71
Test measurement 3.00 3.00 3.00 3.89 3.38 2.96
Site preparation and planting (orchards and tests) 0.72 0.71 0.70 0.62 0.54 0.46
Seed collection (orchard) 3.63 2.73 2.11 3.14 2.04 1.38
Maintenance (orchards and tests) 1.24 1.15 1.06 13.71 12.95 12.29
Totals 8.90 7.88 7.16 24.43 21.90 20.00
Page 27 of 30
https://mc06.manuscriptcentral.com/cjfr-pubs
Canadian Journal of Forest Research
Draft
28
Table 5. Predicted responses to selection and early selection efficiencies in Calycophyllum spruceanum in Ucayali, Peru.
Ratea DC
b
(K$US)
Rc DR
d DR / DC E1
e PV Gross
revenue
(baseh)
(K$US)
NPVf
(baseh)
(K$US)
E2g
(baseh)
PV Gross
revenue
(highh)
NPVf
(highh)
E2
(highh)
Option 1
5% 16,840 0.44
10.1%
1.26 (7.5)(10-5) 2.90 172.0 155.2 38.0 688.1 671.3 1.1
10% 14,480 0.39 (2.7)(10-5) 3.47 52.9 38.4 36.2 211.4 197.0 1.5
15% 13,000 0.13 (9.8)(10-6) 4.07 17.4 4.4 29.9 69.6 56.6 4.7
Option 2
5% 46,500 0.49
11.1%
1.20 (2.6)(10-5) 1 163.6 117.1 1 654.6 608.1 1
10% 41,500 0.32 (7.7)(10-6) 1 43.6 2.1 1 174.6 133.0 1
15% 38,000 0.09 (7.7)(10-6) 1 12.5 -25.4 1 50.1 12.1 1
aDiscount rate; bDiscounted costs; cResponse to selection; dDiscounted response to selection; eEfficiency Metric 1 (see text); fNet present value; gEfficiency Metric 2 (see text); hRefers to timber value assumptions; see text.
Page 28 of 30
https://mc06.manuscriptcentral.com/cjfr-pubs
Canadian Journal of Forest Research
Draft
29
Table 5. Predicted responses to selection and early selection efficiencies in Guazuma crinita in Ucayali, Peru.
Ratea DC
b
(K$US)
Rc DR
d DR / DC E1
e PV Gross
revenue
(baseh)
(K$US)
NPVf
(baseh)
(K$US)
E2g
(baseh)
PV Gross
revenue
(highh)
NPVf
(highh)
E2
(highh)
Option 1
5% 17.8 0.19
2.94%
0.92 (5.2)(10-5) 2.2 42.8 25.0 20.7 171.4 153.6 -102.4
10% 15.8 0.47 (3.0)(10-5) 2.6 21.9 6.2 26.3 87.7 71.9 21.1
15% 14.3 0.25 (1.8)(10-5) 3.0 11.7 -2.5 26.3 47.0 32.6 4.7
Option 2
5% 48.9 0.27
4.22%
1.1 (2.3)(10-5) 1 53.2 4.3 1 212.7 163.8 1
10% 43.8 0.51 (1.2)(10-6) 1 23.7 -20.1 1 94.6 50.8 1
15% 40.0 0.24 (5.9)(10-6) 1 11.1 -28.9 1 44.3 4.3 1
aDiscount rate; bDiscounted costs; cResponse to selection; dDiscounted response to selection; eEfficiency Metric 1 (see text); fNet present value; gEfficiency Metric 2 (see text); hRefers to timber value assumptions; see text.
Page 29 of 30
https://mc06.manuscriptcentral.com/cjfr-pubs
Canadian Journal of Forest Research

Draft
30
Table A1. Timing of program activities for the two selection options, by species
Event Timing (years after discounting baseline of 0.0 years)
Common to both options and species
Mother-tree selection, seed collection start 0.0 years
Seed collection completed 1.25 years
Calycophyllum spruceanum, option 1
Trial site preparation completed 1.75 years
Trial establishment completed 1.75 years
Measurement and analysis completed 3.17 years
Seedling seed orchard established 3.42 years
Annual seed harvests 8.42 years to 17.42 years
Improved plantations established 8.67 years to 17.67 years
Improved plantations harvested 24.67 years to 34.67 years
Calycophyllum spruceanum, option 2
Trial site preparation completed 1. 75 years
Trial establishment completed 1.75 years
Trial thinning completed 3.25 years
Measurement and analysis completed 6.16 years
Seedling seed orchard established 6.41 years
Annual seed harvests 11.41 years to 20.41 years
Improved plantations established 11.66 years to 20.66 years
Improved plantations harvested 27.66 years to 34.66 years
Guazuma crinita, option 1
Trial site preparation completed 1.75 years
Trial establishment completed 1.75 years
Measurement, analysis completed 2.83 years
Seedling seed orchard established 3.08 years
Annual seed harvests 6.08 years to 14.08 years
Improved plantations established 6.33 years to 14.33 years
Improved plantations harvested 13.33 years to 20.33 years
Guazuma crinita, option 2
Trial site preparation completed 1.75 years
Trial establishment completed 1.75 years
Trial thinning completed 3.25 years
Measurement and analysis completed 5.83 years
Seedling seed orchard established 6.08 years
Annual seed harvests 8.08 years to 17.08 years
Improved plantations established 8.33 years to 17.33 years
Page 30 of 30
https://mc06.manuscriptcentral.com/cjfr-pubs
Canadian Journal of Forest Research