Embed Size (px)
Citation preview

DRAFT2016Transportation
DevelopmentImpactFeeStudy
Preparedfor:
CityofBoulder,Colorado
April4,2016
4701SangamoreRoad,SuiteS240Bethesda,MD301.320.6900
www.tischlerbise.com
TABLEOFCONTENTSEXECUTIVESUMMARY.........................................................................................................................1CURRENTTRANSPORTATIONDET...................................................................................................................1
Figure1:TransportationDETRatesCurrentlyCollected.....................................................................2Figure2:MaximumVoter-ApprovedDETRates.................................................................................2
GENERALIMPACTFEEMETHODS....................................................................................................................2CONCLUSIONS.............................................................................................................................................4PROPOSED2016TRANSPORTATIONDEVELOPMENTIMPACTFEE.........................................................................4
Figure3:ProposedTransportationDIFMethodsandCostComponents............................................4Figure4:Proposed2016TransportationDIFSchedule.......................................................................5
MULTIMODALTRANSPORTATIONDIF..................................................................................................6FigureT1:DIFCalculationFlowChart.................................................................................................6
GROWTHSHAREOFFUTURETRANSPORTATIONENHANCEMENTS.........................................................................7FigureT2:PersonTripsToandFromBoulder.....................................................................................7
CAPITALIMPROVEMENTSPLANFORTRANSPORTATIONFACILITIES........................................................................7FigureT3:GrowthCostofTransportationEnhancements..................................................................9
COSTALLOCATIONFORBUSBIKEWALKFACILITIES..........................................................................................10FigureT4:FunctionalPopulation......................................................................................................11FigureT5:BusBikeWalkImprovementsAllocatedtoPopulation&Jobs.........................................12
VEHICLEMILESOFTRAVEL...........................................................................................................................12VehicularTripGenerationRates........................................................................................................13AdjustmentsforCommutingPatternsandPass-ByTrips..................................................................13TripLengthWeightingFactorbyTypeofLandUse...........................................................................13FigureT6:AverageTripLengthbyTripPurposeinBoulder..............................................................14
DEVELOPMENTPROTOTYPESANDPROJECTEDVMT.........................................................................................15FigureT7:ProjectedVMTIncreasetoDevelopmentwithinBoulder................................................15
COSTALLOCATIONFORSTREETIMPROVEMENTS..............................................................................................15FigureT8:CostofStreetImprovementsAllocatedbyVMT..............................................................16
REVENUECREDITEVALUATION.....................................................................................................................17FUNDINGSTRATEGYFORTRANSPORTATIONIMPROVEMENTS.............................................................................17
FigureT9:ProjectedTransportationDIFRevenue............................................................................17APPENDIXA:LANDUSEASSUMPTIONSRELATEDTOTRANSPORTATION...........................................18CUSTOMTRIPGENERATIONRATESBYDWELLINGSIZE......................................................................................18
CityofBoulderControlTotals............................................................................................................18FigureA1:Year-RoundPersonsperUnitbyTypeofHousing...........................................................18FigureA2:VehiclesAvailableperHousingUnit................................................................................19CustomizedTripRatesbyDwellingSizeandType.............................................................................19FigureA3:PersonsandAWVTEbyBedroomRangeandHouseType...............................................20TripGenerationbyDwellingSize.......................................................................................................20FigureA4:VehicleTripsbyDwellingSize..........................................................................................21

4/4/16DRAFTTransportationDevelopmentImpactFeeStudy Boulder,Colorado
EXECUTIVESUMMARY
Aspartofthe2016transportationworkscope,TischlerBisewillpreparethreeproductsfortheCityofBoulder. This document focuses on the capital cost of transportation improvements needed toaccommodate new development assuming more rigorous Development Impact Fee (DIF) legalrequirements.AsecondworkproductwillprovideaDevelopmentExciseTax(DET)studyforabroadersetofgrowth-relatedtransportation improvements. The thirdworkproductwill focusonoperationalcostsandon-goingmaintenanceofBoulder’smultimodaltransportationsystem.
Asarevenueraisingmechanism,anexcisetaxhaslessrestrictivelegalconstraintsthananimpactfee.The latter isa formof landuse regulation, imposedunder theCity’spolicepower, for thepurposeofhealth,safety,andwelfare. InColorado, localgovernmentsmustestablishanimpactfeeata levelnogreater than necessary to defray projected impacts caused by, and directly related to, proposeddevelopment. Also, impact fees may only be used for capital facilities, excluding replacement ofinfrastructureandcorrectingexistingdeficiencies[seeCRS29-20-104.5].
This report assumes compliance with Colorado’s impact fee enabling legislation and applicable legalprecedents.Theproposed2016TransportationDIFscheduleisproportionateandreasonablyrelatedtothegrowthcostofcapitalfacilitiesneededtoservenewdevelopment[seeCRS29-20-104.5(1)and(2)].Specific costs have been identified using local data and current dollars. With input from City staff,TischlerBise determined demand indicators for transportation capacity and calculated proportionatesharefactorstoallocatecostsbytypeofdevelopment.TransportationDIFmethodologiesalsoidentifytheextent towhichnewdevelopment isentitled tovarious typesofcredits toavoidpotentialdoublepaymentofgrowth-relatedcapitalimprovements.
CURRENTTRANSPORTATIONDET
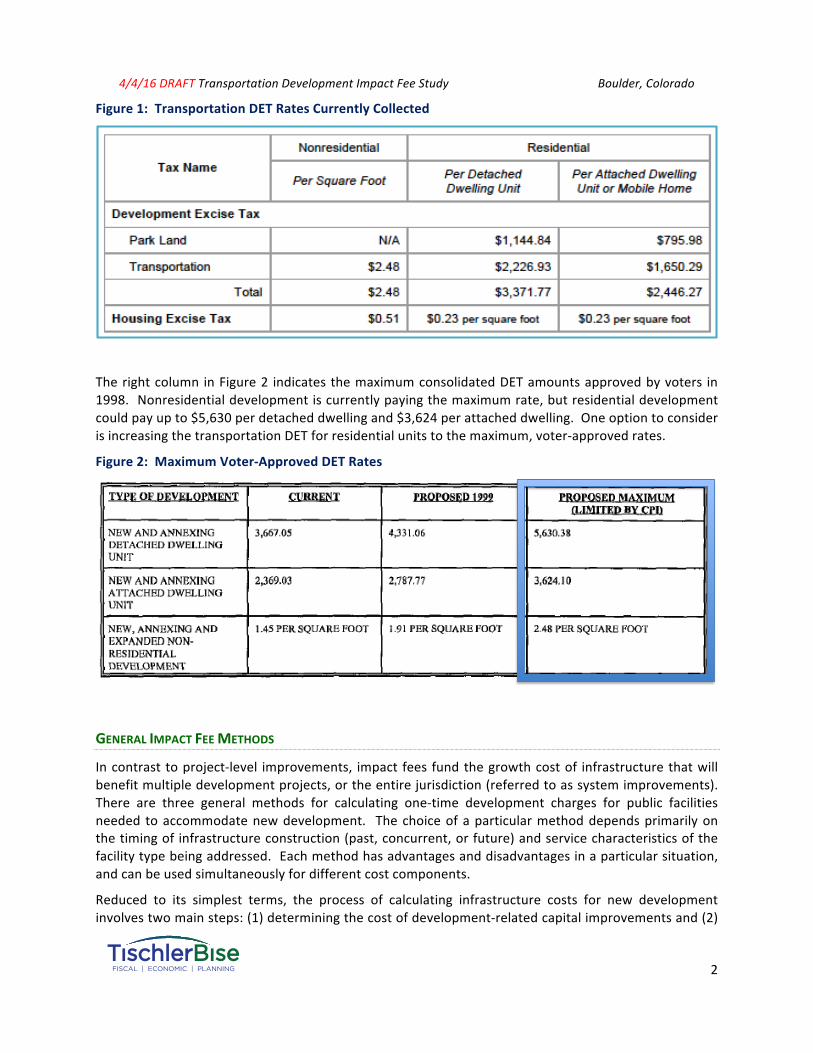
TheCityofBouldercurrentlycollectsaDevelopmentExciseTax(DET),withaportionofthefundsusedfor transportation capital improvements. In 1998, voters approved a maximum consolidated DETschedulethatwassignificantlylessthantheproposedtransportationDETschedulesupportedbyastudycompleted in1996. Boulder’sDET isaone-timerevenue imposedonnewconstruction. Asshown inFigure 1, the City of Boulder currently collects a Transportation DET of $2.48 per square foot ofnonresidential floorareaandaTransportationDETforeachadditionaldwelling(approximately$2,227per detached and $1,650 per attached unit). Applying these rates to the projected increase indevelopmentwithinBoulderoverthenexttenyears(seeLandUseAssumptionsbyTischlerBise)wouldyieldapproximately$11.5millioninTransportationDETrevenue,withresidentialunitscontributing43%ofthetenyeartotaland57%fromnonresidentialdevelopment.
4/4/16DRAFTTransportationDevelopmentImpactFeeStudy Boulder,Colorado
2
Figure1:TransportationDETRatesCurrentlyCollected
TherightcolumninFigure2 indicatesthemaximumconsolidatedDETamountsapprovedbyvoters in1998.Nonresidentialdevelopmentiscurrentlypayingthemaximumrate,butresidentialdevelopmentcouldpayupto$5,630perdetacheddwellingand$3,624perattacheddwelling.OneoptiontoconsiderisincreasingthetransportationDETforresidentialunitstothemaximum,voter-approvedrates.
Figure2:MaximumVoter-ApprovedDETRates
GENERALIMPACTFEEMETHODS
Incontrasttoproject-level improvements, impact fees fundthegrowthcostof infrastructurethatwillbenefitmultipledevelopmentprojects,ortheentirejurisdiction(referredtoassystemimprovements).There are three general methods for calculating one-time development charges for public facilitiesneeded toaccommodatenewdevelopment. Thechoiceofaparticularmethoddependsprimarilyonthetimingofinfrastructureconstruction(past,concurrent,orfuture)andservicecharacteristicsofthefacilitytypebeingaddressed.Eachmethodhasadvantagesanddisadvantagesinaparticularsituation,andcanbeusedsimultaneouslyfordifferentcostcomponents.
Reduced to its simplest terms, the process of calculating infrastructure costs for new developmentinvolvestwomainsteps:(1)determiningthecostofdevelopment-relatedcapitalimprovementsand(2)

4/4/16DRAFTTransportationDevelopmentImpactFeeStudy Boulder,Colorado
3
allocating those costs equitably to various types of development. In practice, though, impact feecalculations can become quite complicated because of the many variables involved in defining therelationshipbetweendevelopmentandtheneedfor facilitieswithinthedesignatedservicearea. ThefollowingparagraphsdiscussthreebasicmethodsandhowthosemethodscanbeappliedinBoulder.
CostRecovery(pastimprovements)Therationaleforrecoupment,oftencalledcostrecovery,isthatnewdevelopmentispayingforitsshareoftheusefullifeandremainingcapacityoffacilitiesalreadybuilt,orlandalreadypurchased,fromwhichnewgrowthwillbenefit.Thismethodologyisoftenusedforutilitysystemsthatmustprovideadequatecapacitybeforenewdevelopmentcantakeplace.
IncrementalExpansion(concurrentimprovements)Theincrementalexpansionmethoddocumentscurrentlevel-of-service(LOS)standardsforeachtypeofpublicfacility,usingbothquantitativeandqualitativemeasures. Thisapproachensuresthatthereareno existing infrastructure deficiencies or surplus capacity in infrastructure. Newdevelopment is onlypaying its proportionate share for growth-related infrastructure. Revenuewill be used to expand orprovideadditionalfacilities,asneeded,toaccommodatenewdevelopment.Anincrementalexpansioncostmethodisbestsuitedforpublicfacilitiesthatwillbeexpandedinregularincrementtokeeppacewithdevelopment.
Plan-Based(futureimprovements)The plan-basedmethod allocates costs for a specified set of improvements to a specified amount ofdevelopment. Improvementsaretypically identified inacapital improvementsplananddevelopmentpotential is identified by land use assumptions. There are two options for determining the cost perserviceunit:1)totalcostofapublicfacilitycanbedividedbytotalserviceunits(averagecost),or2)thegrowth-share of the public facility cost can be divided by the net increase in service units over theplanningtimeframe(marginalcost).
Credits
Regardlessofthemethodology,aconsiderationof“credits” is integralto legallydefensible impactfeestudies. There are two types of “credits” with specific characteristics, both of which should beaddressedinstudiesandordinances.
• First, a revenue credit might be necessary if there is a double payment situation and otherrevenues are contributing to the capital costs of infrastructure to be funded by DIF revenue.This type of credit is integrated into theDIF calculation, thus reducing the gross amount. Incontrast to some studies that only provide general costs,with credits at the back-end of theanalysis, Boulder’s 2016 transportationDIFupdateuses growth shares toprovide anup-frontreductionintotalcosts. Also,the2016updateprovidesDIFrevenueprojectionstoverifythatnewdevelopmentwill fully fund thegrowth shareof future infrastructurecosts (i.e.,onlyDIFrevenuewillpayforgrowthcosts).
• Second,asite-specificcreditordeveloperreimbursementmightbenecessaryfordedicationoflandorconstructionofsystemimprovementstobefundedbyDIFrevenue.Thistypeofcreditisaddressedintheadministrationandimplementationoftheimpactfeeprogram.

4/4/16DRAFTTransportationDevelopmentImpactFeeStudy Boulder,Colorado
4
CONCLUSIONS
Afterevaluatingthe1996DETstudy,thatemphasizedmovingvehiclesandallocatedcostsaccordingly,TischlerBise concluded the current Transportation DET rate schedule is not proportionate by type ofdevelopmentanddoesnotcomplywithColorado’simpactfeeenablinglegislation.Itisnotpossibletosimply update the 20-year old DET methodology with current data and comply with more rigorousimpactfeestandardsthatwereenactedin2001. Becauselocalgovernmentmustquantifyreasonableimpactscausedby,anddirectlyrelatedto,proposeddevelopment[seeCRS29-20-104.5(1)and(2)],the2016transportationstudyyieldslowerchargesonnewdevelopment.ProposeddollaramountsshowninFigure4areexpectedtoyieldapproximately$9.9millionoverthenexttenyears,whichwillcoverthegrowthcostofplannedtransportationenhancements. Incomparison, thecurrentTransportationDETrate schedule would yield approximately $11.5 million over the next ten years. Also, the currentTransportationDETrateschedulewouldobtainapproximately43%of future revenue fromresidentialdevelopment and 57% from nonresidential development. In contrast, the proposed 2016 DIFmethodology expects to obtain approximately 52% of future Transportation DIF revenue fromresidentialdevelopmentand48%fromnonresidentialdevelopment.TischlerBisealsofindsthecurrentTransportation DET rate schedule to be inconsistent with best practices to ensure impact fees areproportionatetotheneedforcapitalfacilities. Forresidentialdevelopment,TischlerBiserecommendsswitchingfromthecurrentTransportationDETapproach,basedontwohousingtypes,toafeeschedulebased on dwelling size (measured by square feet of finished living space). To be proportionate,transportationimpactfeesshouldalsodifferentiatebytypeofnonresidentialdevelopmentasshowninFigure4.Foreaseofadministrationandcomparison,thetransportationDIFscheduleisconsistentwithBoulder’s2016DIFstudyforallothertypesofinfrastructure.
PROPOSED2016TRANSPORTATIONDEVELOPMENTIMPACTFEE
Figure 3 summarizes the methods and cost components used in Boulder’s 2016 Transportation DIFstudy. Both the DIF and DET studies share the same types of improvements and cost allocationmethods.Thekeydifferencebetweenthetwoisthemagnitudeofcost,withtheDETbasedonamoreextensivesetofgrowth-relatedtransportationimprovements.
Figure3:ProposedTransportationDIFMethodsandCostComponents
TypeofImprovements
CostAllocation ServiceArea Plan-BasedMethod(future)
Walk/Bike/Transit
FunctionalPopulationand
JobsCitywide
Sidewalks,Multi-UsePaths,BikeLanesandBusStops/Pullouts
StreetsVehicleMilesof
TravelCitywide
Arterial/CollectorCapacityandIntersectionImprovements

4/4/16DRAFTTransportationDevelopmentImpactFeeStudy Boulder,Colorado
5
Figure4showstheproposed2016TransportationDIFschedule,alongwithcurrentTransportationDETrates.Forresidentialdevelopment,updatedamountsarebasedonsquarefeetoffinishedlivingspace.Garages,porchesandpatiosareexcludedfromtheDIFassessment.
Fornonresidentialdevelopment,DIFratesarestatedpersquarefootoffloorarea,exceptfor“NursingHome / Assisted Living” (per bed) and “Lodging” (per room). The proposed DIF schedule fornonresidential development is designed to provide a reasonable DIF amount for general types ofdevelopment.Foruniquedevelopments,theCitymayalloworrequireanindependentassessment.
TheproposedtotalDIFisacombinationoftwocostcomponentsanddifferentcostallocationmethods.Thecostof“BusBikeWalk”capitalimprovementswasallocatedtotheincreaseinpopulationandjobswithin Boulder. The cost of street improvements was allocated to the projected increase in vehiclemilesoftravel.Detailsregardingbothcostallocationmethodsareprovidedinthemiddlesectionofthisreport.
Figure4:Proposed2016TransportationDIFSchedule
2016TransportationDIF
DevelopmentUnit
BusBikeWalk
Streets ProposedTransportation
DIF
CurrentTransportation
DET
Increase/Decrease
PercentChange
Residential(bysquarefeetoffinishedlivingspace)800orless DwellingUnit $875 $97 $972 $1,650 -$678 -41%801to1200 DwellingUnit $1,346 $153 $1,499 $1,650 -$151 -9%1201to1600 DwellingUnit $1,638 $188 $1,826 $1,939 -$113 -6%1601to2200 DwellingUnit $1,885 $217 $2,102 $2,227 -$125 -6%2201ormore DwellingUnit $2,117 $245 $2,362 $2,227 $135 6%NonresidentialRetail/Restaurant SquareFoot $1.35 $0.54 $1.89 $2.48 -$0.59 -24%Office SquareFoot $1.94 $0.22 $2.16 $2.48 -$0.32 -13%LightIndustrial SquareFoot $1.25 $0.14 $1.39 $2.48 -$1.09 -44%Warehousing SquareFoot $0.50 $0.07 $0.57 $2.48 -$1.91 -77%Institutional SquareFoot $0.44 $0.19 $0.63 $2.48 -$1.85 -75%Hospital SquareFoot $1.58 $0.27 $1.85 $2.48 -$0.63 -25%NursingHome/AssistedLiving
Bed $453 $55 $508
Lodging Room $307 $165 $472

4/4/16DRAFTTransportationDevelopmentImpactFeeStudy Boulder,Colorado
6
MULTIMODALTRANSPORTATIONDIF
The2016TransportationDIFstudyusesaplan-basedmethodologythat includes improvements forallmodesoftravel.FigureT1providesanoverviewofthemethodology.Thisstudydocumentsthegeneralcost allocation between residential and nonresidential development, including detailed calculationsusedtoderivespecificDIFamountsbydwellingsizeandtypeofnonresidentialdevelopment.Fromtheuniverse of all projects in Boulder’s Capital Improvement Plan (CIP), which is based on theTransportationMasterPlan(TMP),staffandconsultantsidentifiedtransportationimprovementsneededto accommodate new development over ten years. This study refers to these projects as“enhancements”todifferentiatethemfrom“maintenance”projectsthatarenoteligibleforimpactfeefunding. Also,eachprojectwasevaluated toquantify the reasonable impactscausedby,anddirectlyrelated to, proposed development, as required by Colorado’s impact fee enabling legislation. These“growthcosts”willbefundedbyDIFrevenue,withnon-growthcostsfundedbyotherrevenues. Staffdeterminedthat89%ofenhancementprojectsareforBusBikeWalkfacilities(primarilymovingpeople),withtheremaining11%forstreetimprovements(i.e.primarilymovingvehicles).ThegrowthcostofBusBike Walk improvements was allocated to residential and non-residential development based onfunctionalpopulation(describedfurtherbelow).ThegrowthcostofstreetimprovementswasallocatedaccordingtoestimatedVehicleMilesofTravel(VMT)forgeneraltypesofdevelopment.
FigureT1:DIFCalculationFlowChart
TransportalonCIPforEnhancements(excludesmaintenancecosts)
GrowthCost(fundedbyTransportalonDIF
89%BusBikeWalkImprovements
FunclonalPopulalonCostAllocalon
60%Residenlal
40%Nonresidenlal
11%StreetImprovements
VMTCostAllocalon
44%Residenlal
56%Nonresidenlal
Non-growthCost(paidbyotherrevenues)

4/4/16DRAFTTransportationDevelopmentImpactFeeStudy Boulder,Colorado
7
GROWTHSHAREOFFUTURETRANSPORTATIONENHANCEMENTS
The9.9%growthshare isbasedontheprojectedaverageannual increase inpersontripstoandfromBoulderfrom2010to2035(illustratedbyFigure3-22inBoulder’sStateoftheSystemReport).Becauseinternal-external travel ismostevidentduringmorningandafternoonpeakhours, it isakey factor inourperceptionoftrafficcongestion.FigureT2providesareasonablemeansofquantifyingtheimpactofgrowthontransportationfacilities.
FigureT2:PersonTripsToandFromBoulder
CAPITALIMPROVEMENTSPLANFORTRANSPORTATIONFACILITIES
As shown in Figure T3, the ten-year growth cost of planned enhancement projects is approximately$10.58million. Formost transportationprojects listedbelow, the growth share to be fundedbyDIFrevenueis9.9%ofthelocalcost,whichisthetotalprojectcostlessanygrantfunding.The9.9%growthshare is based on the projected increase in person trips to and from Boulder from 2010 to 2035, asdiscussedabove.
GiventhefactthatBoulderisnotexpandinggeographically(i.e.nosignificantadditionaltransportationinfrastructureontheperiphery),theimprovementslistedbelowareprimarilyenhancementstoexistingfacilities.Thusexistingandnewdevelopmentwillequallybenefitfromallprojectsexceptthosewitha100% growth share. The four line items that are 100% attributable to new development are fordevelopmentcoordination,TIPscoping/prioritizationandcorridorstudies. Toaccountforgrantfunds,fourlineitemsinthetablebelowhavegrowthcostrangingfrom16.1%to49.5%ofthelocalcost.Thesepercentageswerederivedafterapplyingthe9.9%growthallocationfactortothetotalprojectcost.
Communities 2010 2035 Change %ChangeBroomfield 28,130 39,254 11,124 39.5%Denver 13,643 14,416 773 5.7%DIA 2,962 4,139 1,176 39.7%ERIE 11,993 24,546 12,554 104.7%Lafayette 18,613 21,564 2,950 15.9%Longmont 40,976 47,774 6,798 16.6%Lyons 1,892 1,968 77 4.0%Louisville 25,799 26,214 415 1.6%Superior 9,988 12,073 2,085 20.9%
TOTAL 153,995 191,9470.99% <=AverageAnnualGrowthRate9.9% <=PercentIncreaseOverTenYears
DatasourceH:\Projects-Open\A-E\BOULDERTransitMasterPlan2012.777\05Background\TravelDemandModel\Person_Trips
4/4/16DRAFTTransportationDevelopmentImpactFeeStudy Boulder,Colorado
8
ThelistofimprovementsinFigureT3excludesthreeprojectsproposedbystaffbutnotrecommendedbyTischlerBisedue to the requirement inColorado’senabling legislation that feesmustbe limited toimpacts caused by, and directly related to proposed development. Boulder’s current practice is toderive citywide feesand limit feeexpenditures toprojects thatwill benefit all newdevelopment. Toavoidtheneedformultipleserviceareasandfeeschedules,thefollowingprojectsintheUniversityHillareawereexcluded:1)streetimprovementsforeventsinthecommercialdistrict,and2)lightingwithintheresidentialarea.ThefinalprojectexcludedwasforpedestrianaccessandlightingimprovementstoChautauquaPark,whichcouldpossiblybefundedusingparkimpactfees.

4/4/16DRAFTTransportationDevelopmentImpactFeeStudy Boulder,Colorado
9
FigureT3:GrowthCostofTransportationEnhancements
CIP# ProjectLocation Description
Ten-YearCost
(lessgrants)
FY16-25
Walk/Bike/Transit
FY16-25Streets
Growth
Shareof
LocalCost
310TR052OGCitywideFunds2800&2810
TIPlocalmatch&TMPimplementation
$18,363,000 $1,642,800 $182,500 9.9%
310TR003OC CitywideMajorcapitalreconstructionandenhancements
$4,800,000 $436,900 $39,700 9.9%
310TR773OC CitywidePedestrianfacilitiesrepair/replacement/ADAandenhancements
$3,774,000 $375,500 $0 9.9%
310TR153NG 30thSt&Colorado*Localshareofbike/pedunderpass(totalcost=$7,500,000)
$3,150,000 $588,500 $149,600 23.4%
310TR156NCBoulderCreek&Aprapahoe(15thtoBroadway)
Reconstructionandmultimodalimprovements
$2,500,000 $248,300 $0 9.9%
3102ABCK03BoulderCreek-Arapahoe&13th
Underpass $2,365,000 $234,100 $0 9.9%
310TR152NGBroadway-ViolettoHwy36*
Localshareofreconstruction&multimodalimprovements(totalcost=$7,050,000)
$1,825,000 $661,000 $34,800 38.1%
310TR692OC CitywideBikewayfacilitiesenhancements
$1,350,000 $133,700 $0 9.9%
3102ABCK01 BoulderCreek Pathlighting $979,680 $97,000 $0 9.9%
310TR743NC 28thSt-ValmonttoIris Multimodalimprovements $860,000 $76,900 $8,500 9.9%
3102ABCK02 BoulderCreek Pathimprovements $770,000 $76,200 $0 9.9%
310TR112OC CitywidePedestrianfacilitiesenhancements
$750,000 $74,300 $0 9.9%
310TR692OC Citywide Tributarygreenways $585,000 $57,900 $0 9.9%310BJ002NC Bluff&30thSt Trafficsignal $532,000 $10,500 $42,100 9.9%
310TD019NC 28thSt-BaselinetoIrisCompletestreetelements;turnlanes;widenbridge
$470,000 $42,000 $4,700 9.9%
310TDOO4OCCitywideFunds2810&3500
Developmentcoordination $450,000 $337,500 $112,500 100.0%
310TR157NG CitywideBldrCo/CityJointTIPScoping&Prioritization
$289,000 $289,000 $0 100.0%
310TD021OC Citywide Intersectionimprovements $200,000 $4,000 $15,800 9.9%310TR479OC 30th&Colorado TransportationCorridorStudy $200,000 $150,000 $50,000 100.0%
310TR154NG19th-NorwoodtoUpland*
Localshareofreconstruction&walk/bikeimprovements(totalcost=$257,000)
$157,000 $16,800 $8,400 16.1%
310TR480NC EastArapahoe TransportationCorridorStudy $100,000 $75,000 $25,000 100.0%
310TR151NGBoulderSlough-30thSttoPearl*
Localshareofmultiusepath(totalcost=$480,000)
$96,000 $47,500 $0 49.5%
CitywideAdditionalimprovementsinYears7-10
$29,710,500 $3,783,600 $449,100 14.2%
*Projectswithgrantfunding;enhancement Ten-YearTotal=> $74,276,180 $9,459,000 $1,122,700 14.2%costgrowthshareisapproximately5.9%oftotalcost 89% 11%
$10,581,700 <=TenYearTotaltobefundedbyDIF$63,694,480 <=Totaltobefundedbyotherrevenues
EnhancementCostDueToGrowth

4/4/16DRAFTTransportationDevelopmentImpactFeeStudy Boulder,Colorado
10
COSTALLOCATIONFORBUSBIKEWALKFACILITIES
The demand for Bus Bike Walk facilities is a function of both residential and nonresidentialdevelopment. Asshown inFigureT4, functionalpopulation is similar towhat theU.S.CensusBureaucalls"daytimepopulation"byaccountingforpeoplelivingandworkingina jurisdiction. InadditiontotheBoulder-specificdata,TischlerBisehasreliedonextensivepublicandprivatesectorinputtoestablishreasonable “weighting factors” to account for time spent at either residential or nonresidentialdevelopment.Theseweightingfactorsareshownbelowwithgreyshading.
The functional population analysis startswith 2015 estimates of jobs and population in Boulder (seeyellowhighlighting),asdocumentedintheLandUseAssumptions.Accordingtothe2013TMPStateoftheSystemreport(seepage3-13),approximately10%ofBoulderjobsareself-employedpersons.Theremaining 90% of jobs require “journey-to-work” travel. The 2014 Boulder Valley Employee SurveyindicatesBoulder residentsheld38%of these jobs,withpersons livingoutsideofBoulderholding theremaining62%of journey-to-workjobs. Thefunctionalpopulationanalysisassumesallworkersspendtenhoursperweekday(annualizedaverage)atnonresidentiallocations.
ResidentswhoworkinBoulderareassigned10hourstononresidentialdevelopment(discussedabove)and14hourstoresidentialdevelopment.ResidentswhoworkoutsideBoulderareassigned14hourstoresidential development. Jobs held by non-residents are assigned 10 hours to nonresidentialdevelopment.Residentswhodon'tworkareassigned20hoursperdaytoresidentialdevelopmentandfour hours per day to nonresidential development (annualized averages) to account for time spentshopping,eatingout,andothersocial/recreationalactivities.

4/4/16DRAFTTransportationDevelopmentImpactFeeStudy Boulder,Colorado
11
BasedonBoulder’s2015functionalpopulationanalysis,thecostallocationforresidentialdevelopmentis 60%, while nonresidential development accounts for 40% of the demand for Bus Bike Walkinfrastructure.
FigureT4:FunctionalPopulation
Basedonthecostofplannedtransportationenhancements(seeFigureT3)BusBikeWalkimprovementsaccountfor89%ofgrowthcosts,orapproximately$9.46millionoverthenexttenyears. AsshowninFigureT5,60%ofthisamount,dividedbytheprojectedincreaseinBoulder’spopulationoverthenexttenyears, yieldsa capital costof$748peradditional resident. TheBusBikeWalk componentof the2016 DIF for transportation improvements is equal to the cost per personmultiplied by the averagenumberofpersonsperdwelling,bysizerange(i.e.squarefeetoffinishedlivingspace).Forexample,anapartment building with small units (800 or less square feet) would have to pay $748 per personmultipliedbyanaverageof1.17personsperdwelling,or$875perdwellingunit(rounded).TheDIFfornonresidential development is equal to the capital cost per additional job,multiplied by the averagenumberofjobsperdevelopmentunit,foreachtypeofdevelopment.
ServiceUnitsin2015 Demand PersonNonresidential Hours/Day Hours
JobsLocatedinCity* 98,51010%Self-employed 9,851 10 98,510
JobsRequiringJourney-To-Work 88,659JobsHeldByResidents** 38% 33,690 10 336,900
JobsHeldByNon-residents** 62% 54,969 <=56%ofjobs 10 549,690Non-workingResidents 51,054 4 204,216
NonresidentialSubtotal 1,189,316NonresidentialShare=> 40%
ResidentialPopulation* 104,808
Non-workingResidents 51,054 20 1,021,080ResidentWorkers 53,754
81% ResidentsWorkinginCity 43,541 <=44%ofjobs 14 609,574(includesself-employed)***
19% ResidentsWorkingOutsideCity*** 10,213 14 142,982ResidentialSubtotal 1,773,636ResidentialShare=> 60%
TOTAL 2,962,952
BoulderFunctionalPopulationAnalysis
*BoulderLandUseAssump@ons,TischlerBise01/27/16.**Percentagesfrom2014BoulderValleyEmployeeSurvey,Table36,Ques@on32.***Percentagesfrom2014BoulderCommunityHouseholdSurvey,Table112,Ques@on24.

4/4/16DRAFTTransportationDevelopmentImpactFeeStudy Boulder,Colorado
12
FigureT5:BusBikeWalkImprovementsAllocatedtoPopulation&Jobs
VEHICLEMILESOFTRAVEL
FigureT3aboveindicatesstreetimprovementstoprovideadditionalvehicularcapacityaccountfor11%of the growth cost, or $1.12 million over the next ten years. The streets component of theTransportationDIFisderivedfromcustomtripgenerationrates(seeAppendixA),triprateadjustmentfactors,and thecapital costperVehicleMileofTravel (VMT). The latter isa functionofaverage triplength, trip-length weighting factor by type of development, and the growth cost of transportationimprovements.Eachcomponentisdescribedbelow.
TenYearGrowthCostofBusBikeWalkImprovements=> $9,459,000CostRangeandAllocationperServiceUnit
ProportionateShareBasedonFunctional
Population
2015to2025Increase
CostperAdditionalServiceUnit
BoulderPopulation 60% 7,580 $748BoulderJobs 40% 7,013 $539
2015 2025Population 104,808 112,388
Jobs 98,510 105,523TenYearIncreaseinPopulationplusJobs 7.2%
ResidentialSquareFeetofLiving
SpaceDevelopmentUnit Personsper
HousingUnitProposedBusBikeWalkComponent
800orless DwellingUnit 1.17 $875801to1200 DwellingUnit 1.80 $1,3461201to1600 DwellingUnit 2.19 $1,6381601to2200 DwellingUnit 2.52 $1,8852201ormore DwellingUnit 2.83 $2,117
NonresidentialType DevelopmentUnit Jobsper
DevelopmentUnit
ProposedBusBikeWalkComponent
Retail/Restaurant SqFtofFloorArea 0.00251 $1.35Office SqFtofFloorArea 0.00359 $1.94LightIndustrial SqFtofFloorArea 0.00231 $1.25Warehousing SqFtofFloorArea 0.00092 $0.50Institutional SqFtofFloorArea 0.00081 $0.44Hospital SqFtofFloorArea 0.00294 $1.58NursingHome/AssistedLiving
Bed 0.84 $453
Lodging Room 0.57 $307

4/4/16DRAFTTransportationDevelopmentImpactFeeStudy Boulder,Colorado
13
VMT is a measurement unit equal to one vehicle traveling one mile. In the aggregate, VMT is theproduct of vehicle tripsmultiplied by the average trip length1. The average trip length of 3.8mileswithinBoulderisfromthe2012ModalShiftReport,asderivedfromasurveyofresidents(i.e.householdtraveldiaries).
VehicularTripGenerationRates
Boulder’s2016TransportationDIFstudyisbasedonAverageWeekdayVehicleTripEnds(AWVTE).Forresidentialdevelopment,tripratesarecustomizedusingdemographicdataforBoulder,asdocumentedinAppendixA.Fornonresidentialdevelopment,tripgenerationratesarefromthereferencebookTripGenerationpublishedbytheInstituteofTransportationEngineers(ITE9thEdition2012).Avehicletripend represents a vehicleeitherenteringorexitingadevelopment (as if a traffic counterwereplacedacross a driveway). To calculate transportation development fees, trip generation rates require anadjustment factor to avoid double counting each trip at both the origin and destination points.Therefore, thebasic trip adjustment factor is 50%. Asdiscussed furtherbelow, theDIFmethodologyincludes additional adjustments to make the fees proportionate to the infrastructure demand forparticulartypesofdevelopment.
AdjustmentsforCommutingPatternsandPass-ByTrips
Residentialdevelopmenthasaslightly larger tripadjustment factorof52%toaccount forcommutersleavingBoulderforwork.AccordingtotheBoulderValley2012ModalShiftreport(seeFigure46),workorwork commute trips by single andmultiple occupancy vehicles accounted for 15.9%of productiontrips(i.e.,allout-boundtrips,whichare50%ofalltripends).Also,Table112(Question24)inthe2014BoulderCommunitySurveyindicatesthat19%ofresidentworkerstraveledoutsideBoulderforwork.Incombination,thesefactors(0.159x0.50x0.19=0.02)supporttheadditional2%allocationoftripstoresidentialdevelopment.
For commercialdevelopment, the tripadjustment factor is less than50%because retaildevelopmentand some services, like schools anddaycare facilities, attract vehicles as they pass by on arterial andcollectorroads.Forexample,whensomeonestopsataconveniencestoreonthewayhomefromwork,the convenience store is not theprimarydestination. For the average shopping center, ITE indicatesthat34%ofthevehiclesthatenterarepassingbyontheirwaytosomeotherprimarydestination.Theremaining 66% of attraction trips have the commercial site as their primary destination. Becauseattractiontripsarehalfofalltrips,thetripadjustmentfactoris66%multipliedby50%,orapproximately33%ofthetripends.
TripLengthWeightingFactorbyTypeofLandUse
ThetransportationDIFmethodologyincludesapercentageadjustment,orweightingfactor,toaccountfor trip length variationby typeof landuse. As shown in Figure T6, trips associatedwith residentialdevelopmentareapproximately113%oftheaveragetriplength.Theresidentialtriplengthadjustmentfactor includes data on work commute, driving passengers, social/recreational purposes and other
1TypicalVMTcalculationsfordevelopment-specifictrafficstudies,alongwithmosttransportationmodelsofanentireurbanarea, are derived from traffic counts on particular road segmentsmultiplied by the length of that road segment. For thepurposeoftheDIFstudy,VMTcalculationsarebasedonattraction(inbound)tripstodevelopmentlocatedintheservicearea,withtriplengthlimitedtotheroadnetworkconsideredtobesystemimprovements(arterialsandcollectors).Thisrefinementeliminatespass-throughorexternal-externaltrips,andtravelonroadsthatarenotsystemimprovements(e.g.statehighways).

4/4/16DRAFTTransportationDevelopmentImpactFeeStudy Boulder,Colorado
14
work/businesstravel. Conversely,shoppingandeatingtripsassociatedwithcommercialdevelopmentare roughly68%of theaverage trip lengthwhileothernonresidentialdevelopment typicallyaccountsfortripsthatare72%oftheaverageforalltrips.
FigureT6:AverageTripLengthbyTripPurposeinBoulder
TypeofDevelopment TripPurpose MilesPercent
Miles TripsPercent
Trips MilesPerTrip
WeightingFactor
1-Residential WorkCommute 14.9% 2,719 9.2% 444 6.11-Residential DriveaPassenger 6.6% 1,205 4.8% 232 5.21-Residential ChangeMode&Other 2.9% 529 2.5% 121 4.41-Residential Social/Recreational 15.0% 2,738 13.4% 647 4.21-Residential GoHome 35.4% 6,461 34.7% 1,676 3.91-Residential OtherWork/Business 3.7% 675 4.6% 222 3.01-ResidentialTotal 14,327 3,342 4.3 1.132-Retail/Restaurant Shopping 8.4% 1,533 11.1% 536 2.92-Retail/Restaurant EataMeal 4.0% 730 7.1% 343 2.12-Retail/RestaurantTotal 2,263 879 2.6 0.683-OtherNonresidential PersonalBusiness 5.7% 1,040 6.3% 304 3.43-OtherNonresidential School 3.4% 621 6.3% 304 2.03-OtherNonresidentialTotal 1,661 609 2.7 0.72
TOTAL 100.0% 18,251 100.0% 4,830 3.8DataSource:Figures44and45,ModalShiftinBoulderValley,2012.

4/4/16DRAFTTransportationDevelopmentImpactFeeStudy Boulder,Colorado
15
DEVELOPMENTPROTOTYPESANDPROJECTEDVMT
TherelationshipbetweentheamountofdevelopmentwithinBoulderandVehicleMilesofTravel(VMT)isdocumentedinFigureT7.Atthetoparedataonexistingandprojecteddevelopmentunits.Thelowerportionofthetableindicatesthecostallocationforstreetimprovements.VMTperdevelopmentunitisequal to AWVTE x Trip Adjustment Factor xMode Share for Single andMultiple Occupancy Vehicles(SOV&MOV)xTripLengthWeightingFactorxAverageTripLength.BasedonprojecteddevelopmentinBoulder over the next ten years, residential development should pay for approximately 44% of thegrowthcostofstreetimprovements,withtheremaining56%fundedbynonresidentialdevelopment.
FigureT7:ProjectedVMTIncreasetoDevelopmentwithinBoulder
COSTALLOCATIONFORSTREETIMPROVEMENTS
InputvariablesforthestreetsportionofBoulder’s2016TransportationDIFscheduleareshowninFigureT8. Inbound VMT by type of development, multiplied by the capacity cost per VMT, yields the DIFamount. Forexample,Lodginggenerates8.18VMTperroom,multipliedbythecapitalcostof$20.19perVMT,yieldsaDIFchargeof$165perroom(rounded)forstreetimprovements.
ThetextbelowfromTripGeneration (ITE2012)supports theconsultant’s recommendationtouse ITE820ShoppingCenterasareasonableproxyforallcommercialdevelopment(i.e.retailandrestaurants).Theshoppingcentertripgenerationratesarebasedon302studieswithanr-squaredvalueof0.79.Thelatter is a goodness-of-fit indicator with values ranging from 0 to 1. Higher values indicate theindependent variable (floor area) provides a better prediction of the dependent variable (average
DevelopmentType(1)
2015DevelopmentUnits(1)
2025DevelopmentUnits(1)
AdditionalDevelopment
UnitsSingleUnitDwellings 24,242 24,806 564MultipleUnitDwellings 21,498 23,752 2,254IndustrialSqFt 13,576,996 14,547,603 970,607RetailSqFt 8,565,611 9,174,939 609,328Office&OtherServicesSqFt
14,848,416 15,904,789 1,056,373
HousingUnitTotal 45,740 48,558 2,818NonresKSFTotal 36,991,023 39,627,331 2,636,308
StreetsCostAllocationBasedonVehicleMilesofTravelDevelopment
TypeAvgWkdyVehTripEndsperDevUnit(2)
TripAdjustmentFactors(3)
SOV+MOVModeShare(4)
TripLengthWeightingFactor(5)
VehicleMilesofTravelperDevUnit
TenYearVMT
Increase
ProportionateSharebyType
ofDevSingleUnitDwellings 8.17 52% 55.5% 113% 10.12 5,710 10.27%MultipleUnitDwellings 6.63 52% 55.5% 113% 8.22 18,519 33.31%Industrial(perKSF) 3.56 50% 73.2% 72% 3.56 3,460 6.22%Retail(perKSF) 42.70 33% 73.2% 68% 26.65 16,240 29.21%Office&OtherServices(perKSF)
11.03 50%73.2%
72% 11.05 11,668 20.99%
AverageTripLengthinmiles(6)=> 3.80 55,598 100.00%TenYearGrowthCostofStreetImprovements=> $1,122,700
CostperAdditionalVMT=> $20.19
(1)LandUseAssumpPons,TischlerBise2016.(2)ResidenPaltripratesadjustedtoBoulderdemographics;nonresidenPaltripratesarenaPonalaverages(ITE2012).(3)ResidenPalincludescommuPngpaWernadjustment;Retailincludespass-byadjustment.(4)ResidenPalmodesharefromFigure1,2012ModalShiY;nonresidenPalmodesharefromTable2(primarymode)2014EmployeeSurvey.(5)DerivedfromFigures44+45,ModalShiY,2012..(6)Figure19,2012ModalShiY

4/4/16DRAFTTransportationDevelopmentImpactFeeStudy Boulder,Colorado
16
weekday vehicle trip ends). If the r-squared value is less than 0.50, ITE does not publish the valuebecausefactorsotherthanfloorareaprovideabetterpredictionoftriprates.
“Ashoppingcenterisanintegratedgroupofcommercialestablishments.Shoppingcenters, including neighborhood, community, regional, and super regional centers,were surveyed for this land use. Some of these centers contained non-merchandising facilities, such as office buildings,movie theaters, restaurants, postoffices, banks, and health clubs. Many shopping centers, in addition to theintegrated unit of shops in one building or enclosed around a mall, include outparcels(peripheralbuildingsorpadslocatedontheperimeterofthecenteradjacenttothestreetsandmajoraccesspoints).Thesebuildingsaretypicallydrive-inbanks,retailstores,restaurants,orsmalloffices.Althoughthedatahereindonotindicatewhich of the centers studied include peripheral buildings, it can be assumed thatsomeofthedatashowtheireffect.”
FigureT8:CostofStreetImprovementsAllocatedbyVMT
ResidentialDIFforStreets
SquareFeetofLivingSpace
DevelopmentUnit
AWVTEperDevUnit(2)
TripAdjustmentFactors(3)
SOV+MOVModeShare
(4)
TripLengthWeightingFactor(5)
VMTperDevUnit
ProposedStreets
Component800orless DwellingUnit 3.94 51% 55.5% 113% 4.79 $97
801to1200 DwellingUnit 6.23 51% 55.5% 113% 7.57 $153
1201to1600 DwellingUnit 7.65 51% 55.5% 113% 9.30 $188
1601to2200 DwellingUnit 8.85 51% 55.5% 113% 10.76 $217
2201ormore DwellingUnit 9.99 51% 55.5% 113% 12.14 $245
NonresidentialDIFforStreetsType Development
UnitAWVTEperDevelopment
Unit(2)
TripAdjustmentFactors(3)
SOV+MOVModeShare
(4)
TripLengthWeightingFactor(5)
VMTperDevUnit
ProposedStreets
ComponentRetail/Restaurant SqFt 0.04270 33% 73.2% 68% 0.02665 $0.54
Office SqFt 0.01103 50% 73.2% 72% 0.01105 $0.22
LightIndustrial SqFt 0.00697 50% 73.2% 72% 0.00698 $0.14
Warehousing SqFt 0.00356 50% 73.2% 72% 0.00356 $0.07
Institutional SqFt 0.01403 33% 73.2% 72% 0.00927 $0.19
Hospital SqFt 0.01322 50% 73.2% 72% 0.01324 $0.27
NursingHome/Assisted
LivingBed 2.74 50% 73.2% 72% 2.74 $55
Lodging Room 8.17 50% 73.2% 72% 8.18 $165

4/4/16DRAFTTransportationDevelopmentImpactFeeStudy Boulder,Colorado
17
REVENUECREDITEVALUATION
A credit for other revenues is only necessary if there is potential double payment for systemimprovements.InBoulder,salesandgastaxrevenuewillbeusedformaintenanceofexistingfacilities,correcting existing deficiencies, and for capital projects that are not DIF system improvements. AsshownbelowintheFigureT9,cumulativeDIFrevenueoverthenexttenyearsapproximatesthegrowthcostofsystemimprovements. ThereisnopotentialdoublepaymentfromotherrevenuesifBoulder’selectedofficialsmakealegislativepolicydecisiontouseTransportationDIFrevenuetofundthegrowthcostofsystemimprovements.
FUNDINGSTRATEGYFORTRANSPORTATIONIMPROVEMENTS
The revenue projection shown in Figure T9 assumes implementation of the proposed 2016TransportationDIF scheduleand thedevelopmentprojectionsdescribed in the landuseassumptions.Totheextenttherateofdevelopmenteitheracceleratesorslowsdown,therewillbeacorrespondingchange in DIF revenue and the timing of capital improvements. Based on the proposed 2016methodology,residentialdevelopmentwillpayapproximately52%ofthegrowthcostfortransportationsystemimprovement,withnonresidentialdevelopmentcoveringtheremaining48%.
FigureT9:ProjectedTransportationDIFRevenue
Residential LightIndustrial Retail Office&OtherServices
$1,826 $1.39 $1.89 $2.16Year perhousingunit per1000SqFt per1000SqFt per1000SqFt
HousingUnits SquareFeet SquareFeet SquareFeetBase 2015 45,740 13,576,996 8,565,611 14,848,416
Year1 2016 46,012 13,670,663 8,624,414 14,950,360Year2 2017 46,288 13,765,405 8,683,890 15,053,473Year3 2018 46,566 13,860,809 8,743,783 15,157,308Year4 2019 46,846 13,956,881 8,804,095 15,261,869Year5 2020 47,127 14,053,626 8,864,830 15,367,162Year6 2021 47,409 14,151,048 8,925,989 15,473,193Year7 2022 47,694 14,249,152 8,987,577 15,579,965Year8 2023 47,980 14,347,942 9,049,596 15,687,486Year9 2024 48,268 14,447,424 9,112,049 15,795,758Year10 2025 48,557 14,547,603 9,174,939 15,904,789TenYearIncrease 2,817 970,607 609,328 1,056,373
ProjectedRevenue=> $5,145,000 $1,349,000 $1,152,000 $2,282,000TotalProjectedTransportationDIFRevenue(rounded)=> $9,928,000
ResShare=> 52% NonresShare=> 48%

4/4/16DRAFTTransportationDevelopmentImpactFeeStudy Boulder,Colorado
18
APPENDIXA:LANDUSEASSUMPTIONSRELATEDTOTRANSPORTATION
MostofthedemographicdataforBoulder’s2016transportationstudiesmaybefoundinmemodatedJanuary 27, 2016 regarding “Draft 3 Land Use Assumptions for Impact Fee/Excise Tax Studies.” ThisAppendix contains additional information specific to the transportation analysis, such as customizedvehicletripgenerationratesfortheCityofBoulder.
CUSTOMTRIPGENERATIONRATESBYDWELLINGSIZE
Asanalternativetosimplyusingnationalaveragetripgenerationratesforresidentialdevelopment,aspublishedbytheInstituteofTransportationEngineers(ITE),TischlerBisederivedcustomtripratesusinglocaldemographicdata.Keyinputsneededfortheanalysis(i.e.averagenumberofpersonsandvehiclesavailable per housing units) are available from American Community Survey (ACS) data for ColoradoPublicUseMicrodataArea803,whichisessentiallytheCityofBoulder.
CityofBoulderControlTotals
The2010 censusdidnotobtaindetailed informationusing a “long-form”questionnaire. Instead, theU.S.CensusBureauhasswitched toacontinuousmonthlymailingof surveys,knownas theAmericanCommunitySurvey (ACS),which is limitedbysample-sizeconstraints. Forexample,dataondetachedhousingunitsarenowcombinedwithattachedsingleunits(commonlyknownastownhouses).Partofthe rationale for deriving development related transportation taxes/fees by bedroom range, asdiscussed further below, is to address this ACS data limitation. Because townhouses generally havefewerbedroomsandlesslivingspacethandetachedunits,feesbydwellingsizeensureproportionalityandfacilitateconstructionofaffordableunits.
According to the U.S. Census Bureau, a household is a housing unit that is occupied by year-roundresidents. Developmentfeesoftenusepercapitastandardsandpersonsperhousingunit,orpersonsper household, to derive proportionate-share fee amounts. TischlerBise recommends that fees forresidential development inBoulder be imposed according to thenumberof year-round residents perhousing unit. Figure A1 indicates the average number of year-round residents per housing unit inBoulder. In2013, thecontrol total for theCityofBoulder is2.14personsperdwelling (i.e.weightedaverageforalltypesofhousing).
FigureA1:Year-RoundPersonsperUnitbyTypeofHousing
2013SummarybyTwoHouseTypesUnitsinStructure Persons House- Personsper Housing Personsper Housing Vacancy
holds Household Units HousingUnit Mix Rate
SingleUnit* 57,742 22,479 2.57 23,284 2.48 53% 3%AllOther 36,747 19,828 1.85 20,767 1.77 47% 5%
Subtotal 94,489 42,307 2.23 44,051 2.14 4%GroupQuarters 8,674
TOTAL 103,163*Singleunitincludesdetachedandattached(e.g.townhouse).
Source:TablesB25024,B25032,B25033,andB26001.
2013AmericanCommunitySurvey1-YearEstimates,U.S.CensusBureau.

4/4/16DRAFTTransportationDevelopmentImpactFeeStudy Boulder,Colorado
19
Tripgenerationratesarealsodependentupontheaveragenumberofvehiclesavailableperdwelling.Figure A2 indicates vehicles available per housing unit in the City of Boulder. For the purpose ofcustomizing vehicle trip generation rates, the control total for Boulder is an average of 1.55 vehiclesavailableperhousingunit.
FigureA2:VehiclesAvailableperHousingUnit
CustomizedTripRatesbyDwellingSizeandType
Custom tabulations of demographic data by bedroom range can be created from individual surveyresponsesprovidedbytheU.S.CensusBureau,infilesknownasPublicUseMicro-dataSamples(PUMS).BecausePUMSfilesareavailableforareasofroughly100,000persons,theCityofBoulderapproximatesColorado Public UseMicro-data Area (PUMA) 803. At the top of Figure A3, in the cells with yellowshading, are the2013 survey results forBoulder (latest available). Unadjusted survey results derivedfromPUMSdata(i.e.personsperdwellingandvehiclesavailableperdwelling),wereadjustedtomatchcontroltotalsfortheCityofBoulder,asdocumentedaboveinFiguresA1andA2.
The middle section of Figure A3 provides nation-wide data from the Institute of TransportationEngineers (ITE). AWVTE is the acronym for Average Weekday Vehicle Trip Ends, which measuresvehicles coming and going from a development. Dividing trip ends per household by trip ends perpersonyieldsanaverageof2.01personsperoccupiedapartmentand3.73personsperoccupiedsingledwelling,basedonITE’snationalsurvey.ApplyingBoulder’scurrenthousingmixof47%apartmentsand53%single-unitdwellingsyieldsaweightedaverageof2.92personsperhousehold. Incomparisontothenationaldata,Boulderonlyhasanaverageof2.14personsperhousingunit.
Dividing trip ends per household by trip ends per vehicle available yields an average of 1.30 vehiclesavailable per occupied apartment and 1.58 vehicles available per occupied single dwelling, based onITE’snational survey. ApplyingBoulder’s currenthousingmixof47%apartmentsand53%single-unitdwellings yields a weighted average of 1.45 vehicles available per household. In comparison to thenationaldata,Boulderhasmorevehiclesavailable,withanaverageof1.55perhousingunit.
TenureVehicles
Available(1)
SingleUnit
Detachedor
Attached
AllOther Total
Owner-occupied 35,644 16,469 3,657 20,126Renter-occupied 32,522 6,010 16,171 22,181Total 68,166 22,479 19,828 42,307
UnitsperStructureVehicles
Available
Housing
Units(3)
Vehiclesper
HousingUnit
SingleDetachedorAttached 37,979 23,284 1.63AllOther 30,187 20,767 1.45Total 68,166 44,051 1.55(1)VehiclesavailablebytenurefromTableB25046,AmericanCommunitySurvey,2013.
(2)HouseholdsbytenureandunitsinstructurefromTableB25032,ACS,2013.
(3)HousingunitsfromTableB25024,AmericanCommunitySurvey,2013.
Households(2)

4/4/16DRAFTTransportationDevelopmentImpactFeeStudy Boulder,Colorado
20
Rather than rely on onemethodology, the recommended trip generation rates shown in the bottomsectionofFigureA3(seeBoulderAWVTEperHousingUnitinboldnumbers),areanaverageoftripratesbasedonpersonsandvehiclesavailable,foralltypesofhousingunitsbybedroomrange.IntheCityofBoulder,eachhousingunitisexpectedtoyieldanaverageof7.45AverageWeekdayVehicleTripEnds(AWVTE),comparedtothenationalaverageof8.17tripendsperhousehold.
FigureA3:PersonsandAWVTEbyBedroomRangeandHouseType
TripGenerationbyDwellingSize
ToderiveAWVTEbydwellingsize,TischlerBisematchedtripgenerationratesandaveragefloorarea,bybedroomrange,asshowninFigureA4.Thelogarithmictrendlineformula,derivedfromthefouractualaverages inBoulder, isusedtoderiveestimatedtripendsbydwellingsize,across fivesizethresholds.TischlerBise does not recommend average fees for all house sizes because it makes small units lessaffordableandessentiallysubsidizeslargerunits.
CityofBoulder2013DataBedroom Persons Vehicles Housing Boulder Unadjusted Adjusted Unadjusted AdjustedRange (1) Available(1) Units(1) HsgMix Persons/HU Persons/HU(2) VehAvl/HU VehAvl/HU(2)0-1 114 89 89 19% 1.28 1.31 1.00 0.952 220 162 121 25% 1.82 1.86 1.34 1.273 296 236 134 28% 2.21 2.26 1.76 1.664+ 372 300 135 28% 2.76 2.83 2.22 2.10Total 1,002 787 479 2.09 2.14 1.64 1.55
NationalAveragesAccordingtoITEITE AWVTEper AWVTEper AWVTEper Boulder Personsper VehAvlperCode Person VehicleAvailable Household HsgMix Household Household
220Apt 3.31 5.10 6.65 47% 2.01 1.30210SFD 2.55 6.02 9.52 53% 3.73 1.58WgtdAvg 2.91 5.59 8.17 2.92 1.45RecommendedAWVTEperDwellingUnitbyBedroomRangeBedroom AWVTEper AWVTEper BoulderRange HousingUnit HousingUnit AWVTEper
Basedon Basedon HousingPersons(3) VehiclesAvailable(4) Unit(5)
0-1 3.81 5.31 4.562 5.41 7.10 6.263 6.58 9.28 7.934+ 8.24 11.74 9.99Total 6.23 8.66 7.45
AWVTEperDwellingbyHouseTypeITE AWVTEper AWVTEper BoulderCode HousingUnit HousingUnit AWVTEper
Basedon Basedon Housing Boulder BoulderPersons(3) VehiclesAvailable(4) Unit(5) Persons/HU VehAvl/HU
AllOther 5.15 8.11 6.63 1.77 1.45210SFD 7.22 9.11 8.17 2.48 1.63AllTypes 6.23 8.66 7.45 2.14 1.55
(1)AmericanCommunitySurvey,PublicUseMicrodataSampleforCOPUMA803(2013One-Yearunweighteddata).(2)AdjustedmulVpliersarescaledtomaketheaveragePUMSvaluesmatchcontroltotalsbasedonAmericanCommunitySurvey20131-yeardatafortheCityofBoulder.(3)AdjustedpersonsperhousingunitmulVpliedbynaVonalweightedaveragetriprateperperson.(4)AdjustedvehiclesavailableperhousingunitmulVpliedbynaVonalweightedaveragetripratepervehicleavailable.(5)Averageoftripratesbasedonpersonsandvehiclesavailableperhousingunit.

4/4/16DRAFTTransportationDevelopmentImpactFeeStudy Boulder,Colorado
21
Apartmentunitswillgenerallybe in the threesmallest size thresholds,withone-bedroomunitsbeing800 square feet or less, two-bedroom units ranging from 801 to 1200 square feet, and a few three-bedroomapartmentsbeingatleast1201squarefeet.
Single-unitdwellings (bothdetachedandattached)will have floorareas that correspond to the threelargestsizethresholds.Smallerunitswilllikelyhave1201to1600squarefeetoflivingspace.Themostcommonsingle-unitdwellingwillhavethreebedroomsandlikelyrangefrom1601to2200squarefeet.Allunitswith2201ormoresquarefeetoflivingspaceareassumedtogenerateamaximum9.99AWVTEperdwelling.
FigureA4:VehicleTripsbyDwellingSize
Bedrooms SquareFeet TripEnds SqFtRange TripEnds0-1 700 4.56 800orless 3.942 1,100 6.26 801to1200 6.233 1,800 7.93 1201to1600 7.654+ 2,900 9.99 1601to2200 8.85
2201ormore 9.99
ActualAveragesperHsgUnit Fitted-CurveValues
y=3.7757ln(x)-20.21R²=0.99767
0.00
2.00
4.00
6.00
8.00
10.00
12.00
0 500 1,000 1,500 2,000 2,500 3,000 3,500
TripEnd
sperHou
singUnit
SquareFeetofHeatedArea
AverageWeekdayVehicleTripEndsbyDwellingSizewithinCityofBoulder,CO
AveragedwellingsizebybedroomrangeisfromPropertyAssessorparceldatabase.Averageweekdayvehicletripendsarecalibratedto20131-YearACSPUMSdataforCOPUMA803(CityofBoulder).