Embed Size (px)
Citation preview
9/28/2007 1:24 PM metis\Roadshow Presentation\07 Roadshow Secondary Follow On
Nalco.ppt
0
Dr. William H. Joyce
Chairman and Chief Executive Officer
September 2007
1
This presentation includes “forward-looking statements” within the meaning of Section 27A of the Securities Act of 1933 and Section 21E of the Securities Exchange Act of 1934. These forward-looking statements include statements concerning our plans, objectives, goals, strategies, future events, future revenue or performance, capital expenditures, financing needs, plans or intentions relating to acquisitions, business trends and other information that is not historical information. When used in this presentation, the words “estimates,” “expects,” “anticipates,” “projects,” “plans,” “intends,” “believes,” “forecasts,” or future or conditional verbs, such as “will,” “should,” “could” or “may,” and variations of such words or similar expressions are intended to identify forward-looking statements. All forward-looking statements, including, without limitation, management’s examination of historical operating trends and data are based upon our current expectations and various assumptions. Our expectations, beliefs and projections are expressed in good faith and we believe there is a reasonable basis for them. However, there can be no assurance that management’s expectations, beliefs and projections will be achieved.
There are a number of risks and uncertainties that could cause our actual results to differ materially from the forward-looking statements contained in this presentation. Important factors that could cause our actual results to differ materially from the forward-looking statements we make in this presentation. Such risks, uncertainties and other important factors include, among others: our substantial leverage; limitations on flexibility in operating our business contained in our debt agreements; increases in interest rates as a result of our variable rate indebtedness; pricing pressure from our customers; technological change and innovation; risks associated with our non-U.S. operations; fluctuations in currency exchange rates; high competition in the markets in which we operate; adverse changes to environmental, health and safety regulations; operating hazards in our production facilities; inability to achieve expected cost savings; difficulties in securing or changes in the pricing of the raw materials we use; our significant pension benefit obligations and the current underfunding of our pension plans; our ability to realize the full value of our intangible assets; our ability to attract and retain skilled employees, particularly research scientists, technical sales professionals and engineers; our ability to protect our intellectual property rights; and the possibility that our owners’ interests will conflict with ours. There may be other factors that may cause our actual results to differ materially from the forward-looking statements.
All forward-looking statements attributable to us or persons acting on our behalf apply only as of the date of this presentation and are expressly qualified in their entirety by the cautionary statements included in this presentation. We undertake no obligation to update or revise forward-looking statements which may be made to reflect events or circumstances that arise after the date made or to reflect the occurrence of unanticipated events.
Non-GAAP measures may be discussed in today’s presentation. Management believes that discussion of these measures provides investors with additional insight into the ongoing operations of Nalco Holding Company. Non-GAAP measures are reconciled to the closest GAAP measure in schedules attached to our earnings releases, which may be found at www.nalco.com. Adjusted EBITDA is a non-GAAP measure used to determine compliance with the Company’s debt covenants. Free Cash Flow is defined as Cash from Operations less Capital Expenditures and Minority Interest charges. In addition, Nalco discusses sales growth in terms of nominal (actual), organic (nominal less foreign currency and acquisition/divestiture/merger/joint venture impacts), and real (organic growth less that portion of the growth which consists of price increases that simply pass along higher raw and purchased material costs). The non-GAAP measures should not be viewed as an alternative to GAAP measures of performance. Furthermore, these measures may not be consistent with similar measures provided by other companies.
Forward-Looking Statements and Regulation G
2
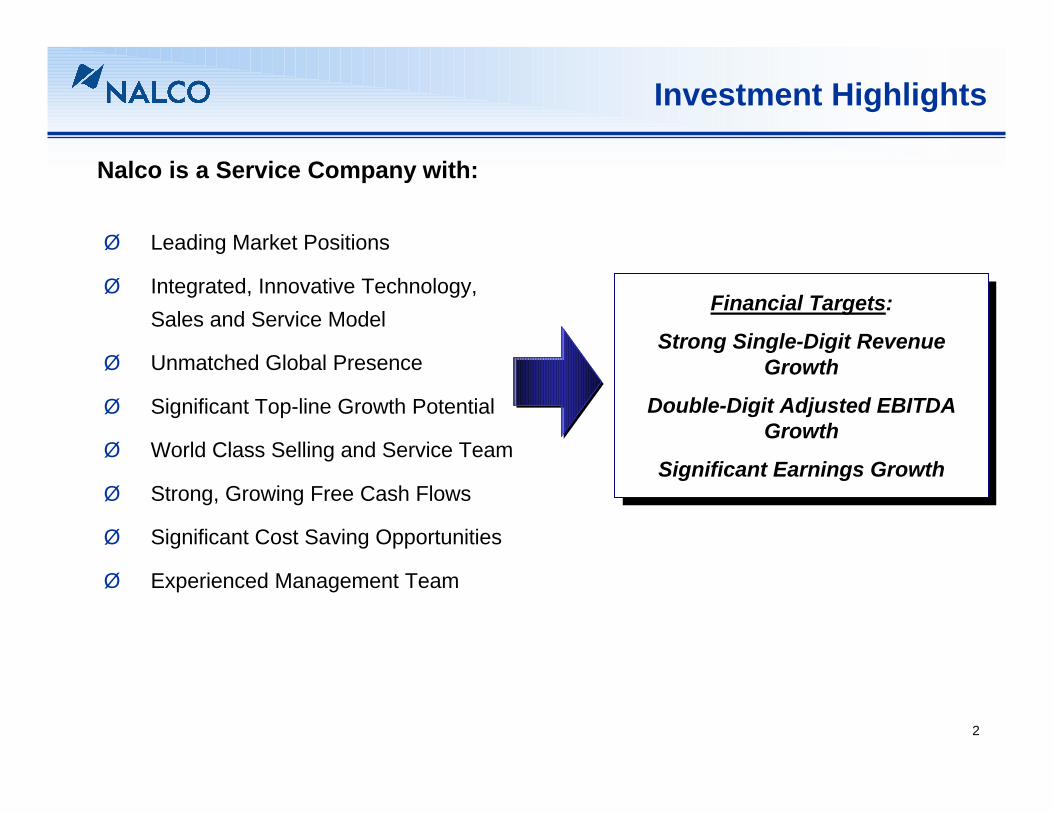
Investment Highlights
Ø Leading Market Positions
Ø Integrated, Innovative Technology, Sales and Service Model
Ø Unmatched Global Presence
Ø Significant Top-line Growth Potential
Ø World Class Selling and Service Team
Ø Strong, Growing Free Cash Flows
Ø Significant Cost Saving Opportunities
Ø Experienced Management Team
Financial Targets:
Strong Single-Digit Revenue Growth
Double-Digit Adjusted EBITDA Growth
Significant Earnings Growth
Financial Targets:
Strong Single-Digit Revenue Growth
Double-Digit Adjusted EBITDA Growth
Significant Earnings Growth
Nalco is a Service Company with:
3
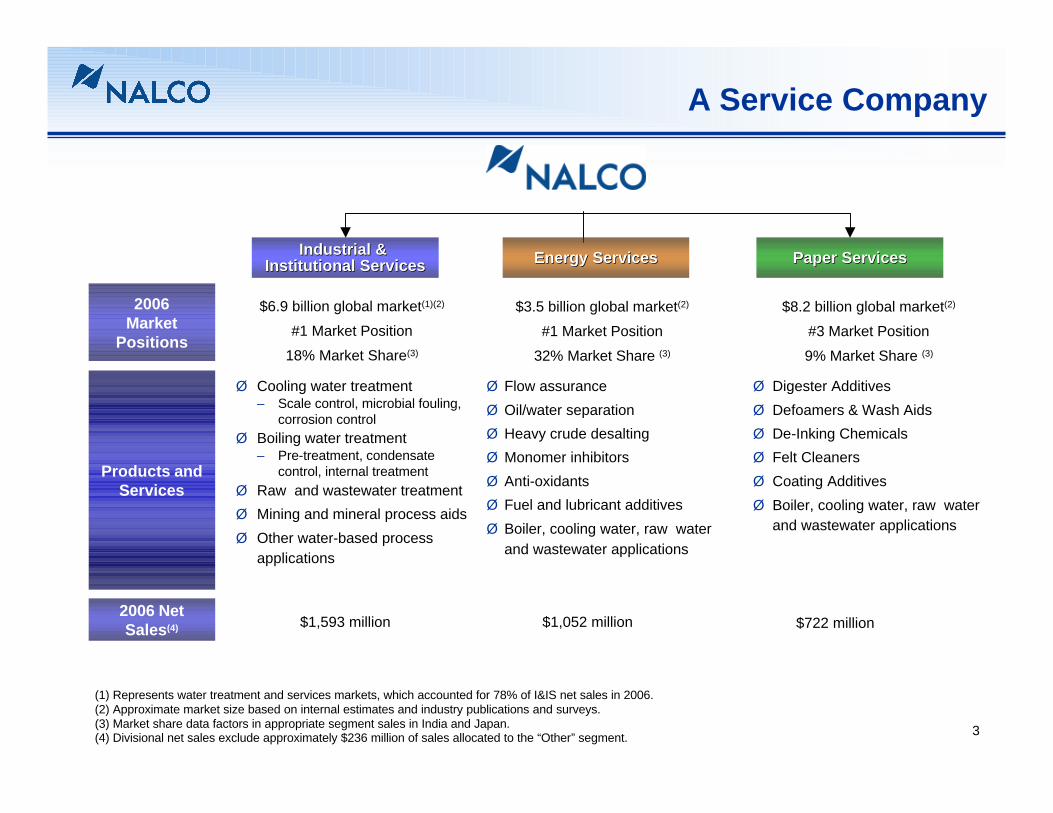
Ø Cooling water treatment– Scale control, microbial fouling,
corrosion controlØ Boiling water treatment
– Pre-treatment, condensate control, internal treatment
Ø Raw and wastewater treatmentØ Mining and mineral process aidsØ Other water-based process
applications
$6.9 billion global market(1)(2)
#1 Market Position18% Market Share(3)
$1,052 million $722 million$1,593 million
A Service Company
Industrial & Industrial & Institutional ServicesInstitutional Services
2006Market
Positions
Products andServices
2006 NetSales(4)
(1) Represents water treatment and services markets, which accounted for 78% of I&IS net sales in 2006.(2) Approximate market size based on internal estimates and industry publications and surveys.(3) Market share data factors in appropriate segment sales in India and Japan.(4) Divisional net sales exclude approximately $236 million of sales allocated to the “Other” segment.
Ø Flow assuranceØ Oil/water separationØ Heavy crude desaltingØ Monomer inhibitorsØ Anti-oxidantsØ Fuel and lubricant additivesØ Boiler, cooling water, raw water
and wastewater applications
$3.5 billion global market(2)
#1 Market Position32% Market Share (3)
Paper ServicesPaper Services
Ø Digester AdditivesØ Defoamers & Wash AidsØ De-Inking ChemicalsØ Felt CleanersØ Coating AdditivesØ Boiler, cooling water, raw water
and wastewater applications
$8.2 billion global market(2)
#3 Market Position9% Market Share (3)
Energy ServicesEnergy Services
4
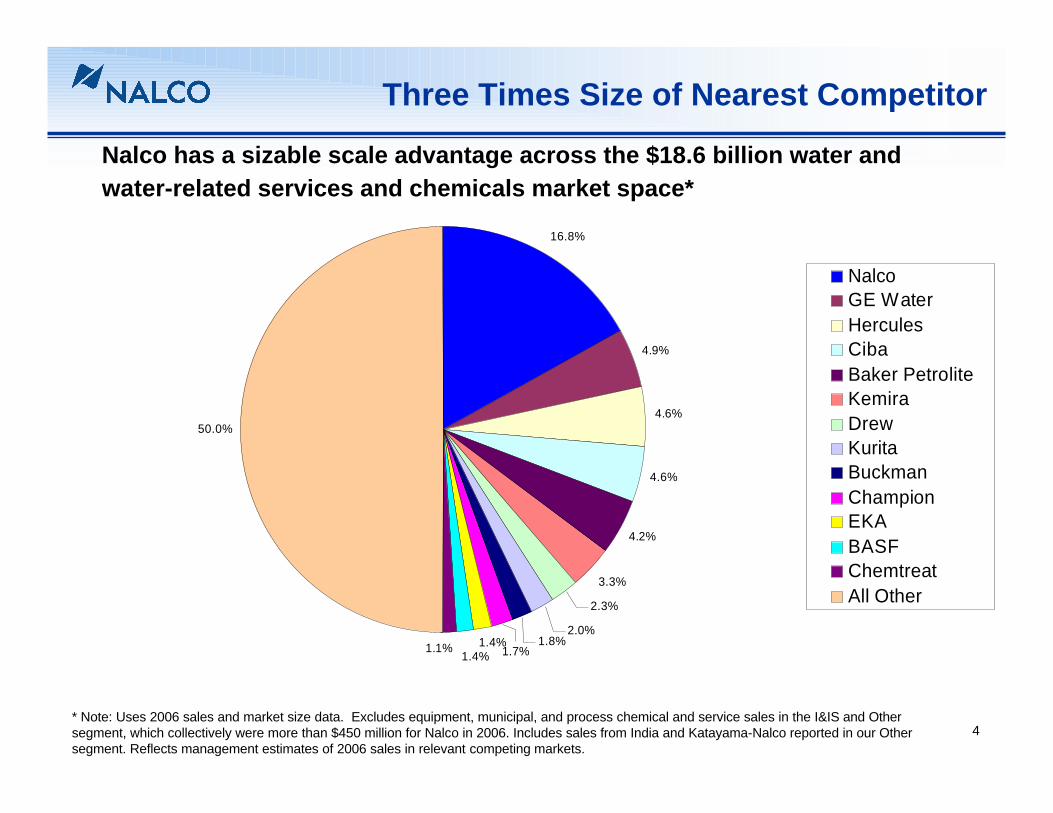
Three Times Size of Nearest Competitor
Nalco has a sizable scale advantage across the $18.6 billion water and water-related services and chemicals market space*
* Note: Uses 2006 sales and market size data. Excludes equipment, municipal, and process chemical and service sales in the I&IS and Other segment, which collectively were more than $450 million for Nalco in 2006. Includes sales from India and Katayama-Nalco reported in our Other segment. Reflects management estimates of 2006 sales in relevant competing markets.
16.8%
4.9%
4.6%
4.6%
4.2%
3.3%
2.3%
2.0%
50.0%
1.8%1.4%1.7%1.4%
1.1%
NalcoGE WaterHerculesCibaBaker PetroliteKemiraDrewKuritaBuckmanChampionEKABASFChemtreatAll Other
5
2007 Objectives Remain on Strategy
1. Generate Organic Growth – Continue positive business momentum through new technology and well-trained sales and service force
2. Improve Work Processes – Gain productivity improvements from NBT and work on next phase of work process initiatives.
3. Develop Alternate Channels – Continue development of WaterServ™ model (+9% YTD) and addition of other new channels to market.
Goal is to finish 2007 strong while also setting the stage for a good 2008.
6
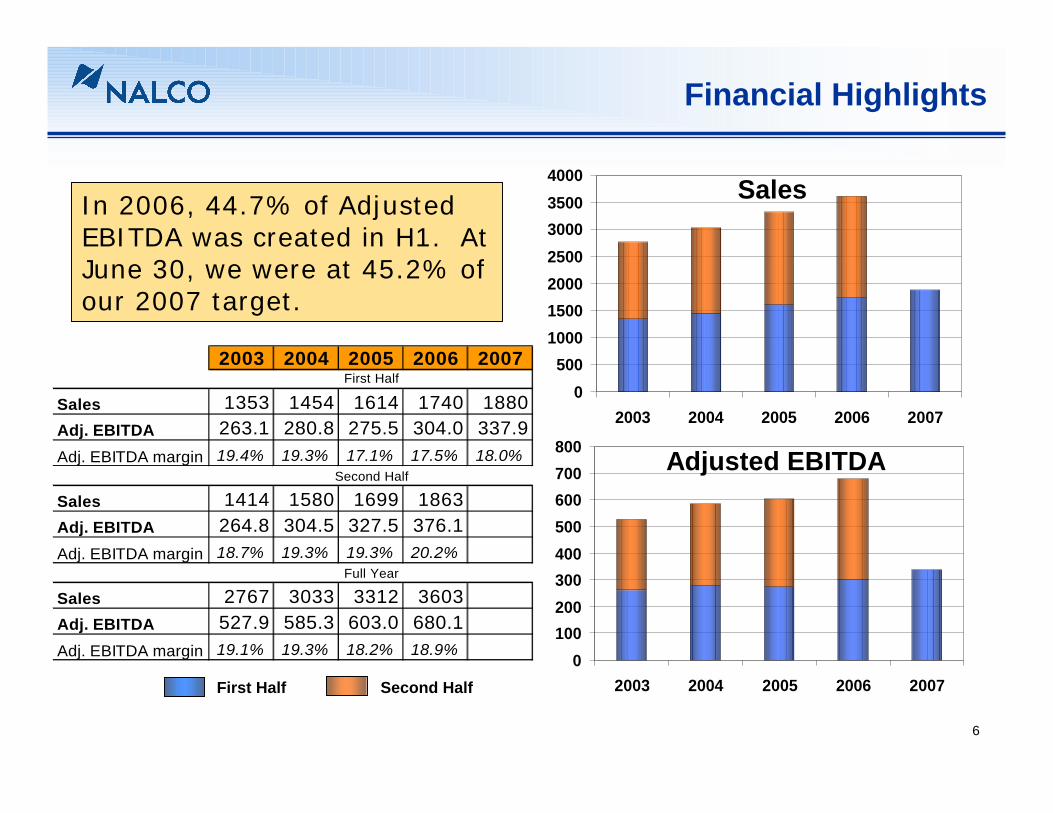
Financial Highlights
0100200300400500600700800
2003 2004 2005 2006 2007
0500
1000150020002500300035004000
2003 2004 2005 2006 2007
Adjusted EBITDA
Sales
First Half Second Half
2003 2004 2005 2006 2007
Sales 1353 1454 1614 1740 1880Adj. EBITDA 263.1 280.8 275.5 304.0 337.9Adj. EBITDA margin 19.4% 19.3% 17.1% 17.5% 18.0%
Sales 1414 1580 1699 1863Adj. EBITDA 264.8 304.5 327.5 376.1Adj. EBITDA margin 18.7% 19.3% 19.3% 20.2%
Sales 2767 3033 3312 3603Adj. EBITDA 527.9 585.3 603.0 680.1Adj. EBITDA margin 19.1% 19.3% 18.2% 18.9%
First Half
Second Half
Full Year
In 2006, 44.7% of Adjusted EBITDA was created in H1. At June 30, we were at 45.2% of our 2007 target.
7
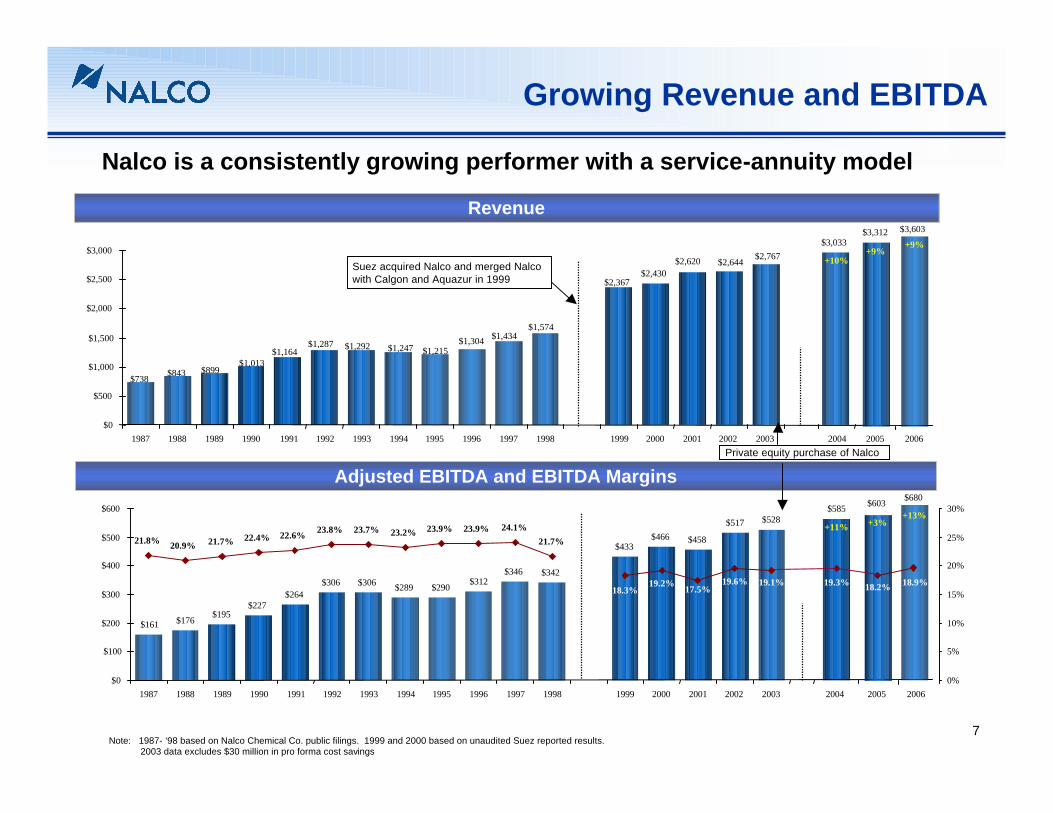
Growing Revenue and EBITDA
Nalco is a consistently growing performer with a service-annuity model
$2,430
$3,033
$1,574$1,434$1,304
$1,215$1,247$1,292$1,287$1,164
$1,013$899$843$738
$2,367
$2,767$2,644$2,620
$0
$500
$1,000
$1,500
$2,000
$2,500
$3,000
1987 1988 1989 1990 1991 1992 1993 1994 1995 1996 1997 1998 1999 2000 2001 2002 2003 2004
$161 $176 $195$227
$264$306 $306 $289 $290 $312
$346 $342
$433$466 $458
$517 $528$585
19.1%19.6%17.5%19.2%
18.3%
21.8% 20.9% 21.7% 22.4% 22.6% 23.8% 23.7% 23.2% 23.9% 23.9% 24.1%21.7%
$0
$100
$200
$300
$400
$500
$600
1987 1988 1989 1990 1991 1992 1993 1994 1995 1996 1997 1998 1999 2000 2001 2002 20030%
5%
10%
15%
20%
25%
30%
Revenue
Suez acquired Nalco and merged Nalco with Calgon and Aquazur in 1999
Adjusted EBITDA and EBITDA Margins
Note: 1987- ‘98 based on Nalco Chemical Co. public filings. 1999 and 2000 based on unaudited Suez reported results.2003 data excludes $30 million in pro forma cost savings
2004
19.3%
2005
$3,312
$603
18.2%
+11% +3%
+9%+10%
Private equity purchase of Nalco
$3,603
+9%
2006
2005 2006
$680
18.9%
+13%
8
Now working on longer-termopportunity to double growth rate
Three key programs
Ø Grow market share overseas through pre-investment in sales engineers and R&D.
Ø Improve bandwidth of sales force to sell broader offering
Ø Continue to build alternate channels
Goal is to double Nalco’s organic growth rate to 10% in 2010. Challenging, but achievable target. Recommend investors treat this as upside until results are proven.
9
MVA $/person
Wa
ter
Tre
atm
en
t$
/p
ers
on
350030002500200015001000
35
30
25
20
15
10
5
0
United States
JapanSouth Korea
Spain
Czech Republic
BrazilIndia
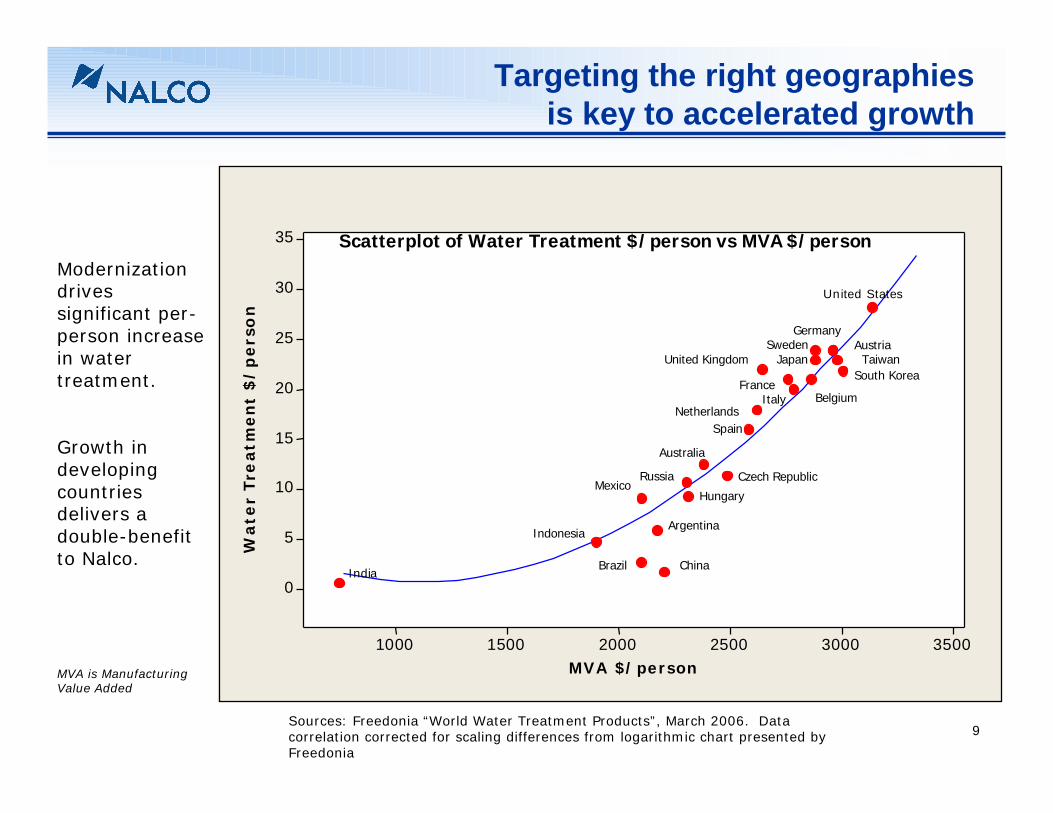
Scatterplot of Water Treatment $/person vs MVA $/person
GermanySweden Austria
Taiwan
Hungary
Argentina
China
MexicoRussia
Australia
United Kingdom
FranceItaly Belgium
Indonesia
Targeting the right geographiesis key to accelerated growth
Modernization drives significant per-person increase in water treatment.
Growth in developing countries delivers a double-benefit to Nalco.
Sources: Freedonia “World Water Treatment Products”, March 2006. Data correlation corrected for scaling differences from logarithmic chart presented by Freedonia
Netherlands
MVA is Manufacturing Value Added
10*2004 GDP data and 2005 Nalco sales data used to calculate relative market strength
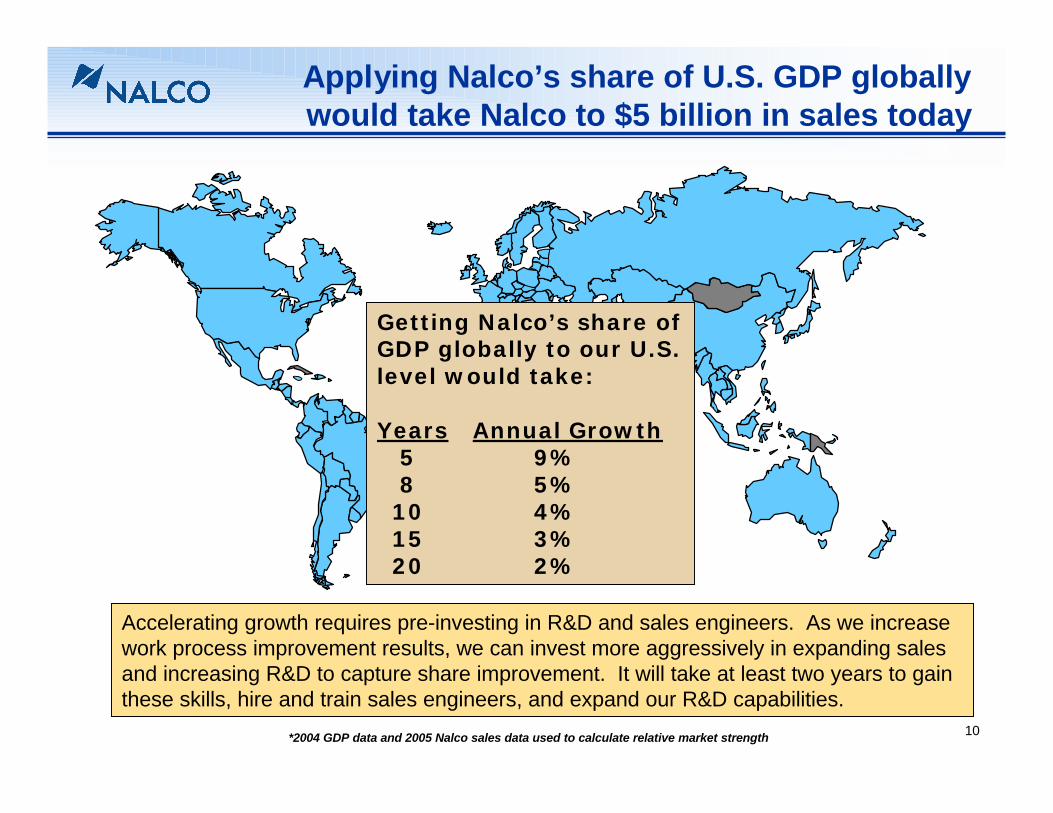
Getting Nalco’s share of GDP globally to our U.S. level would take:
Years Annual Growth5 9% 8 5%10 4%15 3%20 2%
Accelerating growth requires pre-investing in R&D and sales engineers. As we increase work process improvement results, we can invest more aggressively in expanding sales and increasing R&D to capture share improvement. It will take at least two years to gain these skills, hire and train sales engineers, and expand our R&D capabilities.
Applying Nalco’s share of U.S. GDP globally would take Nalco to $5 billion in sales today
11
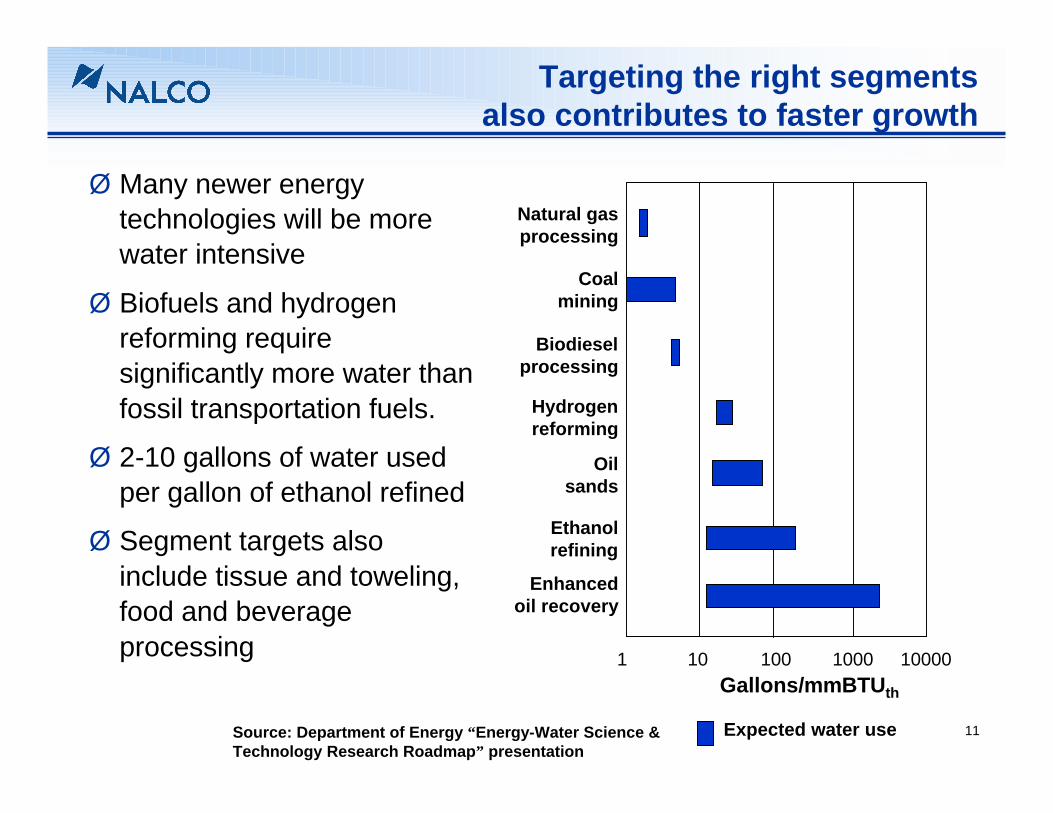
Targeting the right segmentsalso contributes to faster growth
Ø Many newer energy technologies will be more water intensive
Ø Biofuels and hydrogen reforming require significantly more water than fossil transportation fuels.
Ø 2-10 gallons of water used per gallon of ethanol refined
Ø Segment targets also include tissue and toweling, food and beverage processing
Gallons/mmBTUth
1 10 100 1000 10000
Natural gasprocessing
Coalmining
Hydrogenreforming
Biodieselprocessing
Ethanolrefining
Oilsands
Enhancedoil recovery
Source: Department of Energy “Energy-Water Science & Technology Research Roadmap” presentation
Expected water use
12
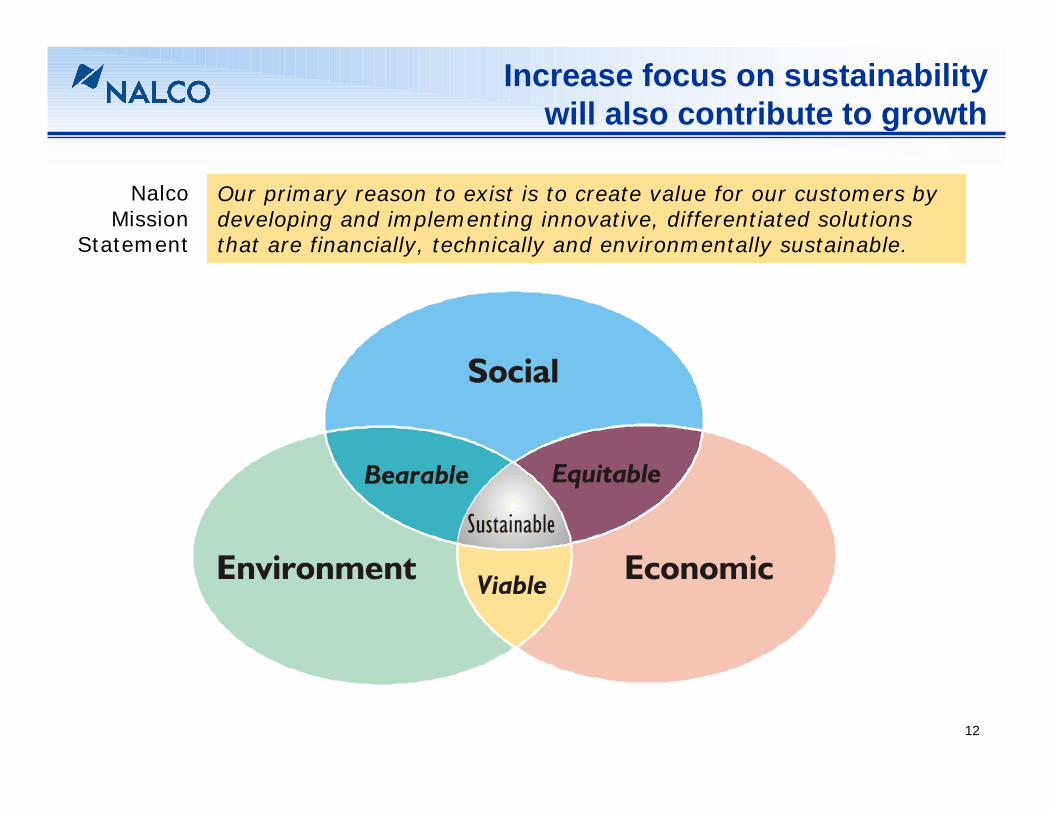
Increase focus on sustainabilitywill also contribute to growth
Our primary reason to exist is to create value for our customers by developing and implementing innovative, differentiated solutionsthat are financially, technically and environmentally sustainable.
NalcoMission
Statement
13
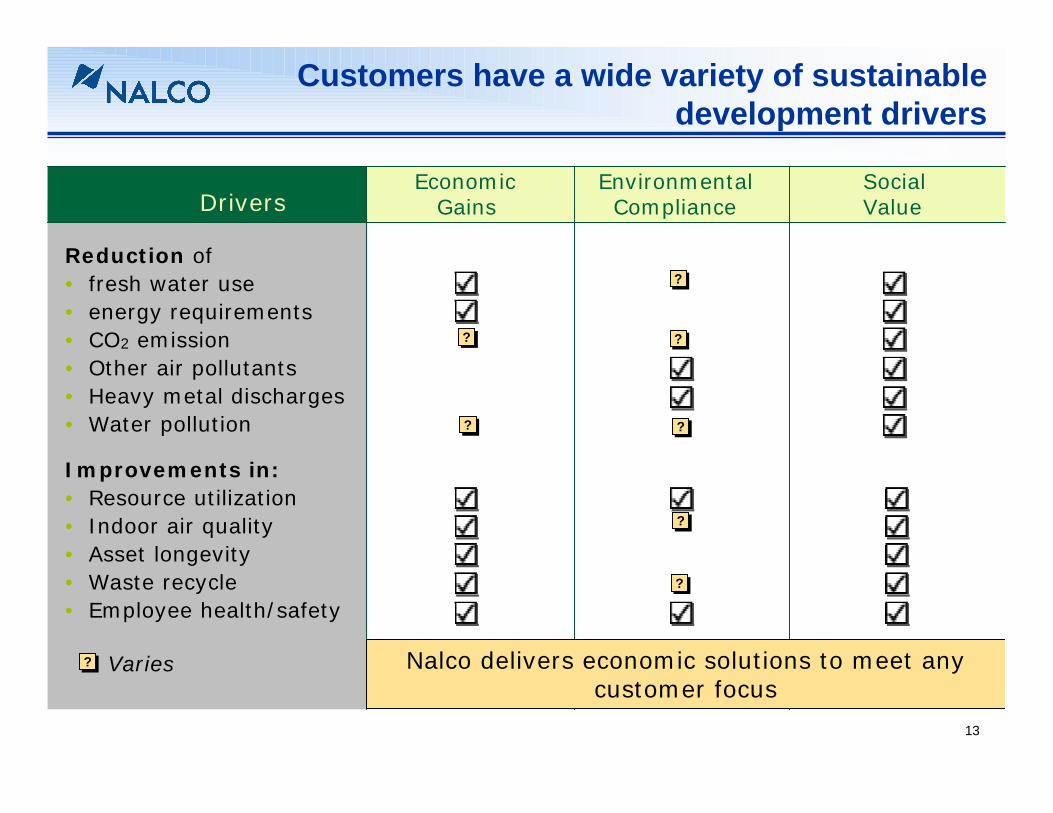
Customers have a wide variety of sustainable development drivers
Economic Environmental Social Gains Compliance ValueDrivers
Reduction of• fresh water use• energy requirements• CO2 emission• Other air pollutants• Heavy metal discharges• Water pollution
Improvements in:• Resource utilization• Indoor air quality• Asset longevity• Waste recycle• Employee health/safety
Varies
??
??
??
??
????
??
Nalco delivers economic solutions to meet any customer focus
??
14
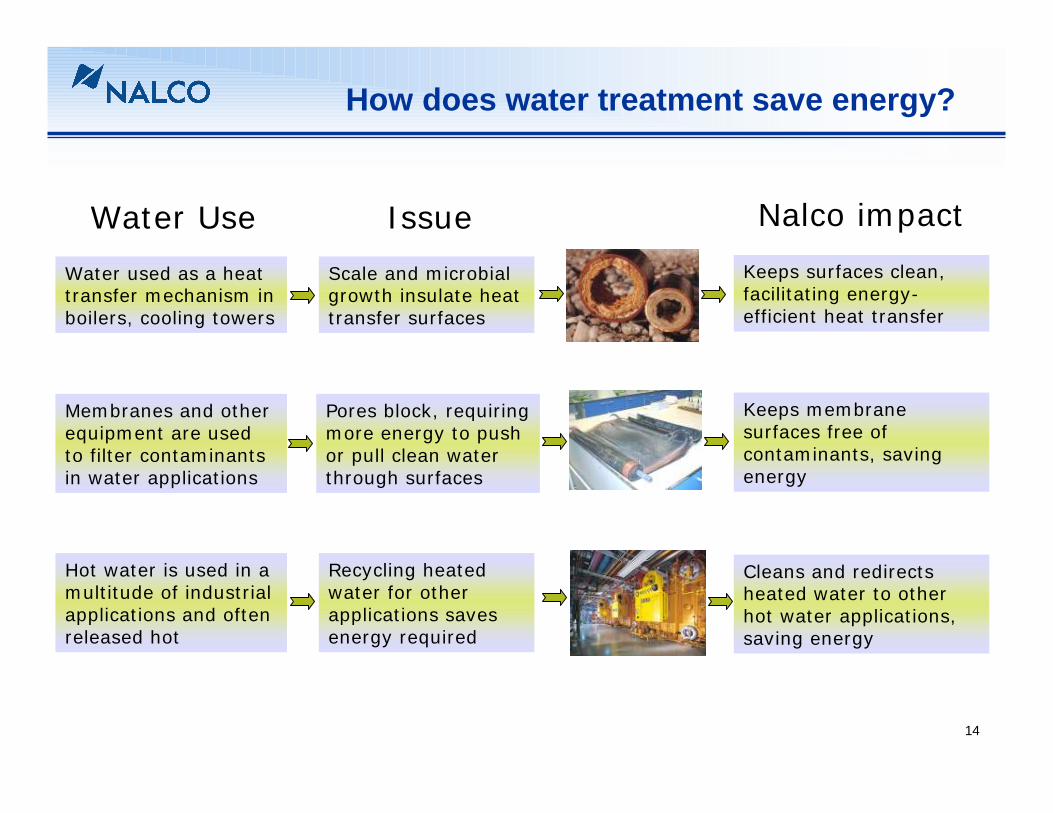
How does water treatment save energy?
Water used as a heat transfer mechanism in boilers, cooling towers
Scale and microbial growth insulate heat transfer surfaces
Keeps surfaces clean, facilitating energy-efficient heat transfer
Membranes and other equipment are used to filter contaminants in water applications
Pores block, requiring more energy to push or pull clean water through surfaces
Keeps membrane surfaces free of contaminants, saving energy
Hot water is used in a multitude of industrial applications and often released hot
Recycling heated water for other applications saves energy required
Cleans and redirects heated water to other hot water applications, saving energy
Water Use Issue Nalco impact
15
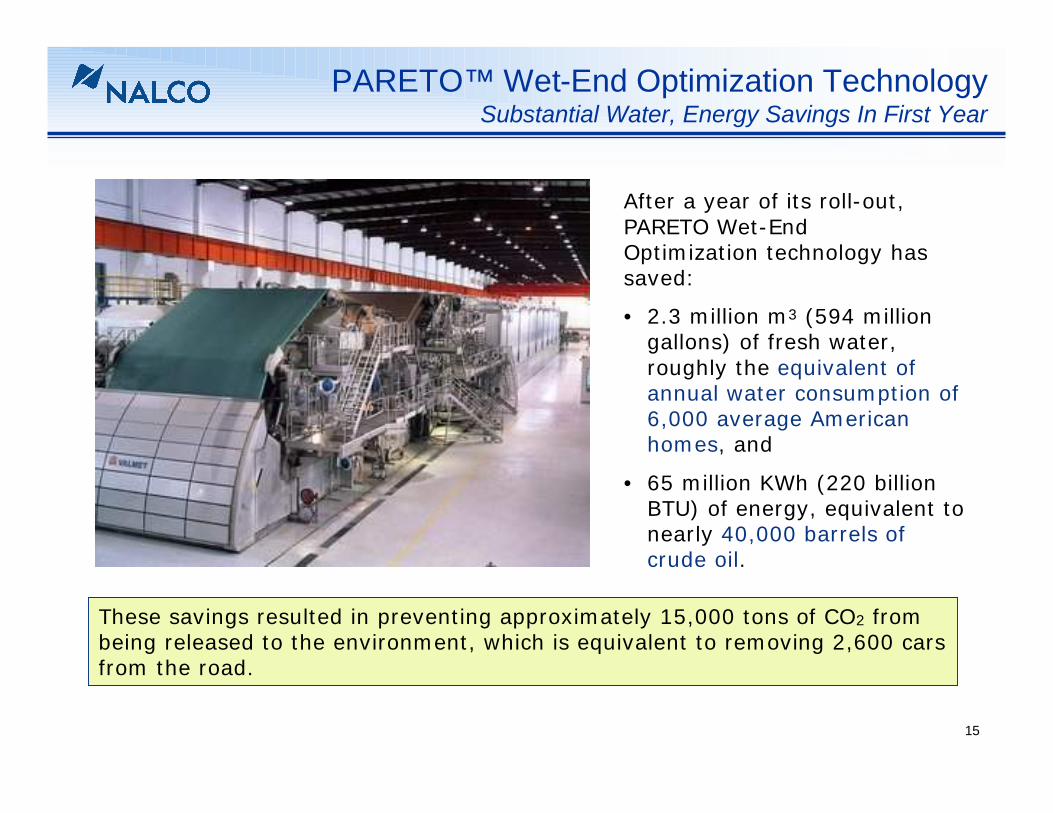
PARETO™ Wet-End Optimization TechnologySubstantial Water, Energy Savings In First Year
After a year of its roll-out,PARETO Wet-EndOptimization technology hassaved:
• 2.3 million m3 (594 million gallons) of fresh water, roughly the equivalent of annual water consumption of 6,000 average American homes, and
• 65 million KWh (220 billion BTU) of energy, equivalent to nearly 40,000 barrels of crude oil.
These savings resulted in preventing approximately 15,000 tons of CO2 from being released to the environment, which is equivalent to removing 2,600 cars from the road.
16
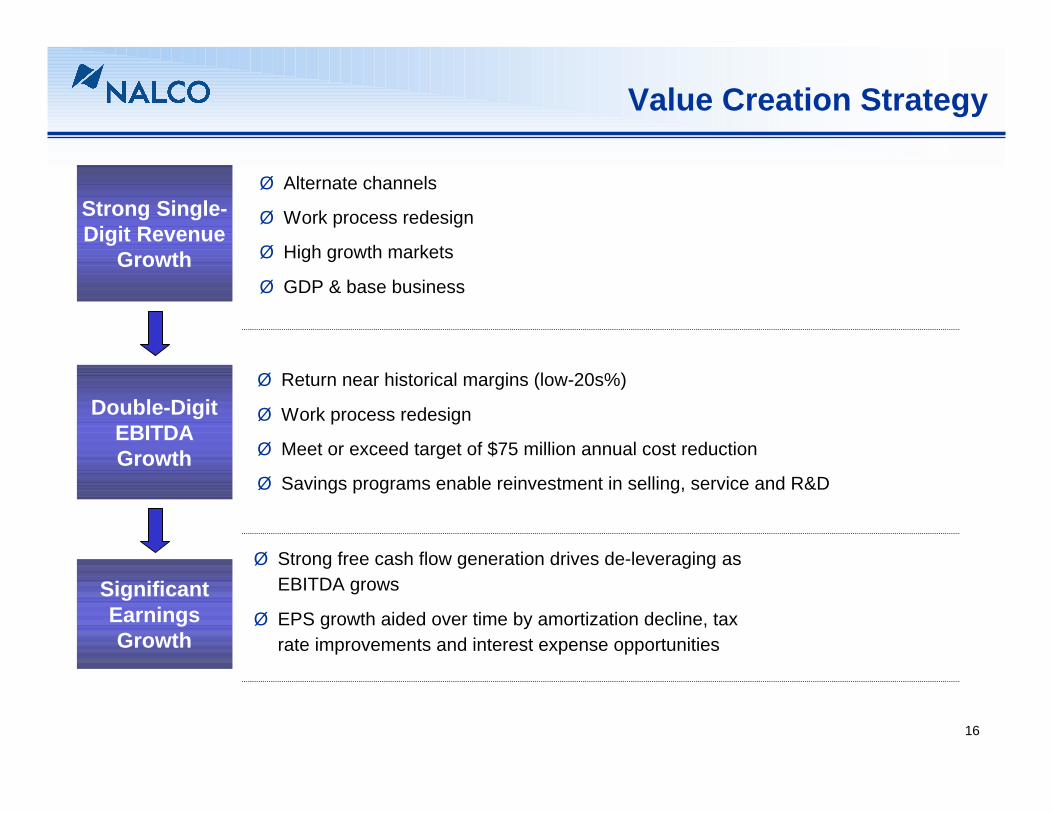
Value Creation Strategy
Strong Single-Digit Revenue
Growth
Double-Digit EBITDA Growth
Significant Earnings Growth
Ø Alternate channels
Ø Work process redesign
Ø High growth markets
Ø GDP & base business
Ø Strong free cash flow generation drives de-leveraging as EBITDA grows
Ø EPS growth aided over time by amortization decline, tax rate improvements and interest expense opportunities
Ø Return near historical margins (low-20s%)
Ø Work process redesign
Ø Meet or exceed target of $75 million annual cost reduction
Ø Savings programs enable reinvestment in selling, service and R&D
9/28/2007 1:24 PM metis\Roadshow Presentation\07 Roadshow Secondary Follow On
Nalco.ppt
17
Appendix
18
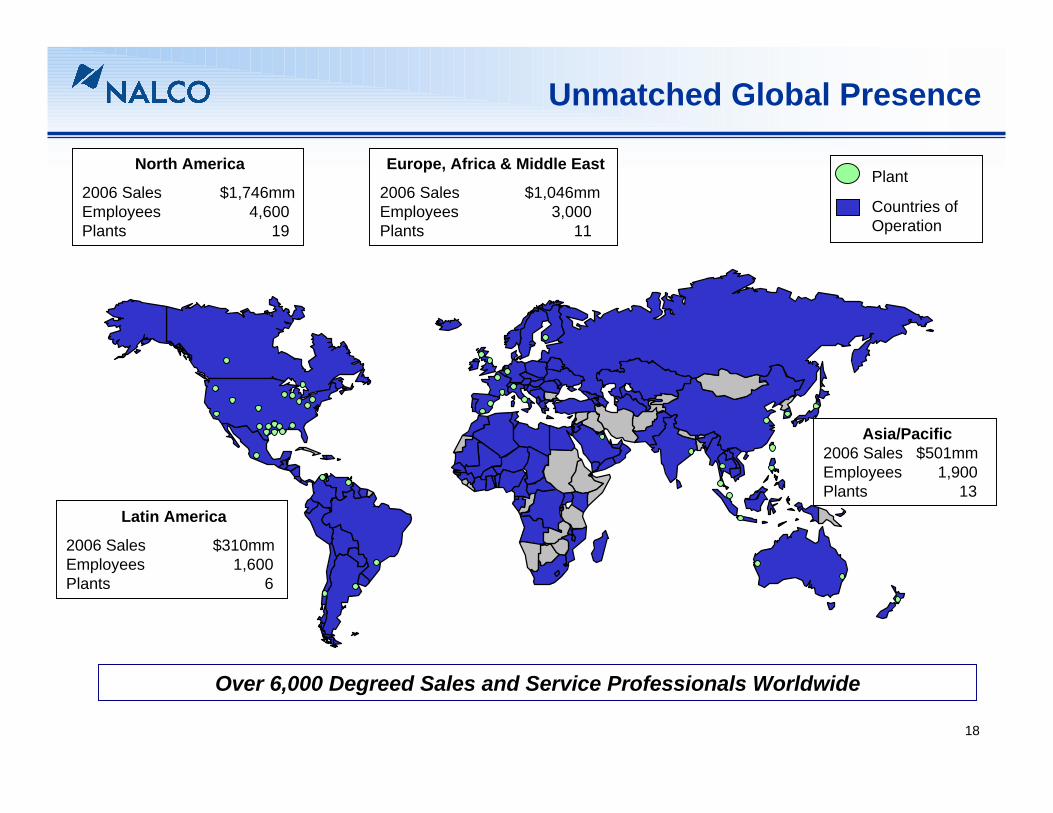
Unmatched Global Presence
Latin America
2006 Sales $310mmEmployees 1,600Plants 6
North America
2006 Sales $1,746mmEmployees 4,600Plants 19
Europe, Africa & Middle East
2006 Sales $1,046mmEmployees 3,000Plants 11
Asia/Pacific2006 Sales $501mmEmployees 1,900Plants 13
Countries of Operation
Plant
Over 6,000 Degreed Sales and Service Professionals Worldwide
19
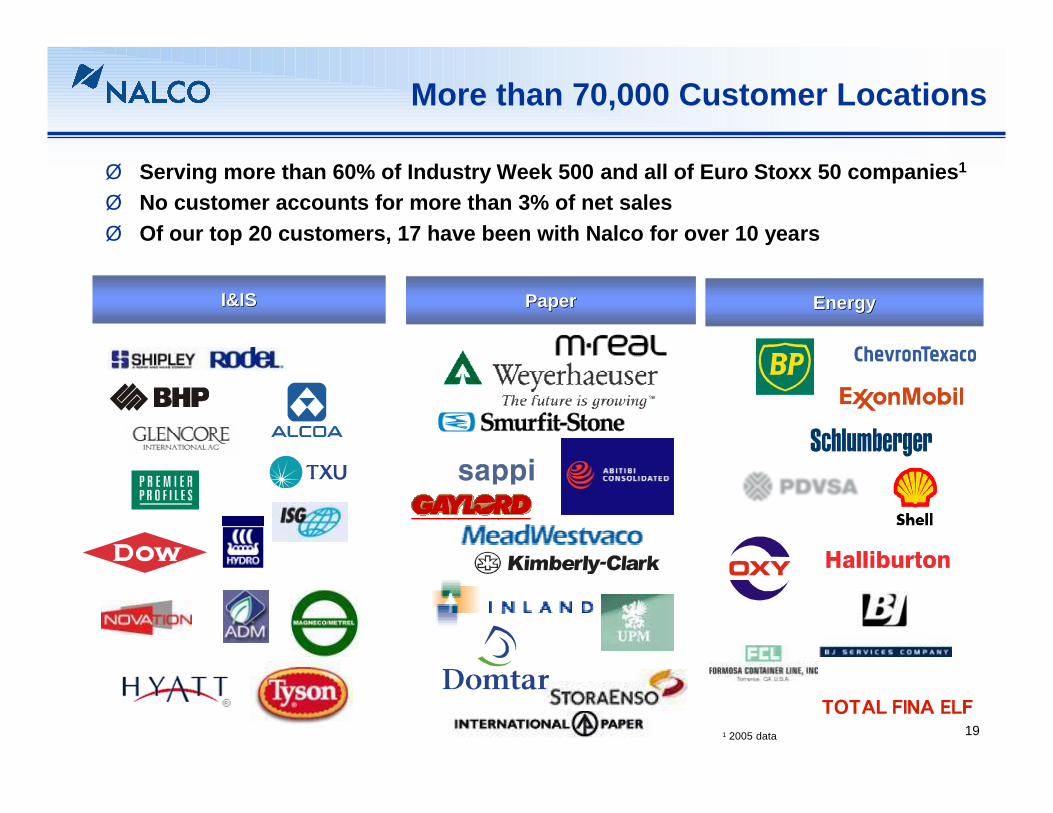
More than 70,000 Customer Locations
Ø Serving more than 60% of Industry Week 500 and all of Euro Stoxx 50 companies1
Ø No customer accounts for more than 3% of net salesØ Of our top 20 customers, 17 have been with Nalco for over 10 years
EnergyEnergyI&ISI&IS PaperPaper
1 2005 data
20
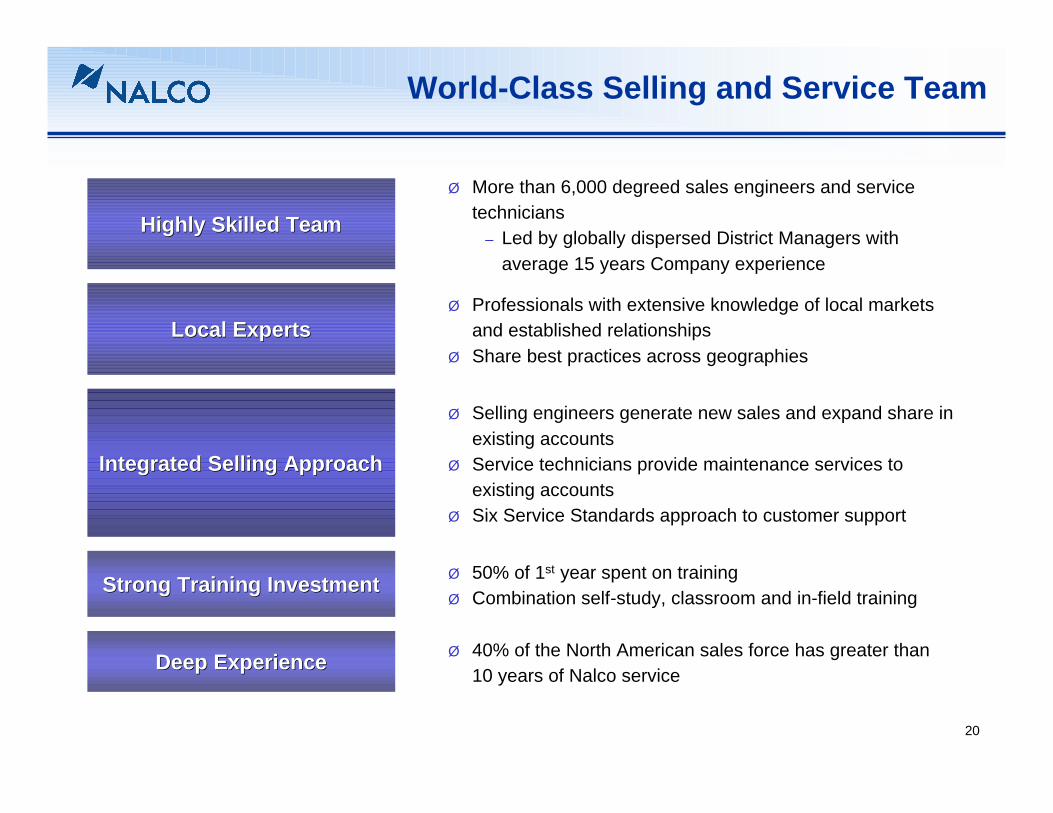
World-Class Selling and Service Team
Ø 40% of the North American sales force has greater than 10 years of Nalco serviceDeep ExperienceDeep Experience
Ø 50% of 1st year spent on trainingØ Combination self-study, classroom and in-field trainingStrong Training InvestmentStrong Training Investment
Ø Selling engineers generate new sales and expand share in existing accounts
Ø Service technicians provide maintenance services to existing accounts
Ø Six Service Standards approach to customer support
Integrated Selling ApproachIntegrated Selling Approach
Ø Professionals with extensive knowledge of local markets and established relationships
Ø Share best practices across geographiesLocal ExpertsLocal Experts
Ø More than 6,000 degreed sales engineers and service technicians
– Led by globally dispersed District Managers with average 15 years Company experience
Highly Skilled TeamHighly Skilled Team
21
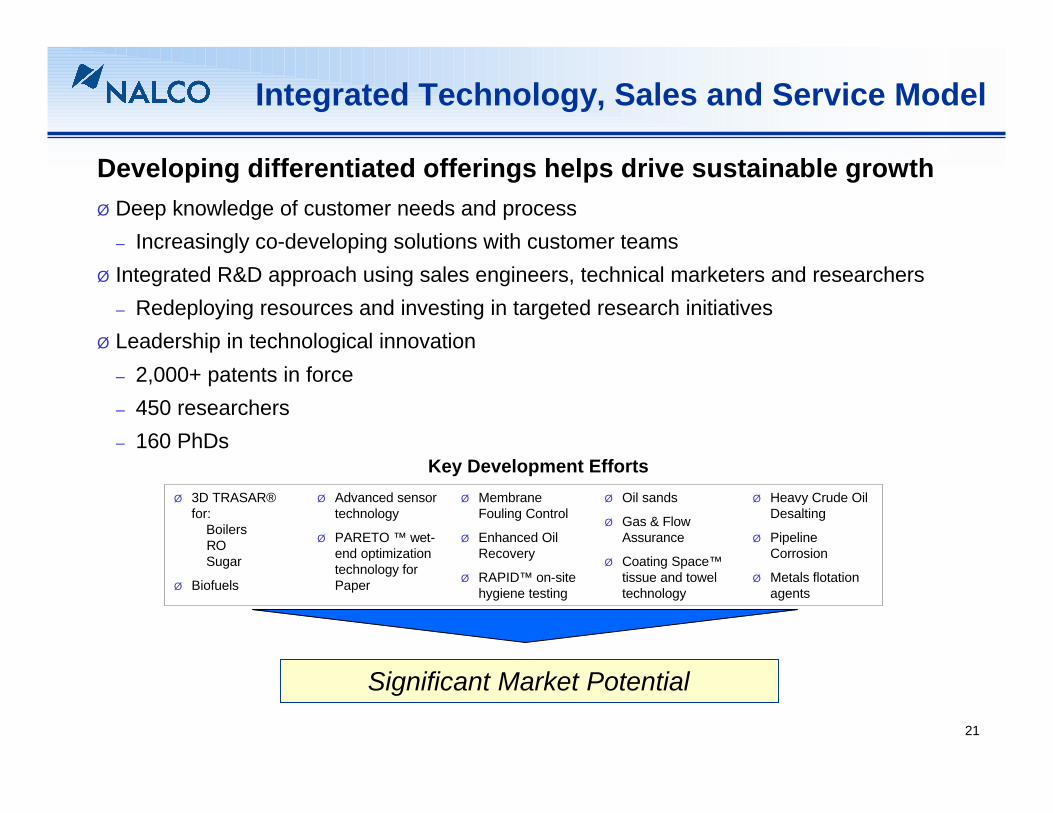
Integrated Technology, Sales and Service Model
Developing differentiated offerings helps drive sustainable growthØ Deep knowledge of customer needs and process
– Increasingly co-developing solutions with customer teamsØ Integrated R&D approach using sales engineers, technical marketers and researchers
– Redeploying resources and investing in targeted research initiativesØ Leadership in technological innovation
– 2,000+ patents in force– 450 researchers– 160 PhDs
Key Development EffortsØ Heavy Crude Oil
Desalting
Ø Pipeline Corrosion
Ø Metals flotation agents
Ø Oil sands
Ø Gas & Flow Assurance
Ø Coating Space™tissue and towel technology
Ø Membrane Fouling Control
Ø Enhanced Oil Recovery
Ø RAPID™ on-site hygiene testing
Ø Advanced sensor technology
Ø PARETO ™ wet-end optimization technology for Paper
Ø 3D TRASAR®for:
BoilersROSugar
Ø Biofuels
Significant Market Potential
22
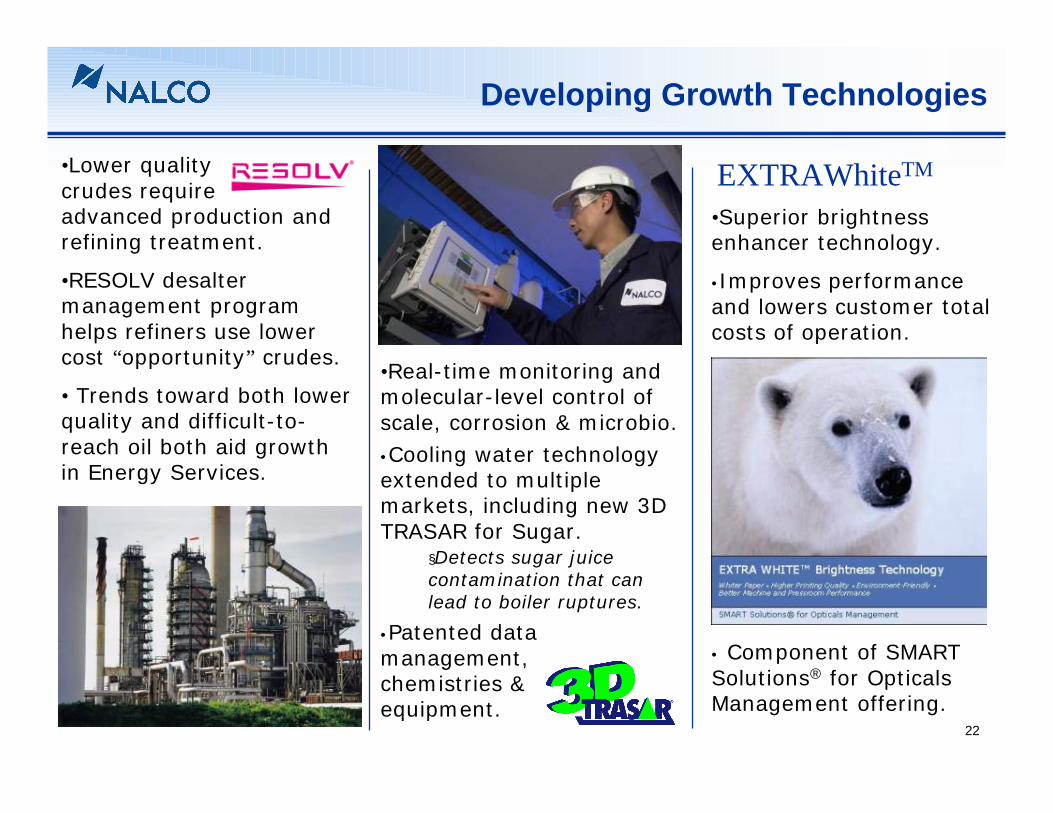
•Superior brightness enhancer technology.
•Improves performance and lowers customer total costs of operation.
• Component of SMART Solutions® for OpticalsManagement offering.
Developing Growth Technologies
•Lower qualitycrudes requireadvanced production and refining treatment.
•RESOLV desalter management program helps refiners use lower cost “opportunity” crudes.
• Trends toward both lower quality and difficult-to-reach oil both aid growth in Energy Services.
•Real-time monitoring and molecular-level control of scale, corrosion & microbio.•Cooling water technology extended to multiple markets, including new 3D TRASAR for Sugar.
§Detects sugar juice contamination that can lead to boiler ruptures.
•Patented data management, chemistries &equipment.
EXTRAWhiteTM
23
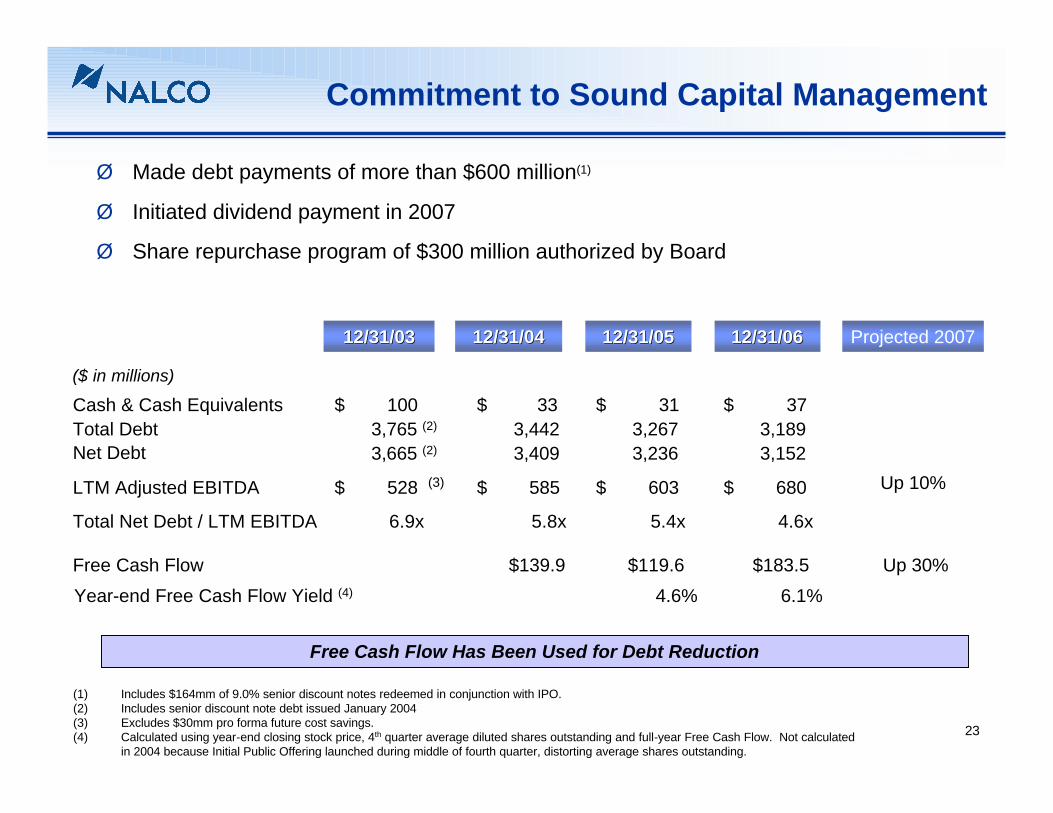
Ø Made debt payments of more than $600 million(1)
Ø Initiated dividend payment in 2007
Ø Share repurchase program of $300 million authorized by Board
Commitment to Sound Capital Management
Free Cash Flow Has Been Used for Debt Reduction
12/31/0312/31/03
($ in millions)
Cash & Cash Equivalents 100$ 31$ Total Debt 3,765 (2) 3,267Net Debt 3,665 (2) 3,236
LTM Adjusted EBITDA 528$ (3) 603$
Total Net Debt / LTM EBITDA 6.9x 5.4x
(1) Includes $164mm of 9.0% senior discount notes redeemed in conjunction with IPO.(2) Includes senior discount note debt issued January 2004(3) Excludes $30mm pro forma future cost savings.(4) Calculated using year-end closing stock price, 4th quarter average diluted shares outstanding and full-year Free Cash Flow. Not calculated
in 2004 because Initial Public Offering launched during middle of fourth quarter, distorting average shares outstanding.
12/31/0512/31/05 12/31/0612/31/06
37$ 3,1893,152
680$
4.6x
12/31/0412/31/04
33$ 3,4423,409
585$
5.8x
Projected 2007
Free Cash Flow $119.6 $183.5$139.9 Up 30%
Up 10%
Year-end Free Cash Flow Yield (4) 4.6% 6.1%
24
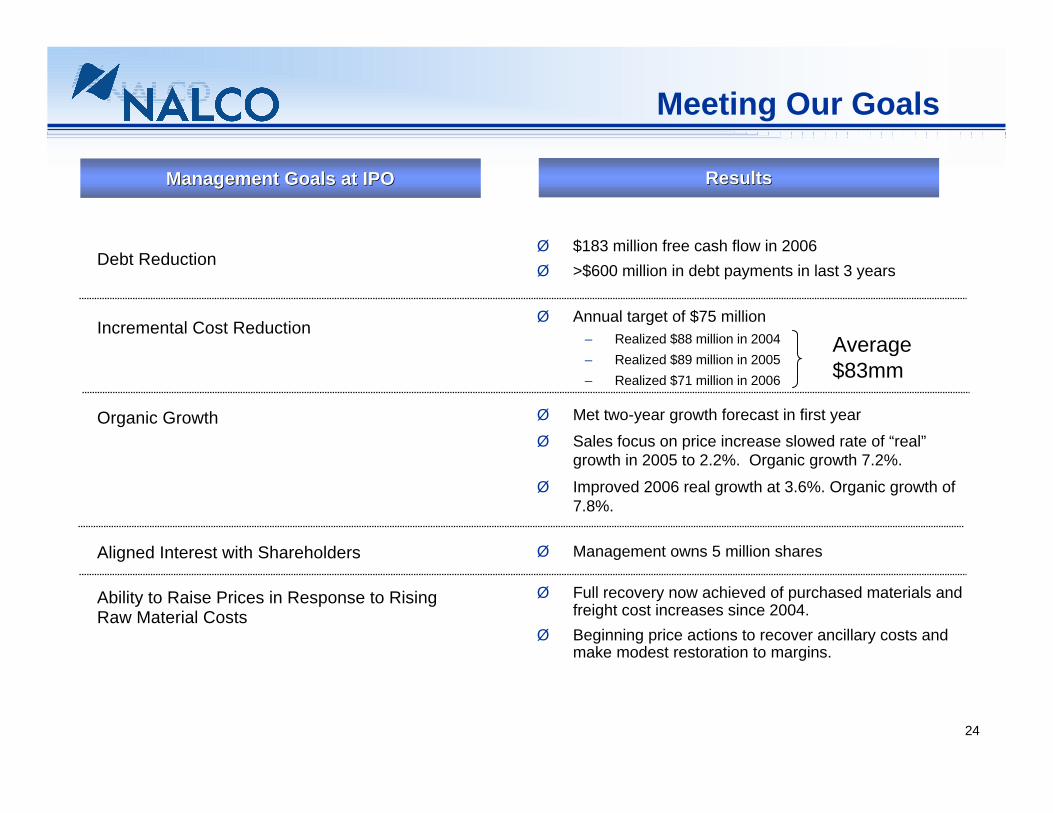
Meeting Our Goals
Debt Reduction
Incremental Cost Reduction
Organic Growth
Aligned Interest with Shareholders
Ability to Raise Prices in Response to Rising Raw Material Costs
Ø $183 million free cash flow in 2006Ø >$600 million in debt payments in last 3 years
Ø Annual target of $75 million– Realized $88 million in 2004– Realized $89 million in 2005– Realized $71 million in 2006
Ø Met two-year growth forecast in first yearØ Sales focus on price increase slowed rate of “real”
growth in 2005 to 2.2%. Organic growth 7.2%.Ø Improved 2006 real growth at 3.6%. Organic growth of
7.8%.
Ø Management owns 5 million shares
Ø Full recovery now achieved of purchased materials and freight cost increases since 2004.
Ø Beginning price actions to recover ancillary costs and make modest restoration to margins.
Management Goals at IPOManagement Goals at IPO ResultsResults
Average $83mm