Embed Size (px)
Citation preview

By
Dr. Raju SarkarDr. Raju Sarkar
Department of Civil & Environmental Engineering
Delhi Technological University(Formerly Delhi College of Engineering)

• Introduction
• Experimental Investigations and Material Properties
• Numerical Study on Pavements Constructed Using Stabilized Pond AshesStabilized Pond Ashes
• Conclusions

• One of the major challenges before manufacturing and production
industries is disposal of residual solid waste products.
• Present emphasis has been laid on residual solid products of thermal
power plants which utilize coal as a fuel for generation of power.
• In National Capital Region - Delhi alone, the production of ash is nearly
5000 tons by the three thermal power stations -Badarpur, Rajghat and
Dadri.

National Thermal Power Station (Badarpur)

Badarpur ash pond

National Thermal Power Station (Dadri)

Dadri ash pond

Pragati Thermal Power Station (Rajghat)

Rajghat ash pond

Few Definitions
Fly ash: fine fraction of ash collected through ESP (electrostatic precipitators) located inside Chimneys. Silt size.
Bottom ash: ash settled at the bottom of a furnace. Sand size.
Pond ash: fly ashes and bottom ashes sluiced in slurry form to ponds in the vicinity and gets collected in ponds is referred as pond ash. Heterogeneous material.Heterogeneous material.

Utilization of ashes
Fly ash: fine silt size, pozzolanic , used in cement manufacturing industry, in
concrete, brick making etc.
Bottom ash: sand size particles, alternative to fine aggregates in cement and
asphalt mixtures, and concrete. asphalt mixtures, and concrete.
Pond ash: with its heterogeneous character makes up for its subdued
chemical reactivity by its intergranular locking and is normally used
in the areas of bulk applications, such as structural fills, backfills,
embankments, road construction, etc.

Need of present study
The need of the present study arises from:
• Overall utilization of Industrial solid waste viz. pond ash needs be improved
i) to reduce the air pollution due to wind; to avoid mixing with surface runoff during flood; and to prevent leaching into the ground water.
Air pollutionFlooded ash pond near thermal power plant
Runoff mixed with pond ash in paddy field
Surface runoff mixed with pond ash

ii) to provide alternative material for road construction and raised embankments to reduce the pressure on conventional aggregates and local soil.
Road
Need of present study (contd.)
Raised embankmentRoad Raised embankment
• To remove confusion regarding cost benefit and provide technical inputs on utilization of several recently introduced materials (termed as admixtures or additives in this study) such as bentonite, fibers, lime, etc. in the stabilization of pond ash.
• Need to introduce better low cost additives, preferably, waste materials for better utilization of pond ash.

Objectives of the study
• Collection of pond ash samples from Badarpur, Dadri and Rajghat thermal power plants to determine physical and geotechnical properties of these pond ashes.
• Carry out Proctor compaction tests, triaxial shear tests and CBR tests on pond ash and its
Collection of pond ash sample from ash pond
Proctor compaction test Triaxial shear test CBR test
• Carry out finite element analysis of pavements having subbase layer made up of stabilized pond ash using PLAXIS.
Finite element analysis of pavements
CBR tests on pond ash and its mixes.

Materials used
Pond ash
Additives
Fiber(polypropylene, low
density, low softening temp. range, hydrophobic nature)
Lime(Calcium oxide – CaO, used to
stabilize soils)
Bentonite (montmorillonite, swelling property, highly absorbent)

New material introduced
(i) Gelatin
• A protein produced by partial hydrolysis of collagen extracted from the boiled bones, tissuesand organs of animals.
• Gelatin melts to a liquid when heated and solidifies when cooled again.
• Gelatin is used as a stabilizer and thickener.
Additives (contd.)
Gelatin
(ii) Starch
• Gelatin is used as a stabilizer and thickener.
• Carbohydrate found in all vegetable matters and in commercially recoverable quantities in Maize, Tapioca, Potato, Wheat and Rice.
• Maize starch used as binder, stabilizer, thickening and suspending agent in textile, paint, detergent and paper industry.
Gelatin
Starch

Waste material - Marble dust
• A by-product during cutting of marble.
• Waste is 20% of the total marble handled.
• Amount of marble dust generated in Rajasthan (from where the sample is collected) every year is 5-6 million tonnes.
Additives (contd.)
Marble industry of Rajasthan

Dry Marble dust Slurry Marble dust
Marble dust

Admixture Percentage
Bentonite 2, 5, 8, 10
Fiber0.5, 1.0, 1.5, 2.0, 2.5,
3.0, 3.5
Percentages of admixtures used for stabilizing pond ash
Details of experiments Materials Standard codes used
a) Specific gravity Pond ashes RILEM (1989)
b) Grain size distribution Pond ashes IS: 2720 ( Part 4) – 1985
c) Atterberg limit tests Pond ashes IS: 2720 ( Part 5) – 1985
d) Compaction tests:
Experimental programme
Lime 2, 5, 8, 10
Marble dust 2, 5, 8, 10
Gelatin-Starch
(1:2)0.5, 1.0, 1.5, 2.0, 2.5
d) Compaction tests:
i) Light compaction (standard Proctor) test
ii) Heavy compaction (modified Proctor)
test
Pond ashes
and mixes
IS: 2720 ( Part 7) – 1980
IS: 2720 ( Part 8) – 1983
e) Consolidated drained triaxial tests under
confining pressures of 100, 200, and 300 kPa
Pond ashes
and mixes
IS: 2720 ( Part 11) –
1981
f) California Bearing Ratio testPond ashes
and mixes
IS: 2720 ( Part 16) –
1987

Test results and discussions
Specific gravity (G)
• Specific gravity of Badarpur, Dadri and Rajghat pond ashes are 2.20, 1.96
and 2.10.
• Specific gravity of Indian coal ashes reported by Sridharan (2001) is 1.46• Specific gravity of Indian coal ashes reported by Sridharan (2001) is 1.46
to 2.66.

Grain size analysis
• Uniformity coefficient of Badarpur, Dadri and Rajghat pond ashes are 4.8,
5.96 and 5.11.
• McLaren and DiGioia (1987) have reported the mean value of uniformity
coefficient as 5.49 ±3.6.

Atterberg limit tests
• Liquid limits of Badarpur, Dadri and Rajghat pond ash are 38.5%, 46.6%
and 43.8%.
• Plastic limit test showed non-plastic behavior.
• Havanagi (1999) obtained the liquid limit of Rajghat fly ash as lying
between 38% to 51%.

Compaction characteristics
Type of Pond Ash Type of Proctor Compaction Test Value
Badarpur
StandardMDD (kN/m3) 12.0
OMC (%) 32.0
ModifiedMDD (kN/m3) 14.9
OMC (%) 24.0
StandardMDD (kN/m3) 11.0
OMC (%) 33.0
Table: Proctor compaction test results of pond ashes
Dadri
StandardOMC (%) 33.0
ModifiedMDD (kN/m3) 13.8
OMC (%) 22.1
Rajghat
StandardMDD (kN/m3) 11.9
OMC (%) 30.9
ModifiedMDD (kN/m3) 14.4
OMC (%) 25.2

15
20
Standard Proctor Test (Badarpur Pond Ash) Modified Proctor Test (Badarpur Pond Ash)
Standard Proctor Test (Dadri Pond Ash) Modified Proctor Test (Dadri Pond Ash)
Standard Proctor Test (Rajghat Pond Ash) Modified Proctor Tests (Rajghat Pond Ash)
Dry
Den
sity
(k
N/m
3 )
Fig.: Standard and modified Proctor test results for Badarpur, Dadri and Rajghat pond ashes
5
10
5 15 25 35 45Water Content (%)
Dry
Den
sity
(k
N/m
PropertiesSource of pond ash
Badarpur Dadri Rajghat
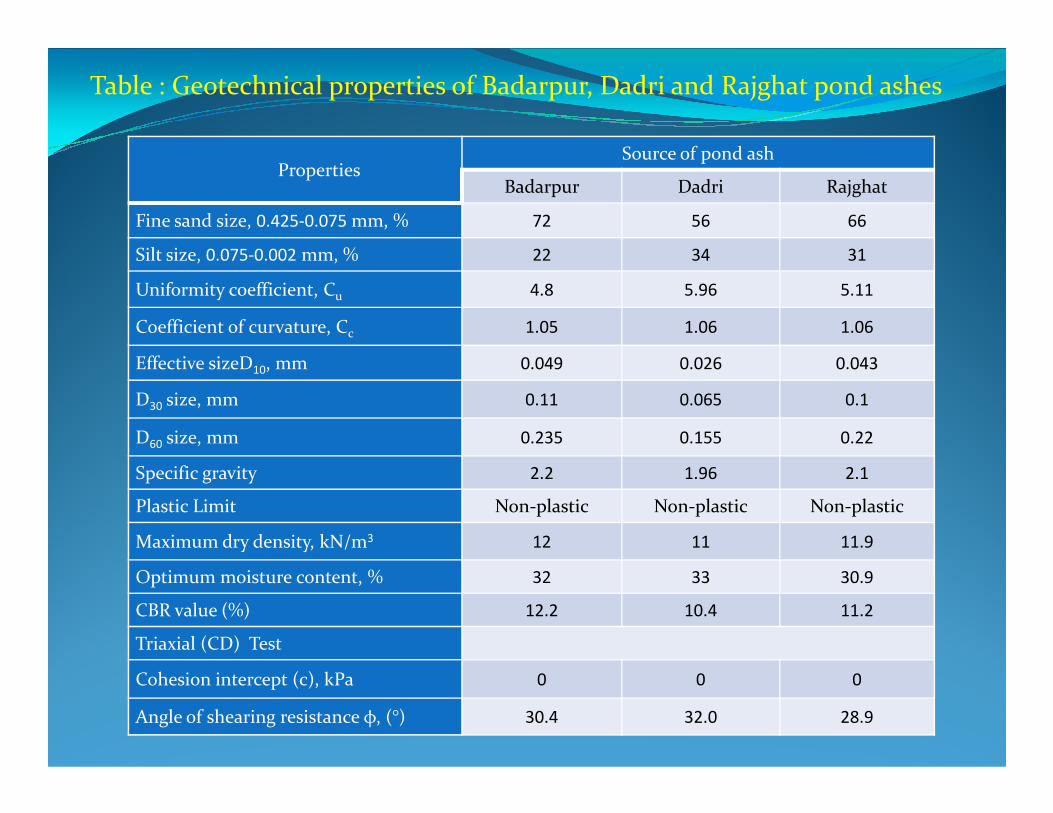
Fine sand size, 0.425-0.075 mm, % 72 56 66
Silt size, 0.075-0.002 mm, % 22 34 31
Uniformity coefficient, Cu 4.8 5.96 5.11
Coefficient of curvature, Cc 1.05 1.06 1.06
Effective sizeD10, mm 0.049 0.026 0.043
D30 size, mm 0.11 0.065 0.1
Table : Geotechnical properties of Badarpur, Dadri and Rajghat pond ashes
D30 size, mm 0.11 0.065 0.1
D60 size, mm 0.235 0.155 0.22
Specific gravity 2.2 1.96 2.1
Plastic Limit Non-plastic Non-plastic Non-plastic
Maximum dry density, kN/m3 12 11 11.9
Optimum moisture content, % 32 33 30.9
CBR value (%) 12.2 10.4 11.2
Triaxial (CD) Test
Cohesion intercept (c), kPa 0 0 0
Angle of shearing resistance φ, (°) 30.4 32.0 28.9

Table: Comparison of highest MDD and corresponding OMC of pond ashes mixed with admixture
Admixture Percentage Type of Proctor's testBadarpur
pond ash
Dadri
pond ash
Rajghat pond
ash
Bentonite 2
StandardMDD (kN/m3) 11.8 10.8 11.5
OMC (%) 31.4 32.4 30.1
ModifiedMDD (kN/m3) 14.4 13.3 13.9
OMC (%) 23.4 21.8 24.5
Fiber 3
Standard MDD (kN/m3) 13.4 12.3 13.0
OMC (%) 28.8 29.7 27.6
ModifiedMDD (kN/m3) 15.9 14.9 15.5
OMC (%) 21.3 19.7 22.3
MDD (kN/m3) 13.9 13.1 13.6
Lime 8
Standard MDD (kN/m3) 13.9 13.1 13.6
OMC (%) 34.8 36.3 34.0
ModifiedMDD (kN/m3) 16.9 15.6 16.4
OMC (%) 26.6 25.5 28.1
Marble dust 10
Standard MDD (kN/m3) 13.8 13.2 13.6
OMC (%) 29.6 30.6 28.6
ModifiedMDD (kN/m3) 16.3 15.5 15.8
OMC (%) 21.5 20.0 23.0
Gelatin-Starch
(1:2)2.5
Standard MDD (kN/m3) 17.3 15.7 16.8
OMC (%) 30.3 28.3 29.5
ModifiedMDD (kN/m3) 20.8 19.2 19.9
OMC (%) 25.2 22.9 24.3

Consolidated drained (CD) triaxial test
• On saturated compacted specimens of pond ashes and their combinations;
under confining stresses of 100, 200 and 300 kPa.
• Axial strain at failure increases with an increase in confining pressure for all
pond ashes and when mixed with admixtures.
• Deviator stress attained peak value at axial strains of 1.5-3.0% for all
specimens and thereafter remained constant.

0
250
500
750
0 1 2 3
100 kPa 200 kPa 300 kPa
Axial Strain (%)D
evia
tori
cS
tres
s (k
Pa)
0
250
500
750
0 1 2 3
100 kPa 200 kPa 300 kPa
Axial Strain (%)
Dev
iato
ric
Str
ess
(kP
a)
0
250
500
750
0 1 2 3
100 kPa 200 kPa 300 kPa
Axial Strain (%)
Dev
iato
ric
Str
ess
(kP
a)
y = 0.5059x
0
100
200
300
400
100 300 500 700p (kPa)
q (
kP
a)
y = 0.5306x
0
100
200
300
400
100 300 500 700p (kPa)
q (
kP
a)
y = 0.483x
0
100
200
300
400
100 300 500 700p (kPa)
q (kPa)
Fig.: Deviatoric Stress vs. Strain and p-q behavior of(a) Badarpur Pond Ash (b) Dadri Pond Ash (c) Rajghat Pond Ash

Table: Comparison of highest φ value of pond ashes mixed with admixture
Admixture Percentage
Badarpur
Pond Ash
Dadri
Pond Ash
Rajghat
Pond Ash
c (kPa) φ (o) c (kPa) φ (o) c (kPa) φ (o)
Bentonite 2.0 13.0 30.0 15.2 31.6 12.2 28.5Bentonite 2.0 13.0 30.0 15.2 31.6 12.2 28.5
Fiber 3.0 14.6 34.1 12.4 33.8 14.9 33.6
Lime 8.0 0.00 33.0 0.00 33.1 0.00 32.4
Marble dust 10.0 0.00 32.5 0.00 32.4 0.00 31.3
Gelatin-Starch (1:2) 2.5 0.00 34.9 0.00 35.0 0.00 34.8

California Bearing Ratio (CBR) test
• Purpose of CBR test is to study the strength behavior of material when
used as a subbase material.
• CBR tests are carried out on pond ash and its mixes.
• Tests are carried out on the specimens compacted in accordance to
standard Proctor test.

Badarpur Pond ashRajghat Pond ashDadri Pond ash
(a) (b)
0
4
8
12
16
0 3 6 9 12
CB
R V
alu
e (%
)
Percentage Bentonite
5
15
25
35
45
0 1 2 3 4
CB
R V
alu
e (%
)
Percentage Fiber
Fig.: Variation of CBR value with percentage (a)Bentonite (b) Fiber (c) Lime (d) Marble dust
(a) (b)
0
10
20
30
40
0 3 6 9 12
CB
R V
alu
e (%
)
Percentage Lime
0
8
16
24
32
0 3 6 9 12
CB
R V
alu
e (%
)
Percentage Marble Dust(c) (d)

Badarpur Pond ash Rajghat Pond ashDadri Pond ash
0
12
24
36
48
0.6 1.2 1.8 2.4 3
CB
R V
alu
e (%
)
(e)
0.6 1.2 1.8 2.4 3
Percentage Gelatin-Starch
Fig.: Variation of CBR value with percentage (e) Gelatin-Starch

Table: Comparison of highest CBR value in percentage of pond ashes mixed with admixture
Admixture Percentage
CBR Value (%)
Badarpur
Pond Ash
Dadri
Pond Ash
Rajghat Pond
Ash
Bentonite 2.0 11.9 10.1 10.8
Fiber 3.0 38.7 35.6 37.9
Lime 8.0 33.9 31.2 32.3
Marble dust 10.0 29.0 24.2 26.7
Gelatin-Starch (1:2) 2.5 42.7 36.9 40.2

• Finite Element Analysis (FEA) is most important numerical method to
solve complex geotechnical problems.
• Present study uses the PLAXIS computer program to predict the stress-
strain distribution within the different layers of pavement.

PLAXIS
PLAXIS has following features:
• Analyses such as static, modal, spectrum, transient and harmonic.
• Two-dimensional (plane stress, plane strain) and three-dimensional • Two-dimensional (plane stress, plane strain) and three-dimensional
analyses.
• Various constitutive models such as elastic, elasto-plastic (Mohr-
Coulomb), etc.

Pavement section
• A typical pavement structure is designed considering subgrade material
as Delhi silt with CBR equal to 9%.
• Traffic load of 100 million standard axles (msa) as per IRC: 37-2001.
Bituminous Concrete 50 mm
DBM Course 135 mm
3750 mm
Subgrade Course 300 mm
DBM Course 135 mm
WBM Course 250 mm
Sub-base Course 200 mm
935 mm
Fig.: Pavement structure (not in scale)
2
1

Ei = 1020 MPa, ν = 0.35Bituminous Concrete
(BC)
Dense Bituminous Macadam
(DBM)Ei = 750MPa, ν = 0.35
Water Bound Macadam
(WBM)
Ei = 167.6 MPa, ν = 0.35, c = 0, φ = 48o
50 mm
250 mm
135 mm
575 kPa
(BC and DBM)Linear elastic
response
Subbase
Ei = 34.5 MPa, ν = 0.35, c = 0, φ = 30.4o
Subgrade
Ei = 30 MPa, ν = 0.30, c = 0, φ = 32o
Fig.: Finite element discretization of pavement section
1100 mm150 mm
200 mm
300 mm
(WBM, Subbase and Subgrade)Elasto-plastic
(Mohr-Coulomb relationship)

Table: Values of modulus of elasticity and Poisson’s ratio and shear parameters for different pavement material
Pavement LayersConstitutive
Model
Modulus of
Elasticity
(Ei) (MPa)
Poisson’s
Ratio (ν)
Shear strength
parameters
c (kPa) ɸ (o)
Bituminous
Concrete (BC)Elastic 1020.0 0.35 - -
Dense Bituminous
Macadam (DBM)Elastic 750.0 0.35 - -
Macadam (DBM)Elastic 750.0 0.35 - -
Water Bound
Macadam (WBM)
Elasto-plastic
(Mohr-
Coulomb)
167.6 0.35 0 48
Subbase (range is
given for all
materials)
Elasto-plastic
(Mohr-
Coulomb)
30-140 0.35 0.0-14.9 26.9-43.0
Subgrade (Delhi silt)
Elasto-plastic
(Mohr-
Coulomb)
30.0 0.30 0 32

Table: Values of modulus of elasticity , density and shear parameters for different subbase materials
Material
Maximum Dry
Density (γd)
(kN/m3)
Modulus of
Elasticity (Ei)
(MPa)
Shear parameters
c (kPa) ɸ (o)
Pond ash
(Badarpur, Dadri, Rajghat)11.0-12.0 35.4-50.0 0 28.9-32.0
Pond ash mixed with bentonite
(2%, 5%, 8% and 10%)10.0-11.8 24.7-43.3 0 26.9-31.6
Pond ash mixed with fiber (0.5%, 1.0%,
1.5%, 2.0%, 2.5%, 3.0% and 3.5%)11.2-13.4 56.0-133.0 12.4-14.9 31.5-42.8
Pond ash mixed with lime
(2%, 5%, 8% and 10%)11.8-13.9 42.0-82.0 0 30.3-36.5
Pond ash mixed with marble dust
(2%, 5%, 8% and 10%)11.7-13.8 36.7-81.0 0 29.7-36.4
Pond ash mixed with gelatin-starch
(0.5%, 1.0%, 1.5%, 2.0% and 2.5%)11.8-17.3 40.0-140.0 0 31.3-43.0

Parametric study
• Detailed parametric study was carried out by considering the nominal
pavement as the standard structure and then varying the thickness of
each layer within practical limits.
LayerNominal pavement
thickness (mm)Variation in thickness (mm)
Table: Variation in thickness considered in pavement study
Layerthickness (mm)
Variation in thickness (mm)
Bituminous concrete (BC) 50 None
Dense Bituminous Macadam
(DBM)135 100, 135, 170, 205
Base Course (WBM) 250 150, 200, 250, 300, 350
Sub-base Course 200 200, 250, 300, 350, 400, 450, 500
Subgrade 300 None

0
200
0 500 1000 1500V
erti
cal
co
mp
ress
ive
stre
ss (
kP
a)Distance from centre of load (mm)
0
250
0 500 1000 1500
Distance from centre of load (mm)
Єv
(x1
0-3
%)
400
600
BC DBM WBM Subbase Subgrade
Ver
tica
l c
om
pre
ssiv
e
500
750
BC DBM WBM Subbase Subgrade
Fig.: Variation of (a) vertical compressive stress and (b) vertical compressive strain at the top of layers along the width of pavement (applied tyre pressure σv = 575 kPa)
(a) (b)

400
600
800
1000
0 200 400 600
Vertical compressive stress (kPa)D
epth
(m
m)
BC
DBM
WaterBound
Macadam
Subbase 400
600
800
1000
500 600 700 800ϵv (x10-3 %)
Dep
th (
mm
)
Fig.: Variation of (a) vertical compressive stress and (b) vertical compressive strain at the top of layers along the depth of pavement (applied tyre pressure σv = 575 kPa)
(a) (b)
0
200
400 Subbase
Subgrade
0
200
400

Design life of pavement
• IRC: 37-2001 : for design life against rutting failure alone:
NR = 4.1656 x 10⁻⁸ [1/ϵv]4.5337
NR = Cumulative standard axles to produce 20 mm rut depth
ϵv = Maximum vertical subgrade compressive strain
• Service life ratio (SLR) given below is used to compare the effect of subbase material type on service life of a pavement:
SLR = N1/N2
SLR = [ϵv2 / ϵv1]4.5337
where, N1, N2 = No. of traffic passes required to produce
allowable rutting for subbase materials 1 and 2

(a)
300
400
500
600
700
150 250 350 450 550
10% Bentonite 8% Bentonite 5% Bentonite 2% Bentonite 0% Bentonite
Sub-base thickness (mm)
Єv
(x10
-3 %
)
3.5% Fiber 3.0% Fiber 2.5% Fiber 2.0% Fiber1.5% Fiber 1.0% Fiber 0.5% Fiber
Fig. : Strain - Sub-base thickness behaviour of Badarpur pond ash mixed with (a) Bentonite (b) Fiber
(b)
200
280
360
440
520
150 250 350 450 550
1.5% Fiber 1.0% Fiber 0.5% Fiber
Sub-base thickness (mm)
Єv
(x10
-3 %
)

(c)
220
300
380
460
540
150 250 350 450 550Subbase thickness (mm)
2% Lime 5% Lime 8% Lime 10% Lime
Єv
(x10
-3 %
)
2% Marble Dust 5% Marble Dust 8% Marble Dust 10% Marble Dust
Fig. : Strain - Sub-base thickness behaviour of Badarpur pond ash mixed with (c) Lime (b) Marble dust
(d)
200
300
400
500
600
150 250 350 450 550Subbase thickness (mm)
2% Marble Dust 5% Marble Dust 8% Marble Dust 10% Marble Dust
Єv
(x10
-3 %
)

100
300
500
700
2% Bentonite 3.0% Fiber 8% Lime 10% Marble Dust
2.5% G-S CSM Pond ashЄ
v(x
10
-3 %
)
Fig.: Variation for different admixtures that gave the minimum vertical strain
100
150 250 350 450 550
Subbase thickness (mm)
200 300 380234 500

Table: Minimum vertical compressive strains at the top of subgrade in microns and service life ratio for different material
(subbase thickness = 200 mm)
Badarpur Dadri RajghatP
on
d a
sh a
lon
e
Fib
er (
3.0
%)
Lim
e (8
.0%
)
Mar
ble
Du
st (
8.0
%)
Gel
atin
-Sta
rch
(2
.5%
)
CS
M
Po
nd
ash
alo
ne
Fib
er (
3.0
%)
Lim
e (8
.0%
)
Mar
ble
Du
st (
8.0
%)
Gel
atin
-Sta
rch
(2
.5%
)
CS
M
Po
nd
ash
alo
ne
Fib
er (
3.0
%)
Lim
e (8
.0%
)
Mar
ble
Du
st (
8.0
%)
Gel
atin
-Sta
rch
(2
.5%
)
CS
M
Po
nd
ash
alo
ne
Fib
er (
Lim
e (
Mar
ble
Du
st (
Gel
atin
CS
M
Po
nd
ash
alo
ne
Fib
er (
Lim
e (
Mar
ble
Du
st (
Gel
atin
CS
M
Po
nd
ash
alo
ne
Fib
er (
Lim
e (
Mar
ble
Du
st (
Gel
atin
CS
M
VCS* 540 360 399 475 321 342 562 390 410 505 342 365 547 375 408 485 319 355
SLR** 0.13 0.79 0.42 0.23 1.33 1.00 0.14 0.74 0.37 0.23 1.34 1.00 0.14 0.78 0.38 0.24 1.62 1.00
*Vertical Compressive Strain**Service Life Ratio

Table: Variation in equivalent thicknesses due to different subbase materials for same life of pavement for Badarpur pond ash
Material
Subbase
thickness
(mm)
Increase in
subbase
thickness
(%)
WBM
thickness
(mm)
Increase in
WBM
thickness
(%)
DBM
thickness
(mm)
Increase
in DBM
thickness
(%)
CSM 200 0 250 0 135 0.0
Pond Ash + Fiber (3.0%) 234 17.0 278 11.2 151 11.9
Pond Ash + Lime (8.0%) 300 50.0 358 43.2 209 54.8
Pond Ash + Marble Dust
(10.0%)380 90.0 478 91.2 285 111.1
Pond Ash alone 500 150.0 542 116.8 345 155.6
Pond Ash + Gelatin-Starch
(2.5%)175 -12.5 215 -14.0 115 -14.8

Table: Thickness and cost of construction of various layers
Pav
emen
t C
om
po
nen
t
Su
bgr
ade
Sub-base Course
WB
M C
ou
rse
DB
M C
ou
rse
Bit
um
ino
us
Co
ncr
ete
Po
nd
ash
Po
nd
ash
+B
ento
nit
e (2
%)
Po
nd
ash
+F
iber
(3%
)
Po
nd
ash
+L
ime
(8%
)
Po
nd
ash
+M
arb
le d
ust
(10
%)
Po
nd
ash
+G
elat
in-s
tarc
h (
2.5%
)
Cost analysis
Pav
emen
t C
om
po
nen
t
Su
bgr
ade
WB
M C
ou
rse
DB
M C
ou
rse
Bit
um
ino
us
Co
ncr
ete
CS
M
Po
nd
ash
Po
nd
ash
+B
ento
nit
e (2
%)
Po
nd
ash
+F
iber
(3%
)
Po
nd
ash
+L
ime
(8%
)
Po
nd
ash
+M
arb
le d
ust
(10
%)
Po
nd
ash
+G
elat
in
Thickness
(mm)300 200 250 135 50
Cost per
m3 (Rs.)111.6 953.81 100.83 188.58 887.43 136.47 100.83 554.43 1371.14 5429.45 6402.75

Table: Percentage saving in cost for 1 km long pavement section with stabilized subbase layer for the same service life
Sl.
No.
Pavement
Component
Top width
(m)
Bottom
width (m)
Height*
(m)
Volume
(m3)
Rate per m3
(Rs.)
Total Rate
(Rs.)
Total Cost (Rs.)
(1+2+3+4+5)
Saving in
cost (%)
1Bituminous
Course3.750 3.950 0.050 192.5 6402.75 1232529
2 DBM Course 3.950 4.490 0.135 569.7 5429.45 3093158
3 WBM Course 4.490 5.490 0.250 1247.5 1371.14 1710497
4 Subgrade 6.290 7.490 0.300 2067 111.6 230677
5 Sub-base Course 5.490 6.290
(a) CSM 0.200 1178.0 953.81 1123588 7390450 -
(b) Pond Ash 0.500 2945.0 100.83 118778 6385639 13.6
Pond Ash + Bentonite (2%):
(c)
Pond Ash + Bentonite (2%):
(since this was the minimum
percentage used in tests)
0.570 3357.3 188.58 222147 6489009 12.2
(d)
Pond Ash + Fiber (3.0%):
(since this was the minimum
percentage used in tests)
0.234 1378.3 887.43 1045393 7312254 1.1
(e)
Pond Ash + Lime (8.0%):
(since this was the minimum
percentage used in tests)
0.300 1767.0 136.47 160762 6427623 13.0
(f)
Pond Ash + Marble Dust (10.0%):
(since this was the minimum
percentage used in tests)
0.380 2238.2 100.83 118778 6385639 13.6
(g)
Pond Ash + Gelatin-Starch (2.5%):
(since this was the minimum
percentage used in tests)
0.175 1030.8 554.43 653119 6919980 6.4
* Equivalent thickness for same SLR

• Pond ash samples of Badarpur, Dadri and Rajghat are sand size particles of 72%, 56% and 66% respectively.
• Of all the admixtures , bentonite gave CBR value less than 20. As per IRC: 2001, the CBR value of a subbase material should be at least 20 for low volume roads. So Bentonite mixed with the pond ash is not suitable.
• Vertical compressive strain at the top of subgrade is minimum in case of • Vertical compressive strain at the top of subgrade is minimum in case of pond ash stabilized with gelatin-starch.
• Comparing subbase, WBM and DBM, the variation in subbase thickness gives the maximum saving in the total cost of construction for the same service life ratio.

Thank You