Embed Size (px)
Citation preview

Abstract The objective of the work was to analyse a 2D concrete beam using non-linear analysis. This report has produced four parametric studies altering the positioning of the point load, the depth of the beam, the length of the beam, the amount of rebar in the beam and the thickness of the beam. The work has then been verified using approximate analysis techniques and compared against a 3D model. It has been found that non-linear analysis gives a closer representation to what occurs in the real world as the beam is loaded. Verification techniques using stress and deflection have worked well while the beam is reacting linearly to an increase in loading. However, the techniques begin to diverge from the true result as the beams behave non-linearly. It has also been found that the non-linear models react very differently to linear models under extreme loading and are therefore vital when analysing large loading conditions. The modelling of crack widths has also been found to be very useful for serviceability limits in industry.
Group Members:
Oliver Harris – Student ID: 10346136
Lawrence Taylor – Student ID: 10395608
Yu Tam – Student ID: 10511595
Daniel Wilkinson – Student ID: 10342869
DR RAFIQ LUSAS
COURSEWORK Module Code: MATH511

1
Table of Contents 1.0 Introduction ...................................................................................................................................... 3
2.0 Literature Review .............................................................................................................................. 4
2.1 Failure Modes of Concrete Beams ................................................................................................ 4
2.2 Crack Control of Concrete Structures ........................................................................................... 4
2.3 Linear and Nonlinear Analysis ....................................................................................................... 5
2.4 Summary of Literature Search ...................................................................................................... 5
3.0 Methodology ..................................................................................................................................... 6
3.1 Model Assumptions: ..................................................................................................................... 7
4.0 Validation .......................................................................................................................................... 7
4.1 Equilibrium .................................................................................................................................... 7
4.2 Symmetry ...................................................................................................................................... 7
4.3 Supports ........................................................................................................................................ 7
5.0 Verification ........................................................................................................................................ 8
5.1 Approximate method .................................................................................................................... 8
5.2 Visual inspection of deflected shape ............................................................................................ 9
6.0 Observations ................................................................................................................................... 12
7.0 Parametric Studies .......................................................................................................................... 13
7.1 The Position of the Point Load – Lawrence Taylor (LT) ............................................................... 13
7.1.1 Beam Verification ................................................................................................................. 16
7.2 Beam Depth and Width – Daniel Wilkinson (DW) ...................................................................... 18
Changing the depth of beam ............................................................................................................ 19
Changing the length of the beam ..................................................................................................... 22
7.2.1 Beam Verification ................................................................................................................. 23
7.3 Size of Steel Reinforcement Bars and Compression Reinforcement – Oliver Harris (OH) .......... 24
Compression reinforcement ............................................................................................................. 26
7.3.1 Beam Verification ................................................................................................................. 28
7.4 Changing Beam Thickness– Yu Tam (YT) ..................................................................................... 29
7.4.1 Beam Verification ................................................................................................................. 32
8.0 Discussion ........................................................................................................................................ 33
8.1 Elastic to Plastic ........................................................................................................................... 33
8.2 Cracking ....................................................................................................................................... 33
8.3 Deflection .................................................................................................................................... 34
8.4 Model Discussion & Limitations .................................................................................................. 35
8.5 Assumptions ................................................................................................................................ 35
8.5 3D Model ..................................................................................................................................... 36

2
8.6 Real World Applications .............................................................................................................. 37
8.7 Verification of the Models .......................................................................................................... 38
9.0 Conclusion ....................................................................................................................................... 39
References ............................................................................................................................................ 40
Appendices ............................................................................................................................................ 42
Appendix A - Series of Contour Plots of Stress and Crack Paths as Load Increases ......................... 42

3
1.0 Introduction
Reinforced concrete beams take advantage of composite material properties utilising the high
compressive strength of concrete and the high tensile strength and ductile properties of steel
reinforcement. As the concrete around them deform, the tensile stresses are taken in by the steel
beams whilst the compressive stresses are resisted by the concrete; using each material property to
an advantage. This behaviour of the reinforced concrete occurs in both elastic and plastic modes
which makes the calculations of stress patterns and deflections particularly difficult to predict
accurately. Therefore, codes of practice use either elastic or plastic approaches for calculations of
the reinforced concrete beams and most calculations assume that the behaviour is elastic and that
cracks do not have an effect on the overall strength of the beam.
In this report, Finite Element Analysis (FEA) using LUSAS (software) has been undertaken to produce a nonlinear analysis of a simply supported reinforced concrete beam in a number of configurations through parametric studies. The beam model used is presented below in Figure 1 - The concrete beam model. To undertake a parametric study, five separate variables have been changed and the effects on the concrete beam have been studied and reported. The following characteristics of the beam have been changed in the following ways: (1) the width and the height of the reinforced concrete beam (2) the size of rebar in the beam (3) the thickness of the beam (4) the positioning of the point load along the beam.
Presented below are the aims and objectives of the parametric study:
Aim:
To investigate non-linear analysis of a concrete beam through a series of parametric studies in a Finite Element Analysis package and how the distribution of stresses is affected in order to discover the benefit of using non-linear analysis in building analysis.
Objectives:
Produce a thorough literature search encompassing all current knowledge of non-linear analysis of concrete beams.
Complete four parametric studies undertaken by individual members of the group of changing the beam geometry, reinforcement sizes, position of point load and load magnitude.
Use approximate analysis techniques to verify the FEA computer outputs.
Discuss observations of the FEA and the effectiveness of the use of models.
Discuss real world applications of techniques incorporating non-linear analysis of concrete beams
Figure 1 - The concrete beam model

4
2.0 Literature Review 2.1 Failure Modes of Concrete Beams Common forms of failure modes in concrete beams include compression, flexural and shear failure.
It is important to understand the concept of these failure modes so that the strength and durability
of a concrete beam may be enhanced by improved design. The failure patterns in the beam can be
used to assess how the beam failed e.g. flexural, shear etc. and how this type of failure may be
avoided. To assess the type of failure, the positioning and angle of the cracks in the beams can be
examined; Figure 2 below highlights the difference between shear and flexural cracking.
Shown in Figure 2, diagonal cracking indicates shear failure of the beam member and vertical cracks
along the base of the beam indicate flexural failure as the tensile forces exceed those of the
concrete (as the steel yields). This is noted by Richardson (no date) who also states that cracks due
to shear forces form where tension stresses due to shear are greatest e.g. near the supports of a
simply supported beam. According to Assakkaf (no date), shear failure of a beam is more difficult to
predict than flexural failure. If a beam does not have properly designed shear reinforcement, then it
may collapse suddenly and without warning. The analysis of the speed of failure is also noted by Al-
Nasra (2013) who states that “Since shear failure is frequently sudden with little or no advanced
warning, the design for shear must ensure that the shear strength for every member in the structure
exceeds the flexural strength”. The model to be investigated in this report does not include any
shear reinforcement and therefore this type of failure must be observed carefully if incorporated
into a real world design scenario. Not shown in Figure 2 are negative flexural cracking over the
supports on the top of the beam and also as vertical cracks (Pirro, 2012).
2.2 Crack Control of Concrete Structures A major design implication for reinforced concrete beams compared with those of steel beams is the
potential for cracking to occur once the tensile stress in the beam exceeds that of the concrete itself.
It is well known that the tensile strength of concrete is low (approximately 10% that of its
compressive strength) and should therefore be taken as zero during design. According to ‘Reinforced
Concrete’ (2016), cracking is hard to prevent and in fact there is micro cracking present in most
concrete beams. This cracking can lead to moisture penetration which will undermine the
reinforcement of the beam causing rusting and potentially spalling and damage to finishes. It should
be noted that flexural cracks may be related to longitudinal splitting cracks. This relationship is based
on splitting cracks allowing moisture to reach the steel pieces in the concrete and corrode them,
reducing their ability to resist flexure cracks. Reduction in resistance may cause additional flexural
cracks (Giuriani, 1998). Indeed, Eurocodes allow for cracking in concrete although reinforcement
spacing is limited which enables the cracking to be minimised. According to Brooker (2006), when
there are no specific requirements, crack widths in a beam should be limited to 0.3mm and under
Figure 2 - Highlighting the difference in crack patterns of shear and flexural failure (Paul, 2015).

5
certain criteria 0.4mm. This guidance is also noted by CIRIA (2014) which states that cracking is not a
defect, but the basis of reinforced concrete design, as reinforcement is used to control the crack
widths. It also notes that problems may occur when the cracks become too large (e.g. allowing water
ingress) making the structure unsuitable for use. CIRIA (2014) also provides design guidance to how
cracking should be limited: 0.3mm for durability, 0.05 to 0.2mm for water retaining structures and
0.3mm or greater for appearances. It’s worth noting that these measurements are for a guide
pertaining to ‘Early-age thermal crack control in concrete’, related to the entire lifespan of the
concrete used.
2.3 Linear and Nonlinear Analysis When designing structures, it is common to analyse them using linear elastic analysis methods i.e. a
concrete beam tested using Finite Element Analysis will produce reasonable results of how the beam
will behave under normal loading conditions. The material will not permanently deform and
therefore the assumptions used by the computer package will be correct. However, should the
concrete beam (or other structure) be loaded beyond its yield strength, linear FEA analysis will no
longer provide accurate results – the deflection is no longer linearly proportional to the applied
loading (Waters, 2012). Non-linear elastic analysis, as opposed to linear elastic analysis, takes into
account a number of factors that produce a safer and more cost effective estimation of structures
behaviour. Some of these features include nonlinear stress-strain behaviour, tensile cracking and
compression crushing failures and temperature-dependent creep strains (Bathe et al., 1989). Non-
linear analysis takes into account the propagation of cracks through the concrete, assuming that it is
non-elastic. This is unlike linear analysis which works on the assumption that the concrete is
completely elastic and therefore cracks do not form.
Mansur and Tan (1999) state that because the beam behaves in a nonlinear way at higher loads,
there will be a redistribution of forces and moments compared to results obtained from a purely
linear elastic analysis. Mansur and Tan (1999) go on to note that using only linear elastic analysis has
been found to give reasonable results for design purposes and that the effects of force redistribution
have been recognised by codes of practice, and are utilised in those design methods and checks by
performing redistribution of forces and moments.
To model a material using nonlinear analysis, LUSAS adopts the Newton-Raphson Method iterative
procedure in which a linear response is first estimated and then corrections occur to eliminate out of
balance forces. These corrections are referenced against the convergence criterion selected in the
initial setup of the problem (LUSAS, 2015). This is not the only recognised method for nonlinear
analysis. The modified Newton-Raphson method may also be adopted however the use of this
method may present more problems as the procedure may be more likely to diverge than converge
resulting in a failure of the method. Because of the usefulness of nonlinear analysis in design, this
report will utilise it to analyse the beams and compare these results against elastic finite element
analysis using LUSAS.
2.4 Summary of Literature Search To conclude, the report will pay particular attention to crack patterns that form in the reinforced
concrete beam as the load is incrementally increased. Attention will be made to these cracks to
understand the mode of failure. Crack control of the beams as highlighted in the literature search
above is also important to the serviceability of the structure. Note will be taken as to how large the
cracks are becoming in the beams.
The aims and objectives of this report have been detailed in Section 1.
6
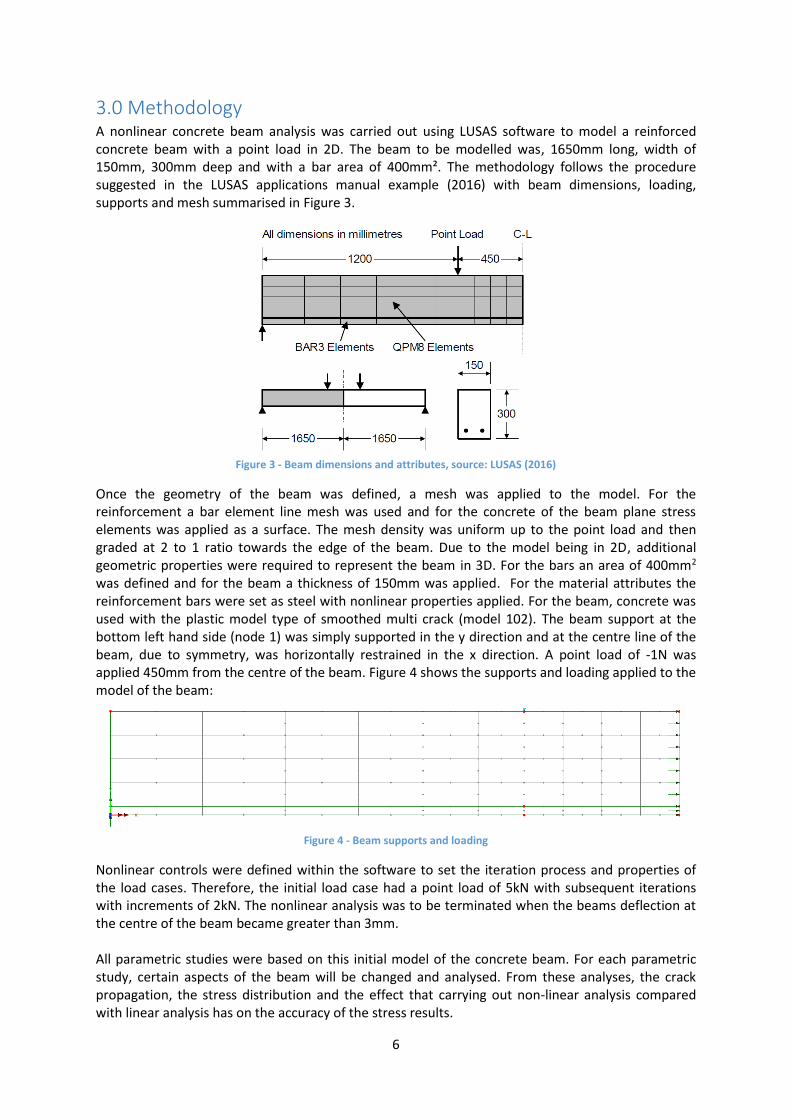
3.0 Methodology A nonlinear concrete beam analysis was carried out using LUSAS software to model a reinforced concrete beam with a point load in 2D. The beam to be modelled was, 1650mm long, width of 150mm, 300mm deep and with a bar area of 400mm². The methodology follows the procedure suggested in the LUSAS applications manual example (2016) with beam dimensions, loading, supports and mesh summarised in Figure 3.
Figure 3 - Beam dimensions and attributes, source: LUSAS (2016)
Once the geometry of the beam was defined, a mesh was applied to the model. For the reinforcement a bar element line mesh was used and for the concrete of the beam plane stress elements was applied as a surface. The mesh density was uniform up to the point load and then graded at 2 to 1 ratio towards the edge of the beam. Due to the model being in 2D, additional geometric properties were required to represent the beam in 3D. For the bars an area of 400mm2 was defined and for the beam a thickness of 150mm was applied. For the material attributes the reinforcement bars were set as steel with nonlinear properties applied. For the beam, concrete was used with the plastic model type of smoothed multi crack (model 102). The beam support at the bottom left hand side (node 1) was simply supported in the y direction and at the centre line of the beam, due to symmetry, was horizontally restrained in the x direction. A point load of -1N was applied 450mm from the centre of the beam. Figure 4 shows the supports and loading applied to the model of the beam:
Figure 4 - Beam supports and loading
Nonlinear controls were defined within the software to set the iteration process and properties of the load cases. Therefore, the initial load case had a point load of 5kN with subsequent iterations with increments of 2kN. The nonlinear analysis was to be terminated when the beams deflection at the centre of the beam became greater than 3mm. All parametric studies were based on this initial model of the concrete beam. For each parametric study, certain aspects of the beam will be changed and analysed. From these analyses, the crack propagation, the stress distribution and the effect that carrying out non-linear analysis compared with linear analysis has on the accuracy of the stress results.

7
3.1 Model Assumptions: The superposition of nodal degrees of freedom assumes that the concrete and
reinforcement are perfectly bonded.
Self-weight of beam negligible compared to point load.
Effects of shear reinforcement (shear links) can be ignored.
The deflection of 3mm is measured from the top right hand node of each model.
4.0 Validation
4.1 Equilibrium Using the LUSAS print wizard tool to find the reaction component in the global axis, it was found that
the only reaction in the y-direction (Fy) was at node 1. This was expected due to the concrete beam
being modelled as a half model in 2D with only node 1 being supported in the y-direction. The print
wizard tool was utilised for each load case checking that downward forces were equal to the
reactions at node 1, this is shown in table 1. This shows that the model is in equilibrium as the sum
of the applied load is equal to the sum of reactions.
Table 1 - LUSAS print wizard reaction results in Fy at node 1 for each applied load.
Point Load Applied (kN)
Reaction at node 1 - Fy
(kN)
5 5
7 7
9 9
11 11
13 13
15 15
4.2 Symmetry The concrete beam has symmetrical loading and support conditions along the centre line of the
beam, therefore a half model was used to represent the beam. To verify that the half model was
representing the full beam model, a stress contour plot of beam was mirrored along the centre line
as seen in figure 5. This shows that the maximum tension and compression occurs at the centre of
the beam which is to be expected as the supports are at the edge of the beam with the loading
occurring towards the centre. Therefore it is appropriate to use a half model and verifies that the
central support conditions applied to the model are correct.
Figure 5 - Half model with plane stress contours mirrored
4.3 Supports The support conditions used for the concrete beam model are simply supported at the edges in the y
direction. To model the support conditions, node 1 is restrained in translation in the y direction and
is free to translate and rotate in all other directions. The model is also restrained in translation in the
x-axis along the length of the right hand edge of the model which is a centreline. This represents the

8
centre of the beam as well as the simply supported edge as seen in figure 6. This shows that the
models restraints correspond to the structural support conditions and so correctly models them.
Figure 6 - Support conditions applied to model of concrete beam
5.0 Verification
5.1 Approximate method The model can be verified using the bending stress equation for approximate analysis. Figure 7
shows the line diagram of the beam and below are the calculations for the moment at the centre of
the beam that is then converted into a stress which is then compared to the LUSAS result.
Va = Vb = 5kN
𝐼 =𝑏𝑑3
12=
150 × 3003
12= 337,500,000𝑚𝑚4
Maximum moment @ centre of beam:
𝑀 = 𝑉𝑎 × 1.65 − 5 × 0.45 = 6𝑘𝑁𝑚
𝜎 =𝑀𝑌
𝐼=
6 × 150 𝑥 106
337500000= 2.667𝑁/𝑚𝑚2
This value is then compared to the maximum magnitude of plane stress at the centre of the beam
using a 2D graph cut along centre line as seen in figure 8. The profile of the plane stress at the centre
of the beam is linear with depth as predicted and with the largest stress of 2536kN/m2 and
2362kN/m2 occurring at the top and bottom of the beam respectively. Comparing the hand
calculation to the LUSAS stress plot shows excellent correlation. The validation was carried out on all
load cases and the results are summarised in table 2.
1.2m 0.45m
3.3m
5kN 5kN
0.15m
0.3m
Figure 7 - Approximate analysis of Concrete beam

9
Table 2 - Summary of Validation
Point Load Applied (kN)
Hand Stress Calculation N/mm2
LUSAS Result N/mm2
Percentage difference
Comment
5 2.667 2.536 4.9% Excellent
Correlation
7 3.733 3.556 4.7% Excellent
Correlation
9 4.800 4.725 1.6% Excellent
Correlation
11 5.867 6.368 8.5% Good
Correlation
13 6.933 8.766 26.4% Poor
Correlation
15 8.000 12.684 58.6% Poor
Correlation
Table 2 shows that the hand calculation have very good correlation with the LUSAS results for the
smaller loads applied to the beam. Whereas for the larger loads applied to the beam the correlation
between the hand calculations and LUSAS results becomes poor. This was to be expected as the
hand calculations assume that the material behaves elastically which, at smaller loads, the beam
primarily does. On the other hand, under larger loads, the beam begins to behave elastically as well
as plastically hence the variation with the hand calculations as they do not account for the plastic
behaviour of the beam. The model of the beam behaves as expected with excellent correlation for
the lower load factors therefore the model can be treated as valid.
Figure 8 - Cut at centre of beam showing profile of plane stress with respect to depth
5.2 Visual inspection of deflected shape The deflected shape of the beam is expected to be curved with the largest displacement at the
centre of the beam. The deflected shape can be seen in figure 9, and shows that the deflection
increases towards the centre of the beam, as expected.
-3000
-2000
-1000
0
1000
2000
3000
0 50 100 150 200 250 300
Pla
ne
Str
ess
(kN
/m2
)
Depth of Beam (mm)
Plane Stress vs. Beam Depth

10
Figure 9 - Deflected shape of beam half model
The magnitude of deflection has been calculated by using the bending deflection formula for a beam
as seen in figure 10 and the equations below.
Figure 10 - Line drawing of beam (Rafiq, 2016)
E = 42 x103 N/mm2
I = 337.5 x106 mm4
𝛿 =𝑊𝐿3
6𝐸𝐼[3𝑎
4𝐿−
𝑎3
𝐿3]
𝛿 =5000 × 33003
6 × 42 × 103 × 337.5 × 106[3 × 1200
4 × 3300−
12003
33003] = 0.47𝑚𝑚
A hand calculation was carried out for each load case and then compared to the LUSAS result which
is summarised in table 3.
Table 3 - Summary of deflection validation
Point Load Applied (kN)
Hand Deflection Calculation (mm)
LUSAS Result (mm)
Percentage difference
Comment
5 0.47 0.45 4.3% Excellent
Correlation
7 0.66 0.63 4.5% Excellent
Correlation
9 0.85 0.83 3.5% Excellent
Correlation
11 1.04 1.15 10.6% Good
Correlation
13 1.23 1.69 37.4% Poor
Correlation
15 1.42 3.09 117.6% No Correlation
As for the plane stress validation, the hand deflection calculations do not account for the plastic
behaviour of the beam and this is why there is no correlation between the methods for the point
load applied of 15kN. The hand calculations do not account for the reinforcement properties of the

11
bars and therefore only gives good results for where the beam behaves elastically. Generally the
magnitude of deflection as well as the deflected shape suggests that the model is valid.
For the parametric studies, each member of the group has undertaken a short verification process
mimicking the approximate methods in Sections 5.1 and 5.2.

12
6.0 Observations Figure 11 shows the profile of plane stresses for each load cases cut at the centre of the beam. From
this it can be seen how the stresses distribute as the load is increased and the cracks begin to form.
At 5kN the distribution of stresses is linear and suggests that the stress is spread evenly between the
top and bottom of the beam. As the load case increases, the maximum tension stresses moves
towards the centre of the beam as cracks form; the compression stress increases steadily at the top
of the beam. At 15kN, the distribution is highly non-linear with little stress at the bottom of the
beam, significant amounts of stress in tension is distributed at the centre.
Figure 11 - Profile of plane stresses
Attached in the Appendix A are a series of contour plots of stress as well as crack paths across the
beam. The Appendix shows that cracks propagate from the bottom surface of the centre of the
beam and as the load increases the crack propagates towards the top of the beam. For larger loads
cracks begin to appear towards the supports. From the contour plots it can be seen that for beams
with large amounts of cracking the stress redistributes towards the centre of the beam.
The cracks occurring in the concrete beam have small widths as seen in Figure 12 which shows the
contours of the crack widths, the maximum crack width being 0.11mm at the bottom of the beam.
Figure 12 - Crack widths of standard beam
0
50
100
150
200
250
300
-15 -10 -5 0 5
De
pth
of
Be
am (
mm
)
Plane Stress (N/mm2)
5kN
7kN
9kN
11kN
13kN
15kN

13
7.0 Parametric Studies
7.1 The Position of the Point Load – Lawrence Taylor (LT) The parametric study performed by LT involved the movement of the point load subjected on the
beam. All other variables have been kept the same as the original model. The purpose was to see
how this would affect the stress distribution and cracking profile of the beam. It is assumed that
more cracks will be produced when the point load is applied in position 1 compared with position 5,
as the load applied will increase further than that of position 5 to produce a deflection of 3mm. To
test this hypothesis five FEA models have been produced by varying the point at which the point
load is along the beam at 225mm intervals starting from the central point on the beam Position 5 to
the left hand side of the beam Position 1 (Figure 13).
As the point load positioning was changed, the mesh sizing on the right hand side of the point load
also changed. Each 225mm change in position from the centre of the beam also increased the
number of mesh intervals by two. This was done to increase the accuracy of the results as otherwise
the meshing may have become too coarse to provide reasonable results. The graded mesh utilised
on the left hand side of the point load was not changed, as the area it was calculating the results was
shortening thereby creating more accurate results.
Figure 14 below illustrates the Load vs. Deflection diagrams of the beams modelled. It can be seen
that the further away from the centre of the beam that the point load is applied, the larger the
necessary load must be applied to result in the same deflection of 3mm. This observation is
expected and helps to validate that the model is working as expected. A surprising observation from
Figure 14 also suggests that all beam models behave relatively linear until 1mm of deflection is
surpassed. After 1mm of deflection has been surpassed, the beams begin to deflect more readily
compared to the increase in loading. Fewer incremental increases in the load (set at 2000N) are
required to increase deflection as the point load is moved towards the centre of the beam. Indeed,
Figure 13 – Beam with point load positions 1 to 5.
Position 1
Position 2
Position 3
Position 4
Position 5

14
position 5 where the point load is at the centre of the beam requires only two increases to produce
the same 3mm deflection compared to position 1 where the model requires 4/5 increases in loading
to produce the same result.
The stress diagrams were analysed to investigate where and how the principal stresses formed in
the beams. The cracking profiles are also plotted to investigate how different formations in stress
affect the cracking in the beam models. Below in Figure 15 is the diagram relating to Position 1 when
the beam has reached a deflection of 3mm (the furthest point load from the centre of the beam).
Figures 16 and 17 show the output for Positions 3 and 5.
Figure 14 - Graph comparing load vs. deflection of the five beam models produced.
Figure 15 - Figure showing the stresses and cracks produced in the beam (Position 1)
Figure 16 - Figure showing the stresses and cracks produced in the beam (Position 3).

15
From Figures 15, 16 and 17 it can be seen that as the point load is moved closer towards the centre
of the beam, the cracking that is occurring in the beams is reducing. The angle of cracking in Figure
15 is far more pronounced than the cracking occurring in Figure 17. As discussed in the literature
review (Section 2.2), these angled cracks suggest shear failure forming in the beam as the point load
is moved closer to the support. Of course, this observation is highly important due to the fact that
the beams modelled have no shear links, thereby reducing the capacity of the beam in shear.
It is clear to see from a design point of view that if a beams deflection limit is designed as 3mm (or
whatever the specification outlines), care should be taken to position the point load as close to the
centre of the beam as possible to reduce the number of cracks produced for serviceability limits. The
client may not be pleased if the concrete beams produce too many obvious cracks. It can also be
seen from Figure 15 that the compressive stress produced by the models is not excessive and will
not create compressive cracks in the beam. However, it should be noted that this is an unrealistic
beam model as the point load is being applied on a knife edge. In reality the point load would be
applied over a larger area thereby reducing the stress produced.
Below the severity of the cracks are analysed (Figures 18, 19 and 20), as this will dictate
serviceability requirements in industry (specifically relating to crack control).
Figure 17 - Figure showing the stresses and cracks produced in the beam (Position 5).
Figure 18 - Figure showing the crack width output (Position 1).
Figure 19 - Figure showing the crack width output (Position 3).

16
Table 4 - Table highlighting crack widths in models.
Beam Model Crack Width
(mm)
Position 1 0.0922
Position 2 0.1148
Position 3 0.0795
Position 4 0.1408
Position 5 0.1698
It has been observed when comparing the crack widths, that the closer to the centre of the beam
that the point load is moved the greater the increase in crack width (Table 4). This is an important
observation as it is the opposite of what would be expected from the above observations. Therefore,
although less cracks form the closer the point load is to the centre of the beam, the larger the cracks
become. It should be noted at this point that the cracks are still far below those of the crack control
requirements (highlighted in Section 2.2).
7.1.1 Beam Verification
The same verification method has been used as shown in Section 5.0. Results will be discussed in
Section 8.7.
Table 5 - Table showing verification of FEA results vs. elastic hand calculations.
Model Point Load (kN) Hand Calc Stress (N/mm2) LUSAS Stress (N/mm2) Comment
Position 1 9 3.00 2.85 Excellent
Position 1 23 7.67 11.75 Poor
Position 2 9 3.90 3.72 Excellent
Position 2 19 8.23 13.20 Poor
Position 3 9 4.80 4.73 Excellent
Position 3 15 8.00 12.68 Poor
Position 4 9 5.70 6.03 Excellent
Position 4 15 9.50 12.23 Poor
Position 5 9 3.30 8.28 Bad
Position 5 13 4.76 18.66 Bad
Figure 20 - Figure showing the crack width output (Position 5).

17
Table 6- Deflection Hand Calculations
Model Point Load (kN) Hand Calc Deflection (mm) LUSAS Deflection (mm) Comment
Position 1 9 0.60 0.57 Excellent
Position 1 23 1.54 3.50 OK
Position 2 9 0.74 0.70 Excellent
Position 2 19 1.57 4.00 Poor
Position 3 9 0.85 0.83 Excellent
Position 3 15 1.42 3.09 Poor
Position 4 9 0.93 0.96 Excellent
Position 4 15 1.54 3.81 Poor
Position 5 9 0.48 1.04 OK
Position 5 13 0.69 3.07 Bad

18
7.2 Beam Depth and Width – Daniel Wilkinson (DW) The parametric study carried out by DBW required changing the dimensions of the concrete beam
but keeping the reinforcement bars the same size and in the same location. The purpose of this
parametric study was to determine the effect of changing the dimension on the stress distribution
throughout the beam with relation to the location of the reinforcement bars. The point load is
maintained in the same location on the parametric beams by ratios of length either side of the point
load. This ensures that the point load is acting in the same place, proportionally, for each of the
beams to make sure that comparative analysis is relevant to the report.
Figure 21 – 500mm deep beam
It was decided that changing both the length and the depth of the beam would be suitable for
demonstrating the effects of dimension on the non-linear analysis of the concrete beam. With this
criterion in mind, it was decided that investigating a beam depth of 500mm (Figure 21) and 100mm
(Figure 22) would be beneficial to see the difference in stress distribution in relation to the original
beam of depth 300mm.
Figure 22 – 100mm deep beam
This is to incorporate a wide range of results in order to accurately determine how cracks propagate
throughout the concrete and how the concrete responds under non-linear analysis. In addition to
this, still maintaining some reality as far as design is concerned, it was decided that a beam of depth
500mm would portray real world scenarios better than an extreme depth of 1000mm. Although
1000mm would demonstrate the effects of stress and crack propagation in a deep beam
environment, it was felt that it was unlikely to occur in real life as considerably more reinforcement
would be needed for a beam of that size in the real world.
In addition to the depth of beam being changed, the effects of changing the length of the beam on
the stress distribution and crack propagation would also be explored. Similarly, to the depth models,
reality was still observed and so the maximum length of beam, bearing in mind that the model is a
symmetrical half model, is a 10m span. Although this might be rare in practice, it proves as an
example of how the non-linear analysis uses the deflection as one of the input criteria in the analysis
and, with the beam being much longer and therefore has a larger deflection, how this then affects
the outcome result.

19
Changing the depth of beam
Figure 23 – 500mm Beam contour plot
The 500mm deep beam model, shown above (Figure 23) at the loading factor 43kN (the load factor
needed to reach a deflection of 3mm or over), shows the stress distribution and the crack
propagation in the concrete. At this point the beam has cracked all the way through; the cracks have
propagated from the bottom of the beam to the top. To the right of the point load, it can be seen
that the concrete beam is experiencing compression as the concrete is cracking at the bottom
forcing the concrete at top of the beam together. When compared to Figure 2, the model is showing
a mix between vertical flexural cracks and incline flexural-shear cracks. This arises from the tensile
forces in the concrete becoming larger than the tensile strength of the concrete. The crack width can
be seen below in Figure 24; the largest crack width is 0.52mm compared with the 0.11mm crack
width of the original beam, a significant increase. As detailed in the literature review, this sized crack
is far above the limits imposed by the Eurocodes and standards of 0.3mm-0.4mm.
Table 7 - Table showing crack widths in models
Beam Model Crack Width
(mm)
100mm 0.0786
300mm 0.0795
500mm 0.2904
L = 10m 0.0748
Figure 24 - 500mm crack widths
Figure 25 below shows the stress at the bottom of the beam, the level of the reinforcement,
throughout a selection of the loading factors. Loading factors 1kN-21kN exhibit similar loading stress
to the original beam, this was to be expected in the first instance of loading. However, when loading
levels 33kN-43kN are reached, the maximum stresses in the bottom of the beam move along the
beam towards the left support, dramatically decreasing and the moving into slight compression

20
around 1200mm. As found in the literature search, issues can occur at the supports in beams as the
stresses move from the centre of the beam towards to outer edges. As shown in the validation of
the original beam, the initial loading causes the beam to deflect elastically, but as the loading
increases, the beam begins to deflect plastically and so will not return back to its original position
when the loading is lifted.
Figure 25 – 500mm beam stress patterns
Figure 26 – 500mm beam stress patterns
The large peak in the Figure 26 above can be attributed to the increase in compression stress in the
top of the beam due to the failure of the concrete below due to cracking, as seen in Figure 23. The
top and bottom areas of the beam are compared here and it can be seen that where there are low
-1
-0.5
0
0.5
1
1.5
2
2.5
3
3.5
4
0 200 400 600 800 1000 1200 1400 1600 1800
Stre
ss (
N/m
m²)
Length (m)
Graph to show stress through bottom of 500mm beam at different loading factors
43kN
37kN
33kN
21kN
11kN
7kN
1kN
-20
-15
-10
-5
0
5
0 200 400 600 800 1000 1200 1400 1600 1800
Stre
ss N
/mm
²)
Distance (m)
Graph to show stress through 500mm beam at Top and Bottom
Bottom
Top

21
stresses in the bottom of the beam due to the concrete failing, larger peaks in stresses appear in the
top of the beam.
The failure phenomena can be explored in Figure 27. This figure shows that the beams with greater
thicknesses fail more suddenly than those with smaller depths. The loading at the 100mm beam
depth shows that the deflection increases gradually with the increase of the loading force. However,
if this is compared to beams of a greater depth, it becomes clear that as the depth increases, the less
the loading needs to change to incite a larger change in the deflection. At this point it is clear that
the steel reinforcement is no longer adequte to ensure that the beam does not suddenly fail. This
shows that as the beam size increases, the reinforcement must be increased as well.
Figure 27 – Deflection against depth
When the same effects are studied in the 100mm depth beam, whilst obviosuly requiring less load to
reach the deflection limit of 3mm, it exhibits the same stress patterns as the 500mm beam. The
crack propagation is similar to the deeper beam, however the cracks are far more spread out
showing dangerous structural weaknesses dow the entire length of the beam. However, in this case
there is far less inclined flexural cracking than in the 500mm beam.
Figure 28 – 100mm Contour plot
Unlike the 500mm beam, the cracks in this beam do not reach the top of the beam once taken to a
deflection of 3mm. Compared to the 500mm beam, the compression stresses in the top of the beam
are larger but there is no surge in compression stresses after the point load, the stresses simply stay
somewhat uniform after this point. This is true in both the bottom and the top of the beam, and
0.00E+00
1.00E+04
2.00E+04
3.00E+04
4.00E+04
5.00E+04
6.00E+04
7.00E+04
8.00E+04
9.00E+04
0 0.5 1 1.5 2 2.5 3 3.5
Load
(N
)
Deflection (mm)
Graph to show load against deflection for varying depth
Original
500mm
750mm
1000mm

22
unlike the 500mm beam the stresses are not affected by the cracks to the greater extent that the
deeper beam was subjected to.
Figure 29 – 100mm stress distribution
Changing the length of the beam In addition to changing the depth dimension, the length of the beam was also changed to see the
cracking effect on a longer beam; it was decided that a beam of 10m overall should be tested (5m
half model).
Figure 30 – 100mm contour plot (Altered termination limit)
As the beam was much longer than the original, the force it took to reach the 3mm deflection was
much less so the effect of changing the maximum deflection was explored. When changing the
maximum deflection to say -20mm, the cracks in the beam still did not form all the way through the
beam (Figure 30), unlike the models where the depth of the beam is changed.
It was then decided that to see the propagation of cracks throughout the beam that the maximum
deflection could be changed to -100mm instead of -3mm. Obviously unrealistic but it demonstrated
that the non-linear analysis is showing the distribution of stresses and the propagation of cracks at
failure and this time the cracks form all the way through the beam (Figure 31).
-16
-14
-12
-10
-8
-6
-4
-2
0
2
4
6
0 200 400 600 800 1000 1200 1400 1600 1800
Stre
ss N
/mm
²
Distance (m)
Graph to show stresses in Top and Bottom of 100mm beam
Bottom
Top

23
Figure 31 – 100mm crack propagation at -100mm deflection
7.2.1 Beam Verification Table 8 - DW Beam Stress Verification
Table 9 - Beam Deflection Verification
Model Point Load (kN) Hand Calc Stress (N/mm2) LUSAS Stress (N/mm2) Comment
Depth = 100mm 9 BEAM FAIL BEAM FAIL BEAM FAIL
Depth = 100mm 4.081 19.60 16.25 Good
Depth = 300mm 9 4.80 4.73 Excellent
Depth = 300mm 15 8.00 12.68 Poor
Depth = 500mm 9 0.78 1.50 Excellent
Depth = 500mm 43 8.26 9.71 Excellent
L = 3.3m 9 4.80 4.73 Excellent
L = 3.3m 15 8.00 12.68 Poor
L = 10m 9 11.70 16.54 Good
L = 10m 11 14.30 19.05 Good
Model Point Load (kN) Hand Calc Deflection (mm) LUSAS Deflection (mm) Comment
Depth = 100mm 9 BEAM FAIL BEAM FAIL BEAM FAIL
Depth = 100mm 4.081 10.46 10.24 Excellent
Depth = 300mm 9 0.85 0.83 Excellent
Depth = 300mm 15 1.42 3.09 Poor
Depth = 500mm 9 0.18 0.16 Excellent
Depth = 500mm 43 0.88 3.07 Poor
L = 3.3m 9 0.85 0.83 Excellent
L = 3.3m 15 1.42 3.09 Poor
L = 10m 9 20.57 60.65 Terrible
L = 10m 11 25.14 107.44 Terrible

24
7.3 Size of Steel Reinforcement Bars and Compression Reinforcement – Oliver Harris
(OH) For design purposes, reinforcement bars for beams are specified by number of bars and the nominal
bar diameter in mm. Standard nominal bar diameters available in the UK range from 6mm to 50mm.
The tension reinforcement bar size is determined in EC2 by using equation 1 to find the area of steel
required and then the number of bars and size can be selected from a manufacturer that have an
equal or larger area of steel than what is required.
𝐴𝑠 =𝑀
𝑓𝑦𝑑𝑍 Equation (1)
As = Area of tension reinforcement required M= Moment
Fyd = Design yield strength of steel Z = Lever Arm
This parametric study aims to investigate how varying the bar size effects the non-linear behaviour
of the concrete beam. A small selection of bars with a range of diameters and cross-sectional areas
were selected to be modelled, as seen in table 7. In practice most beam reinforcement bars
diameters are 8mm – 16mm this range is covered within the parametric study as well as more
extreme cases for beams with very large loads that could require up to 40mm bars. It is expected
that as bar size increase that the effect of cracking is reduced for equivalent loads.
Table 10 - Total cross-sectional area of 2 bars (British Standards Institute, 2005).
Bar Size Cross-sectional
area of bars
6mm 56
10mm 157
16mm 402
25mm 982
40mm 2513
Figure 32 - Parametric study of bar diameter size and how it affects the relationship between Load and deflection
0
5
10
15
20
25
30
35
40
0.00 1.00 2.00 3.00 4.00
Tota
l Lo
ad (
kN)
Deflection (mm)
Graph Showing Load vs. Deflection
40mm Bars
25mm Bars
16mm Bars
10mm Bars
6mm Bars
25
The parametric study shows the impact that the size of the reinforcement bars has on the deflection
of a concrete beam, as seen in figure 32. For a concrete beam as the bar size increased the load
factor required to reach the limit of 3mm deflection increased, as expected.
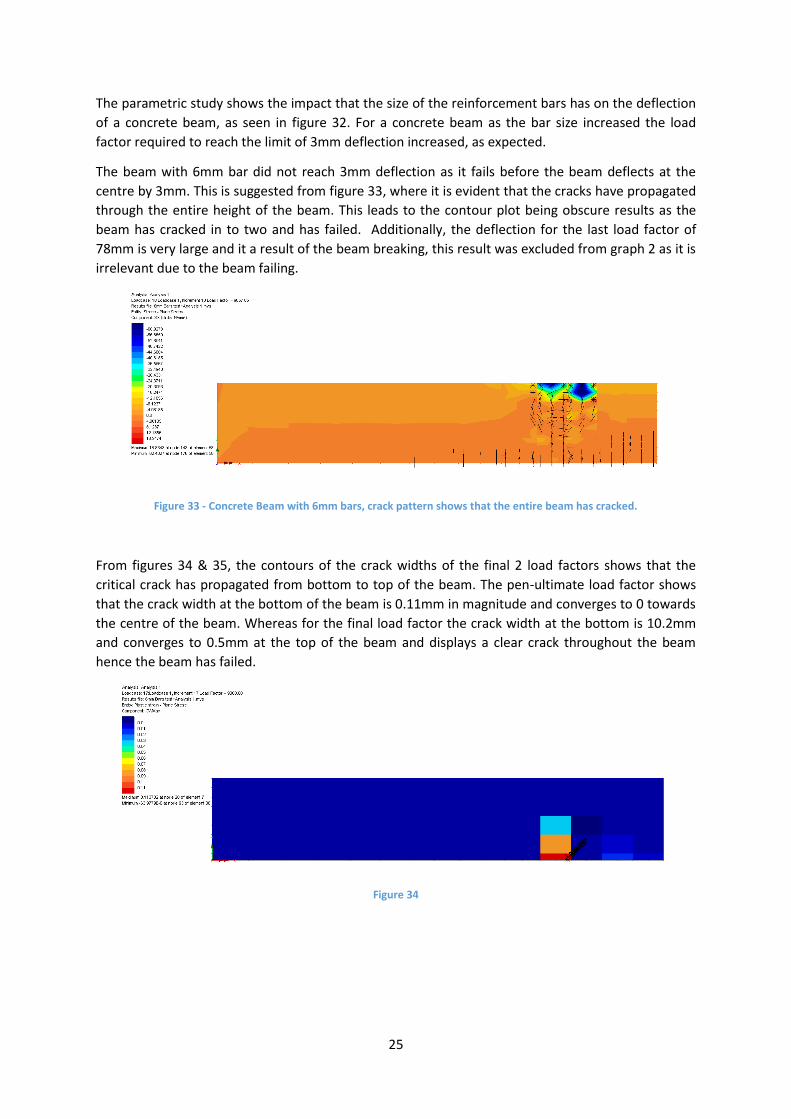
The beam with 6mm bar did not reach 3mm deflection as it fails before the beam deflects at the
centre by 3mm. This is suggested from figure 33, where it is evident that the cracks have propagated
through the entire height of the beam. This leads to the contour plot being obscure results as the
beam has cracked in to two and has failed. Additionally, the deflection for the last load factor of
78mm is very large and it a result of the beam breaking, this result was excluded from graph 2 as it is
irrelevant due to the beam failing.
Figure 33 - Concrete Beam with 6mm bars, crack pattern shows that the entire beam has cracked.
From figures 34 & 35, the contours of the crack widths of the final 2 load factors shows that the
critical crack has propagated from bottom to top of the beam. The pen-ultimate load factor shows
that the crack width at the bottom of the beam is 0.11mm in magnitude and converges to 0 towards
the centre of the beam. Whereas for the final load factor the crack width at the bottom is 10.2mm
and converges to 0.5mm at the top of the beam and displays a clear crack throughout the beam
hence the beam has failed.
Figure 34

26
Figure 35
For the smaller bars of 6mm and 10mm the limit of 6mm was met within relatively few iteration,
therefore the models were solved again with a reduced load step from 2kN to 0.5kN, this lead to
greater accuracy in the deflection against load graph as seen in graph 2.
Figure 36
Interesting for larger bars cracks on the compression side of the beam begin to propagate. This is
evident for the 40mm diameter bars with loads of 30kN and greater are applied cracking starts to
occur on the compression side of the beam and develops further as seen in figure 36. This suggests
for large concrete beams with significant loading that compression reinforcement could be required.
This is reflected in practice with common size beams not requiring compression reinforcement.
Compression reinforcement A further model was investigated to see the effects of adding compression reinforcement to the
concrete beam. The compression reinforcement was positioned 25mm from the top of the beam
and modelled with the same properties of the tension reinforcement. In practice the compression
bar would be smaller than the tension bar however for this analysis using similar size bars should still
lead to general trends of how compression reinforcement affects the plane stress plot. What rebar
was used?

27
Figure 37 - Contour plot and crack plots of compression bar
Figure 38
Adding compression reinforcement made little difference to the deflection, this is expected as the
beam does not require compression reinforcement as it will fail in tension first which is confirmed by
this result. The contour plots are also similar, as the compression part of the beams reinforcement
has not failed.
Table 11 - Comparison of crack widths between models.
Beam Model
Crack Width (mm)
6mm 2.3376
10mm 0.5836
16mm 0.0795
25mm 0.0704
40mm 0.0418
0
2
4
6
8
10
12
14
16
0 0.5 1 1.5 2 2.5 3 3.5
Tota
l Lo
ad (
kN)
Deflection (mm)
Beam with No Compression Reinforcement
Beam with Compression Reinforcement

28
7.3.1 Beam Verification Table 12 - Beam Stress Verification
Table 13 - Beam Deflection Verification
Model Point Load (kN) Hand Calc Stress (N/mm2) LUSAS Stress (N/mm2) Comment
6mm 9 4.80 5.31 Excellent
6mm 11 5.86 48.04 Bad
10mm 9 4.80 5.07 Excellent
10mm 13 6.93 17.60 Poor
16mm 9 4.80 4.73 Excellent
16mm 15 8.00 12.68 Good
25mm 9 4.80 4.33 Excellent
25mm 23 12.26 13.89 Excellent
40mm 9 4.80 3.90 Excellent
40mm 37 19.73 15.49 Excellent
Compression 9 4.80 4.14 Excellent
Compression 17 9.06 12.36 Good
Model Point Load (kN) Hand Calc Deflection (mm) LUSAS Deflection (mm) Comment
6mm 9 0.85 0.97 Excellent
6mm 11 1.04 58.04 Terrible
10mm 9 0.85 0.92 Excellent
10mm 13 1.23 8.70 Terrible
16mm 9 0.85 0.83 Excellent
16mm 15 1.42 3.09 Poor
25mm 9 0.85 0.73 Excellent
25mm 23 2.18 3.20 Excellent
40mm 9 0.85 0.60 Excellent
40mm 37 3.51 3.16 Excellent
Compression 9 0.85 0.76 Excellent
Compression 17 1.61 3.98 Poor

29
7.4 Changing Beam Thickness– Yu Tam (YT) The parametric study undertaken by YT involved changing the width of the beam, therefore the
spacing of the reinforcement, and noting the effect on the cracking, deflection and stress
distributions.
Figure 39 - Different width of the concrete beam
As per the original beam model, reinforcement is provided in the lower face of the beam and has a
total cross-sectional area of 400mm2; the cover of the reinforcement is 25mm on both sides. The
effects of any shear reinforcement can be ignored as the beam does not contain shear links, a
measure that would be used to prevent the effects of shearing in design.
The effect of changing the width of the beam was deemed of interest to this report as this would
show the effects of inadequate reinforcement in the beam. This is of course because as the beam
width increases, the spacing between the reinforcement becomes greater, leaving a large area
without reinforcement. For the beam width, it was decided that investigating a 200mm and 300mm
wide beam would be beneficial to note the difference in stress distribution in relation to the original
beam of width 150mm.
Figure 40 - Geometric of the 2D beam model

30
Figure 41 - Increment Load factor 15000 (thickness = 150mm)
For comparative reasons, Figure 41 - Increment Load factor 15000 (thickness = 150mm) shows the
stresses and the cracking profile of the original beam with a width of 150mm. it can clearly be seen
that the point load, located in the middle, is causing compressive stresses in the top mid-section of
the beam and tensile forces on the outer regions and the bottom of the beam. The effects of the
cracking can clearly be seen because although they do not penetrate throughout the entire depth of
the beam, the cracks weaken the concrete, exerting compressive stresses on the concrete left intact.
Figure 42 – The graph of the beam displacement (thickness = 150mm)
Figure 42 shows the plot graph of the beam displacement for the original model. It can be seen that
as the beam is loaded, there is no sudden and destructive failure. This is expected in the original
beam as the reinforcement is certainly adequate for this size of beam. The gradual deflection shows
that even if the beam is loaded to failure, there will be warning signs such as cracking of finishes that
will warn occupants and allow them to leave quickly.
Figure 43 - Increment Load factor 23000 (thickness = 300mm)
Figure 43 - Increment Load factor 23000 (thickness = 300mm)show the beam with a thickness of
300mm instead of 100mm. The position of applied load and increment load factor is same but the
stress distribution is different to that observed in the original beam. Unlike the original beam, the

31
cracks are no longer clean and vertical in appearance, this time there are more diagonal and angled
cracks. In relation to Figure 2 - Highlighting the difference in crack patterns of shear and flexural
failure (Paul, 2015). these cracks can be identified as inclined flexural/shear cracks indicating that
the tensile forces have exceeded that of the concrete. In addition to this, the cracks have formed all
the way through the beam instead of part of the way.
Figure 44 - 300mm width crack widths
Figure 44 shows the maximum crack widths at the final loading increment of the 300mm wide beam.
The maximum crack width as seen here is 0.277mm which according to the limits found in the
literature search or between 0.3mm and 0.4mm is acceptable. However this does not mean that the
beam is safe and as the cracks have propagated all the way through the beam, the structural
integrity of the beam is now compromised. The maximum crack widths of the other beams are
summarised in the table below.
Table 14 – Crack Widths
Beam Thickness(mm)
Crack Width (mm)
150mm 0.0795
200mm 0.1365
250mm 0.1242
300mm 0.1843
32
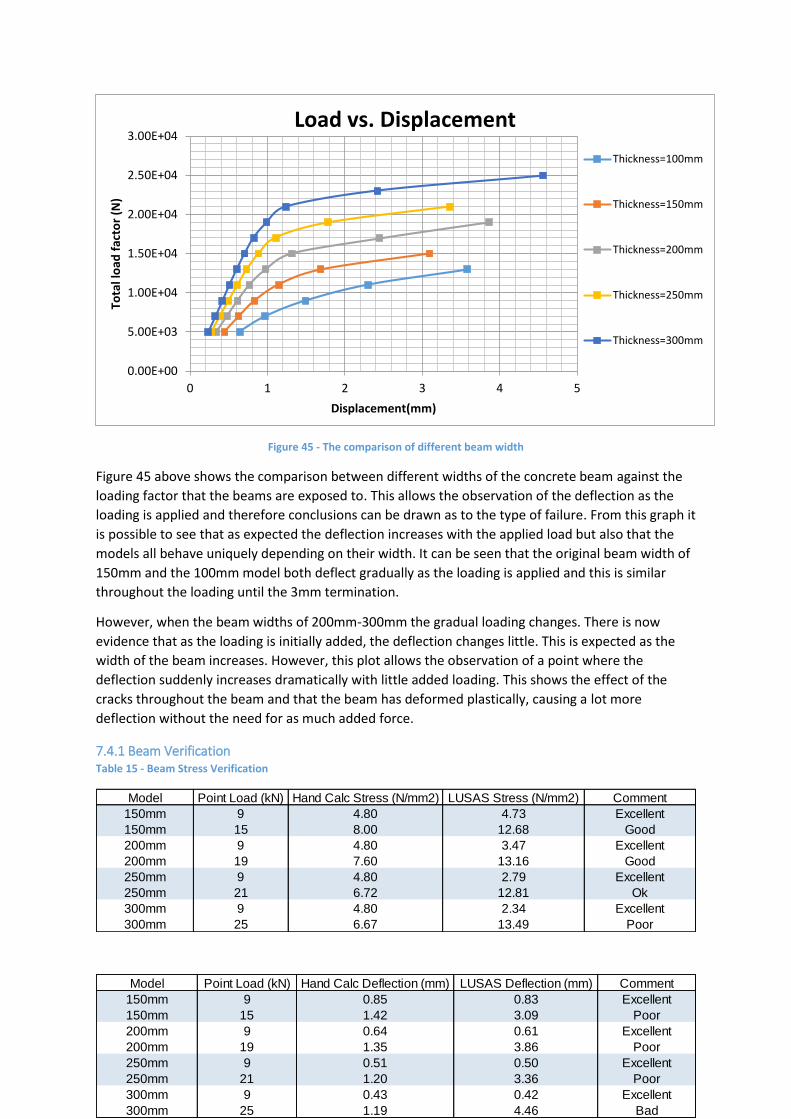
Figure 45 - The comparison of different beam width
Figure 45 above shows the comparison between different widths of the concrete beam against the
loading factor that the beams are exposed to. This allows the observation of the deflection as the
loading is applied and therefore conclusions can be drawn as to the type of failure. From this graph it
is possible to see that as expected the deflection increases with the applied load but also that the
models all behave uniquely depending on their width. It can be seen that the original beam width of
150mm and the 100mm model both deflect gradually as the loading is applied and this is similar
throughout the loading until the 3mm termination.
However, when the beam widths of 200mm-300mm the gradual loading changes. There is now
evidence that as the loading is initially added, the deflection changes little. This is expected as the
width of the beam increases. However, this plot allows the observation of a point where the
deflection suddenly increases dramatically with little added loading. This shows the effect of the
cracks throughout the beam and that the beam has deformed plastically, causing a lot more
deflection without the need for as much added force.
7.4.1 Beam Verification Table 15 - Beam Stress Verification
0.00E+00
5.00E+03
1.00E+04
1.50E+04
2.00E+04
2.50E+04
3.00E+04
0 1 2 3 4 5
Tota
l lo
ad f
acto
r (N
)
Displacement(mm)
Load vs. Displacement
Thickness=100mm
Thickness=150mm
Thickness=200mm
Thickness=250mm
Thickness=300mm
Model Point Load (kN) Hand Calc Stress (N/mm2) LUSAS Stress (N/mm2) Comment
150mm 9 4.80 4.73 Excellent
150mm 15 8.00 12.68 Good
200mm 9 4.80 3.47 Excellent
200mm 19 7.60 13.16 Good
250mm 9 4.80 2.79 Excellent
250mm 21 6.72 12.81 Ok
300mm 9 4.80 2.34 Excellent
300mm 25 6.67 13.49 Poor
Model Point Load (kN) Hand Calc Deflection (mm) LUSAS Deflection (mm) Comment
150mm 9 0.85 0.83 Excellent
150mm 15 1.42 3.09 Poor
200mm 9 0.64 0.61 Excellent
200mm 19 1.35 3.86 Poor
250mm 9 0.51 0.50 Excellent
250mm 21 1.20 3.36 Poor
300mm 9 0.43 0.42 Excellent
300mm 25 1.19 4.46 Bad

33
Table 16 - Beam Deflection Verification

34
8.0 Discussion
8.1 Elastic to Plastic Figure 11 - Profile of plane stresses, clearly visualises the transition between the elastic and plastic
behaviour of the beam. Where the load factor and deflection relationship is linear the beam is
behaving elastically whereas where the relationship becomes non-linear the plastic behaviour
becomes dominant. When the parametric study into the sizing of the bars was carried out (OH), the
elastic region for the bars seems to increase slightly with the increase of bar size. More notable is
that as bar size increases the plastic range appears to be able to take far greater loads. For example,
for 10mm bars where the load is increased between 9kN to 10kN the deflection increases drastically
approaching failure. Comparatively for larger bars such as the 25mm bar at 12kN and greater, the
rate of deflection slightly reduced with increase of load suggesting that the beam offers further
plastic deformation before approaching total failure. These two examples highlight how the bar size
has a direct impact on the plastic behaviour of the concrete beam.
Indeed, this is the purpose of the steel bars in that they allow the gradual failure of the concrete
beam rather than the sudden failure that could be expected from a beam with no reinforcement.
This is further explored in the parametric study changing the dimensions of the beam. As seen in the
parametric studies, there comes a point in the sizing of the beam where the amount of
reinforcement from the unchanged steel bars becomes inadequate and so the concrete beam goes
from failing over time to failing suddenly. This is amplifying the need to change the amount and
sizing of the reinforcement as the size of the beam increases.
8.2 Cracking Non-linear analysis allows the cracks forming within the concrete to be modelled and visualised,
whereas linear analysis does not take this into account. The inclusion of the effect of cracking is to
some extent predictable and therefore can aid and be included in the design and analysis of beams.
Cracking affects the strength of the beam and can be accounted for in the calculation for the failure
load, allowing the design to avoid over engineering resulting in reducing costs.
Comparing the crack propagation diagram (DW) (Figure 23 – 500mm Beam contour plot) to the
stress graphs (Figure 25 – 500mm beam stress patterns) in the parametric study on changing the
dimensions of the concrete beam, it can be seen that the dramatic decrease in stress in the bottom
of the beam coincides with the increased number of cracks. In addition to this, when the stresses in
the bottom of the beam are compared with those at the top, as seen in Figure 26 – 500mm beam
stress patterns, a large peak in the stresses in the top of the beam coincides with the largest spread
of cracks that reach from the bottom of the beam to the top. This can be observed in the crack
diagram (Figure 23 – 500mm Beam contour plot) as the concentrated blue area to the right of the
point load, suggesting that this is the only area of the beam subjected to large stresses at a
deflection of 3mm, after the concrete below has failed. In relation to this, it could be advisable that
for a concrete beam of this size and loading that compression reinforcement is needed in the top of
the beam to ensure that it does not suddenly fail as shown in the (Figure 26 – 500mm beam stress
patterns), after the peak. In the cases where extreme studies were used such as the 500mm beam
depth, 300mm beam width and the smaller steel reinforcement, the cracks that propagated were
well over the 0.3mm-0.4mm threshold suggested in the standards.
Cracks as large as 10.2mm (as seen in the final loading stage of OH’s study) would be dangerous as
well as detrimental to the integrity of the beam. Cracks this large would allow water in which would
rust the steel possibly contributing to spalling. In addition to this, there could be issues with fire

35
safety due to the concrete being used as protection for the steel beams. In this situation the steel
could be softened and so the building would be dangerously unstable under fire conditions, which is
not acceptable.
In the parametric study carried out by YT, the maximum crack widths found were approximately
0.3mm, i.e. within the limits found in the literature search. This parametric study provided data to
show that although the dimensions of the beam and sizing of the steel bars are very important, it is
also very important as to how they are arranged in the beam. If there is too much space between
the bars, the tensile strength of the concrete is relied up too much and as a result, tensile cracking
was observed when the beams were spaced apart.
In the parametric study undertaken by LT, it is clear that the positioning of the point load is very
important when considering the deflection and therefore cracking. From Figures 15, 16 and 17 it can
be seen that as the point load is moved closer towards the centre of the beam, the less cracking
occurs in the beam. Clearly this is important from a design point of view and like the other
parametric studies it shows that if the reinforcement is inadequate to cater for off centre point
loads, then the tensile stress in the concrete will cause cracking. It was also noted that although less
cracks were modelled, the crack widths increased as the point loading moved towards the centre of
the beam.
The concrete of the beam is almost impossible to prevent from cracking and will contain thousands
of micro cracks. The size and location of cracks can be limited by increasing the amount of bars,
reducing the rebar spacing, improving curing methodology, and use of an appropriate concrete mix
design. Structures with severe cracking would concern the public this is considered within design
codes, where cracking is factored as a serviceability failure in limit state design. The Eurocodes limit
the reinforcement spacing which enables the cracking to be minimised. Additionally, cracking can
lead to moisture being able to penetrate and corrode the reinforcement resulting in the beam
failing. Non-linear analysis allows the major crack propagation to be identified and unusual cracking
to be prevented, and the optimisations in positioning the rebar to not only produce the safest design
but to also streamline it with regards to cost savings.
8.3 Deflection Fixing the limit of the deflection and the use of non-linear analysis allows for the observation of the
failure mode. Concrete without reinforcement is likely to fail suddenly as the concrete reaches a
stress of 10% of that of the compressive strength. Concrete with reinforcement will fail over time as
the steel rebar increases the tensile strength of the beam. This can be seen in the parametric studies
and where the steel reinforcement has become inadequate for the beam size (OH).
In the case of the deeper beams (DW), it can clearly be seen from the load against displacement
graph (Figure 27 – Deflection against depth) that there is a point where the deflection suddenly
increases rapidly without much additional load. Compared with the original beam where the
deflection happens gradually over the loading, the initial deflection of the beam is small as the
loading increases until it suddenly deflects to 3mm with very little additional load. This demonstrates
that with the deeper beams, there is little warning that the beam might fail considering the little
amount of deflection in the initial loadings. In practical applications this can be disastrous, but with
the use of adequate reinforcement in the top and bottom of the beam, the failure time can be
increased and so reducing the danger of the beam failing suddenly. The 500mm beam was modelled
using the same size reinforcement as the original beam which according to the discussion above is
not adequate to prevent the concrete from failing suddenly. This effect is also noted when the
width of the beam is changed. According to Figure 45, as the width increases the more sudden the

36
failure of the beam becomes. This is again an example where the steel reinforcement has become
inadequate for that size of concrete beam. In addition to this, there is an issue with spacing in the
beam. It is expected that in a beam of a large size, say the 300mm deep beam, that there would be
more reinforcement along the entire bottom face, not just in each corner. In the parametric study
carried out by LT, it was also apparent that at position 5, the deflection was gradual as the load was
added, but as the position of the point load was moved through to position 5, the point increased
deflection with only a little added load became apparent as in the other parametric studies.
8.4 Model Discussion & Limitations One issue with a 2D model of the beam is that the reinforcing bars are poorly modelled. Following
the right hand rule, at the height where the bars are in the concrete beam in the z-axis the material
is non-homogenous, i.e. the reinforcement is not a sheet but rather 2 bars. The 2D model does not
account for this as it models the bars taking the properties of the total cross sectional area as well as
using an appropriate mesh for bars, however it does not account for the numbering and positioning
of the bars in the z-axis. This oversight in the model will reduce the accuracy of the results, as the
effect of the stress distribution in the z-axis will be inaccurate. However, this effect shouldn’t be too
significant as the beams thickness is relatively small compared to the length (Figure 47). The effect of
the bars was further investigated in a 3D model in Section 8.5.
In addition to this, the crack widths that have been discussed depend greatly on Concrete Crack
Model 102. This model is based on a formula and so discrepancies between what it obtained
through the models in LUSAS and those in real life as concrete is non-homogeneous and therefore
will be different every time it is made and tested. Indeed, LUSAS (2016, pp. 132) states that the
model may display inaccurate crack widths if load increment increases are too great. It also goes on
to state that quadratic elements may decrease the accuracy of the results – the models used in this
report use quadratic instead of linear elements. This amplifies the fact that although concrete can be
successfully modelled in this way, there will still be unexpected or natural phenomena that cannot
be accounted for in the modelling.
The support conditions used in the realisation of the models are unrealistic from a real world
application perspective. In the models presented in this report, the support conditions are specified
so that they are supporting the beam on a ‘knife edge’ rather than on a lintel or large support.
Obviously this increases the stresses at the support for the beam as there is a smaller area through
which the load is transferred. In addition to this, the loading used in the models is also unrealistic as
it is unlikely that there will be a single point load on a beam in a real world application. To increase
the accuracy of the models, it would therefore be beneficial to increase the area in which the
supports and point load has in contact with the models. It can be seen in all models that large
compressive stresses were produced because of the point load acting on a very small surface area.
Indeed, problems arose during verification for stress that the models must be analysed using the
‘Graph Through 2D’ approach to analyse the maximum stress occurring at the centre of the beam
instead of taking the maximum stress overall. This is due to the large stresses obtained under the
point loads.
8.5 Assumptions The superposition of nodal degrees of freedom assumes that the concrete and reinforcement are
perfectly bonded which in the real world is an unlikely case, as dust, poor ribbing on the rebar and
other foreign bodies can cause an imperfect bond between the concrete and the rebar. This creates
a degree of error in the models, as it is modelling the optimum conditions that are otherwise
impossible to replicate in real life.

37
Linear analysis assumes a linear relationship between stress and strain, material properties are
constant and deformations are small as to allow for plane sections to remain plane. Whereas
nonlinear analysis allows for nonlinear stress-strain relationships as well as modelling of structures
that undergo large deformation. Other minor assumptions made include the exclusion of the self-
weight of the beam which is negligible compared to the point load. As discussed in the literature
review, shear links have not been modelled and may have helped with shear failure in the beams.
8.5 3D Model In reality a beam is a 3D object and thus using 2D models could poorly represent how an actual
beam behaves. The models in this report are represented in 2D with the thickness of the beam being
applied as an attribute to the model. To ensure that a 2D model represents the behaviour of the 3D
model well, a 3D model of the beam was constructed in LUSAS. The model had the same geometry,
material properties, supports and total load. The load was split into 2 point loads located 25mm
from the edge of the beam, offering a slightly more realistic loading case compared to a single
central point load. The beams support edge was applied to the line at the bottom edge of the beam.
The model was run, and a contour plot for the final load case with crack paths was produced as seen
in Figure 46 - 3D ModelError! Reference source not found.. The cracking profile appears similar for
the 3D model as for the 2D model. The cracks occur uniformly across the thickness of the model; this
suggests a weakness with both 2D and 3D models. The cracking in an actual beam would be more
random and less uniform due to the material properties of the beam varying slightly throughout the
thickness of the beam. The model assumes that the material properties are isotropic across the
thickness of the beam resulting in a slight difference between the model and an actual beam.
Figure 46 - 3D Model
The deflection profile with respect to the load case of the 3D model was compared to the 2D model,
as seen in Figure 47 - 2D and 3D model comparison of deflection profile. This found that the profiles
were very similar and suggests that the 2D model is an acceptable form to investigate beam
cracking. This is likely due to the beam thickness is small relative to the length therefore the
thickness of the beam can be applied as an attribute to the model of a 2D beam.

38
Figure 47 - 2D and 3D model comparison of deflection profile
8.6 Real World Applications The ability to identify the location of the worst deflection and the propagation of cracks in a
concrete beam is a very important asset. There are countless applications for concrete beams
externally as well as internally and if there is excessive deflection resulting in crack formation, then it
can let water in and can begin to corrode the rebar leading to spalling and the damage of finishes.
Obviously it would be unreasonable to suggest that through non-linear analysis all cracks should be
prevented as there are micro cracks forming in concrete beams even below the Ultimate Limit State.
Non-linear analysis can be used to identify areas badly affected by cracking and allows extra
reinforcement or stronger concrete to be specified to remove the possibility of larger cracks forming
in the beam. The prevention of large cracks is paramount to protect the rebar from the elements but
also to prevent damage to the exterior finishes. Clients will want to be reassured that although the
most efficient and cost effective beams will be used in construction, there is no compromise to the
finish of the building once the beams are loaded (i.e. serviceability).
As this is an iterative procedure to solve the non-linear equations, increasing the number of
increments to be performed by limiting the maximum change in load factor will produce more points
on the load vs. displacement graph to produce results closer to the true behaviour of the beam. As
shown below however (Figure 48), this change in loading vs. deflection only changes slightly and is
therefore not something to be concerned about (LT). As shown in the literature review, because the
process is iterative using the Newton-Raphson method, getting better results requires the use of
using smaller time steps.
0
2
4
6
8
10
12
14
16
18
0 0.5 1 1.5 2 2.5 3 3.5 4 4.5
Tota
l Lo
ad (
kN)
Deflection (mm)
Graph showing difference between 2D and 3D beam modelling
2D Beam 3D Beam

39
Figure 48 – Graph displaying smaller iterations (500N) vs. larger iterations (2000N)
8.7 Verification of the Models
As discussed above, the non-linear nature of the models produces differences between them and
equivalent linear models. As seen above in Sections 7.1.1, 7.2.1, 7.3.1 & 7.4.1 verification using both
the maximum stresses developed and maximum deflection developed in the non-linear models is
compared against elastic analysis methods (examples of calculations shown in Section 5.0). All
models have been verified at two stages, a 9kN load and the maximum load applied to the beam to
produce 3mm of deflection. A 9kN load was chosen as it was deemed to be in the linear region of all
load vs. deflection diagrams. It has been found that the 9kN loading gives very good verification to
the actual non-linear analysis models, due to the linear nature of the models in this region. As the
point load is further increased, the output from the verification method can vary greatly with the
observed output. It is therefore a conclusion of this report that this method should be used with
caution. Although the output from the models may vary with the observed results at the 3mm limit,
the 9kN verification process can help verify that the assumptions used in the model and model setup
match the actual beam to be modelled. It should also be noted that the elastic verification method
for stress does not model the rebar itself. When comparing deflection vs. model deflection the same
output of good correlation with the model was found at 9kN and poor correlation at the final load
increment.

40
9.0 Conclusion Linear analysis is used in most structural analysis as a way of simply determining the resultant forces
in a structure and its behaviour, making it easy to quickly make calculations to check how a building
or beam might react to certain loading or support conditions. However, its simplicity is due to
certain assumptions such as elastic behaviour that, in the real world, cannot be fully translated to a
building structure. This is where non-linear analysis can be utilised as it takes into account the
cracking within the concrete and how it then affects the strength of the concrete and the structures
ability to withstand forces after failure.
It has been found that one of the uses of non-linear analysis allows the sudden failure in the
concrete beam to be observed in detail as there are separate events that need to be identified that
all add to the sudden failure such as crack propagation. Although the deflection is contributory to
the overall failure, the deflection is also due in part to the cracks that form in the concrete beam as
the beam is loaded. In linear analysis, the cracks and crack propagation are not taken into account
and it assumes that the beam is elastic. This is an important aspect in the considerations for design
as it must be ensured that, as cracks decrease the beams ability to take the stresses and loads, that
major cracks should be prevented from forming.
Modelling of the beams in 2D has been found to be sufficient when comparing the results against 3D
models and verification techniques used are only applicable when the models behaviour is still
linear. At the 3mm limit, the verification process is generally no longer reliable to verify the models.
It has been seen that changing the size of the reinforcement effects the displacement of the beam
but also has an effect on the propagation of cracks and the distribution of stresses. For large bars,
cracks begin to propagate in compression at the top of the beam as opposed to small bars in which
the cracks propagate upwards. Changing the depth of the beam increases the cracks formed. Moving
the point load towards the centre of the beam increases the crack widths and increasing the
thickness of the beams also increases the crack widths obtained.

41
References ‘Reinforced Concrete’ (2016) Wikipedia’. Available at:
https://en.wikipedia.org/wiki/Reinforced_concrete (Accessed: 11 April 2016).
Al-Nasra, M. (2013) ‘Shear failure investigation of reinforced concrete beams with swimmer bars’,
Academic Journals, 4(2), pp. 56-74. JCECT [Online]. Available at:
http://www.academicjournals.org/JCECT (Accessed: 11 April 2016).
Assakkaf, A. (no date) Assakkaf. Available at:
www.assakkaf.com/courses/ence355/lectures/part1/chapter4a.pdf (Accessed: 11 April 2016).
Bathe, K., Walczak, J., Welch, A. and Mistry, N. (1989) ‘Nonlinear Analysis of Concrete Structures’,
Computers and Structures, 32(3-4), pp. 563-590, Science Direct [Online]. Available at:
http://www.sciencedirect.com/science/article/pii/0045794989903477 (Accessed: 6 March 2016).
Bristish Standards Institute (2005). BS86666: Concrete Design to BS EN1991 – Properties of
Reinforcement.
Brooker, O. (2006) How to design concrete structures using Eurocode 2: 2. Getting started [Leaflet
obtained online]. Available at: www.concrete.org.uk/fingertips-nuggets.asp?cmd=display&id=616
(Accessed: 11 April 2016).
CIRIA (2014) Early-age thermal crack control in concrete (C660) [Online]. Available at:
http://www.ihsti.com.plymouth.idm.oclc.org/CIS/search?t=ciria+c660&sqm=AllTerms (Accessed: 11
April 2016).
Giuriani, and Plizzari,. (1998). “Interrelation of Splitting and Flexural Cracks in RC Beams.” J. Struct.
Eng. [Online]. Available at:
http://ascelibrary.org.ezaccess.libraries.psu.edu/doi/pdf/10.1061/%28ASCE%290733-
9445%281998%29124%3A9%281032%29 (Accessed: 11 April 2016).
LUSAS (2015) Application Examples Manual [Online]. Available at:
http://www.lusas.cn/protected/documentation/V14_7/Application%20Examples%20Manual%20(Bri
dge,%20Civil%20and%20Structural).pdf (Accessed: 8 March 2016).
LUSAS (2015) LUSAS Finite Element Analysis. Available at:
http://www.lusas.cn/protected/theory/Nonlinear_Iterative_Procedures.html (Accessed: 19 March
2016).
LUSAS (2016b) Solver Reference Manual [Online]. Available at:
http://www2.lusas.com/protected/documentation/V15_2/Solver%20Reference%20Manual.pdf
(Accessed: 8 March 2016).
Mansur, M.A. and Tan, K. (1999) Concrete Beams with Openings. Google Books [Online]. Available at:
https://books.google.co.uk/ (Accessed: 11 April 2016).
Paul, A. (2015) Civil Digital. Available at: http://civildigital.com/failure-modes-beams/ (Accessed: 10
April 2016).
Pirro, R. (2012). "Concrete Evaluation and Repair Techniques” [Online]. Available at:
https://failures.wikispaces.com/+Overview+of+Types+and+Causes (Accessed: 11 April 2016).
Rafiq, Y. (2016) ‘Deflection Formula For Beams’. Structural Analysis and Design III [Online]. Available
at: https://dle.plymouth.ac.uk/ (Accessed: 12 March 2016).

42
Richardson, J. (no date) University of Alabama. Available at:
richardson.eng.ua.edu/Former_Courses/CE_433.../Design_for_Shear.pdf (Accessed: 11 April 2016).
Waters, J. (2012) Life Upfront. Available at: http://lifeupfront.com/jeff-waters-about/ (Accessed: 8
March 2016).

43
Appendices
Appendix A - Series of Contour Plots of Stress and Crack Paths as Load Increases
Load = 5kN - Contours and crack pattern of plane stress SX
Load = 7kN - Contours and crack pattern of plane stress SX
Load = 9kN - Contours and crack pattern of plane stress SX
Load = 11kN - Contours and crack pattern of plane stress SX
Load = 13kN - Contours and crack pattern of plane stress SX

44
Load = 15kN - Contours and crack pattern of plane stress SX