Embed Size (px)
Citation preview

DR. R. K. PACHAURIDR. R. K. PACHAURIChairman, Intergovernmental Panel on Climate ChangeChairman, Intergovernmental Panel on Climate ChangeDirector-General, The Energy and Resources InstituteDirector-General, The Energy and Resources Institute
Director, Yale Climate & Energy InstituteDirector, Yale Climate & Energy Institute
FUKUSHIMA, ENERGY AND CLIMATE FUKUSHIMA, ENERGY AND CLIMATE CHANGECHANGE
28 April 2011, Malaysia
2IPCC
WARMING OF THE CLIMATE WARMING OF THE CLIMATE SYSTEM IS UNEQUIVOCALSYSTEM IS UNEQUIVOCAL

3IPCC
PROJECTED SURFACE TEMPERATURE PROJECTED SURFACE TEMPERATURE CHANGES CHANGES
(2090-2099 relative to 1980-1999)(2090-2099 relative to 1980-1999)
0 0.5 1 1.5 2 2.5 3 3.5 4 4.5 5 5.5 6 6.5 7 7.5
(oC)
Continued emissions would lead to further warming of 1.1ºC to 6.4ºC over the 21st century
(best estimates: 1.8ºC - 4ºC)
4IPCC
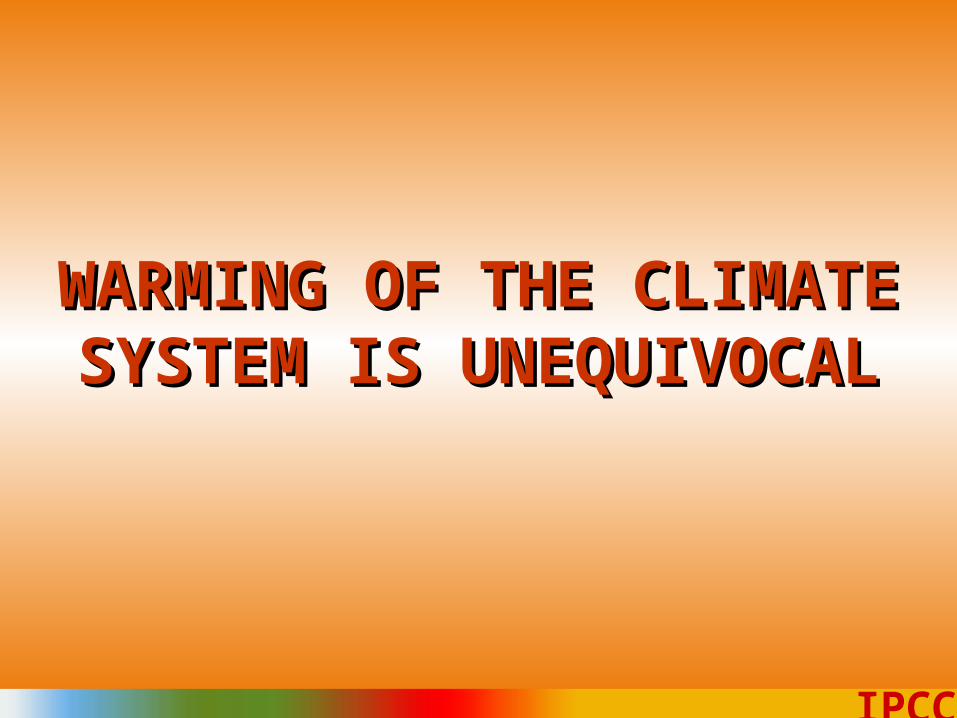
OBSERVED CHANGESOBSERVED CHANGES
Global average sea level
Northern hemispheresnow cover
Global average temperature

5IPCC
INTENSE TROPICAL CYCLONE ACTIVITY HAS INCREASED IN THE NORTH ATLANTIC SINCE ABOUT 1970 - Hurricane Katrina, 2005: up to $200 billion cost estimate
6IPCC
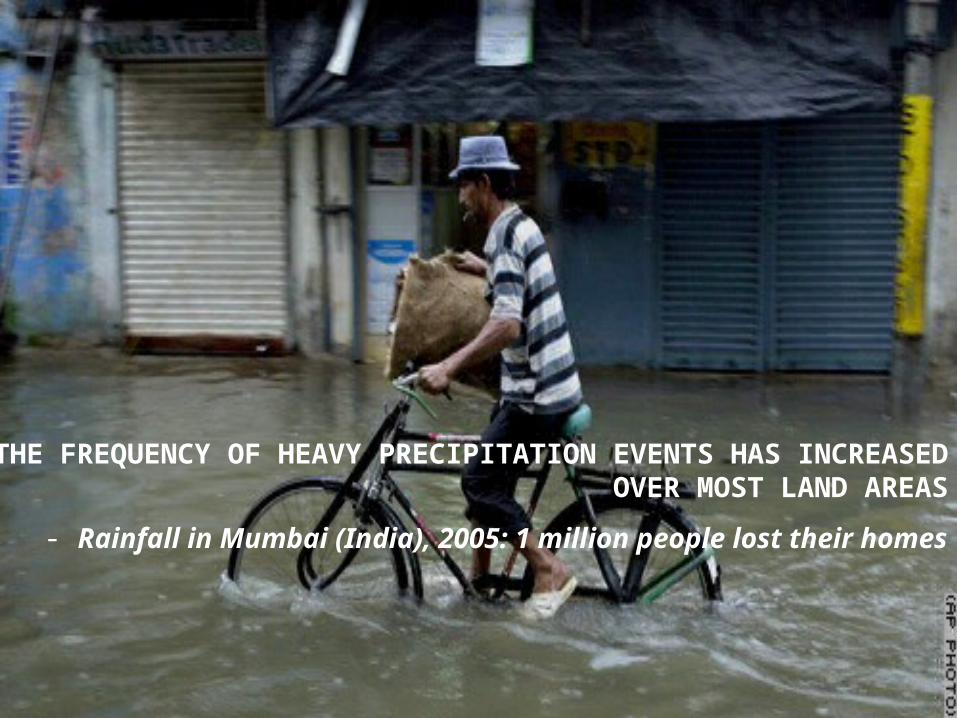
THE FREQUENCY OF HEAVY PRECIPITATION EVENTS HAS INCREASED OVER MOST LAND AREAS
- Rainfall in Mumbai (India), 2005: 1 million people lost their homes

7IPCC
HEAT WAVES HAVE BECOME MORE FREQUENT OVER MOST LAND AREAS
- Heat wave in Europe, 2003: 35 000 deaths

8IPCC
MORE INTENSE AND LONGER DROUGHTS HAVE BEEN OBSERVED OVER WIDER AREAS SINCE THE 1970s, PARTICULARLY IN THE TROPICS AND SUBTROPICS P
ho
to c
red
it: G
oo
dP
lan
et

9IPCC
EXPECTED IMPACTS EXPECTED IMPACTS OF CLIMATE CHANGEOF CLIMATE CHANGE

10IPCC
Coastal erosion and inundation of coastal lowland as sea level continues to rise, flooding the homes of millions of people living in low lying areas
IMPACTS ON COASTAL AREASIMPACTS ON COASTAL AREAS
• In India, 1 m sea-level rise would include inundation of 5,763 km2 (Gujarat, Maharashtra, West Bengal amongst vulnerable states)
• Significant losses of coastal ecosystems, affecting the aquaculture industry

11IPCC
Glacier melt projected to increase flooding, rock avalanches and to affect water resources within the next 2 to 3 decades
• Salinity of groundwater especially along the coast, due to increases in sea level and over-exploitation
• In India, gross per capita water availability will decline from 1820 m3/yr in 2001 to 1140 m3/yr in 2050
IMPACTS ON WATER IMPACTS ON WATER RESOURCESRESOURCES

12IPCC
IMPACTS ON FOOD SECURITYIMPACTS ON FOOD SECURITY
• Water stress at low latitudes means losses of productivity for both rain-fed and irrigated agriculture
• Possible yield reduction in agriculture:50% by 2020 in some African countries30% by 2050 in Central and South Asia30% by 2080 in Latin America
• Crop revenues could fall by 90% by 2100 in africa due to climate variability and change

13IPCC
THE NEED FOR MITIGATIONTHE NEED FOR MITIGATION

14IPCC
Stabilizationlevel
(ppm CO2-eq)
Global mean temp.
increase (ºC)
Year CO2 needs to peak
Global sea level rise above pre- industrial
from thermal expansion
(m)
445 – 490 2.0 – 2.4 2000 – 2015 0.4 – 1.4
490 – 535 2.4 – 2.8 2000 – 2020 0.5 – 1.7
535 – 590 2.8 – 3.2 2010 – 2030 0.6 – 1.9
590 – 710 3.2 – 4.0 2020 – 2060 0.6 – 2.4
CHARACTERISTICS OF CHARACTERISTICS OF STABILIZATION SCENARIOSSTABILIZATION SCENARIOS
POST-TAR STABILIZATION SCENARIOS
15IPCC
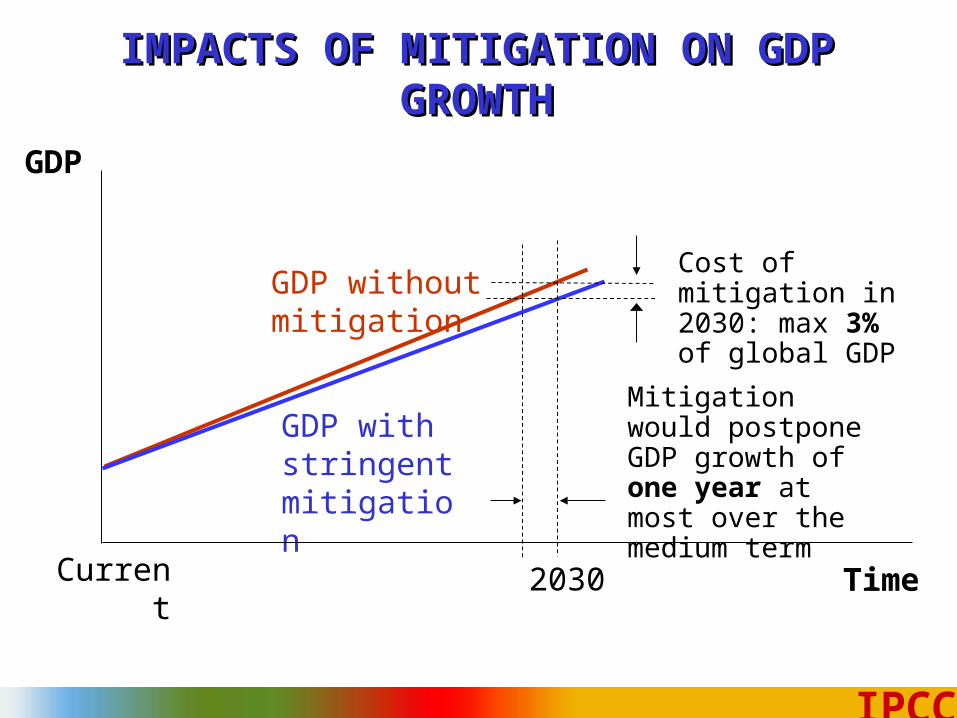
GDP without mitigation
GDP with stringent mitigation
2030
GDP
TimeCurrent
Mitigation would postpone GDP growth of one year at most over the medium term
Cost of mitigation in 2030: max 3% of global GDP
IMPACTS OF MITIGATION ON GDP IMPACTS OF MITIGATION ON GDP GROWTHGROWTH

16IPCC
Common drivers lie behind mitigation policies and policies addressing economic development, poverty, health, employment, energy security, and local environmental protection
Linking policies provide the opportunity for no-regrets policies reducing greenhouse gases mitigation costs
CO2 mitigation potential for 2010 without net cost in India: between 13 and 23% of business as usual scenario
CO-BENEFITS OF MITIGATIONCO-BENEFITS OF MITIGATION
17IPCC
FUTURE TRENDS AND FUTURE TRENDS AND ISSUES IN GLOBAL ENERGY ISSUES IN GLOBAL ENERGY
AND CLIMATE CHANGEAND CLIMATE CHANGE
18IPCC
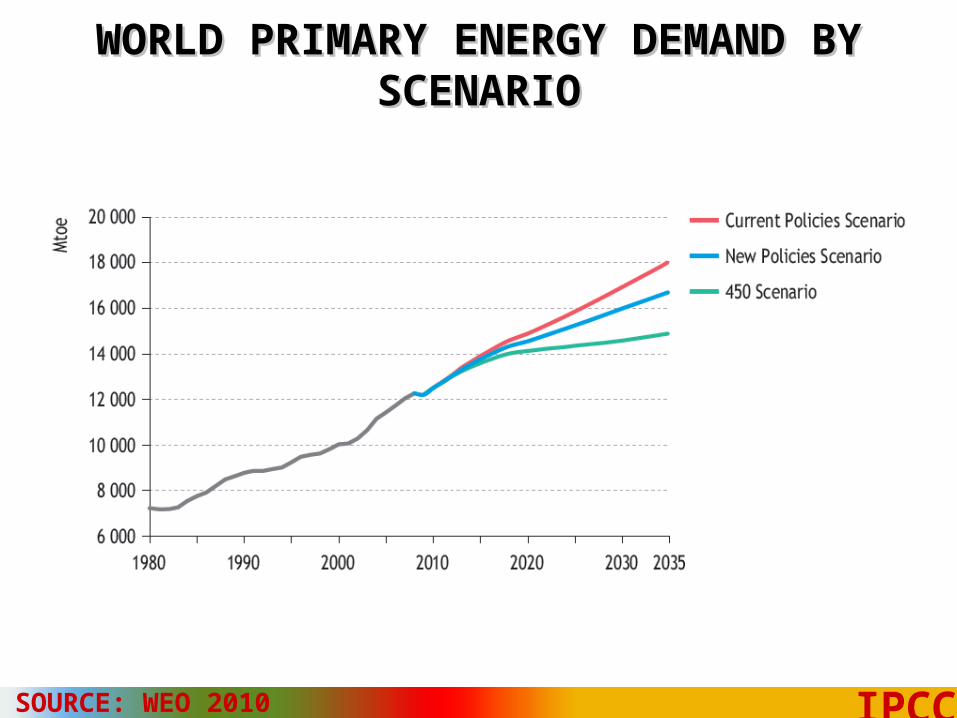
WORLD PRIMARY ENERGY DEMAND BY WORLD PRIMARY ENERGY DEMAND BY SCENARIOSCENARIO
SOURCE: WEO 2010

19IPCC
SHARES OF ENERGY SOURCES IN WORLD SHARES OF ENERGY SOURCES IN WORLD PRIMARY DEMAND BY SCENARIOPRIMARY DEMAND BY SCENARIO
SOURCE: WEO 2010
20IPCC
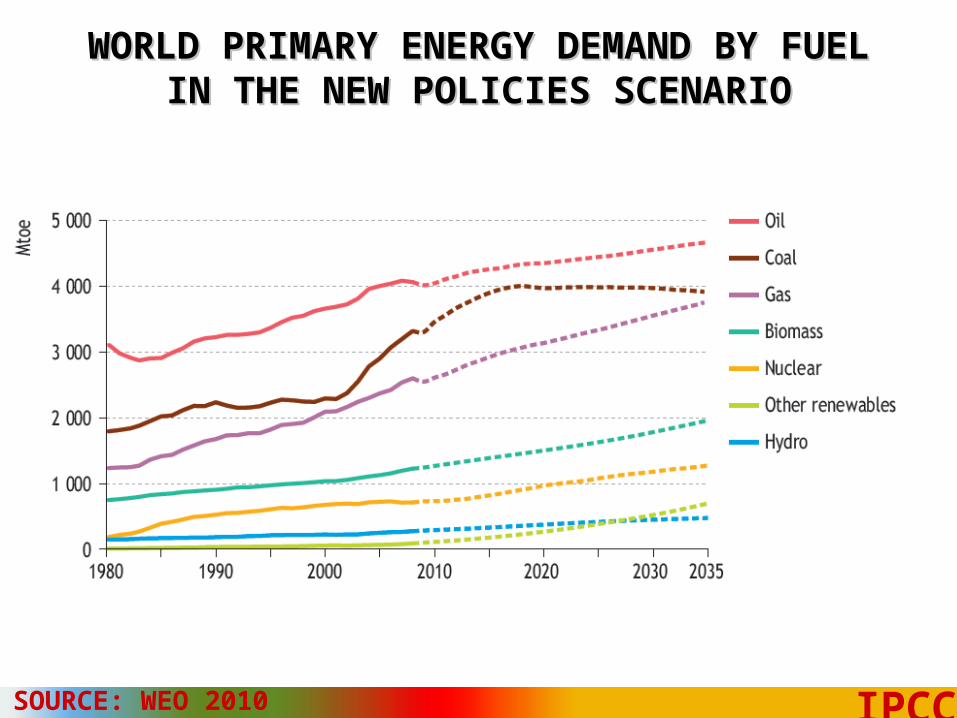
WORLD PRIMARY ENERGY DEMAND BY FUELWORLD PRIMARY ENERGY DEMAND BY FUELIN THE NEW POLICIES SCENARIOIN THE NEW POLICIES SCENARIO
SOURCE: WEO 2010

21IPCC
Nuclear Power and its role Nuclear Power and its role in future energy securityin future energy security
NUCLEAR POWER AND ITS ROLE IN FUTURE ENERGY SECURITY

22IPCC
NUCLEAR POWER HAS BEEN FORMING AN NUCLEAR POWER HAS BEEN FORMING AN INCREASING SHARE OF GLOBAL ENERGY MIXINCREASING SHARE OF GLOBAL ENERGY MIX
Nuclear energy, already at about 7% of total primary energy, could make an increasing contribution to carbon-free electricity and heat in the future.
In 2005, 2626 TWh of electricity (16% of the world total) was generated by nuclear power, requiring about 65,500 t of natural uranium (WNA, 2006a).
Nuclear power capacity forecasts out to 2030 (IAEA, 2005c; WNA, 2005a; Maeda, 2005; Nuclear News, 2005) vary between 279 and 269 740 GWe.
The worldwide operational performance has improved and the 2003–2005 average unit capacity factor was 83.3% (IAEA, 2006).
23IPCC
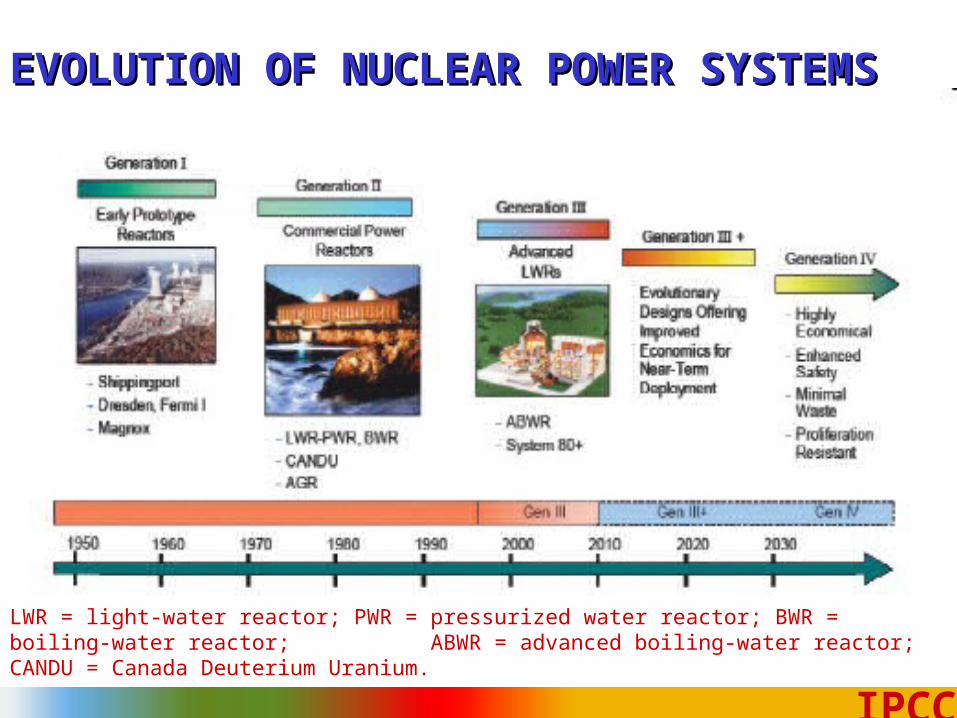
EVOLUTION OF NUCLEAR POWER SYSTEMSEVOLUTION OF NUCLEAR POWER SYSTEMS
LWR = light-water reactor; PWR = pressurized water reactor; BWR = boiling-water reactor; ABWR = advanced boiling-water reactor; CANDU = Canada Deuterium Uranium.

24IPCC
NUCLEAR ENERGY’S POTENTIAL FOR CO-NUCLEAR ENERGY’S POTENTIAL FOR CO-
BENEFITS IN MITIGATION POLICIESBENEFITS IN MITIGATION POLICIES
Mitigation policies relating to energy efficiency of plants, fuel
switching, renewable energy uptake and nuclear power, may have
several objectives that imply a diverse range of co-benefits.
Reducing GHG emissions in the energy sector yields a global impact,
but the co-benefits are typically experienced on a local or regional level.
Nuclear energy shares many of the same market co-benefits as
renewables

25IPCC
MAJOR BARRIERSMAJOR BARRIERS
Long-term fuel resource constraints without recycling
Economics
Safety
Waste management
Security
Proliferation
Adverse public opinion

26IPCC
Be the change you want to see in the world
A technological society has two choices. First it can wait until catastrophic failures expose systemic deficiencies, distortion and self-deceptions…Secondly, a culture can provide social checks and balances to correct for systemic distortion prior to catastrophic failures.


![].pdf · Dr Rajendra Pachauri. By Sapna Kulshrestha and Bindu Gopal Rao -Hotelierlndia . f the words of Dr Pachauri ... Akshay Gavai, environment officer, The Orchid](https://img.pdfslide.us/doc/110x75/5ad3ed707f8b9a0f198e49e9/1pdfdr-rajendra-pachauri-by-sapna-kulshrestha-and-bindu-gopal-rao-hotelierlndia.jpg)