Embed Size (px)
Citation preview
MEASUREMENT OF DISEASE
Pl Path 111 (3+1)
Dr. P.N. SHARMA
Department of Plant Pathology
CSK HPKV, Palampur

Why disease measurement ?
To know the prevalence and extent of damage caused by a disease
To develop effective management strategies

The three categories of disease damage
The whole plant is killed/ damaged
Localized part of plant or the field is affected.
The effect of disease out break persists over several seasons.

Disease is measured in term of intensity
disease intensity can be expressed either as
disease incidence or
disease severity.
The choice between evaluation of disease according to its incidence or severity depends largely on the type of disease and on the objectives.

Disease incidence
It is the percentage of diseased plants or parts in the sample or population of plants.
It can be the proportion or percentage of diseased leaves in a plant, diseased stalks or a tiller or diseased seedlings in a field.
Disease incidence: No. of infected plants x100
Total no. of plant assessed

Disease evaluation according to the incidence is suitable for:
most diseases in the early stages of their epidemic and
it applies mainly to diseases which affects whole plants such as systemic virus diseases, wilts, smuts, fruits rots etc.
Disease incidence generally tells about the prevalence of the disease in a given areas or host population.
Disease Severity
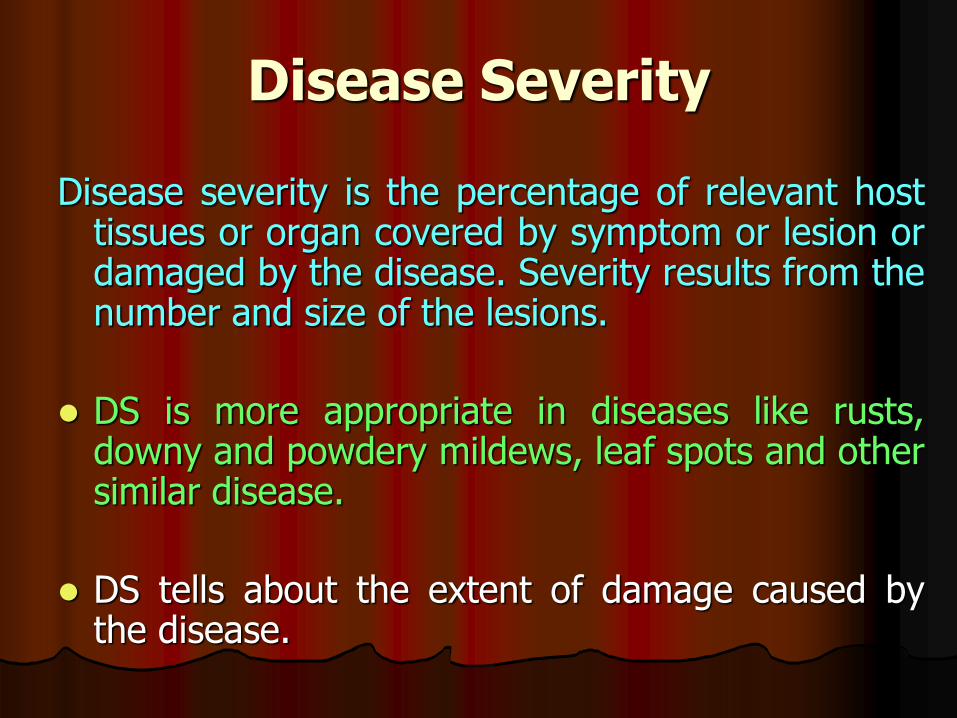
Disease severity is the percentage of relevant host tissues or organ covered by symptom or lesion or damaged by the disease. Severity results from the number and size of the lesions.
DS is more appropriate in diseases like rusts, downy and powdery mildews, leaf spots and other similar disease.
DS tells about the extent of damage caused by the disease.

Disease severity or Infection index
= Sum of all disease rating x 100 Total no. of rating x maximum disease grade
Visual assessment methods
Standard area diagrams
Descriptive keys

Standard area diagrams
Standard area diagrams allow estimation of intermediate levels of disease severity by comparing a diseased plant with diagrams showing both more and less disease.
These diagrams have been prepared for various diseases.
Here the pictorial representation of the host plant with known and graded amounts of disease is compared with diseased leaves to allow estimation of disease severity.
Standard area diagrams e g. leaf rust of wheat provide 1, 5, 10, 20, 50% leaf area infected.

Standard area diagrams used to estimate A. leaf rust of cereals, B. stem rust of cerealsStandard area diagrams used to estimate A. leaf rust of
cereals, B. stem rust of cereals

Standard area diagram C. Septoria glume blotch of wheat, D. late blight of potatoes

Descriptive scales
For assessing the disease severity the descriptive keys have also been standardized for various diseases.
Here the pictorial diagrams of the plants with varying amounts of types of disease symptoms are categorized with descriptions.
These are widely used and are of many types ranging from disease rating on numerical scale to subjective estimates as severe, moderate etc

(Severity scale)
0: No disease on leaf and pods 1: Small brown spot covering <1% leaf area
(pin point spots on pod) 3: Brown sunken spots 1-10% leaf area (< 1%
pod area) 5: Brown spots 11-25% leaf area (1-10% pod
areas) 7: Circular brown sunken spots 26-50% leaf
area(11-25% pod area) 9: Circular to irregular >51% leaf area (>26%
pod area)
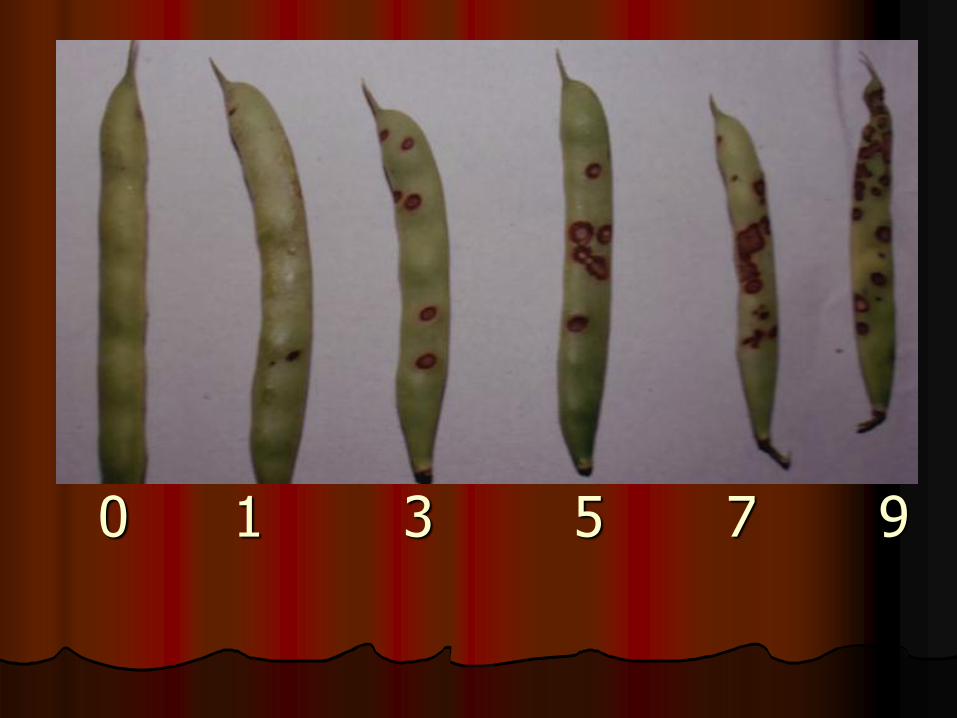
0 1 3 5 7 9

Disease grade Total rating No. of ratings
0 5 0
1 5 5
3 8 24
5 4 20
7 8 56
9 4 36
34 186
Sum of all ratings = 186; total ratings = 34
Max. Disease grade = 9
Dis. Severity = {186/ 34 x 9} X 100
= 60%