Embed Size (px)
Citation preview
Dr. Larry LesserUTEP Assoc. Prof., Dept. of Mathematical Sciences
contact info & equity page at:www.math.utep.edu/Faculty/lesser/
main paper published in 2009:https://www.amstat.org/membersonly/proceedings/papers/300471.pdf
Sept. 24, 2009 12-1:30
“Integrating Gender Equity into Your Course: Lessons Learned from the
Project ACE version of Stat 1380”
Project ACE: ACtion for Equityis a $885,000 Women’s Educational Equity Act grant from the US Dept. of Ed., 2005-10; #U083A050076)
http://eduprojects.utep.edu/projectace/
OUTLINE
• My background/trajectory
• Importance/literature
• Project ACE
• What I tried in my class
• Examples & Results
• Q & A, discussion, workshop
• If-time, a cool song
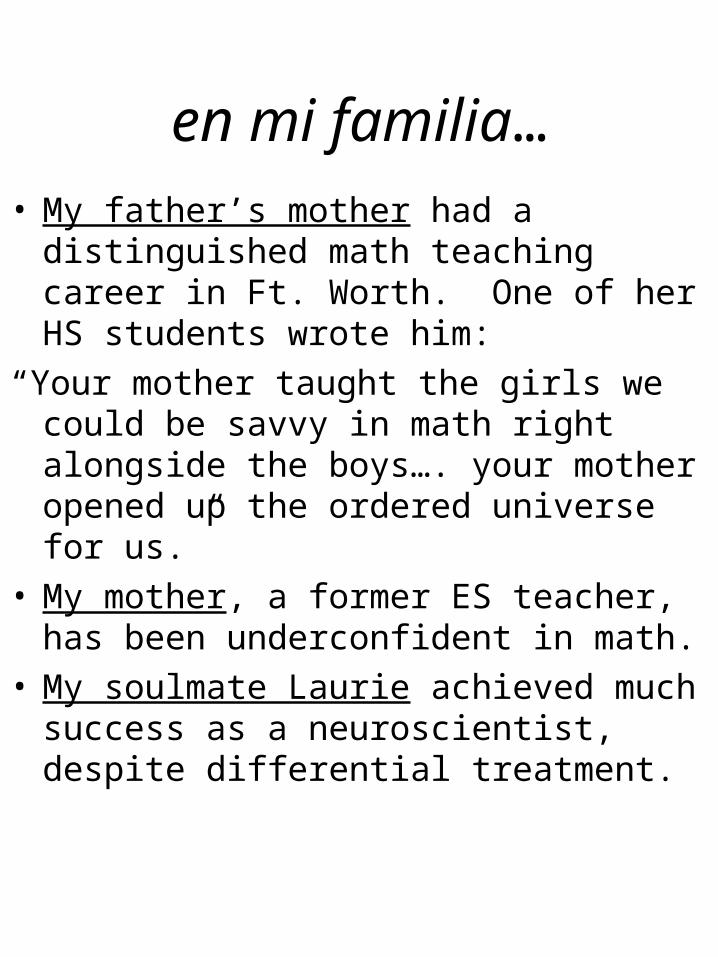
en mi familia…
• My father’s mother had a distinguished math teaching career in Ft. Worth. One of her HS students wrote him:
“Your mother taught the girls we could be savvy in math right alongside the boys…. your mother opened up the ordered universe for us.”
• My mother, a former ES teacher, has been underconfident in math.
• My soulmate Laurie achieved much success as a neuroscientist, despite differential treatment.
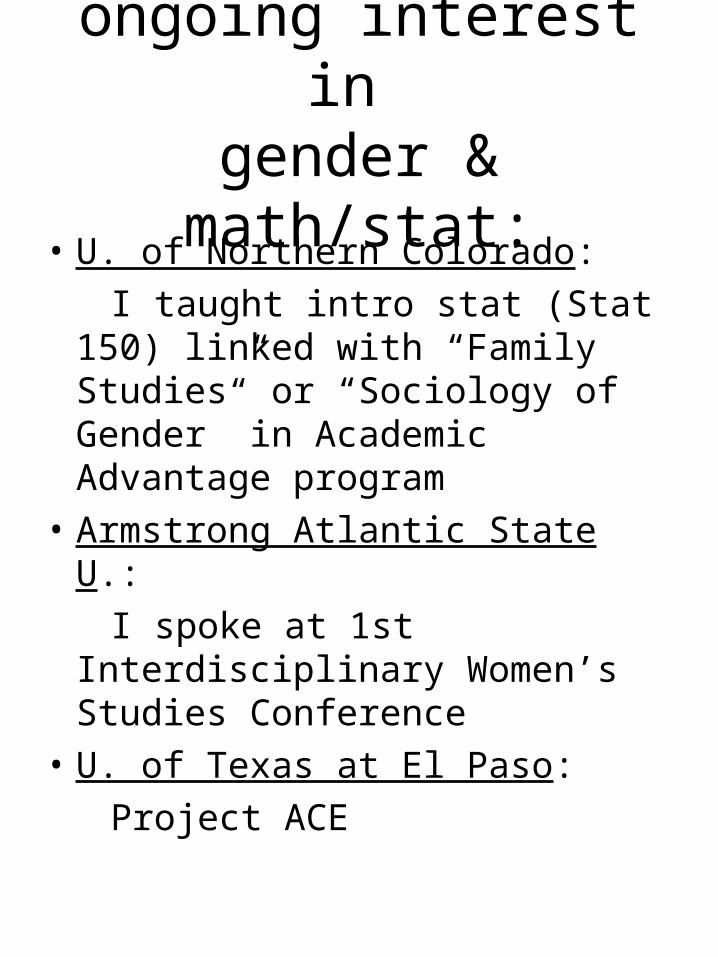
ongoing interest in gender & math/stat:
• U. of Northern Colorado:
I taught intro stat (Stat 150) linked with “Family Studies” or “Sociology of Gender” in Academic Advantage program
• Armstrong Atlantic State U.:
I spoke at 1st Interdisciplinary Women’s Studies Conference
• U. of Texas at El Paso:
Project ACE
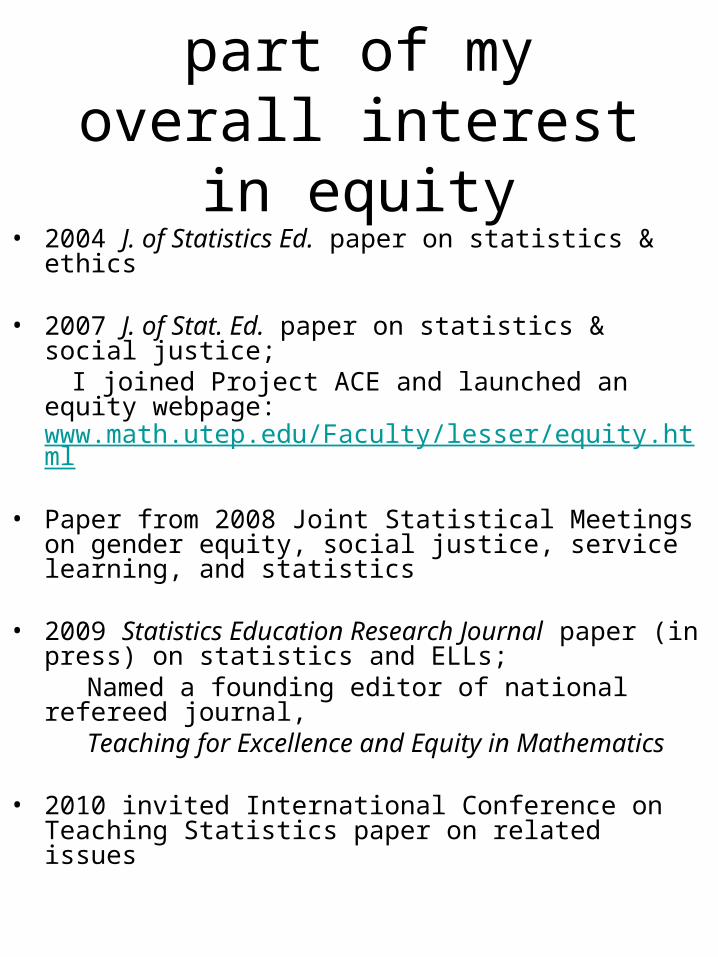
part of my overall interest in equity
• 2004 J. of Statistics Ed. paper on statistics & ethics
• 2007 J. of Stat. Ed. paper on statistics & social justice; I joined Project ACE and launched an equity webpage:
www.math.utep.edu/Faculty/lesser/equity.html
• Paper from 2008 Joint Statistical Meetings on gender equity, social justice, service learning, and statistics
• 2009 Statistics Education Research Journal paper (in press) on statistics and ELLs;
Named a founding editor of national refereed journal, Teaching for Excellence and Equity in Mathematics
• 2010 invited International Conference on Teaching Statistics paper on related issues
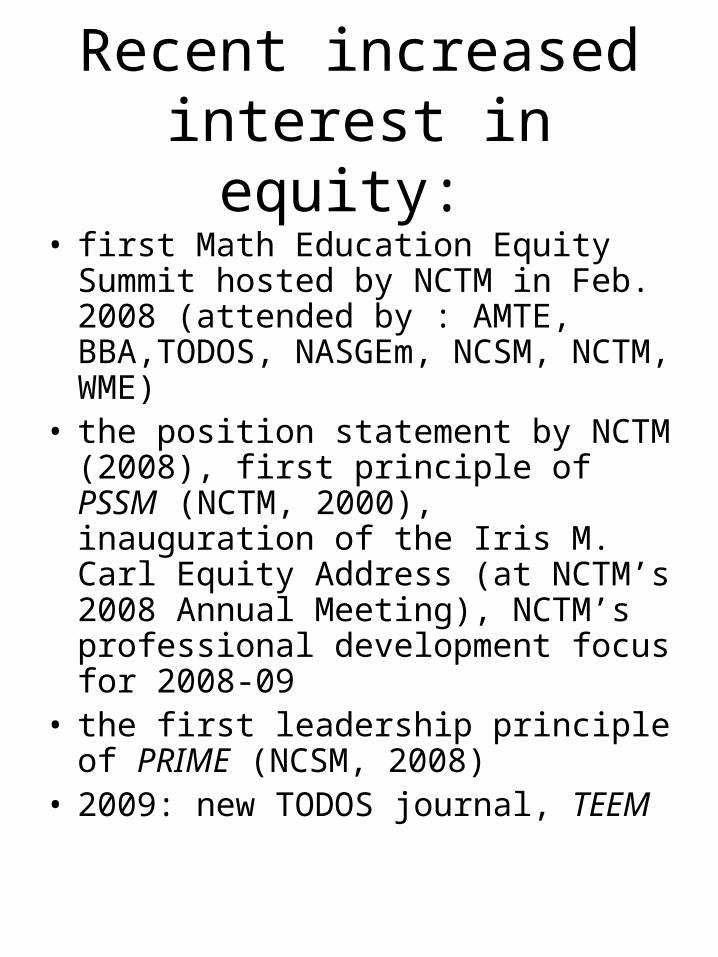
Recent increased interest in equity:
• first Math Education Equity Summit hosted by NCTM in Feb. 2008 (attended by : AMTE, BBA,TODOS, NASGEm, NCSM, NCTM, WME)
• the position statement by NCTM (2008), first principle of PSSM (NCTM, 2000), inauguration of the Iris M. Carl Equity Address (at NCTM’s 2008 Annual Meeting), NCTM’s professional development focus for 2008-09
• the first leadership principle of PRIME (NCSM, 2008)
• 2009: new TODOS journal, TEEM
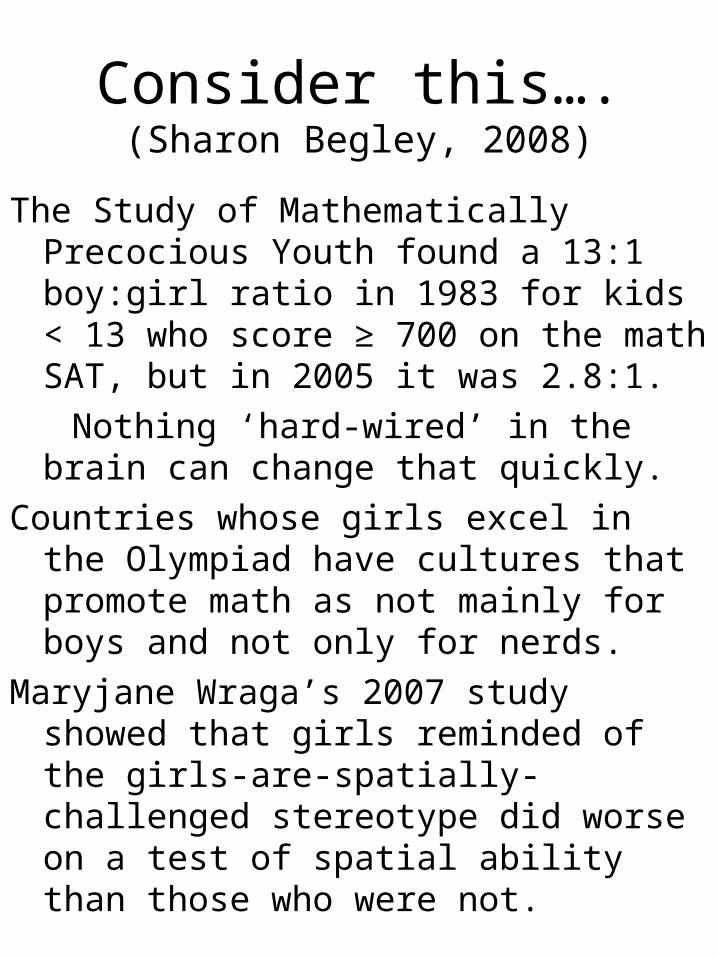
Consider this….(Sharon Begley, 2008)
The Study of Mathematically Precocious Youth found a 13:1 boy:girl ratio in 1983 for kids < 13 who score ≥ 700 on the math SAT, but in 2005 it was 2.8:1.
Nothing ‘hard-wired’ in the brain can change that quickly.
Countries whose girls excel in the Olympiad have cultures that promote math as not mainly for boys and not only for nerds.
Maryjane Wraga’s 2007 study showed that girls reminded of the girls-are-spatially-challenged stereotype did worse on a test of spatial ability than those who were not.
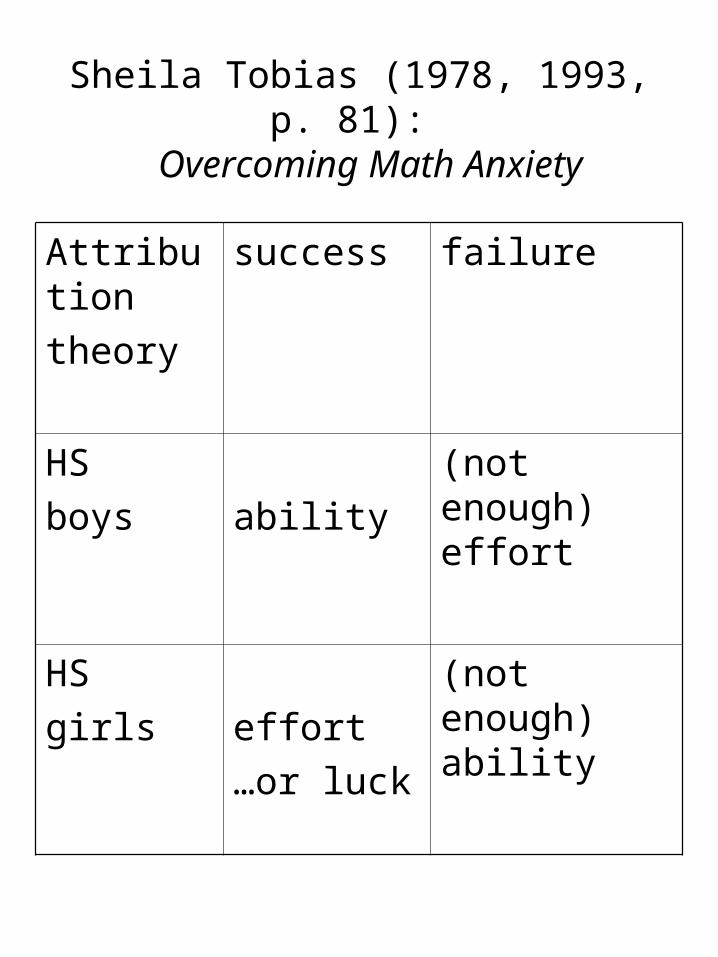
Sheila Tobias (1978, 1993, p. 81): Overcoming Math Anxiety
Attribution
theory
success failure
HS
boys ability
(not enough) effort
HS
girls effort
…or luck
(not enough) ability
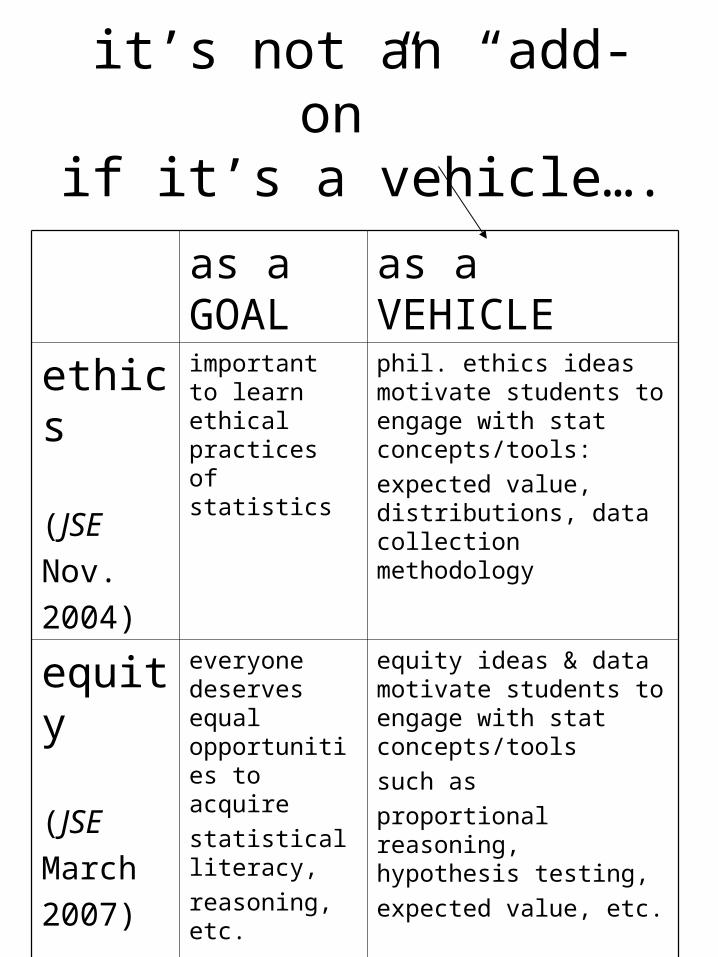
it’s not an “add-on” if it’s a vehicle….
as a GOAL
as a VEHICLE
ethics
(JSE
Nov.
2004)
important to learn ethical practices of statistics
phil. ethics ideas motivate students to engage with stat concepts/tools:
expected value, distributions, data collection methodology
equity
(JSE
March
2007)
everyone deserves equal opportunities to acquire
statistical literacy,
reasoning, etc.
equity ideas & data motivate students to engage with stat concepts/tools
such as
proportional reasoning, hypothesis testing,
expected value, etc.
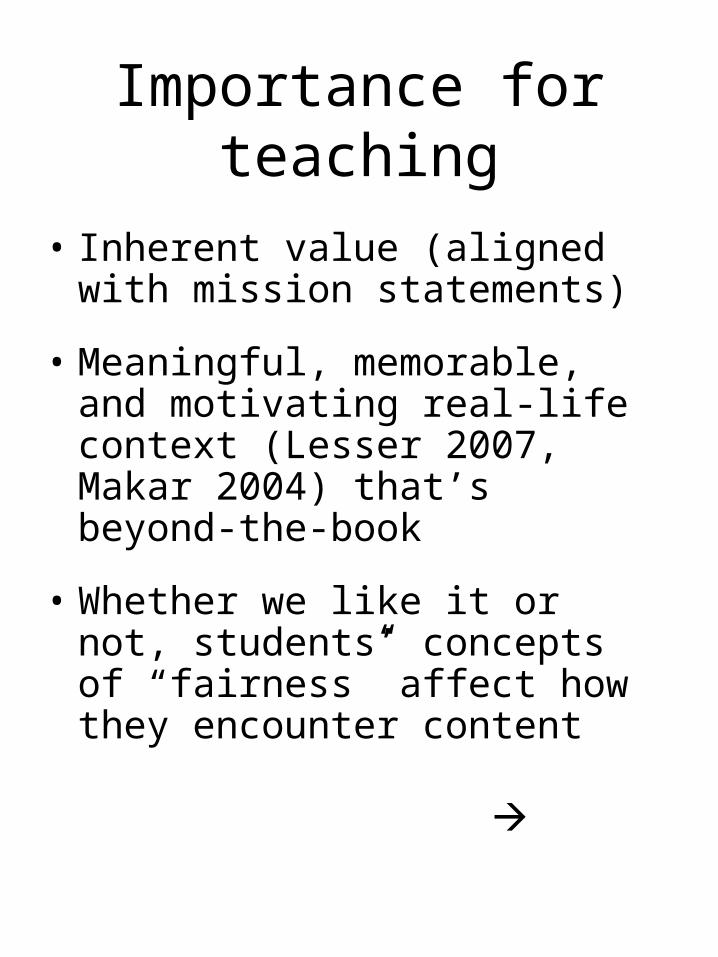
Importance for teaching
• Inherent value (aligned with mission statements)
• Meaningful, memorable, and motivating real-life context (Lesser 2007, Makar 2004) that’s beyond-the-book
• Whether we like it or not, students’ concepts of “fairness” affect how they encounter content
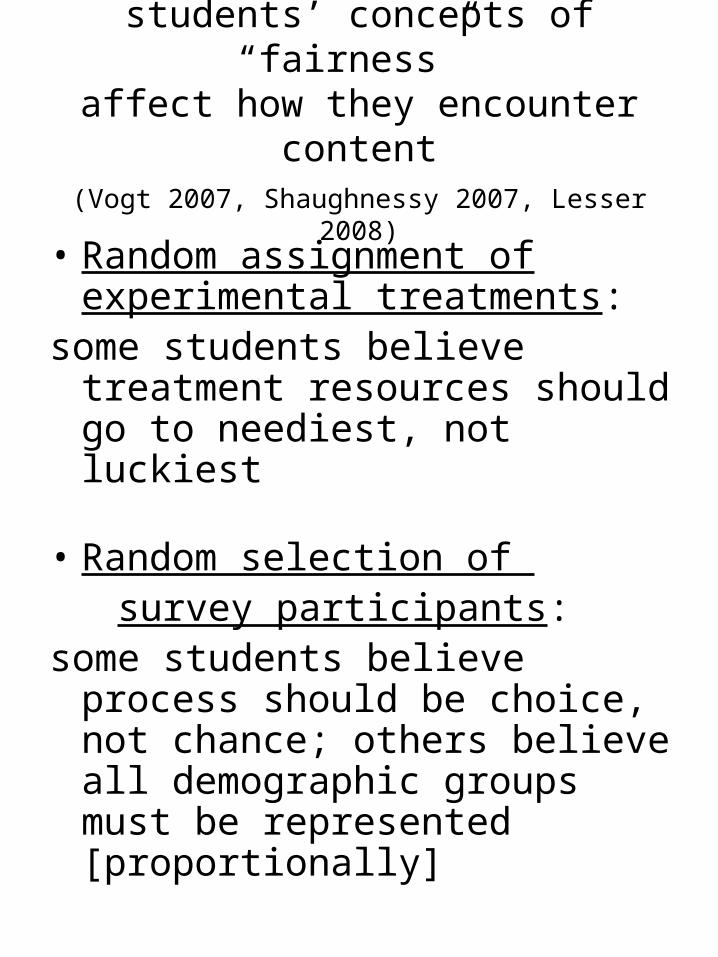
students’ concepts of “fairness” affect how they encounter content(Vogt 2007, Shaughnessy 2007, Lesser 2008)
• Random assignment of experimental treatments:
some students believe treatment resources should go to neediest, not luckiest
• Random selection of survey participants: some students believe process
should be choice, not chance; others believe all demographic groups must be represented [proportionally]
Project ACE background
• 10 university faculty in multiple departments redesigning a wide range of courses, including:
bilingual/ESL education, mathematics, statistics, physical science, critical pedagogy, & multicultural education
• ACE offered multiple workshops, webinars, seminars, articles, and other professional development on relevant issues, including:
service learning, gender issues in the classroom, & gender/equity issues in STEM fields
Project ACE Goals include:
• increase access to higher ed for girls, women, and underrepresented minorities
(Females are among the groups who “have traditionally been far more likely…to be the victims of low expectations”, NCTM 2000, p. 13).
• raise awareness about opportunities in STEM careers for young women
• engage future/current teachers in planning, implementation and evaluation of community service learning activities that will enhance educational equity and solve community problems
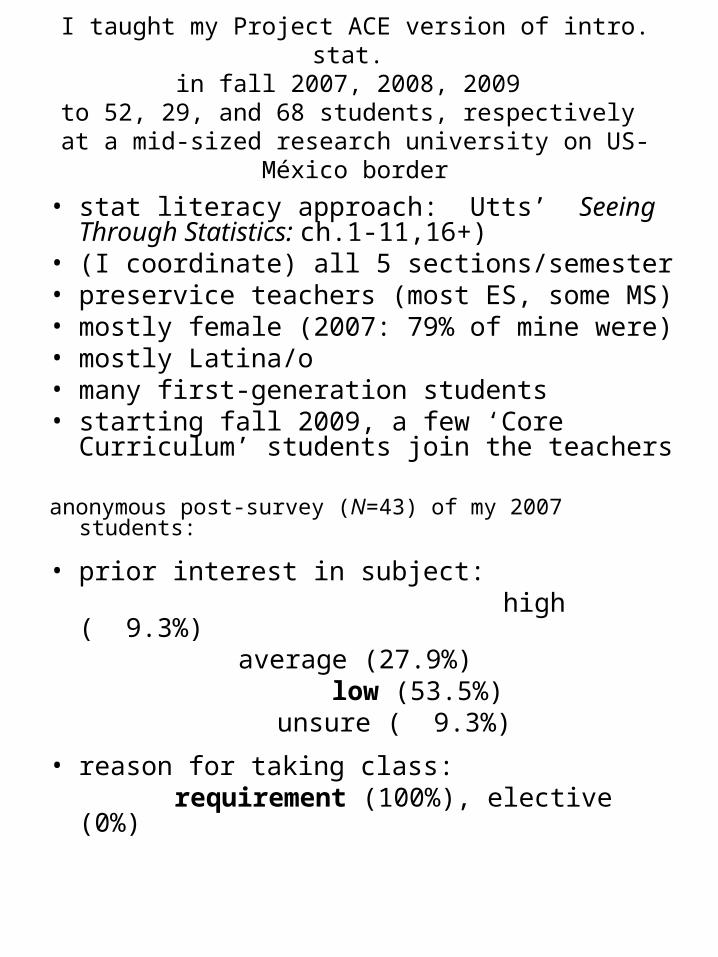
I taught my Project ACE version of intro. stat. in fall 2007, 2008, 2009
to 52, 29, and 68 students, respectively at a mid-sized research university on US-México border
• stat literacy approach: Utts’ Seeing Through Statistics: ch.1-11,16+)
• (I coordinate) all 5 sections/semester• preservice teachers (most ES, some MS)• mostly female (2007: 79% of mine were)• mostly Latina/o • many first-generation students• starting fall 2009, a few ‘Core Curriculum’
students join the teachers
anonymous post-survey (N=43) of my 2007 students:
• prior interest in subject: high ( 9.3%)
average (27.9%) low (53.5%) unsure ( 9.3%)
• reason for taking class: requirement (100%), elective (0%)
goals for my fall 2007 “ACE Stat 1380” included:
• Provide students tools to describe and assess equity.
• Have students explore specific examples or activities that involve gender equity.
• Offer project opportunity that connects to gender equity, social justice or service learning.
• Use pedagogy that gives both genders full chance to participate and learn!
Classroom Strategies
• Humanize subject matter by showing how it came from, connects to, and can be used to help the real-world.
• Mention specific male & female contributors to the field. (resource: www.sacnas.org/biography/)
• Give males & females equal opportunities to answer questions of comparable complexity.
• Provide opportunities for (non-competitive) collaborative learning, and when forming groups, make sure no group has only 1 female, and have roles rotate or randomly assigned
• And….. ???
Some Methods Used• Discussion of equity examples (El Paso
Portraits: Women’s Lives, Potential and Opportunities)
• Launching webpage of resources: www.math.utep.edu/Faculty/lesser/equity.html
• More collaborative learning (including most quizzes and projects)
• Discussed my STEM work as statistician outside academia; modeled my work as a statistics education researcher
• Connections to state (e.g., TEKS, TAKS) and national standards (e.g., K-12 GAISE, NCTM Standards, & Curriculum Focal Points)
• More modeling of technology (TI-73, Excel, applets) & manipulatives, including hands-on computer work
• Final project (authentic assessment)
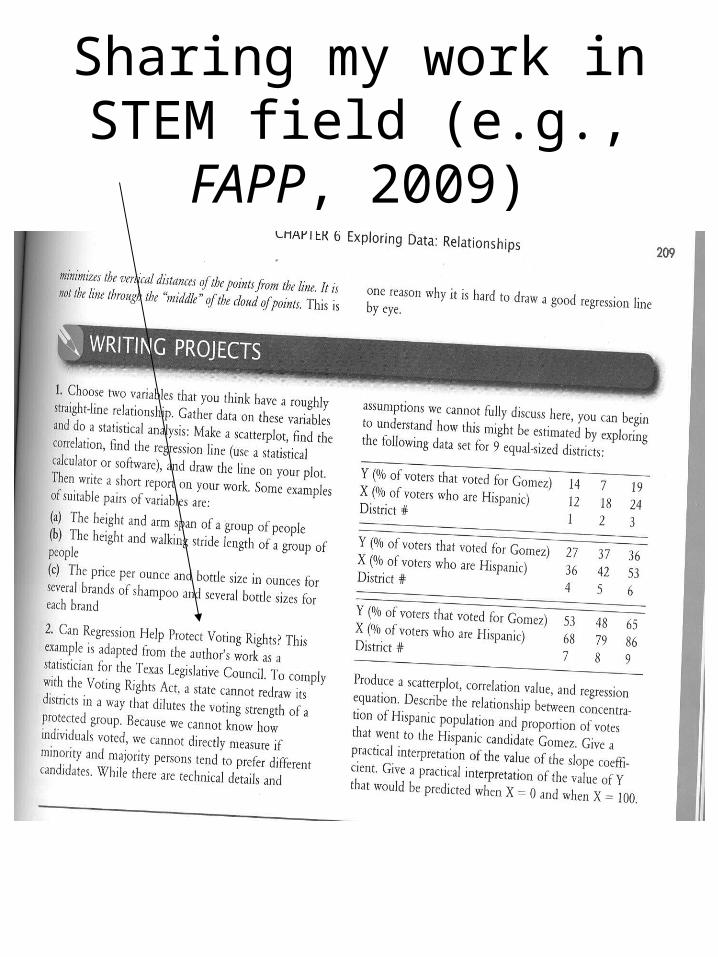
Sharing my work in STEM field (e.g., FAPP, 2009)
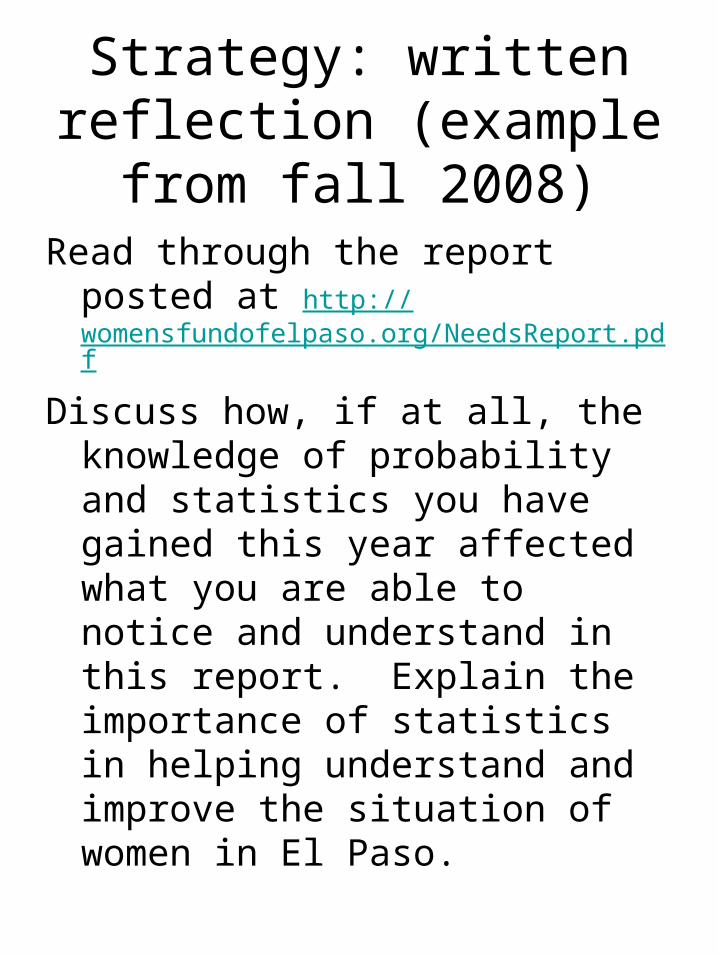
Strategy: written reflection (example from fall 2008)
Read through the report posted at http://womensfundofelpaso.org/NeedsReport.pdf
Discuss how, if at all, the knowledge of probability and statistics you have gained this year affected what you are able to notice and understand in this report. Explain the importance of statistics in helping understand and improve the situation of women in El Paso.

Strategy: written reflection (example from fall 2009)
Questions about S. Begley’s column (9/14/09 Newsweek) include:
• Are ‘disguised gender experiments’ necessary to learn whether people treat babies differently based on the babies’ gender? Explain.
• Does the research discussed in the article support or not support the idea that girls and boys have equal potentials to pursue a career in the STEM fields? Explain.

Results from this assignment
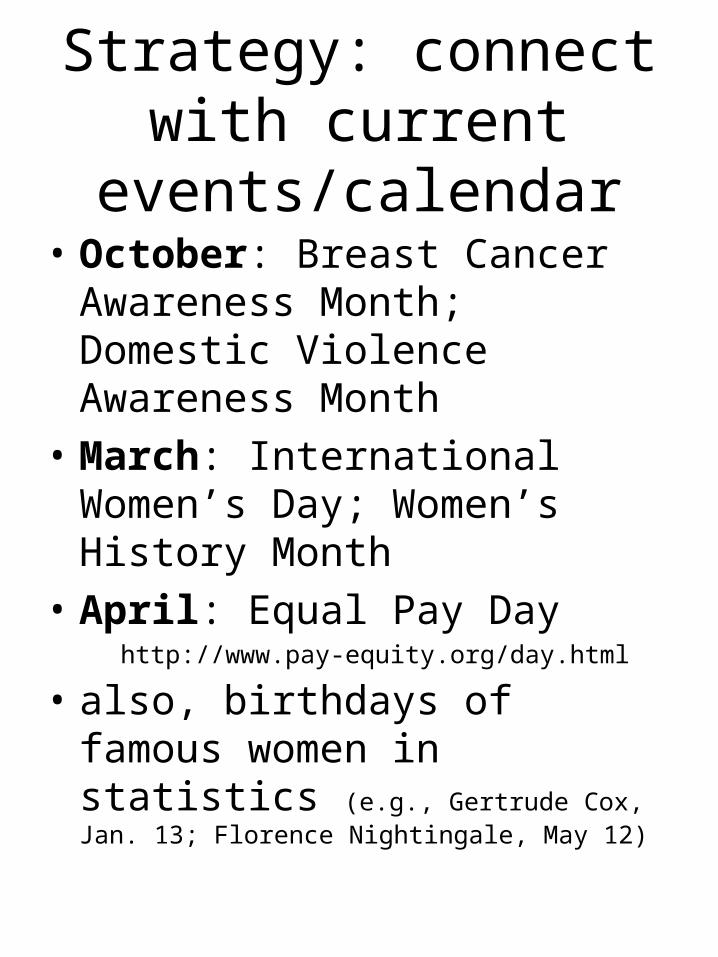
Strategy: connect with current events/calendar
• October: Breast Cancer Awareness Month; Domestic Violence Awareness Month
• March: International Women’s Day; Women’s History Month
• April: Equal Pay Day http://www.pay-equity.org/day.html
• also, birthdays of famous women in statistics (e.g., Gertrude Cox, Jan. 13; Florence Nightingale, May 12)
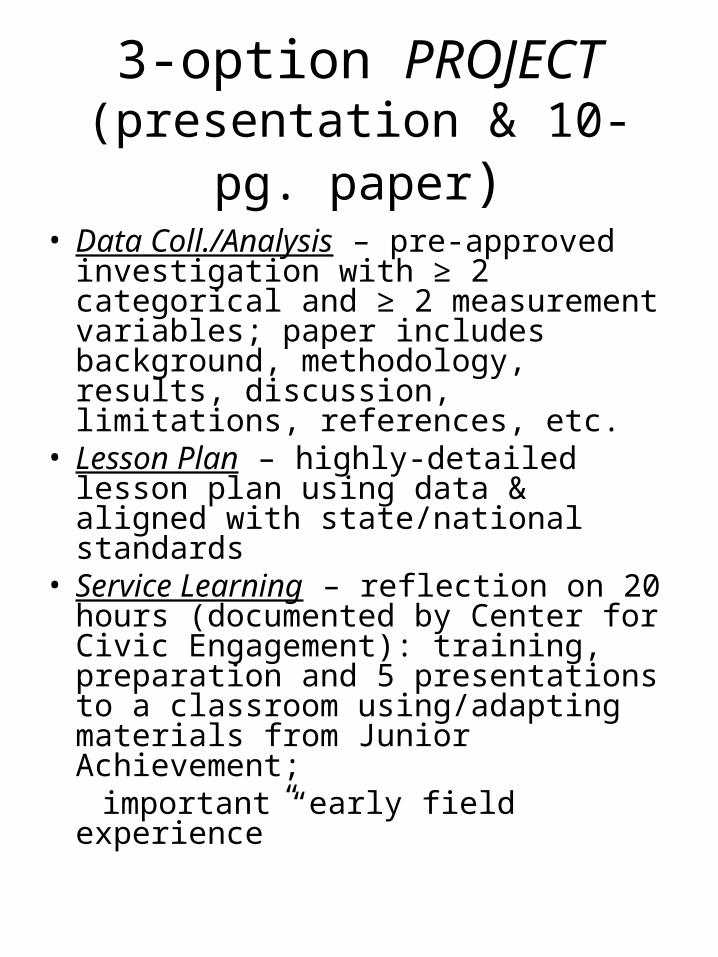
3-option PROJECT (presentation & 10-pg. paper)
• Data Coll./Analysis – pre-approved investigation with ≥ 2 categorical and ≥ 2 measurement variables; paper includes background, methodology, results, discussion, limitations, references, etc.
• Lesson Plan – highly-detailed lesson plan using data & aligned with state/national standards
• Service Learning – reflection on 20 hours (documented by Center for Civic Engagement): training, preparation and 5 presentations to a classroom using/adapting materials from Junior Achievement;
important “early field experience”
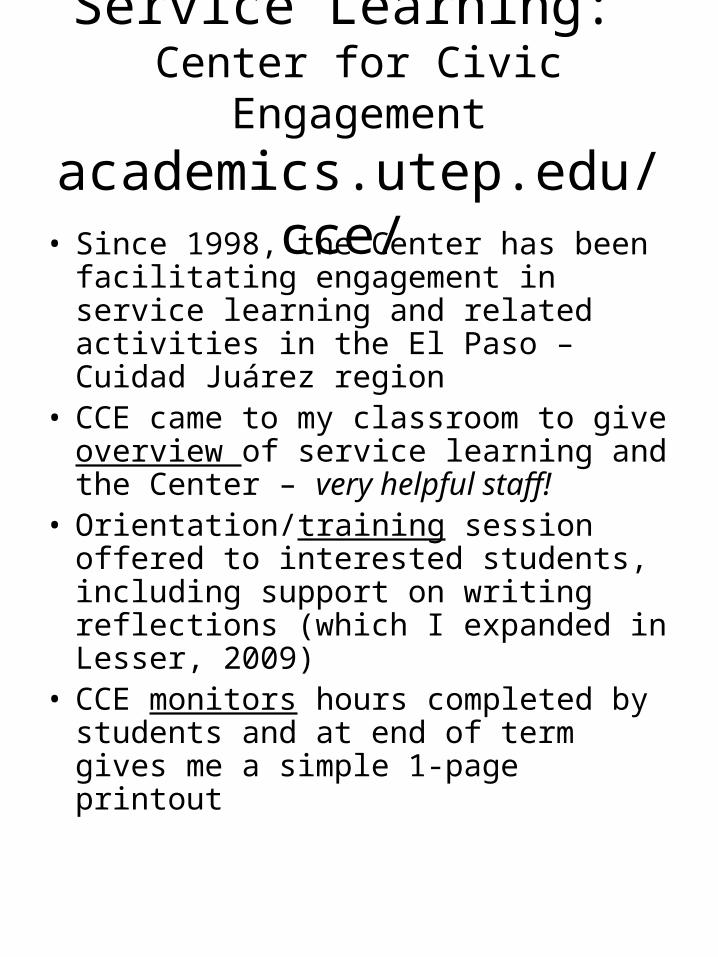
Service Learning: Center for Civic Engagement
academics.utep.edu/cce/ • Since 1998, the Center has been
facilitating engagement in service learning and related activities in the El Paso – Cuidad Juárez region
• CCE came to my classroom to give overview of service learning and the Center – very helpful staff!
• Orientation/training session offered to interested students, including support on writing reflections (which I expanded in Lesser, 2009)
• CCE monitors hours completed by students and at end of term gives me a simple 1-page printout
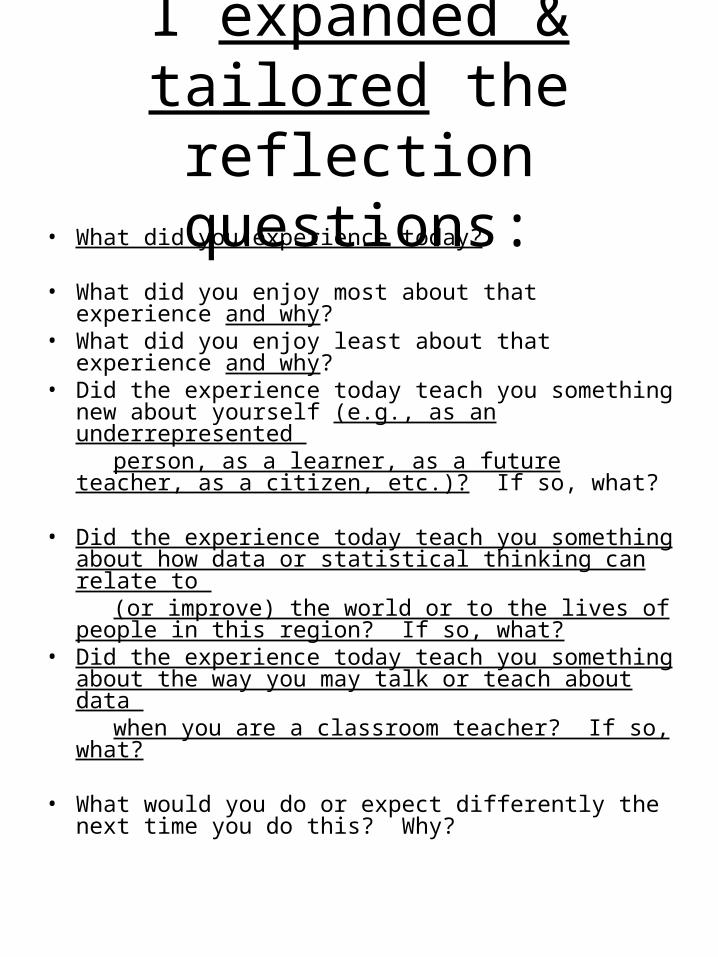
I expanded & tailored the reflection questions:• What did you experience today?
• What did you enjoy most about that experience and why?
• What did you enjoy least about that experience and why?
• Did the experience today teach you something new about yourself (e.g., as an underrepresented
person, as a learner, as a future teacher, as a citizen, etc.)? If so, what?
• Did the experience today teach you something about how data or statistical thinking can relate to
(or improve) the world or to the lives of people in this region? If so, what?
• Did the experience today teach you something about the way you may talk or teach about data
when you are a classroom teacher? If so, what?
• What would you do or expect differently the next time you do this? Why?
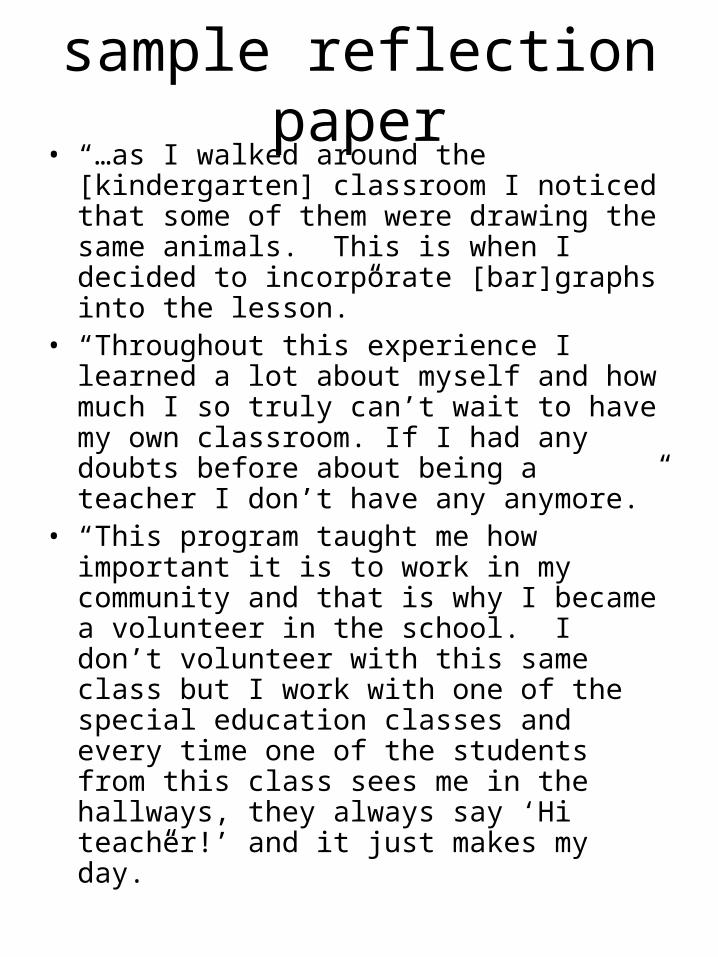
sample reflection paper• “…as I walked around the [kindergarten]
classroom I noticed that some of them were drawing the same animals. This is when I decided to incorporate [bar]graphs into the lesson.”
• “Throughout this experience I learned a lot about myself and how much I so truly can’t wait to have my own classroom. If I had any doubts before about being a teacher I don’t have any anymore.”
• “This program taught me how important it is to work in my community and that is why I became a volunteer in the school. I don’t volunteer with this same class but I work with one of the special education classes and every time one of the students from this class sees me in the hallways, they always say ‘Hi teacher!’ and it just makes my day.”
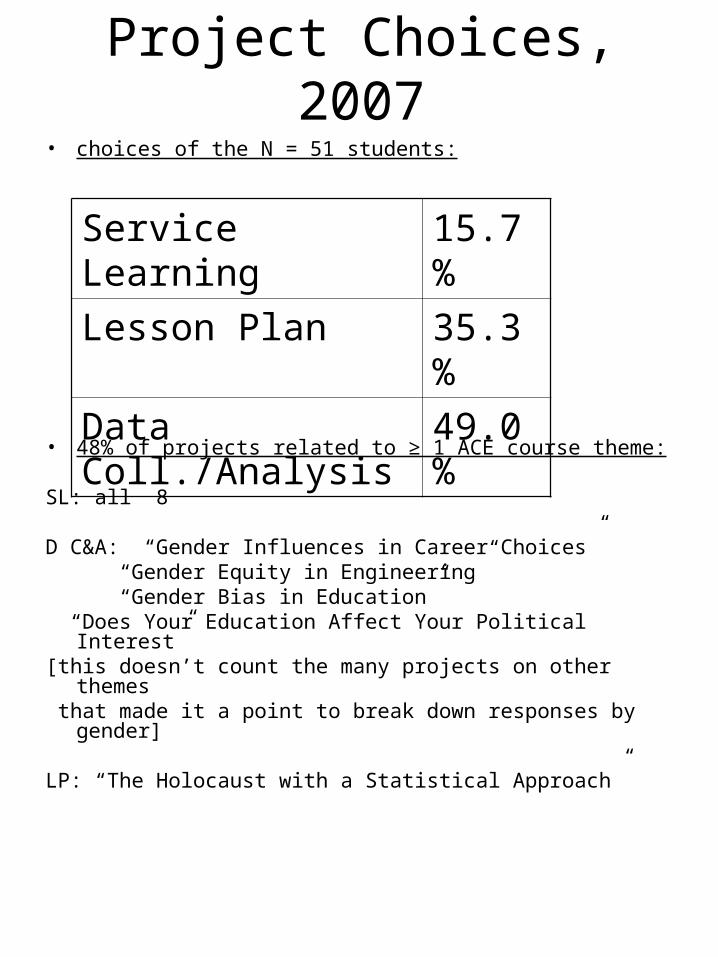
Project Choices, 2007• choices of the N = 51 students:
• 48% of projects related to ≥ 1 ACE course theme:
SL: all 8
D C&A: “Gender Influences in Career Choices” “Gender Equity in Engineering” “Gender Bias in Education” “Does Your Education Affect Your Political Interest”[this doesn’t count the many projects on other themes that made it a point to break down responses by gender] LP: “The Holocaust with a Statistical Approach”
Service Learning 15.7%
Lesson Plan 35.3%
Data Coll./Analysis 49.0%
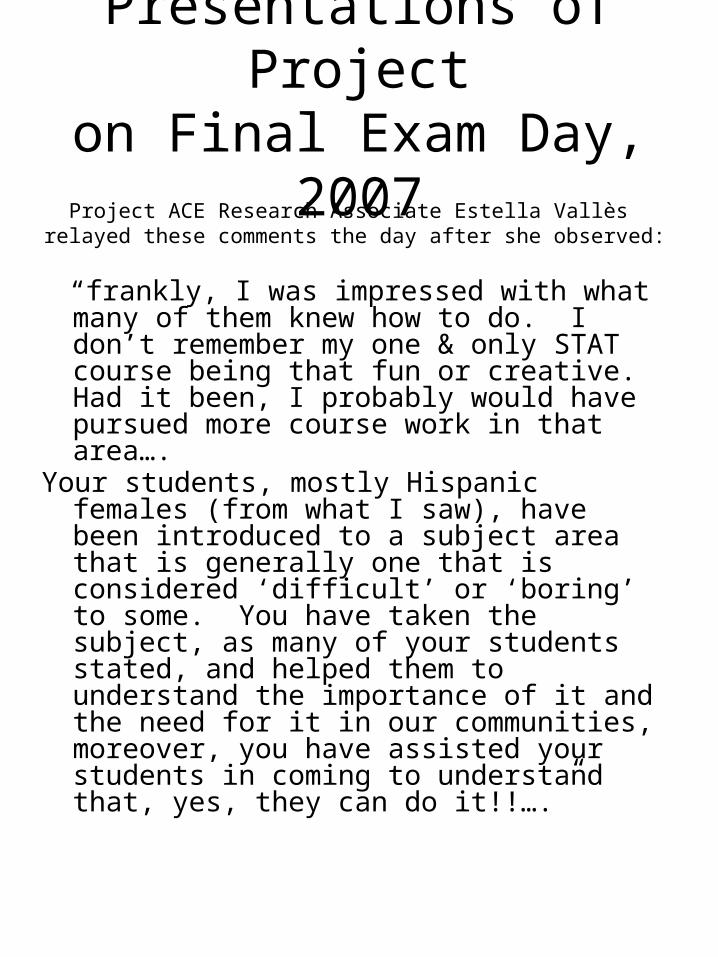
Presentations of Projecton Final Exam Day, 2007
Project ACE Research Associate Estella Vallès relayed these comments the day after she observed:
“frankly, I was impressed with what many of them knew how to do. I don’t remember my one & only STAT course being that fun or creative. Had it been, I probably would have pursued more course work in that area….
Your students, mostly Hispanic females (from what I saw), have been introduced to a subject area that is generally one that is considered ‘difficult’ or ‘boring’ to some. You have taken the subject, as many of your students stated, and helped them to understand the importance of it and the need for it in our communities, moreover, you have assisted your students in coming to understand that, yes, they can do it!!….”
My Reflection on 2007 Project Presentations
• feeling of community in math class was (unusually) strong
• students’ presentation skills and poise were great
• I underestimated how much students could incorporate critical thinking and nontrivial personal reflection into their presentations, including at least one “quiet” student
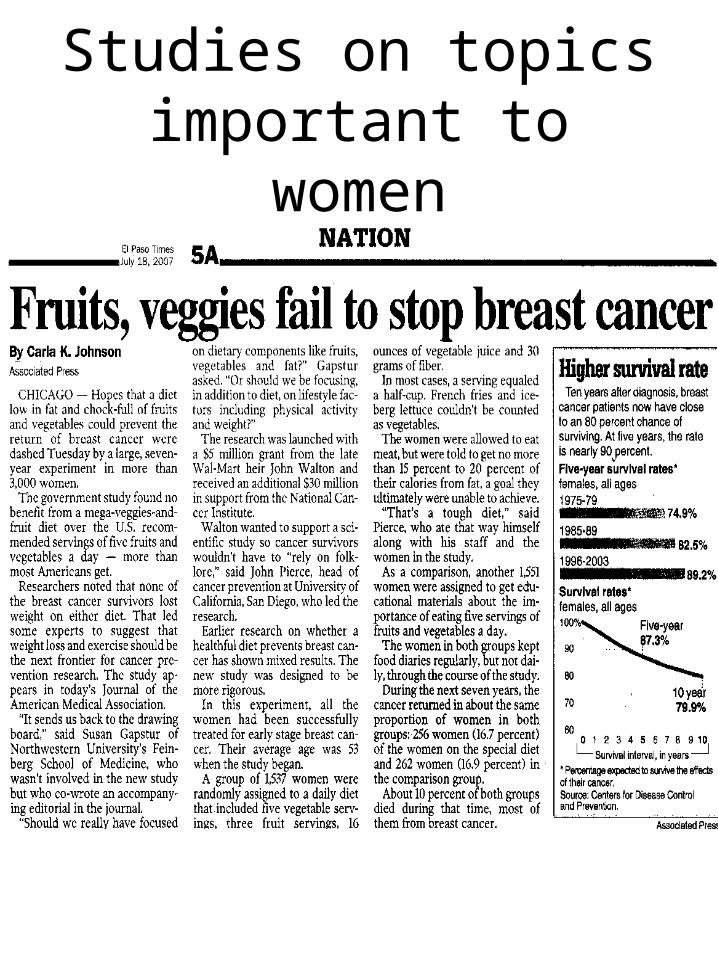
Studies on topics important to women
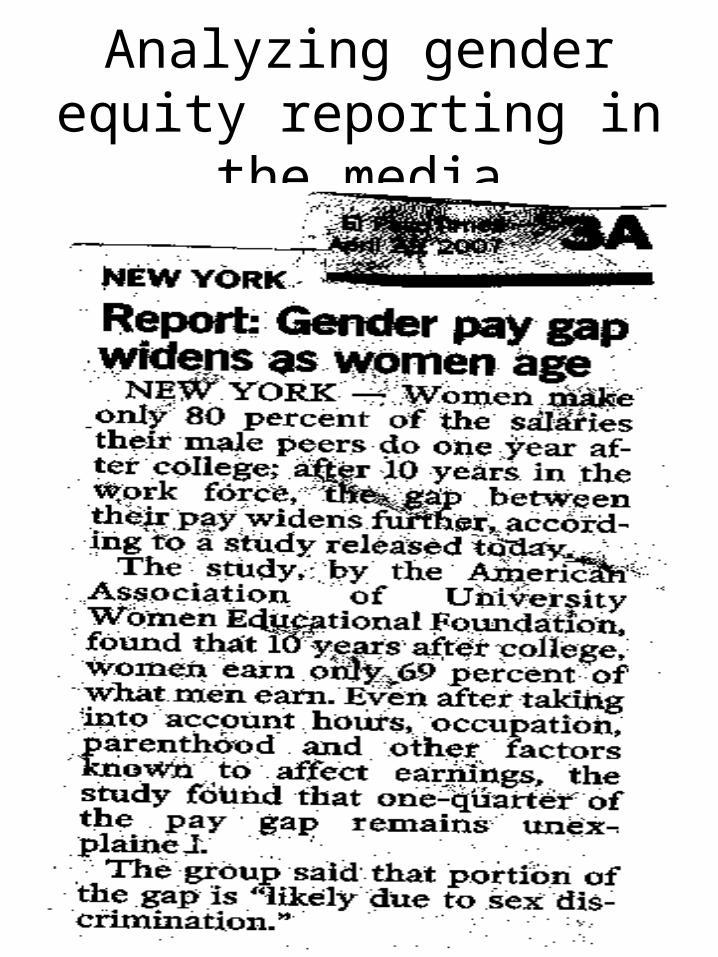
Analyzing gender equity reporting in the media
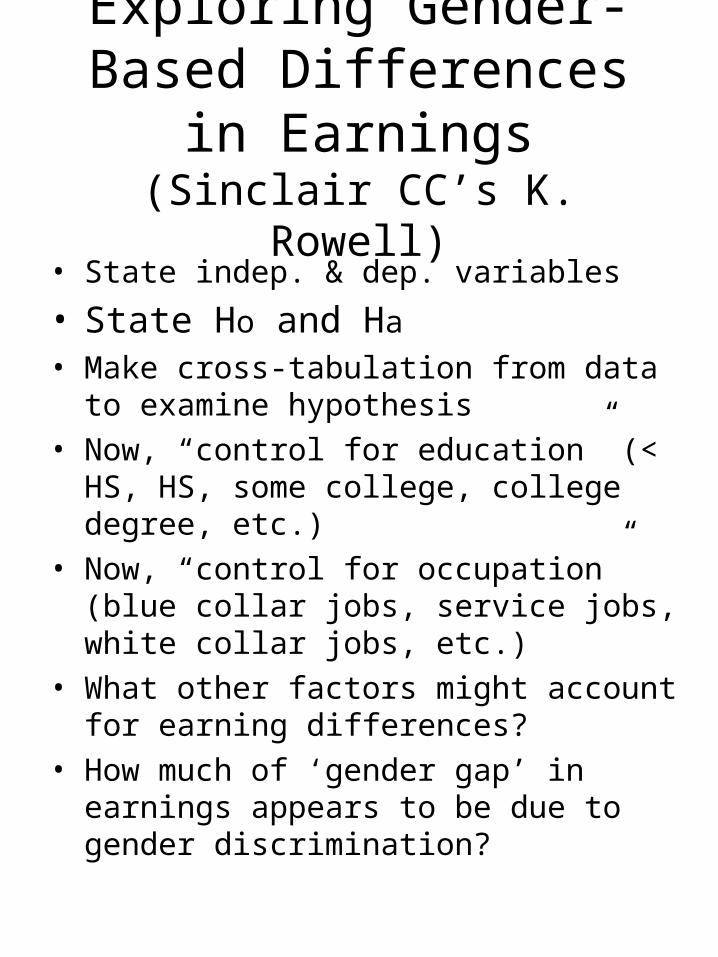
Exploring Gender-Based Differences in Earnings
(Sinclair CC’s K. Rowell)
• State indep. & dep. variables
• State Ho and Ha
• Make cross-tabulation from data to examine hypothesis
• Now, “control for education” (< HS, HS, some college, college degree, etc.)
• Now, “control for occupation” (blue collar jobs, service jobs, white collar jobs, etc.)
• What other factors might account for earning differences?
• How much of ‘gender gap’ in earnings appears to be due to gender discrimination?
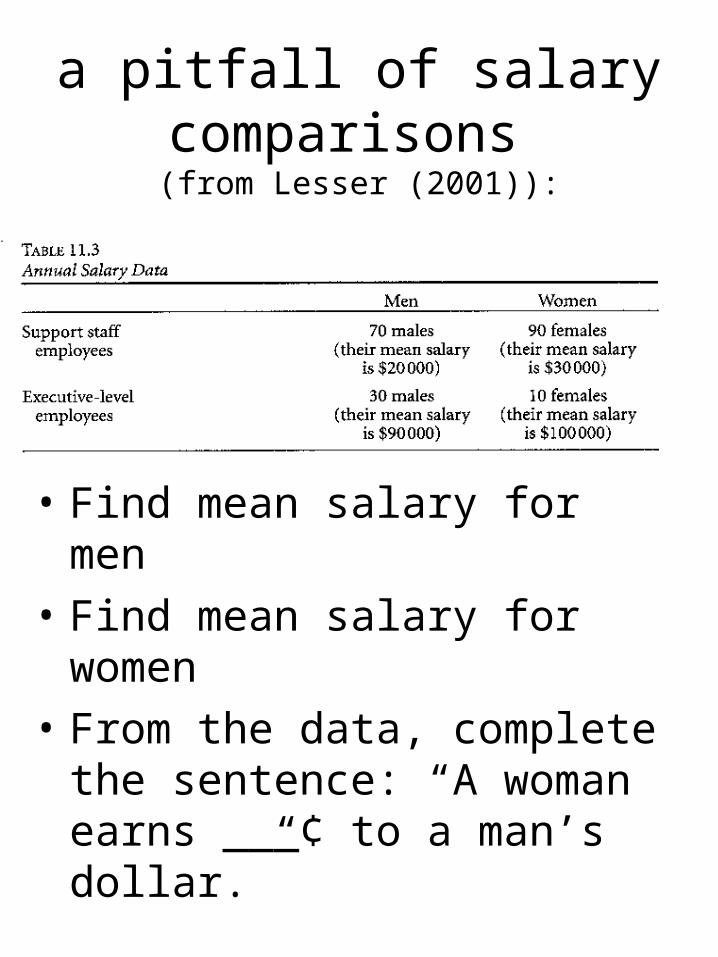
a pitfall of salary comparisons (from Lesser (2001)):
• Find mean salary for men
• Find mean salary for women
• From the data, complete the sentence: “A woman earns ___¢ to a man’s dollar.”
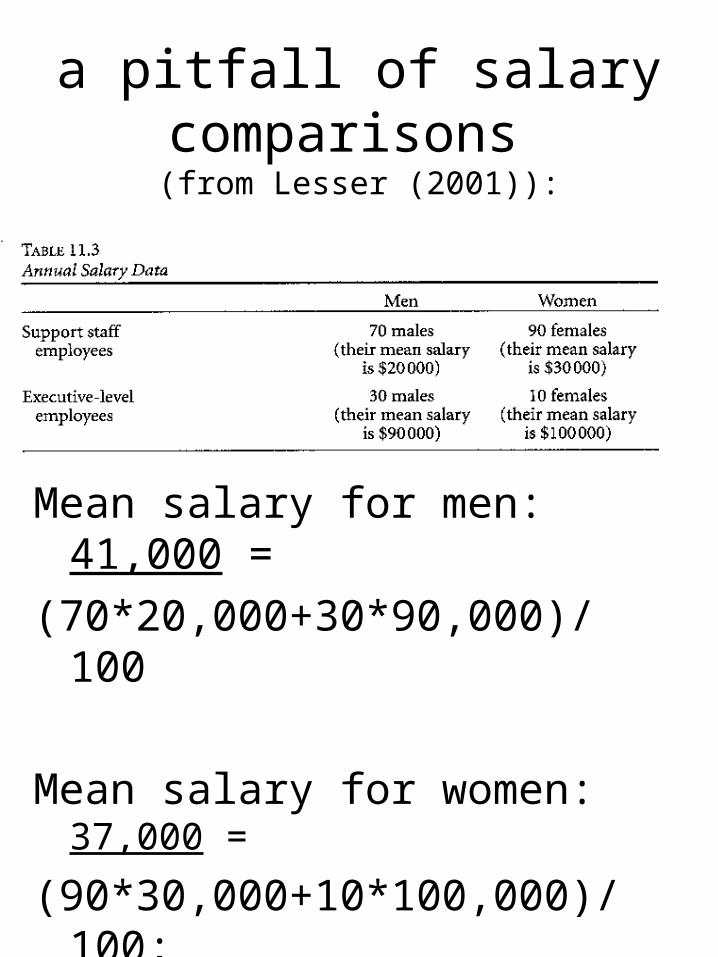
a pitfall of salary comparisons (from Lesser (2001)):
Mean salary for men: 41,000 =
(70*20,000+30*90,000)/100
Mean salary for women: 37,000 =
(90*30,000+10*100,000)/100;
(this is “90¢ to a man’s dollar”)
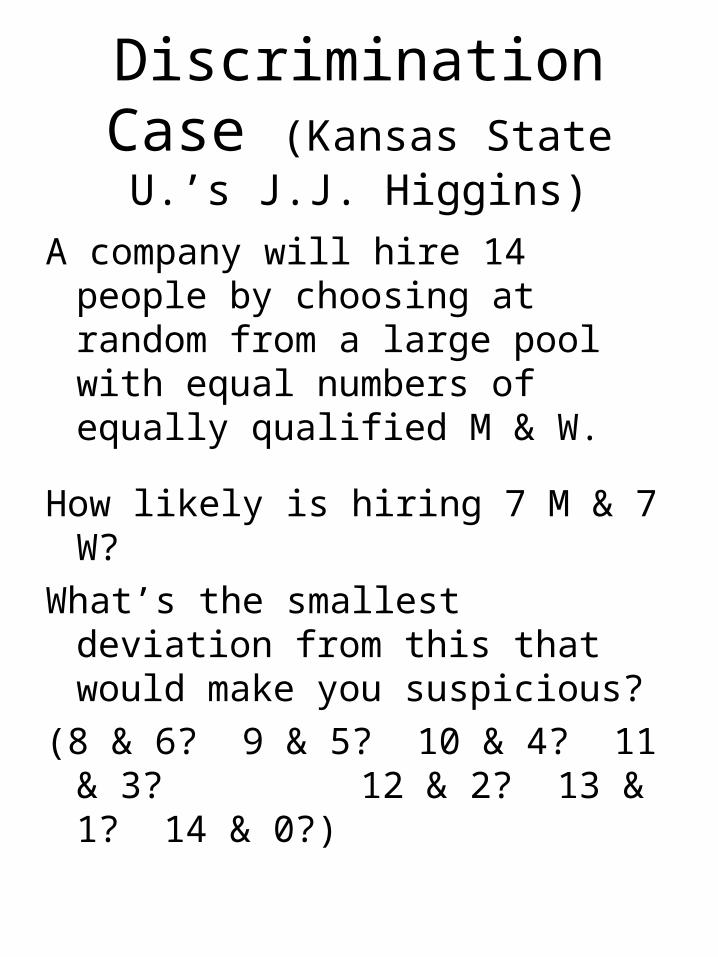
Discrimination Case (Kansas State U.’s J.J. Higgins)
A company will hire 14 people by choosing at random from a large pool with equal numbers of equally qualified M & W.
How likely is hiring 7 M & 7 W?
What’s the smallest deviation from this that would make you suspicious?
(8 & 6? 9 & 5? 10 & 4? 11 & 3? 12 & 2? 13 & 1? 14 & 0?)
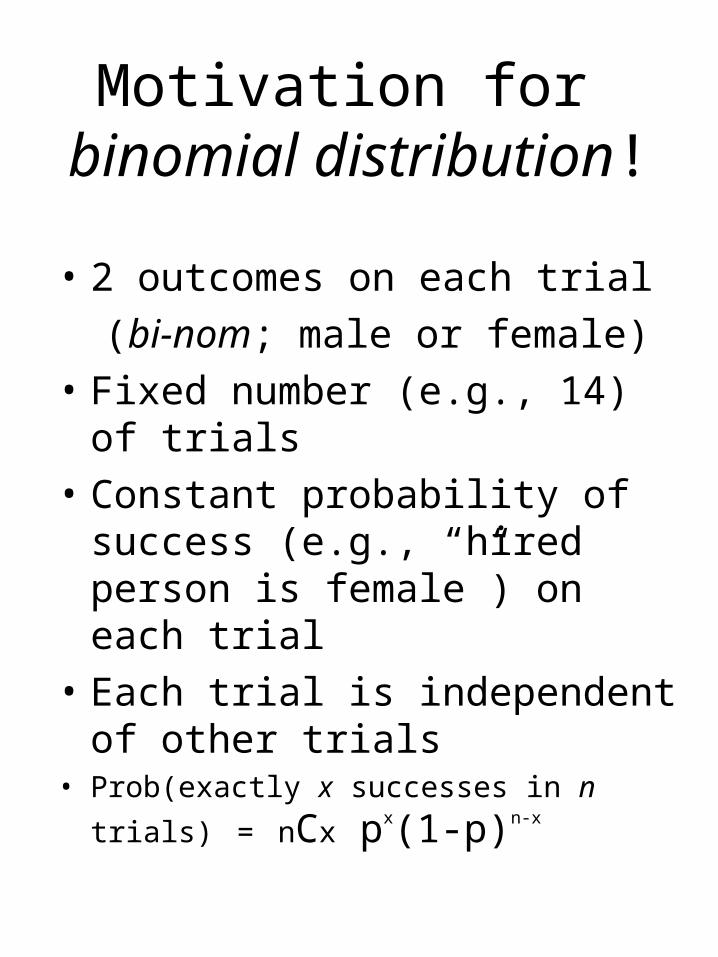
Motivation for binomial distribution!
• 2 outcomes on each trial
(bi-nom; male or female)
• Fixed number (e.g., 14) of trials
• Constant probability of success (e.g., “hired person is female”) on each trial
• Each trial is independent of other trials
• Prob(exactly x successes in n trials) = nCx px(1-p)n-x
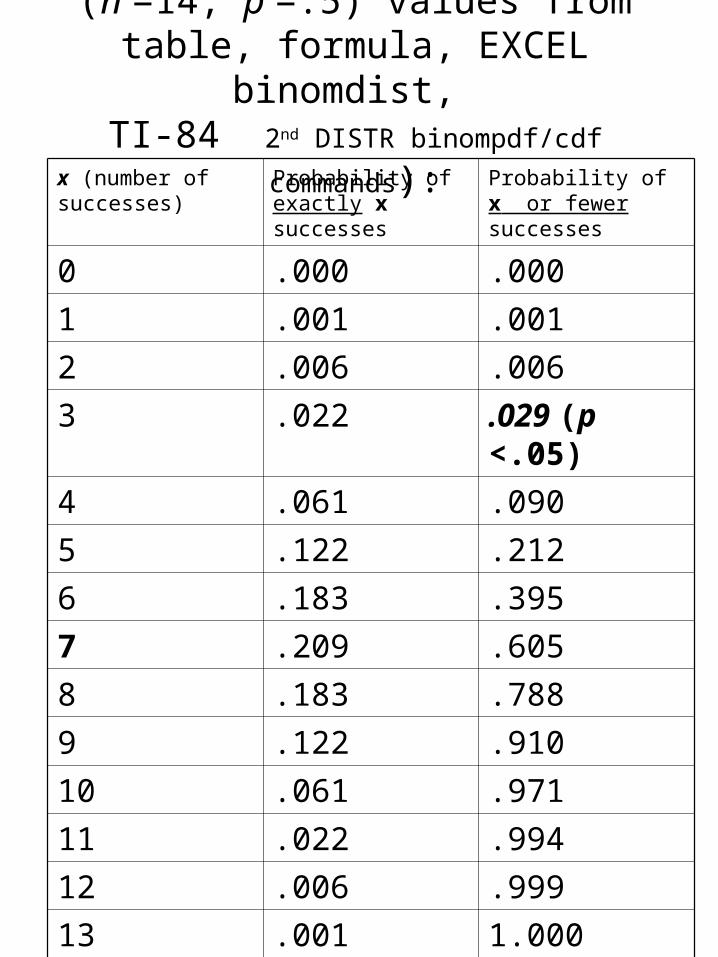
(n =14, p =.5) values from table, formula, EXCEL binomdist,
TI-84 2nd DISTR binompdf/cdf commands):x (number of successes)
Probability of exactly x successes
Probability of x or fewer successes
0 .000 .000
1 .001 .001
2 .006 .006
3 .022 .029 (p <.05)
4 .061 .090
5 .122 .212
6 .183 .395
7 .209 .605
8 .183 .788
9 .122 .910
10 .061 .971
11 .022 .994
12 .006 .999
13 .001 1.000
14 .000 1.000
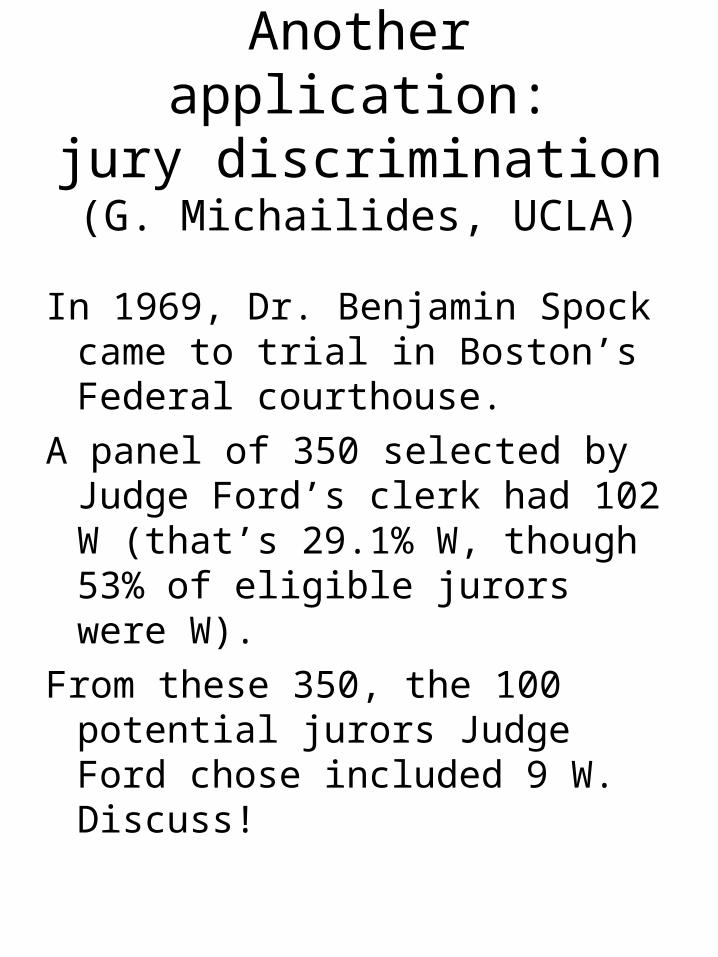
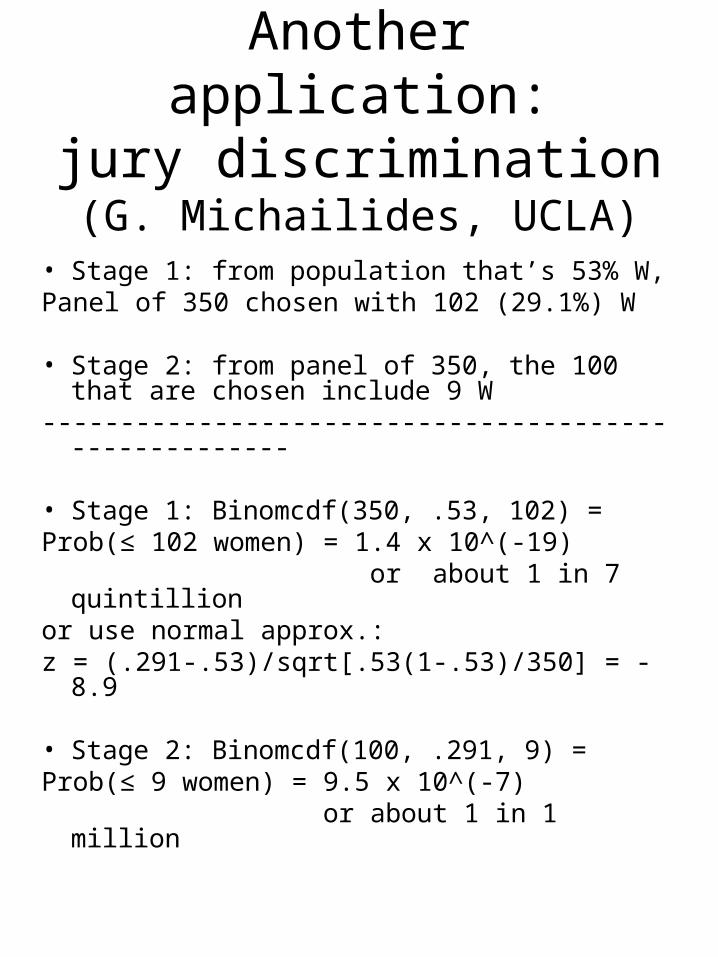
Another application:jury discrimination(G. Michailides, UCLA)
In 1969, Dr. Benjamin Spock came to trial in Boston’s Federal courthouse.
A panel of 350 selected by Judge Ford’s clerk had 102 W (that’s 29.1% W, though 53% of eligible jurors were W).
From these 350, the 100 potential jurors Judge Ford chose included 9 W. Discuss!
Another application:jury discrimination(G. Michailides, UCLA)
• Stage 1: from population that’s 53% W,Panel of 350 chosen with 102 (29.1%) W • Stage 2: from panel of 350, the 100 that
are chosen include 9 W------------------------------------------------------
• Stage 1: Binomcdf(350, .53, 102) = Prob(≤ 102 women) = 1.4 x 10^(-19) or about 1 in 7 quintillionor use normal approx.: z = (.291-.53)/sqrt[.53(1-.53)/350] = -8.9
• Stage 2: Binomcdf(100, .291, 9) =Prob(≤ 9 women) = 9.5 x 10^(-7) or about 1 in 1 million
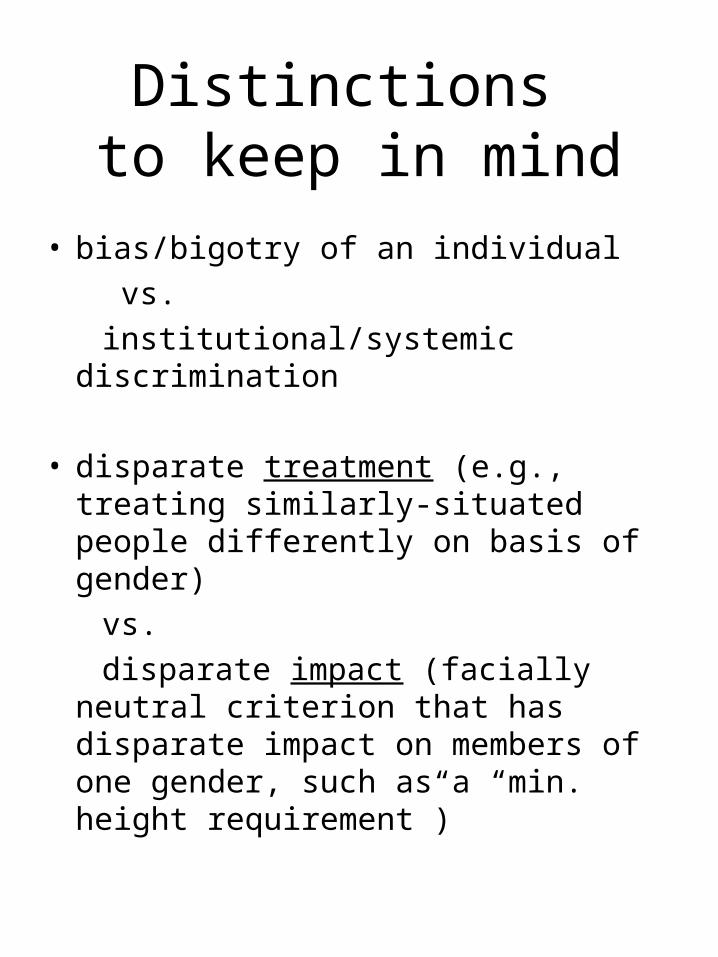
Distinctions to keep in mind
• bias/bigotry of an individual
vs.
institutional/systemic discrimination
• disparate treatment (e.g., treating similarly-situated people differently on basis of gender)
vs.
disparate impact (facially neutral criterion that has disparate impact on members of one gender, such as a “min. height requirement”)
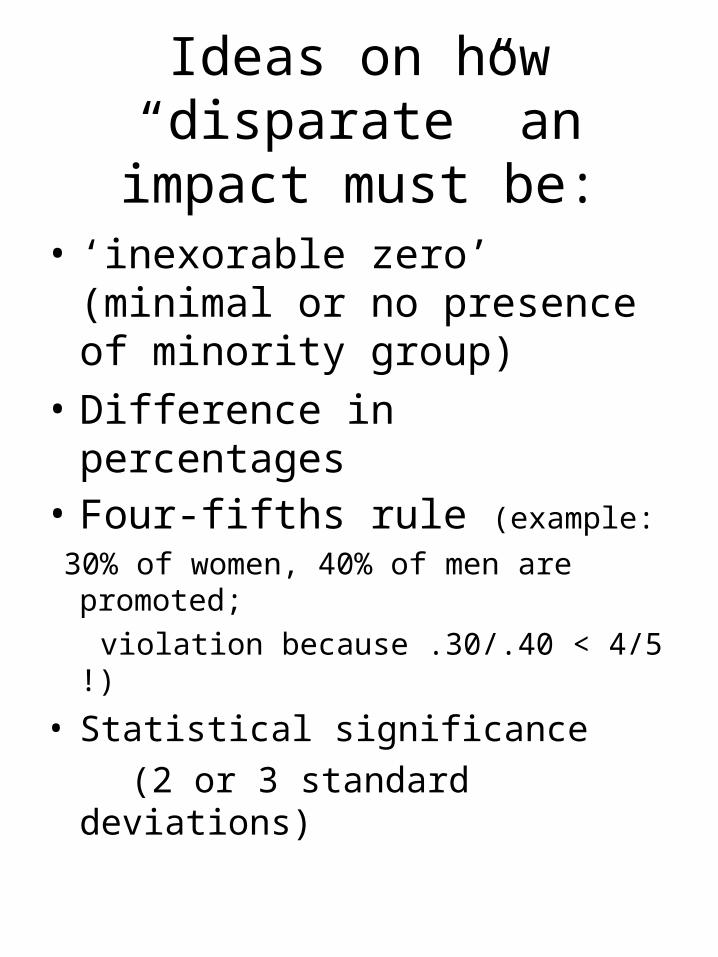
Ideas on how “disparate” an impact must be:
• ‘inexorable zero’ (minimal or no presence of minority group)
• Difference in percentages• Four-fifths rule (example:
30% of women, 40% of men are promoted;
violation because .30/.40 < 4/5 !)
• Statistical significance
(2 or 3 standard deviations)
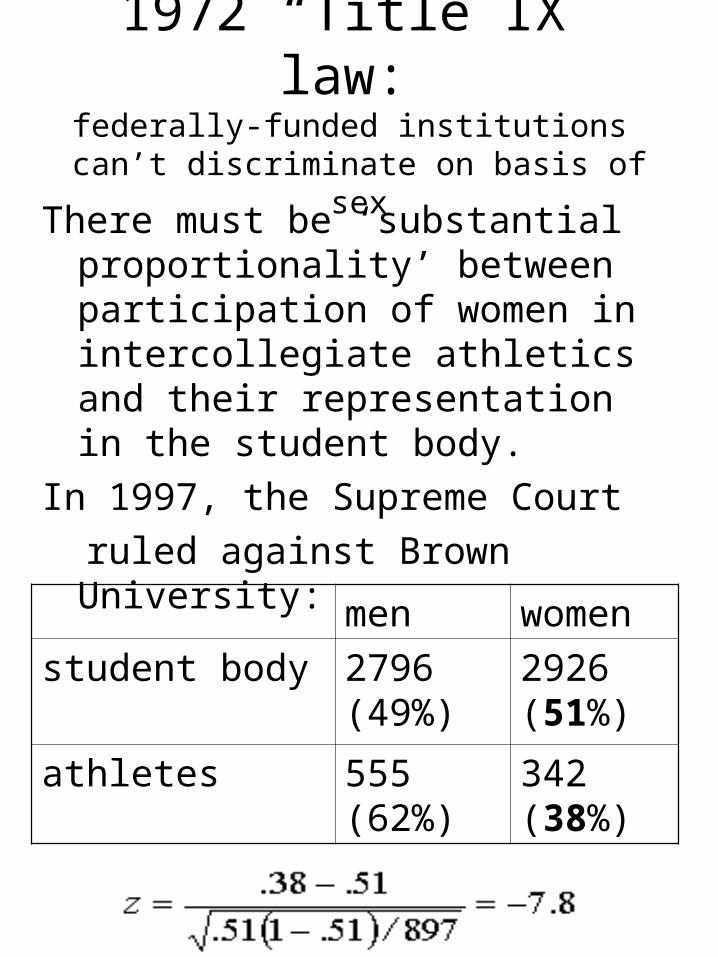
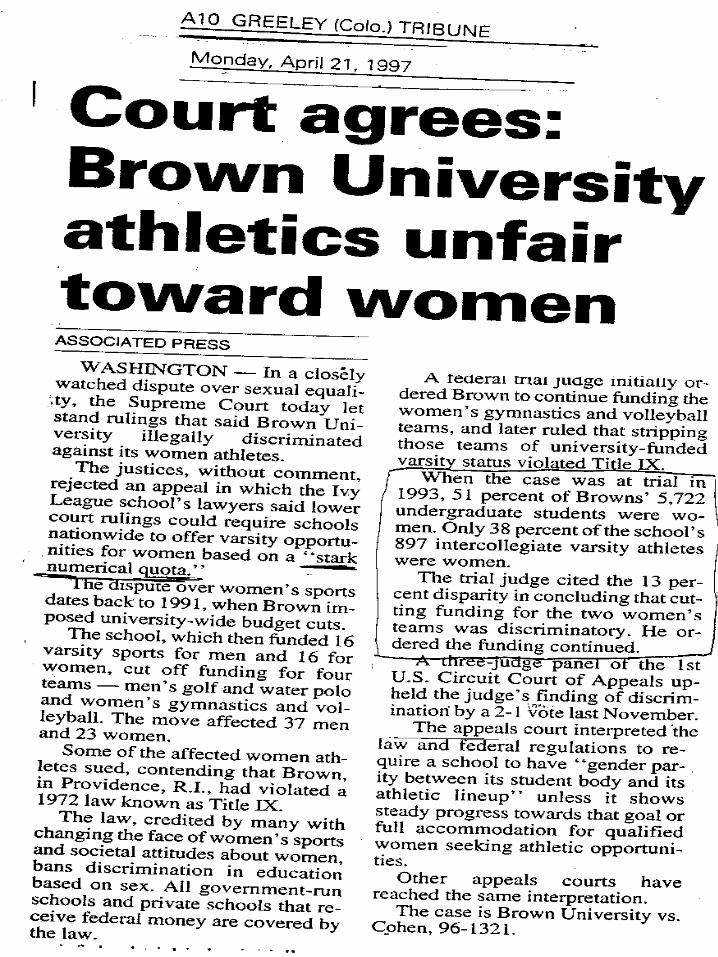
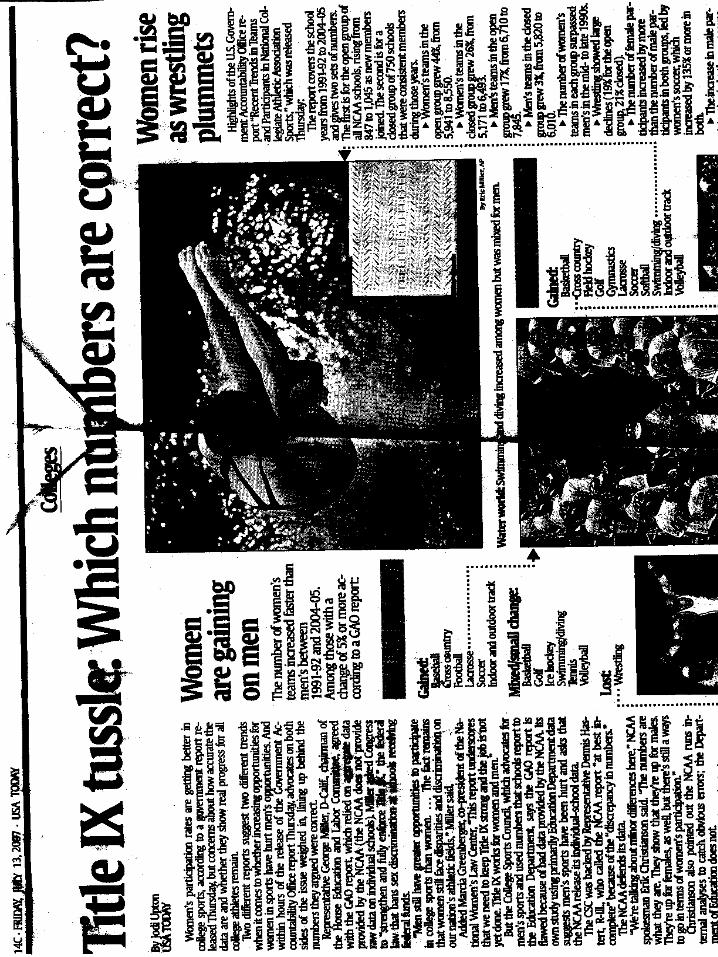
1972 “Title IX” law: federally-funded institutions
can’t discriminate on basis of sex
There must be ‘substantial proportionality’ between participation of women in intercollegiate athletics and their representation in the student body.
In 1997, the Supreme Court
ruled against Brown University:
men women
student body 2796 (49%)
2926 (51%)
athletes 555 (62%)
342 (38%)
.

RESULTS
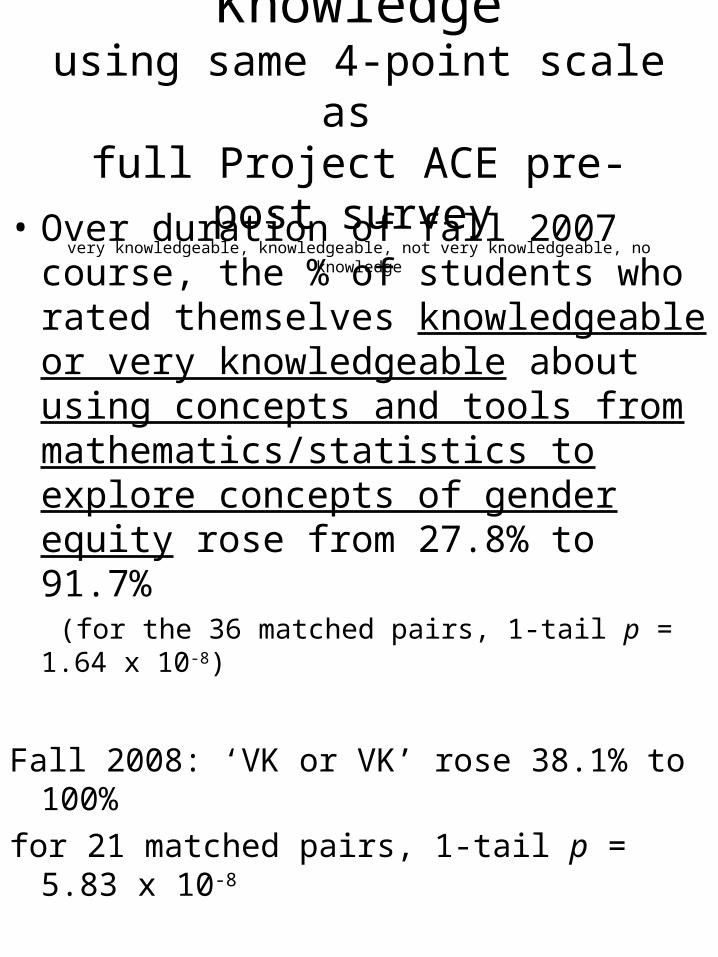
Self-Rated Knowledgeusing same 4-point scale as
full Project ACE pre-post survey very knowledgeable, knowledgeable, not very knowledgeable, no knowledge
• Over duration of fall 2007 course, the % of students who rated themselves knowledgeable or very knowledgeable about using concepts and tools from mathematics/statistics to explore concepts of gender equity rose from 27.8% to 91.7%
(for the 36 matched pairs, 1-tail p = 1.64 x 10⁻⁸)
Fall 2008: ‘VK or VK’ rose 38.1% to 100%
for 21 matched pairs, 1-tail p = 5.83 x 10⁻⁸
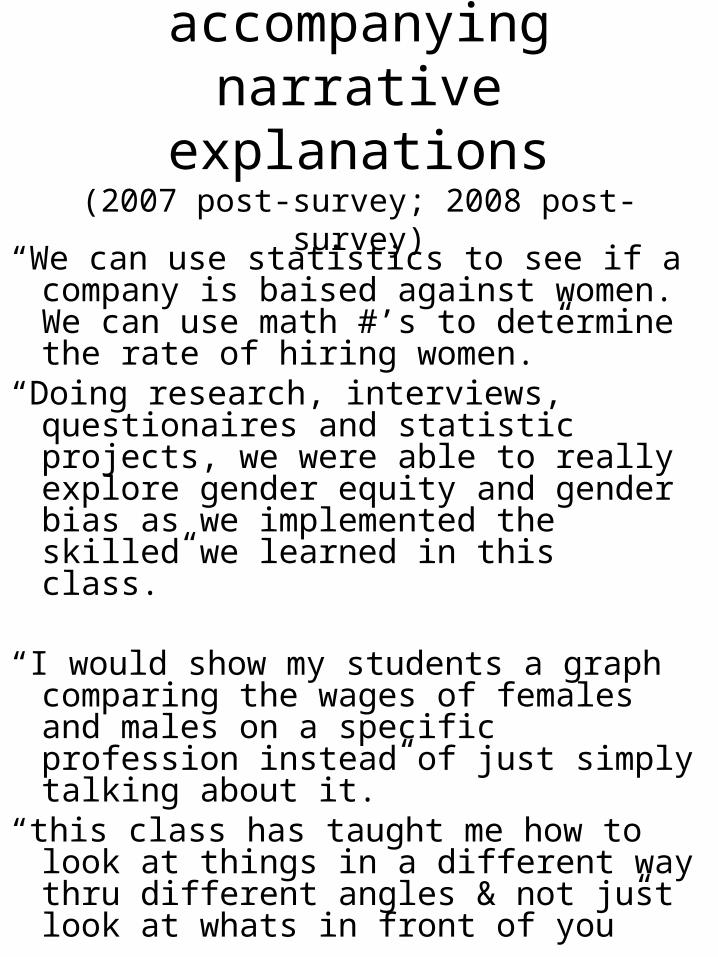
Selected accompanying narrative explanations(2007 post-survey; 2008 post-survey)
“We can use statistics to see if a company is baised against women. We can use math #’s to determine the rate of hiring women.”
“Doing research, interviews, questionaires and statistic projects, we were able to really explore gender equity and gender bias as we implemented the skilled we learned in this class.”
“I would show my students a graph comparing the wages of females and males on a specific profession instead of just simply talking about it.”
“this class has taught me how to look at things in a different way thru different angles & not just look at whats in front of you”
UTEP student evals
• What can we learn from them?
• Do we get hurt by trying something “different”?
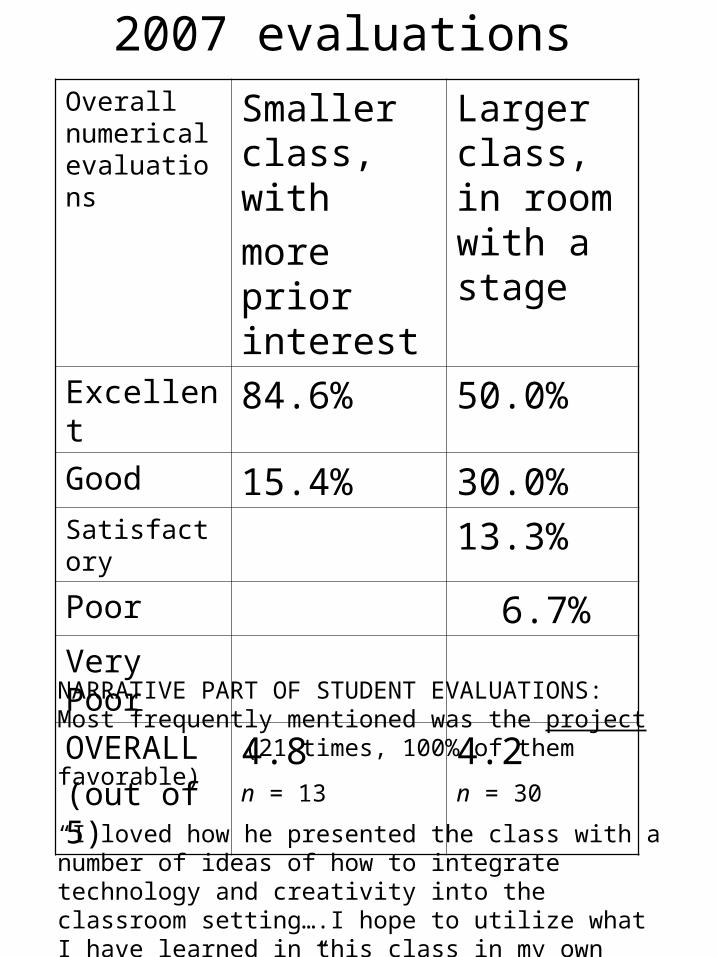
2007 evaluations Overall numerical evaluations
Smaller class, with
more prior interest
Larger class, in room with a stage
Excellent 84.6% 50.0%Good 15.4% 30.0%Satisfactory 13.3%Poor 6.7%Very Poor
OVERALL
(out of 5)4.8 n = 13
4.2 n = 30
NARRATIVE PART OF STUDENT EVALUATIONS:Most frequently mentioned was the project (21 times, 100% of them favorable)
“I loved how he presented the class with a number of ideas of how to integrate technology and creativity into the classroom setting….I hope to utilize what I have learned in this class in my own future classroom.”
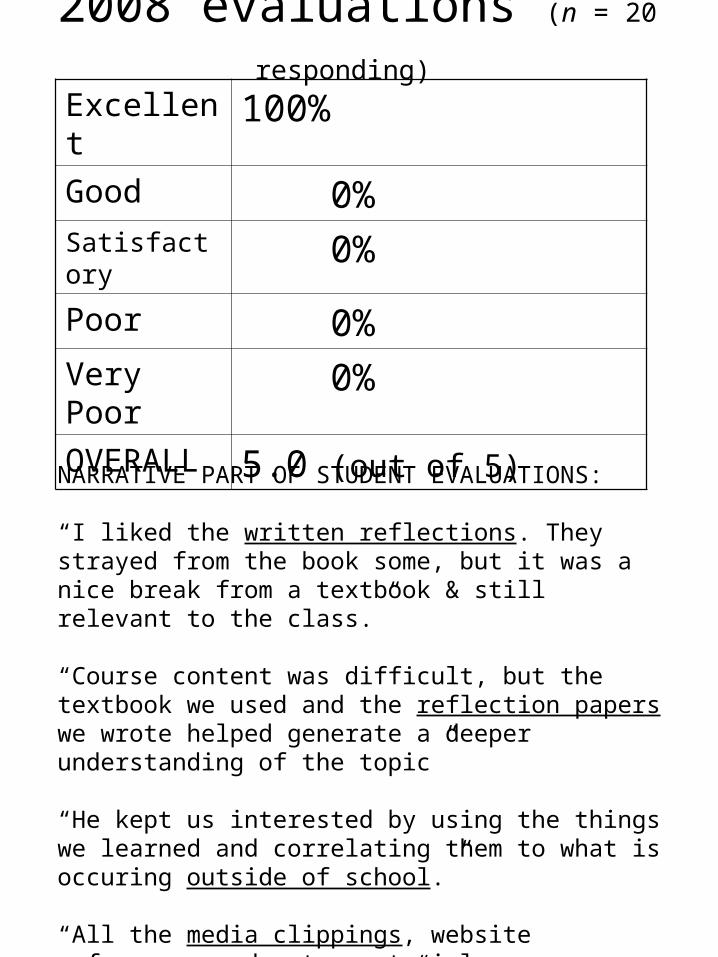
2008 evaluations (n = 20 responding) Excellent 100%Good 0%Satisfactory 0%Poor 0%Very Poor 0%
OVERALL 5.0 (out of 5)
NARRATIVE PART OF STUDENT EVALUATIONS:
“I liked the written reflections. They strayed from the book some, but it was a nice break from a textbook & still relevant to the class.”
“Course content was difficult, but the textbook we used and the reflection papers we wrote helped generate a deeper understanding of the topic”
“He kept us interested by using the things we learned and correlating them to what is occuring outside of school.”
“All the media clippings, website references and extra material was very interesting and helpful.”
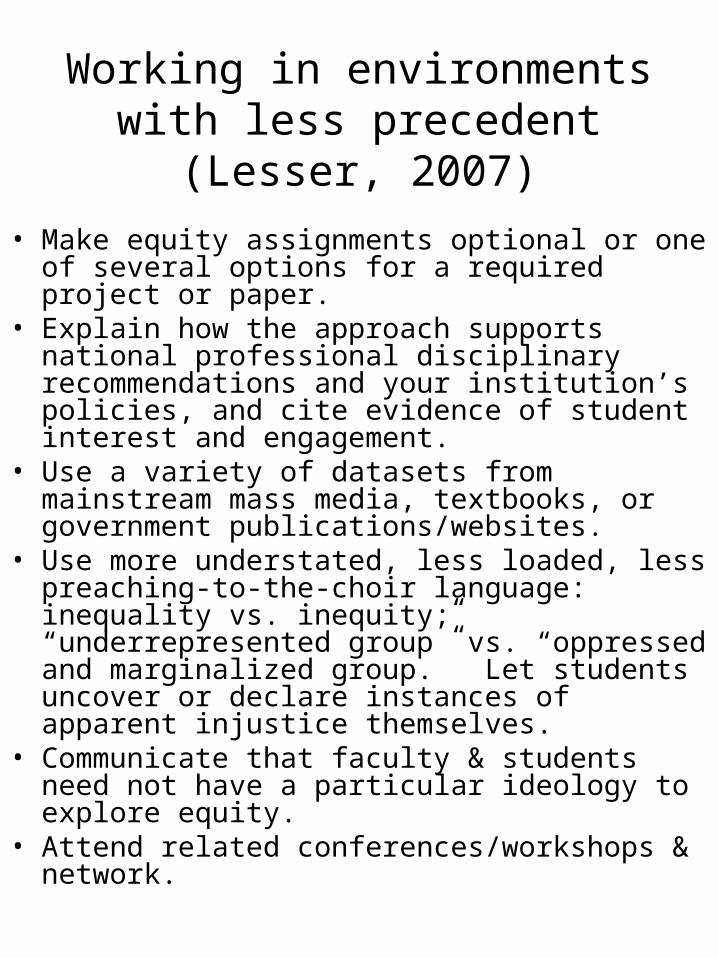
Working in environments with less precedent (Lesser, 2007)
• Make equity assignments optional or one of several options for a required project or paper.
• Explain how the approach supports national professional disciplinary recommendations and your institution’s policies, and cite evidence of student interest and engagement.
• Use a variety of datasets from mainstream mass media, textbooks, or government publications/websites.
• Use more understated, less loaded, less preaching-to-the-choir language: inequality vs. inequity; “underrepresented group” vs. “oppressed and marginalized group.” Let students uncover or declare instances of apparent injustice themselves.
• Communicate that faculty & students need not have a particular ideology to explore equity.
• Attend related conferences/workshops & network.
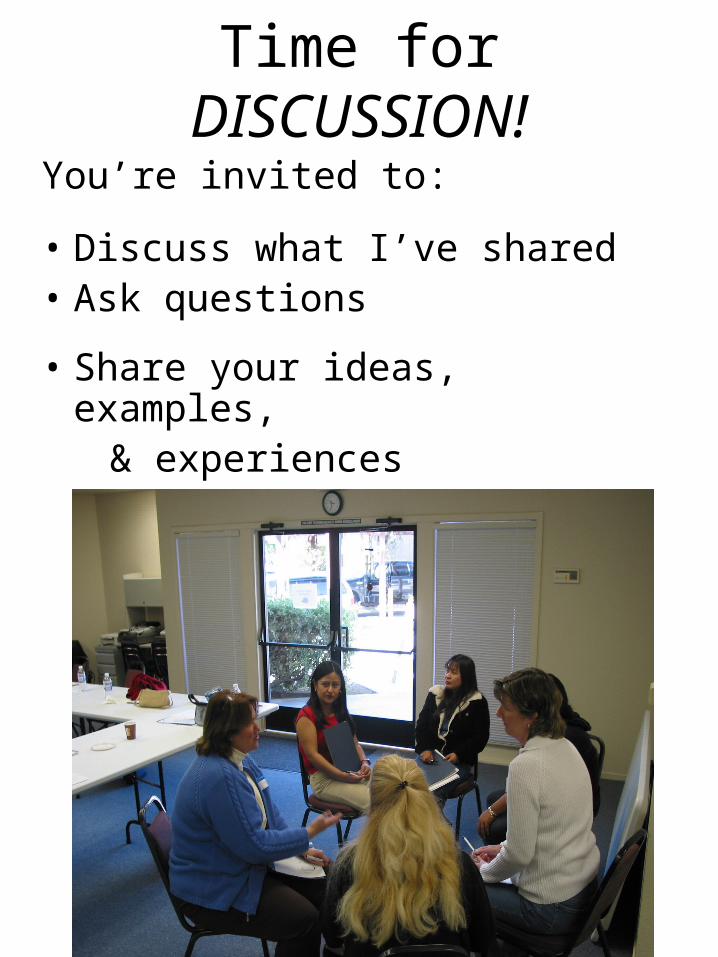
Time for DISCUSSION!
You’re invited to:
• Discuss what I’ve shared• Ask questions
• Share your ideas, examples, & experiences
WORKSHOP
• If many possible assignments, readings, datasets, etc., can be used to meet your course objectives, then can you choose some from equity?
• Are there ways equity can be a vehicle (not add-on) for pieces of course content?
• What connections can you make with the media, calendar, etc.?
• What’s a safe first step to try?• What resources can you adapt?
a song
• http://meetinmontauk.com/2008/10/15/song-of-the-day-87-when-i-was-a-boy-dar-williams/
Dr. Larry LesserUTEP Assoc. Prof., Dept. of Mathematical Sciences
contact info & equity page at:www.math.utep.edu/Faculty/lesser/
main paper published in 2009 at:https://www.amstat.org/membersonly/proceedings/papers/300471.pdf
9/24/09 12-1:30 presentation, Q&A, DIY workshop
“Integrating Gender Equity into Your Course: Lessons Learned from the
Project ACE version of Stat 1380”
Project ACE: ACtion for Equityis a $885,000 Women’s Educational Equity Act grant from the US Dept. of Ed., 2005-10; #U083A050076)
http://eduprojects.utep.edu/projectace/


Pastor Martin Niemöller (1892-1984) about the inactivity of German intellectuals following the Nazi
rise to power and the purging of their chosen targets, group after group.
"First they came for the communists, and I did not speak out-- because I was not a communist;
Then they came for the socialists, and I did not speak out-- because I was not a socialist;
Then they came for the trade unionists, and I did not speak out-- because I was not a trade unionist;
Then they came for the Jews, and I did not speak out-- because I was not a Jew;
Then they came for me-- and there was no one left to speak out for me."
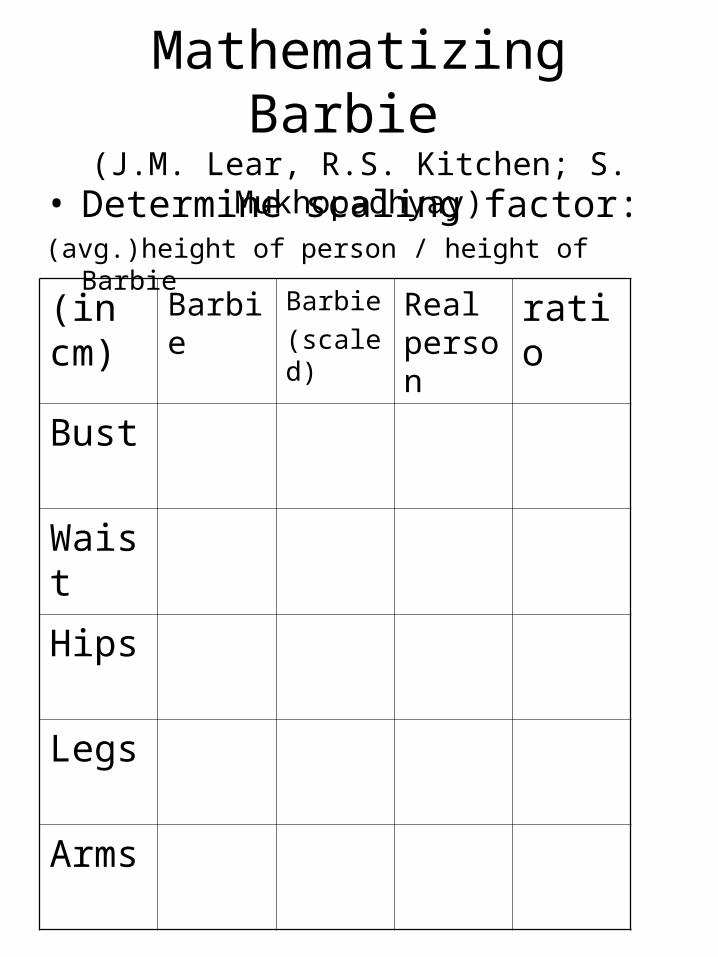
Mathematizing Barbie (J.M. Lear, R.S. Kitchen; S. Mukhopadhyay)
• Determine scaling factor:(avg.)height of person / height of Barbie
(in cm)
Barbie Barbie
(scaled)Real person
ratio
Bust
Waist
Hips
Legs
Arms
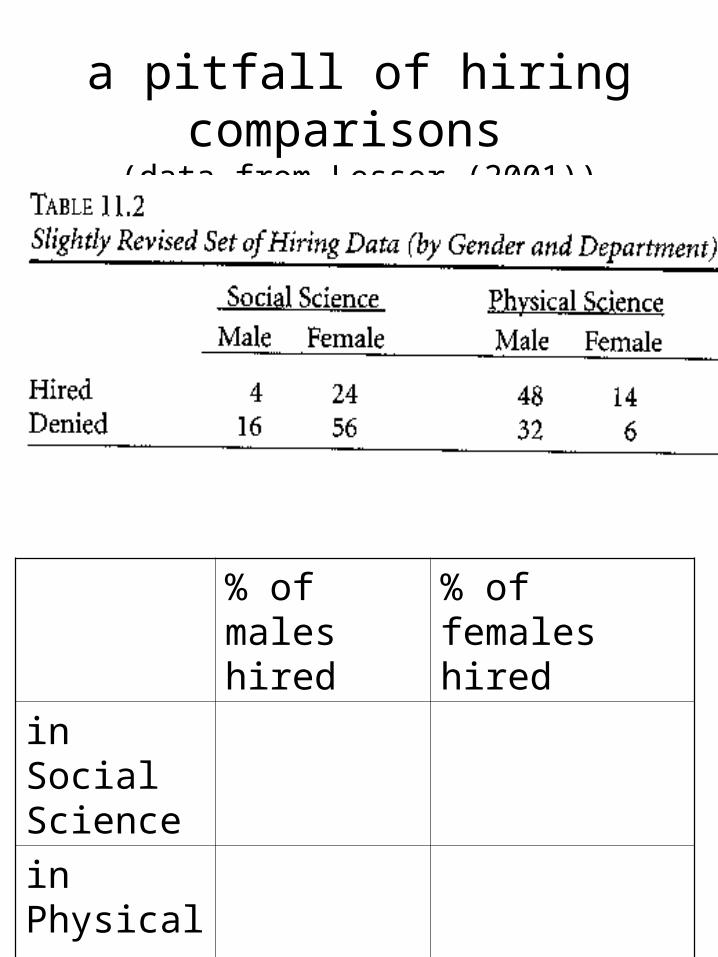
a pitfall of hiring comparisons
(data from Lesser (2001))
% of males hired
% of females hired
in Social Science
in Physical
Science
Overall
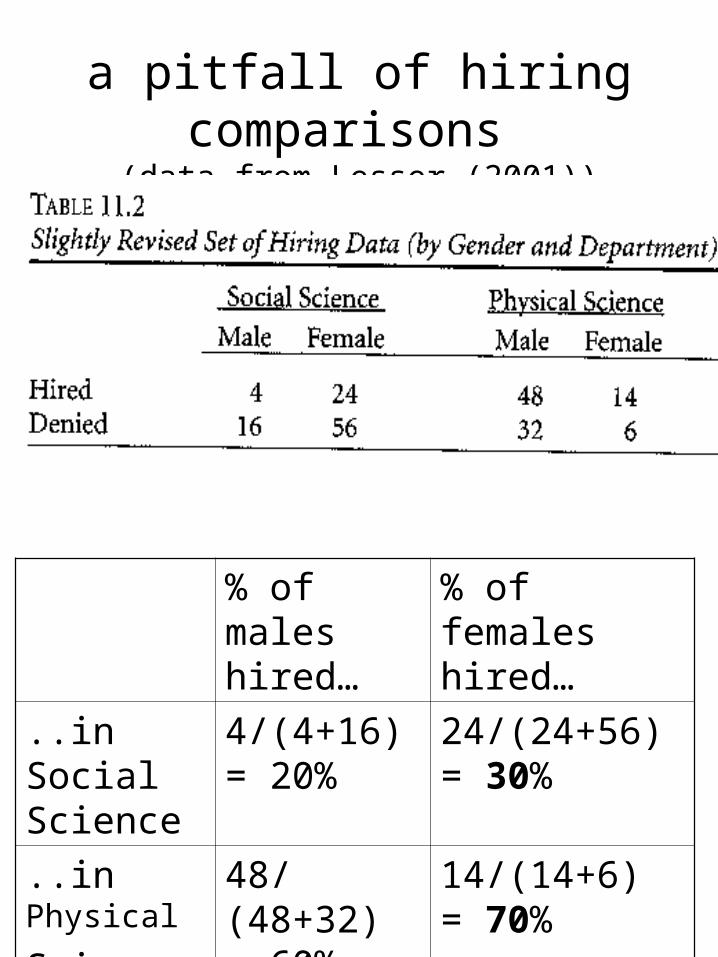
a pitfall of hiring comparisons
(data from Lesser (2001))
% of males hired…
% of females hired…
..in Social Science
4/(4+16) = 20%
24/(24+56) = 30%
..in Physical
Science
48/(48+32) = 60%
14/(14+6) = 70%
…Overall 52% 38%