Embed Size (px)
Citation preview
Dr. Carolyn Bourdeaux
September 30, 2015
Connecticut Fiscal Comparisons
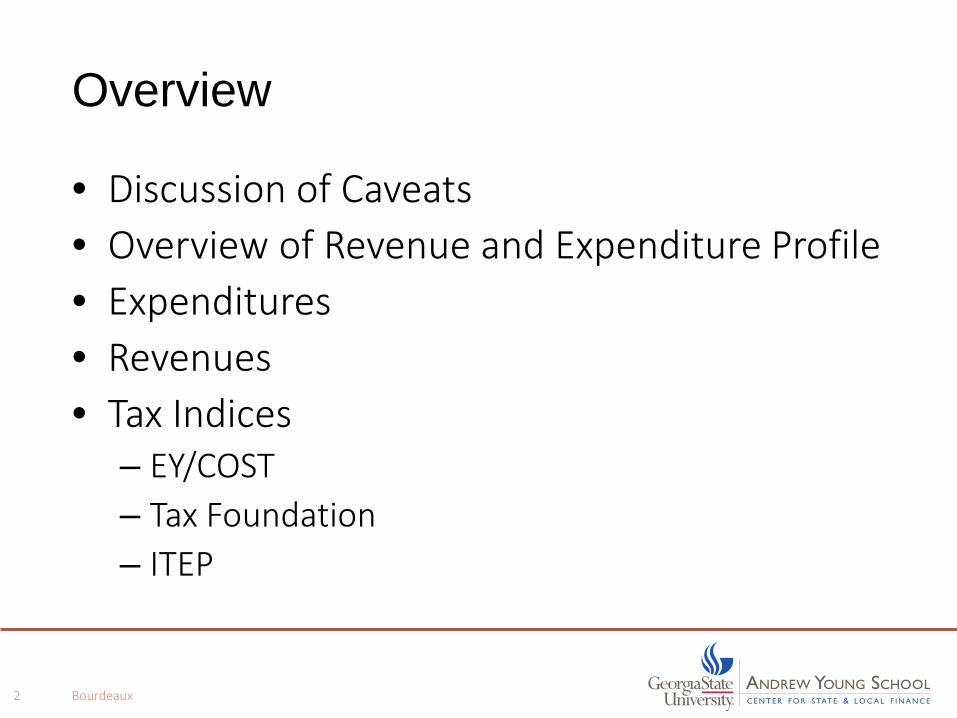
Overview
• Discussion of Caveats • Overview of Revenue and Expenditure Profile • Expenditures • Revenues • Tax Indices
– EY/COST – Tax Foundation – ITEP
Bourdeaux 2
Key Caveats • Analyses typically consider state and local revenues and expenditures
when comparing states. • U.S. Census expenditures and revenues focus on transactions or flow of
funds into and out of government which is not going to include unfunded liabilities such as pension, OPEB, and to some degree debt burden.
• U.S. Census data is only up to date as of 2012, so does not encompass recent major policy changes.
• Governance structures themselves can affect revenues and expenditures; for example, some states have a number of publicly run hospitals which affects both overall expenditures as well as charges that appear as revenues. Other states may simply reimburse private hospitals for the provision of services through Medicaid or other health programs.
• When using U.S. Census data, the analysis provides a very high level view which can indicate areas for further investigation not answers in and of themselves.
Bourdeaux 3
Bourdeaux 4
Sources: U.S. Census Bureau Annual Surveys of State and Local Government Finances and annual population estimates for applicable fiscal years.
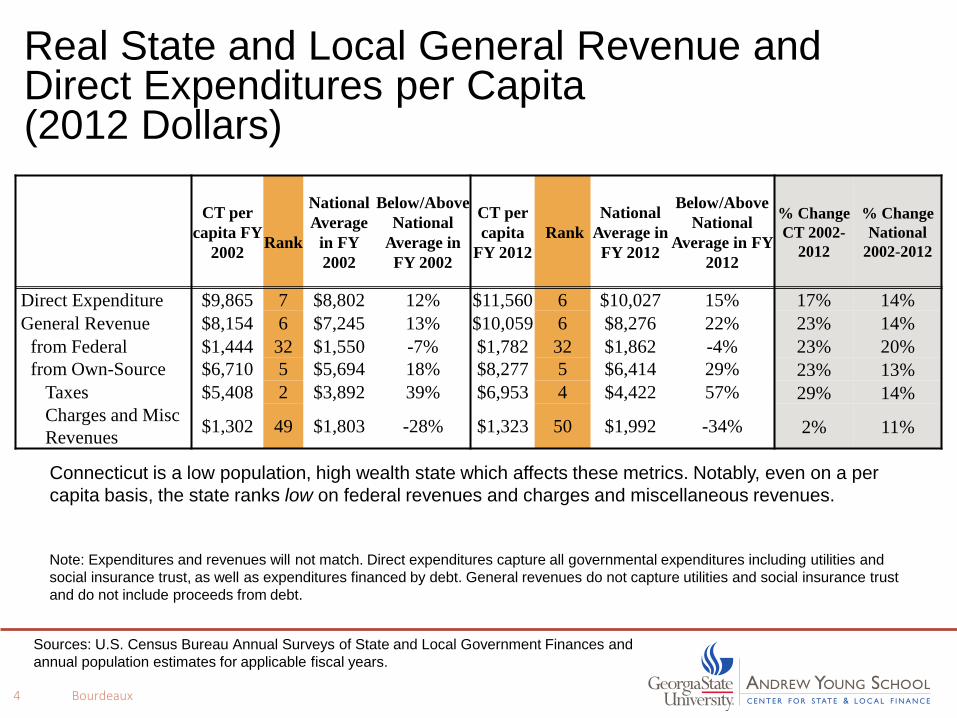
Real State and Local General Revenue and Direct Expenditures per Capita (2012 Dollars)
CT per capita FY
2002
Rank
National Average
in FY 2002
Below/Above National
Average in FY 2002
CT per capita
FY 2012 Rank
National Average in FY 2012
Below/Above National
Average in FY 2012
% Change CT 2002-
2012
% Change National
2002-2012
Direct Expenditure $9,865 7 $8,802 12% $11,560 6 $10,027 15% 17% 14% General Revenue $8,154 6 $7,245 13% $10,059 6 $8,276 22% 23% 14%
from Federal $1,444 32 $1,550 -7% $1,782 32 $1,862 -4% 23% 20% from Own-Source $6,710 5 $5,694 18% $8,277 5 $6,414 29% 23% 13%
Taxes $5,408 2 $3,892 39% $6,953 4 $4,422 57% 29% 14% Charges and Misc Revenues $1,302 49 $1,803 -28% $1,323 50 $1,992 -34% 2% 11%
Connecticut is a low population, high wealth state which affects these metrics. Notably, even on a per capita basis, the state ranks low on federal revenues and charges and miscellaneous revenues.
Note: Expenditures and revenues will not match. Direct expenditures capture all governmental expenditures including utilities and social insurance trust, as well as expenditures financed by debt. General revenues do not capture utilities and social insurance trust and do not include proceeds from debt.
Bourdeaux 5
Sources: U.S. Census Bureau Annual Surveys of State and Local Government Finances and the Bureau of Economic Analysis estimates of personal income.
Connecticut
FY 2002 Rank National
Average in FY 2002
Connecticut FY 2012 Rank
National Average in
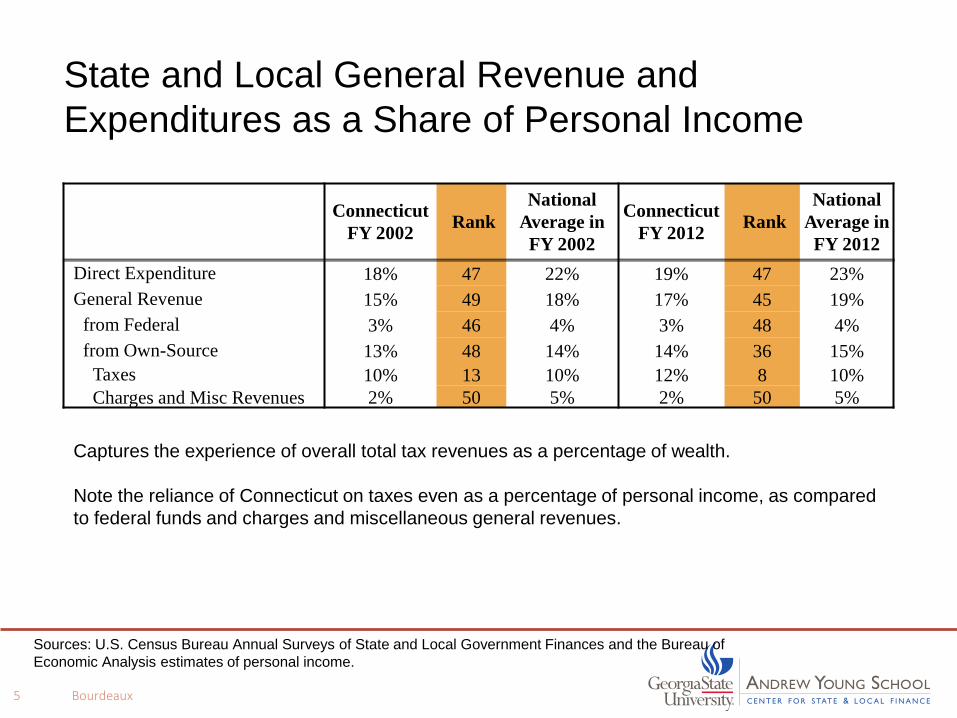
FY 2012 Direct Expenditure 18% 47 22% 19% 47 23% General Revenue 15% 49 18% 17% 45 19%
from Federal 3% 46 4% 3% 48 4% from Own-Source 13% 48 14% 14% 36 15%
Taxes 10% 13 10% 12% 8 10% Charges and Misc Revenues 2% 50 5% 2% 50 5%
State and Local General Revenue and Expenditures as a Share of Personal Income
Captures the experience of overall total tax revenues as a percentage of wealth. Note the reliance of Connecticut on taxes even as a percentage of personal income, as compared to federal funds and charges and miscellaneous general revenues.

Expenditures
Considerations: • What was overall growth in expenditures over time? • How does this compare to other states? • Is health care putting pressure on investment in human and
physical capital?
Bourdeaux 6

Bourdeaux 7
Direct General Expenditure as a Share of Personal Income
Source: U.S. Census Bureau Annual Surveys of State and Local Government Finances and annual Population estimates for applicable fiscal years; personal income is from the Bureau of Economic Analysis
States Expenditures in $m in 2012
2002 2005 2009 2012
% of PI Index % of PI Index % of PI Index % of PI Index
United States $2,587,317 18.9% 100 18.9% 100 20.7% 100 18.6% 100
CONNECTICUT $34,372 16.2% 85.5 15.1% 79.8 16.7% 81.0 15.9% 85.2 Neighboring
Delaware $9,043 19.0% 100.5 21.1% 111.6 22.5% 108.9 22.4% 120.1 Massachusetts $63,393 16.6% 87.8 17.0% 89.8 18.1% 87.8 16.8% 90.2 New Hampshire $10,034 14.1% 74.5 15.4% 81.3 16.2% 78.3 15.2% 81.3 New Jersey $83,030 15.7% 82.9 17.3% 91.6 18.6% 89.8 17.0% 91.4 New York $237,735 23.3% 122.9 23.1% 122.3 24.0% 116.2 22.4% 120.4 Rhode Island $9,292 19.4% 102.5 20.2% 106.8 20.5% 99.2 19.1% 102.5 Vermont $6,237 20.2% 106.9 22.0% 116.3 23.0% 111.5 22.4% 120.2
Southern Florida $134,653 16.8% 88.7 17.5% 92.5 19.9% 96.2 17.0% 91.1 North Carolina $70,264 18.8% 99.0 18.5% 97.6 19.9% 96.5 18.7% 100.3 Virginia $62,781 15.7% 82.8 15.4% 81.4 16.6% 80.6 15.7% 84.4
Resource Rich North Dakota $7,210 22.4% 118.5 21.3% 112.5 20.6% 99.5 18.3% 97.9 Wyoming $7,721 24.6% 129.7 25.1% 132.5 30.8% 148.9 25.5% 136.8
Other Ohio $91,423 19.7% 103.8 20.8% 109.7 21.8% 105.4 19.7% 105.5 Pennsylvania $107,002 18.5% 97.7 19.5% 103.2 19.7% 95.4 18.4% 98.6 Connecticut Rank 46 49 48 48
Bourdeaux 8
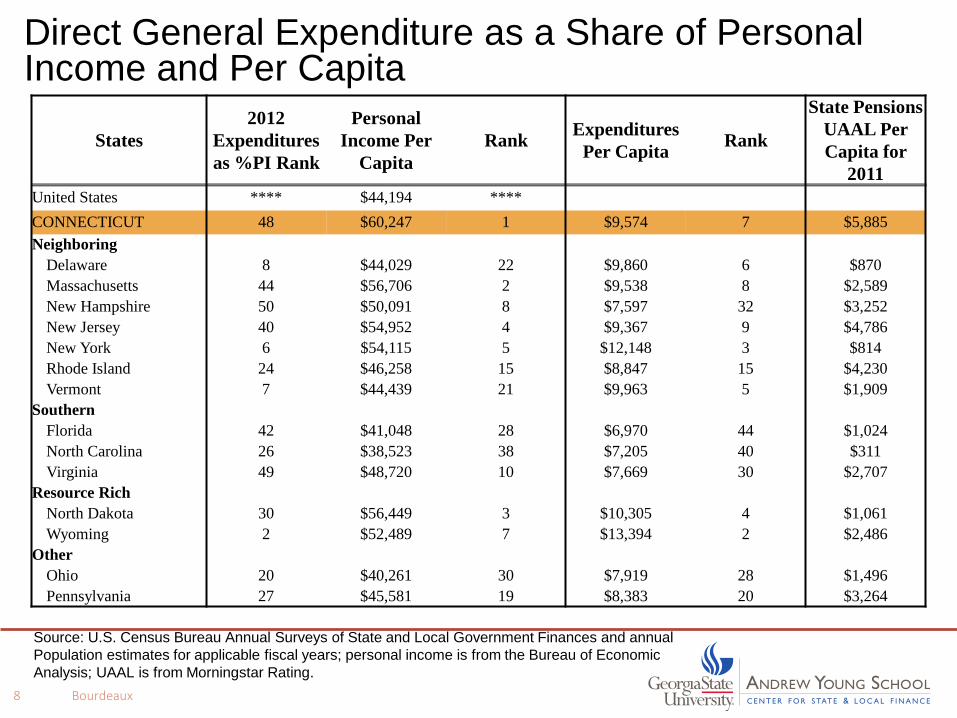
Direct General Expenditure as a Share of Personal Income and Per Capita
States 2012
Expenditures as %PI Rank
Personal Income Per
Capita Rank Expenditures
Per Capita Rank
State Pensions UAAL Per Capita for
2011 United States **** $44,194 **** CONNECTICUT 48 $60,247 1 $9,574 7 $5,885 Neighboring
Delaware 8 $44,029 22 $9,860 6 $870 Massachusetts 44 $56,706 2 $9,538 8 $2,589 New Hampshire 50 $50,091 8 $7,597 32 $3,252 New Jersey 40 $54,952 4 $9,367 9 $4,786 New York 6 $54,115 5 $12,148 3 $814 Rhode Island 24 $46,258 15 $8,847 15 $4,230 Vermont 7 $44,439 21 $9,963 5 $1,909
Southern Florida 42 $41,048 28 $6,970 44 $1,024 North Carolina 26 $38,523 38 $7,205 40 $311 Virginia 49 $48,720 10 $7,669 30 $2,707
Resource Rich North Dakota 30 $56,449 3 $10,305 4 $1,061 Wyoming 2 $52,489 7 $13,394 2 $2,486
Other Ohio 20 $40,261 30 $7,919 28 $1,496 Pennsylvania 27 $45,581 19 $8,383 20 $3,264
Source: U.S. Census Bureau Annual Surveys of State and Local Government Finances and annual Population estimates for applicable fiscal years; personal income is from the Bureau of Economic Analysis; UAAL is from Morningstar Rating.
Bourdeaux 9
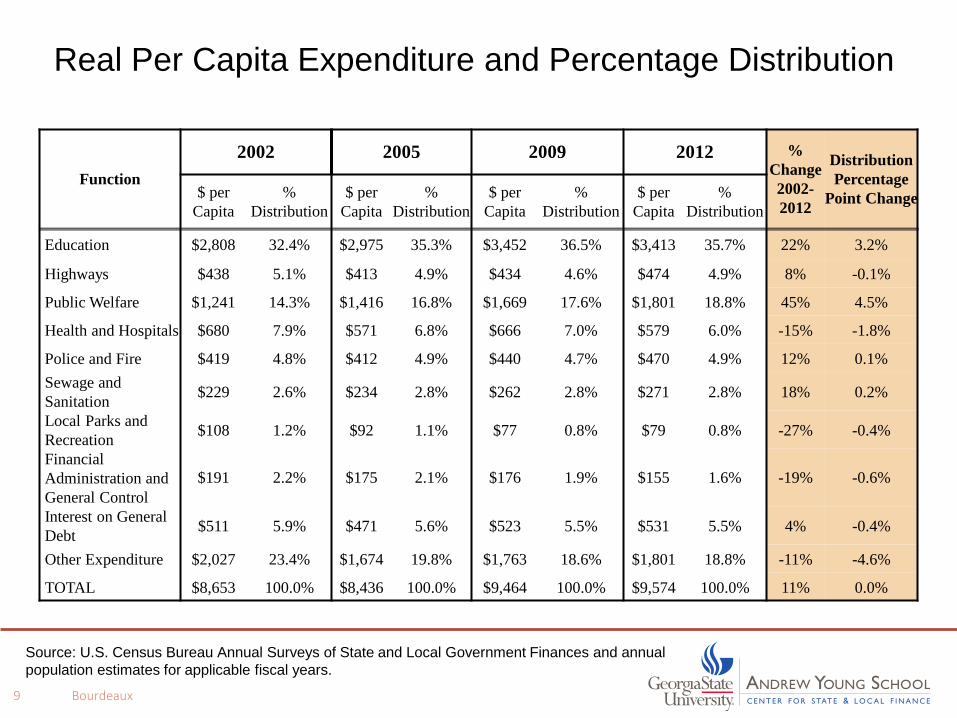
Real Per Capita Expenditure and Percentage Distribution
Function
2002 2005 2009 2012 % Change 2002-2012
Distribution Percentage
Point Change $ per Capita
% Distribution
$ per Capita
% Distribution
$ per Capita
% Distribution
$ per Capita
% Distribution
Education $2,808 32.4% $2,975 35.3% $3,452 36.5% $3,413 35.7% 22% 3.2%
Highways $438 5.1% $413 4.9% $434 4.6% $474 4.9% 8% -0.1%
Public Welfare $1,241 14.3% $1,416 16.8% $1,669 17.6% $1,801 18.8% 45% 4.5%
Health and Hospitals $680 7.9% $571 6.8% $666 7.0% $579 6.0% -15% -1.8%
Police and Fire $419 4.8% $412 4.9% $440 4.7% $470 4.9% 12% 0.1% Sewage and Sanitation $229 2.6% $234 2.8% $262 2.8% $271 2.8% 18% 0.2%
Local Parks and Recreation $108 1.2% $92 1.1% $77 0.8% $79 0.8% -27% -0.4%
Financial Administration and General Control
$191 2.2% $175 2.1% $176 1.9% $155 1.6% -19% -0.6%
Interest on General Debt $511 5.9% $471 5.6% $523 5.5% $531 5.5% 4% -0.4%
Other Expenditure $2,027 23.4% $1,674 19.8% $1,763 18.6% $1,801 18.8% -11% -4.6%
TOTAL $8,653 100.0% $8,436 100.0% $9,464 100.0% $9,574 100.0% 11% 0.0%
Source: U.S. Census Bureau Annual Surveys of State and Local Government Finances and annual population estimates for applicable fiscal years.
Bourdeaux 10
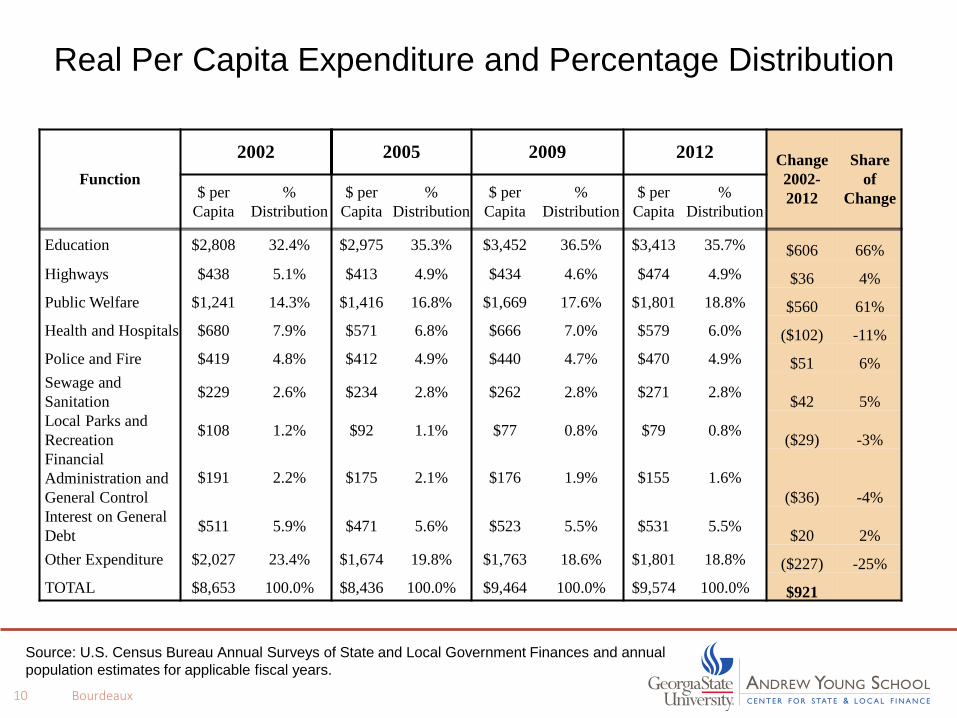
Real Per Capita Expenditure and Percentage Distribution
Function
2002 2005 2009 2012 Change 2002-2012
Share of
Change $ per Capita
% Distribution
$ per Capita
% Distribution
$ per Capita
% Distribution
$ per Capita
% Distribution
Education $2,808 32.4% $2,975 35.3% $3,452 36.5% $3,413 35.7% $606 66% Highways $438 5.1% $413 4.9% $434 4.6% $474 4.9% $36 4% Public Welfare $1,241 14.3% $1,416 16.8% $1,669 17.6% $1,801 18.8% $560 61% Health and Hospitals $680 7.9% $571 6.8% $666 7.0% $579 6.0% ($102) -11% Police and Fire $419 4.8% $412 4.9% $440 4.7% $470 4.9% $51 6% Sewage and Sanitation $229 2.6% $234 2.8% $262 2.8% $271 2.8% $42 5% Local Parks and Recreation $108 1.2% $92 1.1% $77 0.8% $79 0.8% ($29) -3% Financial Administration and General Control
$191 2.2% $175 2.1% $176 1.9% $155 1.6% ($36) -4%
Interest on General Debt $511 5.9% $471 5.6% $523 5.5% $531 5.5% $20 2% Other Expenditure $2,027 23.4% $1,674 19.8% $1,763 18.6% $1,801 18.8% ($227) -25% TOTAL $8,653 100.0% $8,436 100.0% $9,464 100.0% $9,574 100.0% $921
Source: U.S. Census Bureau Annual Surveys of State and Local Government Finances and annual population estimates for applicable fiscal years.
Bourdeaux 11
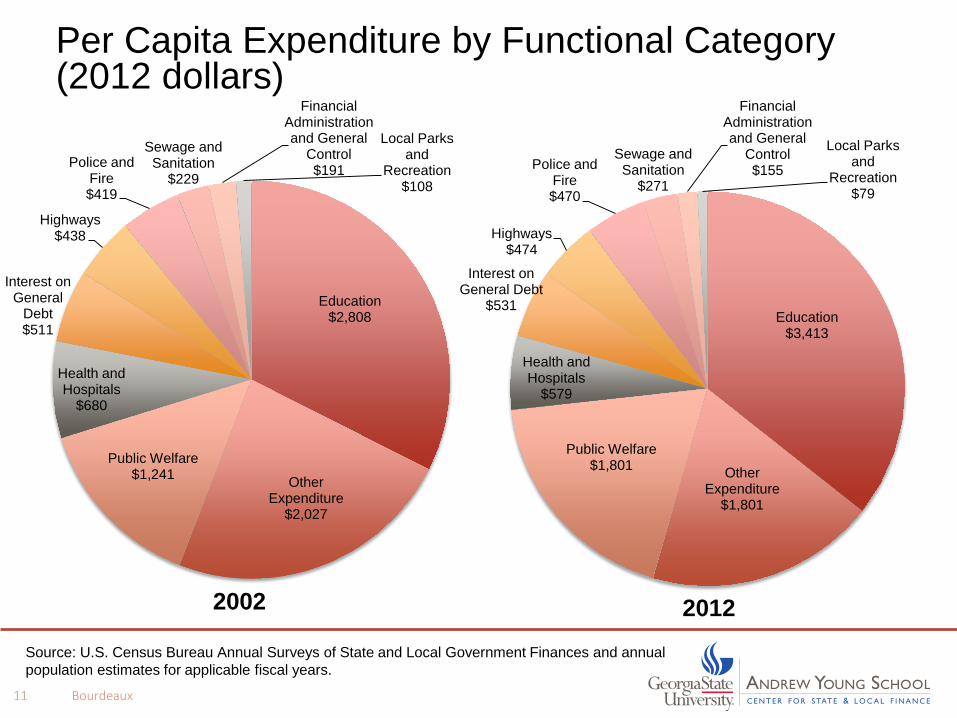
Per Capita Expenditure by Functional Category (2012 dollars)
Education $2,808
Other Expenditure
$2,027
Public Welfare $1,241
Health and Hospitals
$680
Interest on General
Debt $511
Highways $438
Police and Fire $419
Sewage and Sanitation
$229
Financial Administration and General
Control $191
Local Parks and
Recreation $108
2002
Education $3,413
Other Expenditure
$1,801
Public Welfare $1,801
Health and Hospitals
$579
Interest on General Debt
$531
Highways $474
Police and Fire $470
Sewage and Sanitation
$271
Financial Administration and General
Control $155
Local Parks and
Recreation $79
2012 Source: U.S. Census Bureau Annual Surveys of State and Local Government Finances and annual population estimates for applicable fiscal years.

Bourdeaux 12
Connecticut Real Per Capita Public Welfare Expenditures (2012 Dollars)
Source: U.S. Census Bureau Annual Surveys of State and Local Government Finances and annual population estimates for applicable fiscal years.
2002 2012
Expenditure Type
Expendi-tures per Capita
Rank Share Expendi-tures per Capita
Rank Share
% Change 2002-2012
Change 2002-2012
Share of Change
Public welfare $1,241 20 **** $1,801 11 **** 45% $560 ****
Cash assistance payments $115 10 9% $58 21 3% -50% ($58) -10%
Vendor payments $924 17 74% $1,447 14 80% 57% $523 93%
Other public welfare $202 37 16% $297 14 16% 47% $95 17%
Bourdeaux 13
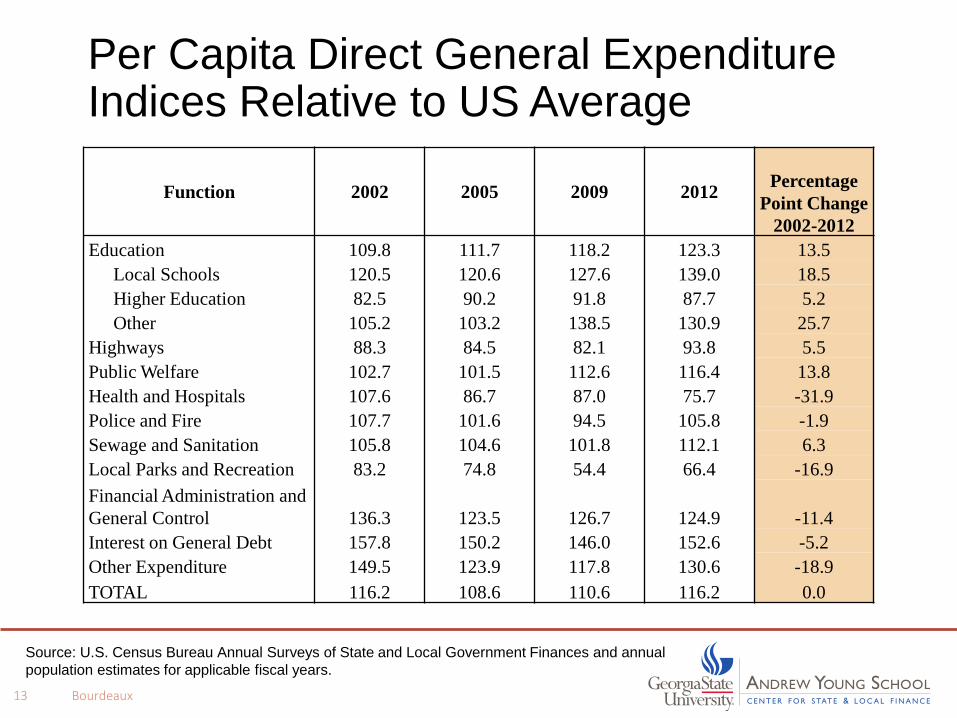
Per Capita Direct General Expenditure Indices Relative to US Average
Source: U.S. Census Bureau Annual Surveys of State and Local Government Finances and annual population estimates for applicable fiscal years.
Function 2002 2005 2009 2012 Percentage Point Change
2002-2012 Education 109.8 111.7 118.2 123.3 13.5
Local Schools 120.5 120.6 127.6 139.0 18.5 Higher Education 82.5 90.2 91.8 87.7 5.2 Other 105.2 103.2 138.5 130.9 25.7
Highways 88.3 84.5 82.1 93.8 5.5 Public Welfare 102.7 101.5 112.6 116.4 13.8 Health and Hospitals 107.6 86.7 87.0 75.7 -31.9 Police and Fire 107.7 101.6 94.5 105.8 -1.9 Sewage and Sanitation 105.8 104.6 101.8 112.1 6.3 Local Parks and Recreation 83.2 74.8 54.4 66.4 -16.9 Financial Administration and General Control 136.3 123.5 126.7 124.9 -11.4 Interest on General Debt 157.8 150.2 146.0 152.6 -5.2 Other Expenditure 149.5 123.9 117.8 130.6 -18.9 TOTAL 116.2 108.6 110.6 116.2 0.0
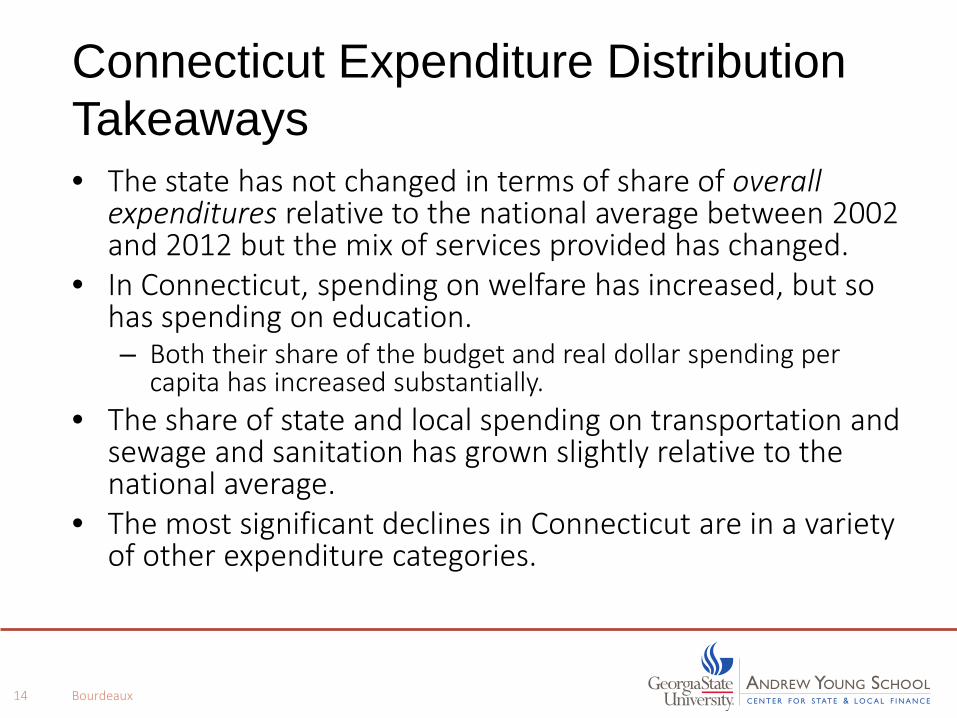
Connecticut Expenditure Distribution Takeaways • The state has not changed in terms of share of overall
expenditures relative to the national average between 2002 and 2012 but the mix of services provided has changed.
• In Connecticut, spending on welfare has increased, but so has spending on education. – Both their share of the budget and real dollar spending per
capita has increased substantially. • The share of state and local spending on transportation and
sewage and sanitation has grown slightly relative to the national average.
• The most significant declines in Connecticut are in a variety of other expenditure categories.
Bourdeaux 14
Revenues
Considerations: • What was overall growth in revenues over time? • How does this compare to other states? • Is the state more or less reliant on a particular revenue source as
compared to the national average and comparisons states?
Bourdeaux 15
Bourdeaux 16
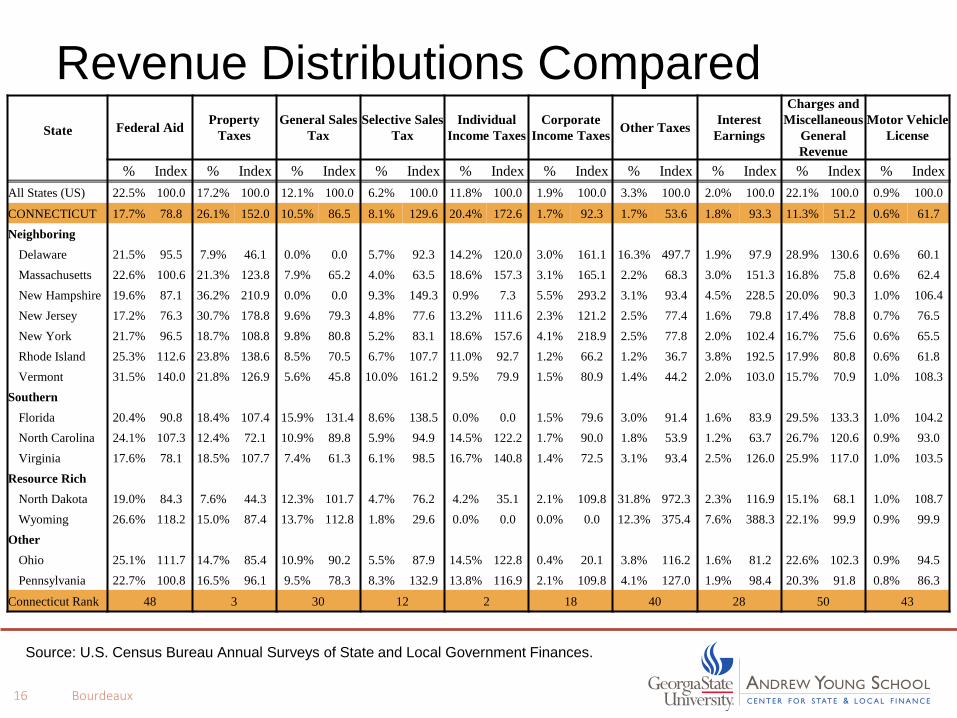
Revenue Distributions Compared State
Federal Aid Property
Taxes General Sales
Tax Selective Sales
Tax Individual
Income Taxes Corporate
Income Taxes Other Taxes Interest Earnings
Charges and Miscellaneous
General Revenue
Motor Vehicle License
% Index % Index % Index % Index % Index % Index % Index % Index % Index % Index All States (US) 22.5% 100.0 17.2% 100.0 12.1% 100.0 6.2% 100.0 11.8% 100.0 1.9% 100.0 3.3% 100.0 2.0% 100.0 22.1% 100.0 0.9% 100.0
CONNECTICUT 17.7% 78.8 26.1% 152.0 10.5% 86.5 8.1% 129.6 20.4% 172.6 1.7% 92.3 1.7% 53.6 1.8% 93.3 11.3% 51.2 0.6% 61.7 Neighboring
Delaware 21.5% 95.5 7.9% 46.1 0.0% 0.0 5.7% 92.3 14.2% 120.0 3.0% 161.1 16.3% 497.7 1.9% 97.9 28.9% 130.6 0.6% 60.1 Massachusetts 22.6% 100.6 21.3% 123.8 7.9% 65.2 4.0% 63.5 18.6% 157.3 3.1% 165.1 2.2% 68.3 3.0% 151.3 16.8% 75.8 0.6% 62.4 New Hampshire 19.6% 87.1 36.2% 210.9 0.0% 0.0 9.3% 149.3 0.9% 7.3 5.5% 293.2 3.1% 93.4 4.5% 228.5 20.0% 90.3 1.0% 106.4 New Jersey 17.2% 76.3 30.7% 178.8 9.6% 79.3 4.8% 77.6 13.2% 111.6 2.3% 121.2 2.5% 77.4 1.6% 79.8 17.4% 78.8 0.7% 76.5 New York 21.7% 96.5 18.7% 108.8 9.8% 80.8 5.2% 83.1 18.6% 157.6 4.1% 218.9 2.5% 77.8 2.0% 102.4 16.7% 75.6 0.6% 65.5 Rhode Island 25.3% 112.6 23.8% 138.6 8.5% 70.5 6.7% 107.7 11.0% 92.7 1.2% 66.2 1.2% 36.7 3.8% 192.5 17.9% 80.8 0.6% 61.8 Vermont 31.5% 140.0 21.8% 126.9 5.6% 45.8 10.0% 161.2 9.5% 79.9 1.5% 80.9 1.4% 44.2 2.0% 103.0 15.7% 70.9 1.0% 108.3
Southern Florida 20.4% 90.8 18.4% 107.4 15.9% 131.4 8.6% 138.5 0.0% 0.0 1.5% 79.6 3.0% 91.4 1.6% 83.9 29.5% 133.3 1.0% 104.2 North Carolina 24.1% 107.3 12.4% 72.1 10.9% 89.8 5.9% 94.9 14.5% 122.2 1.7% 90.0 1.8% 53.9 1.2% 63.7 26.7% 120.6 0.9% 93.0 Virginia 17.6% 78.1 18.5% 107.7 7.4% 61.3 6.1% 98.5 16.7% 140.8 1.4% 72.5 3.1% 93.4 2.5% 126.0 25.9% 117.0 1.0% 103.5
Resource Rich North Dakota 19.0% 84.3 7.6% 44.3 12.3% 101.7 4.7% 76.2 4.2% 35.1 2.1% 109.8 31.8% 972.3 2.3% 116.9 15.1% 68.1 1.0% 108.7 Wyoming 26.6% 118.2 15.0% 87.4 13.7% 112.8 1.8% 29.6 0.0% 0.0 0.0% 0.0 12.3% 375.4 7.6% 388.3 22.1% 99.9 0.9% 99.9
Other Ohio 25.1% 111.7 14.7% 85.4 10.9% 90.2 5.5% 87.9 14.5% 122.8 0.4% 20.1 3.8% 116.2 1.6% 81.2 22.6% 102.3 0.9% 94.5 Pennsylvania 22.7% 100.8 16.5% 96.1 9.5% 78.3 8.3% 132.9 13.8% 116.9 2.1% 109.8 4.1% 127.0 1.9% 98.4 20.3% 91.8 0.8% 86.3
Connecticut Rank 48 3 30 12 2 18 40 28 50 43
Source: U.S. Census Bureau Annual Surveys of State and Local Government Finances.

Connecticut Revenue Shares Compared to National Average
Bourdeaux 17
Property Taxes 26%
Individual Income Taxes
20% Charges and Miscellaneou
s General Revenue
11%
Federal Aid 18%
General Sales Tax
11%
All Other 14%
CONNECTICUT
Property Taxes 17%
Individual Income Taxes
12%
Charges and Miscellaneou
s General Revenue
22%
Federal Aid 23%
General Sales Tax 12%
All Other 14%
UNITED STATES AVERAGE
Bourdeaux 18
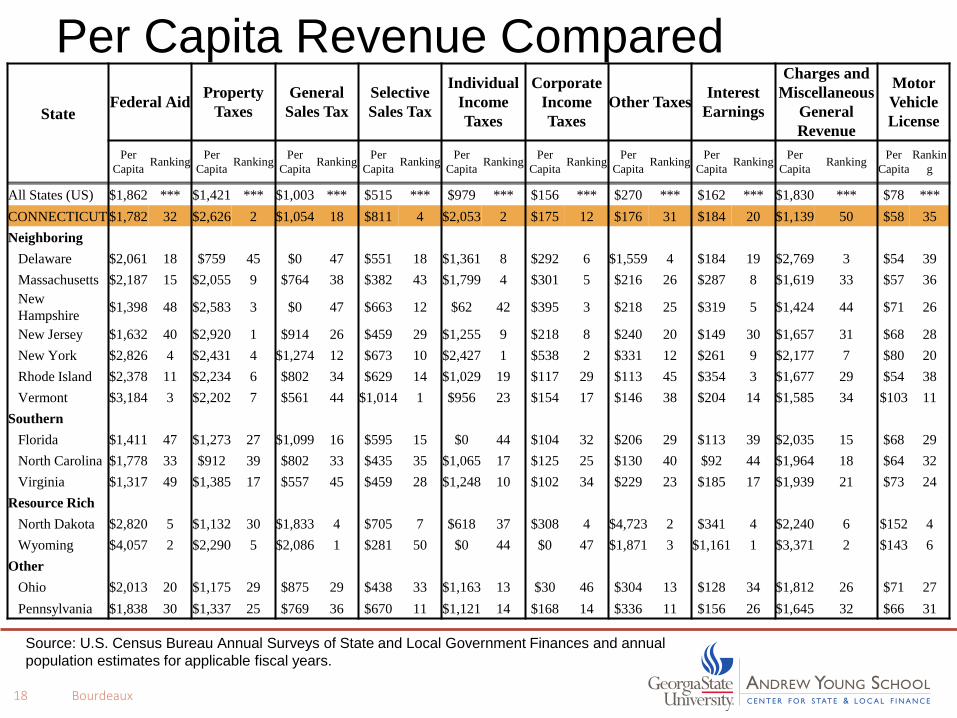
Per Capita Revenue Compared State
Federal Aid Property Taxes
General Sales Tax
Selective Sales Tax
Individual Income Taxes
Corporate Income Taxes
Other Taxes Interest Earnings
Charges and Miscellaneous
General Revenue
Motor Vehicle License
Per Capita Ranking Per
Capita Ranking Per Capita Ranking Per
Capita Ranking Per Capita Ranking Per
Capita Ranking Per Capita Ranking Per
Capita Ranking Per Capita Ranking Per
Capita Rankin
g
All States (US) $1,862 *** $1,421 *** $1,003 *** $515 *** $979 *** $156 *** $270 *** $162 *** $1,830 *** $78 *** CONNECTICUT $1,782 32 $2,626 2 $1,054 18 $811 4 $2,053 2 $175 12 $176 31 $184 20 $1,139 50 $58 35 Neighboring
Delaware $2,061 18 $759 45 $0 47 $551 18 $1,361 8 $292 6 $1,559 4 $184 19 $2,769 3 $54 39 Massachusetts $2,187 15 $2,055 9 $764 38 $382 43 $1,799 4 $301 5 $216 26 $287 8 $1,619 33 $57 36 New Hampshire $1,398 48 $2,583 3 $0 47 $663 12 $62 42 $395 3 $218 25 $319 5 $1,424 44 $71 26
New Jersey $1,632 40 $2,920 1 $914 26 $459 29 $1,255 9 $218 8 $240 20 $149 30 $1,657 31 $68 28 New York $2,826 4 $2,431 4 $1,274 12 $673 10 $2,427 1 $538 2 $331 12 $261 9 $2,177 7 $80 20 Rhode Island $2,378 11 $2,234 6 $802 34 $629 14 $1,029 19 $117 29 $113 45 $354 3 $1,677 29 $54 38 Vermont $3,184 3 $2,202 7 $561 44 $1,014 1 $956 23 $154 17 $146 38 $204 14 $1,585 34 $103 11
Southern Florida $1,411 47 $1,273 27 $1,099 16 $595 15 $0 44 $104 32 $206 29 $113 39 $2,035 15 $68 29 North Carolina $1,778 33 $912 39 $802 33 $435 35 $1,065 17 $125 25 $130 40 $92 44 $1,964 18 $64 32 Virginia $1,317 49 $1,385 17 $557 45 $459 28 $1,248 10 $102 34 $229 23 $185 17 $1,939 21 $73 24
Resource Rich North Dakota $2,820 5 $1,132 30 $1,833 4 $705 7 $618 37 $308 4 $4,723 2 $341 4 $2,240 6 $152 4 Wyoming $4,057 2 $2,290 5 $2,086 1 $281 50 $0 44 $0 47 $1,871 3 $1,161 1 $3,371 2 $143 6
Other Ohio $2,013 20 $1,175 29 $875 29 $438 33 $1,163 13 $30 46 $304 13 $128 34 $1,812 26 $71 27 Pennsylvania $1,838 30 $1,337 25 $769 36 $670 11 $1,121 14 $168 14 $336 11 $156 26 $1,645 32 $66 31
Source: U.S. Census Bureau Annual Surveys of State and Local Government Finances and annual population estimates for applicable fiscal years.

Bourdeaux 19
Charges: Per Capita Revenues and Distribution
United States Share US Per
Capita Connecticut Share
CT Per
Capita Rank
Above/Below National Average
Current charges $426,127,960 *** $1,357 $2,931,703 *** $817 50 Institutions of higher education $99,135,188 23% $316 $1,125,942 38% $314 32 -1%
School lunch sales (gross) $6,308,120 1% $20 $117,724 4% $33 6 63%
Hospitals $123,389,520 29% $393 $315,758 11% $88 43 -78%
Highways $13,285,811 3% $42 $1,883 0% $1 49 -99%
Sewerage $47,013,334 11% $150 $377,451 13% $105 38 -30% Solid waste management $16,584,206 4% $53 $242,735 8% $68 13 28%
Other charges $120,411,781 28% $384 $750,210 26% $209 N/A -46%
Source: U.S. Census Bureau Annual Surveys of State and Local Government Finances and annual population estimate.
Revenue Distribution Compared • Connecticut is heavily dependent on property and personal
income taxes. – Neighboring states also tend to collect high property tax
revenues per capita (and are generally somewhat dependent on property taxes).
– Neighboring states are more varied in their income tax revenue collections per capita and dependence on the income tax.
• Connecticut in the bottom tier of states in terms of dependence on federal funds and is last in its collections of current charges and miscellaneous general revenues per capital. – Neighboring states vary in terms of federal funds and charges
and miscellaneous revenues collected per capita as well as their relative dependencef these sources of funds.
Bourdeaux 20

Tax Indices
Bourdeaux 21
How does CT rank on different popular tax indices and why?
Caveats and Considerations • With all tax indices, some common issues:
– Some states export tax impact more than other states (e.g., severance taxes, sales taxes in high tourism areas) and this is not captured in the indices
– Measures can be fairly rough in terms of allocation to business, particularly the expenditures (e.g., police and fire are split 50-50 between business and individuals)
– Most measures do not capture user fees or other types of non-tax revenues
– To date, not much success in using indices in empirical research to predict economic growth/decline
Bourdeaux 22
Ernst & Young/Council on State Taxation (EY/COST) FY2013 • Measures all business tax revenues collected through
the property tax, sales and excise taxes, individual and corporate income taxes, unemployment insurance, business and corporate license, public utility taxes, insurance premium taxes and a variety of other taxes
• Total Effective Business Tax Rate (TEBTR) is all of these revenues divided by private sector Gross State Product
• Also measures business benefit to tax ratio: or governmental benefits relative to business tax revenues paid.
• NOTE: Measures tax impact based on legal liability which is necessarily actual tax incidence
Bourdeaux 23

Connecticut’s Rank • Overall Connecticut ranks 49th (incl. DC) on the EY/COST
TEBTR, which is total tax revenues collected from businesses as a percent of private sector GSP. • Oregon and North Carolina are below Connecticut
• Private sector GSP is a wealth measure like personal income and the state benefits from this but also the state is 51st in terms of business taxes as a share of total tax revenues collected. – State government is 49th – Local government is 51st
• Connecticut also in top ten in terms of taxes per dollar of benefit – With 50% of education expenses allocated as benefit to business,
businesses get $1 of benefit for every $0.80 spent in taxes
Bourdeaux 24
Bourdeaux 25
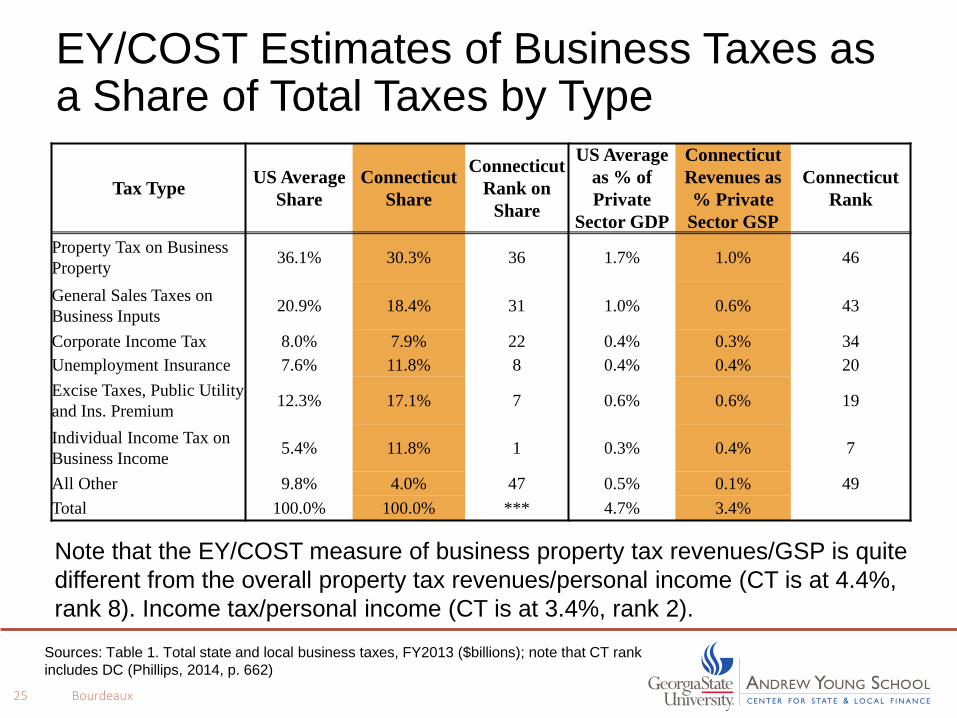
EY/COST Estimates of Business Taxes as a Share of Total Taxes by Type
Tax Type US Average Share
Connecticut Share
Connecticut Rank on
Share
US Average as % of Private
Sector GDP
Connecticut Revenues as % Private
Sector GSP
Connecticut Rank
Property Tax on Business Property 36.1% 30.3% 36 1.7% 1.0% 46
General Sales Taxes on Business Inputs 20.9% 18.4% 31 1.0% 0.6% 43
Corporate Income Tax 8.0% 7.9% 22 0.4% 0.3% 34 Unemployment Insurance 7.6% 11.8% 8 0.4% 0.4% 20 Excise Taxes, Public Utility and Ins. Premium 12.3% 17.1% 7 0.6% 0.6% 19
Individual Income Tax on Business Income 5.4% 11.8% 1 0.3% 0.4% 7
All Other 9.8% 4.0% 47 0.5% 0.1% 49 Total 100.0% 100.0% *** 4.7% 3.4%
Sources: Table 1. Total state and local business taxes, FY2013 ($billions); note that CT rank includes DC (Phillips, 2014, p. 662)
Note that the EY/COST measure of business property tax revenues/GSP is quite different from the overall property tax revenues/personal income (CT is at 4.4%, rank 8). Income tax/personal income (CT is at 3.4%, rank 2).
Tax Foundation: 2015 State Business Tax Climate Index • Focuses on tax structure across 5 tax types, each with a
different weight: – Income (32%) , Sales (22%), Property (15%), Corporate Income
(21%), and Unemployment Insurance (11%) • Thematically argue that low rate and broad base is best for
business: – Lower score for selected tax credits, exemptions, and deductions – Lower score for taxes that create “double taxation” or tax
pyramiding (ex/ sales taxes on business inputs) – Lower score for high marginal tax rates and progressive tax
brackets • Note: A key issue is that if a state doesn’t have a tax type,
particularly an income tax, it will rank high
Bourdeaux 26
Bourdeaux 27
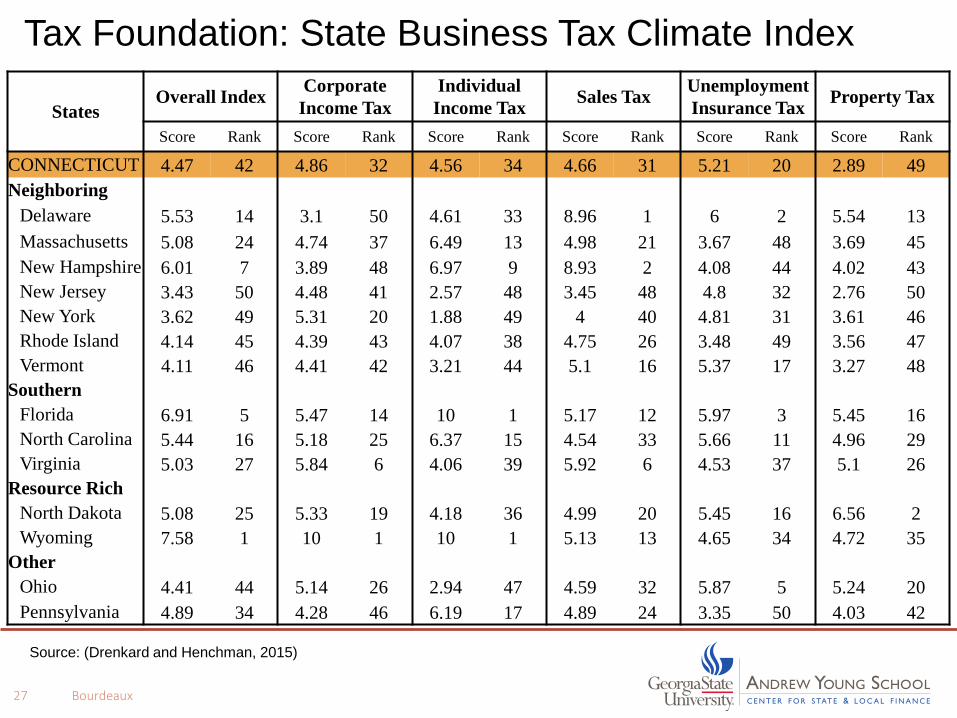
Tax Foundation: State Business Tax Climate Index
States Overall Index Corporate
Income Tax Individual
Income Tax Sales Tax Unemployment Insurance Tax Property Tax
Score Rank Score Rank Score Rank Score Rank Score Rank Score Rank
CONNECTICUT 4.47 42 4.86 32 4.56 34 4.66 31 5.21 20 2.89 49 Neighboring
Delaware 5.53 14 3.1 50 4.61 33 8.96 1 6 2 5.54 13 Massachusetts 5.08 24 4.74 37 6.49 13 4.98 21 3.67 48 3.69 45 New Hampshire 6.01 7 3.89 48 6.97 9 8.93 2 4.08 44 4.02 43 New Jersey 3.43 50 4.48 41 2.57 48 3.45 48 4.8 32 2.76 50 New York 3.62 49 5.31 20 1.88 49 4 40 4.81 31 3.61 46 Rhode Island 4.14 45 4.39 43 4.07 38 4.75 26 3.48 49 3.56 47 Vermont 4.11 46 4.41 42 3.21 44 5.1 16 5.37 17 3.27 48
Southern Florida 6.91 5 5.47 14 10 1 5.17 12 5.97 3 5.45 16 North Carolina 5.44 16 5.18 25 6.37 15 4.54 33 5.66 11 4.96 29 Virginia 5.03 27 5.84 6 4.06 39 5.92 6 4.53 37 5.1 26
Resource Rich North Dakota 5.08 25 5.33 19 4.18 36 4.99 20 5.45 16 6.56 2 Wyoming 7.58 1 10 1 10 1 5.13 13 4.65 34 4.72 35
Other Ohio 4.41 44 5.14 26 2.94 47 4.59 32 5.87 5 5.24 20 Pennsylvania 4.89 34 4.28 46 6.19 17 4.89 24 3.35 50 4.03 42
Source: (Drenkard and Henchman, 2015)
Institute for Tax and Economic Policy Index: What is Measured • The index number is constructed by examining income, property and
sales taxes and then subtracting the average of several ratios from 1: – The share of after-tax to pretax income for the wealthiest 1 percent of
income earners divided by that same ratio for the poorest 20 percent. – The share of after-tax to pre-tax income for the wealthiest 1 percent of
income earners divided by that same ratio for the middle 60 percent of income earners.
– The share of after-tax to pre-tax income for the wealthiest 20 percent of income earners divided by that same ratio for the poorest 40 percent, half-weighted.
• The resulting index number indicates the progressivity of a state’s system of taxation. The more positive the number, the more the high and low income levels become more similar after state and local taxation.
• Alternatively, the more negative the index number, the more regressive a state’s system of taxation; meaning it furthers income inequality
Bourdeaux 28
Bourdeaux 29
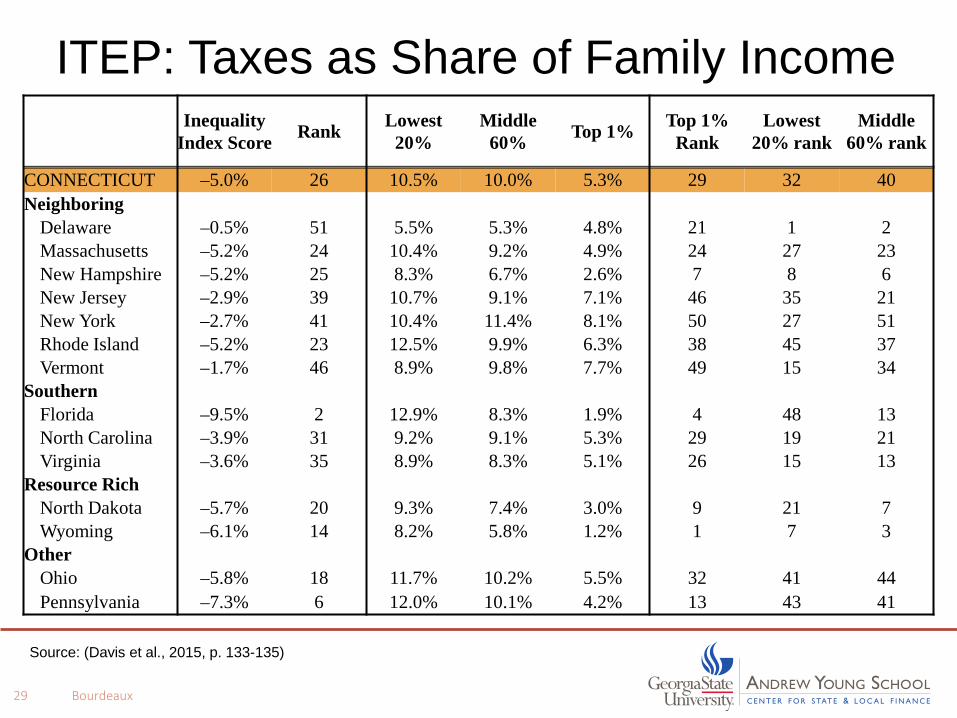
ITEP: Taxes as Share of Family Income
Inequality Index Score Rank Lowest
20% Middle
60% Top 1% Top 1% Rank
Lowest 20% rank
Middle 60% rank
CONNECTICUT –5.0% 26 10.5% 10.0% 5.3% 29 32 40 Neighboring
Delaware –0.5% 51 5.5% 5.3% 4.8% 21 1 2 Massachusetts –5.2% 24 10.4% 9.2% 4.9% 24 27 23 New Hampshire –5.2% 25 8.3% 6.7% 2.6% 7 8 6 New Jersey –2.9% 39 10.7% 9.1% 7.1% 46 35 21 New York –2.7% 41 10.4% 11.4% 8.1% 50 27 51 Rhode Island –5.2% 23 12.5% 9.9% 6.3% 38 45 37 Vermont –1.7% 46 8.9% 9.8% 7.7% 49 15 34
Southern Florida –9.5% 2 12.9% 8.3% 1.9% 4 48 13 North Carolina –3.9% 31 9.2% 9.1% 5.3% 29 19 21 Virginia –3.6% 35 8.9% 8.3% 5.1% 26 15 13
Resource Rich North Dakota –5.7% 20 9.3% 7.4% 3.0% 9 21 7 Wyoming –6.1% 14 8.2% 5.8% 1.2% 1 7 3
Other Ohio –5.8% 18 11.7% 10.2% 5.5% 32 41 44 Pennsylvania –7.3% 6 12.0% 10.1% 4.2% 13 43 41
Source: (Davis et al., 2015, p. 133-135)
Other Indices • Small Business Tax Index: Connecticut ranks in bottom 10 (41st in
2015) having a less favorable small business tax climate – This index largely counts top marginal income and corporate income
taxes which makes up 63% of CT overall “score.”
• Beacon Hill Institute: State Competitiveness Index – Connecticut was 40th lowest in competitiveness on this index in 2014.
However, in other years, going back to at least 2006, the state was in the middle of the pack, scoring 24th in 2006 and 27th in 2013.
– Connecticut scores in the top ten states in terms of openness (5th), technology (8th) and security (6th), and in the upper ranks in human resources (15th).
– The state then scores very poorly on government and fiscal policy (47th), business incubation capacity (50th), infrastructure (41st), and environmental policy (42nd).
Bourdeaux 30