Embed Size (px)
Citation preview
Dr. C. S. GardeVishwakarma Institute of Information Technology, Pune
VIIT, Pune

Experimental Physics – Technology intensive
Devising new Experiments using cutting edge Technology – a must for new Physics
However, limited time and manpower for research in technology
VIIT has a large pool of engineering faculty (~130) and students (500 in final year)
Win-Win situation
VIIT, Pune
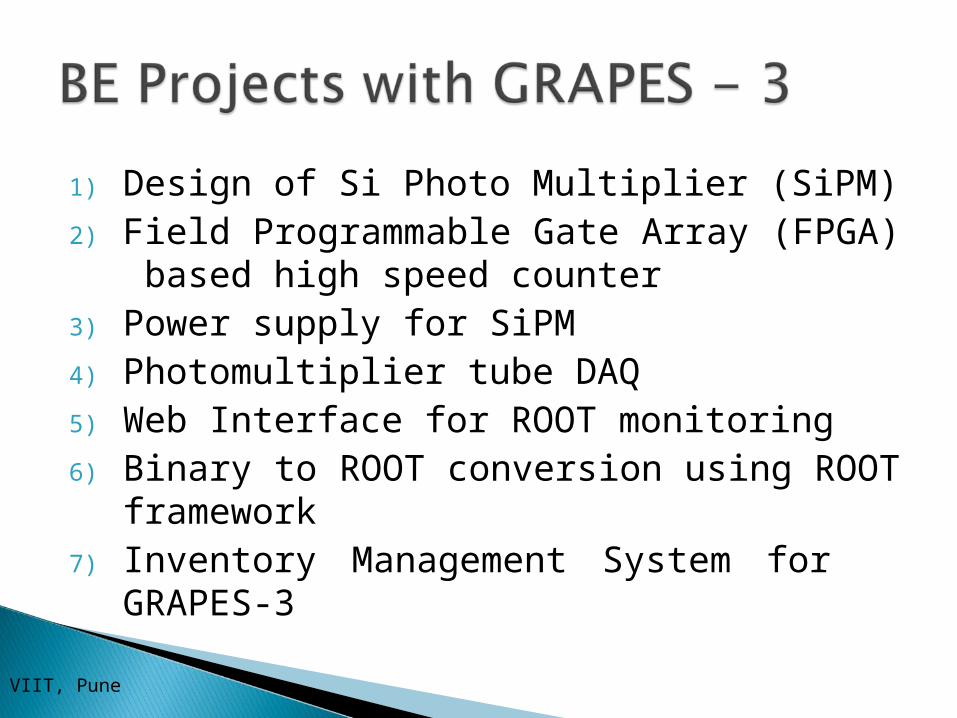
1) Design of Si Photo Multiplier (SiPM) 2) Field Programmable Gate Array (FPGA)
based high speed counter3) Power supply for SiPM4) Photomultiplier tube DAQ5) Web Interface for ROOT monitoring6) Binary to ROOT conversion using ROOT
framework7) Inventory Management System for
GRAPES-3
VIIT, Pune
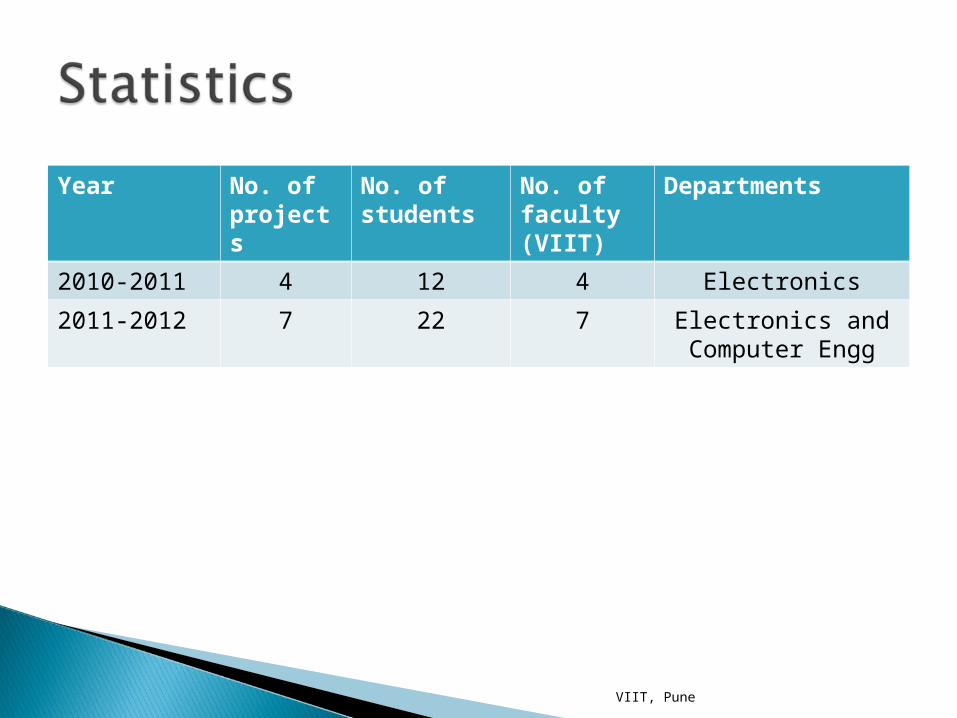
Year No. of projects
No. of students
No. of faculty (VIIT)
Departments
2010-2011 4 12 4 Electronics
2011-2012 7 22 7 Electronics and Computer Engg
VIIT, Pune
VIIT, Pune

1) Design of Si Photo Multiplier (SiPM) 2) Field Programmable Gate Array (FPGA)
based high speed counter3) Power supply for SiPM4) Photomultiplier tube DAQ5) Web Interface for ROOT monitoring6) Binary to ROOT conversion using ROOT
framework7) Inventory Management System for
GRAPES-3
VIIT, Pune

Design of Si Photo Multiplier (SiPM)
VIIT, Pune
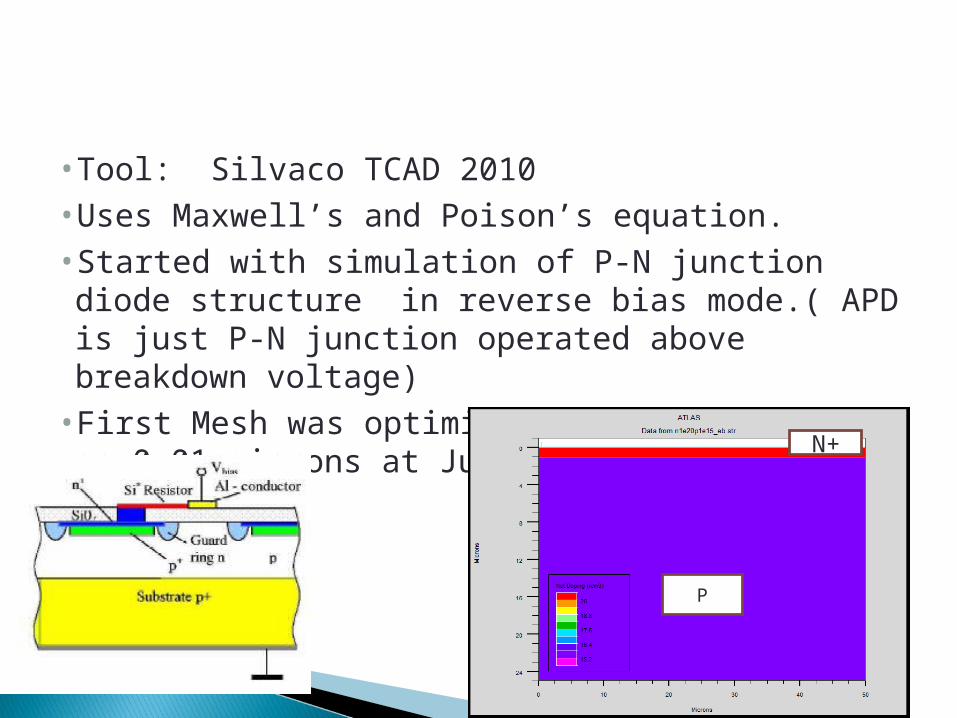
• Tool: Silvaco TCAD 2010• Uses Maxwell’s and Poison’s equation.• Started with simulation of P-N junction diode structure in reverse bias mode.( APD is just P-N junction operated above breakdown voltage)
• First Mesh was optimized and it is chosen as 0.01 microns at Junction.
P
N+
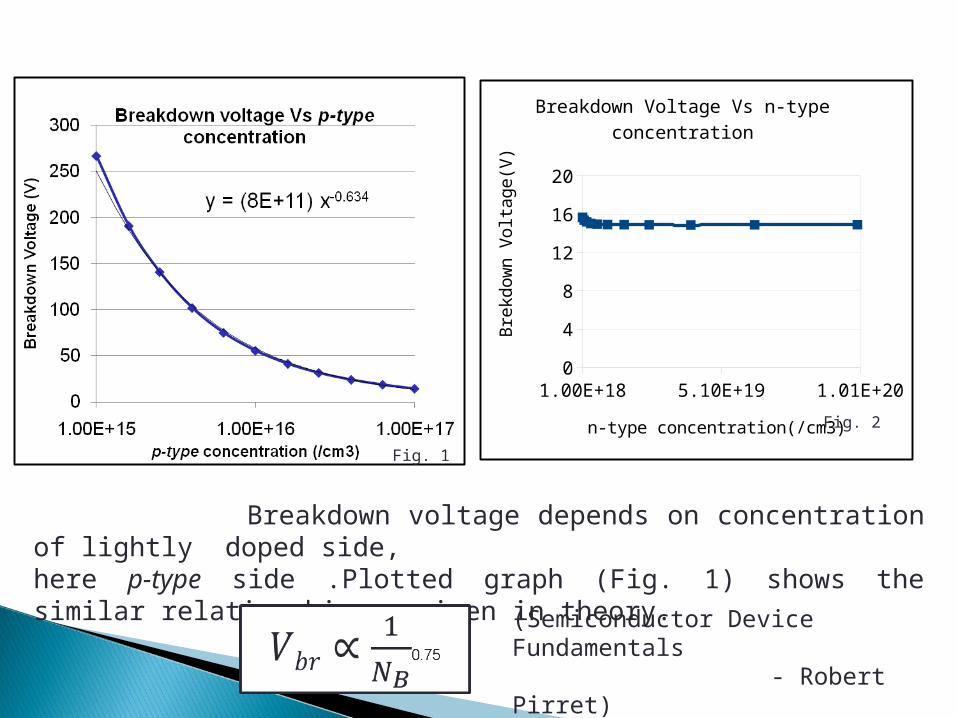
•Simulations were done by varying n-type and p-type concentration,keeping other parameters fixed.
•Effect on breakdown voltage was observed and results are plotted.
•P-type concentration Varied from 1e15 to 1e17 •N-type concentration Varied from 1e18 to 1e20•Each range was broken into 10 points , so total 100 simulations.
Net
Dop
ing
(/cm3
)
1.00E+18 5.10E+19 1.01E+200
4
8
12
16
20
Breakdown Voltage Vs n-type concen-tration
n-type concentration(/cm3)
Bre
kdow
n V
olta
ge(V
) Breakdown voltage depends on concentration of lightly doped side,here p-type side .Plotted graph (Fig. 1) shows the similar relationship as given in theory.
Fig. 1
Fig. 2
(Semiconductor Device Fundamentals - Robert Pirret)
Practical doping
• Till now structure simulated as a step junction (abrupt
junction) which is ideal case
• Practical methods of doping : Ion Implantation and
Diffusion
• Diffusion : a error-function doping profile.
• Ion Implantation : a Gaussian doping profile.
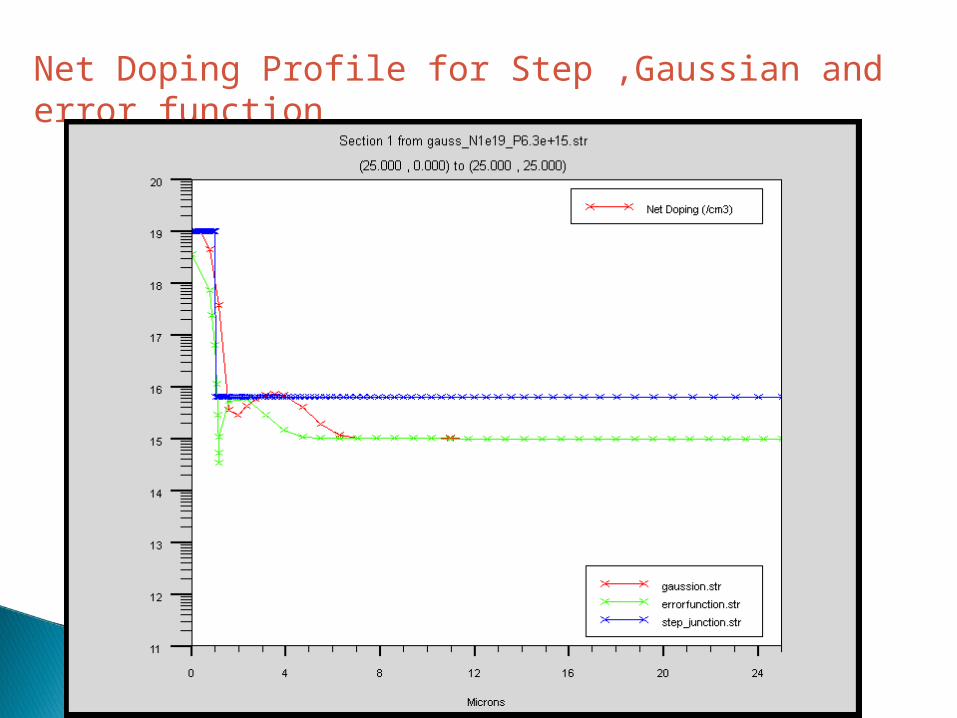
Net Doping Profile for Step ,Gaussian and error function
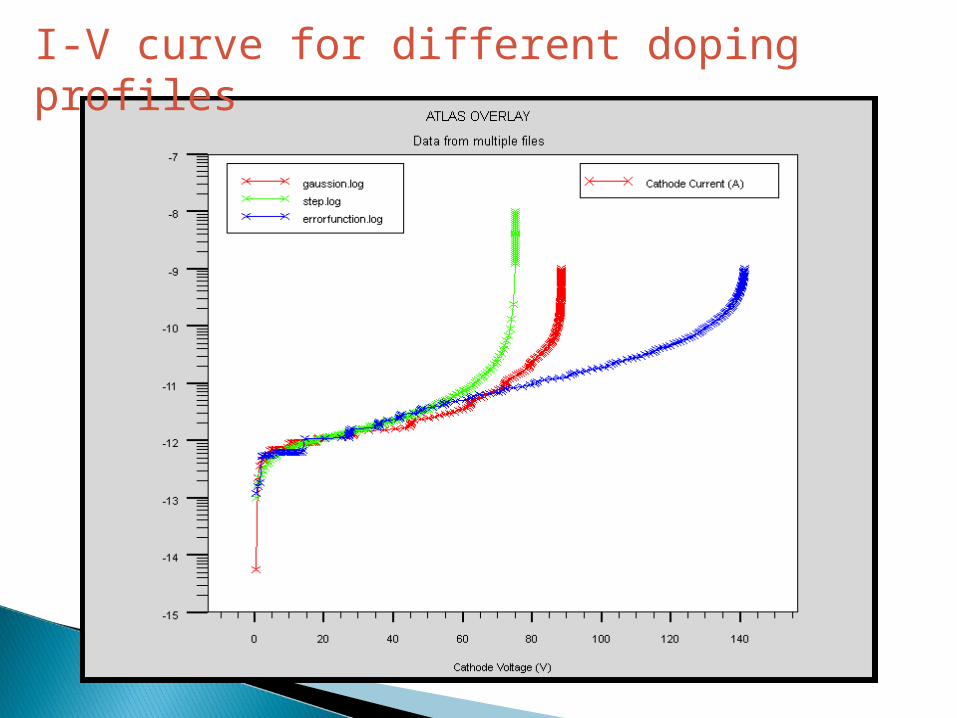
I-V curve for different doping profiles
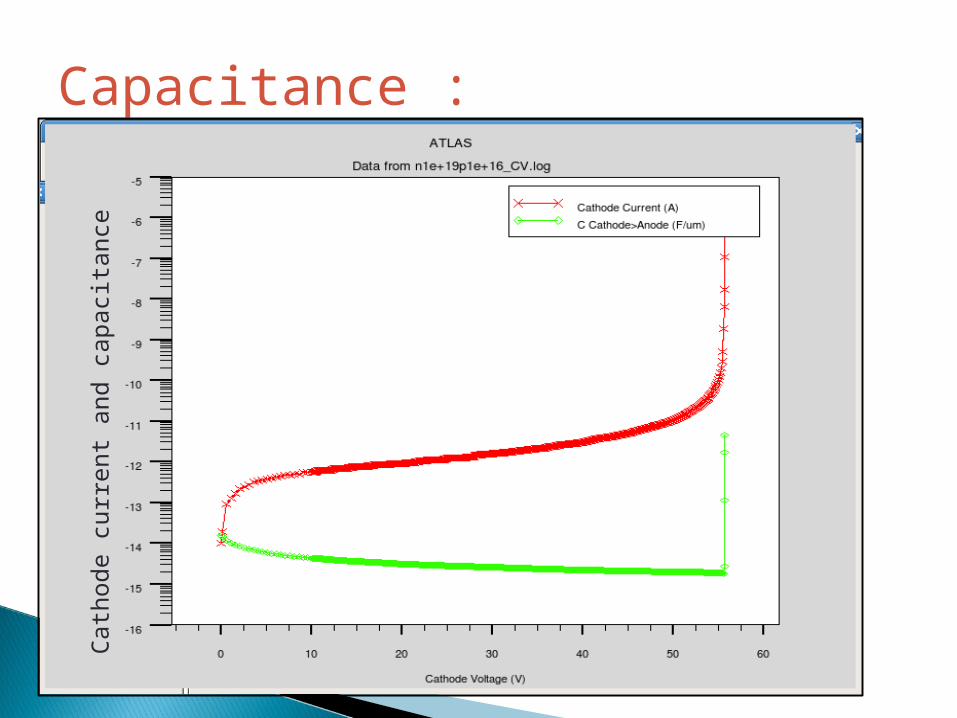
Capacitance :C
atho
de c
urre
nt a
nd c
apac
itanc
e
Optical Simulation
• Spectral ResponseSpectral Response
With appropriate biasing(reverse) diode is bombarded with light of various wavelength covering visible spectrum.
Current through diode is monitored and plotted as function of wavelength.
• Transient ResponseTransient Response
Optical pulse of very short duration is incident on surface of diode.
Diode’s response (rise time, fall time) is studied .
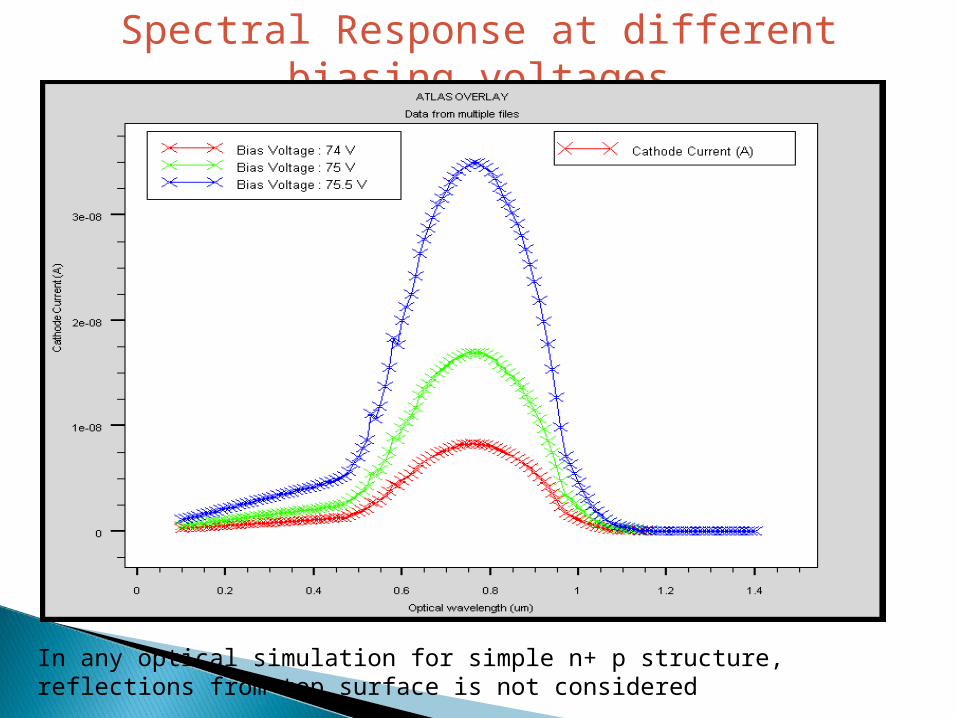
Spectral Response at different biasing voltages
In any optical simulation for simple n+ p structure, reflections from top surface is not considered
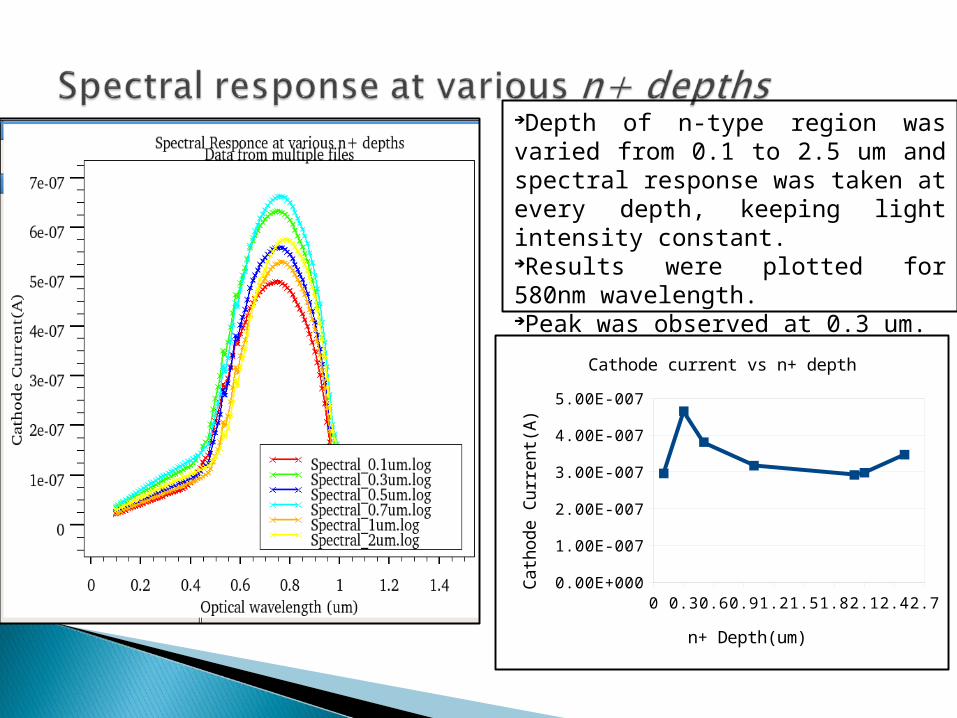
Depth of n-type region was varied from 0.1 to 2.5 um and spectral response was taken at every depth, keeping light intensity constant.Results were plotted for 580nm wavelength.Peak was observed at 0.3 um.
0 0.3 0.6 0.9 1.2 1.5 1.8 2.1 2.4 2.70.00E+000
1.00E-007
2.00E-007
3.00E-007
4.00E-007
5.00E-007
Cathode current vs n+ depth
n+ Depth(um)
Cat
hod
e C
urr
ent(
A)
Intensity Variation at various n+ depthsC
atho
de c
urre
nt (
A)
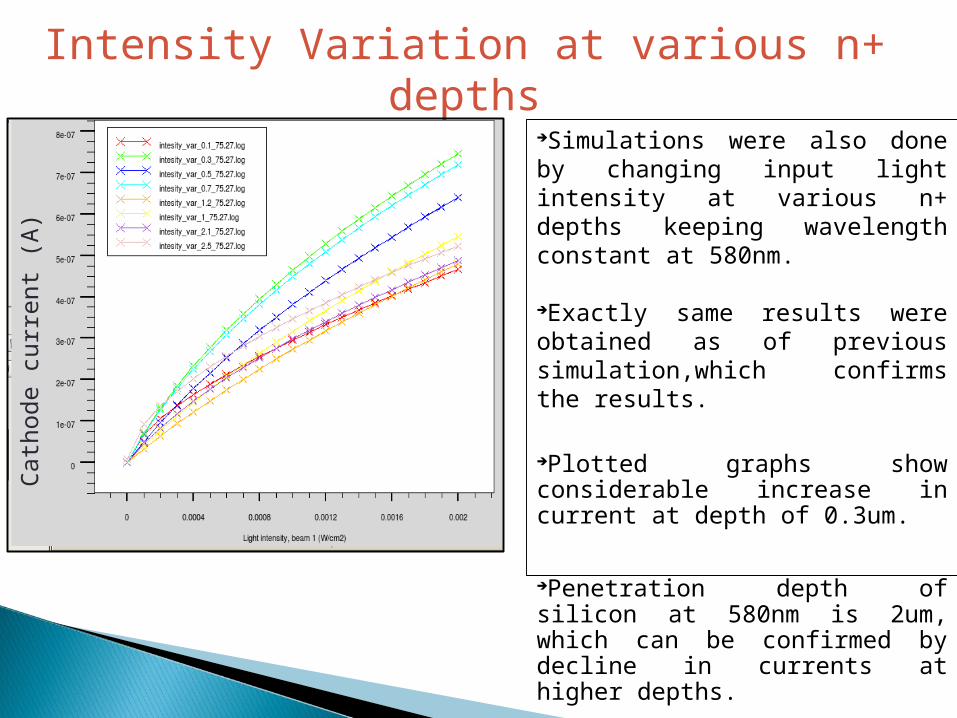
Simulations were also done by changing input light intensity at various n+ depths keeping wavelength constant at 580nm.
Exactly same results were obtained as of previous simulation,which confirms the results.
Plotted graphs show considerable increase in current at depth of 0.3um.
Penetration depth of silicon at 580nm is 2um, which can be confirmed by decline in currents at higher depths.
Transient simulation( P-Spice)
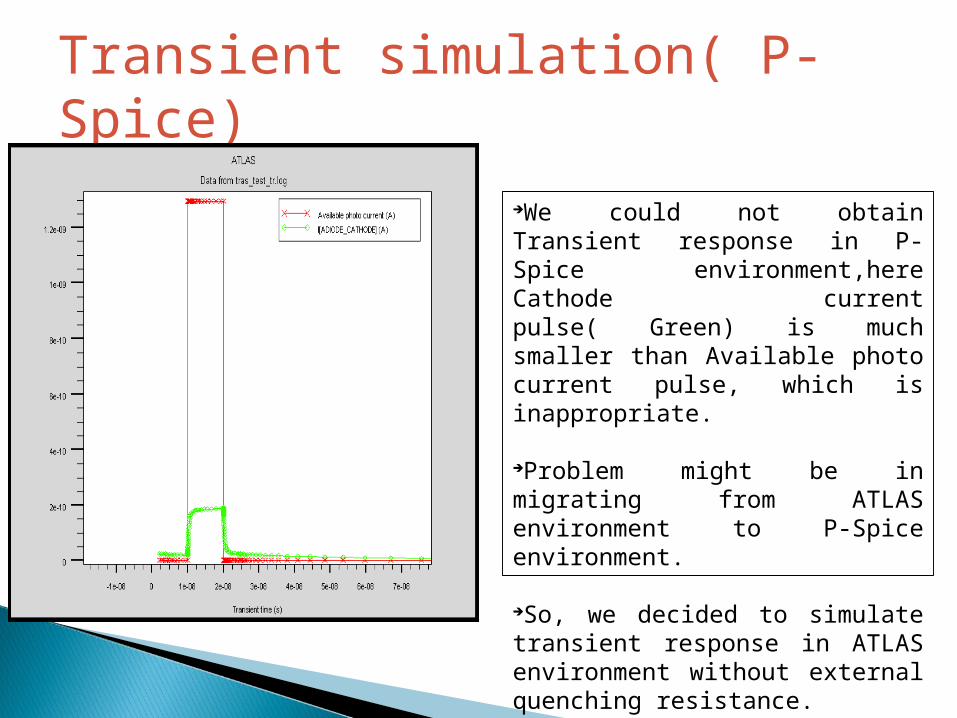
We could not obtain Transient response in P-Spice environment,here Cathode current pulse( Green) is much smaller than Available photo current pulse, which is inappropriate.
Problem might be in migrating from ATLAS environment to P-Spice environment.
So, we decided to simulate transient response in ATLAS environment without external quenching resistance.
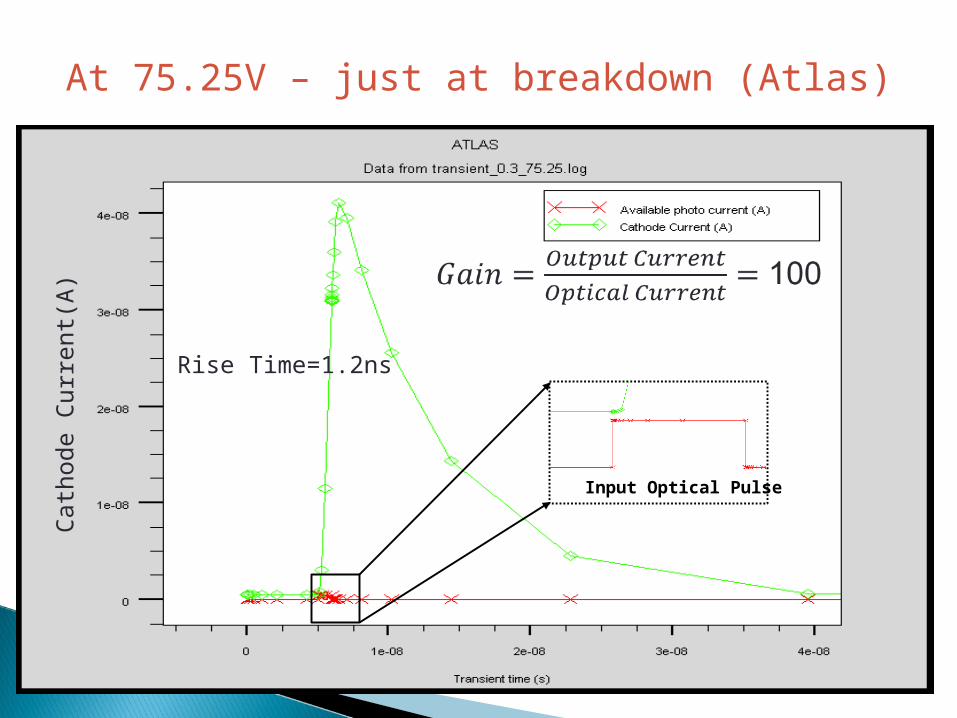
At 75.25V – just at breakdown (Atlas)C
atho
de C
urre
nt(A
)
Rise Time=1.2ns
Input Optical Pulse
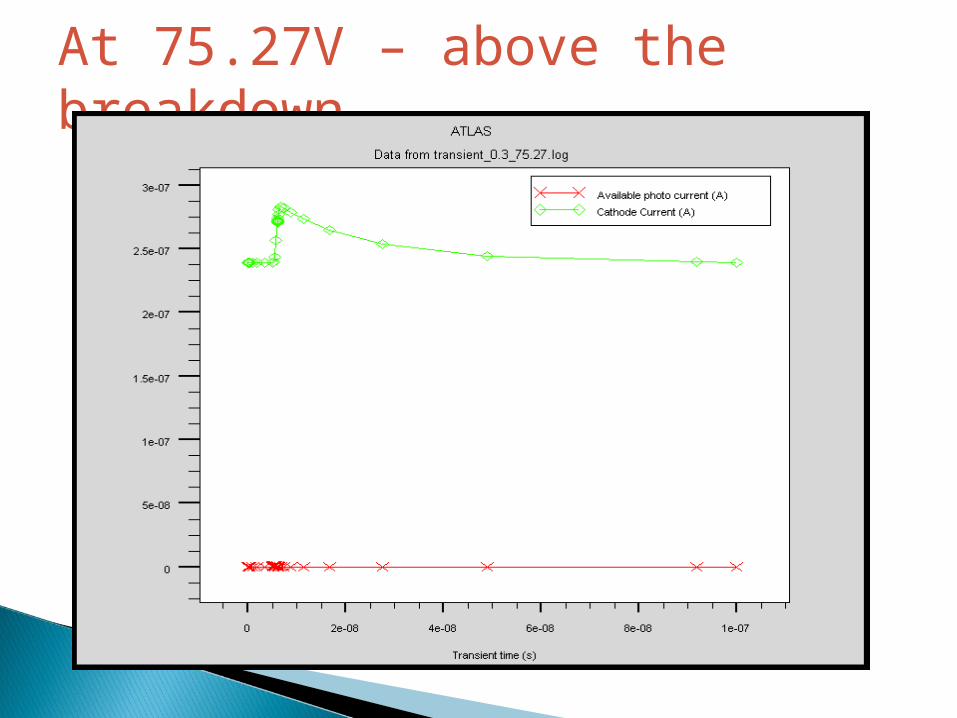
At 75.27V – above the breakdown
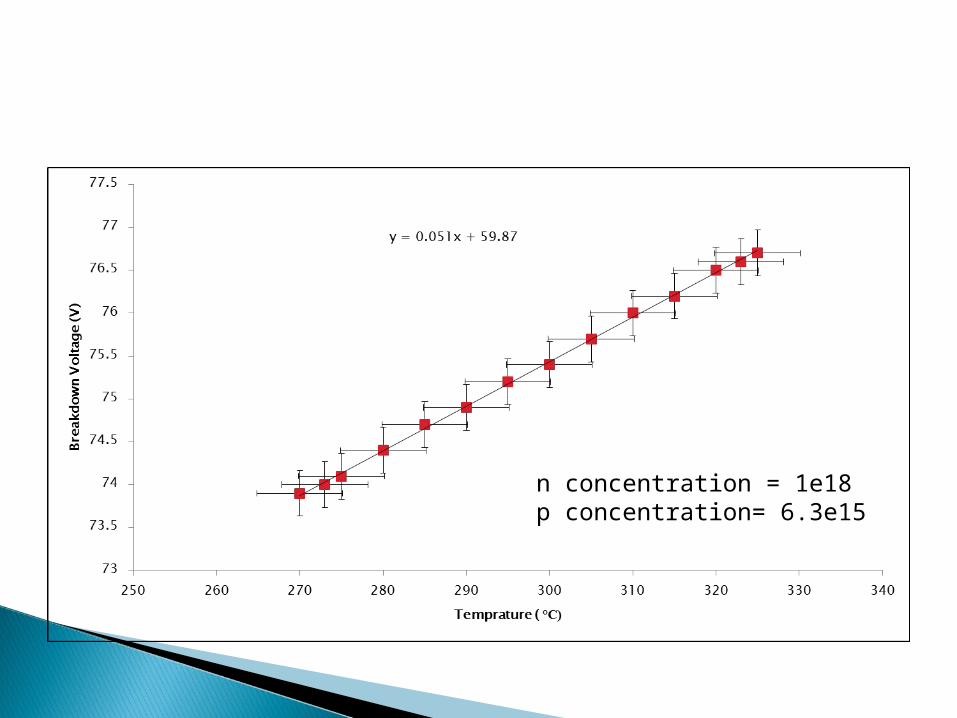
n concentration = 1e18p concentration= 6.3e15
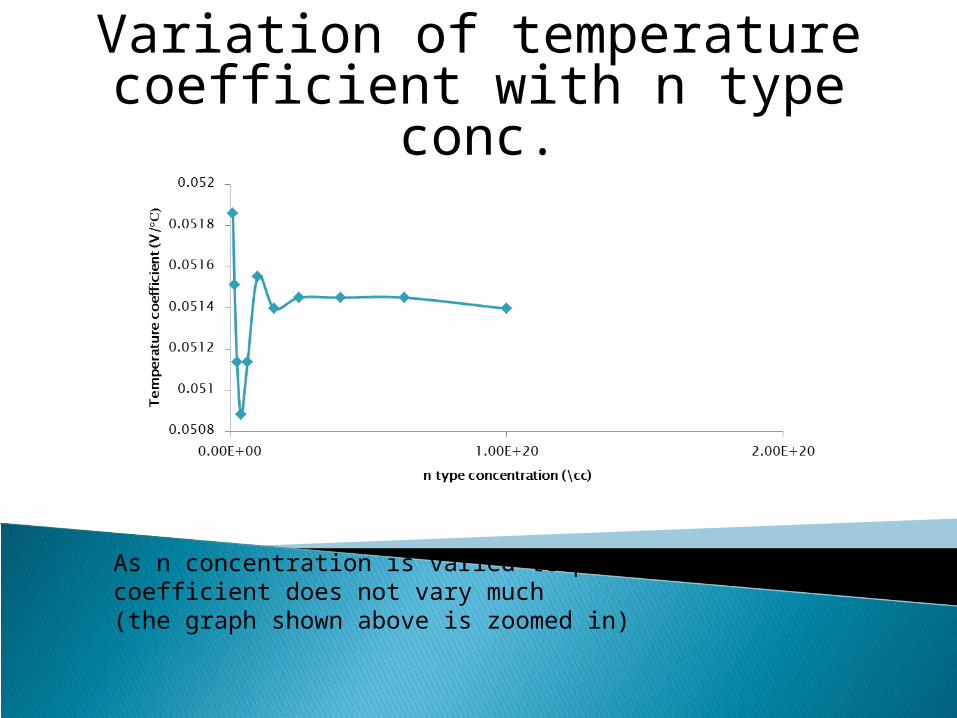
As n concentration is varied temperature coefficient does not vary much(the graph shown above is zoomed in)
Variation of temperature coefficient with n type conc.
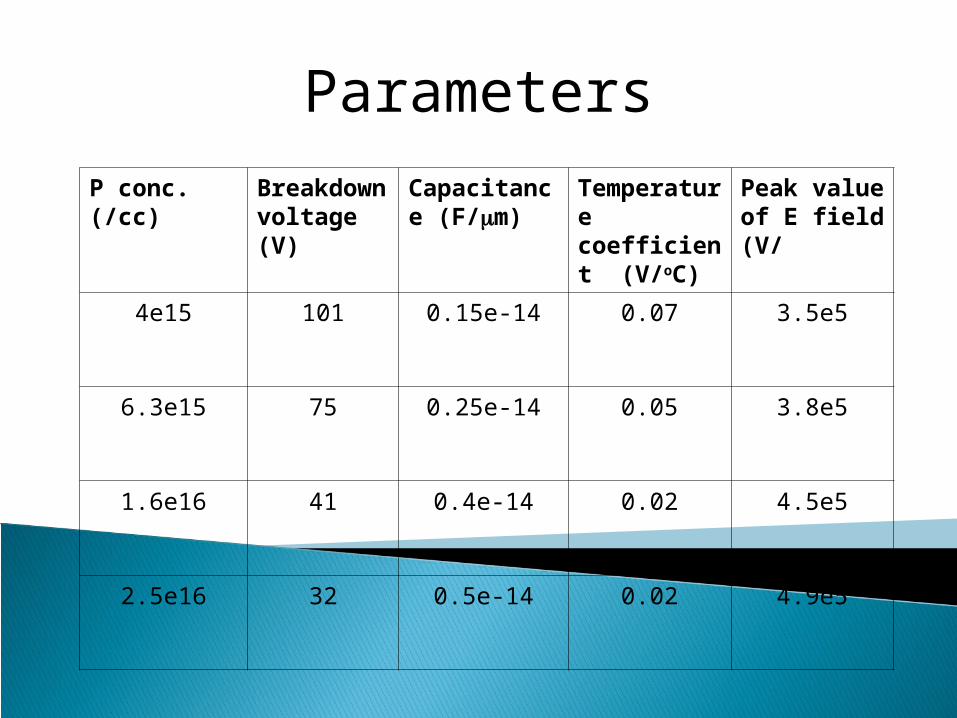
P conc.(/cc)
Breakdown voltage (V)
Capacitance (F/m)
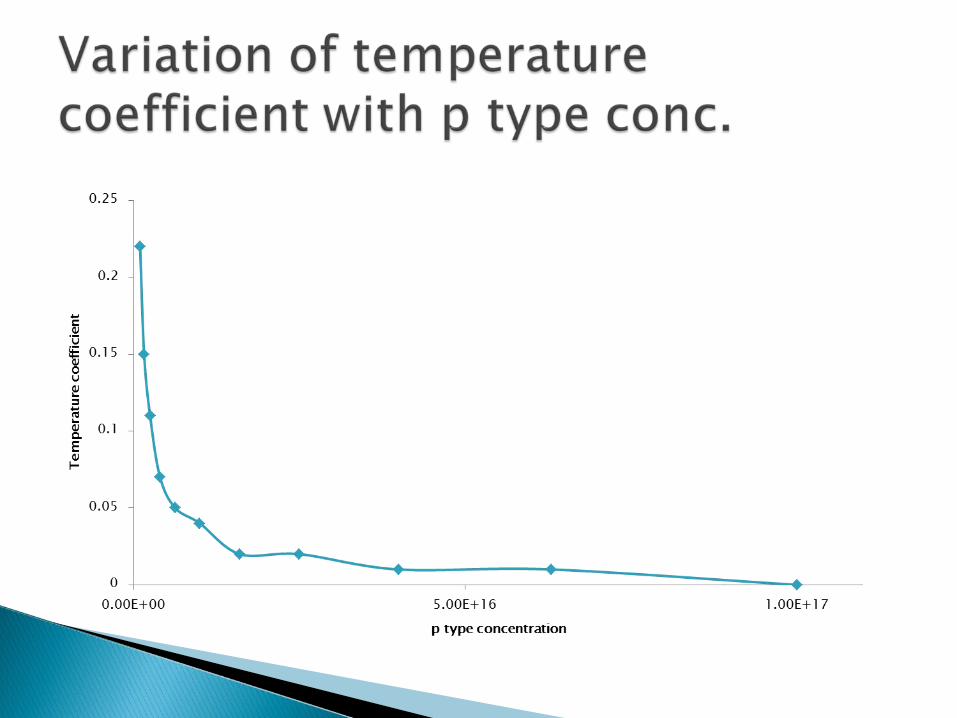
Temperature coefficient (V/oC)
Peak value of E field (V/
4e15 101 0.15e-14 0.07 3.5e5
6.3e15 75 0.25e-14 0.05 3.8e5
1.6e16 41 0.4e-14 0.02 4.5e5
2.5e16 32 0.5e-14 0.02 4.9e5
Parameters
Towards new structure... Till now we have simulated only simple p-n
junction(device simulation) in order to understand effect of every parameter.
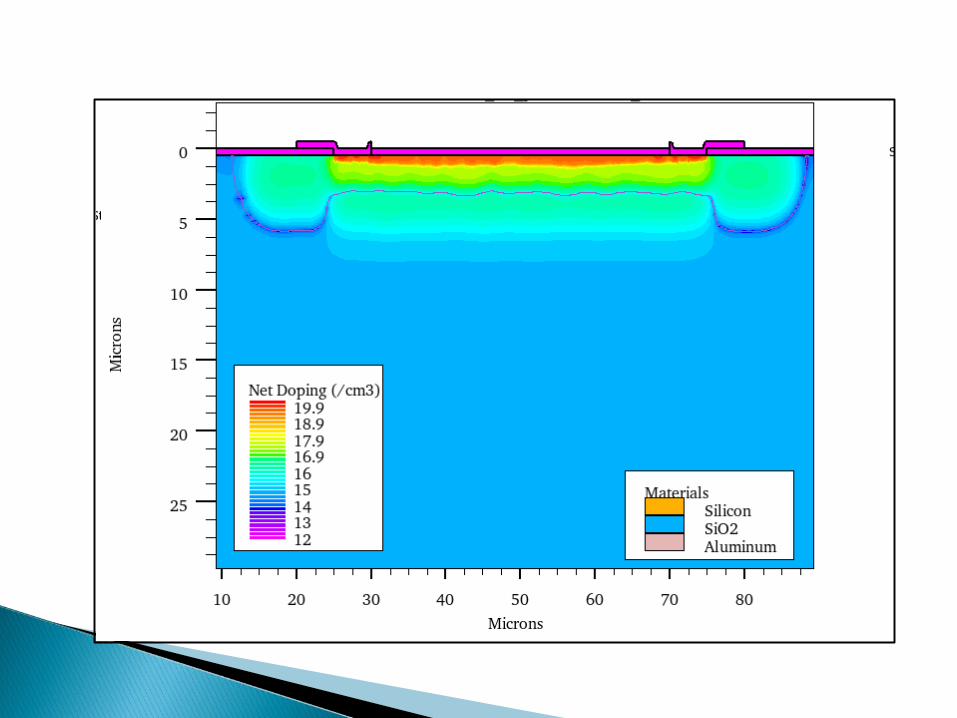
So we moved on to the more practical structure, which is made up of 4-5 layers.
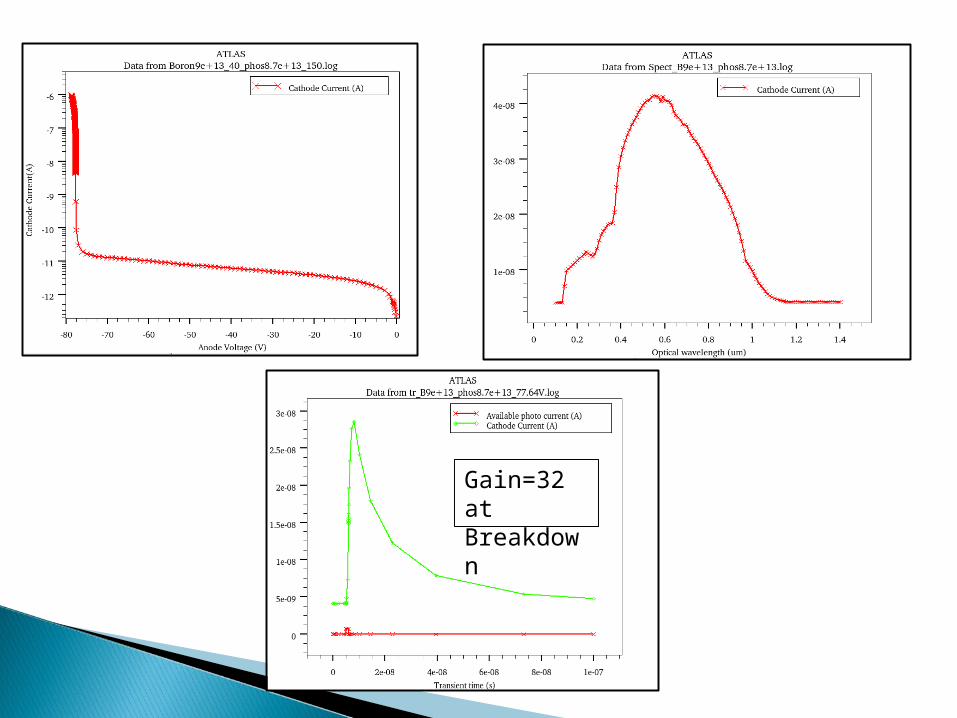
Gain=32 at Breakdown
Process simulation started After fabrication, simulations can be fine tuned for
development of full fledged SiPM
Web Interface for ROOT monitoring
VIIT, Pune
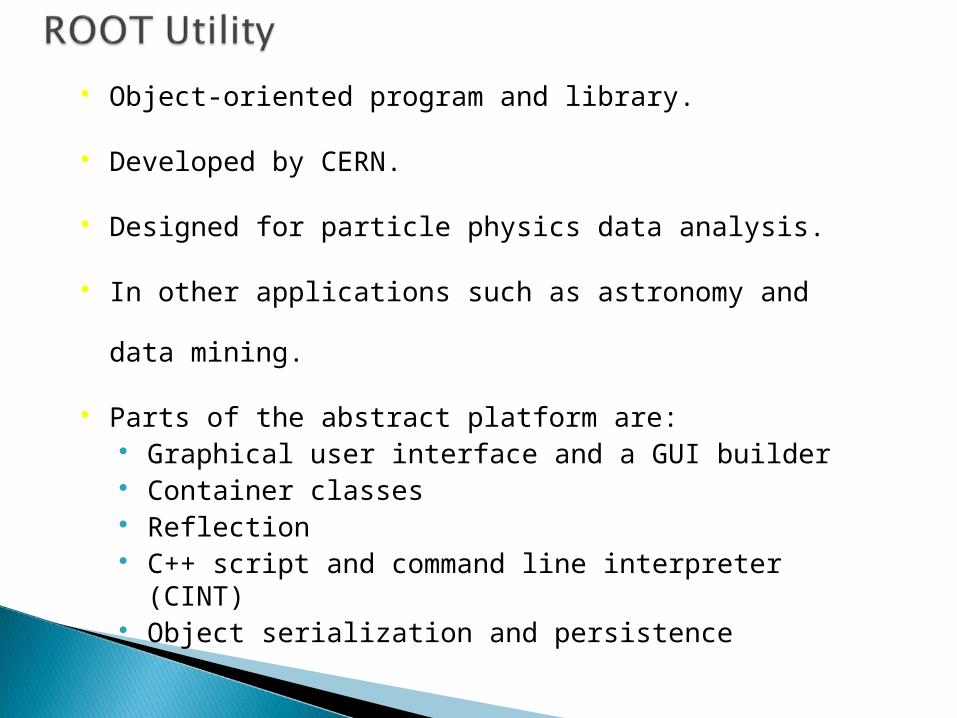
Object-oriented program and library.
Developed by CERN.
Designed for particle physics data analysis.
In other applications such as astronomy and data
mining.
Parts of the abstract platform are: Graphical user interface and a GUI builder Container classes Reflection C++ script and command line interpreter
(CINT) Object serialization and persistence
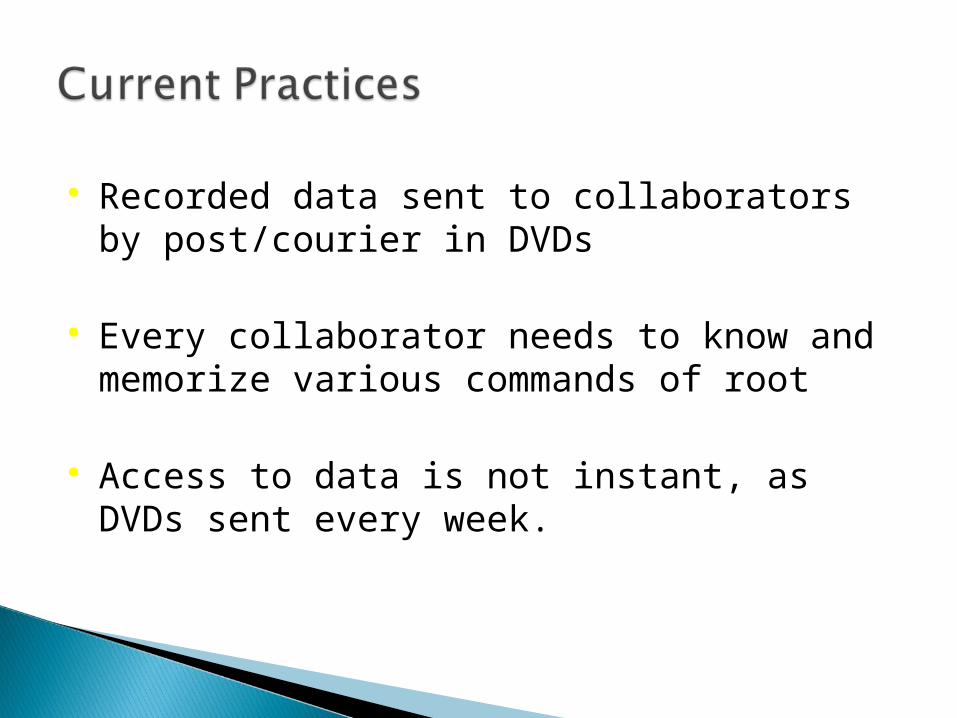
Recorded data sent to collaborators by post/courier in DVDs
Every collaborator needs to know and memorize various commands of root
Access to data is not instant, as DVDs sent every week.

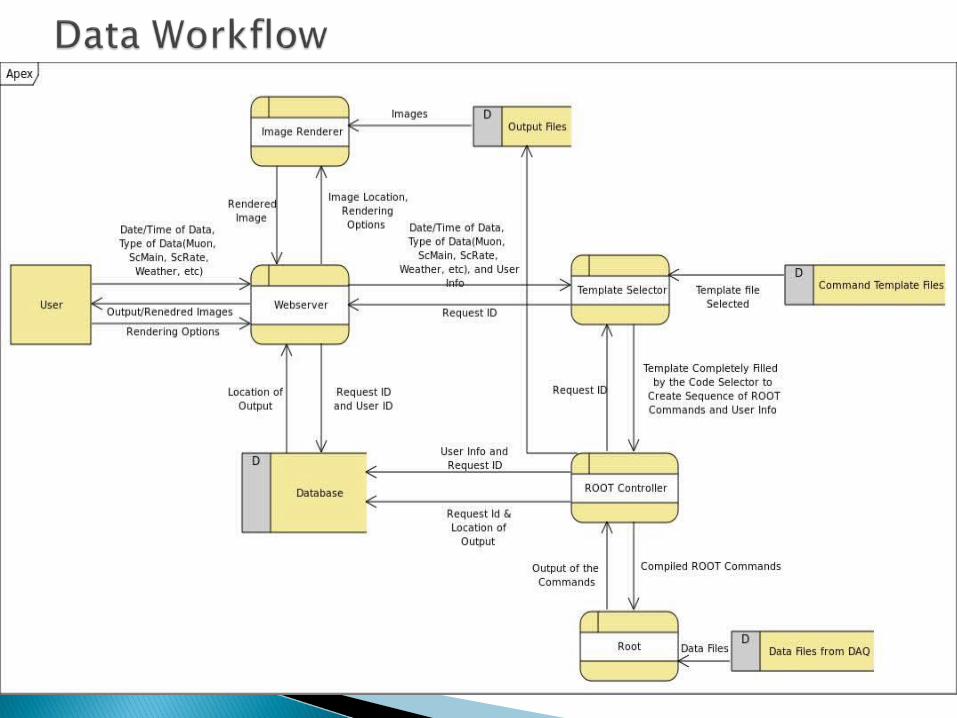
Our GoalOur Goal
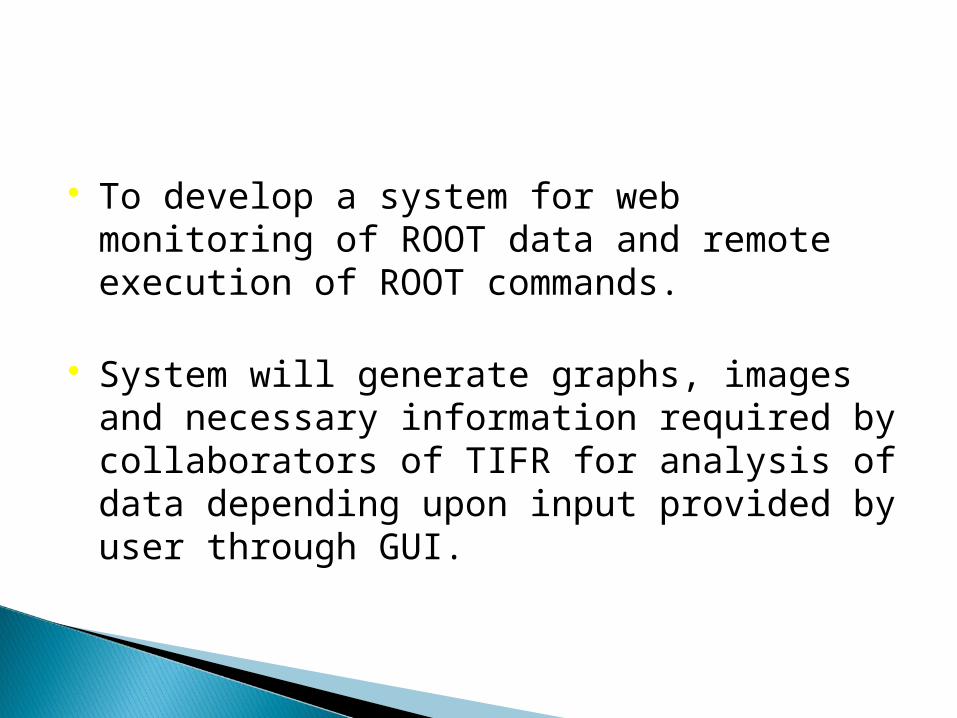
To develop a system for web monitoring of ROOT data and remote execution of ROOT commands.
System will generate graphs, images and necessary information required by collaborators of TIFR for analysis of data depending upon input provided by user through GUI.
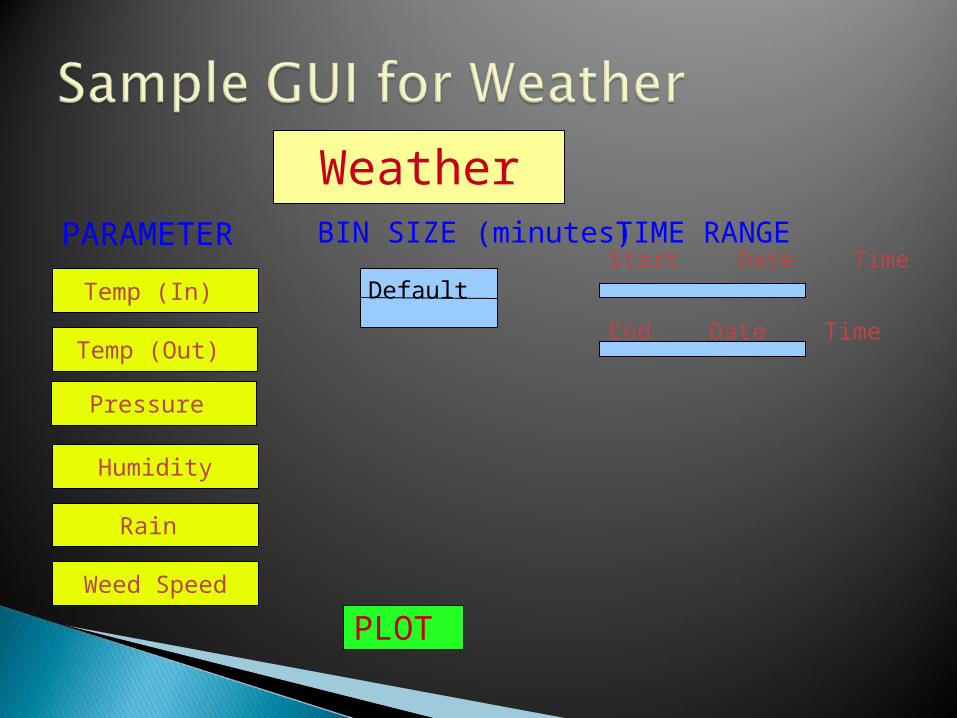
Temp (In)
PARAMETERStart Date Time
BIN SIZE (minutes) TIME RANGE
End Date Time
Pressure
Temp (Out)
Humidity
Weed Speed
Rain
PLOT
Default
Weather

Our ApproachOur Approach

As a result of VIIT-GRAPES-3 collaboration, VIIT students are motivated to take up research careers
VIIT faculty also benefiting from hands-on experience
Developing valuable Human Resource Strong VIIT-GRAPES-3 collaboration could
help GRAPES-3 to upgrade the existing experiments and possibly take up new challenging experiments
VIIT, Pune

VIIT, Pune

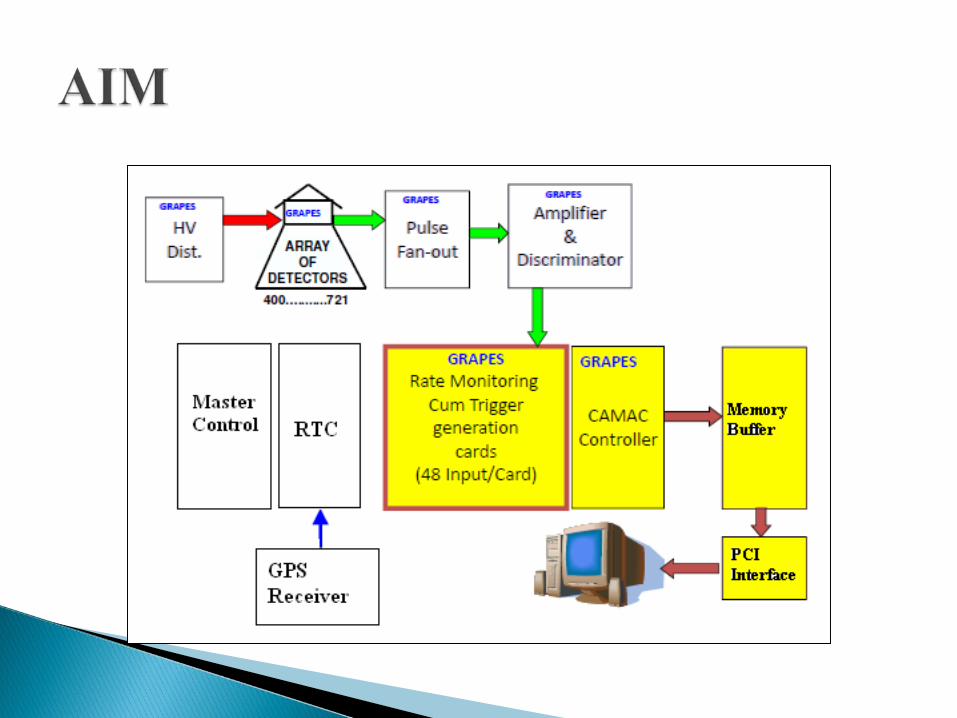
Pulse signals from the Scintillator Detectors are digitized in the discriminator section and fixed width pulse is taken as an output
High Speed Event Counter takes these fixed width pulses as inputs and counts the number of such pulses
With the counting of these pulses duration of air showers can be determined and trigger control signals can be generated
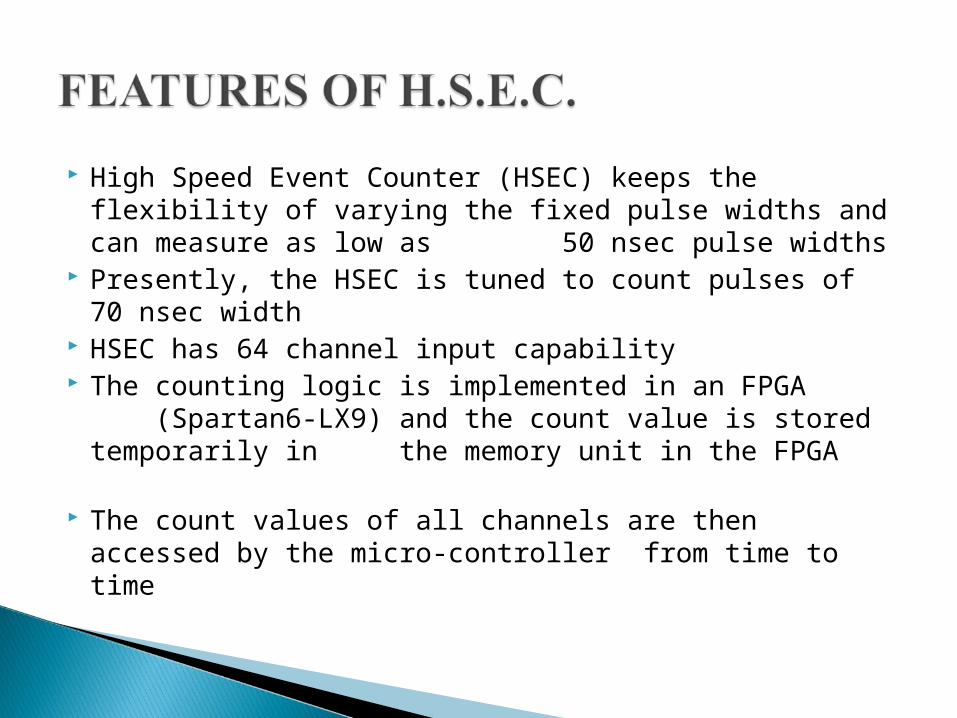
High Speed Event Counter (HSEC) keeps the flexibility of varying the fixed pulse widths and can measure as low as 50 nsec pulse widths
Presently, the HSEC is tuned to count pulses of 70 nsec width HSEC has 64 channel input capability The counting logic is implemented in an FPGA
(Spartan6-LX9) and the count value is stored temporarily in the memory unit in the FPGA
The count values of all channels are then accessed by the micro-controller from time to time
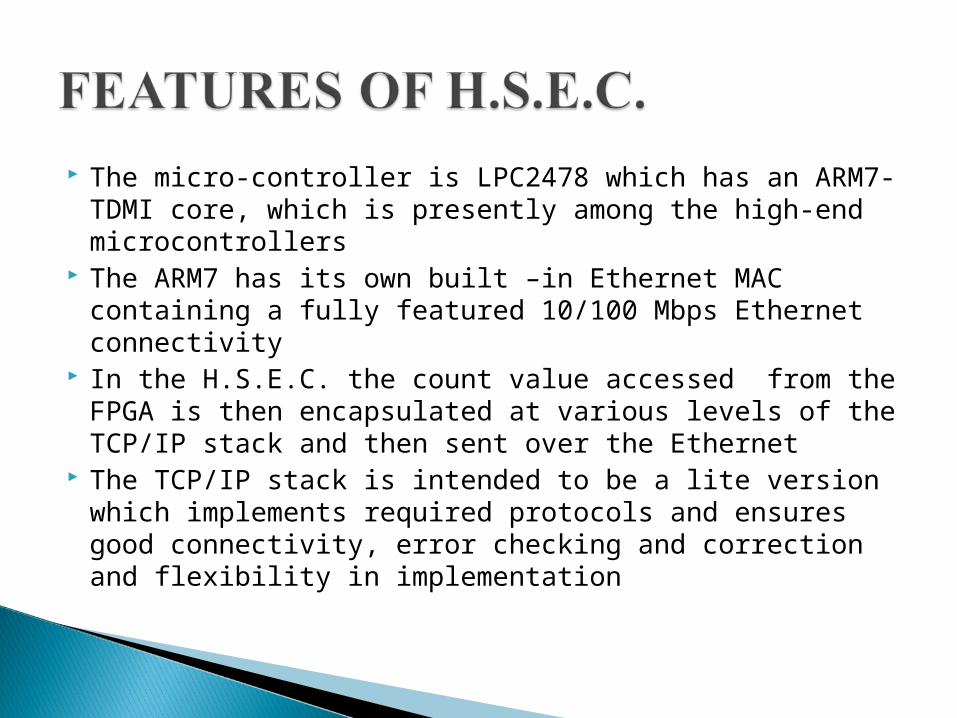
The micro-controller is LPC2478 which has an ARM7-TDMI core, which is presently among the high-end microcontrollers
The ARM7 has its own built –in Ethernet MAC containing a fully featured 10/100 Mbps Ethernet connectivity
In the H.S.E.C. the count value accessed from the FPGA is then encapsulated at various levels of the TCP/IP stack and then sent over the Ethernet
The TCP/IP stack is intended to be a lite version which implements required protocols and ensures good connectivity, error checking and correction and flexibility in implementation
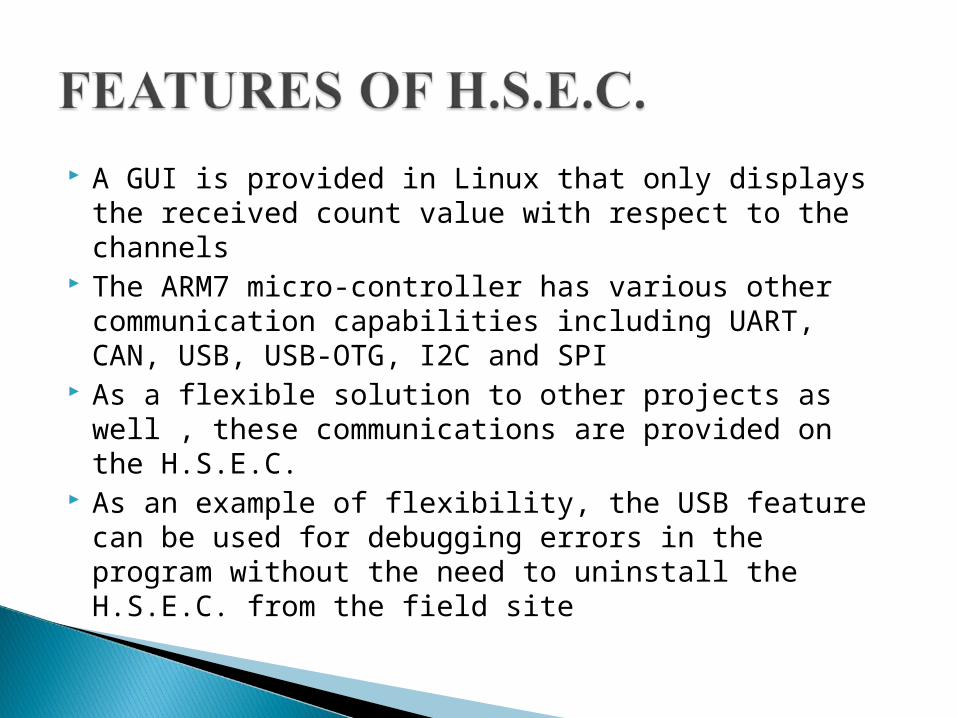
A GUI is provided in Linux that only displays the received count value with respect to the channels
The ARM7 micro-controller has various other communication capabilities including UART, CAN, USB, USB-OTG, I2C and SPI
As a flexible solution to other projects as well , these communications are provided on the H.S.E.C.
As an example of flexibility, the USB feature can be used for debugging errors in the program without the need to uninstall the H.S.E.C. from the field site
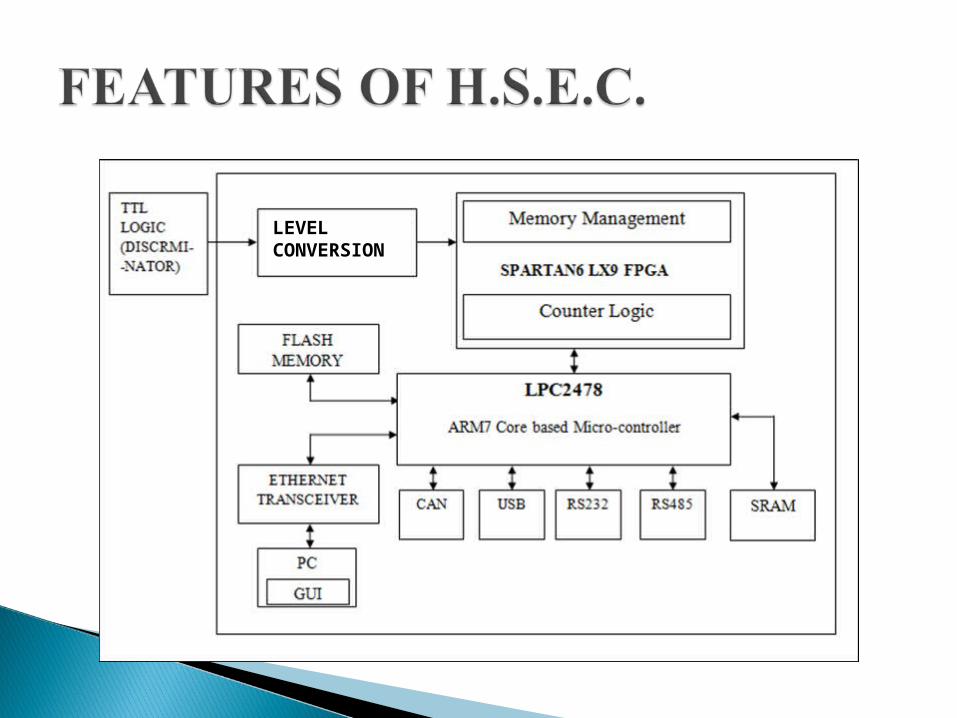
LLEVEL CONVERSION
The FPGA in H.S.E.C. is purposely chosen to be a high-end FPGA so that as a future scope, the Ethernet connectivity can be directly implemented on the FPGA itself. The Spartan6-LX9 has sufficient resources to implement a complete TCP/IP stack
Strong error control and correction algorithms can be implemented on the ARM7
The ARM7 supports Linux kernel, so a board-to-board connectivity can be implemented with slight modifications
An embedded web-server can be implemented and stored in the flash memory on the H.S.E.C. which will facilitate the user to access the information about each board through any web-browser