Embed Size (px)
Citation preview
Dr. APJ Abdul Kalam
Central Instrumentation Facility (CIF)
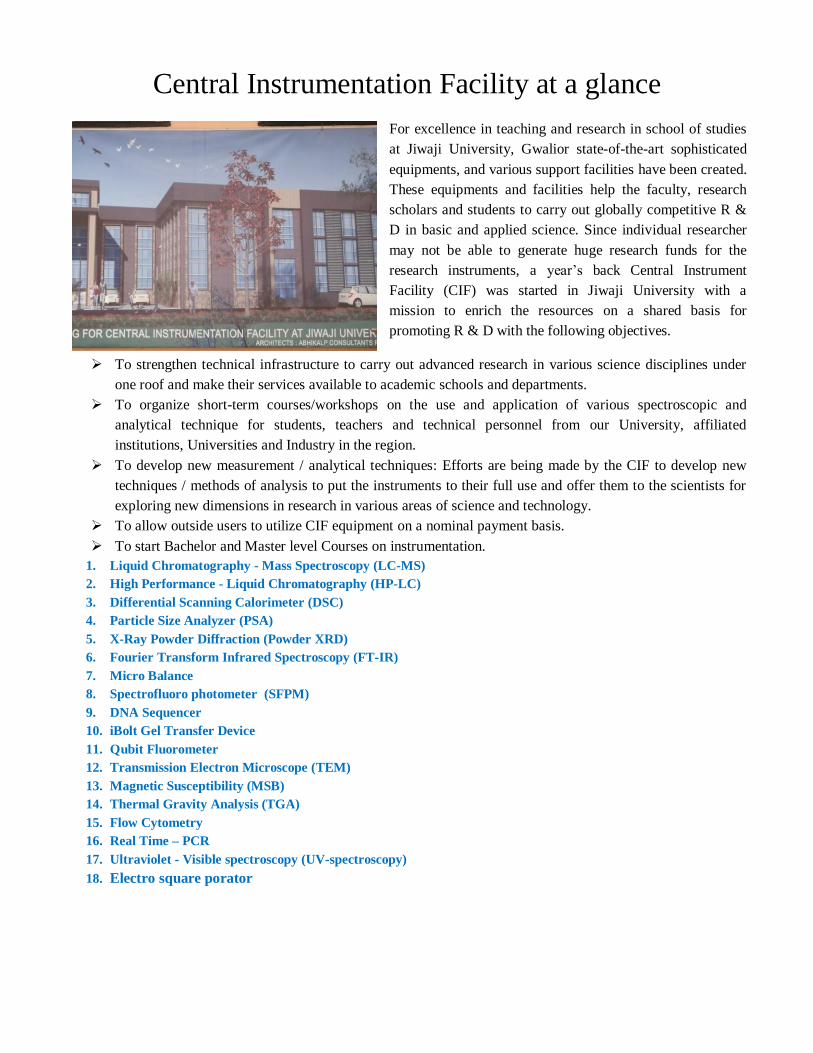
Central Instrumentation Facility at a glance
For excellence in teaching and research in school of studies
at Jiwaji University, Gwalior state-of-the-art sophisticated
equipments, and various support facilities have been created.
These equipments and facilities help the faculty, research
scholars and students to carry out globally competitive R &
D in basic and applied science. Since individual researcher
may not be able to generate huge research funds for the
research instruments, a year’s back Central Instrument
Facility (CIF) was started in Jiwaji University with a
mission to enrich the resources on a shared basis for
promoting R & D with the following objectives.
To strengthen technical infrastructure to carry out advanced research in various science disciplines under
one roof and make their services available to academic schools and departments.
To organize short-term courses/workshops on the use and application of various spectroscopic and
analytical technique for students, teachers and technical personnel from our University, affiliated
institutions, Universities and Industry in the region.
To develop new measurement / analytical techniques: Efforts are being made by the CIF to develop new
techniques / methods of analysis to put the instruments to their full use and offer them to the scientists for
exploring new dimensions in research in various areas of science and technology.
To allow outside users to utilize CIF equipment on a nominal payment basis.
To start Bachelor and Master level Courses on instrumentation.
1. Liquid Chromatography - Mass Spectroscopy (LC-MS)
2. High Performance - Liquid Chromatography (HP-LC)
3. Differential Scanning Calorimeter (DSC)
4. Particle Size Analyzer (PSA)
5. X-Ray Powder Diffraction (Powder XRD)
6. Fourier Transform Infrared Spectroscopy (FT-IR)
7. Micro Balance
8. Spectrofluoro photometer (SFPM)
9. DNA Sequencer
10. iBolt Gel Transfer Device
11. Qubit Fluorometer
12. Transmission Electron Microscope (TEM)
13. Magnetic Susceptibility (MSB)
14. Thermal Gravity Analysis (TGA)
15. Flow Cytometry
16. Real Time – PCR
17. Ultraviolet - Visible spectroscopy (UV-spectroscopy)
18. Electro square porator
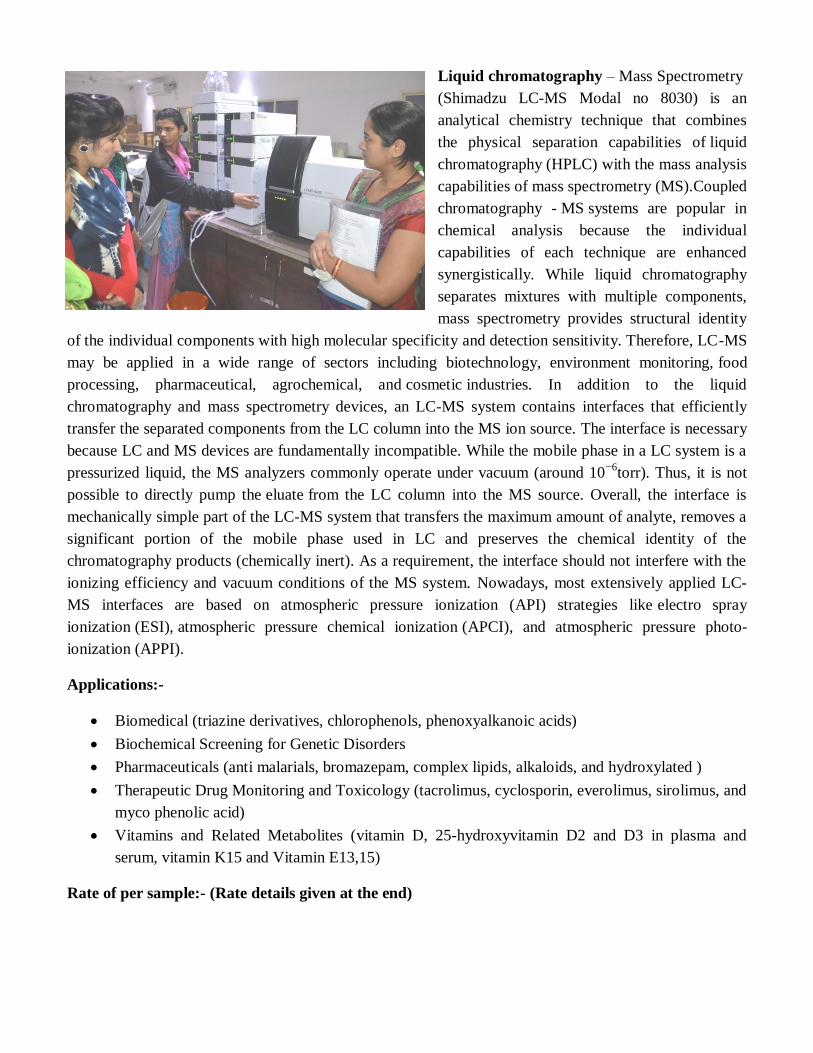
Liquid chromatography – Mass Spectrometry
(Shimadzu LC-MS Modal no 8030) is an
analytical chemistry technique that combines
the physical separation capabilities of liquid
chromatography (HPLC) with the mass analysis
capabilities of mass spectrometry (MS).Coupled
chromatography - MS systems are popular in
chemical analysis because the individual
capabilities of each technique are enhanced
synergistically. While liquid chromatography
separates mixtures with multiple components,
mass spectrometry provides structural identity
of the individual components with high molecular specificity and detection sensitivity. Therefore, LC-MS
may be applied in a wide range of sectors including biotechnology, environment monitoring, food
processing, pharmaceutical, agrochemical, and cosmetic industries. In addition to the liquid
chromatography and mass spectrometry devices, an LC-MS system contains interfaces that efficiently
transfer the separated components from the LC column into the MS ion source. The interface is necessary
because LC and MS devices are fundamentally incompatible. While the mobile phase in a LC system is a
pressurized liquid, the MS analyzers commonly operate under vacuum (around 10−6
torr). Thus, it is not
possible to directly pump the eluate from the LC column into the MS source. Overall, the interface is
mechanically simple part of the LC-MS system that transfers the maximum amount of analyte, removes a
significant portion of the mobile phase used in LC and preserves the chemical identity of the
chromatography products (chemically inert). As a requirement, the interface should not interfere with the
ionizing efficiency and vacuum conditions of the MS system. Nowadays, most extensively applied LC-
MS interfaces are based on atmospheric pressure ionization (API) strategies like electro spray
ionization (ESI), atmospheric pressure chemical ionization (APCI), and atmospheric pressure photo-
ionization (APPI).
Applications:-
Biomedical (triazine derivatives, chlorophenols, phenoxyalkanoic acids)
Biochemical Screening for Genetic Disorders
Pharmaceuticals (anti malarials, bromazepam, complex lipids, alkaloids, and hydroxylated )
Therapeutic Drug Monitoring and Toxicology (tacrolimus, cyclosporin, everolimus, sirolimus, and
myco phenolic acid)
Vitamins and Related Metabolites (vitamin D, 25-hydroxyvitamin D2 and D3 in plasma and
serum, vitamin K15 and Vitamin E13,15)
Rate of per sample:- (Rate details given at the end)
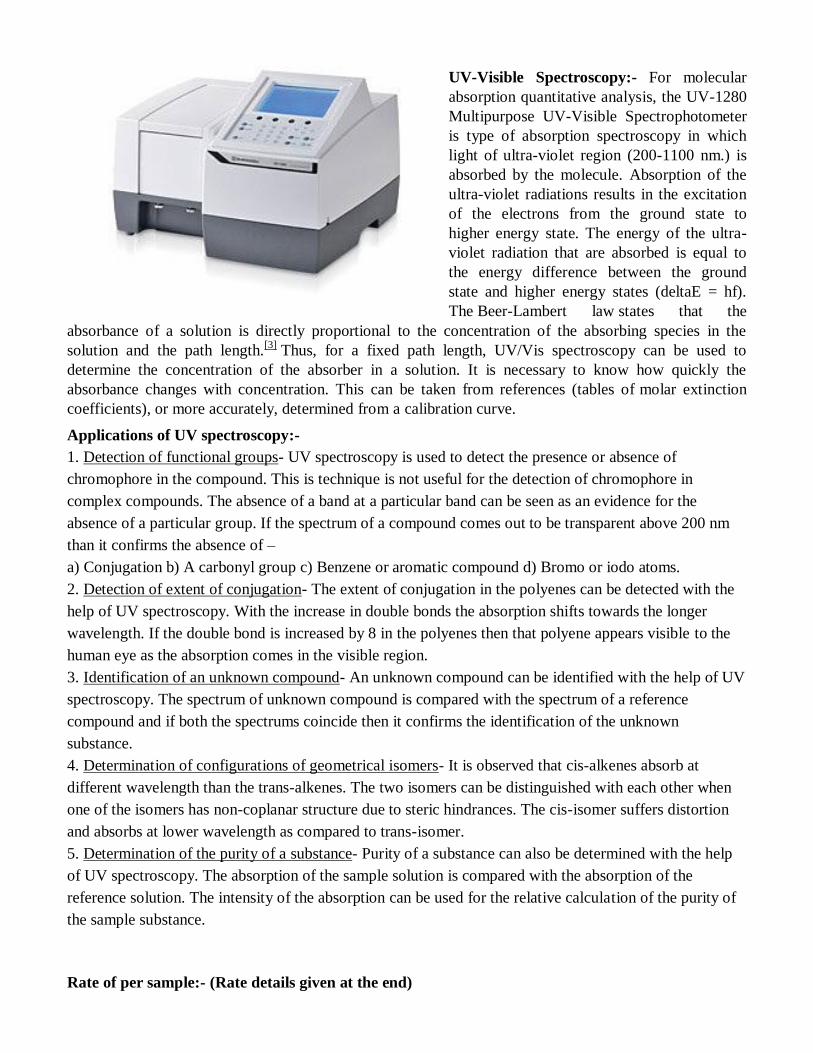
UV-Visible Spectroscopy:- For molecular
absorption quantitative analysis, the UV-1280
Multipurpose UV-Visible Spectrophotometer
is type of absorption spectroscopy in which
light of ultra-violet region (200-1100 nm.) is
absorbed by the molecule. Absorption of the
ultra-violet radiations results in the excitation
of the electrons from the ground state to
higher energy state. The energy of the ultra-
violet radiation that are absorbed is equal to
the energy difference between the ground
state and higher energy states (deltaE = hf).
The Beer-Lambert law states that the
absorbance of a solution is directly proportional to the concentration of the absorbing species in the
solution and the path length.[3]
Thus, for a fixed path length, UV/Vis spectroscopy can be used to
determine the concentration of the absorber in a solution. It is necessary to know how quickly the
absorbance changes with concentration. This can be taken from references (tables of molar extinction
coefficients), or more accurately, determined from a calibration curve.
Applications of UV spectroscopy:-
1. Detection of functional groups- UV spectroscopy is used to detect the presence or absence of
chromophore in the compound. This is technique is not useful for the detection of chromophore in
complex compounds. The absence of a band at a particular band can be seen as an evidence for the
absence of a particular group. If the spectrum of a compound comes out to be transparent above 200 nm
than it confirms the absence of –
a) Conjugation b) A carbonyl group c) Benzene or aromatic compound d) Bromo or iodo atoms.
2. Detection of extent of conjugation- The extent of conjugation in the polyenes can be detected with the
help of UV spectroscopy. With the increase in double bonds the absorption shifts towards the longer
wavelength. If the double bond is increased by 8 in the polyenes then that polyene appears visible to the
human eye as the absorption comes in the visible region.
3. Identification of an unknown compound- An unknown compound can be identified with the help of UV
spectroscopy. The spectrum of unknown compound is compared with the spectrum of a reference
compound and if both the spectrums coincide then it confirms the identification of the unknown
substance.
4. Determination of configurations of geometrical isomers- It is observed that cis-alkenes absorb at
different wavelength than the trans-alkenes. The two isomers can be distinguished with each other when
one of the isomers has non-coplanar structure due to steric hindrances. The cis-isomer suffers distortion
and absorbs at lower wavelength as compared to trans-isomer.
5. Determination of the purity of a substance- Purity of a substance can also be determined with the help
of UV spectroscopy. The absorption of the sample solution is compared with the absorption of the
reference solution. The intensity of the absorption can be used for the relative calculation of the purity of
the sample substance.
Rate of per sample:- (Rate details given at the end)
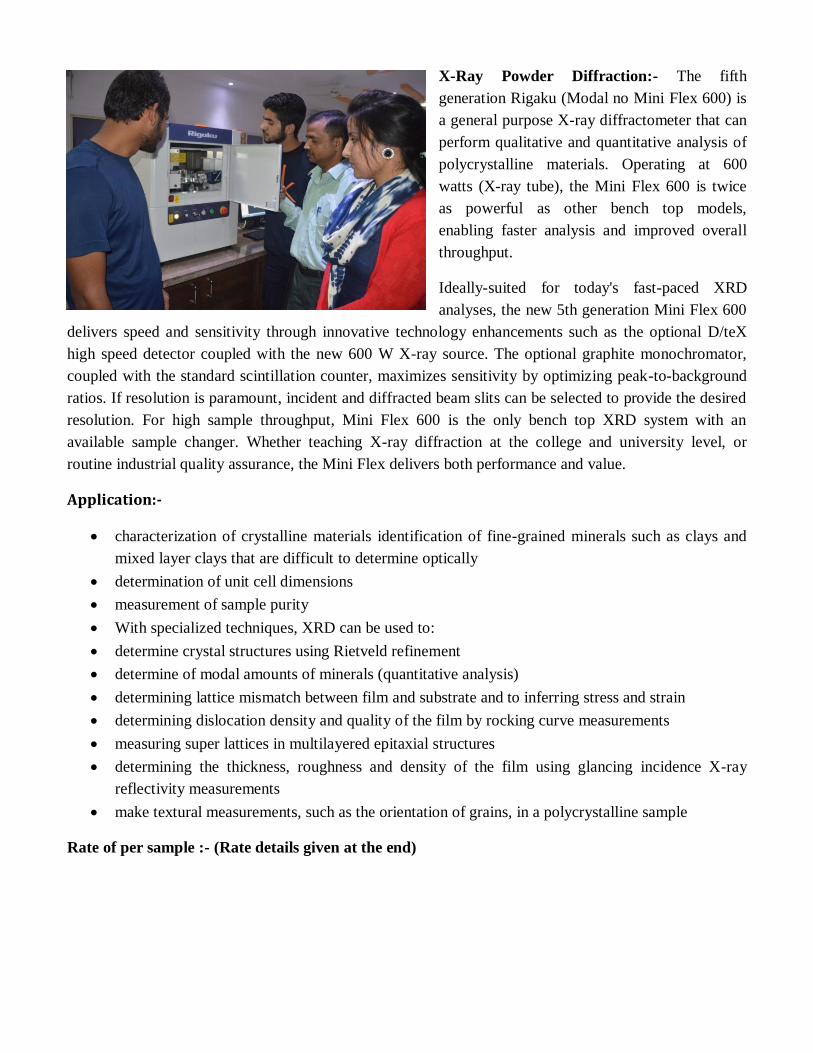
X-Ray Powder Diffraction:- The fifth
generation Rigaku (Modal no Mini Flex 600) is
a general purpose X-ray diffractometer that can
perform qualitative and quantitative analysis of
polycrystalline materials. Operating at 600
watts (X-ray tube), the Mini Flex 600 is twice
as powerful as other bench top models,
enabling faster analysis and improved overall
throughput.
Ideally-suited for today's fast-paced XRD
analyses, the new 5th generation Mini Flex 600
delivers speed and sensitivity through innovative technology enhancements such as the optional D/teX
high speed detector coupled with the new 600 W X-ray source. The optional graphite monochromator,
coupled with the standard scintillation counter, maximizes sensitivity by optimizing peak-to-background
ratios. If resolution is paramount, incident and diffracted beam slits can be selected to provide the desired
resolution. For high sample throughput, Mini Flex 600 is the only bench top XRD system with an
available sample changer. Whether teaching X-ray diffraction at the college and university level, or
routine industrial quality assurance, the Mini Flex delivers both performance and value.
Application:-
characterization of crystalline materials identification of fine-grained minerals such as clays and
mixed layer clays that are difficult to determine optically
determination of unit cell dimensions
measurement of sample purity
With specialized techniques, XRD can be used to:
determine crystal structures using Rietveld refinement
determine of modal amounts of minerals (quantitative analysis)
determining lattice mismatch between film and substrate and to inferring stress and strain
determining dislocation density and quality of the film by rocking curve measurements
measuring super lattices in multilayered epitaxial structures
determining the thickness, roughness and density of the film using glancing incidence X-ray
reflectivity measurements
make textural measurements, such as the orientation of grains, in a polycrystalline sample
Rate of per sample :- (Rate details given at the end)
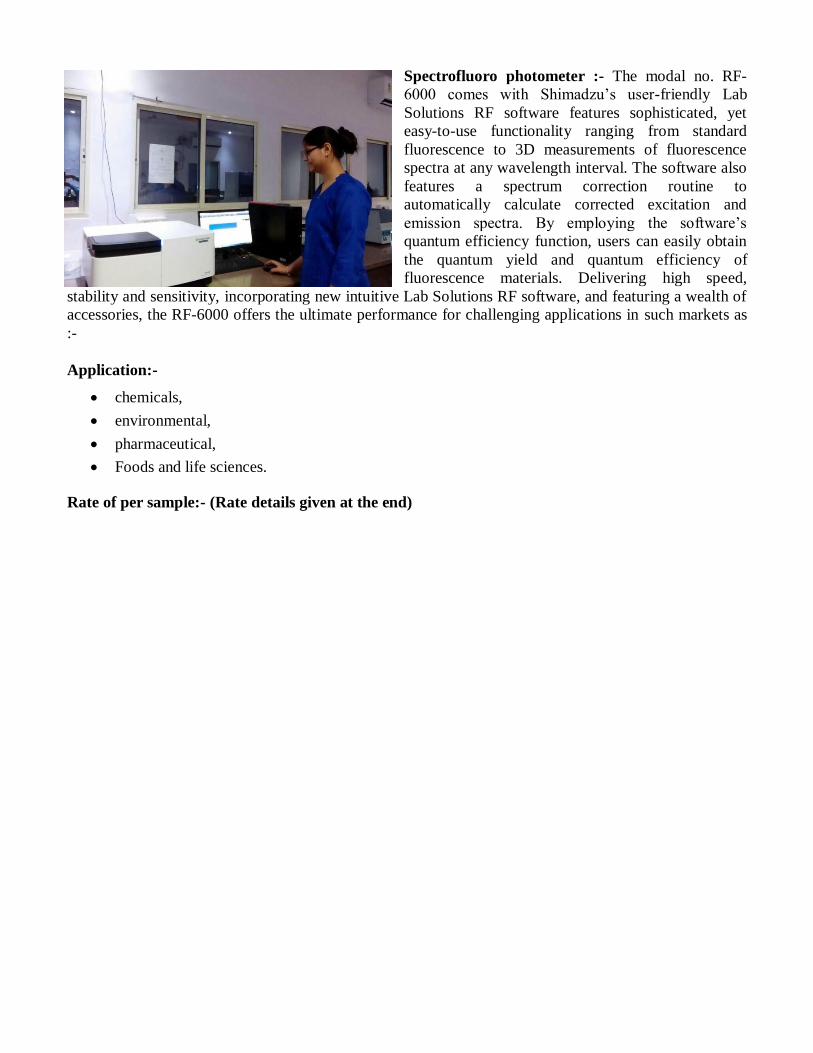
Spectrofluoro photometer :- The modal no. RF-
6000 comes with Shimadzu’s user-friendly Lab
Solutions RF software features sophisticated, yet
easy-to-use functionality ranging from standard
fluorescence to 3D measurements of fluorescence
spectra at any wavelength interval. The software also
features a spectrum correction routine to
automatically calculate corrected excitation and
emission spectra. By employing the software’s
quantum efficiency function, users can easily obtain
the quantum yield and quantum efficiency of
fluorescence materials. Delivering high speed,
stability and sensitivity, incorporating new intuitive Lab Solutions RF software, and featuring a wealth of
accessories, the RF-6000 offers the ultimate performance for challenging applications in such markets as
:-
Application:-
chemicals,
environmental,
pharmaceutical,
Foods and life sciences.
Rate of per sample:- (Rate details given at the end)
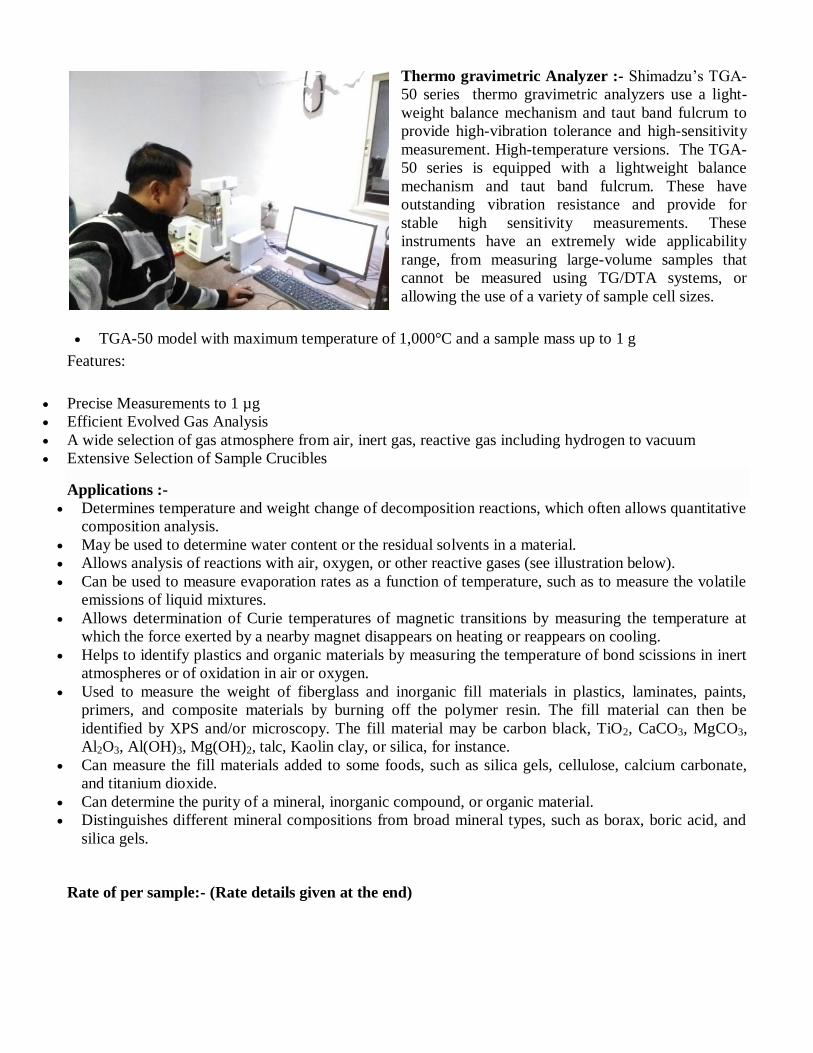
Thermo gravimetric Analyzer :- Shimadzu’s TGA-
50 series thermo gravimetric analyzers use a light-
weight balance mechanism and taut band fulcrum to
provide high-vibration tolerance and high-sensitivity
measurement. High-temperature versions. The TGA-
50 series is equipped with a lightweight balance
mechanism and taut band fulcrum. These have
outstanding vibration resistance and provide for
stable high sensitivity measurements. These
instruments have an extremely wide applicability
range, from measuring large-volume samples that
cannot be measured using TG/DTA systems, or
allowing the use of a variety of sample cell sizes.
TGA-50 model with maximum temperature of 1,000°C and a sample mass up to 1 g
Features:
Precise Measurements to 1 µg
Efficient Evolved Gas Analysis
A wide selection of gas atmosphere from air, inert gas, reactive gas including hydrogen to vacuum
Extensive Selection of Sample Crucibles
Applications :-
Determines temperature and weight change of decomposition reactions, which often allows quantitative
composition analysis.
May be used to determine water content or the residual solvents in a material.
Allows analysis of reactions with air, oxygen, or other reactive gases (see illustration below).
Can be used to measure evaporation rates as a function of temperature, such as to measure the volatile
emissions of liquid mixtures.
Allows determination of Curie temperatures of magnetic transitions by measuring the temperature at
which the force exerted by a nearby magnet disappears on heating or reappears on cooling.
Helps to identify plastics and organic materials by measuring the temperature of bond scissions in inert
atmospheres or of oxidation in air or oxygen.
Used to measure the weight of fiberglass and inorganic fill materials in plastics, laminates, paints,
primers, and composite materials by burning off the polymer resin. The fill material can then be
identified by XPS and/or microscopy. The fill material may be carbon black, TiO2, CaCO3, MgCO3,
Al2O3, Al(OH)3, Mg(OH)2, talc, Kaolin clay, or silica, for instance.
Can measure the fill materials added to some foods, such as silica gels, cellulose, calcium carbonate,
and titanium dioxide.
Can determine the purity of a mineral, inorganic compound, or organic material.
Distinguishes different mineral compositions from broad mineral types, such as borax, boric acid, and
silica gels.
Rate of per sample:- (Rate details given at the end)
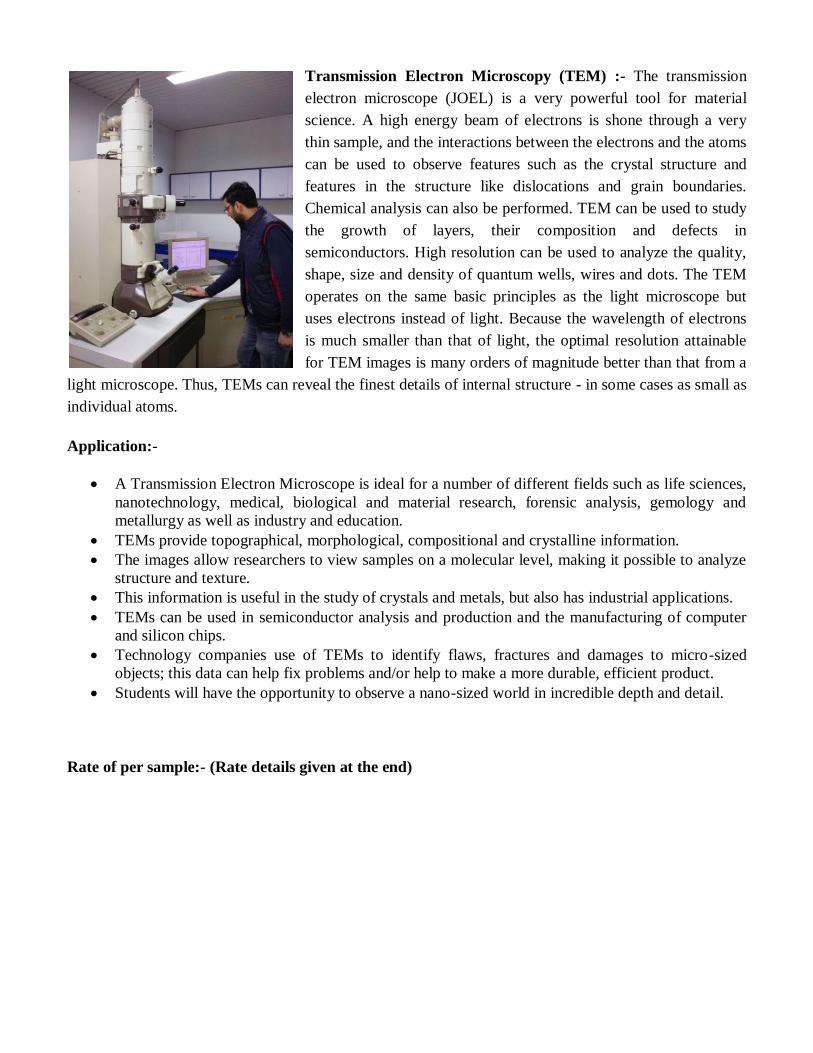
Transmission Electron Microscopy (TEM) :- The transmission
electron microscope (JOEL) is a very powerful tool for material
science. A high energy beam of electrons is shone through a very
thin sample, and the interactions between the electrons and the atoms
can be used to observe features such as the crystal structure and
features in the structure like dislocations and grain boundaries.
Chemical analysis can also be performed. TEM can be used to study
the growth of layers, their composition and defects in
semiconductors. High resolution can be used to analyze the quality,
shape, size and density of quantum wells, wires and dots. The TEM
operates on the same basic principles as the light microscope but
uses electrons instead of light. Because the wavelength of electrons
is much smaller than that of light, the optimal resolution attainable
for TEM images is many orders of magnitude better than that from a
light microscope. Thus, TEMs can reveal the finest details of internal structure - in some cases as small as
individual atoms.
Application:-
A Transmission Electron Microscope is ideal for a number of different fields such as life sciences,
nanotechnology, medical, biological and material research, forensic analysis, gemology and
metallurgy as well as industry and education.
TEMs provide topographical, morphological, compositional and crystalline information.
The images allow researchers to view samples on a molecular level, making it possible to analyze
structure and texture.
This information is useful in the study of crystals and metals, but also has industrial applications.
TEMs can be used in semiconductor analysis and production and the manufacturing of computer
and silicon chips.
Technology companies use of TEMs to identify flaws, fractures and damages to micro-sized
objects; this data can help fix problems and/or help to make a more durable, efficient product.
Students will have the opportunity to observe a nano-sized world in incredible depth and detail.
Rate of per sample:- (Rate details given at the end)
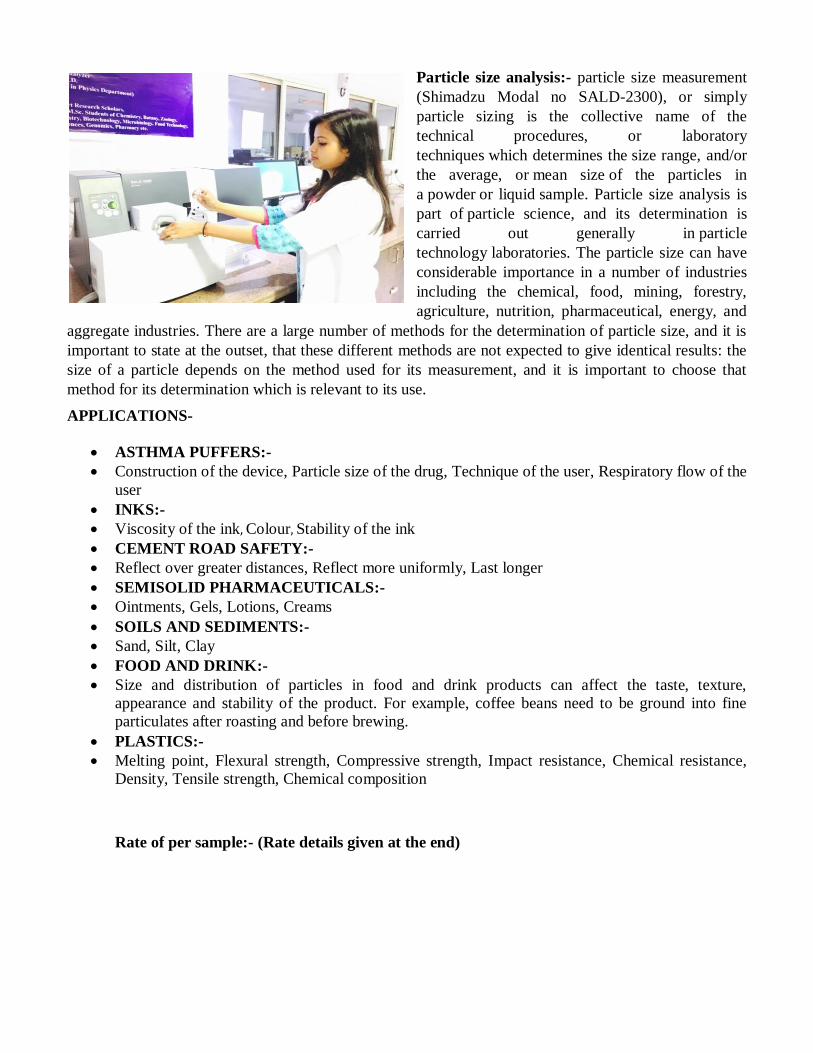
Particle size analysis:- particle size measurement
(Shimadzu Modal no SALD-2300), or simply
particle sizing is the collective name of the
technical procedures, or laboratory
techniques which determines the size range, and/or
the average, or mean size of the particles in
a powder or liquid sample. Particle size analysis is
part of particle science, and its determination is
carried out generally in particle
technology laboratories. The particle size can have
considerable importance in a number of industries
including the chemical, food, mining, forestry,
agriculture, nutrition, pharmaceutical, energy, and
aggregate industries. There are a large number of methods for the determination of particle size, and it is
important to state at the outset, that these different methods are not expected to give identical results: the
size of a particle depends on the method used for its measurement, and it is important to choose that
method for its determination which is relevant to its use.
APPLICATIONS-
ASTHMA PUFFERS:-
Construction of the device, Particle size of the drug, Technique of the user, Respiratory flow of the
user
INKS:-
Viscosity of the ink, Colour, Stability of the ink
CEMENT ROAD SAFETY:-
Reflect over greater distances, Reflect more uniformly, Last longer
SEMISOLID PHARMACEUTICALS:-
Ointments, Gels, Lotions, Creams
SOILS AND SEDIMENTS:-
Sand, Silt, Clay
FOOD AND DRINK:-
Size and distribution of particles in food and drink products can affect the taste, texture,
appearance and stability of the product. For example, coffee beans need to be ground into fine
particulates after roasting and before brewing.
PLASTICS:-
Melting point, Flexural strength, Compressive strength, Impact resistance, Chemical resistance,
Density, Tensile strength, Chemical composition
Rate of per sample:- (Rate details given at the end)
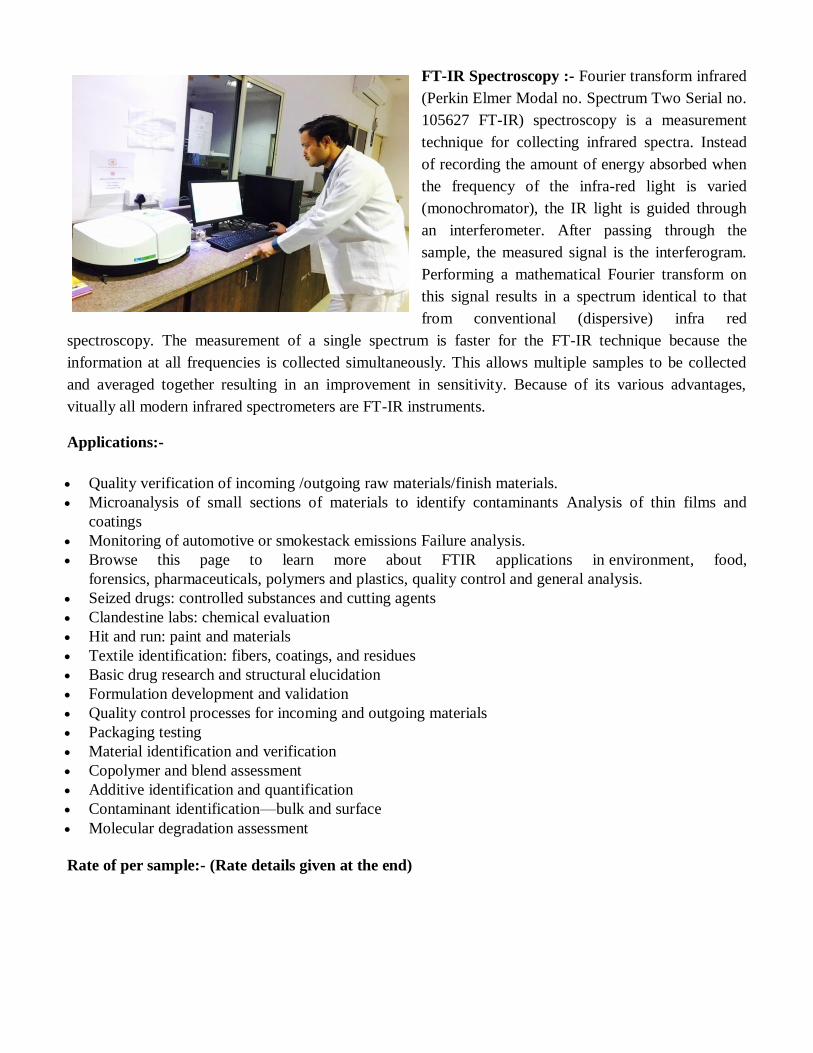
FT-IR Spectroscopy :- Fourier transform infrared
(Perkin Elmer Modal no. Spectrum Two Serial no.
105627 FT-IR) spectroscopy is a measurement
technique for collecting infrared spectra. Instead
of recording the amount of energy absorbed when
the frequency of the infra-red light is varied
(monochromator), the IR light is guided through
an interferometer. After passing through the
sample, the measured signal is the interferogram.
Performing a mathematical Fourier transform on
this signal results in a spectrum identical to that
from conventional (dispersive) infra red
spectroscopy. The measurement of a single spectrum is faster for the FT-IR technique because the
information at all frequencies is collected simultaneously. This allows multiple samples to be collected
and averaged together resulting in an improvement in sensitivity. Because of its various advantages,
vitually all modern infrared spectrometers are FT-IR instruments.
Applications:-
Quality verification of incoming /outgoing raw materials/finish materials.
Microanalysis of small sections of materials to identify contaminants Analysis of thin films and
coatings
Monitoring of automotive or smokestack emissions Failure analysis.
Browse this page to learn more about FTIR applications in environment, food,
forensics, pharmaceuticals, polymers and plastics, quality control and general analysis.
Seized drugs: controlled substances and cutting agents
Clandestine labs: chemical evaluation
Hit and run: paint and materials
Textile identification: fibers, coatings, and residues
Basic drug research and structural elucidation
Formulation development and validation
Quality control processes for incoming and outgoing materials
Packaging testing
Material identification and verification
Copolymer and blend assessment
Additive identification and quantification
Contaminant identification—bulk and surface
Molecular degradation assessment
Rate of per sample:- (Rate details given at the end)
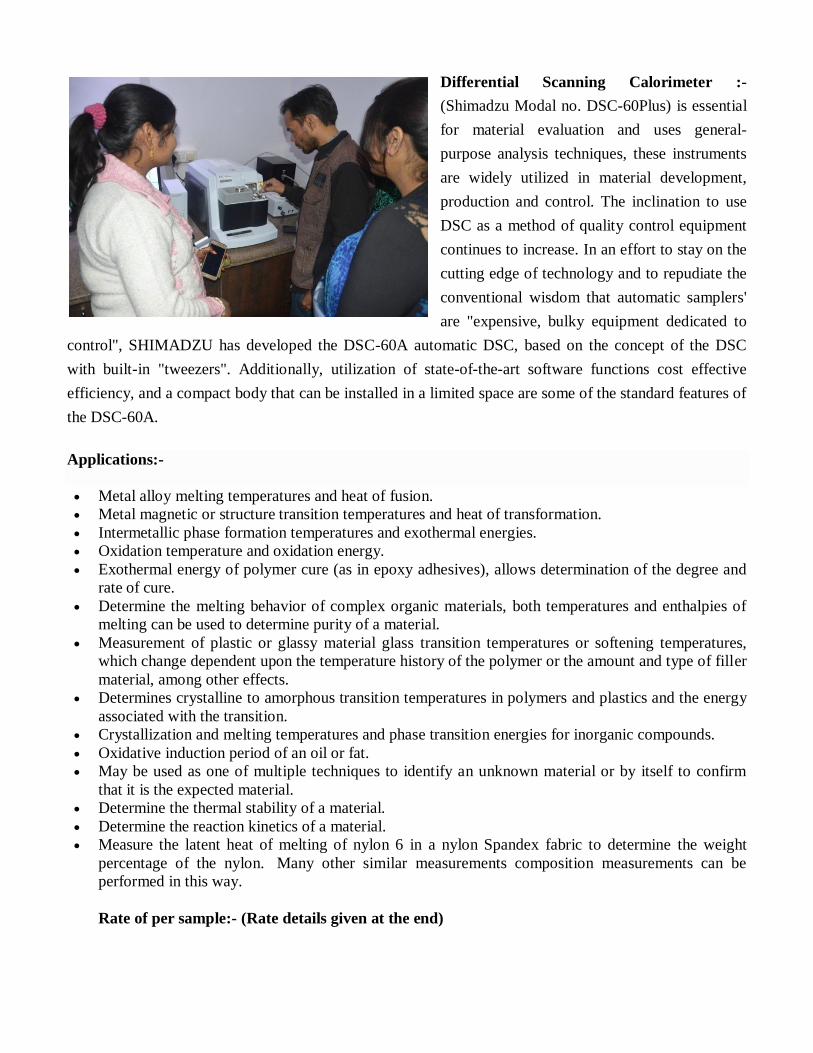
Differential Scanning Calorimeter :-
(Shimadzu Modal no. DSC-60Plus) is essential
for material evaluation and uses general-
purpose analysis techniques, these instruments
are widely utilized in material development,
production and control. The inclination to use
DSC as a method of quality control equipment
continues to increase. In an effort to stay on the
cutting edge of technology and to repudiate the
conventional wisdom that automatic samplers'
are "expensive, bulky equipment dedicated to
control", SHIMADZU has developed the DSC-60A automatic DSC, based on the concept of the DSC
with built-in "tweezers". Additionally, utilization of state-of-the-art software functions cost effective
efficiency, and a compact body that can be installed in a limited space are some of the standard features of
the DSC-60A.
Applications:-
Metal alloy melting temperatures and heat of fusion.
Metal magnetic or structure transition temperatures and heat of transformation.
Intermetallic phase formation temperatures and exothermal energies.
Oxidation temperature and oxidation energy.
Exothermal energy of polymer cure (as in epoxy adhesives), allows determination of the degree and
rate of cure.
Determine the melting behavior of complex organic materials, both temperatures and enthalpies of
melting can be used to determine purity of a material.
Measurement of plastic or glassy material glass transition temperatures or softening temperatures,
which change dependent upon the temperature history of the polymer or the amount and type of filler
material, among other effects.
Determines crystalline to amorphous transition temperatures in polymers and plastics and the energy
associated with the transition.
Crystallization and melting temperatures and phase transition energies for inorganic compounds.
Oxidative induction period of an oil or fat.
May be used as one of multiple techniques to identify an unknown material or by itself to confirm
that it is the expected material.
Determine the thermal stability of a material.
Determine the reaction kinetics of a material.
Measure the latent heat of melting of nylon 6 in a nylon Spandex fabric to determine the weight
percentage of the nylon. Many other similar measurements composition measurements can be
performed in this way.
Rate of per sample:- (Rate details given at the end)
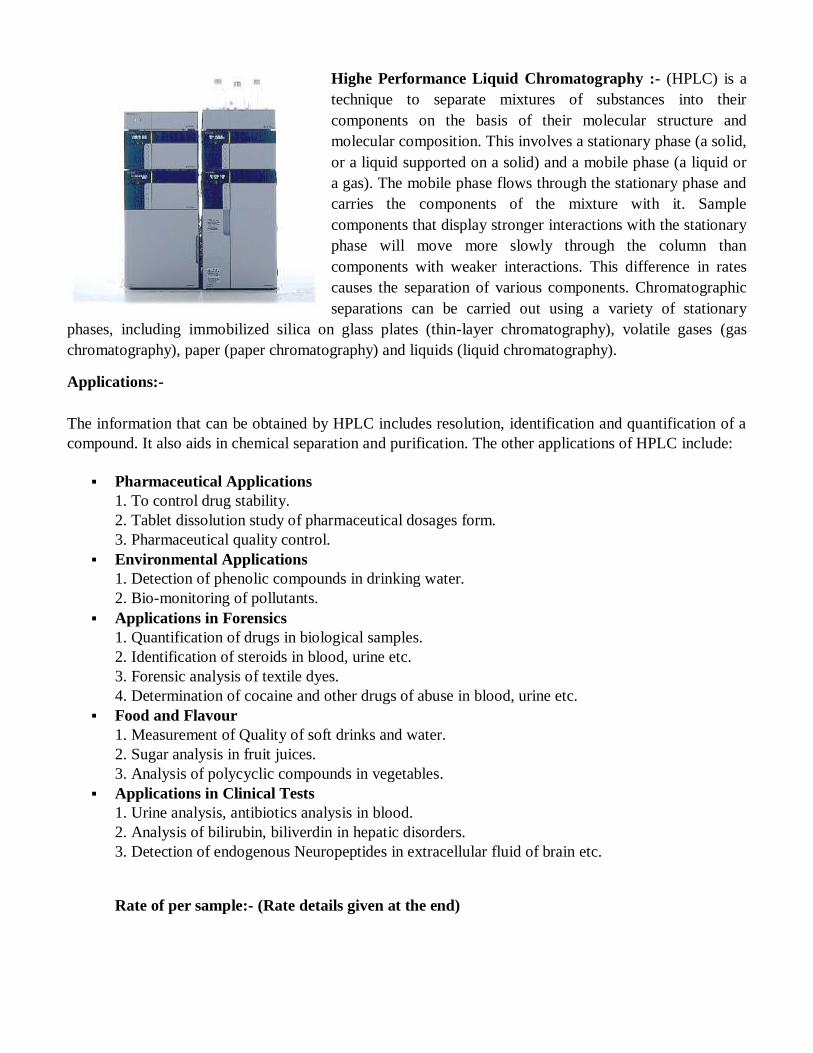
Highe Performance Liquid Chromatography :- (HPLC) is a
technique to separate mixtures of substances into their
components on the basis of their molecular structure and
molecular composition. This involves a stationary phase (a solid,
or a liquid supported on a solid) and a mobile phase (a liquid or
a gas). The mobile phase flows through the stationary phase and
carries the components of the mixture with it. Sample
components that display stronger interactions with the stationary
phase will move more slowly through the column than
components with weaker interactions. This difference in rates
causes the separation of various components. Chromatographic
separations can be carried out using a variety of stationary
phases, including immobilized silica on glass plates (thin-layer chromatography), volatile gases (gas
chromatography), paper (paper chromatography) and liquids (liquid chromatography).
Applications:-
The information that can be obtained by HPLC includes resolution, identification and quantification of a
compound. It also aids in chemical separation and purification. The other applications of HPLC include:
Pharmaceutical Applications
1. To control drug stability.
2. Tablet dissolution study of pharmaceutical dosages form.
3. Pharmaceutical quality control.
Environmental Applications
1. Detection of phenolic compounds in drinking water.
2. Bio-monitoring of pollutants.
Applications in Forensics
1. Quantification of drugs in biological samples.
2. Identification of steroids in blood, urine etc.
3. Forensic analysis of textile dyes.
4. Determination of cocaine and other drugs of abuse in blood, urine etc.
Food and Flavour
1. Measurement of Quality of soft drinks and water.
2. Sugar analysis in fruit juices.
3. Analysis of polycyclic compounds in vegetables.
Applications in Clinical Tests
1. Urine analysis, antibiotics analysis in blood.
2. Analysis of bilirubin, biliverdin in hepatic disorders.
3. Detection of endogenous Neuropeptides in extracellular fluid of brain etc.
Rate of per sample:- (Rate details given at the end)
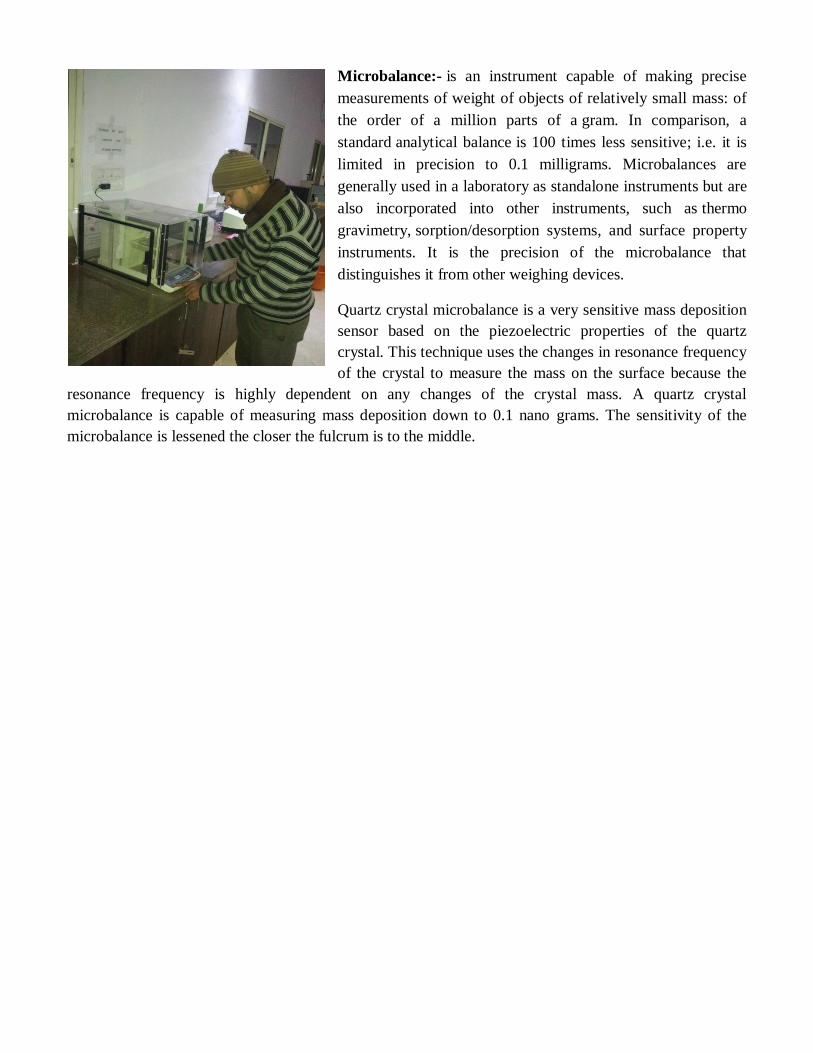
Microbalance:- is an instrument capable of making precise
measurements of weight of objects of relatively small mass: of
the order of a million parts of a gram. In comparison, a
standard analytical balance is 100 times less sensitive; i.e. it is
limited in precision to 0.1 milligrams. Microbalances are
generally used in a laboratory as standalone instruments but are
also incorporated into other instruments, such as thermo
gravimetry, sorption/desorption systems, and surface property
instruments. It is the precision of the microbalance that
distinguishes it from other weighing devices.
Quartz crystal microbalance is a very sensitive mass deposition
sensor based on the piezoelectric properties of the quartz
crystal. This technique uses the changes in resonance frequency
of the crystal to measure the mass on the surface because the
resonance frequency is highly dependent on any changes of the crystal mass. A quartz crystal
microbalance is capable of measuring mass deposition down to 0.1 nano grams. The sensitivity of the
microbalance is lessened the closer the fulcrum is to the middle.
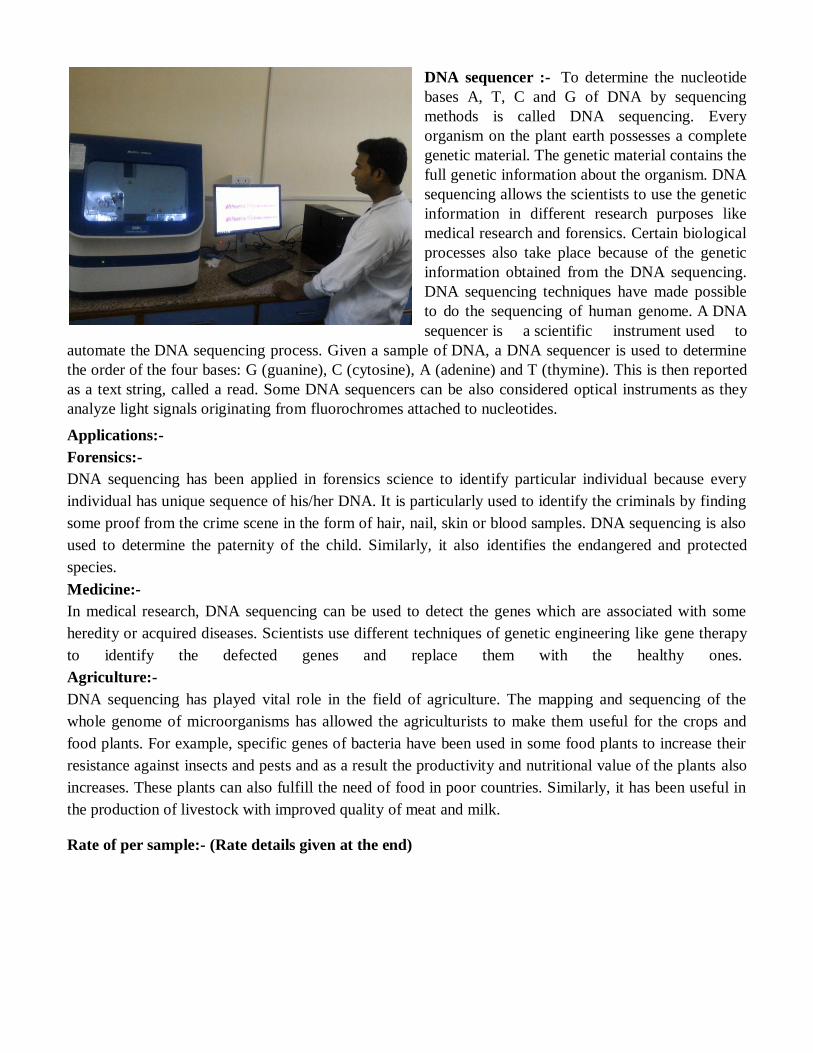
DNA sequencer :- To determine the nucleotide
bases A, T, C and G of DNA by sequencing
methods is called DNA sequencing. Every
organism on the plant earth possesses a complete
genetic material. The genetic material contains the
full genetic information about the organism. DNA
sequencing allows the scientists to use the genetic
information in different research purposes like
medical research and forensics. Certain biological
processes also take place because of the genetic
information obtained from the DNA sequencing.
DNA sequencing techniques have made possible
to do the sequencing of human genome. A DNA
sequencer is a scientific instrument used to
automate the DNA sequencing process. Given a sample of DNA, a DNA sequencer is used to determine
the order of the four bases: G (guanine), C (cytosine), A (adenine) and T (thymine). This is then reported
as a text string, called a read. Some DNA sequencers can be also considered optical instruments as they
analyze light signals originating from fluorochromes attached to nucleotides.
Applications:-
Forensics:-
DNA sequencing has been applied in forensics science to identify particular individual because every
individual has unique sequence of his/her DNA. It is particularly used to identify the criminals by finding
some proof from the crime scene in the form of hair, nail, skin or blood samples. DNA sequencing is also
used to determine the paternity of the child. Similarly, it also identifies the endangered and protected
species.
Medicine:-
In medical research, DNA sequencing can be used to detect the genes which are associated with some
heredity or acquired diseases. Scientists use different techniques of genetic engineering like gene therapy
to identify the defected genes and replace them with the healthy ones.
Agriculture:-
DNA sequencing has played vital role in the field of agriculture. The mapping and sequencing of the
whole genome of microorganisms has allowed the agriculturists to make them useful for the crops and
food plants. For example, specific genes of bacteria have been used in some food plants to increase their
resistance against insects and pests and as a result the productivity and nutritional value of the plants also
increases. These plants can also fulfill the need of food in poor countries. Similarly, it has been useful in
the production of livestock with improved quality of meat and milk.
Rate of per sample:- (Rate details given at the end)
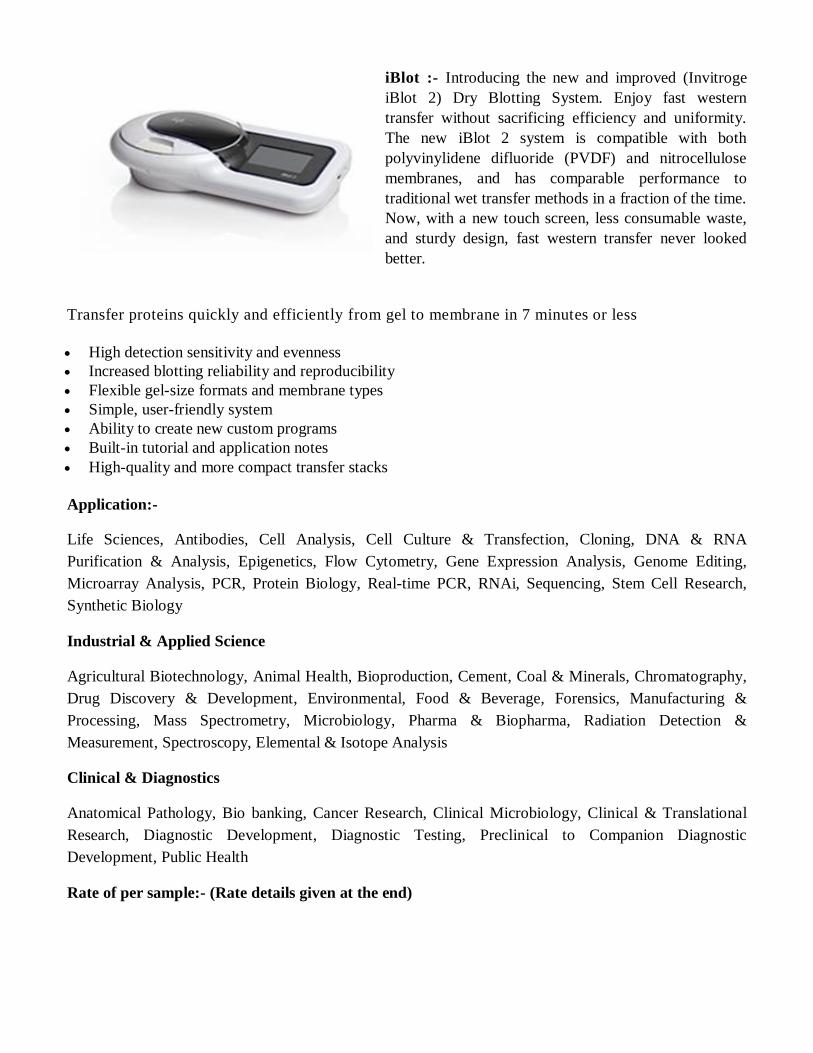
iBlot :- Introducing the new and improved (Invitroge
iBlot 2) Dry Blotting System. Enjoy fast western
transfer without sacrificing efficiency and uniformity.
The new iBlot 2 system is compatible with both
polyvinylidene difluoride (PVDF) and nitrocellulose
membranes, and has comparable performance to
traditional wet transfer methods in a fraction of the time.
Now, with a new touch screen, less consumable waste,
and sturdy design, fast western transfer never looked
better.
Transfer proteins quickly and efficiently from gel to membrane in 7 minutes or less
High detection sensitivity and evenness
Increased blotting reliability and reproducibility
Flexible gel-size formats and membrane types
Simple, user-friendly system
Ability to create new custom programs
Built-in tutorial and application notes
High-quality and more compact transfer stacks
Application:-
Life Sciences, Antibodies, Cell Analysis, Cell Culture & Transfection, Cloning, DNA & RNA
Purification & Analysis, Epigenetics, Flow Cytometry, Gene Expression Analysis, Genome Editing,
Microarray Analysis, PCR, Protein Biology, Real-time PCR, RNAi, Sequencing, Stem Cell Research,
Synthetic Biology
Industrial & Applied Science
Agricultural Biotechnology, Animal Health, Bioproduction, Cement, Coal & Minerals, Chromatography,
Drug Discovery & Development, Environmental, Food & Beverage, Forensics, Manufacturing &
Processing, Mass Spectrometry, Microbiology, Pharma & Biopharma, Radiation Detection &
Measurement, Spectroscopy, Elemental & Isotope Analysis
Clinical & Diagnostics
Anatomical Pathology, Bio banking, Cancer Research, Clinical Microbiology, Clinical & Translational
Research, Diagnostic Development, Diagnostic Testing, Preclinical to Companion Diagnostic
Development, Public Health
Rate of per sample:- (Rate details given at the end)
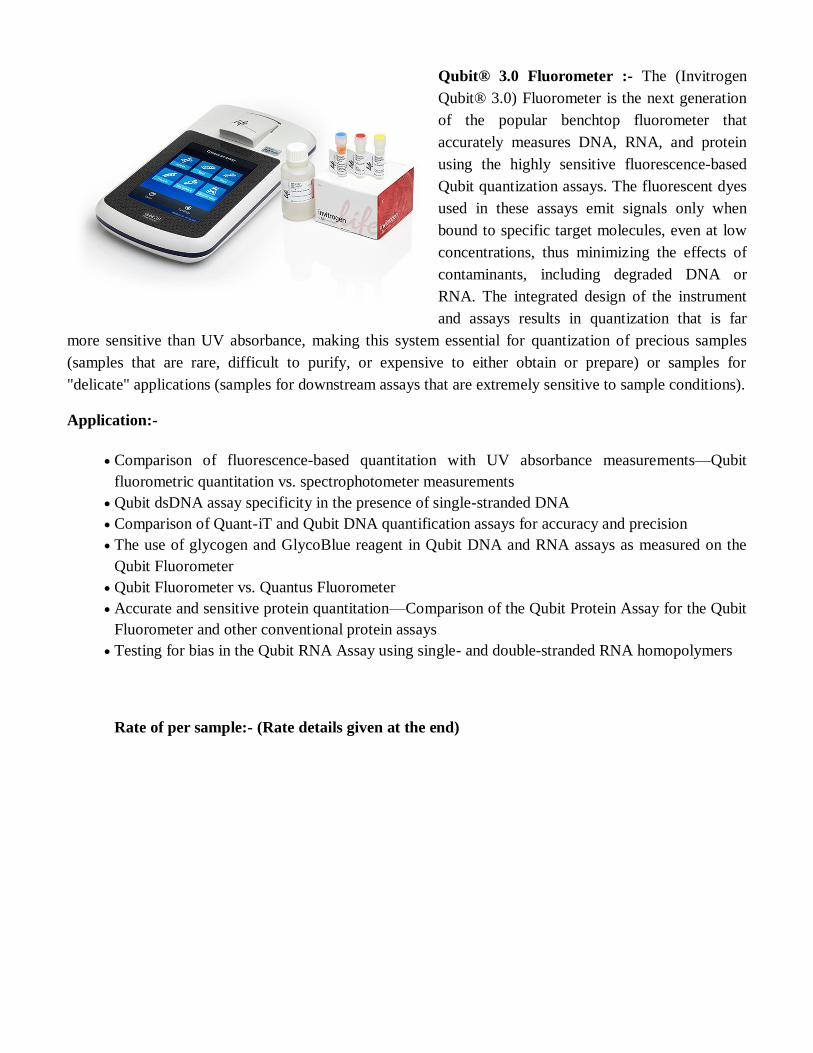
Qubit® 3.0 Fluorometer :- The (Invitrogen
Qubit® 3.0) Fluorometer is the next generation
of the popular benchtop fluorometer that
accurately measures DNA, RNA, and protein
using the highly sensitive fluorescence-based
Qubit quantization assays. The fluorescent dyes
used in these assays emit signals only when
bound to specific target molecules, even at low
concentrations, thus minimizing the effects of
contaminants, including degraded DNA or
RNA. The integrated design of the instrument
and assays results in quantization that is far
more sensitive than UV absorbance, making this system essential for quantization of precious samples
(samples that are rare, difficult to purify, or expensive to either obtain or prepare) or samples for
"delicate" applications (samples for downstream assays that are extremely sensitive to sample conditions).
Application:-
Comparison of fluorescence-based quantitation with UV absorbance measurements—Qubit
fluorometric quantitation vs. spectrophotometer measurements
Qubit dsDNA assay specificity in the presence of single-stranded DNA
Comparison of Quant-iT and Qubit DNA quantification assays for accuracy and precision
The use of glycogen and GlycoBlue reagent in Qubit DNA and RNA assays as measured on the
Qubit Fluorometer
Qubit Fluorometer vs. Quantus Fluorometer
Accurate and sensitive protein quantitation—Comparison of the Qubit Protein Assay for the Qubit
Fluorometer and other conventional protein assays
Testing for bias in the Qubit RNA Assay using single- and double-stranded RNA homopolymers
Rate of per sample:- (Rate details given at the end)
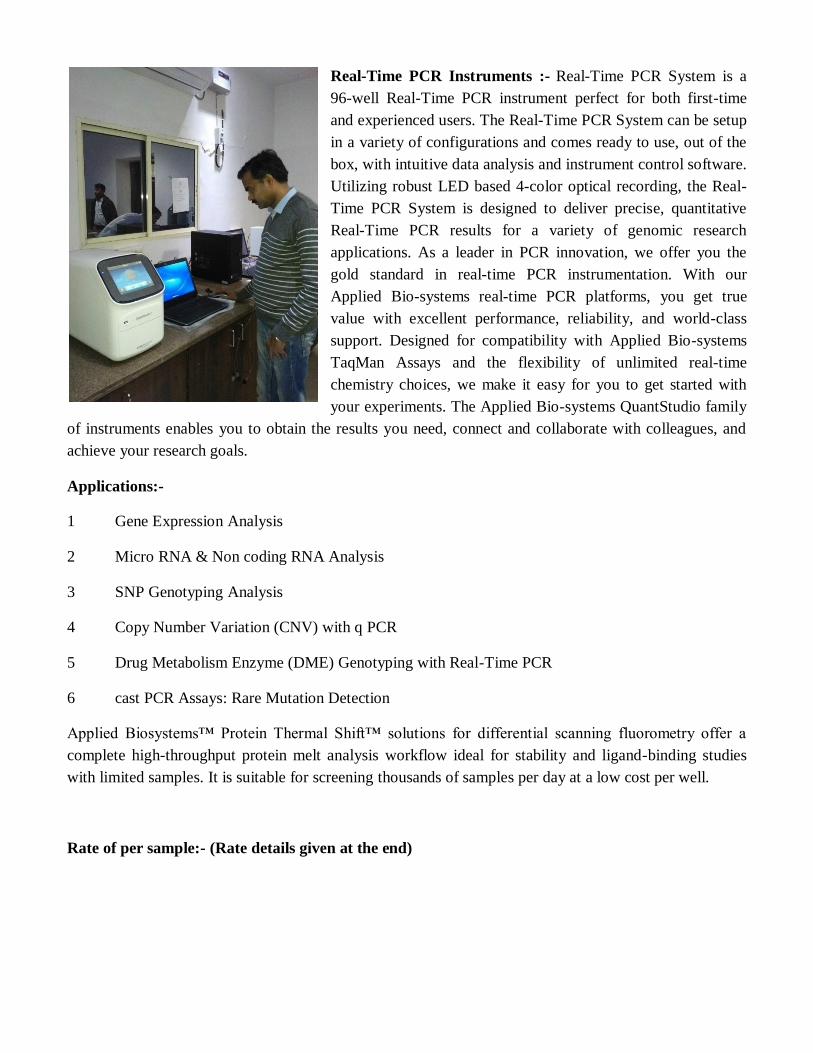
Real-Time PCR Instruments :- Real-Time PCR System is a
96-well Real-Time PCR instrument perfect for both first-time
and experienced users. The Real-Time PCR System can be setup
in a variety of configurations and comes ready to use, out of the
box, with intuitive data analysis and instrument control software.
Utilizing robust LED based 4-color optical recording, the Real-
Time PCR System is designed to deliver precise, quantitative
Real-Time PCR results for a variety of genomic research
applications. As a leader in PCR innovation, we offer you the
gold standard in real-time PCR instrumentation. With our
Applied Bio-systems real-time PCR platforms, you get true
value with excellent performance, reliability, and world-class
support. Designed for compatibility with Applied Bio-systems
TaqMan Assays and the flexibility of unlimited real-time
chemistry choices, we make it easy for you to get started with
your experiments. The Applied Bio-systems QuantStudio family
of instruments enables you to obtain the results you need, connect and collaborate with colleagues, and
achieve your research goals.
Applications:-
1 Gene Expression Analysis
2 Micro RNA & Non coding RNA Analysis
3 SNP Genotyping Analysis
4 Copy Number Variation (CNV) with q PCR
5 Drug Metabolism Enzyme (DME) Genotyping with Real-Time PCR
6 cast PCR Assays: Rare Mutation Detection
Applied Biosystems™ Protein Thermal Shift™ solutions for differential scanning fluorometry offer a
complete high-throughput protein melt analysis workflow ideal for stability and ligand-binding studies
with limited samples. It is suitable for screening thousands of samples per day at a low cost per well.
Rate of per sample:- (Rate details given at the end)
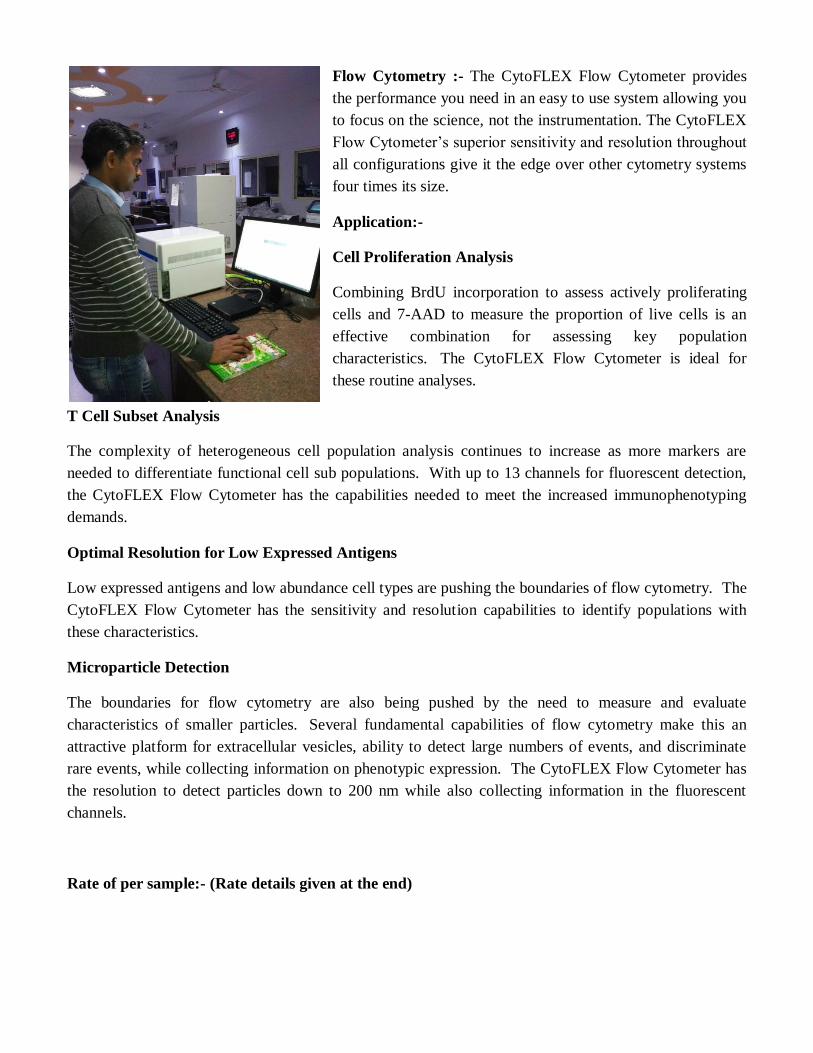
Flow Cytometry :- The CytoFLEX Flow Cytometer provides
the performance you need in an easy to use system allowing you
to focus on the science, not the instrumentation. The CytoFLEX
Flow Cytometer’s superior sensitivity and resolution throughout
all configurations give it the edge over other cytometry systems
four times its size.
Application:-
Cell Proliferation Analysis
Combining BrdU incorporation to assess actively proliferating
cells and 7-AAD to measure the proportion of live cells is an
effective combination for assessing key population
characteristics. The CytoFLEX Flow Cytometer is ideal for
these routine analyses.
T Cell Subset Analysis
The complexity of heterogeneous cell population analysis continues to increase as more markers are
needed to differentiate functional cell sub populations. With up to 13 channels for fluorescent detection,
the CytoFLEX Flow Cytometer has the capabilities needed to meet the increased immunophenotyping
demands.
Optimal Resolution for Low Expressed Antigens
Low expressed antigens and low abundance cell types are pushing the boundaries of flow cytometry. The
CytoFLEX Flow Cytometer has the sensitivity and resolution capabilities to identify populations with
these characteristics.
Microparticle Detection
The boundaries for flow cytometry are also being pushed by the need to measure and evaluate
characteristics of smaller particles. Several fundamental capabilities of flow cytometry make this an
attractive platform for extracellular vesicles, ability to detect large numbers of events, and discriminate
rare events, while collecting information on phenotypic expression. The CytoFLEX Flow Cytometer has
the resolution to detect particles down to 200 nm while also collecting information in the fluorescent
channels.
Rate of per sample:- (Rate details given at the end)
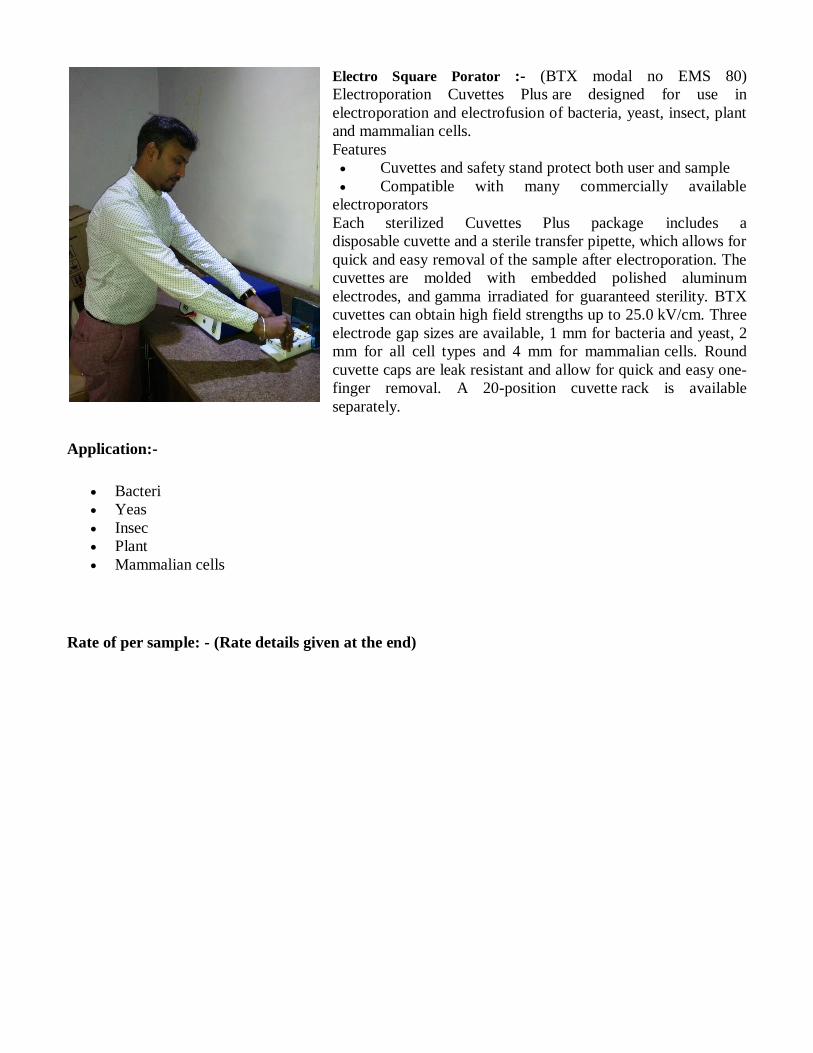
Electro Square Porator :- (BTX modal no EMS 80)
Electroporation Cuvettes Plus are designed for use in
electroporation and electrofusion of bacteria, yeast, insect, plant
and mammalian cells.
Features
Cuvettes and safety stand protect both user and sample
Compatible with many commercially available
electroporators
Each sterilized Cuvettes Plus package includes a
disposable cuvette and a sterile transfer pipette, which allows for
quick and easy removal of the sample after electroporation. The
cuvettes are molded with embedded polished aluminum
electrodes, and gamma irradiated for guaranteed sterility. BTX
cuvettes can obtain high field strengths up to 25.0 kV/cm. Three
electrode gap sizes are available, 1 mm for bacteria and yeast, 2
mm for all cell types and 4 mm for mammalian cells. Round
cuvette caps are leak resistant and allow for quick and easy one-
finger removal. A 20-position cuvette rack is available
separately.
Application:-
Bacteri
Yeas
Insec
Plant
Mammalian cells
Rate of per sample: - (Rate details given at the end)
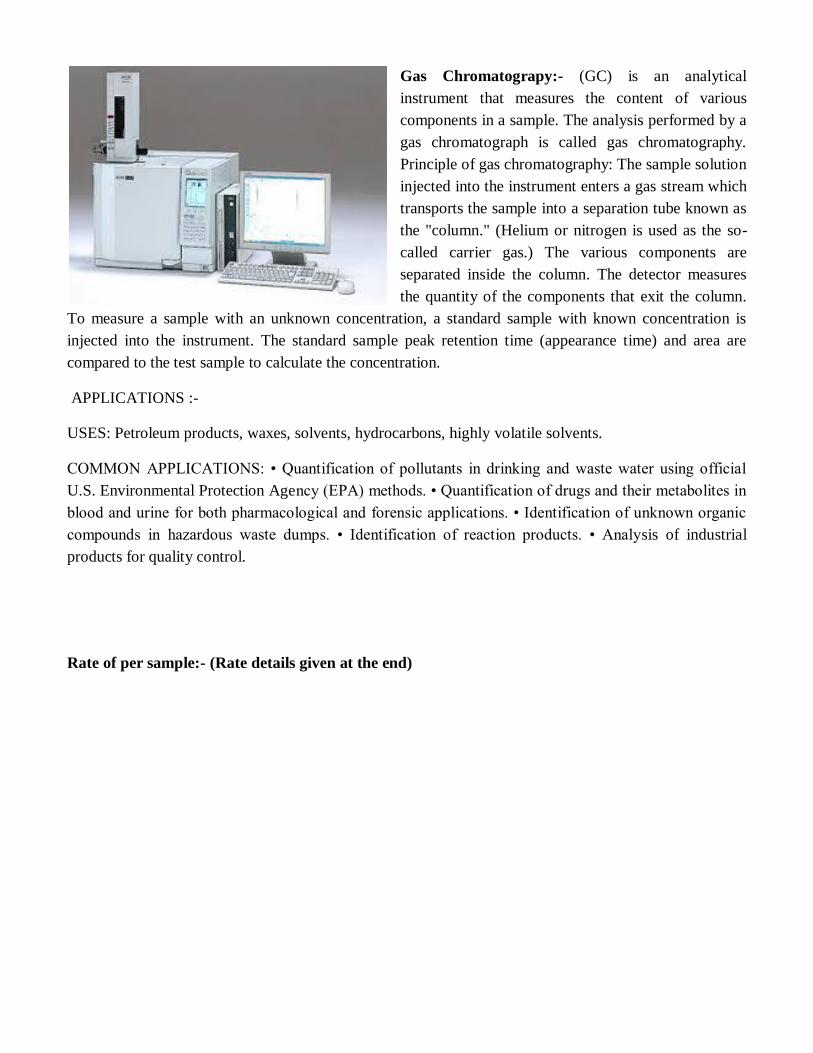
Gas Chromatograpy:- (GC) is an analytical
instrument that measures the content of various
components in a sample. The analysis performed by a
gas chromatograph is called gas chromatography.
Principle of gas chromatography: The sample solution
injected into the instrument enters a gas stream which
transports the sample into a separation tube known as
the "column." (Helium or nitrogen is used as the so-
called carrier gas.) The various components are
separated inside the column. The detector measures
the quantity of the components that exit the column.
To measure a sample with an unknown concentration, a standard sample with known concentration is
injected into the instrument. The standard sample peak retention time (appearance time) and area are
compared to the test sample to calculate the concentration.
APPLICATIONS :-
USES: Petroleum products, waxes, solvents, hydrocarbons, highly volatile solvents.
COMMON APPLICATIONS: • Quantification of pollutants in drinking and waste water using official
U.S. Environmental Protection Agency (EPA) methods. • Quantification of drugs and their metabolites in
blood and urine for both pharmacological and forensic applications. • Identification of unknown organic
compounds in hazardous waste dumps. • Identification of reaction products. • Analysis of industrial
products for quality control.
Rate of per sample:- (Rate details given at the end)
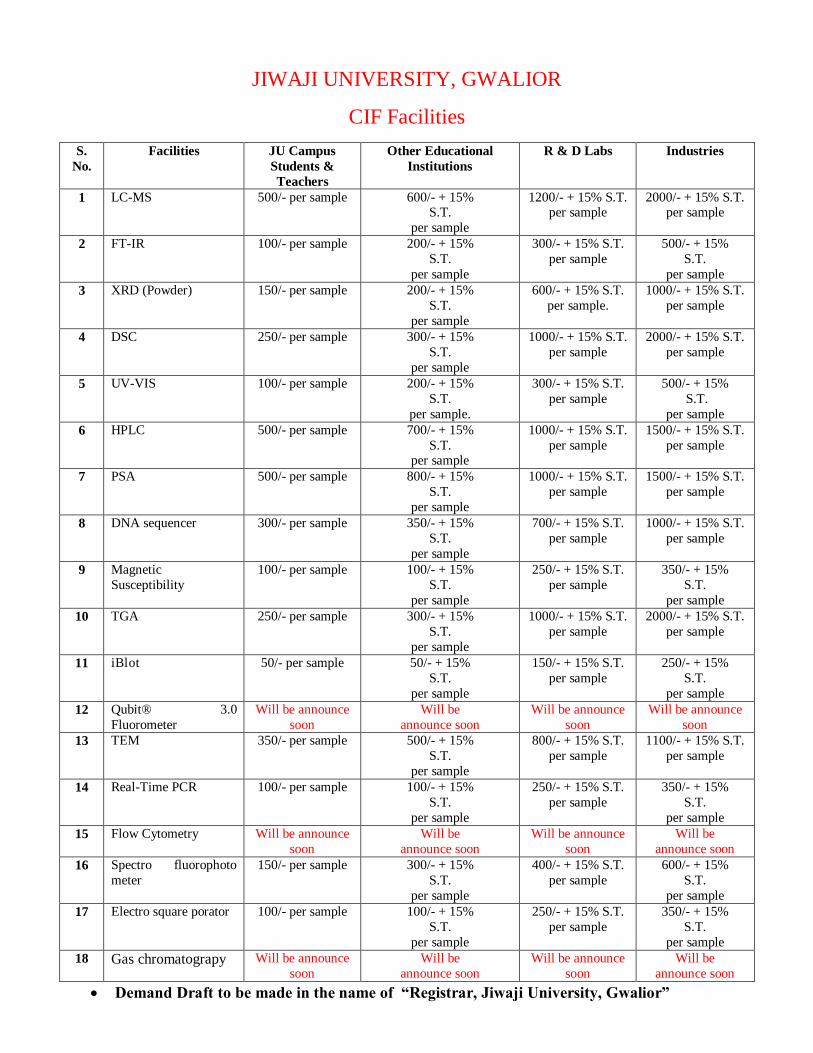
JIWAJI UNIVERSITY, GWALIOR
CIF Facilities
S.
No.
Facilities JU Campus
Students &
Teachers
Other Educational
Institutions
R & D Labs Industries
1 LC-MS 500/- per sample 600/- + 15% S.T.
per sample
1200/- + 15% S.T. per sample
2000/- + 15% S.T. per sample
2 FT-IR 100/- per sample 200/- + 15%
S.T.
per sample
300/- + 15% S.T.
per sample
500/- + 15%
S.T.
per sample
3 XRD (Powder) 150/- per sample 200/- + 15%
S.T.
per sample
600/- + 15% S.T.
per sample.
1000/- + 15% S.T.
per sample
4 DSC 250/- per sample 300/- + 15%
S.T.
per sample
1000/- + 15% S.T.
per sample
2000/- + 15% S.T.
per sample
5 UV-VIS 100/- per sample 200/- + 15%
S.T.
per sample.
300/- + 15% S.T.
per sample
500/- + 15%
S.T.
per sample
6 HPLC 500/- per sample 700/- + 15%
S.T. per sample
1000/- + 15% S.T.
per sample
1500/- + 15% S.T.
per sample
7 PSA 500/- per sample 800/- + 15%
S.T.
per sample
1000/- + 15% S.T.
per sample
1500/- + 15% S.T.
per sample
8 DNA sequencer 300/- per sample 350/- + 15%
S.T.
per sample
700/- + 15% S.T.
per sample
1000/- + 15% S.T.
per sample
9 Magnetic
Susceptibility
100/- per sample 100/- + 15%
S.T.
per sample
250/- + 15% S.T.
per sample
350/- + 15%
S.T.
per sample
10 TGA 250/- per sample 300/- + 15%
S.T.
per sample
1000/- + 15% S.T.
per sample
2000/- + 15% S.T.
per sample
11 iBlot 50/- per sample 50/- + 15%
S.T.
per sample
150/- + 15% S.T.
per sample
250/- + 15%
S.T.
per sample
12 Qubit® 3.0
Fluorometer
Will be announce
soon
Will be
announce soon
Will be announce
soon
Will be announce
soon
13 TEM 350/- per sample 500/- + 15%
S.T.
per sample
800/- + 15% S.T.
per sample
1100/- + 15% S.T.
per sample
14 Real-Time PCR 100/- per sample 100/- + 15%
S.T.
per sample
250/- + 15% S.T.
per sample
350/- + 15%
S.T.
per sample
15 Flow Cytometry Will be announce
soon
Will be
announce soon
Will be announce
soon
Will be
announce soon
16 Spectro fluorophoto
meter
150/- per sample 300/- + 15%
S.T.
per sample
400/- + 15% S.T.
per sample
600/- + 15%
S.T.
per sample
17 Electro square porator 100/- per sample 100/- + 15%
S.T.
per sample
250/- + 15% S.T.
per sample
350/- + 15%
S.T.
per sample
18 Gas chromatograpy Will be announce
soon
Will be
announce soon
Will be announce
soon
Will be
announce soon
Demand Draft to be made in the name of “Registrar, Jiwaji University, Gwalior”
Terms & Conditions:-
1. Sample preparation and Method development will be charged extra. Varies from material and
method to method depending on the sample if required so.
2. Raw data (data tables) for XRD, UV-VIS, FT-IR and other instrument. Will be charged extra
@Rs. 10.00 per page
3. Courier charges extra (depend on destination) Rs. 50.00 (minimum)
4. Digital copy of data will be charged Rs. 50.00 per sample (excluding media cost)
5. Overlay charges- Rs. 50.00
6. Service Tax: extra (as per University rule)
7. Payment: advance
8. Urgent service: 100 % extra charges.
9. The analytical data /spectra are provided only for research/development purposes. These
cannot be used as certificates in legal disputes.
10. Service charges including Service Tax are payable in advance by crossed bank draft in favor
of Registrar, Jiwaji University, Gwalior” Central Instrumentation Facility, Payable at
Gwalior.
11. Sample and payment should be sent preferably in the same cover. Separate samples
should be sent for different analysis. Sample will not be analyzed until payment is
received.
12. In all correspondence related to analysis our reference number must be mentioned.
13. Radio- active material, unstable and explosive compounds are not accepted for analysis.
14. Research fellows and students are advised to send their application and samples are
recommended by their supervisor Head of Department to avail the discount.
15. Interpretation of spectra is NOT undertaken.
16. As per the recent decision of CIF committee it is mandatory for user of CIF facility to
acknowledge the facility in their research work and communicates the same to CIF, Jiwaji
University, Gwalior M.P. This condition is necessary for availing ―discounted educational
institute price‖ for educational institutes.
17. For Lab visit, it is mandatory to take prior appointment from Co-Ordinator, CIF before your
visit. The application should be send through department/Senior official of institute/Company.
No deviation will be allowed for the timings.
All the communication should be addressed to:
To,
Prof. D. D. Agarwal
Co-Ordinator
Central Instrumentation Facility
Jiwaji University, Gwalior (M.P.) 474011
Contact No. +919893040776
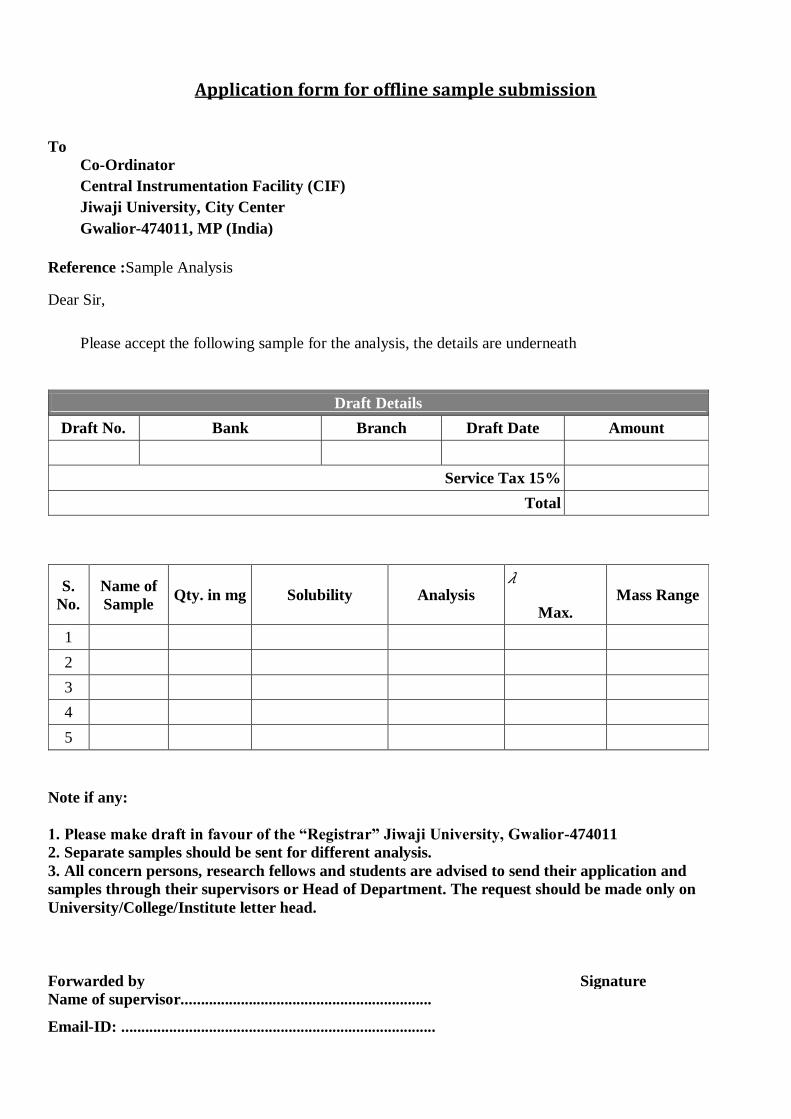
Application form for offline sample submission
To
Co-Ordinator
Central Instrumentation Facility (CIF)
Jiwaji University, City Center
Gwalior-474011, MP (India)
Reference :Sample Analysis
Dear Sir,
Please accept the following sample for the analysis, the details are underneath
Draft Details
Draft No. Bank Branch Draft Date Amount
Service Tax 15%
Total
S.
No.
Name of
Sample Qty. in mg Solubility Analysis
𝜆
Max. Mass Range
1
2
3
4
5
Note if any:
1. Please make draft in favour of the “Registrar” Jiwaji University, Gwalior-474011
2. Separate samples should be sent for different analysis.
3. All concern persons, research fellows and students are advised to send their application and
samples through their supervisors or Head of Department. The request should be made only on
University/College/Institute letter head.
Forwarded by Signature
Name of supervisor...............................................................
Email-ID: ...............................................................................
Tel/Mobile No........................................................................
Department.......................................................................
Address:................................................................................
...........................................................................................
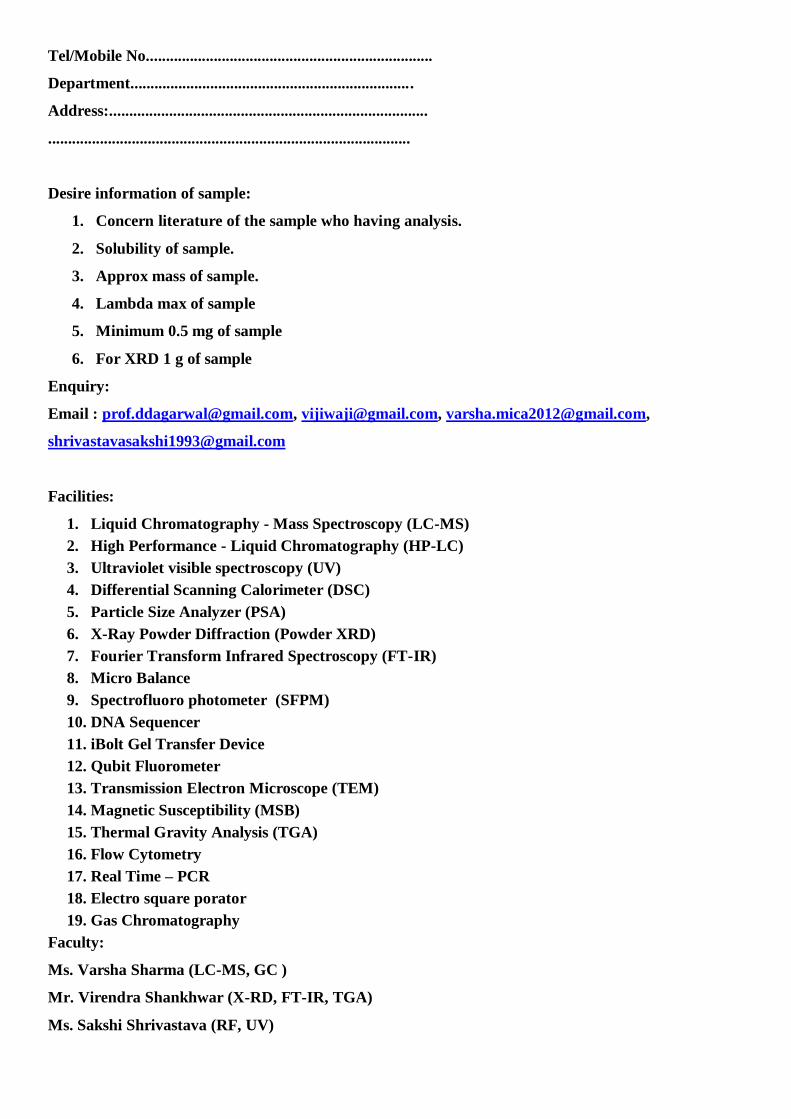
Desire information of sample:
1. Concern literature of the sample who having analysis.
2. Solubility of sample.
3. Approx mass of sample.
4. Lambda max of sample
5. Minimum 0.5 mg of sample
6. For XRD 1 g of sample
Enquiry:
Email : [email protected], [email protected], [email protected],
Facilities:
1. Liquid Chromatography - Mass Spectroscopy (LC-MS)
2. High Performance - Liquid Chromatography (HP-LC)
3. Ultraviolet visible spectroscopy (UV)
4. Differential Scanning Calorimeter (DSC)
5. Particle Size Analyzer (PSA)
6. X-Ray Powder Diffraction (Powder XRD)
7. Fourier Transform Infrared Spectroscopy (FT-IR)
8. Micro Balance
9. Spectrofluoro photometer (SFPM)
10. DNA Sequencer
11. iBolt Gel Transfer Device
12. Qubit Fluorometer
13. Transmission Electron Microscope (TEM)
14. Magnetic Susceptibility (MSB)
15. Thermal Gravity Analysis (TGA)
16. Flow Cytometry
17. Real Time – PCR
18. Electro square porator
19. Gas Chromatography
Faculty:
Ms. Varsha Sharma (LC-MS, GC )
Mr. Virendra Shankhwar (X-RD, FT-IR, TGA)
Ms. Sakshi Shrivastava (RF, UV)
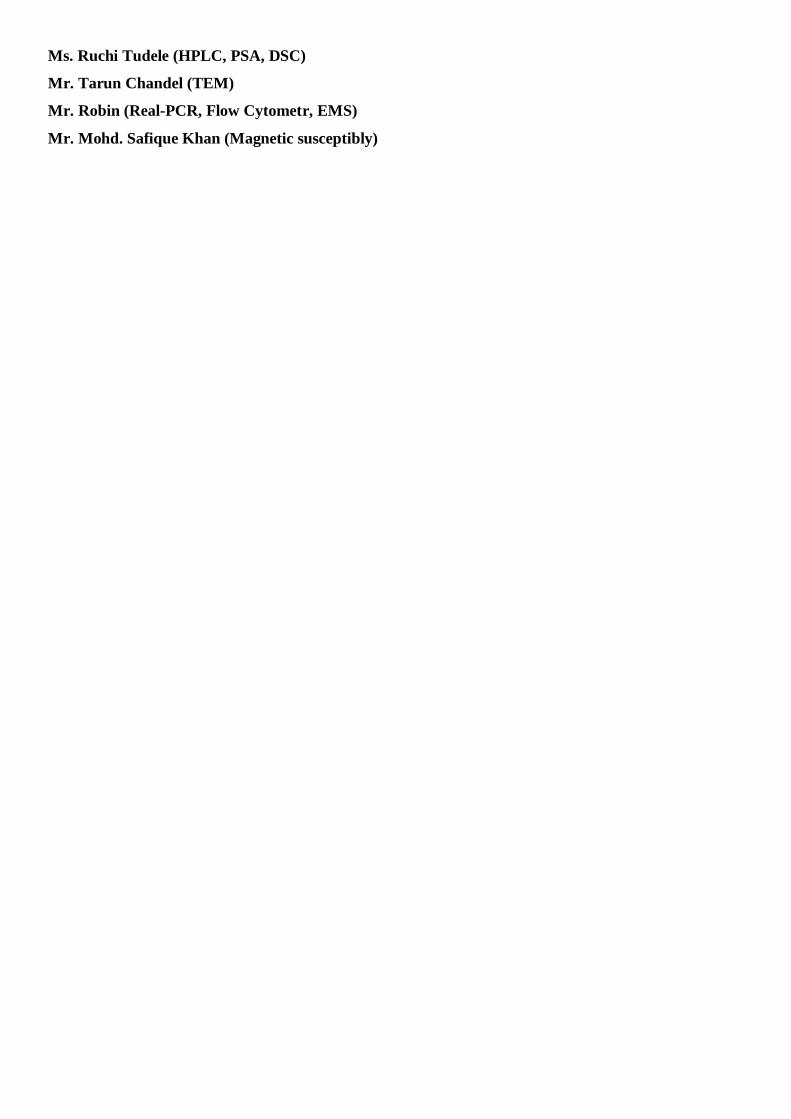
Ms. Ruchi Tudele (HPLC, PSA, DSC)
Mr. Tarun Chandel (TEM)
Mr. Robin (Real-PCR, Flow Cytometr, EMS)
Mr. Mohd. Safique Khan (Magnetic susceptibly)