Embed Size (px)
Citation preview
Dr. Anna MokgokongChairperson
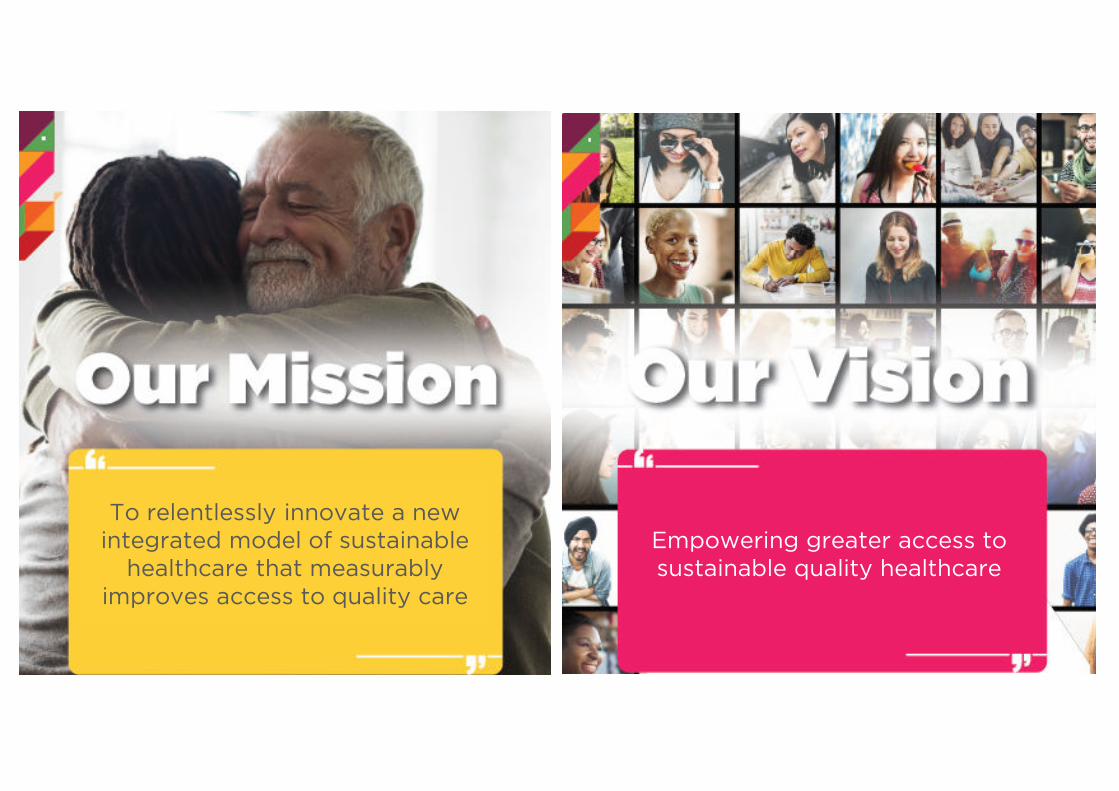
To relentlessly innovate a new
integrated model of sustainable
healthcare that measurably
improves access to quality care
Empowering greater access to
sustainable quality healthcare

Antoine van BuurenGroup CEO
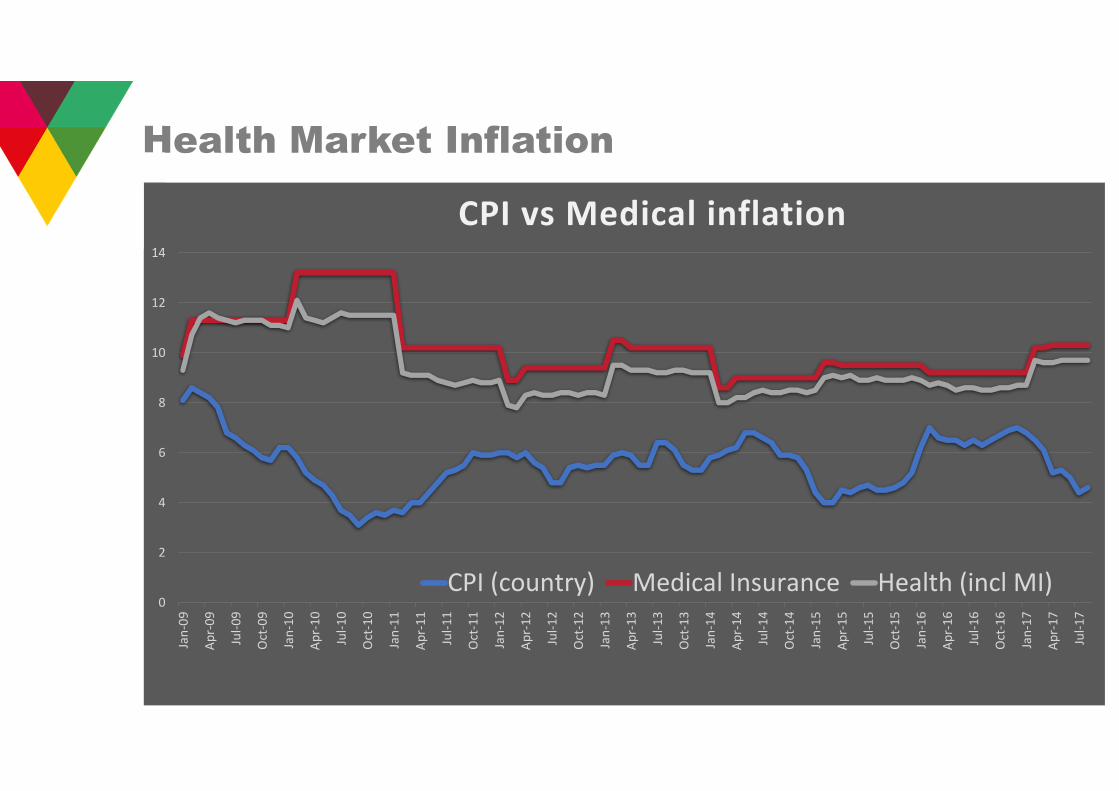
Health Market Inflation
0
2
4
6
8
10
12
14
Jan
-09
Ap
r-0
9
Jul-
09
Oct
-09
Jan
-10
Ap
r-1
0
Jul-
10
Oct
-10
Jan
-11
Ap
r-1
1
Jul-
11
Oct
-11
Jan
-12
Ap
r-1
2
Jul-
12
Oct
-12
Jan
-13
Ap
r-1
3
Jul-
13
Oct
-13
Jan
-14
Ap
r-1
4
Jul-
14
Oct
-14
Jan
-15
Ap
r-1
5
Jul-
15
Oct
-15
Jan
-16
Ap
r-1
6
Jul-
16
Oct
-16
Jan
-17
Ap
r-1
7
Jul-
17
CPI vs Medical inflation
CPI (country) Medical Insurance Health (incl MI)
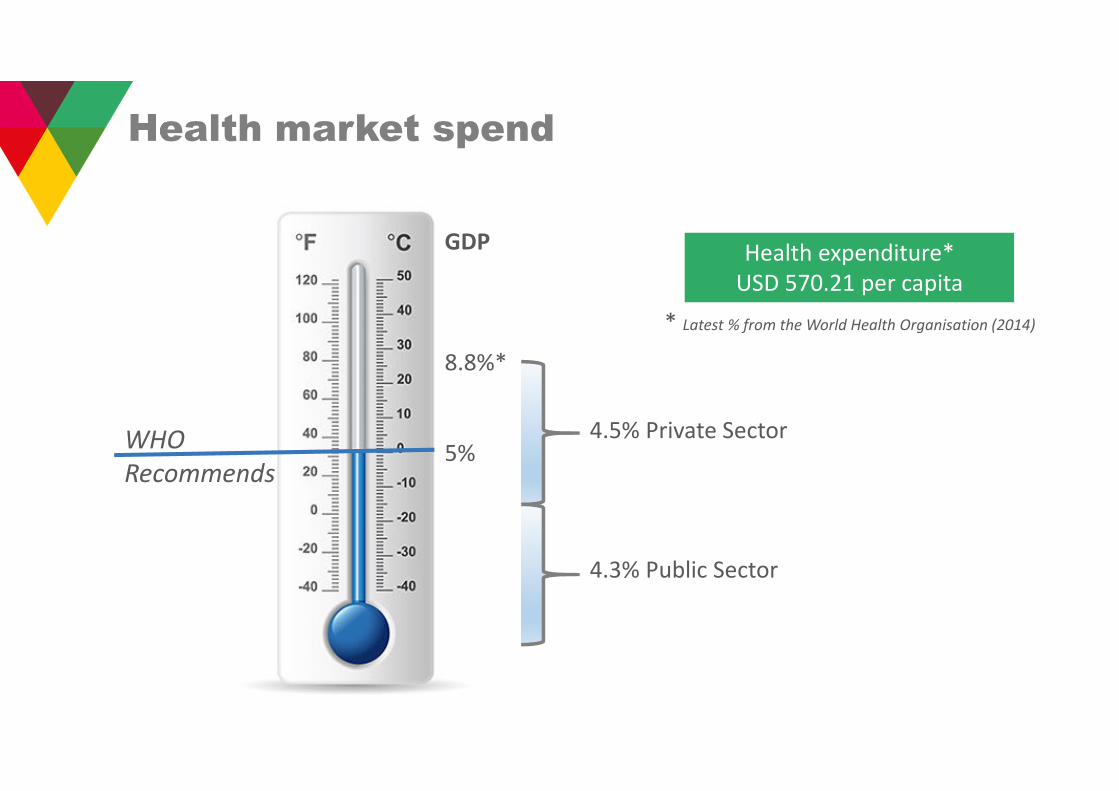
GDP
8.8%*
5%WHO
Recommends
4.5% Private Sector
4.3% Public Sector
* Latest % from the World Health Organisation (2014)
Health expenditure*
USD 570.21 per capita
Health market spend
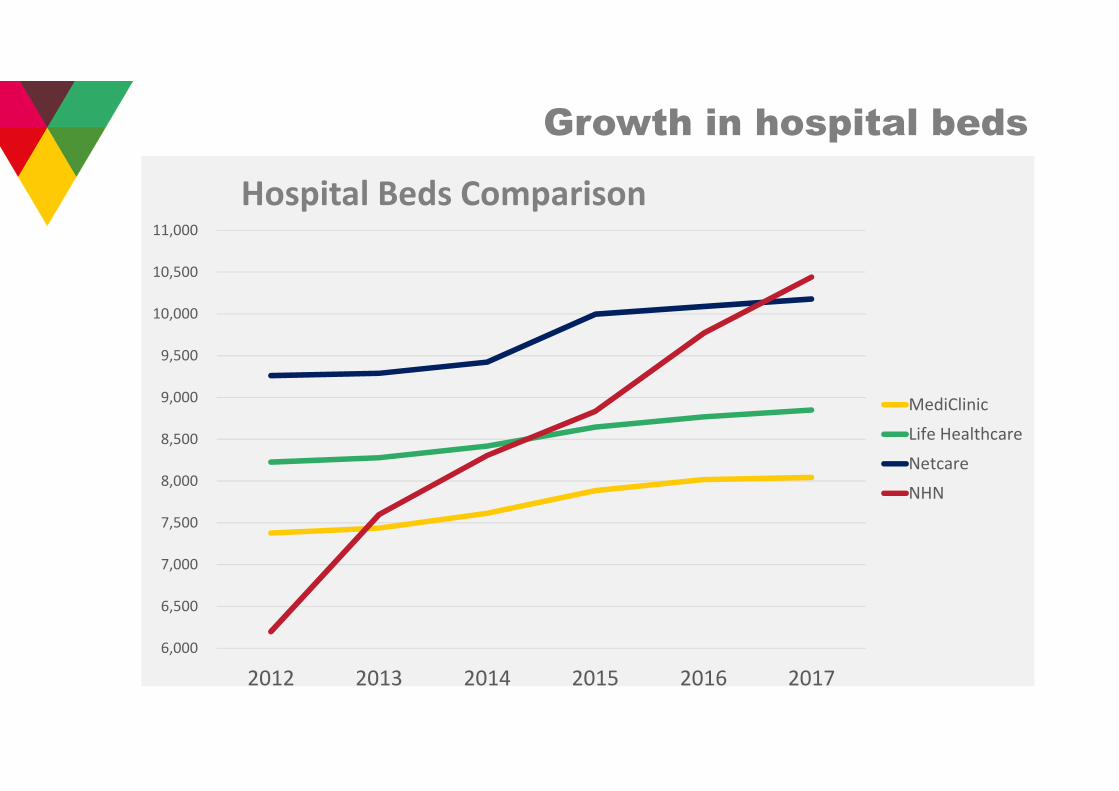
Growth in hospital beds
6,000
6,500
7,000
7,500
8,000
8,500
9,000
9,500
10,000
10,500
11,000
2012 2013 2014 2015 2016 2017
Hospital Beds Comparison
MediClinic
Life Healthcare
Netcare
NHN
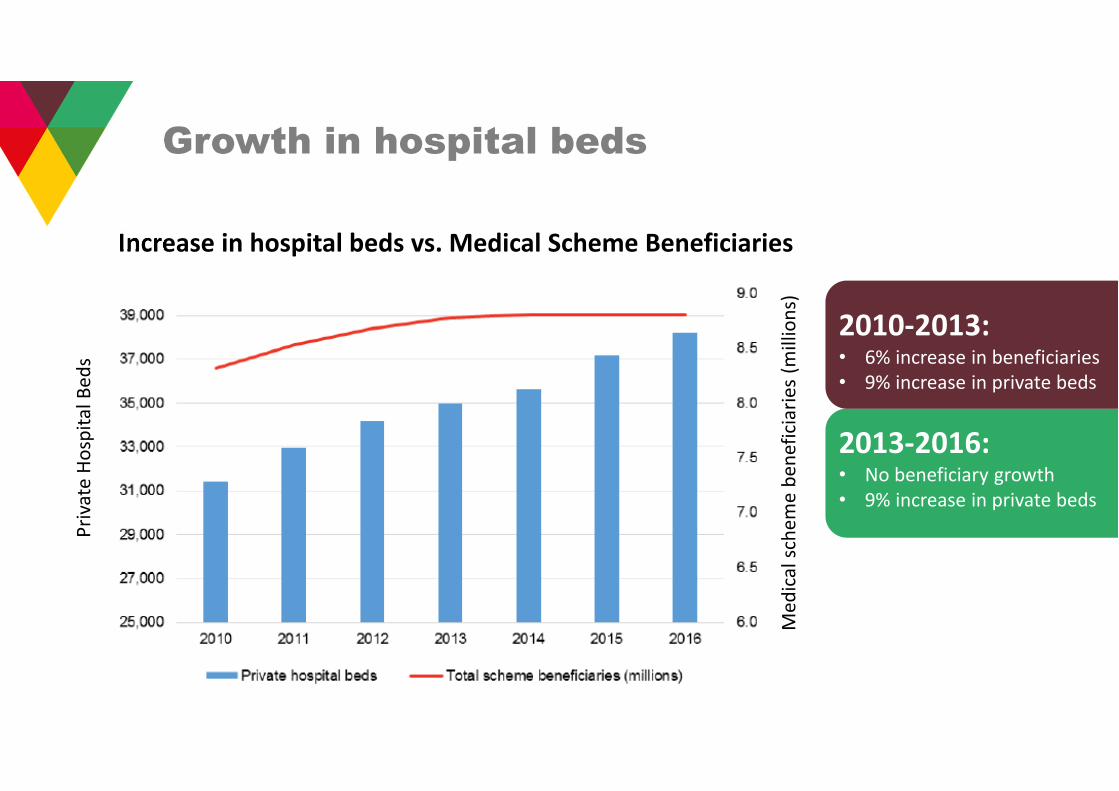
Growth in hospital beds
2010-2013:• 6% increase in beneficiaries
• 9% increase in private beds
2013-2016:• No beneficiary growth
• 9% increase in private beds
Increase in hospital beds vs. Medical Scheme Beneficiaries
Pri
vate
Ho
spit
al
Be
ds
Me
dic
al
sch
em
e b
en
efi
cia
rie
s (m
illi
on
s)
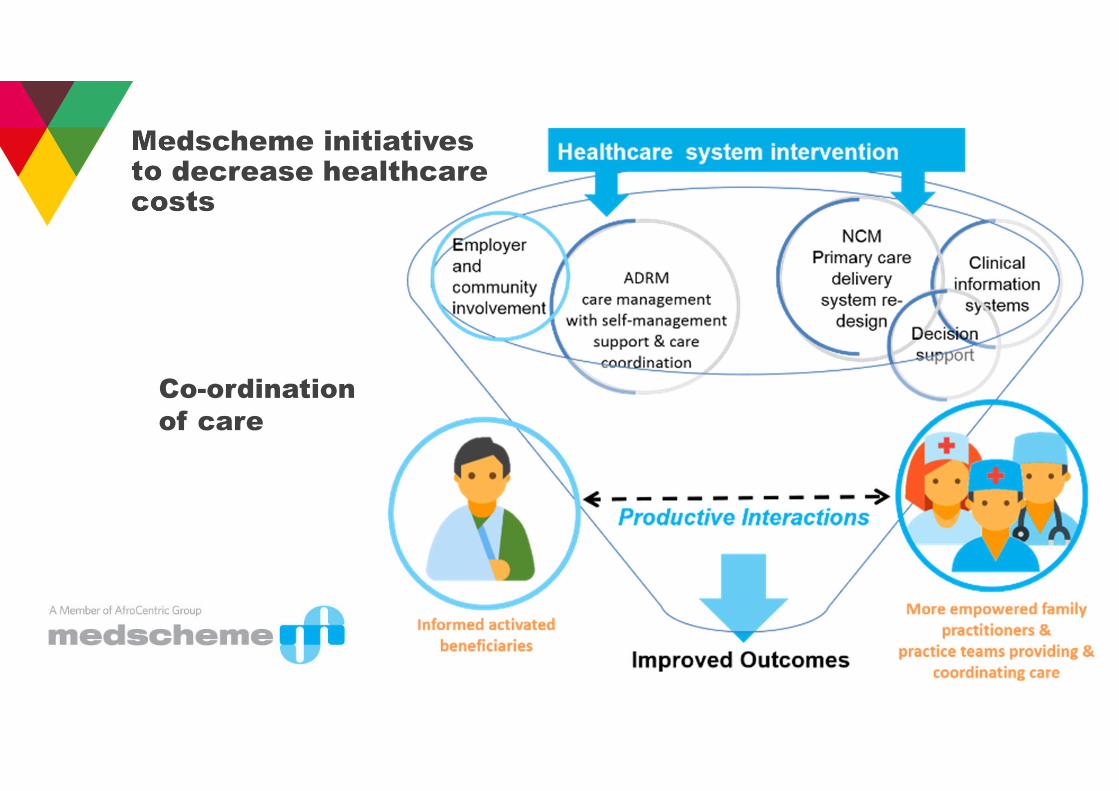
Co-ordination
of care
Medscheme initiatives to decrease healthcare costs
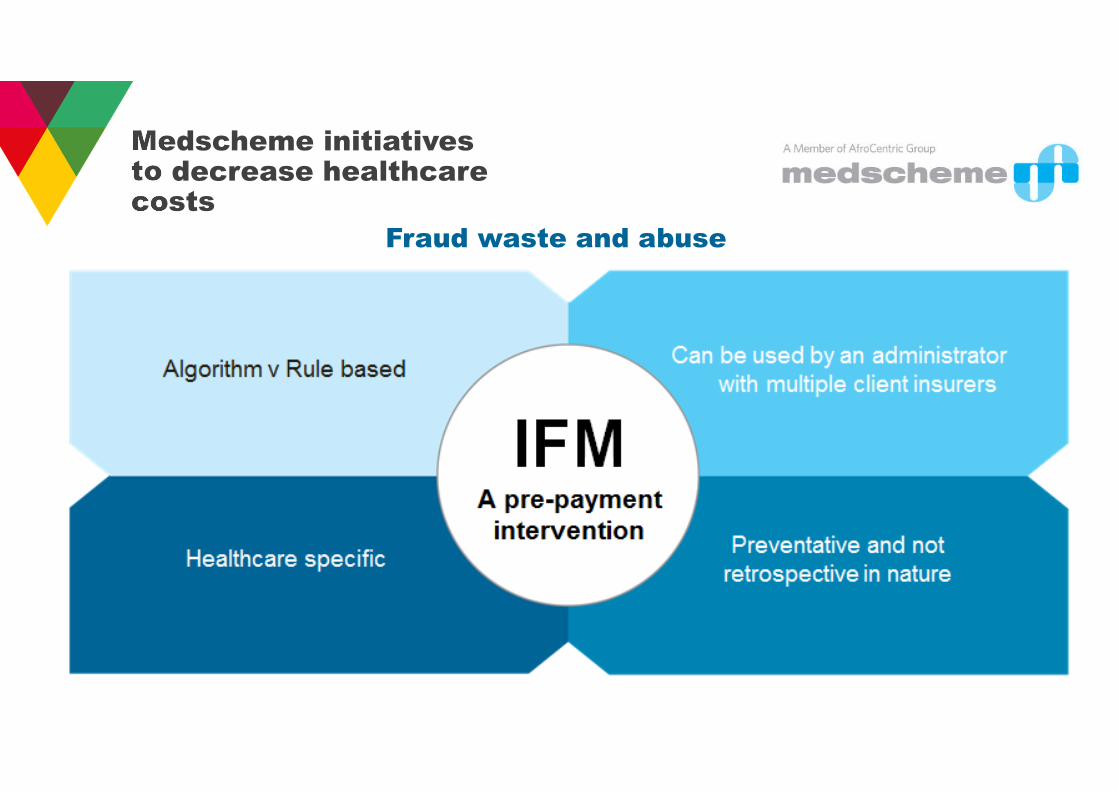
Fraud waste and abuse
Medscheme initiatives to decrease healthcare costs
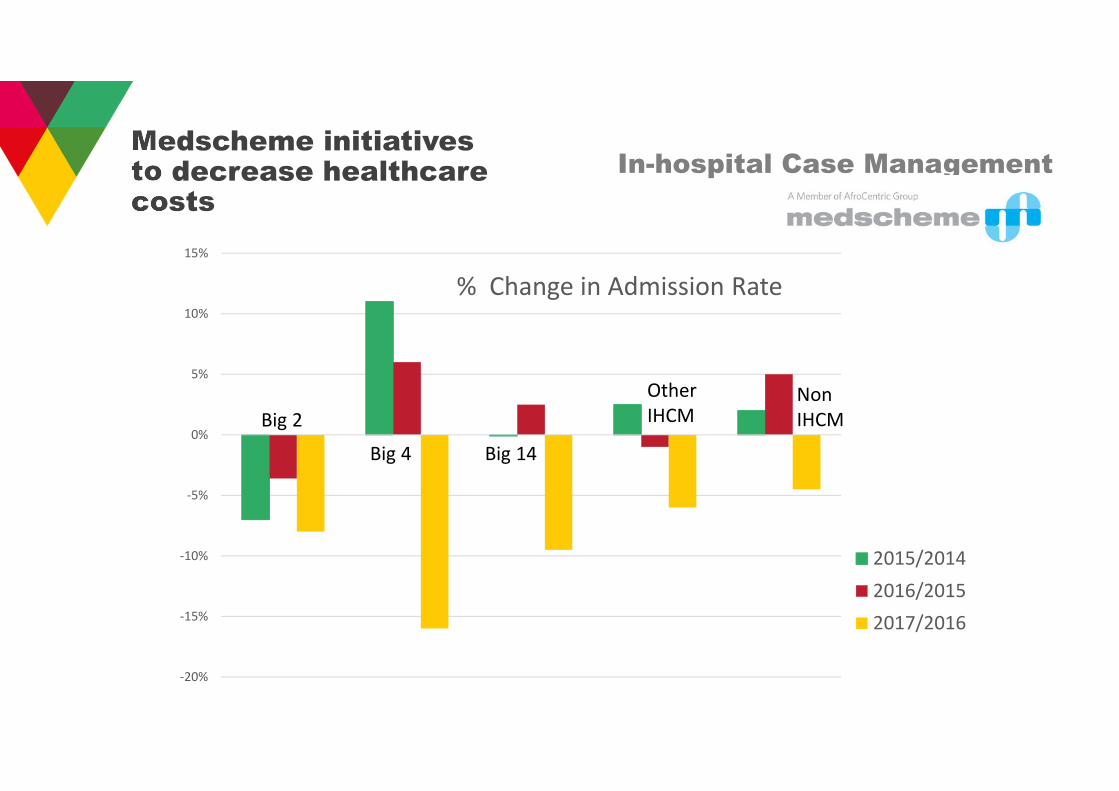
In-hospital Case ManagementMedscheme initiatives to decrease healthcare costs
-20%
-15%
-10%
-5%
0%
5%
10%
15%
% Change in Admission Rate
2015/2014
2016/2015
2017/2016
Big 2
Big 4 Big 14
Other
IHCMNon
IHCM
Medscheme initiatives to decrease healthcare costs
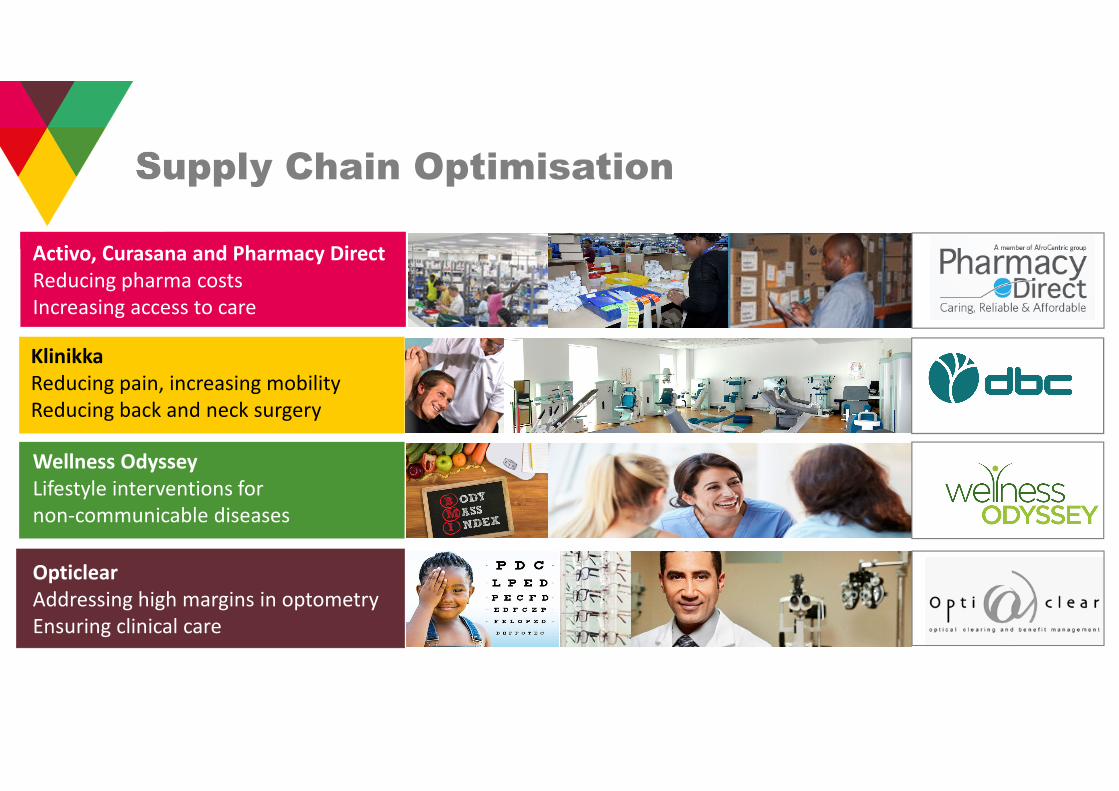
Activo, Curasana and Pharmacy Direct
Reducing pharma costs
Increasing access to care
Klinikka
Reducing pain, increasing mobility
Reducing back and neck surgery
Wellness Odyssey
Lifestyle interventions for
non-communicable diseases
Opticlear
Addressing high margins in optometry
Ensuring clinical care
Supply Chain Optimisation
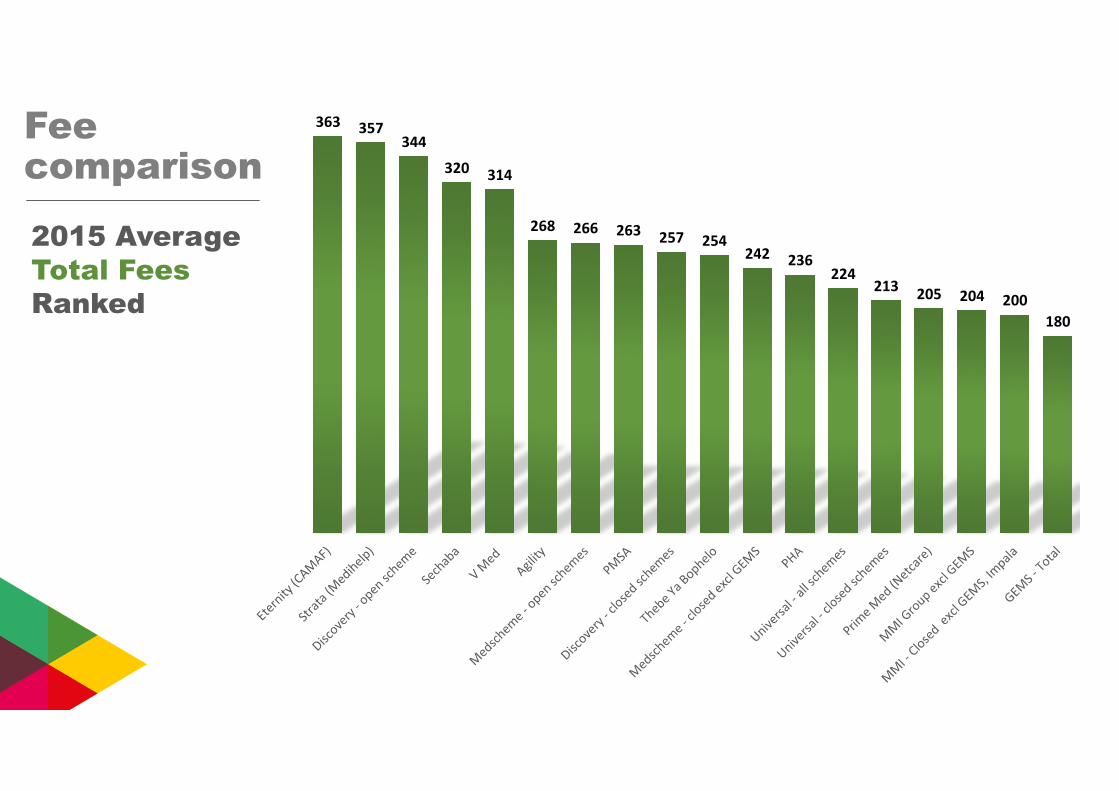
363 357344
320314
268 266 263257 254
242 236224
213205 204 200
180
Fee comparison
2015 Average
Total Fees
Ranked

Hannes BoonzaaierGroup CFO
Column1
0
500
1000
1500
2000
2500
3000
3500
4000
2 0 1 32 0 1 4
2 0 1 52 0 1 6
2 0 1 7
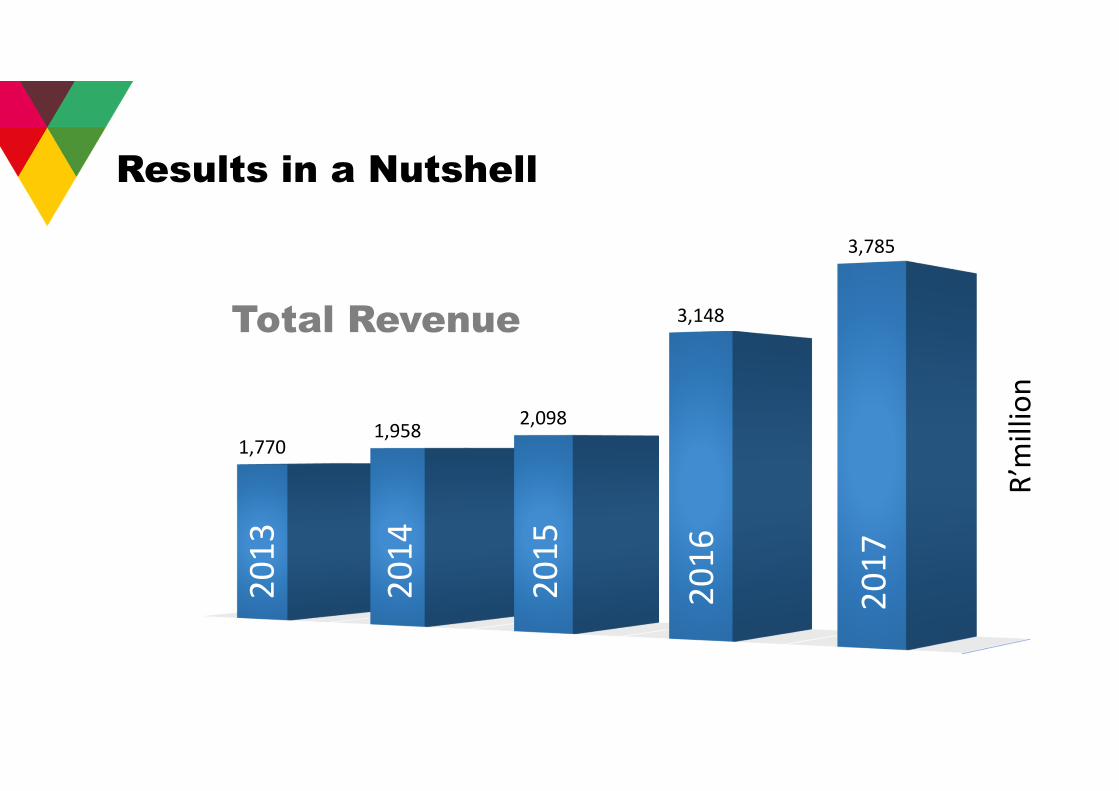
1,7701,958
2,098
3,148
3,7852
01
3
20
16
20
15
20
14
20
17
Total Revenue
R’m
illi
on
Results in a Nutshell
Column1
0
100
200
300
400
500
600
2 0 1 32 0 1 4
2 0 1 52 0 1 6
2 0 1 7
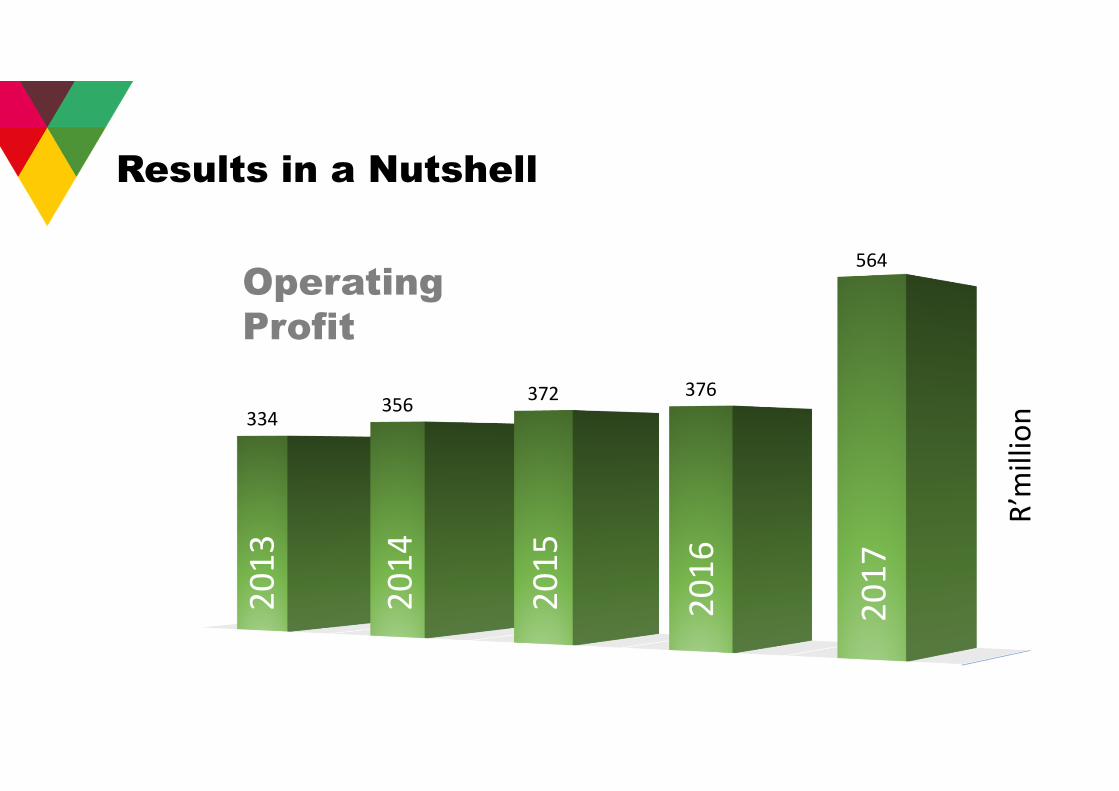
334356
372 376
5642
01
3
20
16
20
15
20
14
20
17
Operating
Profit
R’m
illi
on
Results in a Nutshell
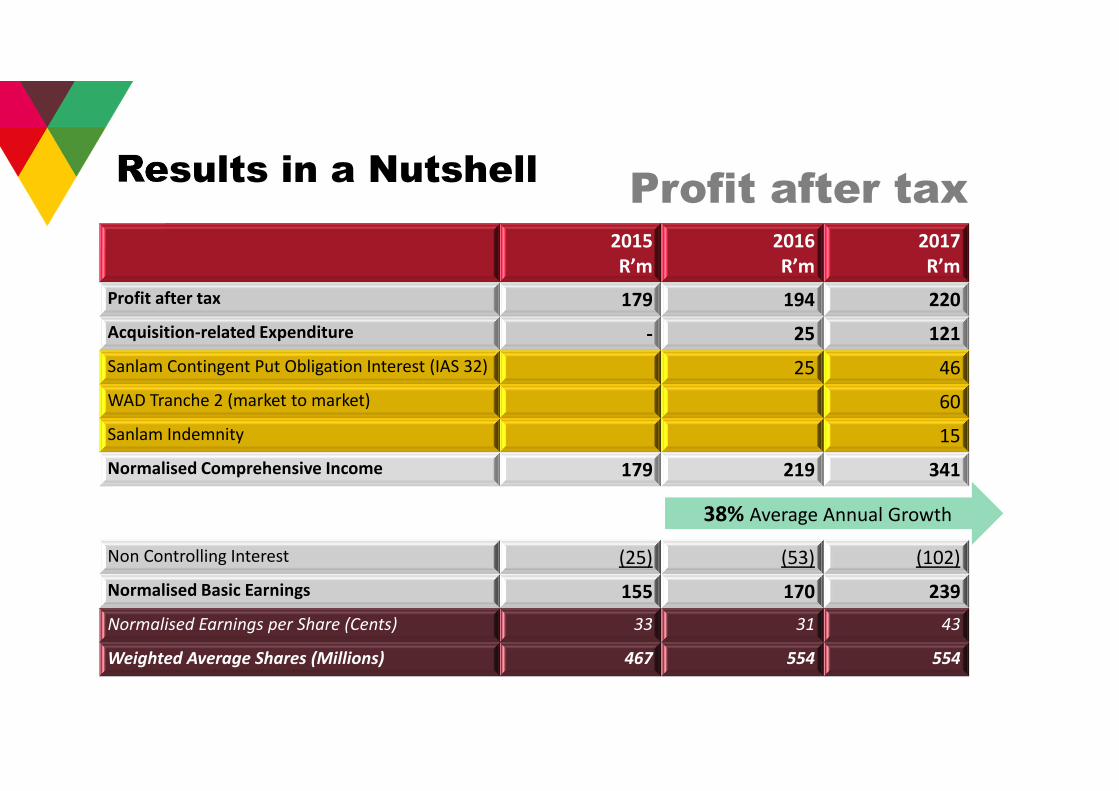
2015
R’m
2016
R’m
2017
R’m
Profit after tax 179 194 220
Acquisition-related Expenditure - 25 121
Sanlam Contingent Put Obligation Interest (IAS 32) 25 46
WAD Tranche 2 (market to market) 60
Sanlam Indemnity 15
Normalised Comprehensive Income 179 219 341
Non Controlling Interest (25) (53) (102)
Normalised Basic Earnings 155 170 239
Normalised Earnings per Share (Cents) 33 31 43
Weighted Average Shares (Millions) 467 554 554
Results in a NutshellProfit after tax
38% Average Annual Growth
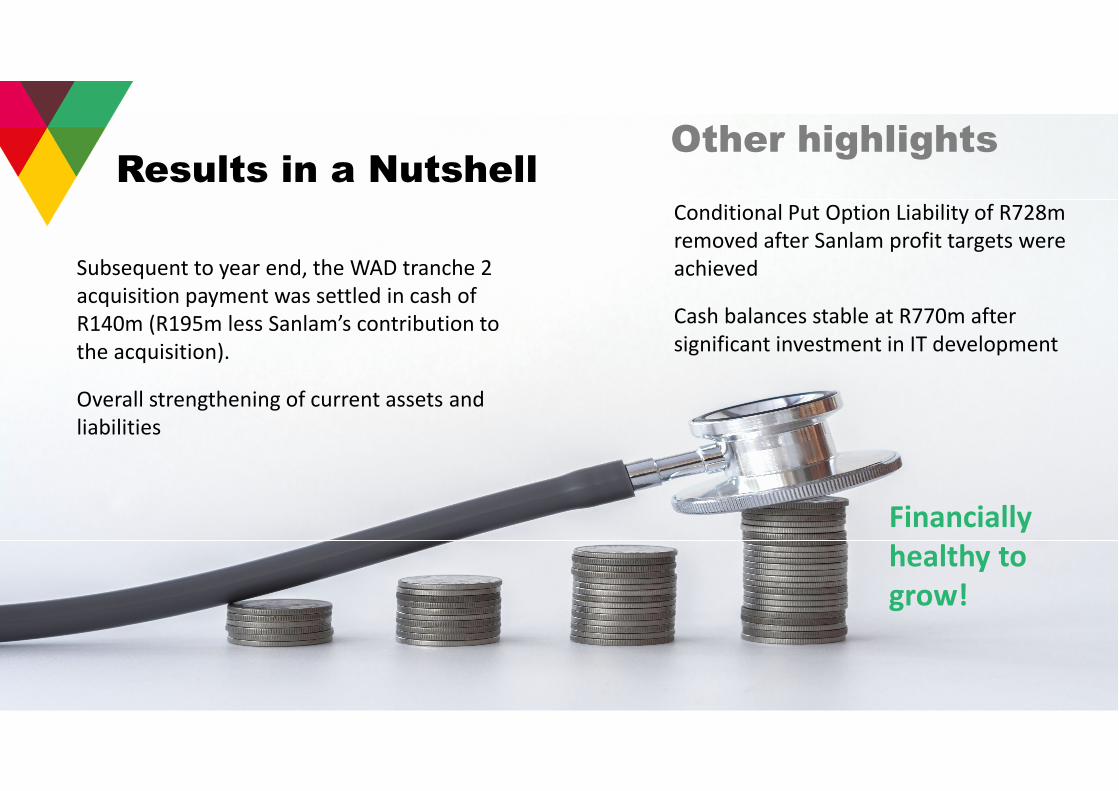
Other highlights
Conditional Put Option Liability of R728m
removed after Sanlam profit targets were
achieved
Cash balances stable at R770m after
significant investment in IT development
Financially
healthy to
grow!
Subsequent to year end, the WAD tranche 2
acquisition payment was settled in cash of
R140m (R195m less Sanlam’s contribution to
the acquisition).
Overall strengthening of current assets and
liabilities
Results in a Nutshell
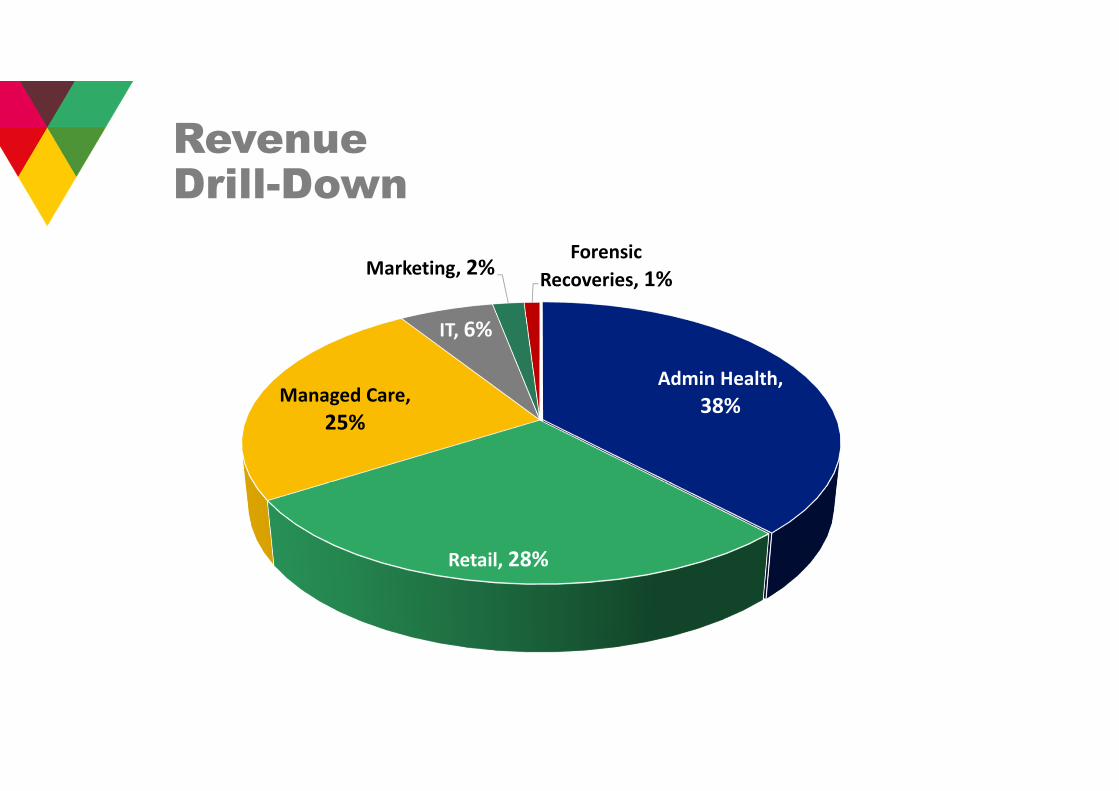
Revenue Drill-Down
Admin Health,
38%
Retail, 28%
Managed Care,
25%
IT, 6%
Marketing, 2%Forensic
Recoveries, 1%
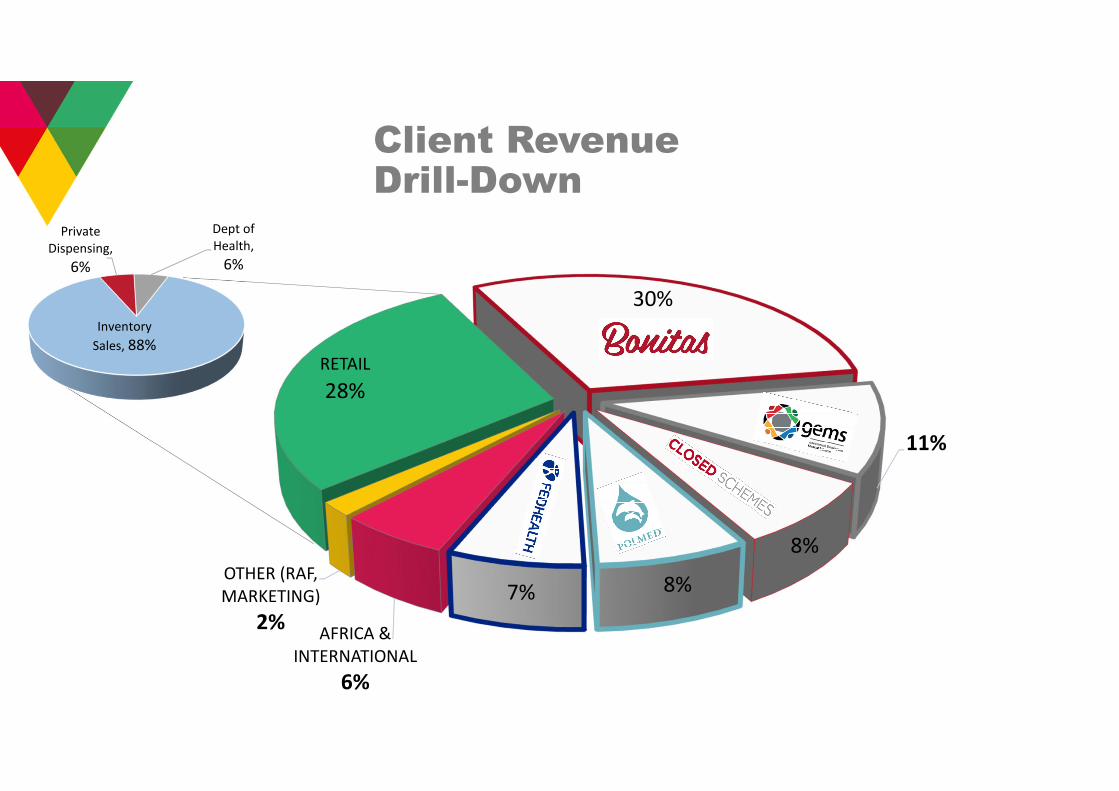
RETAIL
28%
30%
11%
8%
8%7%
AFRICA &
INTERNATIONAL
6%
OTHER (RAF,
MARKETING)
2%
Client Revenue Drill-Down
Inventory
Sales, 88%
Private
Dispensing,
6%
Dept of
Health,
6%
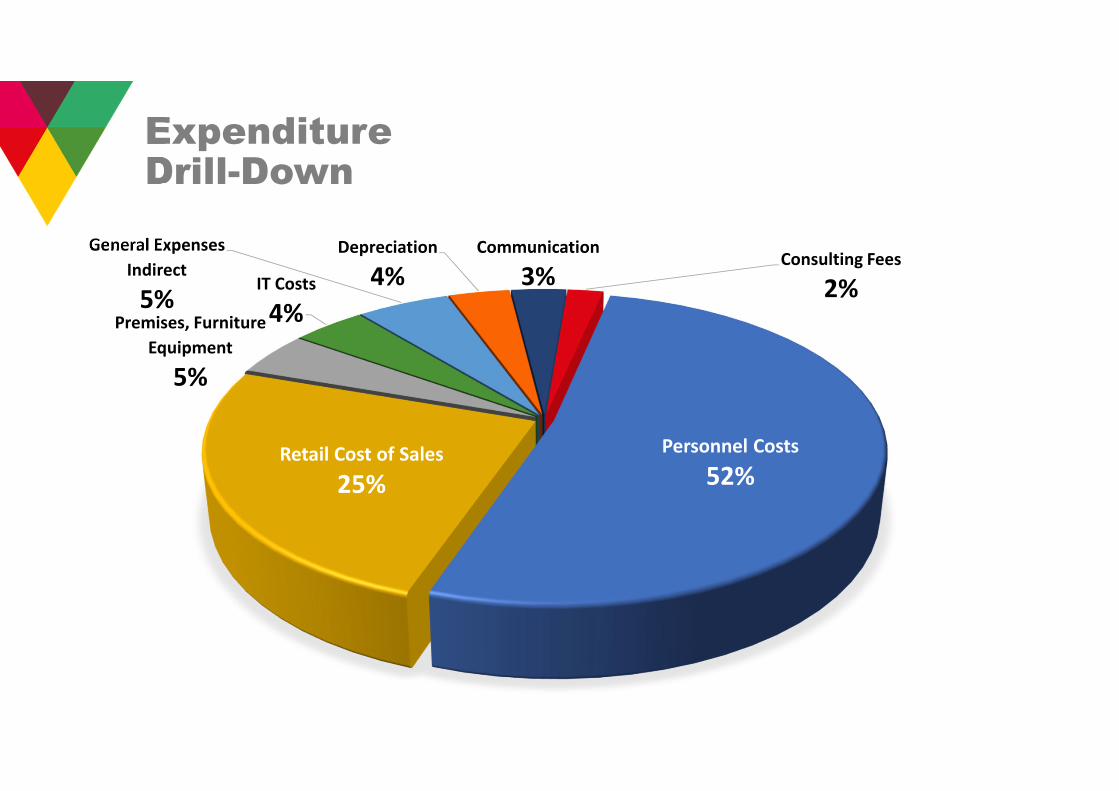
Personnel Costs
52%Retail Cost of Sales
25%
Premises, Furniture
Equipment
5%
IT Costs
4%
General Expenses
Indirect
5%
Depreciation
4%
Communication
3%Consulting Fees
2%
Expenditure Drill-Down
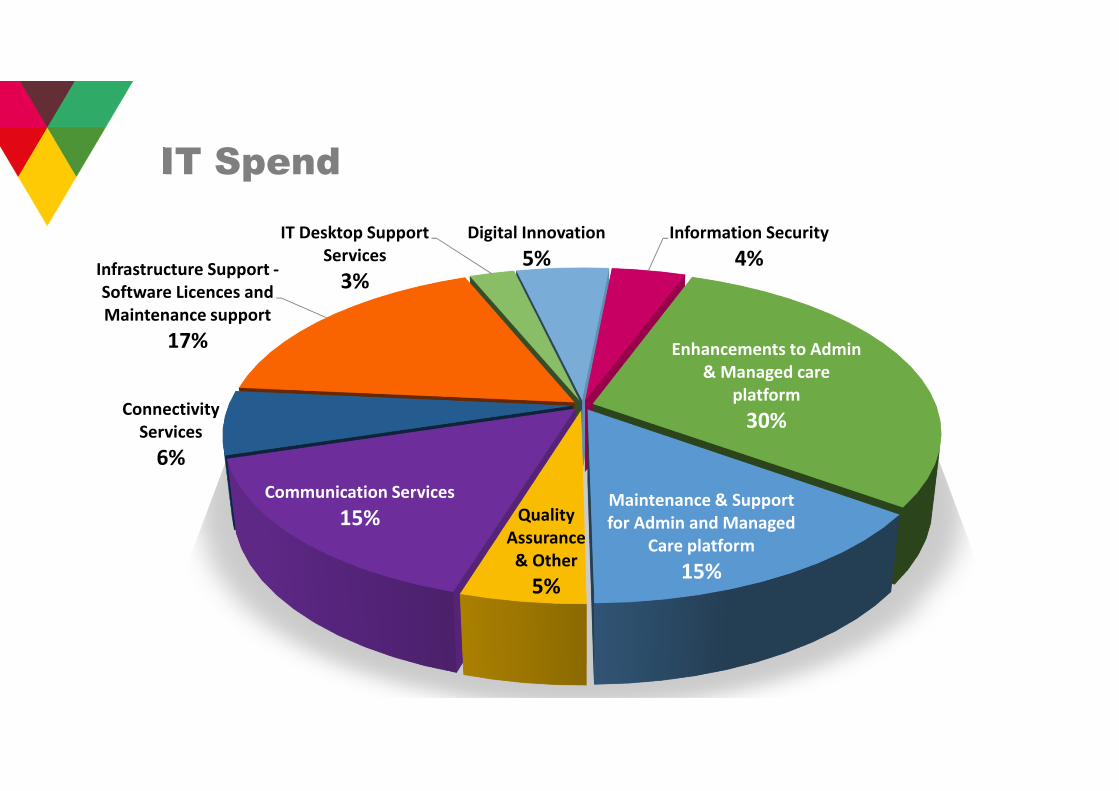
IT Spend
Enhancements to Admin
& Managed care
platform
30%
Maintenance & Support
for Admin and Managed
Care platform
15%
Quality
Assurance
& Other
5%
Communication Services
15%
Connectivity
Services
6%
Infrastructure Support -
Software Licences and
Maintenance support
17%
IT Desktop Support
Services
3%
Digital Innovation
5%
Information Security
4%
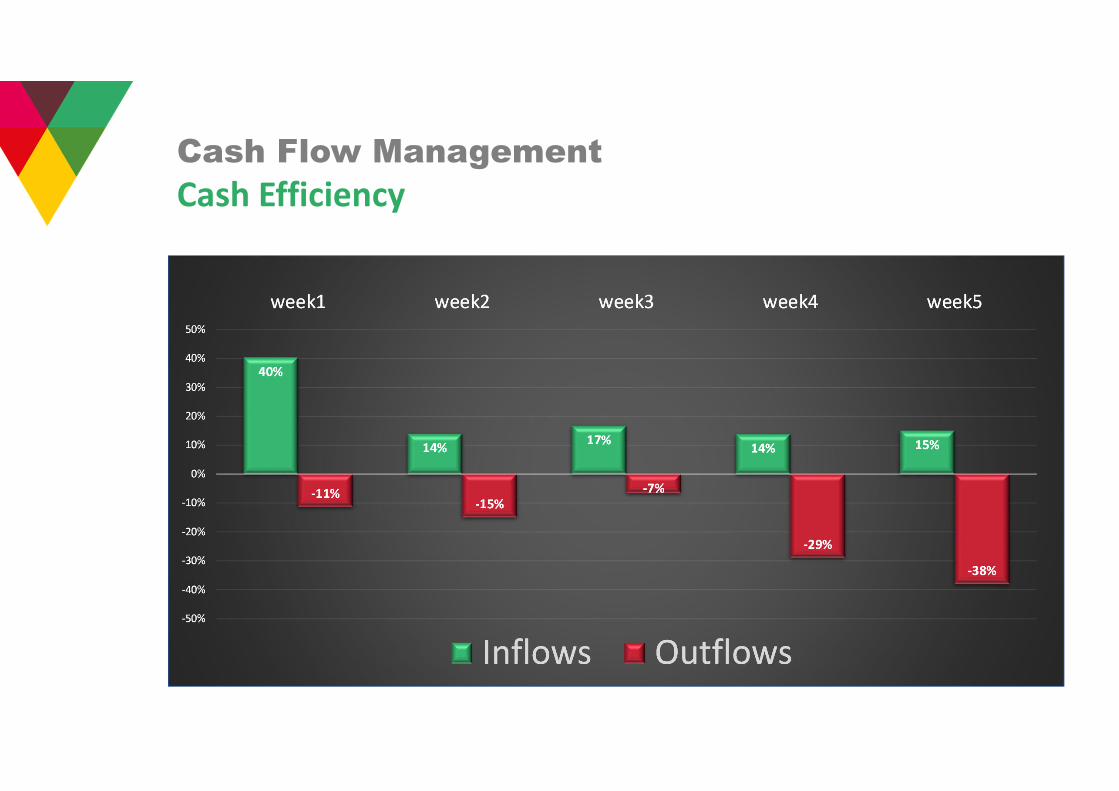
Cash Flow Management
40%
14%17%
14% 15%
-11%-15%
-7%
-29%
-38%
-50%
-40%
-30%
-20%
-10%
0%
10%
20%
30%
40%
50%
week1 week2 week3 week4 week5
Inflows Outflows
Cash Efficiency
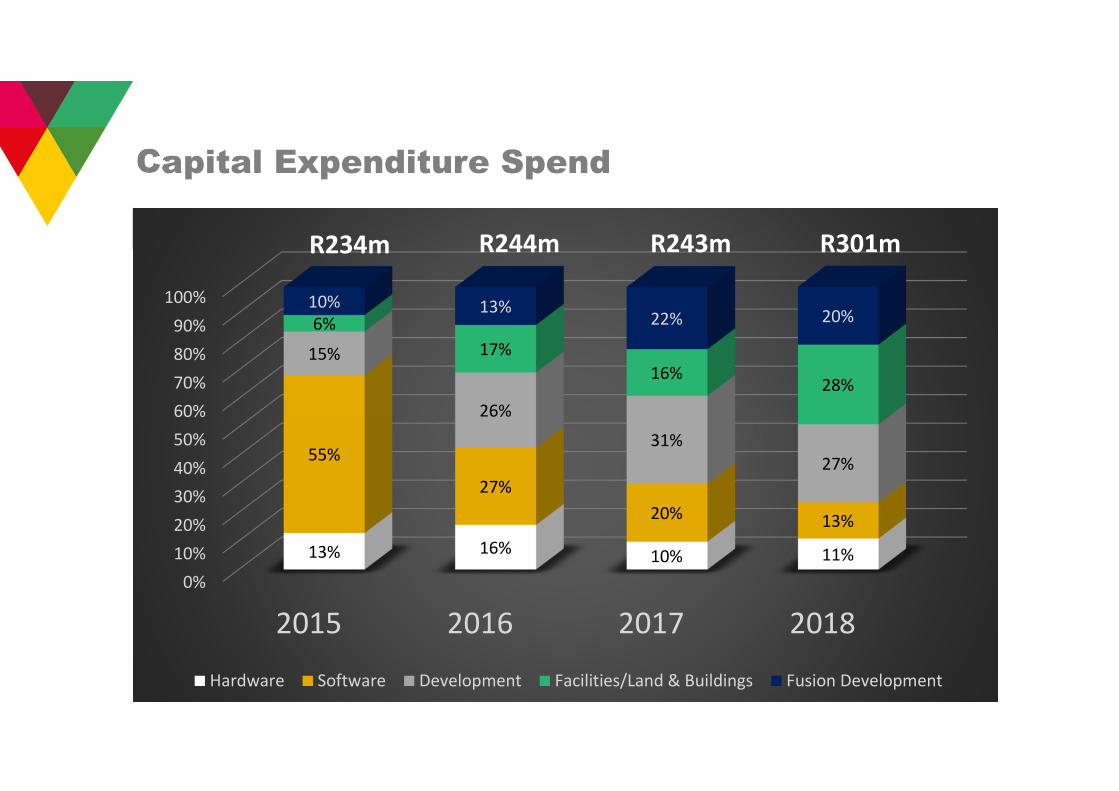
Capital Expenditure Spend
0%
10%
20%
30%
40%
50%
60%
70%
80%
90%
100%
2015 2016 2017 2018
13% 16%10% 11%
55%
27%
20% 13%
15%
26%
31%
27%
6%
17%
16%28%
10% 13%22% 20%
Hardware Software Development Facilities/Land & Buildings Fusion Development
R234m R244m R243m R301m
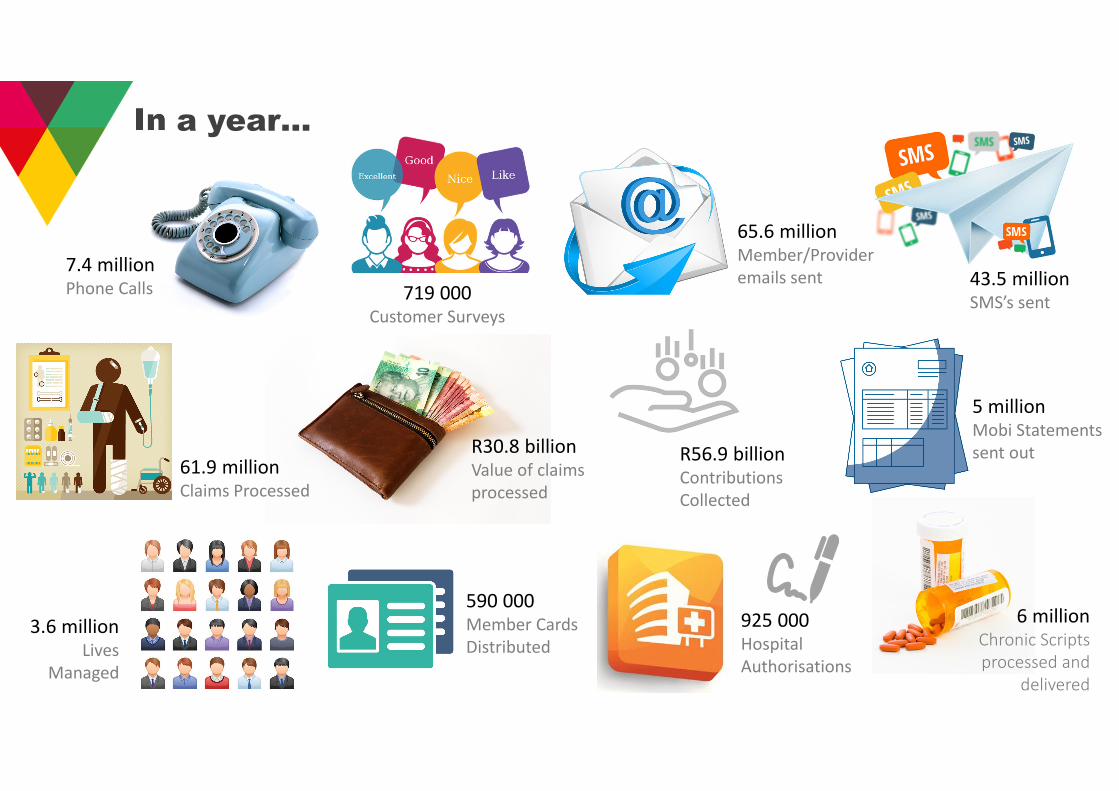
7.4 million Phone Calls 719 000
Customer Surveys
65.6 millionMember/Provider
emails sent 43.5 millionSMS’s sent
R30.8 billion Value of claims
processed
3.6 million Lives
Managed
590 000Member Cards
Distributed
925 000Hospital
Authorisations
In a year…
61.9 million Claims Processed
5 millionMobi Statements
sent out
6 millionChronic Scripts
processed and
delivered
R56.9 billion Contributions
Collected
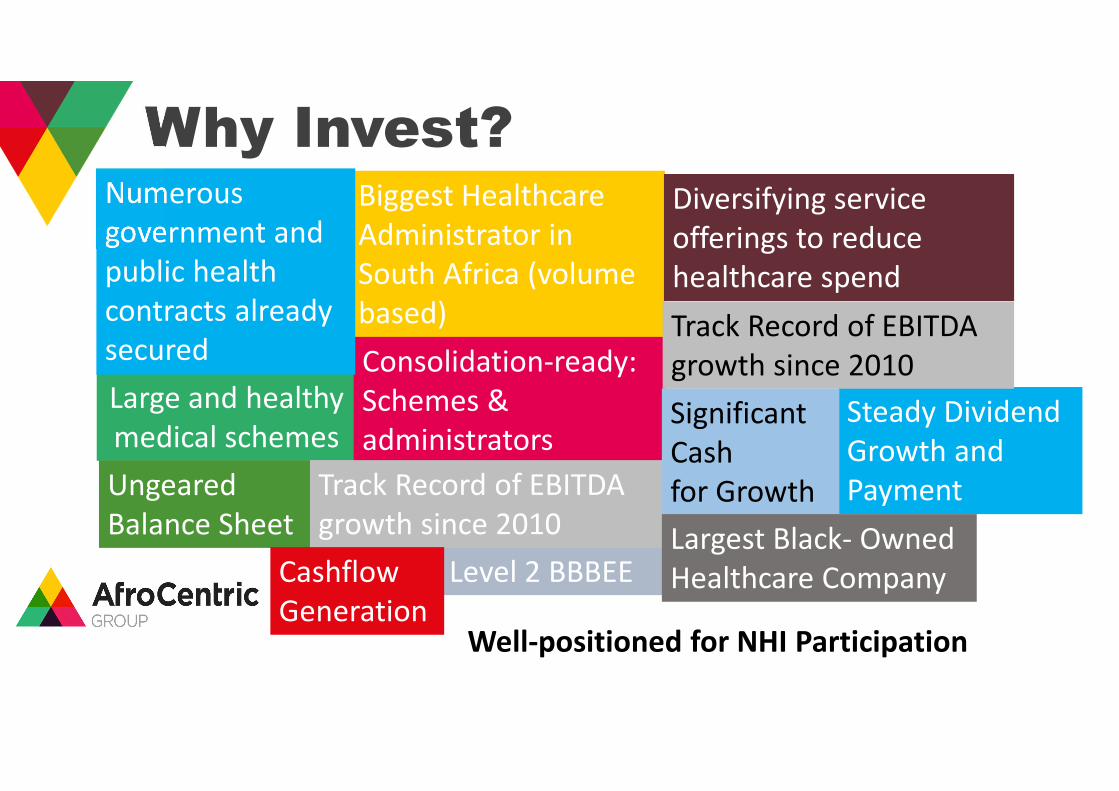
Level 2 BBBEE
Steady Dividend
Growth and
Payment
Why Invest?
Large and healthy
medical schemes
Ungeared
Balance Sheet
Well-positioned for NHI Participation
Biggest Healthcare
Administrator in
South Africa (volume
based)
Consolidation-ready:
Schemes &
administrators
Numerous
government and
public health
contracts already
secured
Diversifying service
offerings to reduce
healthcare spend
Track Record of EBITDA
growth since 2010
Track Record of EBITDA
growth since 2010
Cashflow
Generation
Significant
Cash
for Growth
Largest Black- Owned
Healthcare Company
Thank you for your time