Embed Size (px)
Citation preview
DPEQ Seri 04
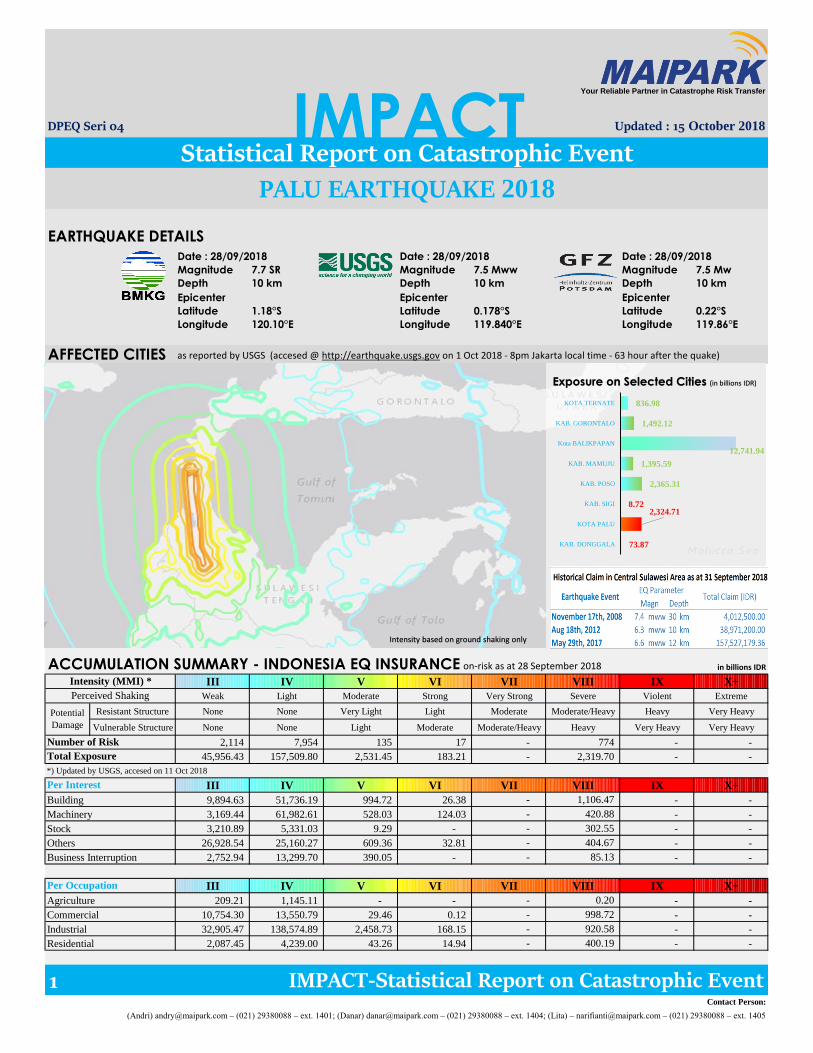
EARTHQUAKE DETAILS
Date : 28/09/2018 Date : 28/09/2018 Date : 28/09/2018
Magnitude 7.7 SR Magnitude 7.5 Mww Magnitude 7.5 Mw
Depth 10 km Depth 10 km Depth 10 km
Epicenter Epicenter Epicenter
Latitude 1.18°S Latitude 0.178°S Latitude 0.22°S
Longitude 120.10°E Longitude 119.840°E Longitude 119.86°E
AFFECTED CITIES as reported by USGS (accesed @ http://earthquake.usgs.gov on 1 Oct 2018 - 8pm Jakarta local time - 63 hour after the quake)
ACCUMULATION SUMMARY - INDONESIA EQ INSURANCE on-risk as at 28 September 2018 in billions IDR
III IV V VI VII VIII IX X+
Weak Light Moderate Strong Very Strong Severe Violent Extreme
Resistant Structure None None Very Light Light Moderate Moderate/Heavy Heavy Very Heavy
Vulnerable Structure None None Light Moderate Moderate/Heavy Heavy Very Heavy Very Heavy
2,114 7,954 135 17 - 774 - -
45,956.43 157,509.80 2,531.45 183.21 - 2,319.70 - -
*) Updated by USGS, accesed on 11 Oct 2018
III IV V VI VII VIII IX X+
9,894.63 51,736.19 994.72 26.38 - 1,106.47 - -
3,169.44 61,982.61 528.03 124.03 - 420.88 - -
3,210.89 5,331.03 9.29 - - 302.55 - -
26,928.54 25,160.27 609.36 32.81 - 404.67 - -
2,752.94 13,299.70 390.05 - - 85.13 - -
III IV V VI VII VIII IX X+
209.21 1,145.11 - - - 0.20 - -
10,754.30 13,550.79 29.46 0.12 - 998.72 - -
32,905.47 138,574.89 2,458.73 168.15 - 920.58 - -
2,087.45 4,239.00 43.26 14.94 - 400.19 - -
1Contact Person:
(Andri) [email protected] – (021) 29380088 – ext. 1401; (Danar) [email protected] – (021) 29380088 – ext. 1404; (Lita) – [email protected] – (021) 29380088 – ext. 1405
Agriculture
Commercial
Industrial
Residential
Building
Machinery
Stock
Others
Business Interruption
Per Occupation
Per Interest
Intensity (MMI) *
Perceived Shaking
Potential
Damage
Number of Risk
Total Exposure
Updated : 15 October 2018
IMPACT-Statistical Report on Catastrophic Event
Statistical Report on Catastrophic Event
PALU EARTHQUAKE 2018
Your Reliable Partner in Catastrophe Risk Transfer
IMPACT
73.87
2,324.71 8.72
2,365.31
1,395.59
12,741.94
1,492.12
836.98
KAB. DONGGALA
KOTA PALU
KAB. SIGI
KAB. POSO
KAB. MAMUJU
Kota BALIKPAPAN
KAB. GORONTALO
KOTA TERNATE
Exposure on Selected Cities (in billions IDR)
Intensity based on ground shaking only
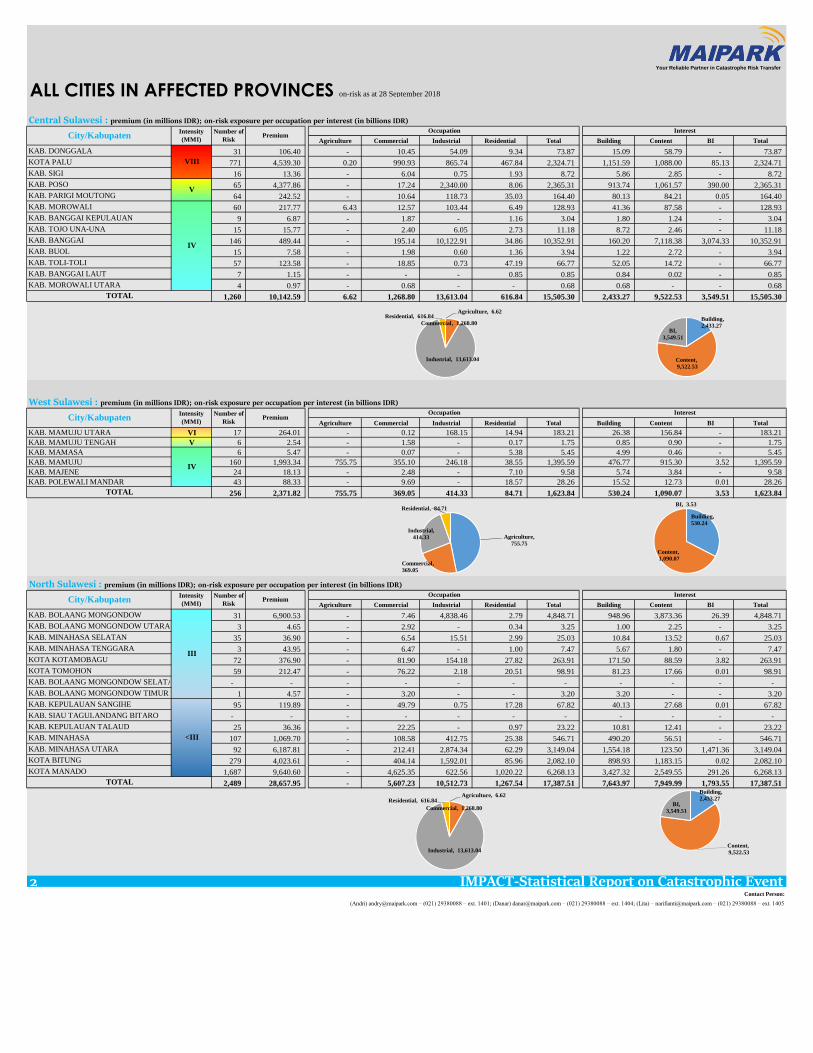
ALL CITIES IN AFFECTED PROVINCES on-risk as at 28 September 2018
Central Sulawesi : premium (in millions IDR); on-risk exposure per occupation per interest (in billions IDR)
Agriculture Commercial Industrial Residential Total Building Content BI Total
KAB. DONGGALA 31 106.40 - 10.45 54.09 9.34 73.87 15.09 58.79 - 73.87
KOTA PALU 771 4,539.30 0.20 990.93 865.74 467.84 2,324.71 1,151.59 1,088.00 85.13 2,324.71
KAB. SIGI 16 13.36 - 6.04 0.75 1.93 8.72 5.86 2.85 - 8.72
KAB. POSO 65 4,377.86 - 17.24 2,340.00 8.06 2,365.31 913.74 1,061.57 390.00 2,365.31
KAB. PARIGI MOUTONG 64 242.52 - 10.64 118.73 35.03 164.40 80.13 84.21 0.05 164.40
KAB. MOROWALI 60 217.77 6.43 12.57 103.44 6.49 128.93 41.36 87.58 - 128.93
KAB. BANGGAI KEPULAUAN 9 6.87 - 1.87 - 1.16 3.04 1.80 1.24 - 3.04
KAB. TOJO UNA-UNA 15 15.77 - 2.40 6.05 2.73 11.18 8.72 2.46 - 11.18
KAB. BANGGAI 146 489.44 - 195.14 10,122.91 34.86 10,352.91 160.20 7,118.38 3,074.33 10,352.91
KAB. BUOL 15 7.58 - 1.98 0.60 1.36 3.94 1.22 2.72 - 3.94
KAB. TOLI-TOLI 57 123.58 - 18.85 0.73 47.19 66.77 52.05 14.72 - 66.77
KAB. BANGGAI LAUT 7 1.15 - - - 0.85 0.85 0.84 0.02 - 0.85
KAB. MOROWALI UTARA 4 0.97 - 0.68 - - 0.68 0.68 - - 0.68
1,260 10,142.59 6.62 1,268.80 13,613.04 616.84 15,505.30 2,433.27 9,522.53 3,549.51 15,505.30
West Sulawesi : premium (in millions IDR); on-risk exposure per occupation per interest (in billions IDR)
Agriculture Commercial Industrial Residential Total Building Content BI Total
KAB. MAMUJU UTARA VI 17 264.01 - 0.12 168.15 14.94 183.21 26.38 156.84 - 183.21
KAB. MAMUJU TENGAH V 6 2.54 - 1.58 - 0.17 1.75 0.85 0.90 - 1.75
KAB. MAMASA 6 5.47 - 0.07 - 5.38 5.45 4.99 0.46 - 5.45
KAB. MAMUJU 160 1,993.34 755.75 355.10 246.18 38.55 1,395.59 476.77 915.30 3.52 1,395.59
KAB. MAJENE 24 18.13 - 2.48 - 7.10 9.58 5.74 3.84 - 9.58
KAB. POLEWALI MANDAR 43 88.33 - 9.69 - 18.57 28.26 15.52 12.73 0.01 28.26
256 2,371.82 755.75 369.05 414.33 84.71 1,623.84 530.24 1,090.07 3.53 1,623.84
North Sulawesi : premium (in millions IDR); on-risk exposure per occupation per interest (in billions IDR)
Agriculture Commercial Industrial Residential Total Building Content BI Total
KAB. BOLAANG MONGONDOW 31 6,900.53 - 7.46 4,838.46 2.79 4,848.71 948.96 3,873.36 26.39 4,848.71
KAB. BOLAANG MONGONDOW UTARA 3 4.65 - 2.92 - 0.34 3.25 1.00 2.25 - 3.25
KAB. MINAHASA SELATAN 35 36.90 - 6.54 15.51 2.99 25.03 10.84 13.52 0.67 25.03
KAB. MINAHASA TENGGARA 3 43.95 - 6.47 - 1.00 7.47 5.67 1.80 - 7.47
KOTA KOTAMOBAGU 72 376.90 - 81.90 154.18 27.82 263.91 171.50 88.59 3.82 263.91
KOTA TOMOHON 59 212.47 - 76.22 2.18 20.51 98.91 81.23 17.66 0.01 98.91
KAB. BOLAANG MONGONDOW SELATAN - - - - - - - - - - -
KAB. BOLAANG MONGONDOW TIMUR 1 4.57 - 3.20 - - 3.20 3.20 - - 3.20
KAB. KEPULAUAN SANGIHE 95 119.89 - 49.79 0.75 17.28 67.82 40.13 27.68 0.01 67.82
KAB. SIAU TAGULANDANG BITARO - - - - - - - - - - -
KAB. KEPULAUAN TALAUD 25 36.36 - 22.25 - 0.97 23.22 10.81 12.41 - 23.22
KAB. MINAHASA 107 1,069.70 - 108.58 412.75 25.38 546.71 490.20 56.51 - 546.71
KAB. MINAHASA UTARA 92 6,187.81 - 212.41 2,874.34 62.29 3,149.04 1,554.18 123.50 1,471.36 3,149.04
KOTA BITUNG 279 4,023.61 - 404.14 1,592.01 85.96 2,082.10 898.93 1,183.15 0.02 2,082.10
KOTA MANADO 1,687 9,640.60 - 4,625.35 622.56 1,020.22 6,268.13 3,427.32 2,549.55 291.26 6,268.13
2,489 28,657.95 - 5,607.23 10,512.73 1,267.54 17,387.51 7,643.97 7,949.99 1,793.55 17,387.51
2
Number of
RiskPremium
City/KabupatenIntensity
(MMI)
Number of
RiskPremium
Occupation Interest
TOTAL
City/KabupatenIntensity
(MMI)
Number of
RiskPremium
Occupation Interest
IV
TOTAL
VIII
V
IV
III
<III
IMPACT-Statistical Report on Catastrophic EventContact Person:
(Andri) [email protected] – (021) 29380088 – ext. 1401; (Danar) [email protected] – (021) 29380088 – ext. 1404; (Lita) – [email protected] – (021) 29380088 – ext. 1405
City/KabupatenIntensity
(MMI)
Occupation Interest
TOTAL
Agriculture, 6.62
Commercial, 1,268.80
Industrial, 13,613.04
Residential, 616.84 Building,
2,433.27
Content,
9,522.53
BI,
3,549.51
Agriculture,
755.75
Commercial,
369.05
Industrial,
414.33
Residential, 84.71
Building,
530.24
Content,
1,090.07
BI, 3.53
Your Reliable Partner in Catastrophe Risk Transfer
Agriculture, 6.62
Commercial, 1,268.80
Industrial, 13,613.04
Residential, 616.84
Building,
2,433.27
Content,
9,522.53
BI,
3,549.51
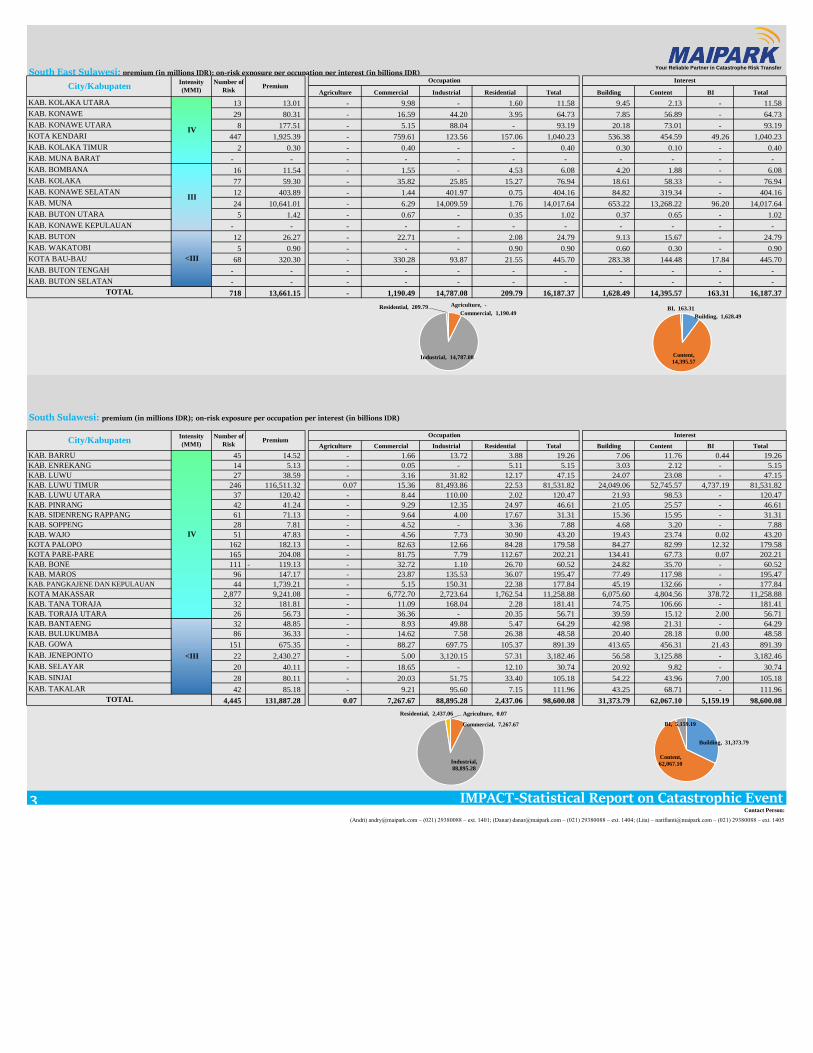
South East Sulawesi: premium (in millions IDR); on-risk exposure per occupation per interest (in billions IDR)
Agriculture Commercial Industrial Residential Total Building Content BI Total
KAB. KOLAKA UTARA 13 13.01 - 9.98 - 1.60 11.58 9.45 2.13 - 11.58
KAB. KONAWE 29 80.31 - 16.59 44.20 3.95 64.73 7.85 56.89 - 64.73
KAB. KONAWE UTARA 8 177.51 - 5.15 88.04 - 93.19 20.18 73.01 - 93.19
KOTA KENDARI 447 1,925.39 - 759.61 123.56 157.06 1,040.23 536.38 454.59 49.26 1,040.23
KAB. KOLAKA TIMUR 2 0.30 - 0.40 - - 0.40 0.30 0.10 - 0.40
KAB. MUNA BARAT - - - - - - - - - - -
KAB. BOMBANA 16 11.54 - 1.55 - 4.53 6.08 4.20 1.88 - 6.08
KAB. KOLAKA 77 59.30 - 35.82 25.85 15.27 76.94 18.61 58.33 - 76.94
KAB. KONAWE SELATAN 12 403.89 - 1.44 401.97 0.75 404.16 84.82 319.34 - 404.16
KAB. MUNA 24 10,641.01 - 6.29 14,009.59 1.76 14,017.64 653.22 13,268.22 96.20 14,017.64
KAB. BUTON UTARA 5 1.42 - 0.67 - 0.35 1.02 0.37 0.65 - 1.02
KAB. KONAWE KEPULAUAN - - - - - - - - - - -
KAB. BUTON 12 26.27 - 22.71 - 2.08 24.79 9.13 15.67 - 24.79
KAB. WAKATOBI 5 0.90 - - - 0.90 0.90 0.60 0.30 - 0.90
KOTA BAU-BAU 68 320.30 - 330.28 93.87 21.55 445.70 283.38 144.48 17.84 445.70
KAB. BUTON TENGAH - - - - - - - - - - -
KAB. BUTON SELATAN - - - - - - - - - - -
718 13,661.15 - 1,190.49 14,787.08 209.79 16,187.37 1,628.49 14,395.57 163.31 16,187.37
South Sulawesi: premium (in millions IDR); on-risk exposure per occupation per interest (in billions IDR)
Agriculture Commercial Industrial Residential Total Building Content BI Total
KAB. BARRU 45 14.52 - 1.66 13.72 3.88 19.26 7.06 11.76 0.44 19.26
KAB. ENREKANG 14 5.13 - 0.05 - 5.11 5.15 3.03 2.12 - 5.15
KAB. LUWU 27 38.59 - 3.16 31.82 12.17 47.15 24.07 23.08 - 47.15
KAB. LUWU TIMUR 246 116,511.32 0.07 15.36 81,493.86 22.53 81,531.82 24,049.06 52,745.57 4,737.19 81,531.82
KAB. LUWU UTARA 37 120.42 - 8.44 110.00 2.02 120.47 21.93 98.53 - 120.47
KAB. PINRANG 42 41.24 - 9.29 12.35 24.97 46.61 21.05 25.57 - 46.61
KAB. SIDENRENG RAPPANG 61 71.13 - 9.64 4.00 17.67 31.31 15.36 15.95 - 31.31
KAB. SOPPENG 28 7.81 - 4.52 - 3.36 7.88 4.68 3.20 - 7.88
KAB. WAJO 51 47.83 - 4.56 7.73 30.90 43.20 19.43 23.74 0.02 43.20
KOTA PALOPO 162 182.13 - 82.63 12.66 84.28 179.58 84.27 82.99 12.32 179.58
KOTA PARE-PARE 165 204.08 - 81.75 7.79 112.67 202.21 134.41 67.73 0.07 202.21
KAB. BONE 111 119.13- - 32.72 1.10 26.70 60.52 24.82 35.70 - 60.52
KAB. MAROS 96 147.17 - 23.87 135.53 36.07 195.47 77.49 117.98 - 195.47
KAB. PANGKAJENE DAN KEPULAUAN 44 1,739.21 - 5.15 150.31 22.38 177.84 45.19 132.66 - 177.84
KOTA MAKASSAR 2,877 9,241.08 - 6,772.70 2,723.64 1,762.54 11,258.88 6,075.60 4,804.56 378.72 11,258.88
KAB. TANA TORAJA 32 181.81 - 11.09 168.04 2.28 181.41 74.75 106.66 - 181.41
KAB. TORAJA UTARA 26 56.73 - 36.36 - 20.35 56.71 39.59 15.12 2.00 56.71
KAB. BANTAENG 32 48.85 - 8.93 49.88 5.47 64.29 42.98 21.31 - 64.29
KAB. BULUKUMBA 86 36.33 - 14.62 7.58 26.38 48.58 20.40 28.18 0.00 48.58
KAB. GOWA 151 675.35 - 88.27 697.75 105.37 891.39 413.65 456.31 21.43 891.39
KAB. JENEPONTO 22 2,430.27 - 5.00 3,120.15 57.31 3,182.46 56.58 3,125.88 - 3,182.46
KAB. SELAYAR 20 40.11 - 18.65 - 12.10 30.74 20.92 9.82 - 30.74
KAB. SINJAI 28 80.11 - 20.03 51.75 33.40 105.18 54.22 43.96 7.00 105.18
KAB. TAKALAR 42 85.18 - 9.21 95.60 7.15 111.96 43.25 68.71 - 111.96
4,445 131,887.28 0.07 7,267.67 88,895.28 2,437.06 98,600.08 31,373.79 62,067.10 5,159.19 98,600.08
3
TOTAL
IMPACT-Statistical Report on Catastrophic Event
IV
Contact Person:
(Andri) [email protected] – (021) 29380088 – ext. 1401; (Danar) [email protected] – (021) 29380088 – ext. 1404; (Lita) – [email protected] – (021) 29380088 – ext. 1405
TOTAL
City/KabupatenIntensity
(MMI)Premium
Occupation InterestNumber of
Risk
Interest
IV
III
<III
City/KabupatenIntensity
(MMI)
Number of
RiskPremium
Occupation
<III
Agriculture, -
Commercial, 1,190.49
Industrial, 14,787.08
Residential, 209.79
Building, 1,628.49
Content,
14,395.57
BI, 163.31
Agriculture, 0.07
Commercial, 7,267.67
Industrial,
88,895.28
Residential, 2,437.06
Building, 31,373.79
Content,
62,067.10
BI, 5,159.19
Your Reliable Partner in Catastrophe Risk Transfer
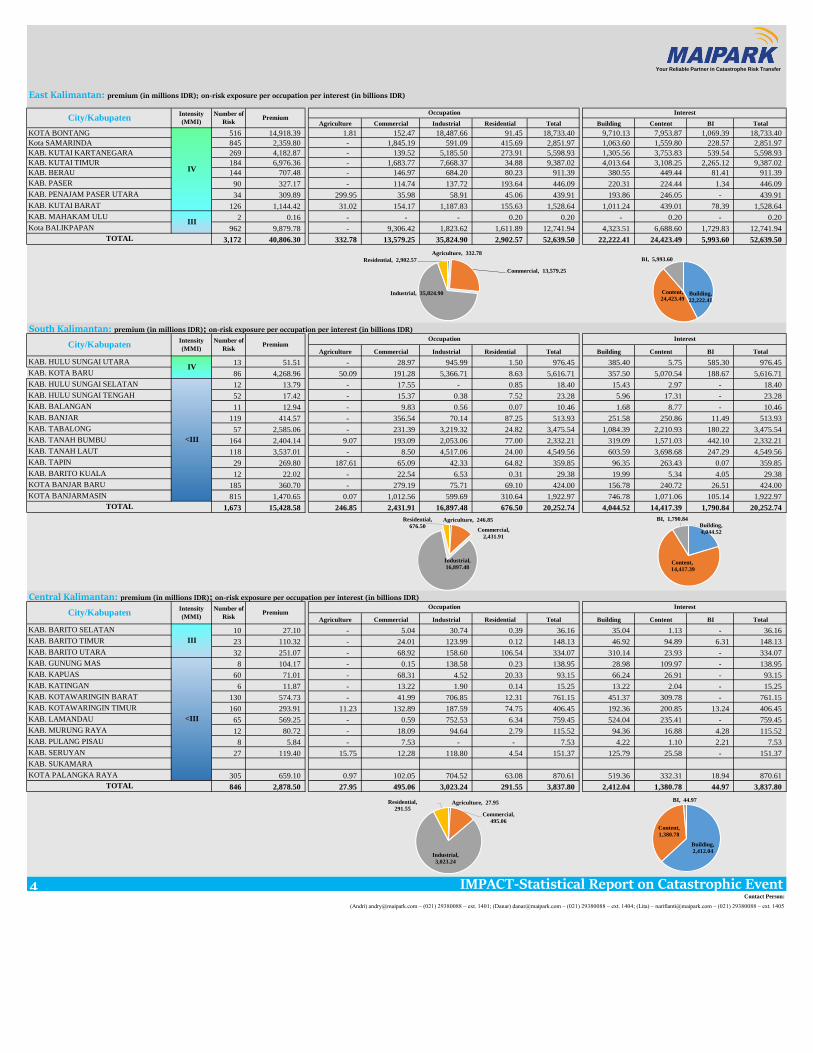
East Kalimantan: premium (in millions IDR); on-risk exposure per occupation per interest (in billions IDR)
Agriculture Commercial Industrial Residential Total Building Content BI Total
KOTA BONTANG 516 14,918.39 1.81 152.47 18,487.66 91.45 18,733.40 9,710.13 7,953.87 1,069.39 18,733.40
Kota SAMARINDA 845 2,359.80 - 1,845.19 591.09 415.69 2,851.97 1,063.60 1,559.80 228.57 2,851.97
KAB. KUTAI KARTANEGARA 269 4,182.87 - 139.52 5,185.50 273.91 5,598.93 1,305.56 3,753.83 539.54 5,598.93
KAB. KUTAI TIMUR 184 6,976.36 - 1,683.77 7,668.37 34.88 9,387.02 4,013.64 3,108.25 2,265.12 9,387.02
KAB. BERAU 144 707.48 - 146.97 684.20 80.23 911.39 380.55 449.44 81.41 911.39
KAB. PASER 90 327.17 - 114.74 137.72 193.64 446.09 220.31 224.44 1.34 446.09
KAB. PENAJAM PASER UTARA 34 309.89 299.95 35.98 58.91 45.06 439.91 193.86 246.05 - 439.91
KAB. KUTAI BARAT 126 1,144.42 31.02 154.17 1,187.83 155.63 1,528.64 1,011.24 439.01 78.39 1,528.64
KAB. MAHAKAM ULU 2 0.16 - - - 0.20 0.20 - 0.20 - 0.20
Kota BALIKPAPAN 962 9,879.78 - 9,306.42 1,823.62 1,611.89 12,741.94 4,323.51 6,688.60 1,729.83 12,741.94
3,172 40,806.30 332.78 13,579.25 35,824.90 2,902.57 52,639.50 22,222.41 24,423.49 5,993.60 52,639.50
South Kalimantan: premium (in millions IDR); on-risk exposure per occupation per interest (in billions IDR)
Agriculture Commercial Industrial Residential Total Building Content BI Total
KAB. HULU SUNGAI UTARA 13 51.51 - 28.97 945.99 1.50 976.45 385.40 5.75 585.30 976.45
KAB. KOTA BARU 86 4,268.96 50.09 191.28 5,366.71 8.63 5,616.71 357.50 5,070.54 188.67 5,616.71
KAB. HULU SUNGAI SELATAN 12 13.79 - 17.55 - 0.85 18.40 15.43 2.97 - 18.40
KAB. HULU SUNGAI TENGAH 52 17.42 - 15.37 0.38 7.52 23.28 5.96 17.31 - 23.28
KAB. BALANGAN 11 12.94 - 9.83 0.56 0.07 10.46 1.68 8.77 - 10.46
KAB. BANJAR 119 414.57 - 356.54 70.14 87.25 513.93 251.58 250.86 11.49 513.93
KAB. TABALONG 57 2,585.06 - 231.39 3,219.32 24.82 3,475.54 1,084.39 2,210.93 180.22 3,475.54
KAB. TANAH BUMBU 164 2,404.14 9.07 193.09 2,053.06 77.00 2,332.21 319.09 1,571.03 442.10 2,332.21
KAB. TANAH LAUT 118 3,537.01 - 8.50 4,517.06 24.00 4,549.56 603.59 3,698.68 247.29 4,549.56
KAB. TAPIN 29 269.80 187.61 65.09 42.33 64.82 359.85 96.35 263.43 0.07 359.85
KAB. BARITO KUALA 12 22.02 - 22.54 6.53 0.31 29.38 19.99 5.34 4.05 29.38
KOTA BANJAR BARU 185 360.70 - 279.19 75.71 69.10 424.00 156.78 240.72 26.51 424.00
KOTA BANJARMASIN 815 1,470.65 0.07 1,012.56 599.69 310.64 1,922.97 746.78 1,071.06 105.14 1,922.97
1,673 15,428.58 246.85 2,431.91 16,897.48 676.50 20,252.74 4,044.52 14,417.39 1,790.84 20,252.74
Central Kalimantan: premium (in millions IDR); on-risk exposure per occupation per interest (in billions IDR)
Agriculture Commercial Industrial Residential Total Building Content BI Total
KAB. BARITO SELATAN 10 27.10 - 5.04 30.74 0.39 36.16 35.04 1.13 - 36.16
KAB. BARITO TIMUR 23 110.32 - 24.01 123.99 0.12 148.13 46.92 94.89 6.31 148.13
KAB. BARITO UTARA 32 251.07 - 68.92 158.60 106.54 334.07 310.14 23.93 - 334.07
KAB. GUNUNG MAS 8 104.17 - 0.15 138.58 0.23 138.95 28.98 109.97 - 138.95
KAB. KAPUAS 60 71.01 - 68.31 4.52 20.33 93.15 66.24 26.91 - 93.15
KAB. KATINGAN 6 11.87 - 13.22 1.90 0.14 15.25 13.22 2.04 - 15.25
KAB. KOTAWARINGIN BARAT 130 574.73 - 41.99 706.85 12.31 761.15 451.37 309.78 - 761.15
KAB. KOTAWARINGIN TIMUR 160 293.91 11.23 132.89 187.59 74.75 406.45 192.36 200.85 13.24 406.45
KAB. LAMANDAU 65 569.25 - 0.59 752.53 6.34 759.45 524.04 235.41 - 759.45
KAB. MURUNG RAYA 12 80.72 - 18.09 94.64 2.79 115.52 94.36 16.88 4.28 115.52
KAB. PULANG PISAU 8 5.84 - 7.53 - - 7.53 4.22 1.10 2.21 7.53
KAB. SERUYAN 27 119.40 15.75 12.28 118.80 4.54 151.37 125.79 25.58 - 151.37
KAB. SUKAMARA
KOTA PALANGKA RAYA 305 659.10 0.97 102.05 704.52 63.08 870.61 519.36 332.31 18.94 870.61
846 2,878.50 27.95 495.06 3,023.24 291.55 3,837.80 2,412.04 1,380.78 44.97 3,837.80
4
Occupation
<III
TOTAL
City/KabupatenIntensity
(MMI)
Number of
RiskPremium
Occupation Interest
IV
IV
III
<III
TOTAL
InterestCity/Kabupaten
Intensity
(MMI)
Number of
RiskPremium
City/KabupatenIntensity
(MMI)
Number of
RiskPremium
Occupation Interest
TOTAL
IMPACT-Statistical Report on Catastrophic EventContact Person:
(Andri) [email protected] – (021) 29380088 – ext. 1401; (Danar) [email protected] – (021) 29380088 – ext. 1404; (Lita) – [email protected] – (021) 29380088 – ext. 1405
III
Agriculture, 332.78
Commercial, 13,579.25
Industrial, 35,824.90
Residential, 2,902.57
Building,
22,222.41
Content,
24,423.49
BI, 5,993.60
Agriculture, 246.85
Commercial,
2,431.91
Industrial,
16,897.48
Residential,
676.50 Building,
4,044.52
Content,
14,417.39
BI, 1,790.84
Your Reliable Partner in Catastrophe Risk Transfer
Agriculture, 27.95
Commercial,
495.06
Industrial,
3,023.24
Residential,
291.55
Building,
2,412.04
Content,
1,380.78
BI, 44.97
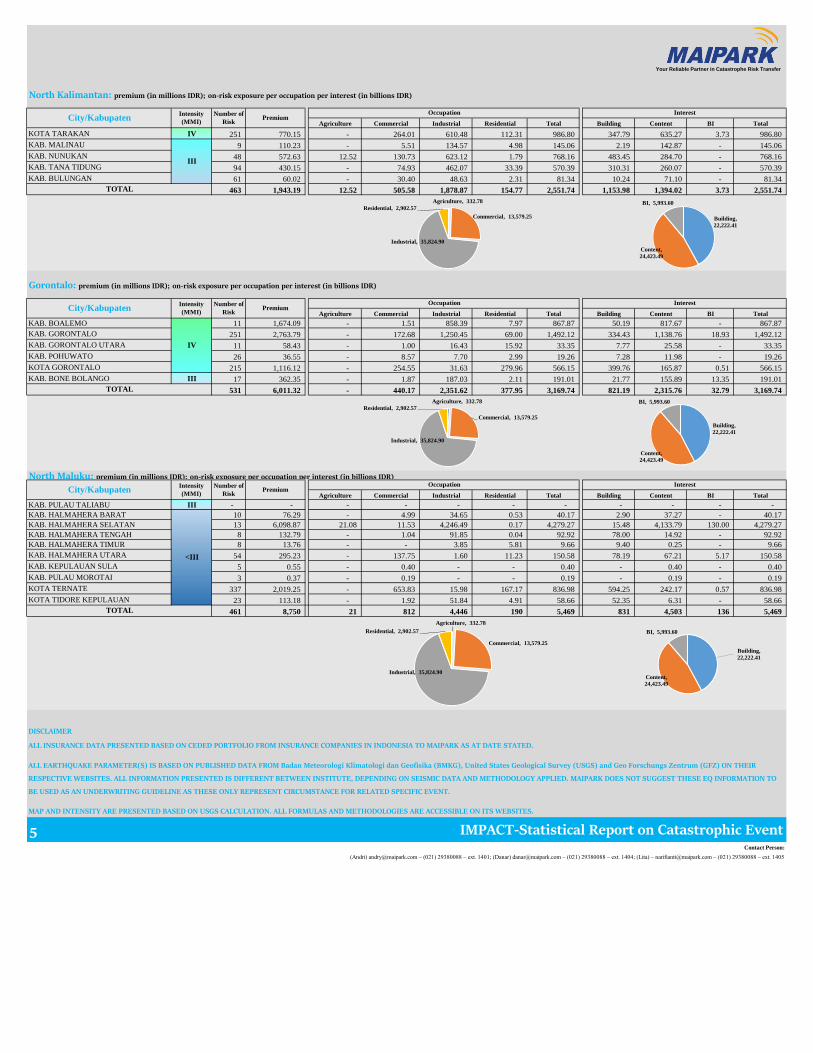
North Kalimantan: premium (in millions IDR); on-risk exposure per occupation per interest (in billions IDR)
Agriculture Commercial Industrial Residential Total Building Content BI Total
KOTA TARAKAN IV 251 770.15 - 264.01 610.48 112.31 986.80 347.79 635.27 3.73 986.80
KAB. MALINAU 9 110.23 - 5.51 134.57 4.98 145.06 2.19 142.87 - 145.06
KAB. NUNUKAN 48 572.63 12.52 130.73 623.12 1.79 768.16 483.45 284.70 - 768.16
KAB. TANA TIDUNG 94 430.15 - 74.93 462.07 33.39 570.39 310.31 260.07 - 570.39
KAB. BULUNGAN 61 60.02 - 30.40 48.63 2.31 81.34 10.24 71.10 - 81.34
463 1,943.19 12.52 505.58 1,878.87 154.77 2,551.74 1,153.98 1,394.02 3.73 2,551.74
Gorontalo: premium (in millions IDR); on-risk exposure per occupation per interest (in billions IDR)
Agriculture Commercial Industrial Residential Total Building Content BI Total
KAB. BOALEMO 11 1,674.09 - 1.51 858.39 7.97 867.87 50.19 817.67 - 867.87
KAB. GORONTALO 251 2,763.79 - 172.68 1,250.45 69.00 1,492.12 334.43 1,138.76 18.93 1,492.12
KAB. GORONTALO UTARA 11 58.43 - 1.00 16.43 15.92 33.35 7.77 25.58 - 33.35
KAB. POHUWATO 26 36.55 - 8.57 7.70 2.99 19.26 7.28 11.98 - 19.26
KOTA GORONTALO 215 1,116.12 - 254.55 31.63 279.96 566.15 399.76 165.87 0.51 566.15
KAB. BONE BOLANGO III 17 362.35 - 1.87 187.03 2.11 191.01 21.77 155.89 13.35 191.01
531 6,011.32 - 440.17 2,351.62 377.95 3,169.74 821.19 2,315.76 32.79 3,169.74
North Maluku: premium (in millions IDR); on-risk exposure per occupation per interest (in billions IDR)
Agriculture Commercial Industrial Residential Total Building Content BI Total
KAB. PULAU TALIABU III - - - - - - - - - - -
KAB. HALMAHERA BARAT 10 76.29 - 4.99 34.65 0.53 40.17 2.90 37.27 - 40.17
KAB. HALMAHERA SELATAN 13 6,098.87 21.08 11.53 4,246.49 0.17 4,279.27 15.48 4,133.79 130.00 4,279.27
KAB. HALMAHERA TENGAH 8 132.79 - 1.04 91.85 0.04 92.92 78.00 14.92 - 92.92
KAB. HALMAHERA TIMUR 8 13.76 - - 3.85 5.81 9.66 9.40 0.25 - 9.66
KAB. HALMAHERA UTARA 54 295.23 - 137.75 1.60 11.23 150.58 78.19 67.21 5.17 150.58
KAB. KEPULAUAN SULA 5 0.55 - 0.40 - - 0.40 - 0.40 - 0.40
KAB. PULAU MOROTAI 3 0.37 - 0.19 - - 0.19 - 0.19 - 0.19
KOTA TERNATE 337 2,019.25 - 653.83 15.98 167.17 836.98 594.25 242.17 0.57 836.98
KOTA TIDORE KEPULAUAN 23 113.18 - 1.92 51.84 4.91 58.66 52.35 6.31 - 58.66
461 8,750 21 812 4,446 190 5,469 831 4,503 136 5,469
DISCLAIMER
ALL INSURANCE DATA PRESENTED BASED ON CEDED PORTFOLIO FROM INSURANCE COMPANIES IN INDONESIA TO MAIPARK AS AT DATE STATED.
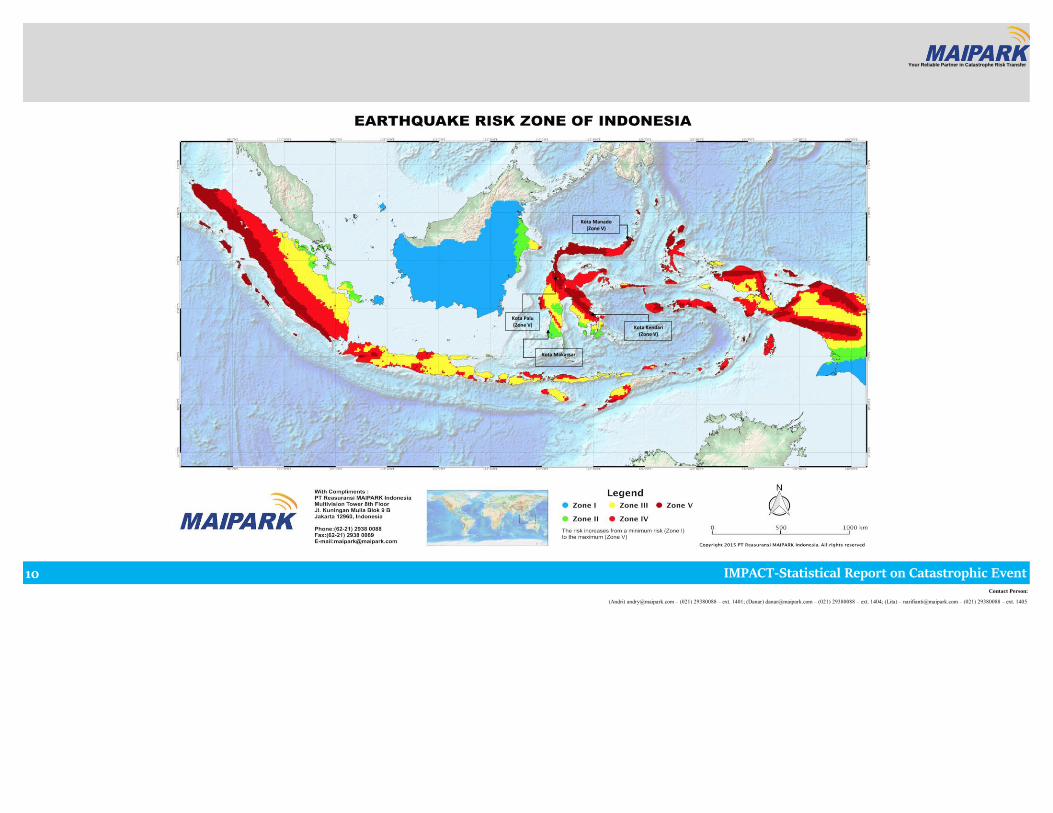
MAP AND INTENSITY ARE PRESENTED BASED ON USGS CALCULATION. ALL FORMULAS AND METHODOLOGIES ARE ACCESSIBLE ON ITS WEBSITES.
5
(Andri) [email protected] – (021) 29380088 – ext. 1401; (Danar) [email protected] – (021) 29380088 – ext. 1404; (Lita) – [email protected] – (021) 29380088 – ext. 1405
ALL EARTHQUAKE PARAMETER(S) IS BASED ON PUBLISHED DATA FROM Badan Meteorologi Klimatologi dan Geofisika (BMKG), United States Geological Survey (USGS) and Geo Forschungs Zentrum (GFZ) ON THEIR
RESPECTIVE WEBSITES. ALL INFORMATION PRESENTED IS DIFFERENT BETWEEN INSTITUTE, DEPENDING ON SEISMIC DATA AND METHODOLOGY APPLIED. MAIPARK DOES NOT SUGGEST THESE EQ INFORMATION TO
BE USED AS AN UNDERWRITING GUIDELINE AS THESE ONLY REPRESENT CIRCUMSTANCE FOR RELATED SPECIFIC EVENT.
IMPACT-Statistical Report on Catastrophic EventContact Person:
City/KabupatenIntensity
(MMI)Premium
Occupation Interest
TOTAL
City/KabupatenIntensity
(MMI)
Number of
Risk
TOTAL
Occupation Interest
TOTAL
City/KabupatenIntensity
(MMI)
Number of
RiskPremium
Occupation Interest
<III
IV
Premium
III
Number of
Risk
Agriculture, 332.78
Commercial, 13,579.25
Industrial, 35,824.90
Residential, 2,902.57
Building,
22,222.41
Content,
24,423.49
BI, 5,993.60
Your Reliable Partner in Catastrophe Risk Transfer
Agriculture, 332.78
Commercial, 13,579.25
Industrial, 35,824.90
Residential, 2,902.57
Building,
22,222.41
Content,
24,423.49
BI, 5,993.60
Agriculture, 332.78
Commercial, 13,579.25
Industrial, 35,824.90
Residential, 2,902.57
Building,
22,222.41
Content,
24,423.49
BI, 5,993.60
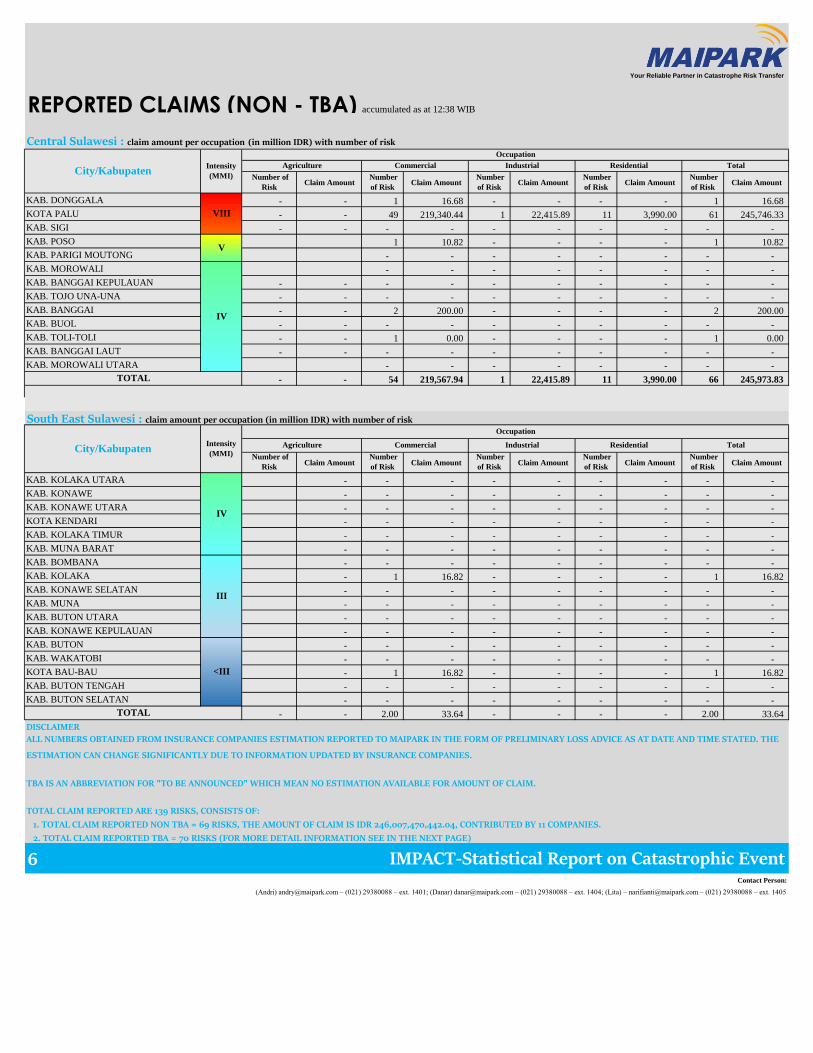
REPORTED CLAIMS (NON - TBA) accumulated as at 12:38 WIB
Central Sulawesi : claim amount per occupation (in million IDR) with number of risk
Number of
Risk Claim Amount
Number
of Risk Claim Amount
Number
of Risk Claim Amount
Number
of Risk Claim Amount
Number
of Risk Claim Amount
KAB. DONGGALA - - 1 16.68 - - - - 1 16.68
KOTA PALU - - 49 219,340.44 1 22,415.89 11 3,990.00 61 245,746.33
KAB. SIGI - - - - - - - - - -
KAB. POSO 1 10.82 - - - - 1 10.82
KAB. PARIGI MOUTONG - - - - - - - -
KAB. MOROWALI - - - - - - - -
KAB. BANGGAI KEPULAUAN - - - - - - - - - -
KAB. TOJO UNA-UNA - - - - - - - - - -
KAB. BANGGAI - - 2 200.00 - - - - 2 200.00
KAB. BUOL - - - - - - - - - -
KAB. TOLI-TOLI - - 1 0.00 - - - - 1 0.00
KAB. BANGGAI LAUT - - - - - - - - - -
KAB. MOROWALI UTARA - - - - - - - -
- - 54 219,567.94 1 22,415.89 11 3,990.00 66 245,973.83
South East Sulawesi : claim amount per occupation (in million IDR) with number of risk
Number of
Risk Claim Amount
Number
of Risk Claim Amount
Number
of Risk Claim Amount
Number
of Risk Claim Amount
Number
of Risk Claim Amount
KAB. KOLAKA UTARA - - - - - - - - -
KAB. KONAWE - - - - - - - - -
KAB. KONAWE UTARA - - - - - - - - -
KOTA KENDARI - - - - - - - - -
KAB. KOLAKA TIMUR - - - - - - - - -
KAB. MUNA BARAT - - - - - - - - -
KAB. BOMBANA - - - - - - - - -
KAB. KOLAKA - 1 16.82 - - - - 1 16.82
KAB. KONAWE SELATAN - - - - - - - - -
KAB. MUNA - - - - - - - - -
KAB. BUTON UTARA - - - - - - - - -
KAB. KONAWE KEPULAUAN - - - - - - - - -
KAB. BUTON - - - - - - - - -
KAB. WAKATOBI - - - - - - - - -
KOTA BAU-BAU - 1 16.82 - - - - 1 16.82
KAB. BUTON TENGAH - - - - - - - - -
KAB. BUTON SELATAN - - - - - - - - -
- - 2.00 33.64 - - - - 2.00 33.64
DISCLAIMER
6 IMPACT-Statistical Report on Catastrophic EventContact Person:
Intensity
(MMI)City/Kabupaten
TBA IS AN ABBREVIATION FOR "TO BE ANNOUNCED" WHICH MEAN NO ESTIMATION AVAILABLE FOR AMOUNT OF CLAIM.
Occupation
Agriculture Commercial
(Andri) [email protected] – (021) 29380088 – ext. 1401; (Danar) [email protected] – (021) 29380088 – ext. 1404; (Lita) – [email protected] – (021) 29380088 – ext. 1405
ALL NUMBERS OBTAINED FROM INSURANCE COMPANIES ESTIMATION REPORTED TO MAIPARK IN THE FORM OF PRELIMINARY LOSS ADVICE AS AT DATE AND TIME STATED. THE
ESTIMATION CAN CHANGE SIGNIFICANTLY DUE TO INFORMATION UPDATED BY INSURANCE COMPANIES.
TOTAL CLAIM REPORTED ARE 139 RISKS, CONSISTS OF:
1. TOTAL CLAIM REPORTED NON TBA = 69 RISKS, THE AMOUNT OF CLAIM IS IDR 246,007,470,442.04, CONTRIBUTED BY 11 COMPANIES.
2. TOTAL CLAIM REPORTED TBA = 70 RISKS (FOR MORE DETAIL INFORMATION SEE IN THE NEXT PAGE)
TOTAL
Occupation
TotalCity/Kabupaten
Intensity
(MMI)
Agriculture Commercial Industrial Residential
TOTAL
Industrial Residential Total
IV
III
<III
VIII
V
IV
Your Reliable Partner in Catastrophe Risk Transfer
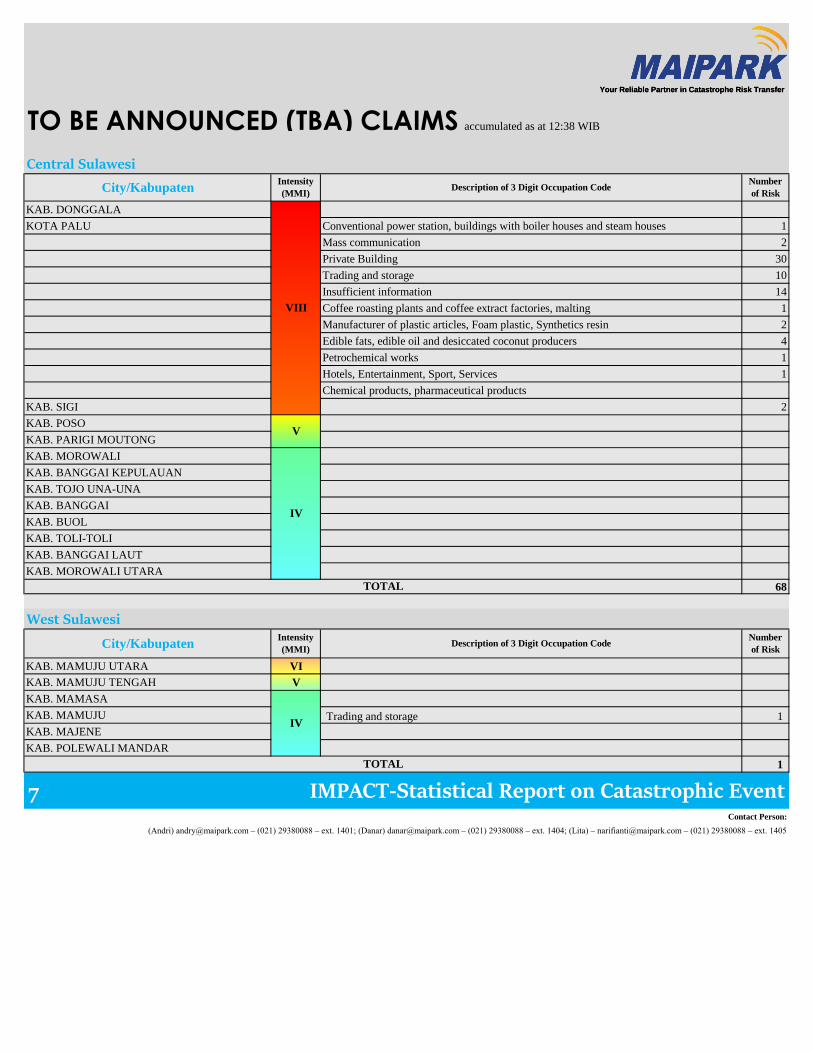
TO BE ANNOUNCED (TBA) CLAIMS accumulated as at 12:38 WIB
Central Sulawesi
KAB. DONGGALA
KOTA PALU Conventional power station, buildings with boiler houses and steam houses 1
Mass communication 2
Private Building 30
Trading and storage 10
Insufficient information 14
Coffee roasting plants and coffee extract factories, malting 1
Manufacturer of plastic articles, Foam plastic, Synthetics resin 2
Edible fats, edible oil and desiccated coconut producers 4
Petrochemical works 1
Hotels, Entertainment, Sport, Services 1
Chemical products, pharmaceutical products
KAB. SIGI 2
KAB. POSO
KAB. PARIGI MOUTONG
KAB. MOROWALI
KAB. BANGGAI KEPULAUAN
KAB. TOJO UNA-UNA
KAB. BANGGAI
KAB. BUOL
KAB. TOLI-TOLI
KAB. BANGGAI LAUT
KAB. MOROWALI UTARA
68
West Sulawesi
KAB. MAMUJU UTARA VI
KAB. MAMUJU TENGAH V
KAB. MAMASA
KAB. MAMUJU Trading and storage 1
KAB. MAJENE
KAB. POLEWALI MANDAR
1
7
City/KabupatenIntensity
(MMI)Description of 3 Digit Occupation Code
IMPACT-Statistical Report on Catastrophic EventContact Person:
TOTAL
Description of 3 Digit Occupation Code
Number
of Risk
V
VIII
IV
IV
(Andri) [email protected] – (021) 29380088 – ext. 1401; (Danar) [email protected] – (021) 29380088 – ext. 1404; (Lita) – [email protected] – (021) 29380088 – ext. 1405
TOTAL
Number
of RiskCity/Kabupaten
Intensity
(MMI)
Your Reliable Partner in Catastrophe Risk TransferYour Reliable Partner in Catastrophe Risk Transfer
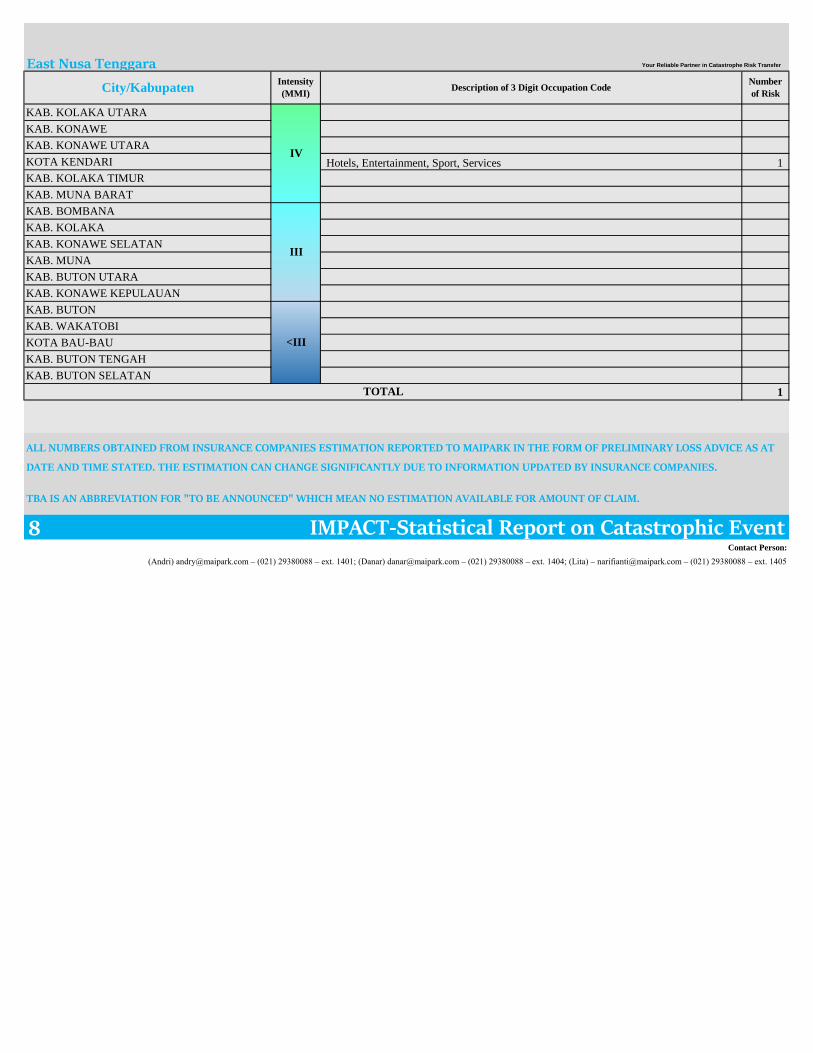
East Nusa Tenggara
KAB. KOLAKA UTARA
KAB. KONAWE
KAB. KONAWE UTARA
KOTA KENDARI Hotels, Entertainment, Sport, Services 1
KAB. KOLAKA TIMUR
KAB. MUNA BARAT
KAB. BOMBANA
KAB. KOLAKA
KAB. KONAWE SELATAN
KAB. MUNA
KAB. BUTON UTARA
KAB. KONAWE KEPULAUAN
KAB. BUTON
KAB. WAKATOBI
KOTA BAU-BAU
KAB. BUTON TENGAH
KAB. BUTON SELATAN
1
8
TOTAL
Description of 3 Digit Occupation CodeCity/KabupatenIntensity
(MMI)
(Andri) [email protected] – (021) 29380088 – ext. 1401; (Danar) [email protected] – (021) 29380088 – ext. 1404; (Lita) – [email protected] – (021) 29380088 – ext. 1405
IMPACT-Statistical Report on Catastrophic EventContact Person:
ALL NUMBERS OBTAINED FROM INSURANCE COMPANIES ESTIMATION REPORTED TO MAIPARK IN THE FORM OF PRELIMINARY LOSS ADVICE AS AT
DATE AND TIME STATED. THE ESTIMATION CAN CHANGE SIGNIFICANTLY DUE TO INFORMATION UPDATED BY INSURANCE COMPANIES.
TBA IS AN ABBREVIATION FOR "TO BE ANNOUNCED" WHICH MEAN NO ESTIMATION AVAILABLE FOR AMOUNT OF CLAIM.
<III
IV
III
Number
of Risk
Your Reliable Partner in Catastrophe Risk Transfer
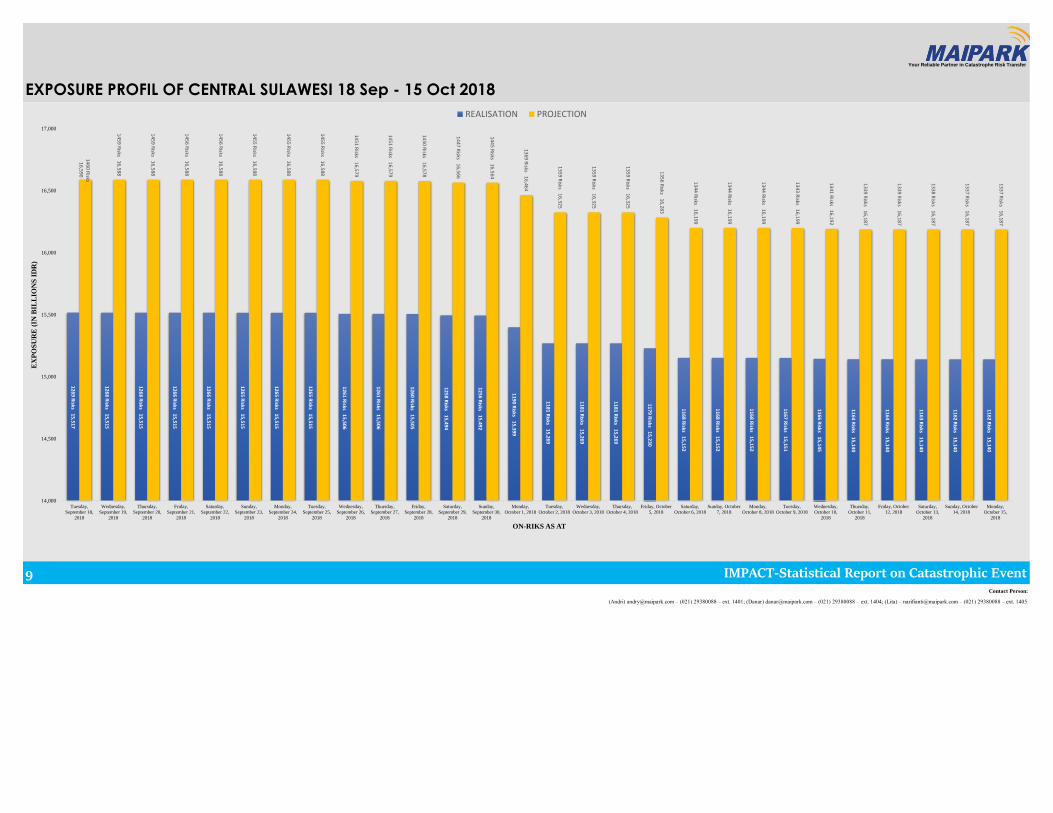
EXPOSURE PROFIL OF CENTRAL SULAWESI 18 Sep - 15 Oct 2018
9 IMPACT-Statistical Report on Catastrophic EventContact Person:
(Andri) [email protected] – (021) 29380088 – ext. 1401; (Danar) [email protected] – (021) 29380088 – ext. 1404; (Lita) – [email protected] – (021) 29380088 – ext. 1405
Your Reliable Partner in Catastrophe Risk Transfer
12
69
Risks
15
,51
7
12
68
Risks
15
,51
5
12
68
Risks
15
,51
5
12
66
Risks
15
,51
5
12
66
Risks
15
,51
5
12
65
Risks
15
,51
5
12
65
Risks
15
,51
5
12
65
Risks
15
,51
5
12
61
Risks
15
,50
6
12
61
Risks
15
,50
6
12
60
Risks
15
,50
5
12
58
Risks
15
,49
4
12
56
Risks
15
,49
2
11
90
Risks
15
,39
9
11
81
Risks
15
,26
9
11
81
Risks
15
,26
9
11
81
Risks
15
,26
9
11
79
Risks
15
,23
0
11
68
Risks
15
,15
2
11
68
Risks
15
,15
2
11
68
Risks
15
,15
2
11
67
Risks
15
,15
1
11
66
Risks
15
,14
5
11
64
Risks
15
,14
0
11
64
Risks
15
,14
0
11
63
Risks
15
,14
0
11
62
Risks
15
,14
0
11
62
Risks
15
,14
0
14
60
Risks
16
,59
0
14
59
Risks
16
,58
8
14
59
Risks
16
,58
8
14
56
Risks
16
,58
8
14
56
Risks
16
,58
8
14
55
Risks
16
,58
8
14
55
Risks
16
,58
8
14
55
Risks
16
,58
8
14
51
Risks
16
,57
9
14
51
Risks
16
,57
9
14
50
Risks
16
,57
8
14
47
Risks
16
,56
6
14
45
Risks
16
,56
4
13
69
Risks
16
,46
4
13
59
Risks
16
,32
5
13
59
Risks
16
,32
5
13
59
Risks
16
,32
5
13
56
Risks
16
,28
3
13
44
Risks
16
,19
9
13
44
Risks
16
,19
9
13
44
Risks
16
,19
9
13
43
Risks
16
,19
9
13
41
Risks
16
,19
2
13
39
Risks
16
,18
7
13
39
Risks
16
,18
7
13
38
Risks
16
,18
7
13
37
Risks
16
,18
7
13
37
Risks
16
,18
7
14,000
14,500
15,000
15,500
16,000
16,500
17,000
Tuesday,
September 18,
2018
Wednesday,
September 19,
2018
Thursday,
September 20,
2018
Friday,
September 21,
2018
Saturday,
September 22,
2018
Sunday,
September 23,
2018
Monday,
September 24,
2018
Tuesday,
September 25,
2018
Wednesday,
September 26,
2018
Thursday,
September 27,
2018
Friday,
September 28,
2018
Saturday,
September 29,
2018
Sunday,
September 30,
2018
Monday,
October 1, 2018
Tuesday,
October 2, 2018
Wednesday,
October 3, 2018
Thursday,
October 4, 2018
Friday, October
5, 2018
Saturday,
October 6, 2018
Sunday, October
7, 2018
Monday,
October 8, 2018
Tuesday,
October 9, 2018
Wednesday,
October 10,
2018
Thursday,
October 11,
2018
Friday, October
12, 2018
Saturday,
October 13,
2018
Sunday, October
14, 2018
Monday,
October 15,
2018
EX
PO
SU
RE
(IN
BIL
LIO
NS
ID
R)
ON-RIKS AS AT
REALISATION PROJECTION
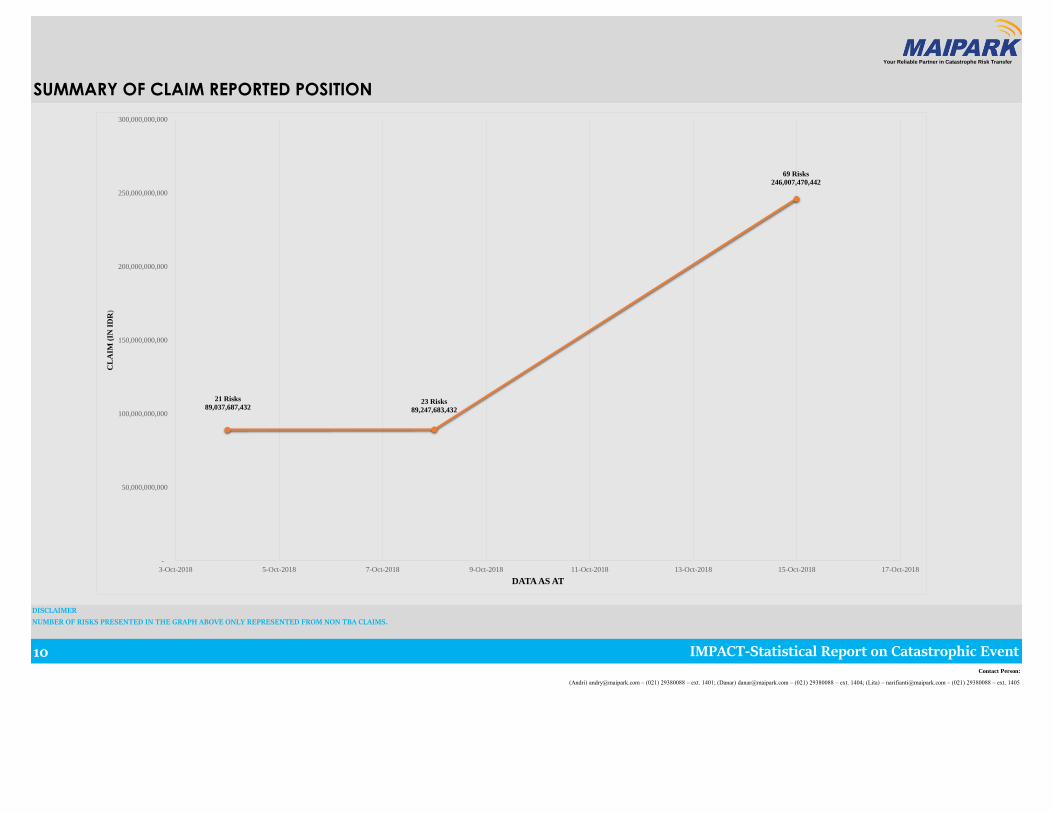
SUMMARY OF CLAIM REPORTED POSITION
DISCLAIMER
NUMBER OF RISKS PRESENTED IN THE GRAPH ABOVE ONLY REPRESENTED FROM NON TBA CLAIMS.
10 IMPACT-Statistical Report on Catastrophic EventContact Person:
(Andri) [email protected] – (021) 29380088 – ext. 1401; (Danar) [email protected] – (021) 29380088 – ext. 1404; (Lita) – [email protected] – (021) 29380088 – ext. 1405
Your Reliable Partner in Catastrophe Risk Transfer
21 Risks
89,037,687,432 23 Risks
89,247,683,432
69 Risks
246,007,470,442
-
50,000,000,000
100,000,000,000
150,000,000,000
200,000,000,000
250,000,000,000
300,000,000,000
3-Oct-2018 5-Oct-2018 7-Oct-2018 9-Oct-2018 11-Oct-2018 13-Oct-2018 15-Oct-2018 17-Oct-2018
CL
AIM
(IN
ID
R)
DATA AS AT
10 IMPACT-Statistical Report on Catastrophic EventContact Person:
(Andri) [email protected] – (021) 29380088 – ext. 1401; (Danar) [email protected] – (021) 29380088 – ext. 1404; (Lita) – [email protected] – (021) 29380088 – ext. 1405
Your Reliable Partner in Catastrophe Risk Transfer
Kota Palu(Zone V)
Kota Makassar
Kota Kendari(Zone V)
Kota Manado(Zone V)