Embed Size (px)
Citation preview

DP
VICO
Digital Pulse Processor
Manual
www.ketek.net [email protected]
Hofer Str. 3 81737 Munich Germany
phone +49 89 673 467 70 fax +49 89 673 467 77
KETEK GmbH


Table of Contents
1 Safety instructions ........................................................................................................... 1
2 Product Description......................................................................................................... 12.1 Features ...................................................................................................................2
2.1.1 General Spectrometer Features .......................................................................22.1.2 Embedded Systems Features ...........................................................................22.1.3 Multichannel Operation ................................................................................... 2
2.2 Hardware Requirements ..........................................................................................22.3 Hardware Options ...................................................................................................3
2.3.1 Communications .............................................................................................. 32.3.2 Analog Input .................................................................................................... 32.3.3 Gain and Calibration ........................................................................................ 3
2.4 Software Overview ..................................................................................................32.4.1 User Interface, e.g. ProSpect ........................................................................... 32.4.2 Device Drivers, e.g. Handel (DLL) .....................................................................32.4.3 Firmware .......................................................................................................... 4
3 The ProSpect Software .................................................................................................... 43.1 Installation ...............................................................................................................43.2 Starting ProSpect for the First Time ......................................................................... 43.3 A Tour Through the Basic ProSpect Features ........................................................... 6
3.3.1 The Settings Panel ............................................................................................ 63.3.2 The Main Panel ................................................................................................ 73.3.3 Preview of the Setup Process .......................................................................... 73.3.4 Parameter Settings: GLOBSET, PARSETs, and GENSETs .....................................7
3.4 Detector/Preamplifier (GLOBSET) Settings .............................................................. 83.4.1 Viewing the Preamplifier Signal .......................................................................83.4.2 Setting the Polarity .......................................................................................... 93.4.3 Setting the Reset Interval (Reset-Type Preamplifiers) ......................................9
3.5 MCA (GENSET) Settings .........................................................................................103.5.1 Gain Overview ............................................................................................... 103.5.2 Setting the Dynamic Range ............................................................................103.5.3 Setting the Base Gain ..................................................................................... 103.5.4 MCA Format ................................................................................................... 12
DP
VICO

3.6 Spectrum Acquisition .............................................................................................133.6.1 ROI Selection ...................................................................................................143.6.2 Base Gain Calibration ......................................................................................15
3.7 Peaking Time (PARSET) Optimization ......................................................................163.7.1 Threshold Settings ..........................................................................................173.7.2 Fine Gain Trim .................................................................................................183.7.3 Optimization of the Remaining PARSETs .........................................................193.7.4 Advanced Optimizations .................................................................................193.7.5 Viewing the Run statistics ...............................................................................253.7.6 Livetime and Deadtime ...................................................................................253.7.7 Saving a Spectrum...........................................................................................25
3.8 Diagnostics .............................................................................................................263.8.1 Board Status and Information .........................................................................263.8.2 Log Files ..........................................................................................................273.8.3 The Scope Tool ................................................................................................273.8.4 Baseline Acquisition ........................................................................................31
4 Contact ...........................................................................................................................35
Revision history:
Rev. 1.2, December 2017: Adapted to the ProSpect 1.1.14 Rev. 1.1, July 2017: Multichannel section 2.1.3 added Rev. 1.0, June 2016

12th December 2017 Rev. 1.2 Page 1
The safety instructions are provided both for your protection and to prevent damage to the VICO-DP and connected equipment. This safety information applies to all operators and service personnel.
2 Product DescriptionThe high-performance Digital Pulse Processor VICO-DP is a high-rate, digitally-based, multi-channel analyzer (MCA), designed for energy-dispersive X-ray measurements in benchtop, portable and embedded systems.
Its analog front-end is optimized for KETEKs preamplifiers. The VICO-DP offers computer control over all available amplifier and spectrometer parameters including gain, filter peaking time, and pileup inspection criteria. VICO-DP firmware and parameters are stored locally in non-volatile memory.
The VICO-DP features extremely short peaking times down to 100 ns and is optimized for KETEKs CUBE-based SDD modules.
The VICO-DP is available as a plugin module for KETEKs AXAS-A, AXAS-C, and for KETEKs open frame solution for OEMs.
The VICO-DP software is warranted against all defects for one year.
Dear Customer,
Thank you for choosing the KETEK VICO-DP. We ensure you that this product has been manufactured with highest industry standards in order to meet your quality expectations. Our highest priority is to deliver you the best product on the market.
The purpose of this start-up guide is to provide new KETEK VICO-DP users with an easy-to-use reference for getting to work with the ProSpect software application.
1 Safety instructions
It is strongly recommended to keep to the instructions in this manual when installing the VICO-DP.
Please keep this user manual always with the system to allow any operator access to this important information.
NOTE
DP
VICO
VICO-DP Manual Page 2
2.1 Features2.1.1 General Spectrometer Features
• Dimensions: 46.55mm x 31.3mm x 11mm.
• Operates with all KETEK-SDDs and AXAS.
• The VICO-DP requires several DC voltage supplies for operation. The VICO DP’s power consumption is less than 1 Watt
• Multi-channel analysis with up to 8K (8192) bins allows for optimal use of data to separate fluorescence signal from backgrounds.
• Instantaneous throughput beyond 1,000,000 counts per second (cps).
• Digital trapezoidal filtering, with programmable peaking times between 100 ns and 24 µs in 24 steps.
• Digitally-controlled analog gain: 6 dB range, 2 discrete settings.
• Digital fine gain trim: 16-bit precision.
• Pileup inspection criteria computer settable, including fast channel peaking time, threshold, and rejection criterion.
• Accurate ICR and live-time reporting for precise dead-time corrections.
2.1.2 Embedded Systems Features
• Data acquisition and control via USB 2.0 high-speed or RS-232.
• Twenty-four (24) sets of optimized spectrometer parameters, or PARSETs, are stored and retrieved on a per-peaking-time basis in nonvolative memory.
• Five (5) sets of MCA parameters, or GENSETs, are stored and retrieved in nonvolative memory.
• The provided ProSpect software application for VICO-DP parameter set configuration—intended for use both in evaluation and production phases.
• DLL. The combination of ProSpect+DLL only works with Windows. The source code package for Windows or Unix is available on request.
2.1.3 Multichannel Operation
Several systems equipped with VICO-DPs can be connected to the same host PC and operated simultaneously.
The Prospect software is only available for Windows operating systems!
NOTE
Multichannel operation is only possible in case of the systems with the same VICO-DP firmware version. Otherwise a reliable operation cannot be guaranteed. This could be the case if the systems have been purchased separately. Please contact KETEK for more details.
NOTE
2.2 Hardware RequirementsHost Computer
The VICO-DP can communicate with any host computer/controller via USB or RS-232.
12th December 2017 Rev. 1.2 Page 3
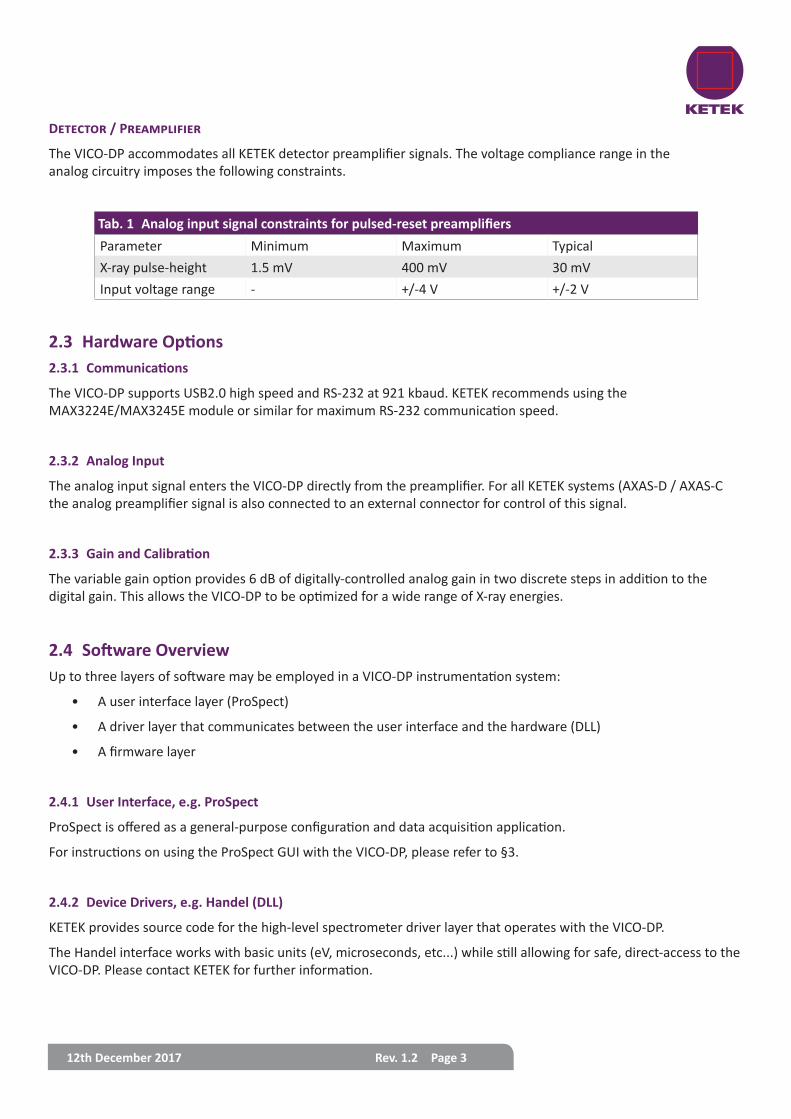
Parameter Minimum Maximum TypicalX-ray pulse-height 1.5 mV 400 mV 30 mVInput voltage range - +/-4 V +/-2 V
Tab. 1 Analog input signal constraints for pulsed-reset preamplifiers
Detector / Preamplifier
The VICO-DP accommodates all KETEK detector preamplifier signals. The voltage compliance range in the analog circuitry imposes the following constraints.
2.3 Hardware Options2.3.1 Communications
The VICO-DP supports USB2.0 high speed and RS-232 at 921 kbaud. KETEK recommends using the MAX3224E/MAX3245E module or similar for maximum RS-232 communication speed.
2.3.2 Analog Input
The analog input signal enters the VICO-DP directly from the preamplifier. For all KETEK systems (AXAS-D / AXAS-C the analog preamplifier signal is also connected to an external connector for control of this signal.
2.3.3 Gain and Calibration
The variable gain option provides 6 dB of digitally-controlled analog gain in two discrete steps in addition to the digital gain. This allows the VICO-DP to be optimized for a wide range of X-ray energies.
2.4 Software OverviewUp to three layers of software may be employed in a VICO-DP instrumentation system:
• A user interface layer (ProSpect)
• A driver layer that communicates between the user interface and the hardware (DLL)
• A firmware layer
2.4.1 User Interface, e.g. ProSpect
ProSpect is offered as a general-purpose configuration and data acquisition application.
For instructions on using the ProSpect GUI with the VICO-DP, please refer to §3.
2.4.2 Device Drivers, e.g. Handel (DLL)
KETEK provides source code for the high-level spectrometer driver layer that operates with the VICO-DP.
The Handel interface works with basic units (eV, microseconds, etc...) while still allowing for safe, direct-access to the VICO-DP. Please contact KETEK for further information.
DP
VICO
VICO-DP Manual Page 4
2.4.3 Firmware
The VICO-DP operates with a relatively simple command set, accommodating easy implementation into embedded systems. More detailed information about the firmware is provided with the VICO-DP Manual.
3 The ProSpect SoftwareProSpect is the User Interface for configuring the VICO-DP settings, for performimg diagnostic tasks, and for acquiring and exporting spectra.
ProSpect works with Windows 7 and higher. The latest software update can be downloaded from the the KETEK website
3.1 Installation1. Close all applications that are currently running.
2. Double-click the installation executable.
3. Follow the instructions to install ProSpect and Handel.
When the ProSpect installation is finished, a shortcut to the application will be located on your desktop. A copy of Adobe Acrobat Reader® is required to view the help files distributed with ProSpect. If you need to install Adobe Acrobat Reader®, please do so from the Adobe website:
https://acrobat.adobe.com/us/en/products/pdf-reader.html
File Location
The default location of the ProSpect executable after installation is C:\Program Files (x86)\XIA\ProSpect 1.0
3.2 Starting ProSpect for the First TimeProSpect must first determine to which USB or COM (RS-232 serial) port the VICO-DP is connected, and store that information in a configuration (INI) file.
The VICO-DP boots itself upon power-up, and is shortly (about 5 s) thereafter ready to acquire data with the same set of operating parameters used in the previous run. The first time the VICO-DP is powered on, detector- and preamplifier-related parameters will be in the factory default state.
The VICO-DP requires approximately 5 seconds to boot up, during which time the device can be recognized but cannot be initialized by the host.
NOTE

12th December 2017 Rev. 1.2 Page 5
Fig. 1 The ProSpect Configuration File Error dialog appears the first time ProSpect is started.
The settings should be optimized and saved to the non-volatile on-board memory so that they will automatically load during subsequent boot operations.The first time ProSpect is started, an error dialog will appear, indicating that no INI file was specified. See Fig. 1.
Fig. 2 The ProSpect Generate Configuration File dialog detects all connected devices.
1. Click the [Generate New File…] button to open the Generate Configuration File dialog, which displays all de-tected devices.
2. Click in the Select column next to the detected VICO-DP.
3. Click the [Save] button to generate an appropriate INI file and proceed with initialization

DP
VICO
VICO-DP Manual Page 6
3.3 A Tour Through the Basic ProSpect FeaturesThe Main Window is divided into two panels: The Settings Panel on the left and the larger Main Panel on the right.
Both panels are tabbed. In Fig. 3, the Acquisition and the MCA table are selected.
3.3.1 The Settings Panel
The Settings panel contains four tabs:
• Acquisition
• System
• SCA
• Detector
In this guide, we will limit the scope to the Acquisition and Detector tabs.
In the uppermost section, the Acquisition tab provides access to Peaking Time selection.
The two sections below contain peaking-time-related PARSET settings and the MCA-related GENSET settings parameters.
The Settings panel is intended to be the primary interface for setup and optimization as well as data acquisition, and is referenced throughout the following paragraphs. The Detector tab contains global (GLOBSET) settings related to the detector type and preamplifier characteristics, as described in §3.4.
Fig. 3 ProSpect Main Window

12th December 2017 Rev. 1.2 Page 7
3.3.2 The Main Panel
The Main panel contains three tabs:
• the MCA spectrum display tab
• the Scope tab
• the Baseline tab
The MCA tab is the default tab, while the Scope and Baseline tabs are for diagnostics
The MCA tab displays the acquired energy spectrum in the plot area and run statistics, e.g. input count rate, real time, etc., in the Statistics area at the top. Statistics for-user specified spectral regions of interest (e.g. ROI-selected peak mean and FWHM) are displayed in the ROI Controls area at the bottom.
The Scope tab is an oscilloscope tool for viewing digital signal vectors.
The Baseline tab displays the diagnostic baseline histogram and baseline history data. Zooming and panning in all three Main panel tabs can be customized by using the Display Controls in conjunction with mouse operations both on the axes and in the plot area.
The Status Bar along the bottom contains information about the state of the hardware and software, and the hard-ware serial number. The status indicator at the lower left corner of the main window changes to yellow during RS-232 or USB communications, green when idle and red when an error has been detected.
3.3.3 Preview of the Setup Process
The VICO-DP has been designed for ease-of-use in embedded applications. ProSpect can be used to first optimize de-tector and preamplifier settings and all the parameters associated with each of the 24 Peaking Times in combination with up to 5 MCA spectrum formats and then save them to non-volatile memory.
Once setup is complete, the client software application only needs to switch between PARSETs to select the desired Peaking Time and MCA spectrum format to retrieve all the optimized settings from non-volatile memory.
The setup process comprises three steps:
1. Configuring the detector preamplifier settings,
2. Adjusting the MCA format,
3. Optimizing the parameters linked to each Peaking Time.
3.3.4 Parameter Settings: GLOBSET, PARSETs, and GENSETs
Three different types of parameter tables are stored in non-volatile memory: GLOBSET, PARSET, and GENSET.
Globset
The singular GLOBSET is accessible in the Detector tab. It contains global settings including detector/preamplifier settings and preset run controls. There is only one GLOBSET. These global settings are used for all peaking times and MCA formats. Changes to these settings are simultaneously applied and saved to nonvolatile memory via the [Apply / Save] button.
DP
VICO
VICO-DP Manual Page 8
Parset
The PARSET table is accessible in the top half of the Acquisition tab. It includes all peaking-time-dependent settings, e.g. thresholds, sampling interval, etc.
Selecting a new Peaking Time automatically loads a unique set of parameters stored for that peaking time.
There is a complete PARSET table stored in non-volatile memory for each Peaking Time. To maintain energy calibra-tion and proper triggering across every combination of PARSET and GENSET, each PARSET in fact includes Fine Gain Trim values and five sets of thresholds; one for each GENSET.
Genset
The GENSET table is accessible in the bottom half of the Acquisition tab. It defines the number of bins and granu-larity of the MCA spectrum, as well as the Base Gain. Five GENSET tables can be stored, allowing for five different optimized MCA formats. Typically though, only the first GENSET, i.e. GENSET0, is used.
3.4 Detector/Preamplifier (GLOBSET) SettingsThe global parameter set, or GLOBSET, includes detector type and preamplifier characteristics, accessible in the Detector tab of the Settings panel (see Fig. 5). ProSpect automatically determines the preamplifier type based upon the firmware installed in non-volatile memory.
The detector settings always include the signal Polarity. For reset-type preamplifiers, the Reset Interval, the period of time following the preamplifier reset during which data acquisition is disabled, is also included.
3.4.1 Viewing the Preamplifier Signal
1. Select the Scope tab in the Main Panel, which acquires and displays the digital signal vectors from the VICO-DP. See Fig. 4.
2. Select ADC from the Trace Type drop-down list.
3. Click the [Get Trace] button to refresh the display.

12th December 2017 Rev. 1.2 Page 9
The Sampling Interval field controls the time interval between individual points, thus larger values will result in a lon-ger displayed period. The minimum value of 25 ns (for 40 MSPS ADC) results in a displayed period of approximately 200 µs. A detailed discussion of the Scope tool diagnostics can be found in §3.8.3.
3.4.2 Setting the Polarity
We recommend that you review §3.8.3 for an introduction to the Scope tool. The DDP2’s digital filters expect positive X-ray pulse-steps, i.e. with a rising edge.
If the displayed X-ray steps have a falling edge, as in Fig. 4, the detector Polarity setting must be modified. If the displayed X-ray steps have a rising edge (as in Fig. 5), the VICO-DP polarity setting is correct—proceed to the next section.
To change the Polarity setting:
1. Select (+) Positive or (-) Negative from the drop-down list.
2. Click the [Apply/Save] button to apply the new setting.3. Store it to non-volatile memory.
4. Click the [Get Trace] button again to verify positive pulse-steps.
3.4.3 Setting the Reset Interval (Reset-Type Preamplifiers)
Reset preamplifiers produce a large corrective reset step when the large-signal ‘staircase’ waveform reaches its limit. This reset transient varies for different preamplifiers, both in the duration and in other signal characteristics, e.g. rise time, charge-injection, overshoot and settling time.
Data acquisition should be disabled during the transient. If it is not, artifact events can be introduced into the spec-trum and resolution can be degraded due to corruption of the baseline measurement. The Reset Interval sets the duration after a preamplifier reset is detected during which baseline and event acquisition is disabled.
Fig. 4 Scope tool, displaying a series of two X-ray pulses from a re-set-type preamplifier. Note that pulses have falling edges, indicating that the polarity setting is wrong.
DP
VICO
VICO-DP Manual Page 10
The default Reset Interval of 5 µs should work reasonably well for KETEKs SDDs. In any case, the setting is best optimized after gain and threshold settings have been chosen, which affect baseline acquisition. Preamplifier reset transients, and how to properly set the Reset Interval, are discussed in §3.8.3.3.
3.5 MCA (GENSET) SettingsThe general parameter set, or GENSET, includes the Base Gain and the Number MCA Bins, MCA Bin Width, and other settings that define the MCA spectrum. Up to five complete GENSETs can be modified and stored such that five optimized MCA formats can automatically be retrieved simply by selecting the GENSET parameter.
Here, we simply want to prepare GENSET0 with some basic settings.
3.5.1 Gain Overview
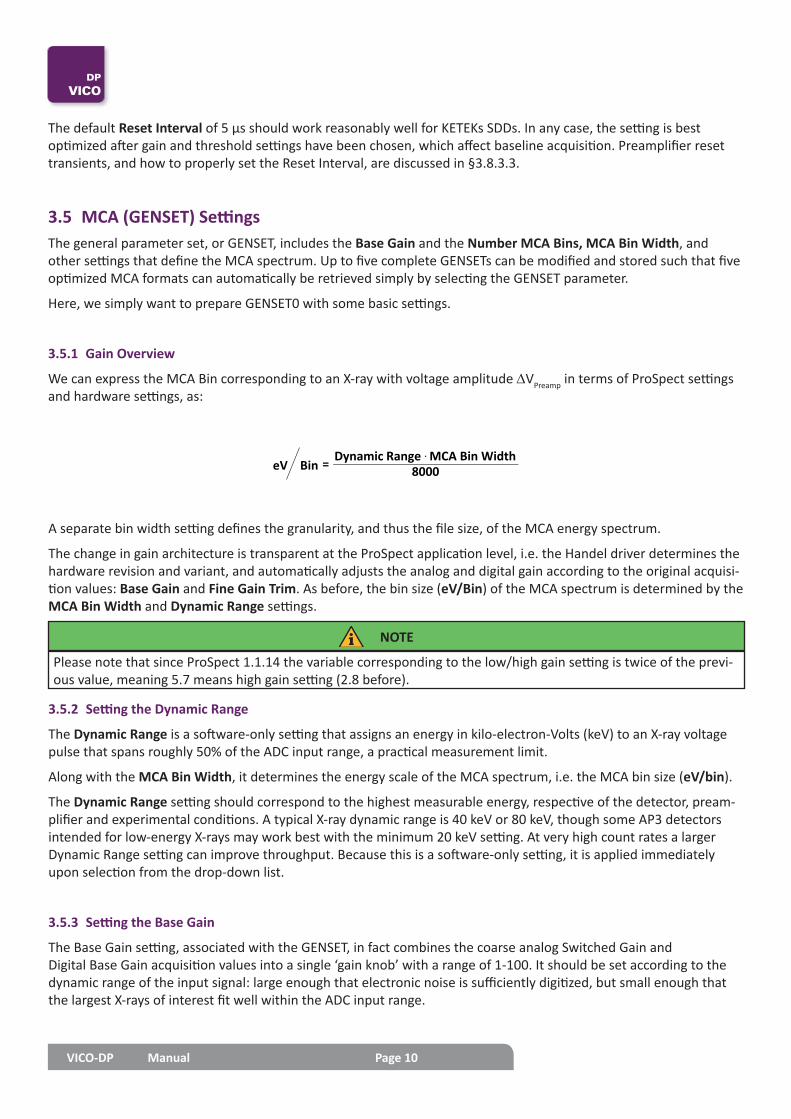
We can express the MCA Bin corresponding to an X-ray with voltage amplitude DVPreamp in terms of ProSpect settings and hardware settings, as:
A separate bin width setting defines the granularity, and thus the file size, of the MCA energy spectrum.
The change in gain architecture is transparent at the ProSpect application level, i.e. the Handel driver determines the hardware revision and variant, and automatically adjusts the analog and digital gain according to the original acquisi-tion values: Base Gain and Fine Gain Trim. As before, the bin size (eV/Bin) of the MCA spectrum is determined by the MCA Bin Width and Dynamic Range settings.
3.5.2 Setting the Dynamic Range
The Dynamic Range is a software-only setting that assigns an energy in kilo-electron-Volts (keV) to an X-ray voltage pulse that spans roughly 50% of the ADC input range, a practical measurement limit.
Along with the MCA Bin Width, it determines the energy scale of the MCA spectrum, i.e. the MCA bin size (eV/bin).
The Dynamic Range setting should correspond to the highest measurable energy, respective of the detector, pream-plifier and experimental conditions. A typical X-ray dynamic range is 40 keV or 80 keV, though some AP3 detectors intended for low-energy X-rays may work best with the minimum 20 keV setting. At very high count rates a larger Dynamic Range setting can improve throughput. Because this is a software-only setting, it is applied immediately upon selection from the drop-down list.
3.5.3 Setting the Base Gain
The Base Gain setting, associated with the GENSET, in fact combines the coarse analog Switched Gain and Digital Base Gain acquisition values into a single ‘gain knob’ with a range of 1-100. It should be set according to the dynamic range of the input signal: large enough that electronic noise is sufficiently digitized, but small enough that the largest X-rays of interest fit well within the ADC input range.
eV Bin 8000Dynamic Range MCA Bin Width= $
Please note that since ProSpect 1.1.14 the variable corresponding to the low/high gain setting is twice of the previ-ous value, meaning 5.7 means high gain setting (2.8 before).
NOTE
12th December 2017 Rev. 1.2 Page 11
As a rule of thumb, the largest X-rays of interest should span no more than 50% of the ADC input range.
The default Base Gain setting serves as an adequate starting point for most detectors. If the Preamplifier Gain is known, use the equation below to choose the preliminary Base Gain setting.
Scope Tool
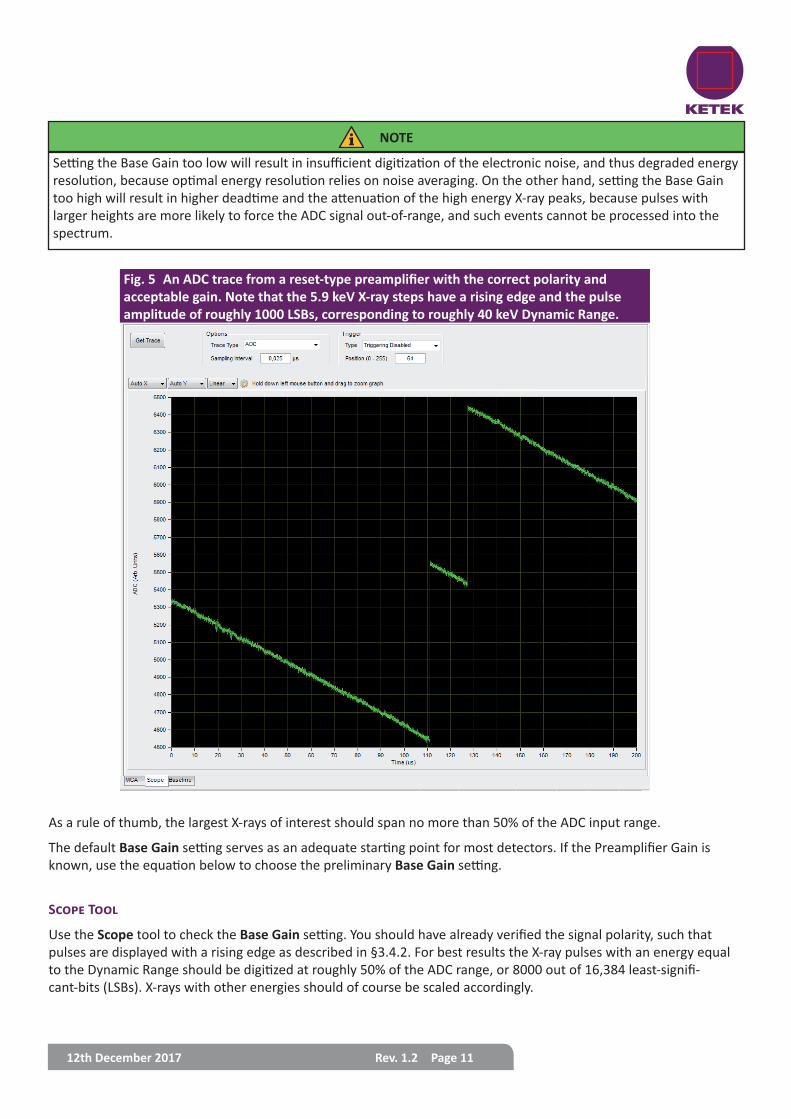
Use the Scope tool to check the Base Gain setting. You should have already verified the signal polarity, such that pulses are displayed with a rising edge as described in §3.4.2. For best results the X-ray pulses with an energy equal to the Dynamic Range should be digitized at roughly 50% of the ADC range, or 8000 out of 16,384 least-signifi-cant-bits (LSBs). X-rays with other energies should of course be scaled accordingly.
Setting the Base Gain too low will result in insufficient digitization of the electronic noise, and thus degraded energy resolution, because optimal energy resolution relies on noise averaging. On the other hand, setting the Base Gain too high will result in higher deadtime and the attenuation of the high energy X-ray peaks, because pulses with larger heights are more likely to force the ADC signal out-of-range, and such events cannot be processed into the spectrum.
NOTE
Fig. 5 An ADC trace from a reset-type preamplifier with the correct polarity and acceptable gain. Note that the 5.9 keV X-ray steps have a rising edge and the pulse amplitude of roughly 1000 LSBs, corresponding to roughly 40 keV Dynamic Range.

DP
VICO
VICO-DP Manual Page 12
1. First select the desired Number of MCA Bins.
2. Set the MCA Bin Width such that the product is less than or equal to 8192.
3. Click [Apply] to download the new settings to hardware.
4. Click [Save] once you have verified the settings.
Number MCA Bins MCA Bin Width Bin Size Energy Range8192 1 5 eV 40.96 keV8000 1 5 eV 40.00 keV4096 1 5 eV 20.48 keV4000 1 5 eV 20.00 keV4096 2 10 eV 40.96 keV4000 2 10 eV 40.00 keV2048 1 5 eV 10.24 keV2000 1 5 eV 10.00 keV2048 2 10 eV 20.24 keV2000 2 10 eV 20.00 keV2048 4 20 eV 40.96 keV2000 4 20 eV 40.00 keV
Tab. 4 Bin Size and Energy Range as a function of Number MCA Bins and MCA Bin Width, with a Dynamic Range of 40 keV. Note that the product of Number MCA Bins and MCA Bin Width is always 8192 or less.
When the product equals 8000, the energy range of the MCA spectrum is exactly equal to the Dynamic Range, corre-sponding to voltage pulses that span 50% or less of the ADC input range, a practical measurement limit.
Energy Range = Number MCA Bins * eV/Bin
A few examples are shown in Table 4 above, all with the Dynamic Range equal to 40 keV.
Which setting is the best depends on the required bin size, energy range and spectrum file size for a given application.
Note that the default setting is 4096 bins with MCA Bin Width equal to 1.
3.5.4 MCA Format
The DDP2 MCA format is quite flexible, with adjustable Number MCA Bins ranging up to 8192, and adjustable granularity via the MCA Bin Width setting. The DSP doesn’t constrain the relationship between these settings, so it’s possible to define a spectrum that exceeds the practical limits of the ADC, i.e. such that the MCA energy range signifi-cantly exceeds the Dynamic Range, which should be avoided. As a rule-of-thumb, the product of Number MCA Bins and MCA Bin Width should not exceed 8192.
12th December 2017 Rev. 1.2 Page 13
3.6 Spectrum AcquisitionAt this point the Polarity, Base Gain, Dynamic Range, Number MCA Bins and MCA Bin Width should have been set as described in § 3.4 and § 3.5 above. Before saving the GENSET settings, however, the Base Gain should be calibrat-ed from an actual energy spectrum.
Proceed as follows:
1. Click on the MCA tab.
The MCA tab displays the distribution of measured pulse-heights and thus, after calibration, the energy spectrum of the incident photons.
2. Click the [Start Run] button to begin a data acquisition run.
If the Continuous checkbox is selected, the display will refresh automatically. Otherwise data will only be displayed after clicking the [Update] button and/or after the run is stopped.
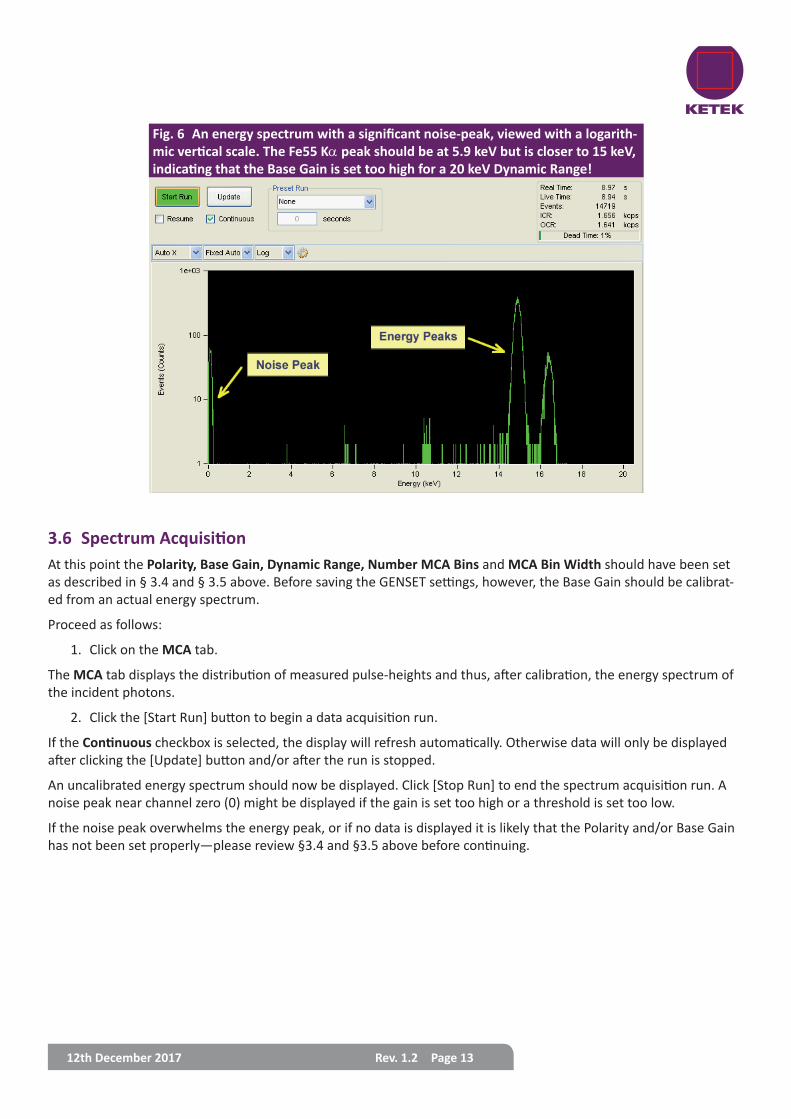
An uncalibrated energy spectrum should now be displayed. Click [Stop Run] to end the spectrum acquisition run. A noise peak near channel zero (0) might be displayed if the gain is set too high or a threshold is set too low.
If the noise peak overwhelms the energy peak, or if no data is displayed it is likely that the Polarity and/or Base Gain has not been set properly—please review §3.4 and §3.5 above before continuing.
Fig. 6 An energy spectrum with a significant noise-peak, viewed with a logarith-mic vertical scale. The Fe55 Ka peak should be at 5.9 keV but is closer to 15 keV, indicating that the Base Gain is set too high for a 20 keV Dynamic Range!
DP
VICO
VICO-DP Manual Page 14
3.6.1 ROI Selection
In order to calibrate the energy we must first designate the calibration peak with a Region of Interest (ROI). By default the ROI table should display as in Fig. 7 A.
1. Click on the Add New Row icon to add the first ROI.
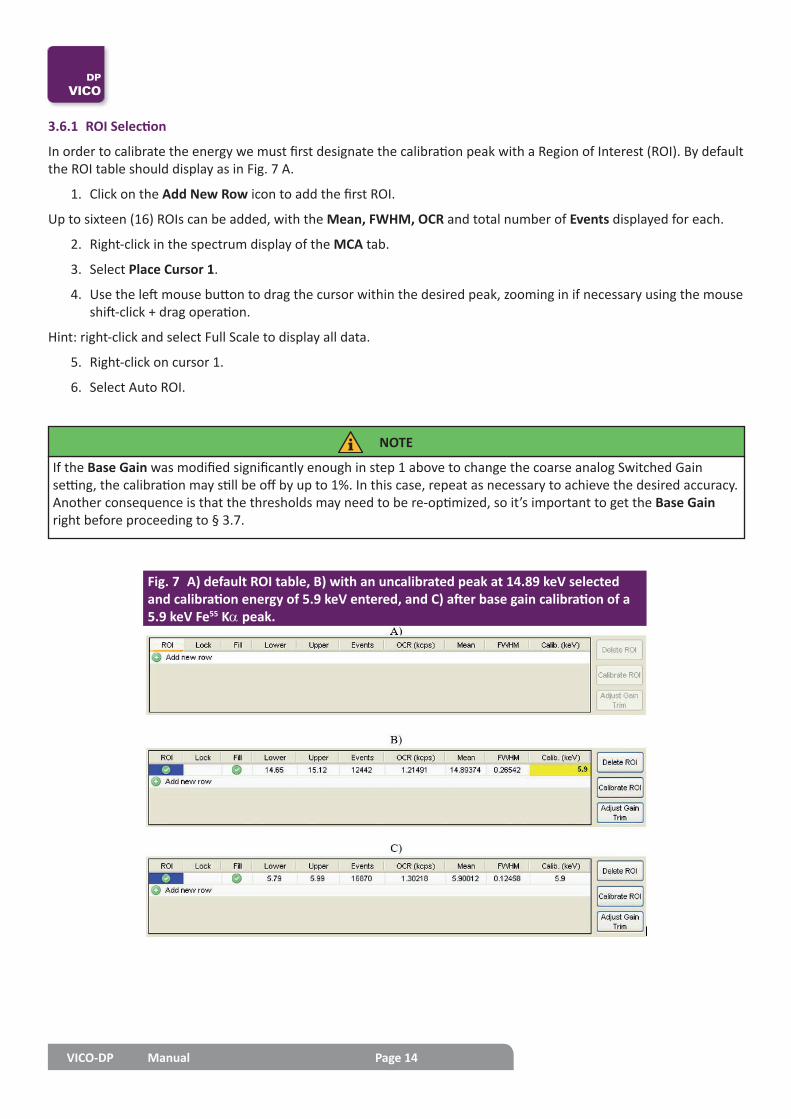
Up to sixteen (16) ROIs can be added, with the Mean, FWHM, OCR and total number of Events displayed for each.
2. Right-click in the spectrum display of the MCA tab.
3. Select Place Cursor 1.
4. Use the left mouse button to drag the cursor within the desired peak, zooming in if necessary using the mouse shift-click + drag operation.
Hint: right-click and select Full Scale to display all data.
5. Right-click on cursor 1.
6. Select Auto ROI.
Fig. 7 A) default ROI table, B) with an uncalibrated peak at 14.89 keV selected and calibration energy of 5.9 keV entered, and C) after base gain calibration of a 5.9 keV Fe55 Ka peak.
If the Base Gain was modified significantly enough in step 1 above to change the coarse analog Switched Gain setting, the calibration may still be off by up to 1%. In this case, repeat as necessary to achieve the desired accuracy. Another consequence is that the thresholds may need to be re-optimized, so it’s important to get the Base Gain right before proceeding to § 3.7.
NOTE
12th December 2017 Rev. 1.2 Page 15
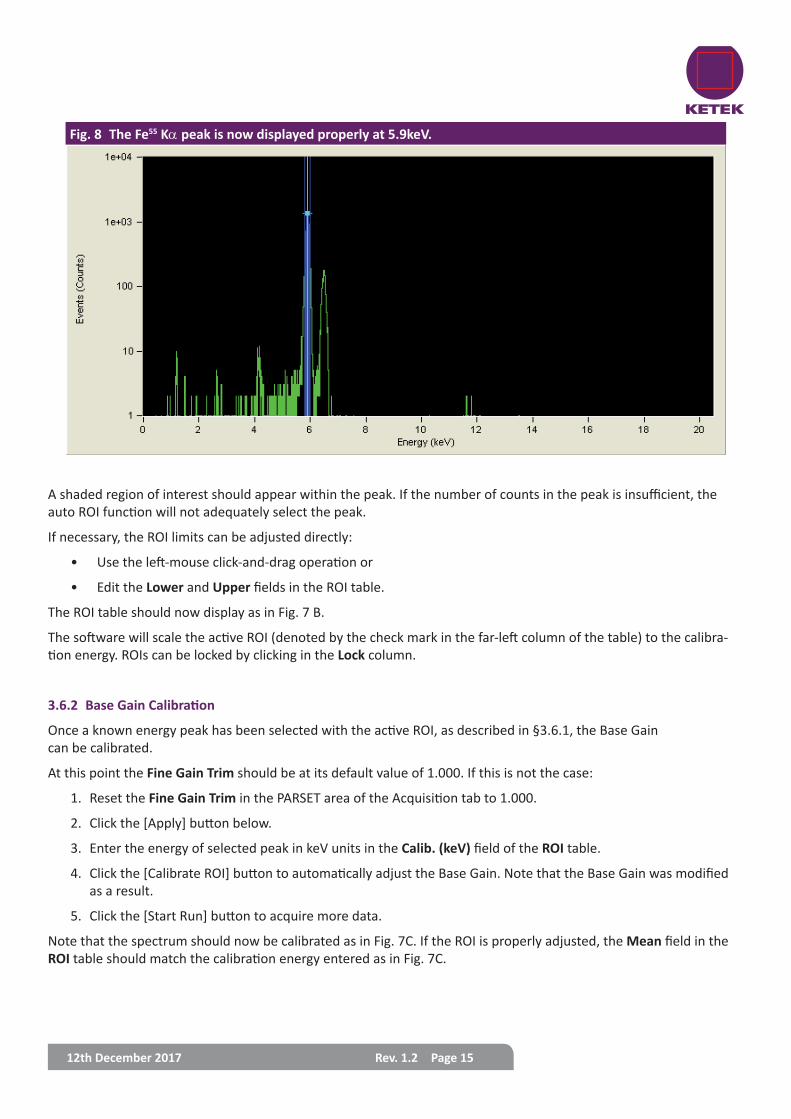
A shaded region of interest should appear within the peak. If the number of counts in the peak is insufficient, the auto ROI function will not adequately select the peak.
If necessary, the ROI limits can be adjusted directly:
• Use the left-mouse click-and-drag operation or
• Edit the Lower and Upper fields in the ROI table.
The ROI table should now display as in Fig. 7 B.
The software will scale the active ROI (denoted by the check mark in the far-left column of the table) to the calibra-tion energy. ROIs can be locked by clicking in the Lock column.
3.6.2 Base Gain Calibration
Once a known energy peak has been selected with the active ROI, as described in §3.6.1, the Base Gain can be calibrated.
At this point the Fine Gain Trim should be at its default value of 1.000. If this is not the case:
1. Reset the Fine Gain Trim in the PARSET area of the Acquisition tab to 1.000.
2. Click the [Apply] button below.
3. Enter the energy of selected peak in keV units in the Calib. (keV) field of the ROI table.
4. Click the [Calibrate ROI] button to automatically adjust the Base Gain. Note that the Base Gain was modified as a result.
5. Click the [Start Run] button to acquire more data.
Note that the spectrum should now be calibrated as in Fig. 7C. If the ROI is properly adjusted, the Mean field in the ROI table should match the calibration energy entered as in Fig. 7C.
Fig. 8 The Fe55 Ka peak is now displayed properly at 5.9keV.

DP
VICO
VICO-DP Manual Page 16
Fig. 9 The PARSET area of the Acquisi-tion tab includes Peaking Time selec-tion and the modification and storage to nonvolatile memory of related settings.
Once you are satisfied with the MCA settings and energy calibration, click the [Save] button in the GENSET area of the Acquisition tab.
3.7 Peaking Time (PARSET) OptimizationFor each of the twenty-four Peaking Time values the DSP stores a complete set of all related spectrometer param-eters into non-volatile memory, i.e. into the corresponding PARSET. The 24 parameter sets (PARSETs) are first opti-mized and saved to the on-board non-volatile memory.
Subsequent selection of an optimized Peaking Time retrieves all relevant digital filtering and peak inspection param-eters (e.g. gap time, thresholds, pileup inspection interval, etc.). This functionality is targeted at embedded systems: the configuration and optimization procedures can be performed in the lab using the ProSpect software, such that only a small command set is required within the embedded system itself, e.g. start run, stop run, change PARSET (peaking time), etc.
The configuration process needs only be performed once, though of course the parameter sets can later be modified.
Please refer to the KETEK VICO-DP manual for further details. All VICO-DP-related documents are available online at:
http://www.ketek.net/documentation/sdd-downloads/
Peaking Time (PARSET) selection and the most commonly used parameter settings are accessed directly from the Acquisition tab of the Settings panel.
»» Click [Edit Filter Parameters] to access less frequently used parameters.
»» Select the desired Peaking Time from the drop-down list.

12th December 2017 Rev. 1.2 Page 17
The following sections describe the process of selecting and storing the individual parameters for one peaking time.
3.7.1 Threshold Settings
Three thresholds can be used simultaneously to distinguish noise from X-ray events. Whereas noise goes into the baseline distribution, X-ray events go into the energy spectrum.
Each of these thresholds has its own balance of timing vs. noise performance.
• The fast-filter Trigger threshold achieves the best pulse-pileup rejection.
• The slow-filter Energy threshold can be used to detect the lowest energies.
• The intermediate-filter Baseline threshold is somewhere in the middle.
Thresholds can be individually disabled by setting them to zero (0).
The thresholds are typically the most important PARSET settings to get right. By default they are set conservatively, however, better performance will be achieved when the thresholds are set as described below.
We recommend saving the PARSET after each threshold is verified, by clicking the [Save] button.
Finally, note that if the Base Gain is subsequently changed by a significant amount, i.e. by enough to change the coarse analog Switched Gain, the thresholds must be re-optimized and the PARSET saved again. For this reason it’s important to first get the Base Gain right as described in §3.6.2.
3.7.1.1 Disable the Slow Threshold
By default the Energy threshold is disabled, and it should be disabled, i.e. set to zero (0), in nearly all cases.
Although its excellent noise reduction also allows detection of the very lowest energy X-rays, its slow response pre-cludes an accurate determination of deadtime. This results in both degraded pulse pileup inspection and an error in the input count rate calculation. The Energy threshold should thus be used only when low-energy X-rays of interest are present that can’t otherwise be detected using the other thresholds, and only then with the understanding that pileup inspection for such events is marginal at best.
3.7.1.2 Trigger Threshold
By default the Energy threshold and the Baseline threshold should be disabled, i.e. set to zero (0).
If this is not the case
1. Set both values to zero now.
2. Click [Apply].
Depending on the system, an appropriate Trigger threshold value is provided.
3. Edit the value as necessary.
4. Click [Apply].
5. Click [Start Run] to acquire data in the MCA tab.
6. Click [Stop Run].
If the noise peak is NOT displayed:
7. Reduce the Trigger threshold by a factor of 2.
8. Repeat steps 5 to 7 until the noise peak is visible.
9. When the noise peak is displayed, increase the Trigger threshold in smaller increments.
DP
VICO
VICO-DP Manual Page 18
10. Repeat until the noise peak is eliminated.
11. Take note of the input and output count rates (ICR and OCR) for the next section.
12. Click the [Save] button in the PARSET area of the Acquisition tab.
3.7.1.1 Baseline Threshold
Disable the Baseline and Energy thresholds (set to zero (0)). The Trigger threshold has been set to a good value be-fore as described in the previous chapter.
In most cases a starting value of roughly 100 for the Baseline threshold is appropriate.
1. Edit the value.
2. Click [Apply].
3. Click [Start Run] to acquire data in the MCA tab.
4. Click [Stop Run].
If the noise peak is NOT displayed:
5. Reduce the Baseline threshold by a factor of 2 and
6. Repeat steps 3 to 5 until the noise peak is visible.
7. When the noise peak is displayed, increase the Baseline threshold in smaller increments.
8. Repeat until the noise peak is eliminated.
Note that in most cases the Baseline threshold will have very little effect on the input and output count rates.
9. Click the [Save] button to save the new Baseline Threshold to the current PARSET.
3.7.2 Fine Gain Trim
Now we are ready to trim the gain for this peaking time.
Remember, the Base Gain was stored in the GENSET.
The Fine Gain Trim, or per-peaking-time calibration, is stored in the PARSET. There is a Fine Gain Trim value stored for every PARSET/GENSET combination, allowing for a unique overall gain setting for each combination.
1. Select a known peak in the MCA spectrum.
2. Enter its energy in the Calib. (keV) field of the ROI table, if it hasn’t been entered already.
Make sure the selected ROI is active, i.e. it has the green check mark in the left-most column of the table!
3. Click the [Adjust Gain Trim] button to automatically adjust the Fine Gain Trim. Note that the Fine Gain Trim has been modified but the Base Gain has not.
The Overall Gain also includes the Fine Gain Trim value that is associated with each Peaking Time, i.e. stored in each PARSET, to maintain the gain calibration on a per-peaking-time basis, as described in § 3.7.3.
NOTE
12th December 2017 Rev. 1.2 Page 19
4. Click the [Start Run] button to acquire more data. Compare the Mean energy in the ROI table to the calibration energy entered.
5. Repeat steps 3 and 4 until the fields match the required precision.
6. Click the [Save] button to save the Fine Gain Trim to the current PARSET.
3.7.3 Optimization of the Remaining PARSETs
We’re now ready to repeat the above process for each of the remaining twenty-three PARSETs, or perhaps only those that will be used. Set and verify the thresholds and then save each PARSET to non-volatile memory:
1. Write down the Trigger and Baseline threshold settings for your optimized PARSET.
2. Select the next Peaking Time from the drop-down list.
3. Enter the values from step 1 above.
4. Click [Apply].
Don’t re-optimize the Trigger threshold unless the Fast Trigger Filter Peaking Time (aka FASTLEN) has changed. By default all PARSETs have a Fast Trigger Filter Peaking Time of 50 ns (FASTLEN=2),
Note that the Fast Trigger Filter Peaking Time is displayed in the Edit Filter Parameters dialog as described in § 3.7.4.
If you are changing from a shorter Peaking Time to a longer one, the Baseline threshold can likely be reduced a bit. Optimize the Baseline threshold as described in §3.7.1.1.
5. Calibrate the Fine Gain Trim as described in §3.7.2.
6. Repeat steps 1-5 above for each remaining Peaking Time, making sure to [Save] often.
Now you have completed the basic configuration and optimization!
If you do not achieve satisfactory performance after following the above procedure, continue reading § 3.7.4 below, which includes:
• Adjusting the slow gap time for longer preamplifier rise times, as described in §3.7.4.1.
• The Peak Capture Method at short peaking times may need adjustment, as described in §3.7.4.2.
• Adjustment of the Fast Trigger Filter and pileup inspection parameters is described in §3.7.4.3.
3.7.4 Advanced Optimizations
See figure Fig. 11 for the advanced settings for the current Peaking Time. Changing any of these parameters can significantly alter the performance of VICO-DP at the selected Peaking Time.
DP
VICO
VICO-DP Manual Page 20
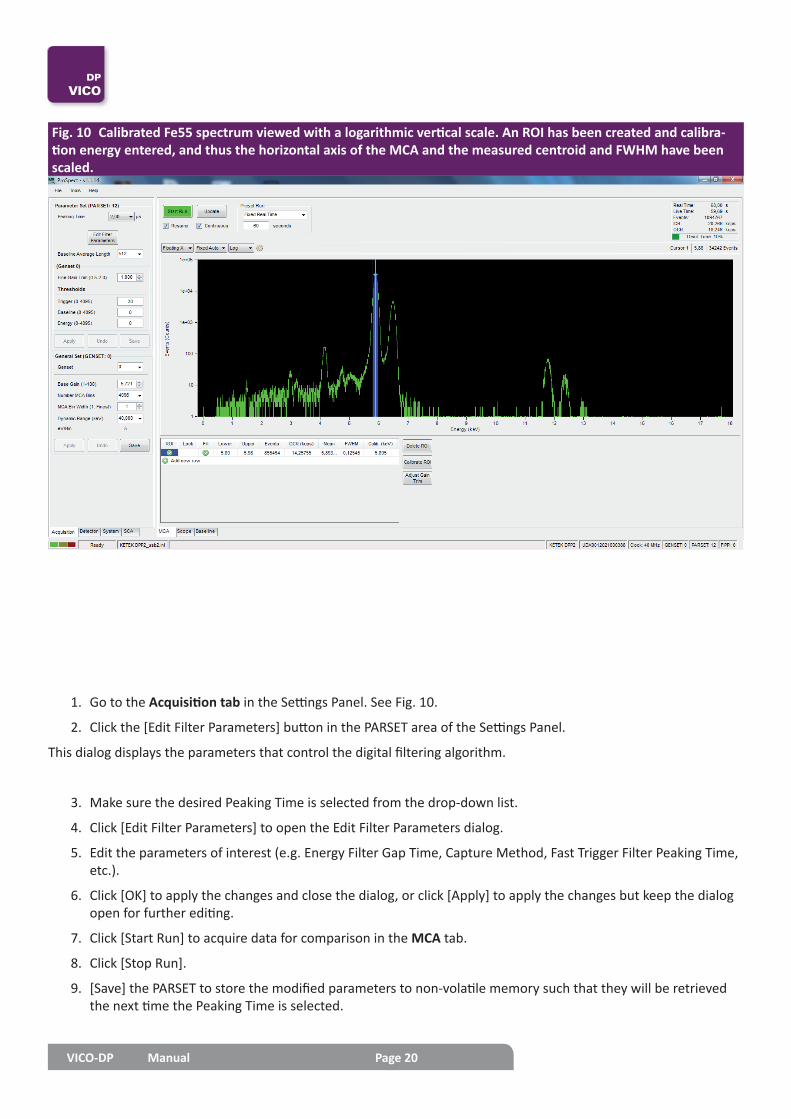
1. Go to the Acquisition tab in the Settings Panel. See Fig. 10.
2. Click the [Edit Filter Parameters] button in the PARSET area of the Settings Panel.
This dialog displays the parameters that control the digital filtering algorithm.
3. Make sure the desired Peaking Time is selected from the drop-down list.
4. Click [Edit Filter Parameters] to open the Edit Filter Parameters dialog.
5. Edit the parameters of interest (e.g. Energy Filter Gap Time, Capture Method, Fast Trigger Filter Peaking Time, etc.).
6. Click [OK] to apply the changes and close the dialog, or click [Apply] to apply the changes but keep the dialog open for further editing.
7. Click [Start Run] to acquire data for comparison in the MCA tab.
8. Click [Stop Run].
9. [Save] the PARSET to store the modified parameters to non-volatile memory such that they will be retrieved the next time the Peaking Time is selected.
Fig. 10 Calibrated Fe55 spectrum viewed with a logarithmic vertical scale. An ROI has been created and calibra-tion energy entered, and thus the horizontal axis of the MCA and the measured centroid and FWHM have been scaled.

12th December 2017 Rev. 1.2 Page 21
3.7.4.1 Preamplifier Rise Time: SLOWGAP
The Energy Filter Gap Time is visible as the ‘flat-top’ region of the energy filter output trapezoid. SLOWGAP is typical-ly set such that the flat-top interval is longer than the longest rise time of the preamplifier output pulses by at least one sampling interval:
Energy Filter Gap Time = SLOWGAP * sampling interval > rise time
In special cases where the very highest output count rates are desired, and perhaps at the expense of energy resolu-tion or peak shape, the user may wish to set the gap time to be significantly less than the SDD’s rise time.
The rise time is easily measured using the Scope tool:
1. Select ADC.
2. Set Sampling Interval to the minimum value by entering “0”.
3. Click the [Get Trace] button.
4. Use the cursors to zoom in on an X-ray pulse, as in below.
Fig. 11 Edit Filter Parameters dialog

DP
VICO
VICO-DP Manual Page 22
In the example plot (Fig. 12) the cursors are used to zoom in and measure the preamplifier 0-100% rise time.
If the input signal displays a range of rise times, as in the case of ballistic deficit (large SDDs > 20mm²), the slow filter gap time should be extended to accommodate the longest rise times.
The Energy Filter Gap Time is constrained by the relationship between the slow energy filter and the intermediate baseline filter. The baseline filter length (BASELEN) and gap (BASEGAP) are always constrained to be exactly ½ or ¼ the energy filter length (SLOWLEN) and gap (SLOWGAP), respectively, depending on the Peaking Time.
This means that the energy filter length and gap increment, or units, must be either 2x or 4x the clock period, as shown in Table 5.
The Baseline Filter Peaking Time and Gap Time are displayed at the bottom of the Edit Filter Parameters dialog, but cannot be edited.
NOTE
ProSpect automatically enforces this relationship: It will round the user value up or down as necessary when the [Apply] or [OK] buttons are pressed. The relationship can be determined by the parameter BFACTOR:
“SLOWLEN= “ “2” ^”(BFACTOR+1)” “ * BASELEN”
NOTE
Fig. 12 In this example plot the rise time is ~200 ns as indicated in the dX=0.20 field at the upper right corner.

12th December 2017 Rev. 1.2 Page 23
Example:
If the preamplifier rise time is 120 ns and the Peaking Time is 8 µs, BFACTOR=1 and SLOWGAP has an increment of 4x the clock period.
With a 40MHz clock the SLOWGAP increment is 100 ns, and the correct setting is 200 ns.
1. Open the Acquisition tab.
2. Click the [Edit Filter Parameters] button.
3. Edit the Energy Filter Gap Time as necessary.
4. Click [OK].
5. Click [Save] to save the new value to the PARSET in the PARSET area of the Acquisition tab.
3.7.4.2 Peak Capture Method: Peak Sensing vs Peak Sampling
Two peak capture methods are supported by the VICO DP hardware. In general, the default Peak Sensing mode is rec-ommended: it is ‘automatic’ and thus easier to use, and achieves the best pulse-height measurement in most cases.
At very short peaking times, and especially when the user sets the Energy Filter Gap Time to less than the pream-plifier rise time, the Peak Sampling mode may yield better results. The precise setting has a strong effect on energy resolution and should be determined empirically for each new detector.
Peak Sensing
In this mode, the energy filter output is monitored over a finite interval of time, and the maximum value within that interval is selected.
Peaking Time Range BFACTOR SLOWGAP increment (with 40MHz clock)0.1 to 0.6 µs 0 2x (50 ns)0.8 to 24 µs 1 4x (100 ns)
Tab. 5 The Energy Filter Gap Time (SLOWGAP) increment depends on the Peaking Time and clock speed..
Fig. 13 In Peak Sensing mode, the peak value of the slow energy filter output is selected.

DP
VICO
VICO-DP Manual Page 24
The interval is set automatically, based on the values of the parameters SLOWLEN and PEAKINT. PEAKINT is also a pileup inspection parameter, as will be discussed in further detail in § 3.7.4.3.
For Peak Sampling mode, the slow filter output is instead sampled a fixed time after the X-ray is detected. This mode is outlined in detail in the VICO-DP User Manual.
Perform the following steps:
1. Select the desired peak capture method.
2. Click [OK].
3. In the PARSET area of the Acquisition tab, click [Save] to save the modification to the PARSET.
3.7.4.3 Pileup Inspection: FASTLEN, FASTGAP, MAXWIDTH, PEAKINT
Undetected pulse-pileup results in unwanted pileup peaks in the spectrum. Pileup peaks in the spectrum can often be identified by noting that the apparent energy of the pileup peak is the sum of the energies of the piled-up X-ray pulses.
Two pileup inspection methods are utilized in the VICO-DP:
• Fast pileup inspection monitors the pulse width of the fast filter output, or more specifically, the time during which the Trigger threshold is exceeded.
• Slow pileup inspection monitors the time between two successive threshold crossings.
The fast filter is controlled by the parameters FASTLEN and FASTGAP. It is not necessary to set the FASTGAP in relation to the preamplifier rise time, in fact it is set to zero (0) by default, and should left so in nearly all cases.
For the limiting case of a preamplifier rise time equal to zero, the fast filter produces a trapezoid of maximum width:
Max Width ≥ (FASTGAP + 2*FASTLEN) * sampling interval
The parameter MAXWIDTH sets the Max Width limit for acceptable events, in units of the sampling interval (i.e. 25 ns for 40MHz). The fast filter trapezoidal waveform convolutes the preamplifier rise time tR with FASTLEN and FAST-GAP, and thus MAXWIDTH should be increased accordingly:
MAXWIDTH ≥ FASTGAP + 2 * FASTLEN + (tR / sampling interval)
The slow Pileup Inspection Interval is the time between two successive fast filter pulses. PEAKINT sets the minimum separation. By default it is automatically set to:
Pileup Inspection Interval = Peaking Time + Gap Time
Or
PEAKINT = SLOWLEN + SLOWGAP
...and should be left so in nearly all cases. Lower settings will increase the magnitude of pileup peaks.

12th December 2017 Rev. 1.2 Page 25
Higher settings may in some special cases improve pileup rejection, but typically it will have no effect on pileup and will always increase the dead-time-per-event and thus reduce throughput. Click the Edit Filter Parameters to open the Edit Filter Parameters dialog.
1. Edit Max Width as necessary.
2. Click [Apply].
In ProSpect, the Pileup Inspection Interval is defined as an offset from its default value, per above equation. The default offset is thus zero.
To increase the interval,
1. Enter a positive number.
2. Click [Apply].
3. Start a new run and re-examine the ratio of the identified pileup peak to its associated energy peak.
4. After the settings have been optimized, click the [Save] button.
Remember that individual settings are stored and retrieved for each Peaking Time!
3.7.5 Viewing the Run statistics
The run statistics are displayed in the upper right corner of the MCA tab. See figure Fig. 10.
Real Time and Live Time are displayed in seconds; ICR (input count rate) and OCR (output count rate) are displayed in kilo-counts-per-second. The total number of Events in the spectrum and the Dead Time percentage are also dis-played.
3.7.6 Livetime and Deadtime
The displayed Live Time is NOT the live time of the energy filter, rather it is a measurement of time that the triggering filter remained under threshold. This measurement, along with the number of times the threshold was crossed, or Fast Peaks, is used to calculate the input count rate.
ICR = Fast Peaks / Live Time
The Live Time of the energy filter is not displayed in software, but can be calculated according to:
Energy filter Live Time = Real Time * OCR / ICR
The Dead Time percentage is displayed in software, calculated as:
Dead Time = 1 – OCR/ICR
3.7.7 Saving a Spectrum
The spectrum export function produces a text file with a descriptive header and a list of values, i.e. the number of counts recorded in each MCA bin. The energy-per-bin and run statistics are included in the header.
DP
VICO
VICO-DP Manual Page 26
To save a spectrum,
1. select Save MCA Data… from the File menu.
2. After the prompt appears, enter the file name.
3. Select a location to save the file.
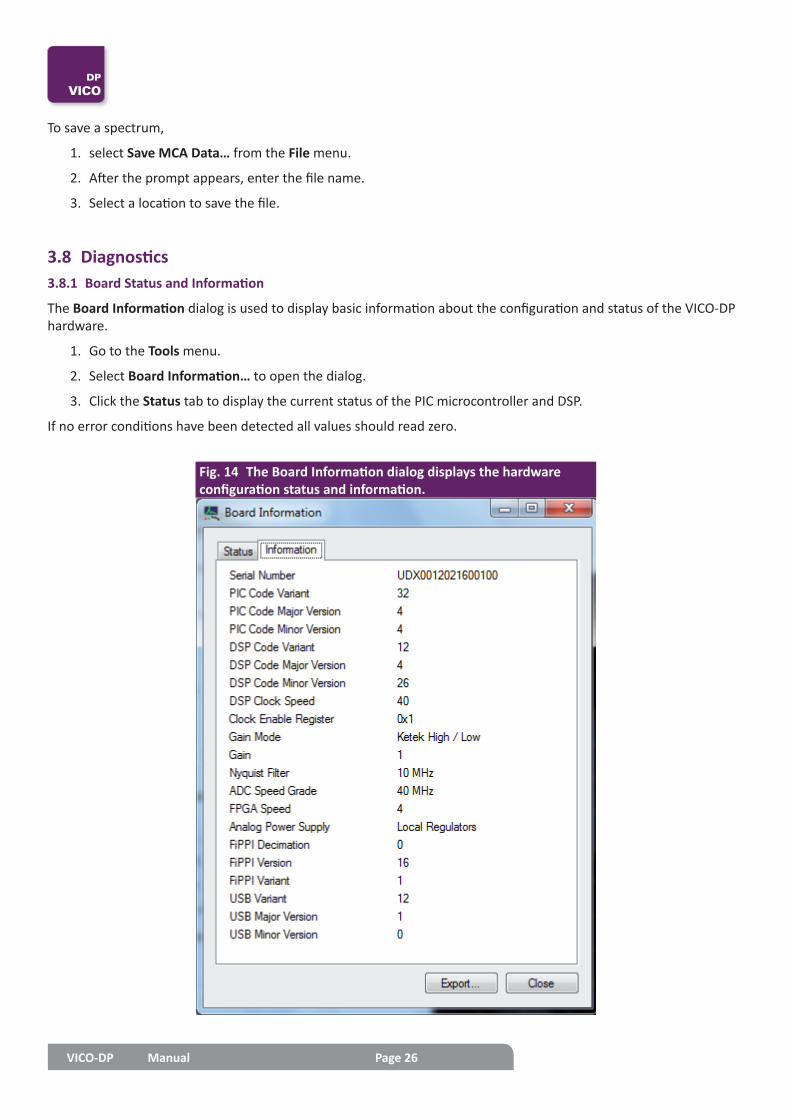
3.8 Diagnostics3.8.1 Board Status and Information
The Board Information dialog is used to display basic information about the configuration and status of the VICO-DP hardware.
1. Go to the Tools menu.
2. Select Board Information… to open the dialog.
3. Click the Status tab to display the current status of the PIC microcontroller and DSP.
If no error conditions have been detected all values should read zero.
Fig. 14 The Board Information dialog displays the hardware configuration status and information.
12th December 2017 Rev. 1.2 Page 27
4. Click the Information tab to display the current hardware and firmware configuration, as displayed in Fig. 14.
5. Click the [Export …] button to store all info, i.e. status, history and configuration information, to a text file.
This text file is useful to XIA support staff when attempting to diagnose hardware and/or firmware problems.
3.8.2 Log Files
1. Go to the Tools menu.
2. Select Diagnostics…to access the software application log files.
The ProSpect tab displays the contents of ProSpect.log, a log of high-level GUI operations.
The Handel tab displays the contents of ProSpect_handel.log, which contains low-level information.
Both files are saved to the default location:
C:\Users\<username>\AppData\Roaming\XIALLC\ProSpect\logs
The log files, and particularly the Handel log file, can be helpful to KETEK support staff when attempting to diagnose hardware and/or firmware problems.
3.8.3 The Scope Tool
The Scope tab displays 8,000 points of the selected digital signal vector, to be used as a diagnostic tool during setup and debugging.
• The Trace Type drop-down list selects the source vector.
• The Sampling Interval field controls the time interval between individual points. The minimum value is the ADC sampling interval, e.g. at 40 MSPS the minimum value is 25 ns, and results in a displayed period of 200 µs.
• The Trigger Type drop-down list selects the scope trigger source (which is independent of the event trigger for data acquisition mode). We recommend setting Trigger Type to Fast Trigger in nearly all cases.
• The Position field determines the horizontal position of the triggered event. Its value ranges from 0 to 255, with 128 putting the triggered event at the center of the displayed trace.
In order to make sense of the Scope data, it’s important to distinguish X-ray pulses from noise, and for reset-type preamplifiers we must also identify preamplifier resets and VICO-DP tracking steps in the display.
DP
VICO
VICO-DP Manual Page 28
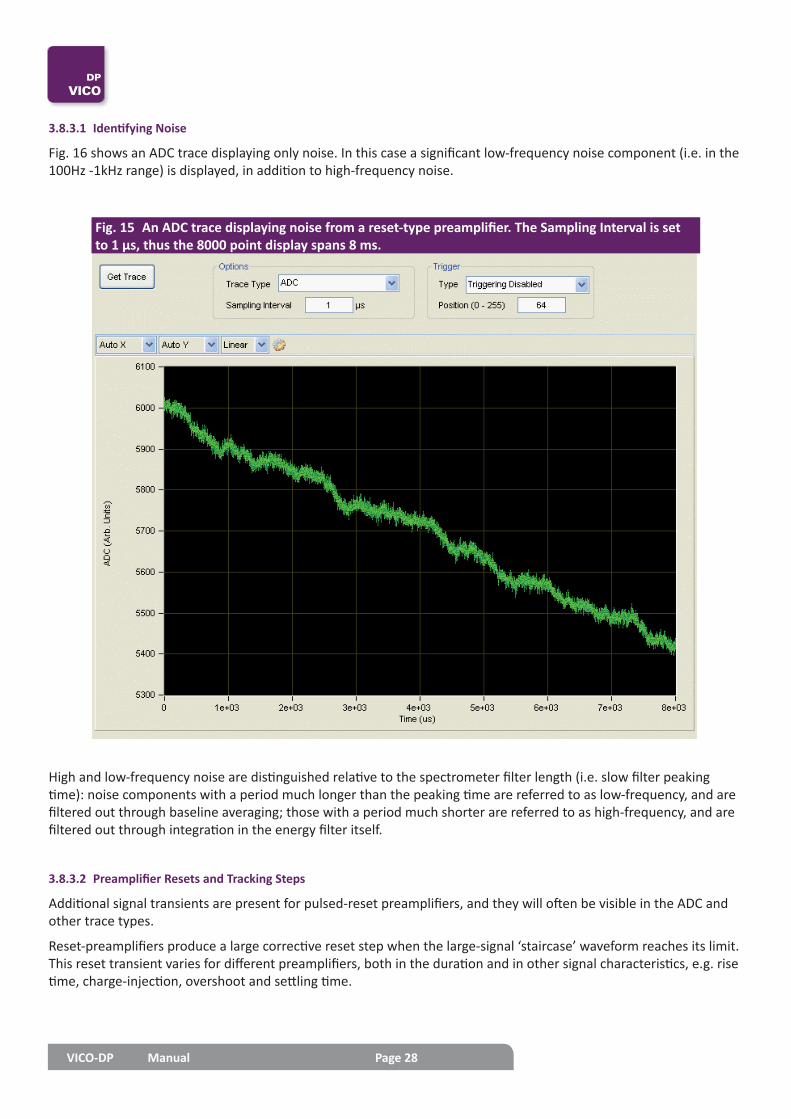
High and low-frequency noise are distinguished relative to the spectrometer filter length (i.e. slow filter peaking time): noise components with a period much longer than the peaking time are referred to as low-frequency, and are filtered out through baseline averaging; those with a period much shorter are referred to as high-frequency, and are filtered out through integration in the energy filter itself.
3.8.3.2 Preamplifier Resets and Tracking Steps
Additional signal transients are present for pulsed-reset preamplifiers, and they will often be visible in the ADC and other trace types.
Reset-preamplifiers produce a large corrective reset step when the large-signal ‘staircase’ waveform reaches its limit. This reset transient varies for different preamplifiers, both in the duration and in other signal characteristics, e.g. rise time, charge-injection, overshoot and settling time.
3.8.3.1 Identifying Noise
Fig. 16 shows an ADC trace displaying only noise. In this case a significant low-frequency noise component (i.e. in the 100Hz -1kHz range) is displayed, in addition to high-frequency noise.
Fig. 15 An ADC trace displaying noise from a reset-type preamplifier. The Sampling Interval is set to 1 µs, thus the 8000 point display spans 8 ms.

12th December 2017 Rev. 1.2 Page 29
Other transients, called tracking steps, are due to the VICO-DP itself. The analog signal conditioner (ASC) dynamically maintains the signal within the ADC input range by introducing large voltage steps of approximately one half the ADC range (i.e. pushing the signal from the ADC boundary to near mid-range).
The resulting transient tracking steps are qualitatively similar to the step produced by an X-ray, but occur with both rising and falling edges.
The individual X-ray steps are in the range 1000 vertical units, which is approximately 6% of the ADC input range. We frequently refer to X-ray step heights in terms of ADC percentages.
NOTE
Tracking steps can be identified by noting that the transients originate near the ADC minimum (0) or maximum (16384) and terminate near mid-range (6000 to 10000).
One preamplifier reset and three tracking steps are displayed in Fig. 17.
Fig. 16 There are approximately 120 X-rays displayed for a reset-type detector. The preamplifier reset briefly sends the ADC out-of-range high. The three tracking steps are introduced by the VICO-DP analog signal conditioner (ASC) in response to the signal first drifting out-of-range low twice, then out-of-range high once.
DP
VICO
VICO-DP Manual Page 30
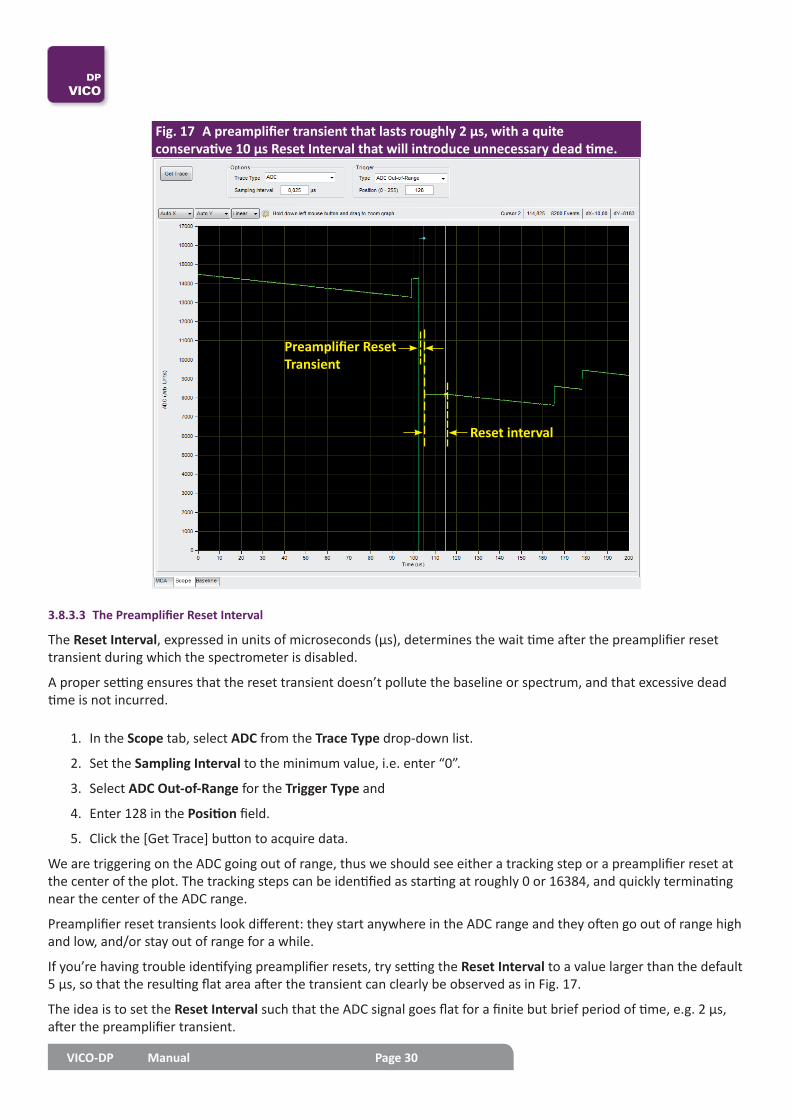
3.8.3.3 The Preamplifier Reset Interval
The Reset Interval, expressed in units of microseconds (µs), determines the wait time after the preamplifier reset transient during which the spectrometer is disabled.
A proper setting ensures that the reset transient doesn’t pollute the baseline or spectrum, and that excessive dead time is not incurred.
1. In the Scope tab, select ADC from the Trace Type drop-down list.
2. Set the Sampling Interval to the minimum value, i.e. enter “0”.
3. Select ADC Out-of-Range for the Trigger Type and
4. Enter 128 in the Position field.
5. Click the [Get Trace] button to acquire data.
We are triggering on the ADC going out of range, thus we should see either a tracking step or a preamplifier reset at the center of the plot. The tracking steps can be identified as starting at roughly 0 or 16384, and quickly terminating near the center of the ADC range.
Preamplifier reset transients look different: they start anywhere in the ADC range and they often go out of range high and low, and/or stay out of range for a while.
If you’re having trouble identifying preamplifier resets, try setting the Reset Interval to a value larger than the default 5 µs, so that the resulting flat area after the transient can clearly be observed as in Fig. 17.
The idea is to set the Reset Interval such that the ADC signal goes flat for a finite but brief period of time, e.g. 2 µs, after the preamplifier transient.
Fig. 17 A preamplifier transient that lasts roughly 2 µs, with a quite conservative 10 µs Reset Interval that will introduce unnecessary dead time.
Reset interval
Preamplifier Reset Transient

12th December 2017 Rev. 1.2 Page 31
The Reset Interval setting can be modified in the Detector tab:
1. Enter the Reset Interval in microseconds.
2. Click the [Apply / Save] button.
3. As a final check, select Baseline Average from the Trace Type drop-down list.
4. Acquire a trace at 100 µs Sampling Interval.
The ideal trace should look like white noise, as in Fig. 18. Significant transients and/or periodic signals warrant a more conservative Reset Interval setting.
All of the Trace Type signals except for ADC and ADC Average are signed 2’s complement vectors.
NOTE
3.8.4 Baseline Acquisition
Proper baseline acquisition and averaging is critical to the VICO-DP’s performance. The baseline is the output re-sponse of a digital filter when no photons are present. As is standard in pulse-processing applications, baseline measurements are averaged over a time interval value that is sufficiently long to eliminate high-frequency noise, but short enough that the average tracks actual variations in the preamplifier output independent of incident photons. This average is subtracted from the instantaneous measurements of step-pulse heights, yielding improved threshold stability with count rate and the improvement in noise associated with the double-correlated pulse-height measure-ment.
Fig. 18 A good Baseline Average trace. Note that the zero point has been shifted to 32768 in the plot area because this is a signed vector.
DP
VICO
VICO-DP Manual Page 32
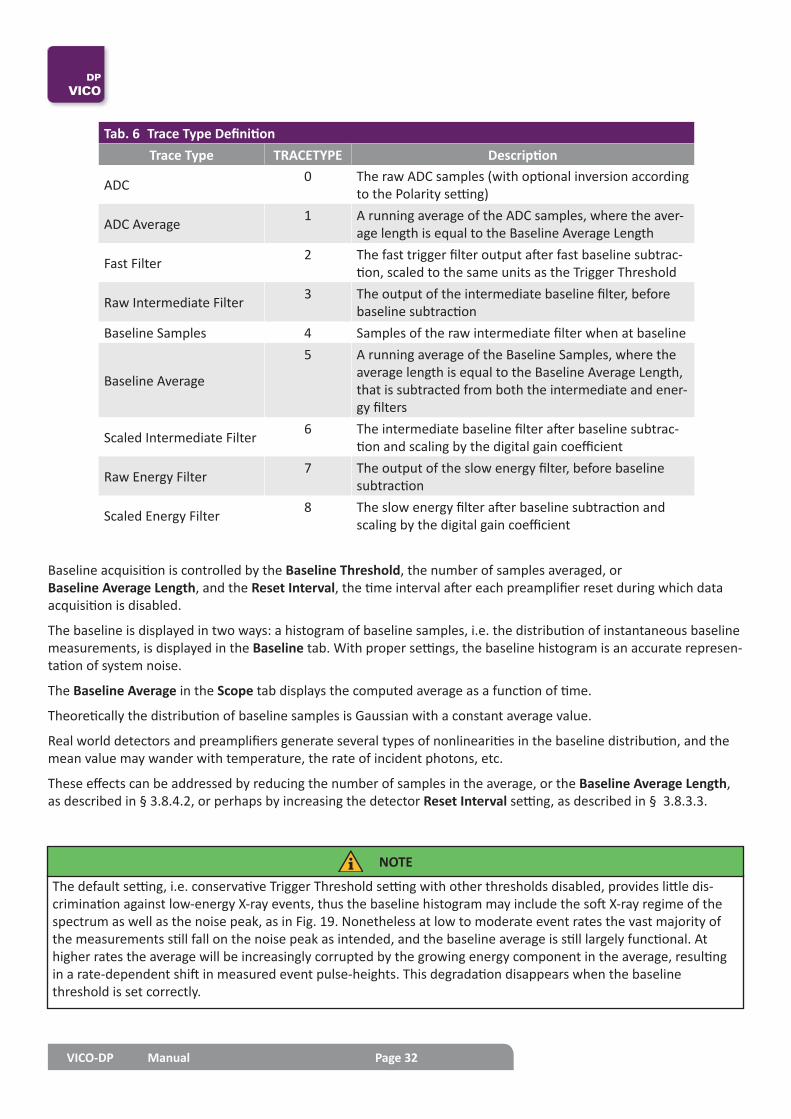
Tab. 6 Trace Type DefinitionTrace Type TRACETYPE Description
ADC 0 The raw ADC samples (with optional inversion according to the Polarity setting)
ADC Average 1 A running average of the ADC samples, where the aver-age length is equal to the Baseline Average Length
Fast Filter 2 The fast trigger filter output after fast baseline subtrac-tion, scaled to the same units as the Trigger Threshold
Raw Intermediate Filter 3 The output of the intermediate baseline filter, before baseline subtraction
Baseline Samples 4 Samples of the raw intermediate filter when at baseline
Baseline Average
5 A running average of the Baseline Samples, where the average length is equal to the Baseline Average Length, that is subtracted from both the intermediate and ener-gy filters
Scaled Intermediate Filter 6 The intermediate baseline filter after baseline subtrac-tion and scaling by the digital gain coefficient
Raw Energy Filter 7 The output of the slow energy filter, before baseline subtraction
Scaled Energy Filter 8 The slow energy filter after baseline subtraction and scaling by the digital gain coefficient
Baseline acquisition is controlled by the Baseline Threshold, the number of samples averaged, or Baseline Average Length, and the Reset Interval, the time interval after each preamplifier reset during which data acquisition is disabled.
The baseline is displayed in two ways: a histogram of baseline samples, i.e. the distribution of instantaneous baseline measurements, is displayed in the Baseline tab. With proper settings, the baseline histogram is an accurate represen-tation of system noise.
The Baseline Average in the Scope tab displays the computed average as a function of time.
Theoretically the distribution of baseline samples is Gaussian with a constant average value.
Real world detectors and preamplifiers generate several types of nonlinearities in the baseline distribution, and the mean value may wander with temperature, the rate of incident photons, etc.
These effects can be addressed by reducing the number of samples in the average, or the Baseline Average Length, as described in § 3.8.4.2, or perhaps by increasing the detector Reset Interval setting, as described in § 3.8.3.3.
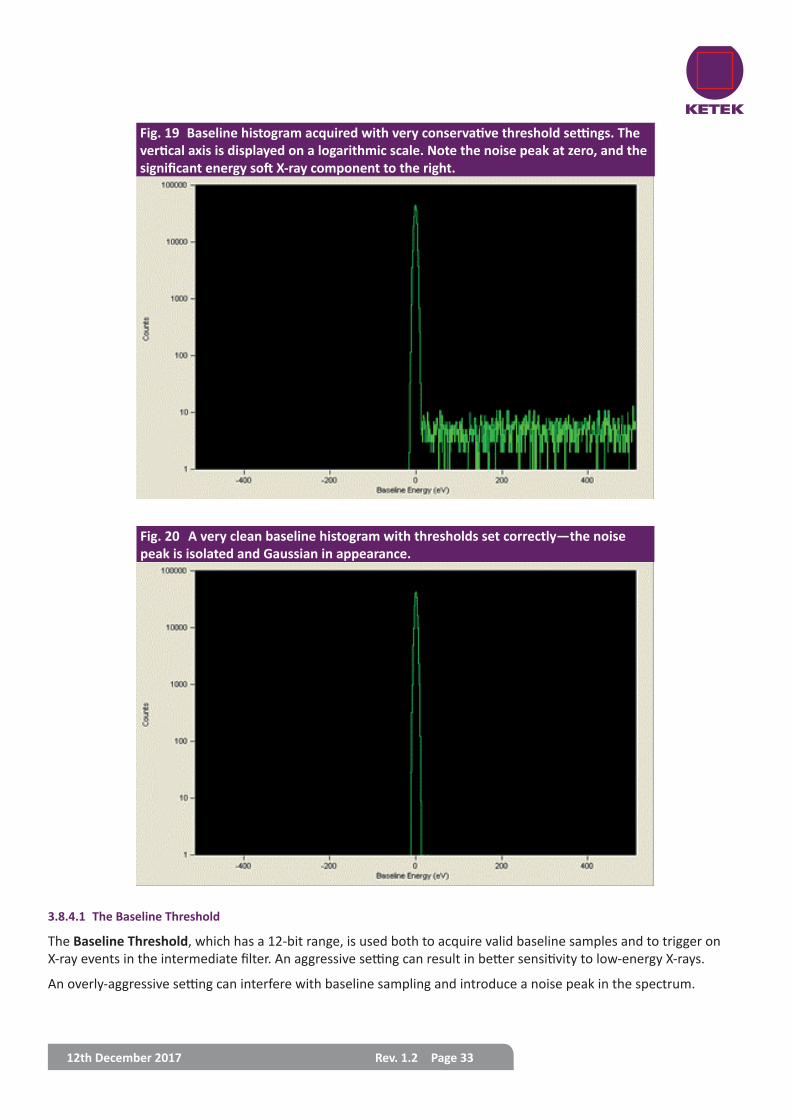
The default setting, i.e. conservative Trigger Threshold setting with other thresholds disabled, provides little dis-crimination against low-energy X-ray events, thus the baseline histogram may include the soft X-ray regime of the spectrum as well as the noise peak, as in Fig. 19. Nonetheless at low to moderate event rates the vast majority of the measurements still fall on the noise peak as intended, and the baseline average is still largely functional. At higher rates the average will be increasingly corrupted by the growing energy component in the average, resulting in a rate-dependent shift in measured event pulse-heights. This degradation disappears when the baseline threshold is set correctly.
NOTE
12th December 2017 Rev. 1.2 Page 33
3.8.4.1 The Baseline Threshold
The Baseline Threshold, which has a 12-bit range, is used both to acquire valid baseline samples and to trigger on X-ray events in the intermediate filter. An aggressive setting can result in better sensitivity to low-energy X-rays.
An overly-aggressive setting can interfere with baseline sampling and introduce a noise peak in the spectrum.
Fig. 20 A very clean baseline histogram with thresholds set correctly—the noise peak is isolated and Gaussian in appearance.
Fig. 19 Baseline histogram acquired with very conservative threshold settings. The vertical axis is displayed on a logarithmic scale. Note the noise peak at zero, and the significant energy soft X-ray component to the right.

DP
VICO
VICO-DP Manual Page 34
The Baseline Threshold is disabled by default (thresholds can be disabled by setting them to 0). See § 3.7.1.1 for instructions on setting the Baseline Threshold.
Follow this procedure:
1. Open the Baseline tab.
2. Click [Get Baseline] to refresh the histogram display.
If the Baseline Threshold is set too high, part of the energy spectrum may be displayed in the baseline distribution as in Fig. 19. If the Baseline Threshold is set correctly, only the noise peak should be visible. For a high quality detector and preamplifier, the noise peak should resemble a symmetric Gaussian distribution as shown in Fig. 20.
3.8.4.2 Number of Samples in the Baseline Average
Real-world detectors and preamplifiers can produce a baseline that varies over time or voltage. A time-variant, or wandering, baseline can be mitigated by reducing the number of samples averaged, or Baseline Average Length. It is part of the PARSET, and thus stored on a per-peaking-time basis. Reducing the number of samples allows the average to track with the real variations in the baseline, and thus yields better accuracy. Conversely, fewer samples in the average results in less noise reduction, and thus less precision in the pulse-height measurement.
1. In the Scope tab, select Baseline Average from the drop-down list.
2. Click the [Get Trace] button.
A large Sampling Interval, e.g. 10-100 µs, is best, because the baseline itself is only sampled periodically.
Each point in the display represents the averaged baseline at that instant. The number of baseline points included in the average is determined by the DSP parameter BLFILTER according to the following equation:
BLFILTER defaults to 64 or 128, thus the default Baseline Average Length is 512 or 256. We have found this to be a good balance for most detectors over a range of peaking times. At very high rates, and alternatively for lower quality detectors with significant real variations in the baseline, it is best to reduce the Baseline Average Length.
At shorter peaking times it is often advantageous to average more points because each individual point contains a larger noise component than for longer peaking times.
1. Open the Acquisition tab.
2. Select the desired Baseline Average Length from the drop-down list and click [Apply].
3. Click [Get Trace] in the Baseline tab to refresh the display.
4. Repeat steps 1 - 3 as necessary.
5. When the desired performance has been verified, click [Save].
Remember that individual settings are stored and retrieved for each Peaking Time.
Baseline Average Length BLFILTER32768=

12th December 2017 Rev. 1.2 Page 35
4 ContactIf you have any questions regarding this or any of our products please do not hesitate to contact us via e-mail or phone.
Address of our KETEK Headquarters Sales Office:
KETEK GmbH Hofer Str. 3 81737 Munich Germany
E-mail [email protected] Phone +49 (0) 89 673467 70 Fax +49 (0) 89 673467 77 Homepage www.ketek.net