Embed Size (px)
Citation preview
DOWNSTREAM SUPPLY CHAIN PERFORMANCE
MEASUREMENT BY THE OIL MARKETING COMPANIES IN
KENYA
BY:
SHIVO JOY LIVOHI
A RESEARCH PROJECT SUBMITTED IN PARTIAL
FULFILLMENT OF THE REQUIREMENT FOR THE DEGREE
OF MASTER OF BUSINESS ADMINISTRATION, SCHOOL OF
BUSINESS,
UNIVERSITY OF NAIROBI
2012
ii
DECLARATION
This research project is the result of my independent study and has not been submitted for
a degree in any other university
_____________________________ _______________________
Shivo, Joy Livohi. Date
D61/72021/2008
This research project has been submitted for examination with my approval as the
university supervisor
___________________________ _______________________
Odock Stephen. Date
Department of Management Science
School of Business
University of Nairobi
�

iii
ACKNOWLEDGEMENTS
I would like to thank God Almighty for His grace. Special gratitude goes to my
Supervisor, Mr. Stephen Odock whose guidance, dedication, patience, persistence and
commitment made it possible for me to complete this project. Kindly accept my sincere
gratitude.
I wish to thank University of Nairobi, School of Business fraternity who in one way or
another assisted during my MBA studies. Thanks to Mr. Mwanyota, your support was
invaluable. I acknowledge my MBA classmates and study colleagues, Martin Muriithi,
Walter Rono, Ken Nyamolo, Evanson Momanyi and Nelson Karisa. It is not possible to
mention all by name, may God bless you all. Thank you all for your support.

iv
DEDICATION
I dedicate this research project to my parents the late Nathan Shivo and Alice Shivo who
always encouraged us to further our education. Thank you for you love and care.
I also dedicate it to all my siblings and friends for their inspiration, support,
encouragement, and understanding throughout the study period.
God bless you all.
� �
v
ABSTRACT
With the rising number of Oil Marketing Companies (OMCs) and increased complexity
of the Downstream Supply Chains, there’s a greater interest in the potential of
Downstream Supply Chains’ Performance Measurement to function as a feedback
mechanism for the continual improvement of a supply chain performance.
The objectives of this study were to examine the extent to which Oil Marketing
Companies in Kenya measured their Downstream Supply Chain Performance; to identify
the Key Performance Indicators used in these measurement and the challenges OMCs
faced whilst undertaking the Downstream Supply Chain Performance measurements.
Data was collected through questionnaires from a population census of 53 Oil Marketing
Companies and was analyzed quantitatively and qualitatively. The findings of the study
indicated that many of the OMCs measured their Downstream Supply Chain Performance
using KPIs such as unit cost of transportation, and of storage; quality of service,
information and quality of products; time for loading, turnaround time, transportation,
delivery and time to relay information; and customer feedback. Major challenges faced
by the OMCs included infrastructural limitations, high demurrage costs and high
operational costs.
The study concluded that the Downstream Supply Chain Performance Measurement is
vital among the OMCs in Kenya with regard to enhancing the performance of their
Downstream Supply Chains. The study recommended OMCs to put in place structured
methods of the Downstream Supply Chain Performance Measurement to ensure
optimized supply chains and to get more value from the supply chains. Flexibility of the
vi
supply chain operations should be enhanced to ensure proper positive feedback from the
SCP Metrics are easily adopted to improve on the performance of the supply chains. The
study also recommended flawless cross-functional and inter-firm supply chain operations
should be encouraged to enhance supply chain performance.
vii
TABLE OF CONTENTS
ACKNOWLEDGEMENTS ............................................................................................ iii�
DEDICATION.................................................................................................................. iv�
ABSTRACT ....................................................................................................................... v�
LIST OF ACRONYMS AND ABBREVIATIONS ....................................................... ix�
LIST OF TABLES ........................................................................................................... xi�
LIST OF FIGURES ........................................................................................................ xii�
CHAPTER ONE: INTRODUCTION ............................................................................. 1�
1.1� Background of the Study ...................................................................................... 1�
1.1.1� Supply Chain Management ........................................................................... 2�
1.1.2� Supply Chain Performance ........................................................................... 4�
1.1.3� The Oil Marketing Companies in Kenya ...................................................... 6�
1.2� Research Problem ................................................................................................. 9�
1.3� Objectives of the study ....................................................................................... 11�
1.4� Value of the Study .............................................................................................. 12�
CHAPTER TWO: LITERATURE REVIEW .............................................................. 13�
2.1� Introduction ........................................................................................................ 13�
2.2� Supply Chain Management ................................................................................ 13�
2.3� Supply Chain Performance................................................................................. 17�
2.4� Supply Chain Performance Measurement .......................................................... 21�
2.4.1� Approaches to Supply Chain Performance Measurement .......................... 22�
2.4.2 The Challenges of Supply Chain Performance Measurement ......................... 27�
2.5� Summary ............................................................................................................ 28�
CHAPTER THREE: RESEARCH METHODOLOGY ............................................. 30�
3.1� Introduction ........................................................................................................ 30�
3.2� Research Design ................................................................................................. 30�
3.3� Population and Sampling ................................................................................... 30�
3.4� Data Collection ................................................................................................... 31�
3.5� Data Analysis ..................................................................................................... 31�
CHAPTER FOUR: DATA ANALYSIS AND INTEPRETATION............................ 32�
viii
4.1� Introduction ........................................................................................................ 32�
4.2� General Information ........................................................................................... 32�
4.2.1 � Information on the Organisation ................................................................. 32�
4.2.2 � Size of OMCs .............................................................................................. 33�
4.2.3 � The Length of Time in Operation ............................................................... 34�
4.2.4 � Oil Products Distributed by OMCs ............................................................. 35�
4.2.5 � Sources of the Petroleum Products by the OMCs ....................................... 38�
4.2.6� Ownership of Petroleum Products Storage Facility .................................... 39�
4.2.7� OMCs Importing for Other Countries......................................................... 40�
4.2.8� Pipeline Transport of Oil Products ............................................................. 41�
4.3� Importance of Downstream Supply Chain Performance Measurement ............. 42�
4.4� Downstream Supply Chain Performance Measurement, and the KPIs Used .... 44�
4.5� Challenges in Downstream Supply Chain Performance Measurement ............. 49�
CHAPTER FIVE: SUMMARY, CONCLUSION AND RECOMMENDATIONS .. 53�
5.1� Introduction ........................................................................................................ 53�
5.2� Summary of Findings ......................................................................................... 53�
5.3� Conclusion .......................................................................................................... 55�
5.4� Recommendations .............................................................................................. 56�
5.5� Limitations of the study...................................................................................... 57�
5.6� Suggestions for Further Study ............................................................................ 57�
REFERENCES ................................................................................................................ 59�
APPENDICES ................................................................................................................. 64�
APPENDIX 1:� QUESTIONNAIRE ........................................................................... 64�
APPENDIX 2:� INTRODUCTION LETTER ............................................................. 73�
APPENDIX 3:� NAMES OF OMCs AS OF MAY 2012 ............................................ 74�
ix
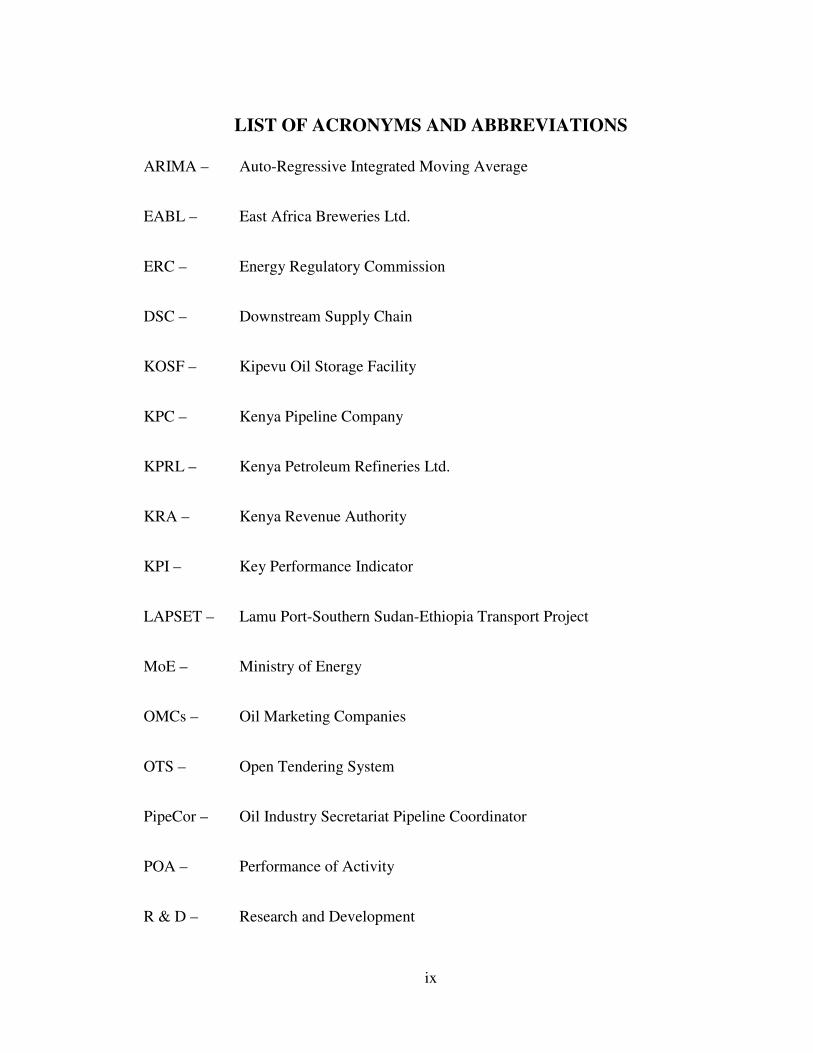
LIST OF ACRONYMS AND ABBREVIATIONS
ARIMA – Auto-Regressive Integrated Moving Average
EABL – East Africa Breweries Ltd.
ERC – Energy Regulatory Commission
DSC – Downstream Supply Chain
KOSF – Kipevu Oil Storage Facility
KPC – Kenya Pipeline Company
KPRL – Kenya Petroleum Refineries Ltd.
KRA – Kenya Revenue Authority
KPI – Key Performance Indicator
LAPSET – Lamu Port-Southern Sudan-Ethiopia Transport Project
MoE – Ministry of Energy
OMCs – Oil Marketing Companies
OTS – Open Tendering System
PipeCor – Oil Industry Secretariat Pipeline Coordinator
POA – Performance of Activity
R & D – Research and Development
x
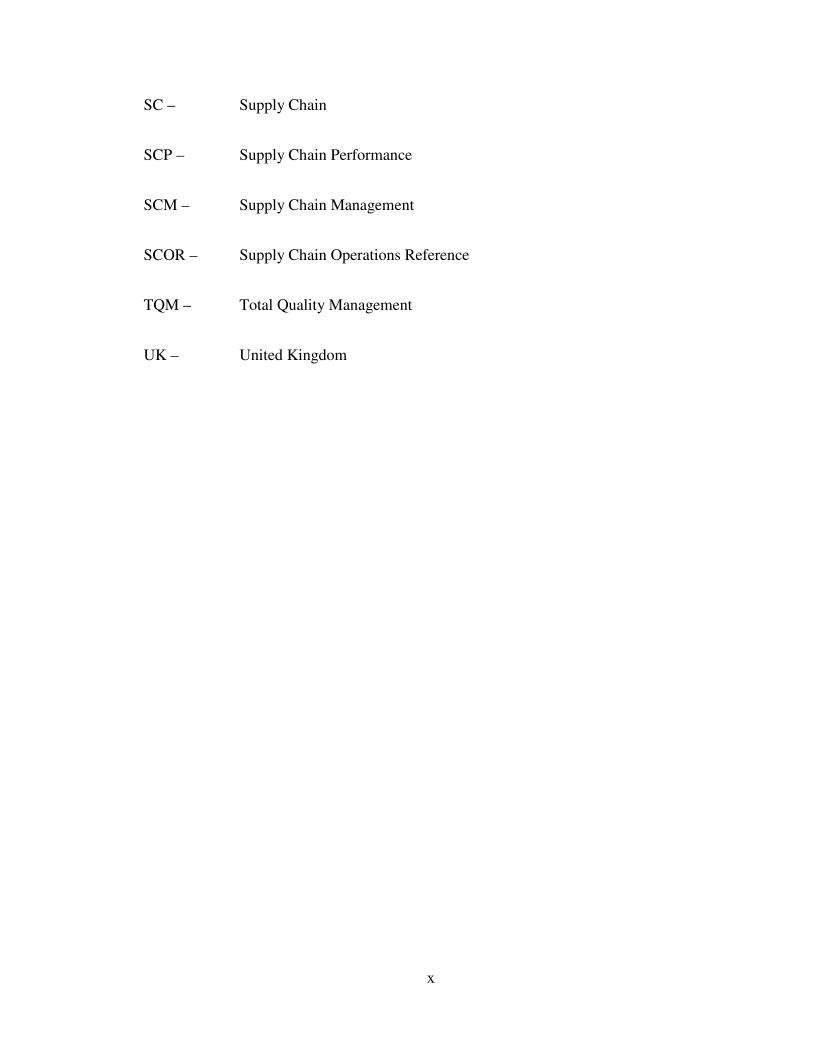
SC – Supply Chain
SCP – Supply Chain Performance
SCM – Supply Chain Management
SCOR – Supply Chain Operations Reference
TQM – Total Quality Management
UK – United Kingdom
� �
xi
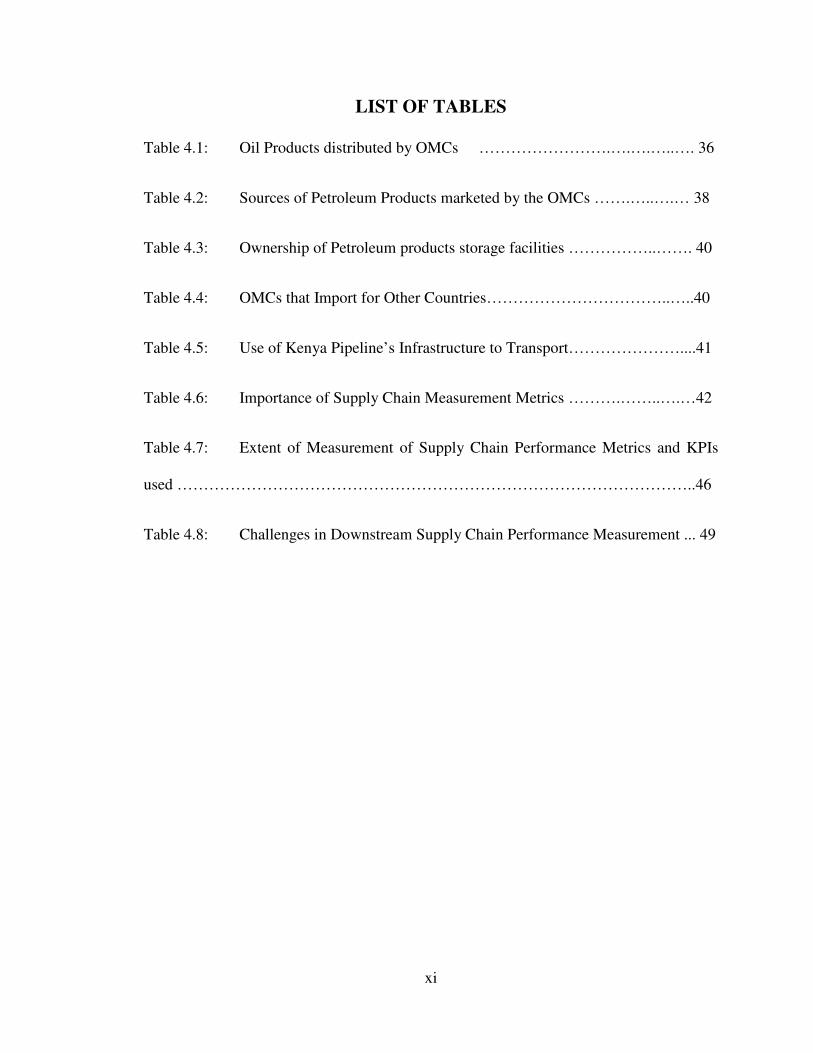
LIST OF TABLES
Table 4.1: Oil Products distributed by OMCs …………………….….….…..…. 36
Table 4.2: Sources of Petroleum Products marketed by the OMCs …….…..….… 38
Table 4.3: Ownership of Petroleum products storage facilities ……………..……. 40
Table 4.4: OMCs that Import for Other Countries……………………………..…..40
Table 4.5: Use of Kenya Pipeline’s Infrastructure to Transport…………………....41
Table 4.6: Importance of Supply Chain Measurement Metrics ……….……..….…42
Table 4.7: Extent of Measurement of Supply Chain Performance Metrics and KPIs
used ……………………………………………………………………………………..46
Table 4.8: Challenges in Downstream Supply Chain Performance Measurement ... 49
� �
xii
LIST OF FIGURES
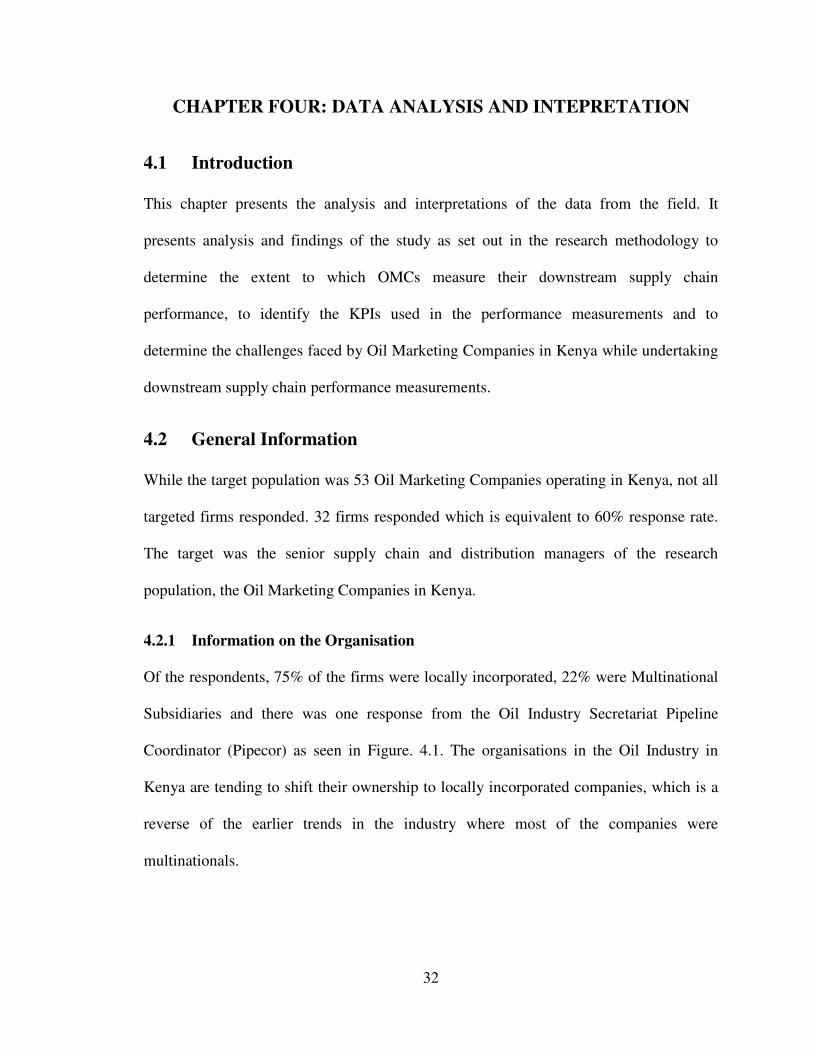
Figure 4.1: Ownership of OMCs ………………………………………….……….. 33
Figure 4.2: Size Distribution of OMCs …………….……….……..………………. 34
Figure 4.3: Years in Operation of OMCs …………….….………………….……… 35
Figure 4.4: Distribution of Petroleum Products …….……………………………... 37
Figure 4.5: Sources of Petroleum Products ………………….…….……………… 39
1
CHAPTER ONE: INTRODUCTION
1.1 Background of the Study
Products should be available to the intended customer at the right time, right place and
the right quantities as per the demand. This is obtained by having proper functions; for
example transport, warehousing, material handling and order processes. Su (1999) argues
that for a physical distribution system to be successful the system needs to perform a
series of important functions such as transport, warehousing, material handling and order
processing. This therefore means that the various functions named need to be integrated
for an effective system.
In the modern business environments characterized by ever-increasing competition and
economy globalization, manufacturers have been exploring innovative technologies and
strategies to achieve and sustain competitive advantage. As an effective business
philosophy, supply chain management has gained tremendous amount of attention from
both the academics and practitioners in the recent years (Chan & Qi, 2003b).
Supply chain management has been defined by Christopher (1998) as ‘the management
of upstream and downstream relationships with suppliers and customers to deliver
superior customer value at less cost to the supply chain as a whole’. To achieve this, the
‘people dimension’ is particularly important in combining technology and systems in
manufacturing and throughout the supply chain but the coordinated contribution of
various professional groups is involved. It has been argued that measuring supply chain
performance can facilitate a greater understanding of the supply chain, and improve its
overall performance (Myers et al. 2004; Chen & Paulraj, 2004).
2
1.1.1 Supply Chain Management
Supply chain management (SCM) is the management of a network of interconnected
businesses involved in the ultimate provision of product and service packages required by
end customers (Harland, 1996). Supply chain management spans all movement and
storage of raw materials, work-in-process inventory, and finished goods from point of
origin to point of consumption.
Supply chain management encompasses the planning and management of all activities
involved in sourcing and procurement, conversion, and all logistics management
activities. Importantly, it also includes coordination and collaboration with channel
partners, which can be suppliers, intermediaries, third-party service providers and
customers. Supply chain integrates supply and demand management within and across
companies. Supply chain management is an integrating function with the primary
responsibility of linking major business functions and business processes within and
across companies into a cohesive and high performing business model. It includes all
logistics, management activities as well as manufacturing operations and it drives
coordination of processes and activities (Jonsson, 2008).
In the UK, a survey showed that 40% of the UK’s gross domestic product was spent on
distribution and logistics related activities (Gunasekaran et al. 2004). The authors noted
that such findings and developments present significant visible impact of distribution,
purchasing, and supply management on company assets.
Supply chains can generally be described with upstream, downstream and internal
organisational activities. Upstream activities, flows and relationships include purchasing
3
and procurement functions. Internal organisational supply chain activities are related to
traditional production. Downstream activities and flows may include outbound logistics,
transportation, marketing, distribution, packaging and warehousing. Another definition
for supply chain is the "design, planning, execution, control, and monitoring of supply
chain activities with the objective of creating net value, building a competitive
infrastructure, leveraging worldwide logistics, synchronizing supply with demand and
measuring performance globally" (Cox, 1999). A supply chain is also broadly defined as
all of the linked individual organizations that by direct or indirect means, lead to delivery
of a service or of a good to a customer (Chopra & Meindl, 2004).
A modern competition is a major upheaval affecting every aspect of how networked
enterprises, supply chain networks, organize and operate. Gwako, (2008) noted that if an
individual enterprise wants to thrive, it has to understand how supply chain networks
work and how they can make them work better. A key feature of present day business is
the idea that it’s the supply chains that compete and not companies (Christopher &
Towill, 2001), and the failure of supply chains is ultimately determined in the
marketplace by the end customer.
In developing a supply chain strategy, the organisational structure of distribution
channels can be viewed as a network of flows embracing the movement of products,
services and information. This channel integration process offers potential for improving
the performance of all organisations along the supply chain and enables them to compete
effectively in the marketplace (Harrison & New, 2002). Supply chain therefore provides a
unique opportunity for organisations to utilize assets more effectively.
4
The challenges and complexity of inventory management, transportation, facilities
management, pricing and information availability are some of the factors that lead an
organisation to embrace supply chain management. All inventories within a supply chain
can dramatically alter a supply chain’s efficiency and responsiveness. Unexpected
changes in customer demands or uncertain supply can greatly affect a supply chain.
Modes and routes for moving the inventory faster generally also affect the supply chain’s
efficiency and responsiveness. Decisions on location, capacity and flexibility of facilities
have a significant effect on performance. Decisions on sourcing, whether in procurement,
in-house sourcing or outsourcing also affects a supply chain. Pricing for economies of
scale, as fixed price or menu pricing are also other decision drivers for supply chains.
1.1.2 Supply Chain Performance
Supply chain management has been a major component of competitive strategy to
enhance organizational productivity and profitability. In recent years, organizational
performance measurement and metrics have received much attention from researchers
and practitioners. The role of these metrics in the success of an organization cannot be
overstated because they affect strategic, tactical and operational planning and control.
Performance measurement and metrics have an important role to play in setting
objectives, evaluating performance, and determining future courses of actions
(Gunasekaran, et al. 2004).
Companies must always be concerned with their competition. Today's marketplace is
shifting from individual company performance to supply chain performance: the entire
chain's ability to meet end-customer needs through product availability and responsive,
on-time delivery. Supply chain performance crosses both functional lines and company
5
boundaries. Functional groups (engineering, R&D, manufacturing, sales and marketing)
are all instrumental in designing, building, and selling products most efficiently for the
supply chain. Traditional company boundaries are changing as companies discover new
ways of working together to achieve the ultimate supply chain goal: the ability to fill
customer orders faster and more efficiently than the competition. To achieve that goal, an
organisation needs performance measures, or "metrics", for global supply chain
performance improvements (Gunasekaran, et al. 2001).
The organisation’s performance measures must show not only how well the firm is
providing for its customers (service metrics) but also how it is handling its business
(speed, asset, inventory, and financial metrics). Given the cross-functional nature of
many supply chain improvements, a firm’s metrics must prevent "organizational silo"
behavior which can hinder supply chain performance. The basic objective of supply chain
management is to “optimize performance of the chain to add as much value as possible
for the least cost possible”. In other words, it aims to link all the supply chain agents to
jointly cooperate within the firm as a way to maximize productivity in the supply chain
and deliver the most benefits to all related parties (Jie, Parton, & Cox, 2007).
Measurement is important, as it affects behavior that impacts supply chain performance.
As such, performance measurement provides the means by which a company can assess
whether its supply chain has improved or degraded. Supply chain performance metrics
provide organizations with a standard framework to assess supply chain operations and
performance including internal and external firm links (Burcher, Lee & Sohal, 2006).
6
1.1.3 The Oil Marketing Companies in Kenya
The Kenyan Economic Survey (2007) indicated that there has been an observable
increase in demand for petroleum products within the Kenyan Economy and that of the
neighbouring countries. This has been fueled by the growth of the industrial and
agricultural sectors, road transport, rail transport, aviation, power generation and
manufacturing. The demand for petroleum products in Kenya has therefore seen a
constant increase. The 2011 Economic Survey shows that the Total demand of petroleum
products grew by 4.3% from 3610.8 thousand tonnes in 2009 to 3760.7 thousand tonnes
in 2010. The demand for power generation increased by 7.2% in 2010; the transport and
communication sector experienced a growth of 5.9% in 2010, driven by the expansion of
transport and storage sub-sectors.
The Oil Marketing Companies fall in the larger Petroleum industry in Kenya. They are
involved in the import, export to the neighbouring countries and distribution of petroleum
products to the end-consumers within Kenyan territory. Most of the neighbouring
countries to Kenya like Uganda, Rwanda, Burundi, DRC, and The Republic of South
Sudan continue to rely on Kenyan petroleum distribution networks and infrastructure.
Most of the supply chain decisions to these countries are made by locally incorporated oil
companies. There has also been an increased number of Oil Marketing Companies,
implying increased competition both for the available distribution infrastructure and for
the consumers. There are currently 53 registered OMCs which actively participate in the
importation of petroleum products (KPRL Entitlement Statement for May, 2012).
Petroleum products come to Kenya through the port of Mombasa, imported in the form of
refined products and as crude oil. The refined products are received by the OMC’s, as
7
well as by Kenya Pipeline Co. or the Kenya Petroleum Refineries Ltd. on behalf of the
OMC’s. KPC stores and transports the finished products to upcountry destinations. The
crude oil is received at the KPRL for processing to various petroleum products on the
basis of a processing agreement, which sets out the precise terms on which KPRL takes
custody of specific quantities and types of crude oil on behalf of the OMCs. The
Mombasa local depots are served directly by KPRL. Bitumen and Fuel oil are however
transported by road.
The supply chain of the petroleum products include three main activities namely the
upstream activities which include oil and gas exploration and production of crude oil, the
procurement of the crude by different users and the shipment to the different users. The
internal organisational supply chain activities would consist of the processing of the
crude oil to produce refined petroleum products. The downstream activities would
include the transportation, marketing, packaging, warehousing and distribution of
finished petroleum products. In the context of Kenyan petroleum industry, the
downstream activities would start at the activities after the receipt of the petroleum
products at the port of Mombasa. These activities include receipt of refined petroleum
products at KPC, KPRL or at the OMC’s depot, the receipt of crude oil by KPRL for
refining, the transportation of the petroleum products received from KPRL and product
stored at KPC by the pipeline or by oil tankers, and lastly, the distribution of the
petroleum products to the end users.
The OMCs on receipt of the refined products at the port of Mombasa will liaise with KPC
on the quantities required of given products at different parts of the country, and KPC
will schedule to deliver the products to the OMC at the required destination, by the
8
required dates. The OMC will also coordinate with KPRL Refinery Scheduler on the
entitled quantities of product that they would require from KPRL and schedule this to be
delivered to the Mombasa local depots or transferred to the pipeline for onward
transportation.
Requirement for all oil companies are consolidated to form a single product batch to be
transported by KPC. OMCs have to share the available pipeline as well as storage
tankage at KPC and KPRL. Sharing of the batch volume is based on each oil company’s
proportionate share of the stock at the KPC storage facility at the time of pumping. The
Kenya Revenue Authority through its Customs Services Department stipulates the
requirement for warehousing of petroleum products. The Department determines how
much duty and when to pay the duties and levies as well as the import and export
requirements. The individual OMCs have to pay up all the required tax duty before any
oil is released from the storage depots.
Each OMC has to liaise with KPRL Planner, or the Pipecor (Pipeline Coordinator) who
determines whether or not the marketer has material at KPRL or at KPC. KRA has then
to clear the required amount for the marketer to have access to their product. The Pipecor
and Refinery Scheduler then ‘queue’ the product for transportation by the pipeline, or for
certain products to be transferred to the local depots for trucking before the transportation
begins. Poor planning on the side of the OMCs will lead to them not having their
products where they would require them, at the required time. KPC will move the batch
to the next time slot that product will be transported in the pipeline.
9
The supply chain in the Petroleum industry is very dynamic, and thus it is very important
to measure its performance to know what to control and keep the company on track of its
business objectives. Measuring the performance of a supply chain will create a scope for
improvement of its performance, which will go a long way in leading a company to
gaining competitive advantage. This study intends to focus on the downstream supply
chain in the petroleum industry in Kenya and examine the extent to which OMC’s
measure their performance.
1.2 Research Problem
Manufacturers and service providers now, more than ever, face an increasing pressure of
customer satisfaction, quality improvement, and demand responsiveness. On the other
hand they need to reduce production costs, shorten lead time and lower inventory levels
to ensure profitability. In order to survive under these pressures, more and more
enterprises are striving to develop long term strategic partnerships with a few component
suppliers and collaborate with them in their operations (Lambert, et al. 1998).
‘Anything measured improves’; ‘What you measure is what you get’; ‘anything measured
gets done’; ‘you cannot manage what you do not measure’. These are some of the clichés
in the industry that support the interest in performance measurement (Lapide, 2000).
Measurement of the supply chain performance maximizes the potential of a given supply
chain, as the weak areas are identified and therefore the management objectives would be
in such a way as to strengthen these areas. The supply chain would thus be driven
towards higher effectiveness and efficiency. Oil Marketing Companies are keen on the
assurance of proper control of production assets through application of asset-wide
performance measurement systems. The business environment in which the Kenyan
10
Petroleum Industry operates in has statutory controls which constrain full market forces
from taking place. The OMCs operate with constrained facilities and in long supply
chains complicated by factors that they have no control over.
Cost of transportation remains high, and the clearance procedures remain long. Other
challenges include; Petroleum products are produced and moved in bulk leading to high
working capital requirements; volatility of crude oil prices in the international markets is
rather high as compared to other products; safety issues are critical due to the high
flammability property of petroleum, necessitating specialized handling all through from
shipment, storage, refining, and transportation to retailing (Dempster, et al. 2000). The
members of the downstream supply chain expect timely, reliable and quality delivery of
the right amount of products at low cost (Cirtita& Glaser-Segura, 2012). Additionally,
effective distribution of oil products will lead to increased profitability.
Ayugi (2007) examined the effectiveness and efficiency of the supply chain model in
Wrigley’s East Africa. He indicated that supply chain activities would increase the
organisation’s performance significantly. His focus was to understand the supply chain
model and the challenges the model was facing. Amolo (2002) found that most oil
companies were constrained in achievement of operations objectives; the major
constraints identified being the shared infrastructure and Government legislation.
Gataragwa (2007) examined the benefits enjoyed by East Africa Breweries Ltd., EABL,
by integrating the upstream and downstream of their supply chain. He observed that the
main risk faced by EABL was that the company relied heavily on few suppliers. Gwako
(2008) examined the metrics and corresponding indicators that Kenya Airways applied in
11
supply chain performance measurement. He highlighted the competitive strengths that an
airline should have to effectively and efficiently compete in the market.
Mukhwana (2010) researched on the impact of supply chain on performance at
Safaricom. He observed that there’s need to adopt a systematic approach to performance
measurement in the supply chain. He also suggested that metrics could be used to ensure
that the supply chain is performing as expected. He however did not specify any
performance measurement approach. Cirtita & Glaser-Segura (2012) studied downstream
supply chain performance metrics. They specifically focused on the use of the Supply
Chain Council’s Supply Chain Operations Reference, SCOR model. They indicated that
the SCOR model covered all aspects of demand satisfaction. This study covered aspects
of supply chain performance measurement but did not relate it to any particular industry
or market.
The downstream supply chain in the petroleum industry faces many challenges, which
could be managed better if the supply chain performance was measured with a view to
optimizing its performance. This study seeks to answer the following questions; Do the
OMC’s measure their downstream supply chain performance? Do the OMCs have supply
chain performance indicators? What challenges do the OMCs face in undertaking
downstream supply chain performance measurements?
1.3 Objectives of the study
The objectives of this study were;
i. To determine the extent to which the Oil Marketing Companies in Kenya measure
their Downstream Supply Chain Performance.
12
ii. To identify the key performance indicators used in Supply Chain Performance
Measurement.
iii. To determine the challenges faced by Oil Marketing Companies in Kenya while
undertaking Downstream Supply Chain Performance Measurement.
1.4 Value of the Study
The knowledge and information from this study will have a practical impact and will be
used by the Kenyan Oil Marketing Companies in utilizing the concept and tools of
downstream supply chain performance measurement to improve their operations. This
study will also be important to potential investors in the industry. It will assist the supply
chain managers in the Petroleum industry in Kenya to evaluate local conditions, key
success factors and challenges unique to the Kenyan business environment that can
contribute to the successful implementation of supply chain performance measurement.
The concepts from the study will form a basis for further research to the academicians.
There has been little study on the concept of supply chain performance measurement and
its importance in the industry. This study will also contribute to the knowledge in the area
of downstream supply chain performance measurement in Kenya.
The study will also contribute towards sound and more informed decision making on
downstream supply chain performance measurement by the policy makers in
organisations and in public institutions. Decisions made from an informed point of view
tend to be more effective. Effective and efficient supply chain operations would be the
goal of policy makers and institutional leaders.
13
CHAPTER TWO: LITERATURE REVIEW
2.1 Introduction
In this chapter, literature on Supply Chain Management, its need and benefit is reviewed.
The literature will also define Supply Chain Performance and the need to measure it. The
chapter will end by exploring studies that have been done on Supply Chain Performance
Measurement.
2.2 Supply Chain Management
Globalization and the advent of new technologies are great contributors to prompting
business competition. Enterprises are looking to effectively and efficiently satisfy
customers’ needs to remain competitive (Chan & Qi, 2003a). The viability of a firm
largely depends on how well the firm responds to customer requirements while becoming
lean (Gunasekaran, et al. 2001). Effectiveness calls for enterprises to be equipped with
customer-focused common goals among all the related suppliers and manufacturers. The
business success would then rely on the capability of quick response to customer
requirements. The supplier and the manufacturer need to coordinate in sharing the
common goal and strategy of improving product quality and customer service level.
Efficiency requires that enterprises meet customer requirement (Chan & Qi, 2003a).
A supply chain is the sequence of organisations – their facilities, functions, and activities
– that are involved in producing and delivering a product or service. The sequence would
begin with the basic suppliers of raw materials and would extend all the way to the final
consumer (Stevenson, 2002). A supply chain is viewed as a number of organisations
working cooperatively with some shared objectives (Holmberg, 2000). Lysons &
14
Farrington (2006) viewed Supply Chain Management, SCM, in three facets; as a
management philosophy, where systems are viewed as a whole, with a strategic
orientation towards the organizational goals; as a set of activities to implement
management philosophy, where integrated behaviour, mutually shared information and
risks as well as rewards have one goal and focus on serving the customers; as a set of
management processes where customer service and customer relationship management as
well as product development and commercialization are championed.
According to Giunipero & Brand (1996), Supply Chain Management represents a state-
of-the-art management tool used to enhance overall customer satisfaction that is intended
to improve competitiveness and profitability. In order to survive in the global competition
and sustain long-term advantages, many firms have introduced SCM (Chan & Qi,
2003b). SCM thinking is a way of thinking that is devoted to discovering tools and
techniques that provide for increased operational effectiveness and efficiency throughout
the delivery channels that must be created internally and externally to support and supply
existing corporate product and service offering to customers (Cox, 1999). Gunasekaran et
al. (2004) indicated that SCM has been a major component of competitive strategy to
enhance organizational productivity and profitability. Every business organisation is part
of at least one supply chain, and many are part of multiple supply chains. The number
and type of organisations in a supply chain are determined by whether the supply chain is
manufacturing or service oriented.
Supply chains are sometimes referred to as value chains. This indicates that value is
added to goods and services as they progress through a chain. Lysons & Farrington
(2006) defined a supply chain as that network of organisations that are involved, through
15
upstream and downstream linkages, in the different processes and activities that produce
value in the form of products and services. SCM is a management philosophy that seeks
synchronization and convergence of intra-firm and inter-firm operational and strategic
capabilities into a unified, compelling marketplace force (Ross, 1998).
Holmberg (2000) indicated that the interest in managing supply chains is growing rapidly
among companies around the world, the major forces being increasing competitive
pressure and the belief that working cooperatively in a supply chain can create a
competitive advantage. Firms adopt integrative management styles focused on
coordinating activities along the supply chain in order to attain or sustain a competitive
position. Organisations used to concentrate on immediate suppliers of their goods and
materials. Most organisations hardly paid much attention to management of their supply
chains. There are several factors, though, that would drive an organisation to consider
managing its supply chain.
Every organisation in the marketplace is looking for ways of improving its operations.
Techniques such as Total Quality Management (TQM), Lean production and agile
production have resulted, and organisations that have adopted these techniques are seeing
improved quality, and reduced excess costs. Organisations are also increasing their level
of outsourcing, buying goods or services instead of producing or providing them
themselves. Transportation costs are also increasing, and these need to be more carefully
managed. Globalization and increasing use of information technology has made the world
a ‘global village’, but this has resulted in longer, more complex, supply chains
(Stevenson, 2002).
16
The markets have grown to be highly dynamic and highly competitive, coupled with
demand for shorter lead times, lower costs, higher quality and diversified products by the
customers (Ip, Chan & Lam, 2011). These are complicated by increased number of new
products, shorter product development and life cycles, and increased demand for
customization. There is also a growing need to adopt quick-response strategies and to
reduce the lead time for products. With all these, organisations are striving to manage
inventories, without causing shortages or having excess inventories that attract
unnecessary handling costs (Stevenson, 2002).
Monczka et al. (1998) described SCM as a concept whose primary objective was to
integrate and manage the sourcing, flow, and control of materials using a total systems
perspective across multiple functions and multiple tiers of suppliers. Supply chain
management deals with the total flow of materials from suppliers through end users.
SCM is a set of beliefs that each firm in the supply chain directly and indirectly affects
the performance of all the other supply chain members, as well as ultimate, overall supply
chain performance.
SCM as an integrative philosophy directs supply chain members to focus on developing
innovative solutions to create unique, individualized sources of customer value (Cooper,
et al. 1998). The main objective of managing the supply chain is to synchronize the
requirements of the customer with the flow of materials from suppliers in order to effect a
balance between what are often seen as conflicting goals of high customer service, low
inventory management, and low unit cost (Stevens, 1989). Embracing effective supply
chain management practices brings a lot of benefits to an organisation. These include
having lower inventories, lower costs, higher productivity, higher profits, shorter lead
17
times, improved ability to respond to fluctuations in demand, and general increased
customer loyalty (Stevenson, 2002).
2.3 Supply Chain Performance
Today’s businesses find that complex corporate supply chains on which they depend
stretch across international borders and also embrace relationships with an increasing
number of partners and suppliers (Mwanyota, 2004). The major challenges for
companies today, arise from the fact that the longer the supply chain becomes the more
complex they are to manage. Supply chains are clogged with unnecessary steps and
redundant stockpiles all of which form a significant percentage of the operating costs.
There are many opportunities to get cost out of the supply chain than you do out of
manufacturing. There tends to be so much duplication and inefficiency. A thorough
understanding of the concept often leads to its successful implementation. A successful
implementation is closely dependent upon the ability to create, manage and reshape long-
term relationships between individuals, organizations and networks within the supply
chain. It requires new organisational arrangements and culture, which calls for
considerable commitment, resources and time to develop (Saad & Patel, 2006).
Supply chains are fluid and are continuously adjusting to changes in supply and demand
for the products they handle. To get the desired performance from supply chains requires
a company to monitor and control its operations on a daily basis. A supply chain exists to
support the market that it serves. To identify the performance that a supply chain should
deliver, we need to evaluate the market being served (Hugos, 2011). In the current
economy the battlefield is shifting from individual company performance to Supply
Chain Performance. Schorr (1998) indicated that firms no longer compete against each
18
other individually, but do so together with their respective supply chains. For firms to
compete and survive in this global competitive environment, they have to continuously
improve their enterprise collaborative and cohesive relationships within the supply chain
networks. Enterprises also need to manage all entities throughout the whole supply chain
network to achieve a unified business objective (Ip, Chan & Lam, 2011).
Supply Chain Performance refers to the extended supply chain’s activities in meeting
end-customer requirements, including product availability, on-time delivery, and all the
necessary inventory and capacity in the supply chain to deliver that performance in a
responsive manner. Supply Chain Performance crosses company boundaries since it
includes raw materials, components, work-in-progress as well as finished products, and
distribution through various channels to the end customer. It also crosses traditional
functional organization lines such as procurement, manufacturing, distribution, marketing
and sales, and research and development (Hausman, 2002). A supply chain performance
evaluation system represents a formal, systematic approach to monitor and evaluate the
performance of the supply chain (Handfield, et al. 2009). It should however be noted that
it is often difficult to develop measures that direct behaviour or activity exactly as
intended. Some firms rely on measures that do not support long term performance. Over
time, the workplace’s view of performance measurement has become more humane and
do not view employees as highly reliable, predictable machines, and exaggerated types
of monitoring and control methods have fallen out of favor, and replaced by a focus on a
measuring a business’ performance rather than that of the individual (Lapide,2000).
Measurement is important, as it affects behavior that impacts supply chain performance.
As such, performance measurement provides the means by which a company can assess
19
whether its Supply Chain has improved or degraded (Lapide, 2000). A performance
measurement system plays an important role in managing a firm’s business as it provides
the information necessary for decision making and actions (Holmberg, 2000). Monitoring
and improvement of a performance of a SC has become an increasingly complex task. A
complex performance management system includes many management processes. These
would include identifying measures, defining targets, planning, communication,
monitoring, reporting and feedback. Performance measurement is critical for companies
to improve supply chains’ effectiveness and efficiency (Cai, Liu, Xiao & Liu, 2008).
Traditionally, performance measurement is defined as the process of quantifying
effectiveness and efficiency of action (Neely, et al.1995). Measuring performance means
transferring the reality of performance into a sequence of limited symbols to be
communicated (Chan & Qi, 2003a).
In recent years, organizational performance measurement and metrics have received
much attention from researchers and practitioners. The role of these metrics in the
success of an organization cannot be overstated because they affect strategic, tactical and
operational planning and control (Gunasekaran, et al. 2004). From a management
perspective, performance measurement and metrics have an important role to play in
setting objectives, evaluating performance, and determining future courses of actions by
providing the necessary information of management feedback. In the context of a
dynamic SC, continuously improving performance has become a critical issue for most
suppliers, manufacturers, and the related retailers to gain and sustain competitiveness.
Monitoring and improvement of performance of a supply chain has become an
increasingly complex task. A complex performance management system includes many
20
management processes, such as identifying measures, defining targets, planning,
communication, monitoring, reporting and feedback. These processes are currently in
many information systems and these solutions measure and monitor Key Performance
Indicators which are crucial for optimizing supply chain performance (Cai, et al. 2008).
Most companies realize the importance of financial and non-financial performance
measures. They have however failed to represent them in a balanced framework.
Gunasekaran et al. (2004) observe that many companies have not succeeded in
maximizing their supply chain’s potential because they have often failed to develop the
performance measures and metrics needed to fully integrate their supply chain to
maximize effectiveness and efficiency. Lee & Billington (1992) observed that the
discrete sites in a supply chain do not maximize efficiency if each pursues goals
independently. They point to incomplete performance measures existing among
industries for assessment of the entire supply chain. Gunasekaran et al. (2004) further
reiterate that measurements should be understandable by all supply chain members and
should offer minimum opportunity for manipulation.
With greater reliance on suppliers and increasing emergence of outsourcing and fierce
competition, the main challenge for supply chain management is to sustain and
continuously improve the coordination and integration of all interactions and interfaces in
order to enhance the overall performance of the supply chain. It is therefore important to
associate the supply chain concept based on continuous improvement with performance
management (Saad & Patel, 2006). Lapide (2000) pointed out that supply chain
performance measurements are important to firms as measurements are important to
directly controlling behavior and indirectly to performance. A few key measurements will
21
go a long way toward keeping a company on track towards achieving its supply chain
improvement objectives. He also noted that picking the wrong measures and leaving out
important ones could lead to supply chain performance degradation. Driving a supply
chain based only on after-the-fact measures, like losing an important customer or having
poor financial performance is not very effective.
According to Handfield et al. (2009) there are a number of reasons for measuring and
evaluating supply chain activity and performance. Measurement can lead to better
decision making as the firm would understand the areas in which performance falls short.
Performance measurement can result in better communication across the supply chain.
Measurement provides the opportunity for performance feedback which then supports the
prevention or correction of problems identified during the performance measurement
process. Lastly, measurement also motivates and directs behaviour towards a desired end
result.
2.4 Supply Chain Performance Measurement
There is no universal method of measuring supply chains performance. Many scholars
have come up with innovative ways to measuring supply chain performance and others
have studied existing methods of measurement. Many firms look to continuously improve
their operations to enhance core competitiveness using supply chain measurement.
However, many companies have not succeeded in maximizing their supply chain’s
potential because they have often failed to develop performance measures and metrics
needed to fully integrate their supply chains to maximize effectiveness and efficiency
(Gunasekaran, et al.2004).
22
Supply chain performance measures can be classified broadly into two categories:
qualitative measures and quantitative measures. Quantitative metrics of supply chain
performance can be classified into two broad categories: Non-financial and financial.
Improving supply chain performance requires a multi-dimensional strategy that addresses
how the organization will service diverse customer needs. While the performance
measurements may be similar, the specific performance goals of each segment may be
quite different. Use of metrics and communicating results allows members of a supply
chain to compete at a higher level and attract customers more than other supply chains
that coordinate inter-firm activity to a lesser extent would (Cirtita & Glaser-Segura,
2012).
2.4.1 Approaches to Supply Chain Performance Measurement
Traditionally, many companies have been tracking their performance based largely on
financial accounting principles (Lapide 2000). These measures are important but are
biased towards improving the financial status of a firm, but are largely insufficient to
measure supply chain performance. These measures lack relationships to important
strategic, non-financial performance, like customer service and loyalty, and product
quality. They also may not be focused towards providing forward looking perspective
and do not directly tie to operational effectiveness and efficiency. Because of these
shortcomings, a variety of measurement approaches have been developed and explored
by different scholars.
Chan & Qi (2003a, b) studied the feasibility of supply chain performance systems using a
process-based approach. They indicated that performance measurement provided an
approach to identify the success and potential of management strategies, and facilitating
23
understanding of progress and position. They proposed an innovative concept of
Performance of Activity to identify and employ performance measures and metrics. This
method reiterated the aspect of supply chains not being self-centered enterprises
connected through the business relations. This measure takes a holistic system
perspective beyond the organisational boundaries. Another model reiterates the
integration of business processes. A supply chain is defined as the integration of key
business processes from end user through original suppliers and other stakeholders. From
this definition, the success of a supply chain requires a change from managing individual
functions to integrating activities within key supply chain business processes.
Holmberg (2000) investigated a systems perspective on supply chain measures, and
examined a system as inter-connected components separated from their environments by
a system border. The rationale of using systems thinking is that it provides a method for
describing, analyzing and planning complex systems of different kinds. This offers a way
of understanding problems and communicating this understanding to others. Looking at
what happens in an isolated unit, and optimizing the routines ensures that unit is as
efficient as possible and would improve the productivity of that isolated unit. The hurdles
that each unit would face would differ with the activity at that unit. With all units as
efficient as possible, the whole supply chain’s performance would improve.
Gunasekaran et al. (2001) studied performance measures and metrics in a supply chain
environment and enumerates several measures and metrics that a firm could adopt. The
first is the Metrics for performance evaluation of planned order procedures where an
analysis of the way the order-related activities are carried out. This covers important
issues like the order-entry method, order lead-time and path of order transverse. Next, the
24
supply chain partnership and related metrics is measured. Partnerships in a supply chain
e.g. outsourcing are important. Many times these reduce product introduction times.
Faster introduction of a product would considerably depend on the reliability and quick
responsiveness of suppliers. This helps to evaluate the level of competitiveness.
Another metric proposed is the production level measures and metrics which focuses
mainly on production processes; product cost, quality, speed of delivery and on the
delivery reliability and flexibility. The fourth metric is the performance evaluation of
delivery link. It deals directly with the customer delivery of goods and services. It is
sometimes referred to as the driver of customer satisfaction. Delivery operations,
however, are very dynamic, making the analysis and subsequent improvement plan of a
distribution system difficult. Measuring customer service and satisfaction is the other
metric. With increased globalization and global markets, effective performance
measurement and supply chain metrics must be linked to customer satisfaction. This
measurement is needed to integrate the customer specification in the control of the
process. The Supply chain finance and logistics cost performance can also be assessed by
determining the total logistics cost. Care must however be taken during decision making
as the cost in one area could affect that of other areas (Gunasekaran, et al. 2001).
Ip et al. (2011) modeled supply chain performance and stability using systems dynamics
and the Auto-Regressive Integrated Moving Average. This was an innovative metrics that
they floated for further analysis and for projecting supply chain stability for long-term
management decisions making. They proposed a three-step integrated model as follows;
first create a KPI to quantify and document performance measurement. This could be in
form of the balanced score card or an index measure. KPI is used widely in measuring
25
business performances of different industries. The next step would entail developing a
systems dynamic model for simply monitoring, updating and evaluating supply chain
performance in achieving the firm’s objective. The dynamic context of supply chains
need to be considered as it is crucial in improving a supply chain and in gaining
competitive advantage. The third step is to build a uni-variate ARIMA model for
examining SC stability.
Cai et al. (2008) proposed a systematic approach that would help analyze and select the
right Key Performance Indicator groups and strategies for their accomplishment, based
on the cost of iterative improvement of each KPI, for improved supply chain
performance. Gatarwa (2007) examined the benefits that East Africa Breweries Limited
enjoyed by integrating the upstream and downstream of their supply chain. The main risk
faced by EABL was the over-reliance on very few suppliers. This posed as a risk to the
performance of the supply chain. Mukhwana (2010) researched on the impact of supply
chain on performance at Safaricom Kenya Limited. The research was to find the impact
of Safaricom’s SCM practices on the company’s performance in the industry. The study
focused on overall operational performance within the Safaricom business. He observed
that there’s need to adopt a systematic approach to performance measurement in the
supply chain. He also suggested that metrics could be used to ensure that the supply chain
is performing as expected. He however did not specify any performance measurement
approach. Gwako (2008) examined metrics and corresponding indicators that Kenya
Airways applied in their supply chain performance measurement. He brought forward the
competitive strengths that an airline should have to effectively and efficiently compete in
the world airline market. He identified the dimensions that Kenya Airways used in
26
measuring its supply chain performance which included reliability, on-time performance,
delay minimization, schedule integrity, frequency of flights, passenger security, customer
service, effectiveness of partnerships, competitive prices and distribution strengths. The
main challenge faced at Kenya Airways being difficulty in linking measures to customer
value.
Cirtita & Glaser-Segura (2012) studied downstream supply chain performance metrics,
and specifically focused on the use of the Supply Chain council’s Supply Chain
Operations Reference, (SCOR) model. The downstream supply chain consists mainly of
manufacturers, transportation, distribution, wholesale, retail and end user. Performance
metrics offer a view of the Downstream Supply Chain cost structure and allow
opportunities for improvement. They also keep track of service levels which allow for
further development of supply efficiencies. The authors adopted the SCOR model which
assesses the following performance attributes; Supply chain delivery performance, supply
chain flexibility and responsiveness, supply chain logistics and cost and supply chain
asset management. The scope of the SCOR model includes all elements of demand
satisfaction starting with the initial demand signal, as an order, and ending with the signal
of satisfying the demand, as final invoice and payments. In their paper, Cirtita & Glaser-
Segura (2012) presented the SCOR model in five attributes; Supply chain delivery
reliability, supply chain flexibility, supply chain responsiveness, supply chain costs and
supply chain asset management efficiency. These attributes give a methodology on the
measurement of Supply Chain Performance. The method does not relate to any specific
industry, country or market. This research study on the Petroleum Oil Industry in Kenya
27
focuses on the Downstream Supply Chain Performance Measurement practice in the
industry.
2.4.2 The Challenges of Supply Chain Performance Measurement
Cai et al. (2008) noted that improving the supply chain performance is a continuous
process requiring both an analytical performance measurement system and a mechanism
to initiate steps towards realization of goals that have been set. Supply chain performance
is measured by a set of variables that capture the impact of actual working of the supply
chains on costs and revenues of the system. Managers are tasked with having to improve
on the variables set by continual improvement, monitoring and evaluation. Reliance on
outsourcing and on suppliers brings a challenge in sustainability of efficient and flawless
supply chain activities and interfaces. Managers are required to understand what
constitutes effective relationships with partners in supply chains and how their
effectiveness can be assessed (Saad & Patel, 2006). The success of the supply chain is
reliant on less tangible factors. Many of the current metrics used in the measurement of
performance are not sufficiently adequate.
Other challenges in supply chain performance measures and evaluation are the existence
of too much data and existence of wrong data. There is sometimes too much data or the
manager would be paying attention to the wrong data. This could be because metrics are
selected using history, or a personal feeling of a manager that the measure is related to
success. Sometimes measures followed by managers may be conflicting with measures
used in other departments or functions. Sometimes managers have a challenge in setting
measures and ignore the longer-range or strategic-focused metrics and instead focus on
the short-range measures. Some supply chain performance measurement metrics lack
28
detail, or drive the wrong performance. They then tend to measure driving behaviour that
is either not intended, or not needed. Many of the performance measures do not give the
guarantee that the behaviour will lead to desired results (Handfield, et al. 2009).
2.5 Summary
The Literature review sought to introduce the reader to Supply Chains, which is a
sequence of organisations involved in producing and delivering a product or service to
customers. Supply Chain Management has the main objective of managing the supply
chain and to synchronize the requirements of the customer with the flow of materials
from suppliers in order to effect a balance between conflicting goals of high customer
service, low inventory management, and low unit cost. The highly dynamic and
competitive business environment has pushed firms to work together towards a common
goal of supplying goods and services to customers. Measurement of the performance of a
supply chain is equally important as this will ensure that a supply chain is optimized and
is working as it should. Supply Chain Performance is a systematic approach to monitor
and evaluate the performance of the supply chain. Measurement is important as it affects
the behaviour that impacts on Supply Chain Performance. It provides information
necessary for decision making.
Several approaches have been suggested for measuring Supply Chain Performance; A
process-based approach, a systems perspective on supply chain measures, use of metrics
and use of KPIs to benchmark on the performance of the supply chain. Supply chain
performance measurement faces a major challenge of heavy reliance on outsourcing by
firms making it difficult to sustain efficient and flawless supply chain activities. The
studies took a broad view of Supply Chain Performance Measurement and did not focus
29
on the Downstream SCP Measurement. Most of the studies also did not focus on the
Petroleum Oil Industry in Kenya, and did not also capture the challenges faced in the
measurement of the SCP.
This study examines the Downstream Supply Chain Performance Measurement by the
Oil Marketing Companies in Kenya. There are few studies done on the measurement of
supply chain performance in Kenya, and especially by the Oil Marketing Companies. The
study would examine extent to which the OMCs measure their Downstream SCP, and
identify the KPIs used. Challenges faced by the OMCs while undertaking these measures
will also be analyzed. The study will examine the manufacturers, transporters’
efficiencies, distribution networks and efficiencies, wholesale and retail services, and end
customer satisfaction of the services rendered.
30
CHAPTER THREE: RESEARCH METHODOLOGY
3.1 Introduction
This chapter highlights the methodology that was adopted in order to meet the objective
of the study, included in this chapter is the research design, the population of the study,
data collection and data analysis procedures.
3.2 Research Design
The study employed a descriptive survey research design to determine the extent to
which OMCs measure their downstream supply chain performance, and identified the
KPIs used in the performance measurements. The survey method was selected as it was
suited in exploratory research studies and allowed the collection of large amounts of data
which could be analyzed quantitatively using descriptive and inferential statistics.
3.3 Population and Sampling
The population of the study was the Oil Marketing Companies (OMCs), in Kenya. The
research was intended to capture data from a broad base consisting small, medium and
large OMCs. The study was a census study of 53 OMCs licensed by the Energy
Regulatory Commission (ERC) to import and process crude at the Kenya Petroleum
Refineries Ltd. (KPRL) and that were operational and active in business as at May 2012.
These organisations encountered long supply chains and had many logistical challenges
in their supply chain operations.
31
3.4 Data Collection
Primary data was collected using a structured questionnaire through ‘drop-and-pick-later’
method. The questionnaires were sent to the supply chain managers or their equivalent of
the various OMCs. The questionnaire has both closed and open-ended questions and has
four sections. Section A of the questionnaire seeks data on the general information on the
OMCs. Section B of the questionnaire examines the level of importance accorded to
given supply chain measurement metrics. Section C of the questionnaire looks at the
extent to which OMCs measure their downstream supply chain performance and the KPIs
used. Section D determines the challenges faced by the OMCs in downstream supply
chain performance measurement (see Appendix 1).
3.5 Data Analysis
The data collected was checked for completeness, consistency and accuracy. It was coded
and tabulated for ease of interpretation. The data was analyzed using descriptive statistics
of mean rating and standard deviation. Section A of the questionnaire was analyzed to
give the general information of the different firms. Section B was analyzed to show
importance accorded to measurement of the downstream supply chain. Section C was
analyzed to show the extent to which the OMCs measured their downstream Supply
Chain Performance. Part D was analyzed to establish the challenges faced in measuring
performance of the Downstream Supply Chain.
32
CHAPTER FOUR: DATA ANALYSIS AND INTEPRETATION
4.1 Introduction
This chapter presents the analysis and interpretations of the data from the field. It
presents analysis and findings of the study as set out in the research methodology to
determine the extent to which OMCs measure their downstream supply chain
performance, to identify the KPIs used in the performance measurements and to
determine the challenges faced by Oil Marketing Companies in Kenya while undertaking
downstream supply chain performance measurements.
4.2 General Information
While the target population was 53 Oil Marketing Companies operating in Kenya, not all
targeted firms responded. 32 firms responded which is equivalent to 60% response rate.
The target was the senior supply chain and distribution managers of the research
population, the Oil Marketing Companies in Kenya.
4.2.1 Information on the Organisation
Of the respondents, 75% of the firms were locally incorporated, 22% were Multinational
Subsidiaries and there was one response from the Oil Industry Secretariat Pipeline
Coordinator (Pipecor) as seen in Figure. 4.1. The organisations in the Oil Industry in
Kenya are tending to shift their ownership to locally incorporated companies, which is a
reverse of the earlier trends in the industry where most of the companies were
multinationals.
33
Figure 4.1: Ownership of OMCs
Source – Research Data
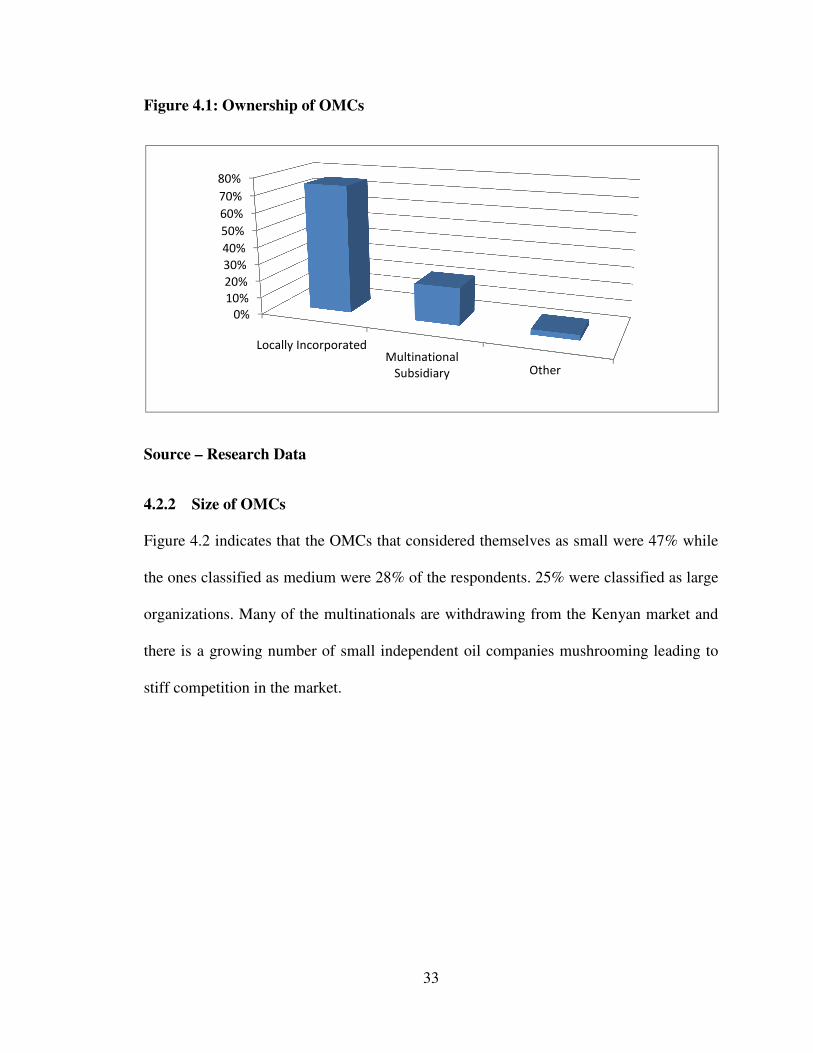
4.2.2 Size of OMCs
Figure 4.2 indicates that the OMCs that considered themselves as small were 47% while
the ones classified as medium were 28% of the respondents. 25% were classified as large
organizations. Many of the multinationals are withdrawing from the Kenyan market and
there is a growing number of small independent oil companies mushrooming leading to
stiff competition in the market.
��
���
���
���
���
���
��
��
���
� ��������� �� ������ �������� ���
���������� � � ��
34
Figure 4.2: Size of OMCs
Source – Research Data
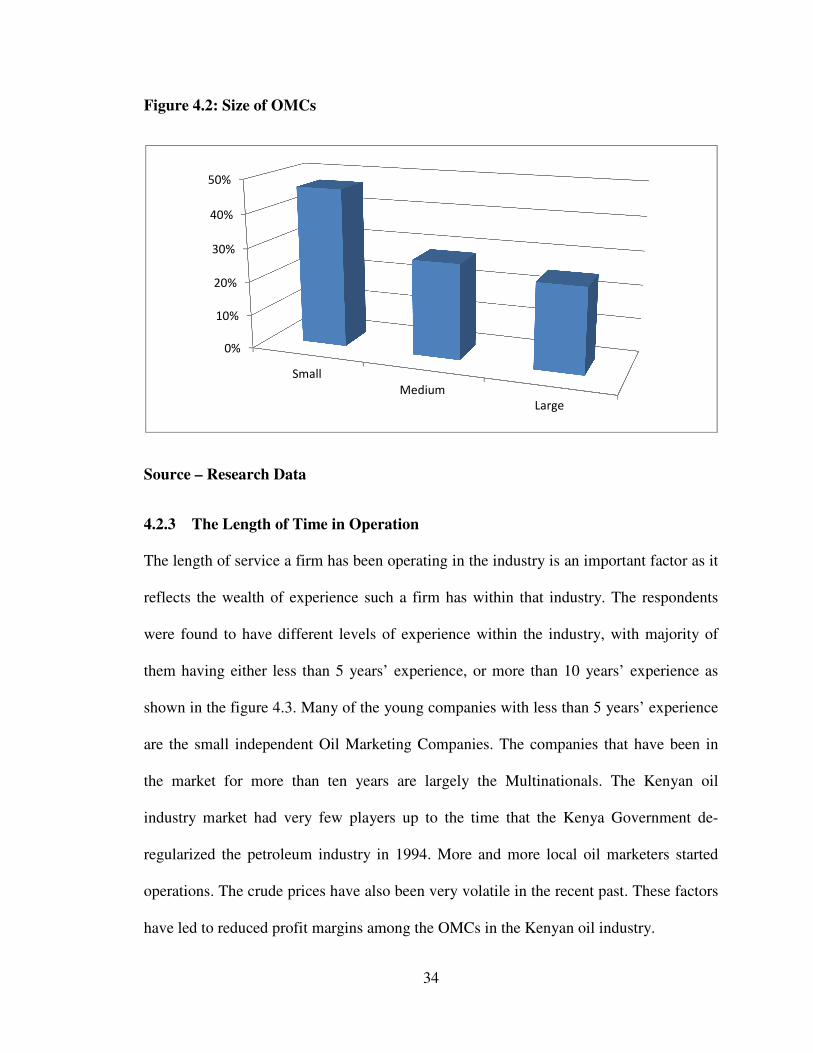
4.2.3 The Length of Time in Operation
The length of service a firm has been operating in the industry is an important factor as it
reflects the wealth of experience such a firm has within that industry. The respondents
were found to have different levels of experience within the industry, with majority of
them having either less than 5 years’ experience, or more than 10 years’ experience as
shown in the figure 4.3. Many of the young companies with less than 5 years’ experience
are the small independent Oil Marketing Companies. The companies that have been in
the market for more than ten years are largely the Multinationals. The Kenyan oil
industry market had very few players up to the time that the Kenya Government de-
regularized the petroleum industry in 1994. More and more local oil marketers started
operations. The crude prices have also been very volatile in the recent past. These factors
have led to reduced profit margins among the OMCs in the Kenyan oil industry.
��
���
���
���
���
���
�! ���
� ����!
���"�
35
Figure 4.3: The Length of Time in Operation
Source – Research Data
Moreover, many of the big multinational OMCs have in the recent past shifted their focus
from downstream petroleum oil operations to upstream, where they focus on oil and gas
exploration activities, as these have much greater profit margins.
4.2.4 Oil Products Distributed by OMCs
Different OMCs distribute different oil products depending on the market target and
business model of the specific OMC. From the respondents, the following was the
percentiles of the different products that firms distributed. From the table 4.1, it can be
observed that most OMCs distributed Diesel, Premium Motor Spirit (Petrol) and
Kerosene.
The recent market trends indicate that the demand for diesel is growing fast and is
surpassing that of petrol. This trend is also seen in many of the regions of the world
��
��
���
���
���
���
���
���
���
���
� ���� �����������#��$ �����������
����� %�&�������� ������
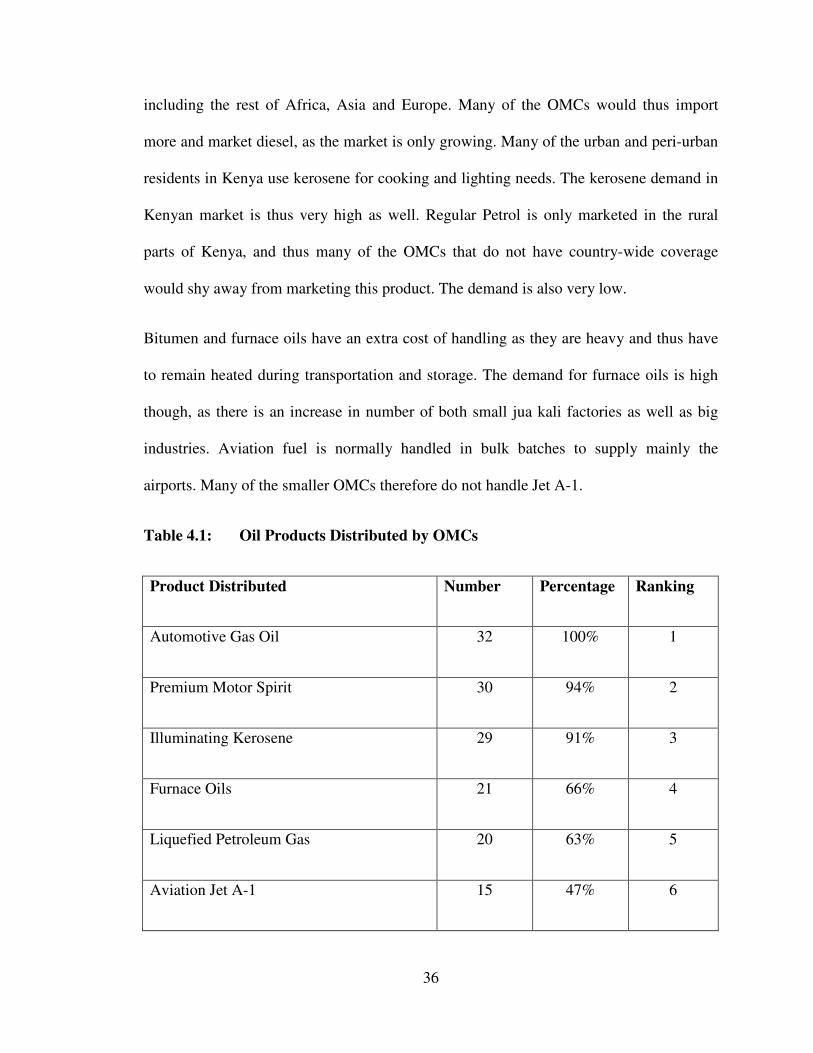
36
including the rest of Africa, Asia and Europe. Many of the OMCs would thus import
more and market diesel, as the market is only growing. Many of the urban and peri-urban
residents in Kenya use kerosene for cooking and lighting needs. The kerosene demand in
Kenyan market is thus very high as well. Regular Petrol is only marketed in the rural
parts of Kenya, and thus many of the OMCs that do not have country-wide coverage
would shy away from marketing this product. The demand is also very low.
Bitumen and furnace oils have an extra cost of handling as they are heavy and thus have
to remain heated during transportation and storage. The demand for furnace oils is high
though, as there is an increase in number of both small jua kali factories as well as big
industries. Aviation fuel is normally handled in bulk batches to supply mainly the
airports. Many of the smaller OMCs therefore do not handle Jet A-1.
Table 4.1: Oil Products Distributed by OMCs
Product Distributed Number Percentage Ranking
Automotive Gas Oil 32 100% 1
Premium Motor Spirit 30 94% 2
Illuminating Kerosene 29 91% 3
Furnace Oils 21 66% 4
Liquefied Petroleum Gas 20 63% 5
Aviation Jet A-1 15 47% 6
37
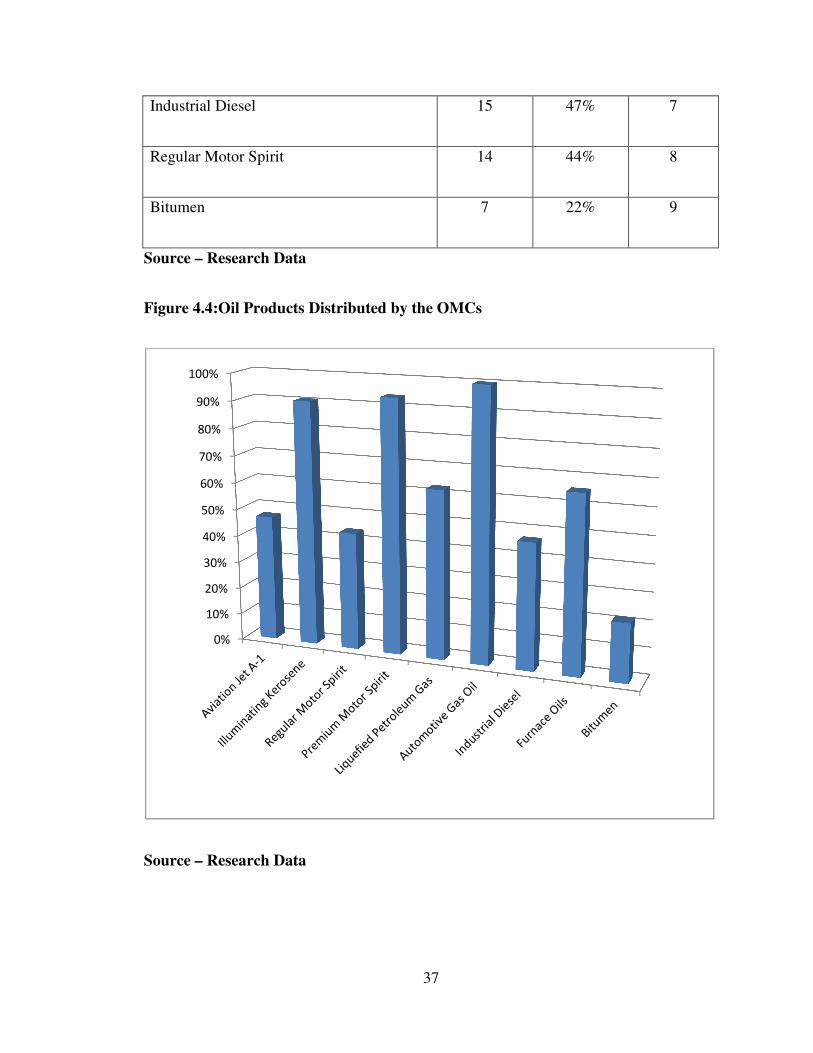
Industrial Diesel 15 47% 7
Regular Motor Spirit 14 44% 8
Bitumen 7 22% 9
Source – Research Data
Figure 4.4:Oil Products Distributed by the OMCs
Source – Research Data
��
���
���
���
���
���
��
��
���
'��
����
38
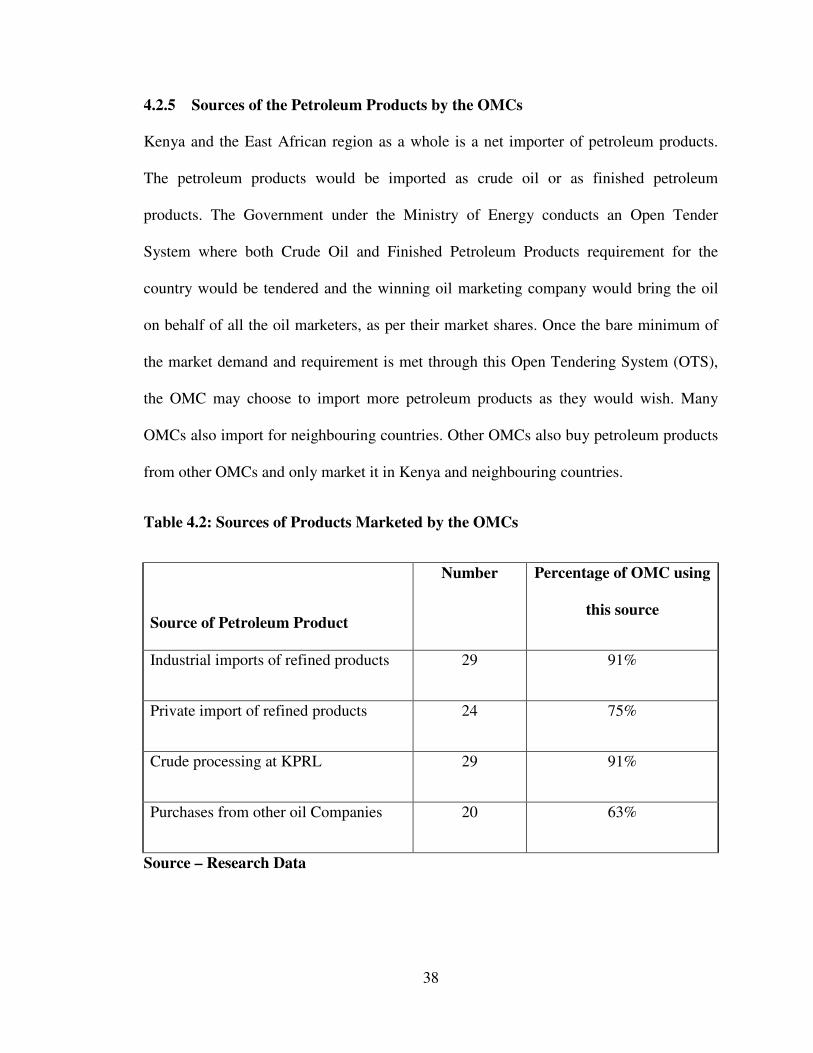
4.2.5 Sources of the Petroleum Products by the OMCs
Kenya and the East African region as a whole is a net importer of petroleum products.
The petroleum products would be imported as crude oil or as finished petroleum
products. The Government under the Ministry of Energy conducts an Open Tender
System where both Crude Oil and Finished Petroleum Products requirement for the
country would be tendered and the winning oil marketing company would bring the oil
on behalf of all the oil marketers, as per their market shares. Once the bare minimum of
the market demand and requirement is met through this Open Tendering System (OTS),
the OMC may choose to import more petroleum products as they would wish. Many
OMCs also import for neighbouring countries. Other OMCs also buy petroleum products
from other OMCs and only market it in Kenya and neighbouring countries.
Table 4.2: Sources of Products Marketed by the OMCs
Source of Petroleum Product
Number Percentage of OMC using
this source
Industrial imports of refined products 29 91%
Private import of refined products 24 75%
Crude processing at KPRL 29 91%
Purchases from other oil Companies 20 63%
Source – Research Data
39
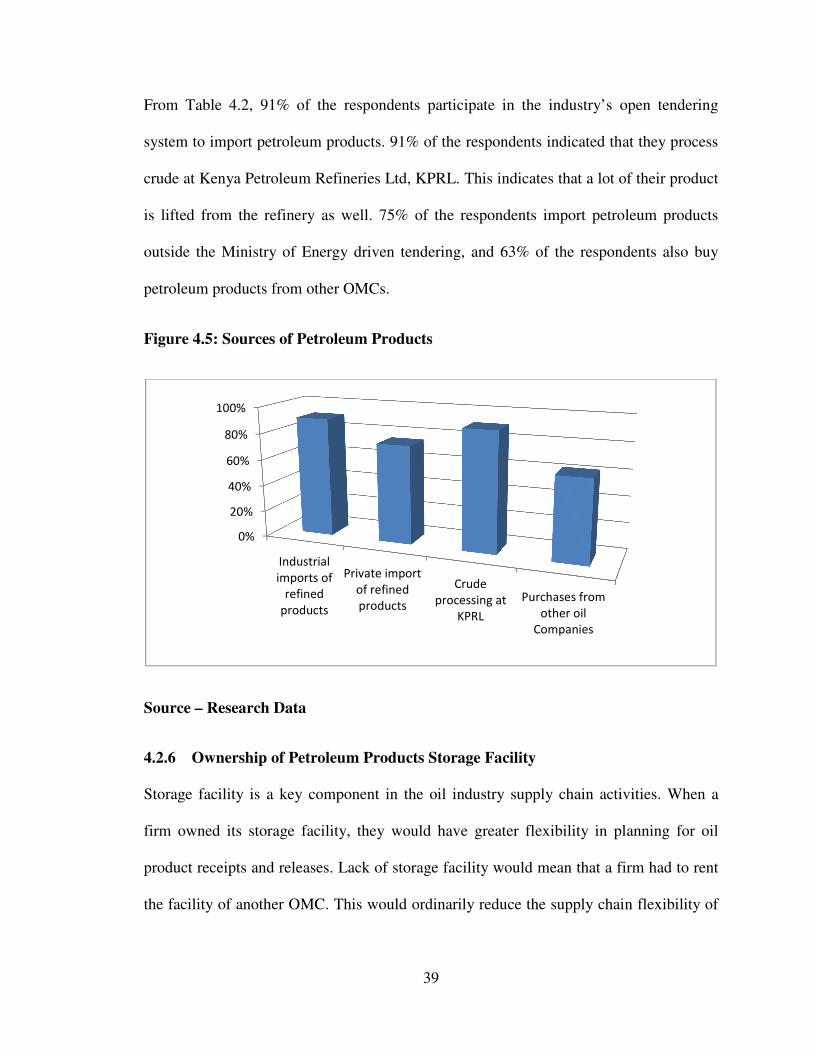
From Table 4.2, 91% of the respondents participate in the industry’s open tendering
system to import petroleum products. 91% of the respondents indicated that they process
crude at Kenya Petroleum Refineries Ltd, KPRL. This indicates that a lot of their product
is lifted from the refinery as well. 75% of the respondents import petroleum products
outside the Ministry of Energy driven tendering, and 63% of the respondents also buy
petroleum products from other OMCs.
Figure 4.5: Sources of Petroleum Products
Source – Research Data
4.2.6 Ownership of Petroleum Products Storage Facility
Storage facility is a key component in the oil industry supply chain activities. When a
firm owned its storage facility, they would have greater flexibility in planning for oil
product receipts and releases. Lack of storage facility would mean that a firm had to rent
the facility of another OMC. This would ordinarily reduce the supply chain flexibility of
��
���
���
��
���
����
����������
�! � ���� (
��(����
�� �����
)��&�����! � ��
(���(����
�� �����
*����
�� ������"���
+),�
)��� �����(� !
� ��� ��
* ! ������
40
the firm renting the facility, as the owner of the facility would determine whether and
when to receive or release another firm’s products.
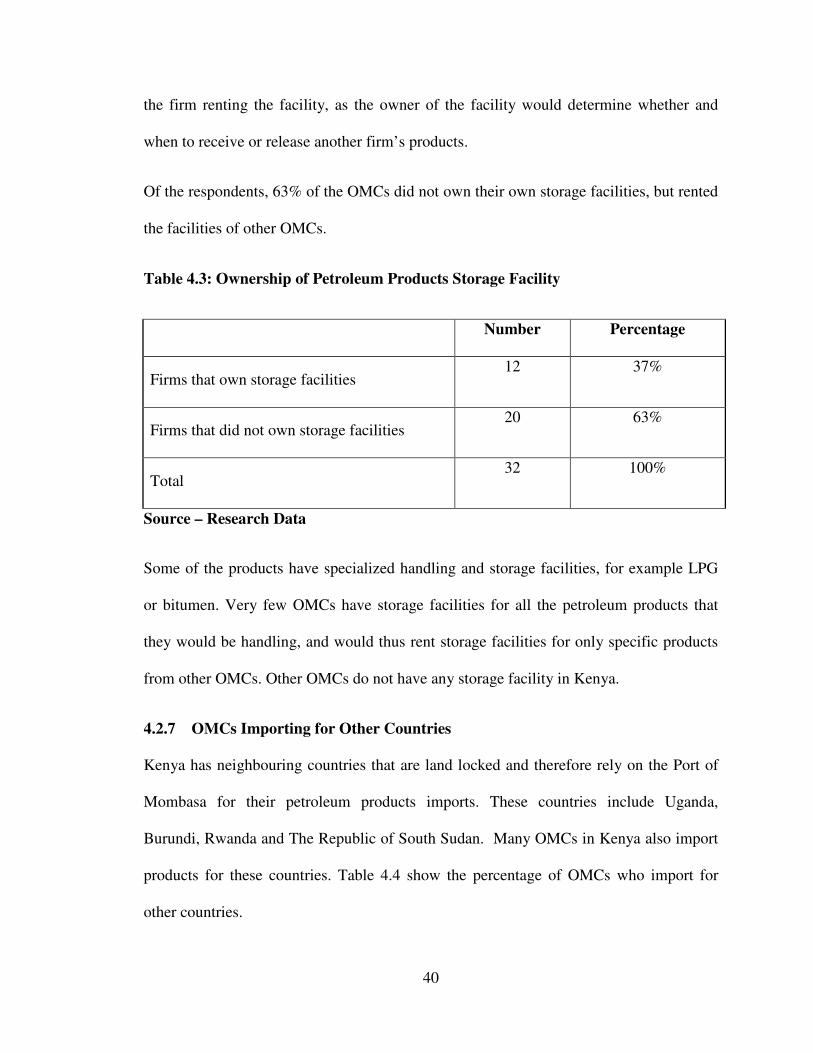
Of the respondents, 63% of the OMCs did not own their own storage facilities, but rented
the facilities of other OMCs.
Table 4.3: Ownership of Petroleum Products Storage Facility
Number Percentage
Firms that own storage facilities 12 37%
Firms that did not own storage facilities 20 63%
Total 32 100%
Source – Research Data
Some of the products have specialized handling and storage facilities, for example LPG
or bitumen. Very few OMCs have storage facilities for all the petroleum products that
they would be handling, and would thus rent storage facilities for only specific products
from other OMCs. Other OMCs do not have any storage facility in Kenya.
4.2.7 OMCs Importing for Other Countries
Kenya has neighbouring countries that are land locked and therefore rely on the Port of
Mombasa for their petroleum products imports. These countries include Uganda,
Burundi, Rwanda and The Republic of South Sudan. Many OMCs in Kenya also import
products for these countries. Table 4.4 show the percentage of OMCs who import for
other countries.
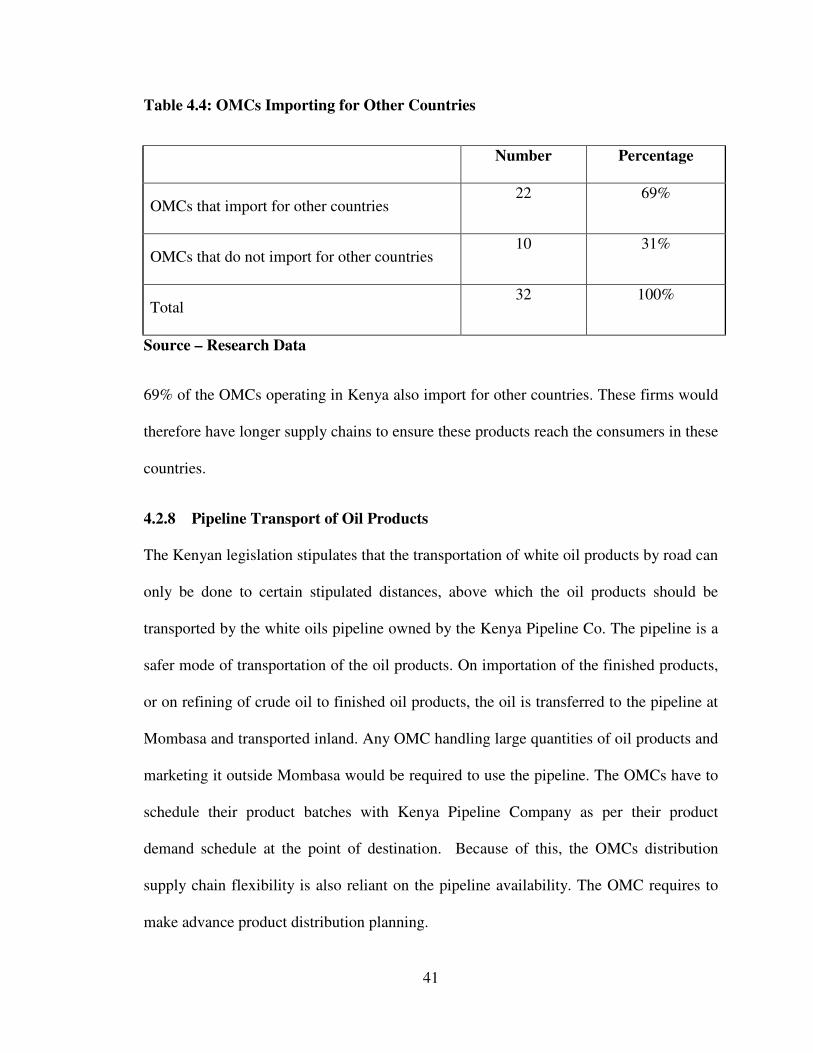
41
Table 4.4: OMCs Importing for Other Countries
Number Percentage
OMCs that import for other countries 22 69%
OMCs that do not import for other countries 10 31%
Total 32 100%
Source – Research Data
69% of the OMCs operating in Kenya also import for other countries. These firms would
therefore have longer supply chains to ensure these products reach the consumers in these
countries.
4.2.8 Pipeline Transport of Oil Products
The Kenyan legislation stipulates that the transportation of white oil products by road can
only be done to certain stipulated distances, above which the oil products should be
transported by the white oils pipeline owned by the Kenya Pipeline Co. The pipeline is a
safer mode of transportation of the oil products. On importation of the finished products,
or on refining of crude oil to finished oil products, the oil is transferred to the pipeline at
Mombasa and transported inland. Any OMC handling large quantities of oil products and
marketing it outside Mombasa would be required to use the pipeline. The OMCs have to
schedule their product batches with Kenya Pipeline Company as per their product
demand schedule at the point of destination. Because of this, the OMCs distribution
supply chain flexibility is also reliant on the pipeline availability. The OMC requires to
make advance product distribution planning.
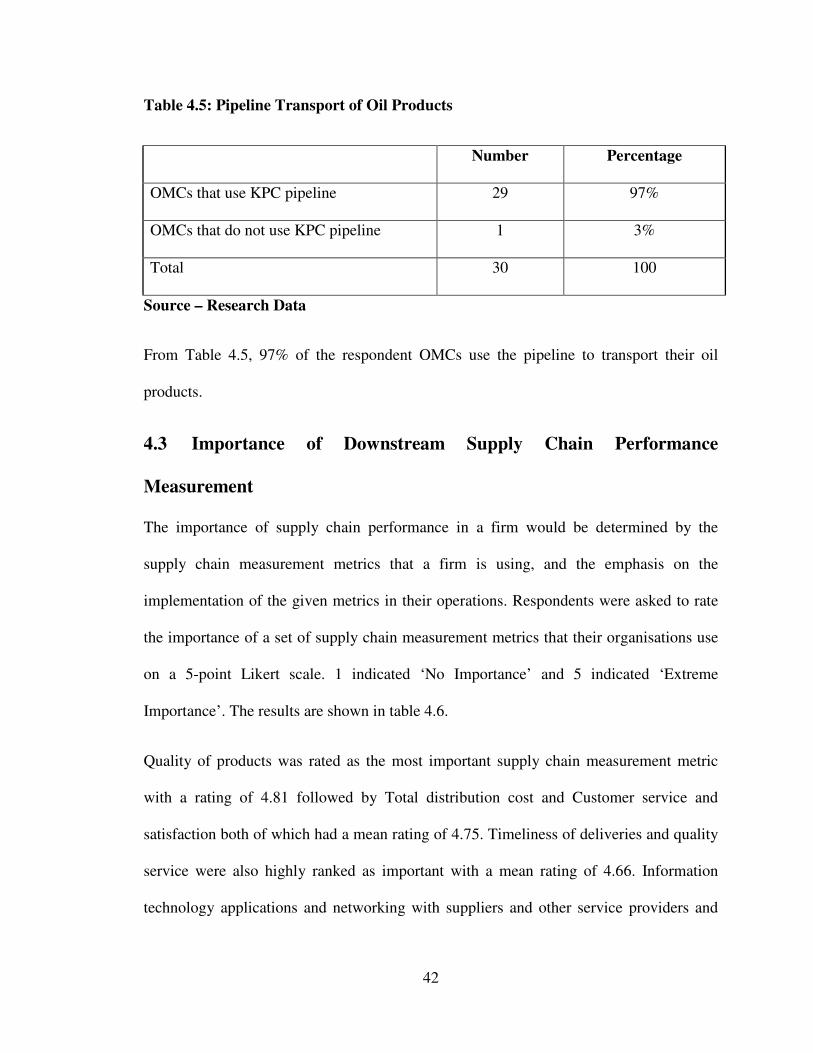
42
Table 4.5: Pipeline Transport of Oil Products
Number Percentage
OMCs that use KPC pipeline 29 97%
OMCs that do not use KPC pipeline 1 3%
Total 30 100
Source – Research Data
From Table 4.5, 97% of the respondent OMCs use the pipeline to transport their oil
products.
4.3 Importance of Downstream Supply Chain Performance
Measurement
The importance of supply chain performance in a firm would be determined by the
supply chain measurement metrics that a firm is using, and the emphasis on the
implementation of the given metrics in their operations. Respondents were asked to rate
the importance of a set of supply chain measurement metrics that their organisations use
on a 5-point Likert scale. 1 indicated ‘No Importance’ and 5 indicated ‘Extreme
Importance’. The results are shown in table 4.6.
Quality of products was rated as the most important supply chain measurement metric
with a rating of 4.81 followed by Total distribution cost and Customer service and
satisfaction both of which had a mean rating of 4.75. Timeliness of deliveries and quality
service were also highly ranked as important with a mean rating of 4.66. Information
technology applications and networking with suppliers and other service providers and
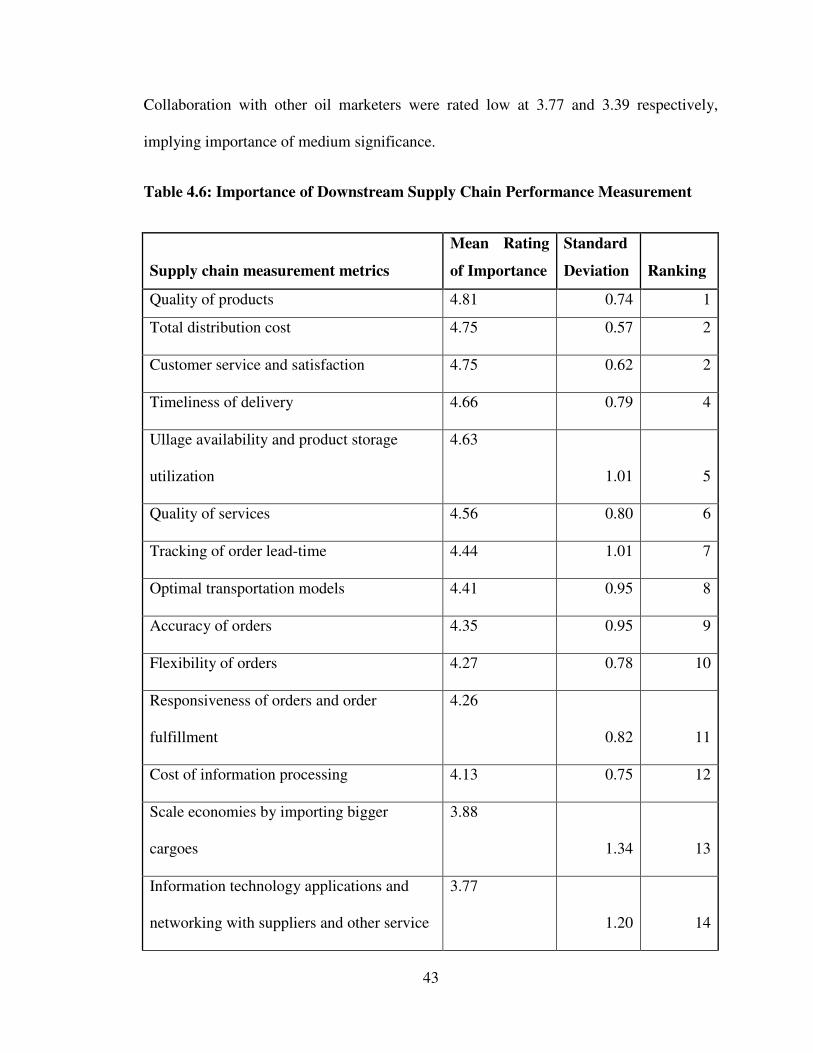
43
Collaboration with other oil marketers were rated low at 3.77 and 3.39 respectively,
implying importance of medium significance.
Table 4.6: Importance of Downstream Supply Chain Performance Measurement
Supply chain measurement metrics
Mean Rating
of Importance
Standard
Deviation Ranking
Quality of products 4.81 0.74 1
Total distribution cost 4.75 0.57 2
Customer service and satisfaction 4.75 0.62 2
Timeliness of delivery 4.66 0.79 4
Ullage availability and product storage
utilization
4.63
1.01 5
Quality of services 4.56 0.80 6
Tracking of order lead-time 4.44 1.01 7
Optimal transportation models 4.41 0.95 8
Accuracy of orders 4.35 0.95 9
Flexibility of orders 4.27 0.78 10
Responsiveness of orders and order
fulfillment
4.26
0.82 11
Cost of information processing 4.13 0.75 12
Scale economies by importing bigger
cargoes
3.88
1.34 13
Information technology applications and
networking with suppliers and other service
3.77
1.20 14
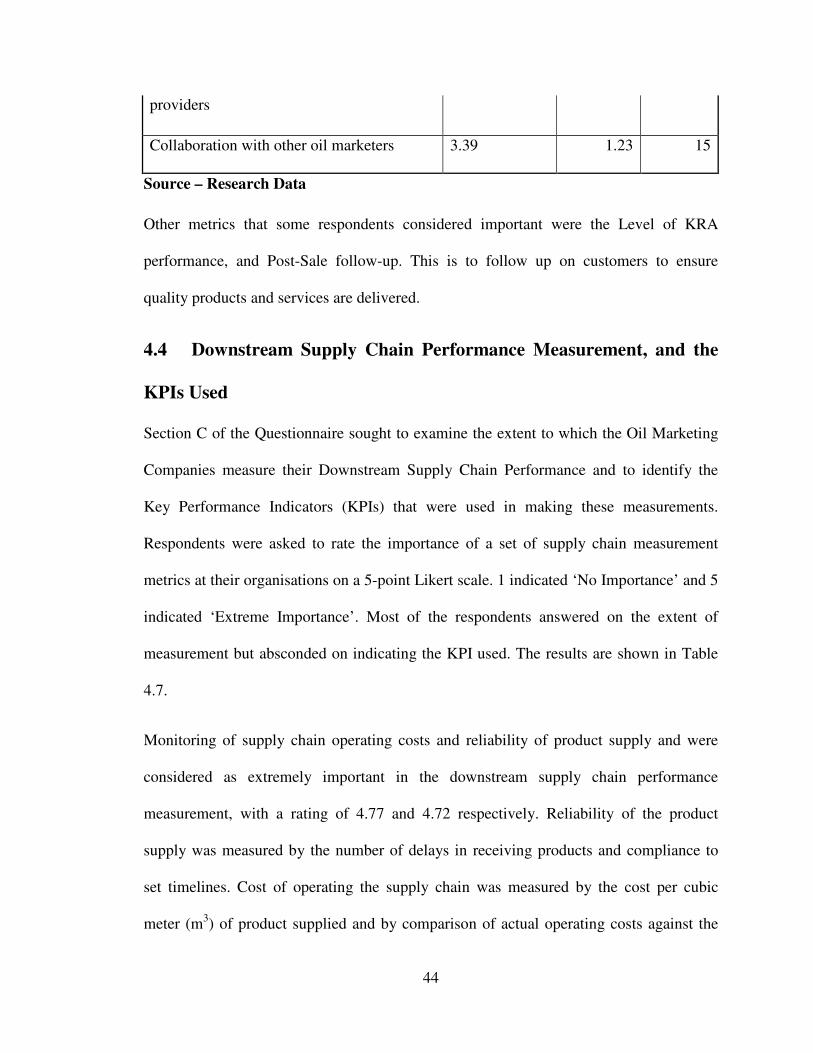
44
providers
Collaboration with other oil marketers 3.39 1.23 15
Source – Research Data
Other metrics that some respondents considered important were the Level of KRA
performance, and Post-Sale follow-up. This is to follow up on customers to ensure
quality products and services are delivered.
4.4 Downstream Supply Chain Performance Measurement, and the
KPIs Used
Section C of the Questionnaire sought to examine the extent to which the Oil Marketing
Companies measure their Downstream Supply Chain Performance and to identify the
Key Performance Indicators (KPIs) that were used in making these measurements.
Respondents were asked to rate the importance of a set of supply chain measurement
metrics at their organisations on a 5-point Likert scale. 1 indicated ‘No Importance’ and 5
indicated ‘Extreme Importance’. Most of the respondents answered on the extent of
measurement but absconded on indicating the KPI used. The results are shown in Table
4.7.
Monitoring of supply chain operating costs and reliability of product supply and were
considered as extremely important in the downstream supply chain performance
measurement, with a rating of 4.77 and 4.72 respectively. Reliability of the product
supply was measured by the number of delays in receiving products and compliance to
set timelines. Cost of operating the supply chain was measured by the cost per cubic
meter (m3) of product supplied and by comparison of actual operating costs against the
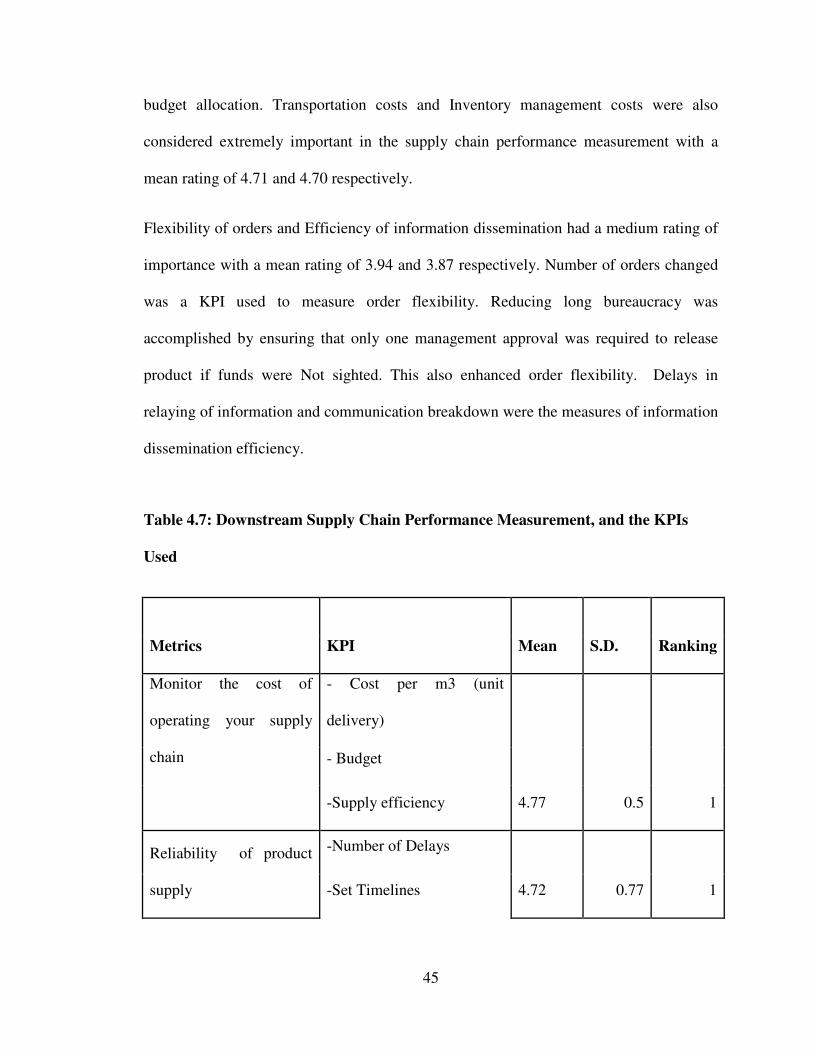
45
budget allocation. Transportation costs and Inventory management costs were also
considered extremely important in the supply chain performance measurement with a
mean rating of 4.71 and 4.70 respectively.
Flexibility of orders and Efficiency of information dissemination had a medium rating of
importance with a mean rating of 3.94 and 3.87 respectively. Number of orders changed
was a KPI used to measure order flexibility. Reducing long bureaucracy was
accomplished by ensuring that only one management approval was required to release
product if funds were Not sighted. This also enhanced order flexibility. Delays in
relaying of information and communication breakdown were the measures of information
dissemination efficiency.
Table 4.7: Downstream Supply Chain Performance Measurement, and the KPIs
Used
KPI Mean S.D. Ranking Metrics
Monitor the cost of
operating your supply
chain
- Cost per m3 (unit
delivery)
4.77 0.5 1
- Budget
-Supply efficiency
Reliability of product
supply
-Number of Delays
4.72 0.77 1 -Set Timelines
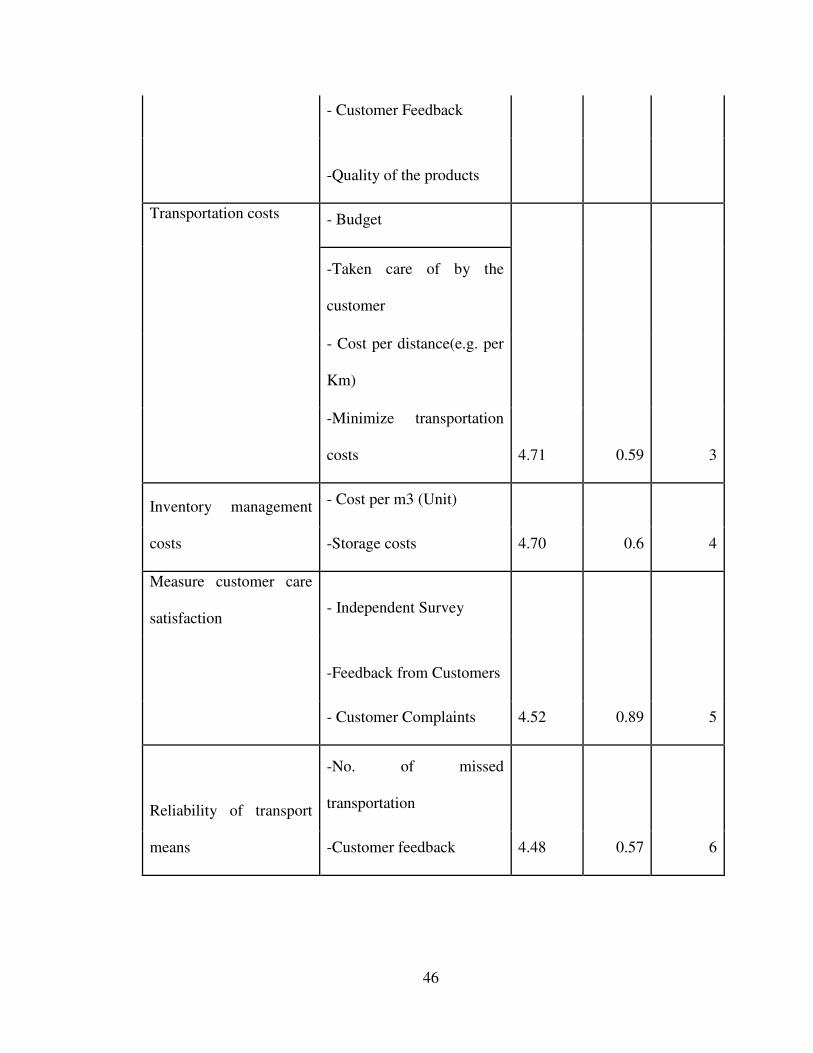
46
- Customer Feedback
-Quality of the products
Transportation costs - Budget
4.71 0.59 3
-Taken care of by the
customer
- Cost per distance(e.g. per
Km)
-Minimize transportation
costs
Inventory management
costs
- Cost per m3 (Unit)
4.70 0.6 4 -Storage costs
Measure customer care
satisfaction - Independent Survey
4.52 0.89 5
-Feedback from Customers
- Customer Complaints
Reliability of transport
means
-No. of missed
transportation
4.48 0.57 6 -Customer feedback
47
Timeliness of orders
delivery -Same day delivery unless
there are factors beyond us
4.47 0.9 7
- Delivery Time
-Customer feedback
Order processing - Time
4.25 0.95 8
- Within 20 minutes of
order confirmation.
-Turnaround time\
-Loading time
Flexibility in service
delivery
- Depends on payment for
the products.
4.22 0.83 9
-Getting more customers
-Efficiency in loading
Flexibility of your orders - One management
approval if funds are NOT
sighted
4.06 0.89 10 - No. of orders to be
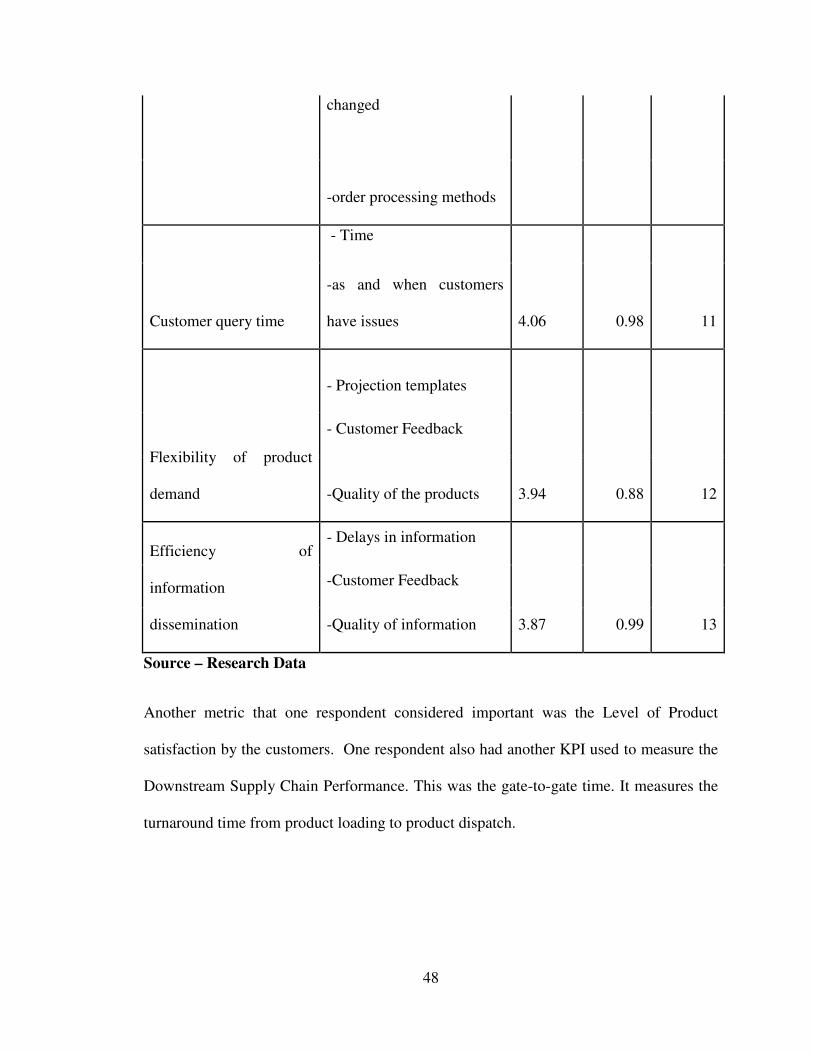
48
changed
-order processing methods
Customer query time
- Time
4.06 0.98 11
-as and when customers
have issues
Flexibility of product
demand
- Projection templates
3.94 0.88 12
- Customer Feedback
-Quality of the products
Efficiency of
information
dissemination
- Delays in information
3.87 0.99 13
-Customer Feedback
-Quality of information
Source – Research Data
Another metric that one respondent considered important was the Level of Product
satisfaction by the customers. One respondent also had another KPI used to measure the
Downstream Supply Chain Performance. This was the gate-to-gate time. It measures the
turnaround time from product loading to product dispatch.
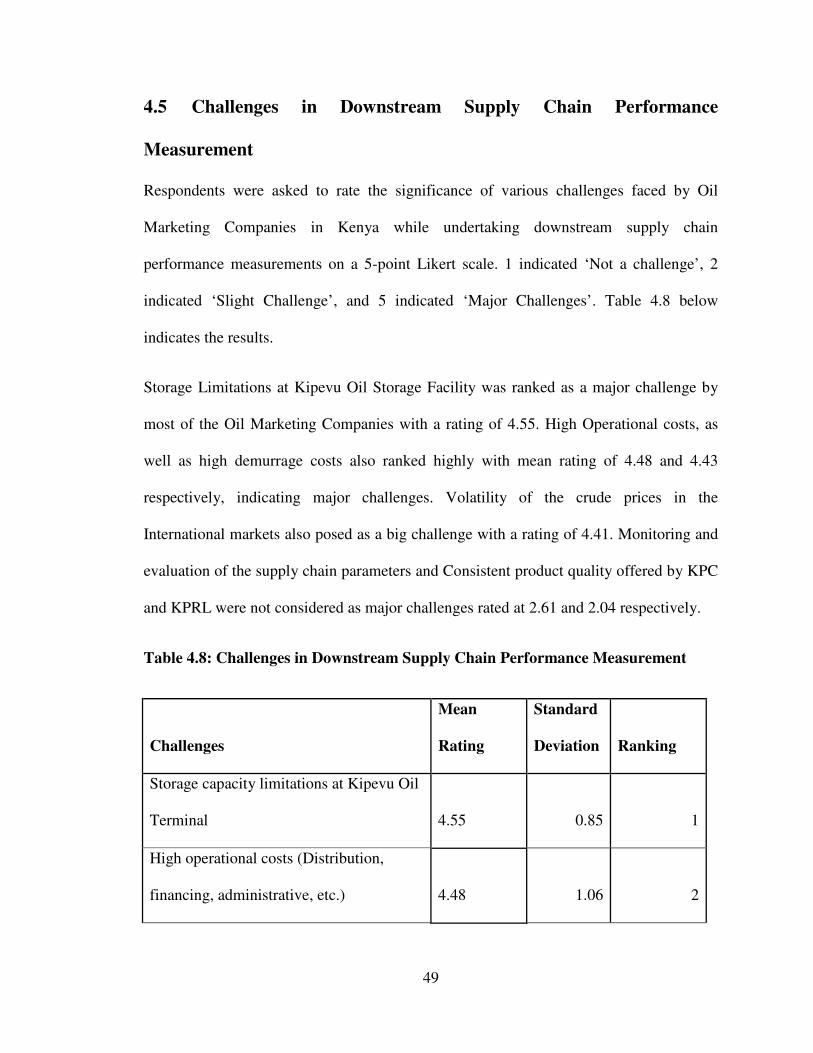
49
4.5 Challenges in Downstream Supply Chain Performance
Measurement
Respondents were asked to rate the significance of various challenges faced by Oil
Marketing Companies in Kenya while undertaking downstream supply chain
performance measurements on a 5-point Likert scale. 1 indicated ‘Not a challenge’, 2
indicated ‘Slight Challenge’, and 5 indicated ‘Major Challenges’. Table 4.8 below
indicates the results.
Storage Limitations at Kipevu Oil Storage Facility was ranked as a major challenge by
most of the Oil Marketing Companies with a rating of 4.55. High Operational costs, as
well as high demurrage costs also ranked highly with mean rating of 4.48 and 4.43
respectively, indicating major challenges. Volatility of the crude prices in the
International markets also posed as a big challenge with a rating of 4.41. Monitoring and
evaluation of the supply chain parameters and Consistent product quality offered by KPC
and KPRL were not considered as major challenges rated at 2.61 and 2.04 respectively.
Table 4.8: Challenges in Downstream Supply Chain Performance Measurement
Challenges
Mean
Rating
Standard
Deviation Ranking
Storage capacity limitations at Kipevu Oil
Terminal 4.55 0.85 1
High operational costs (Distribution,
financing, administrative, etc.) 4.48 1.06 2
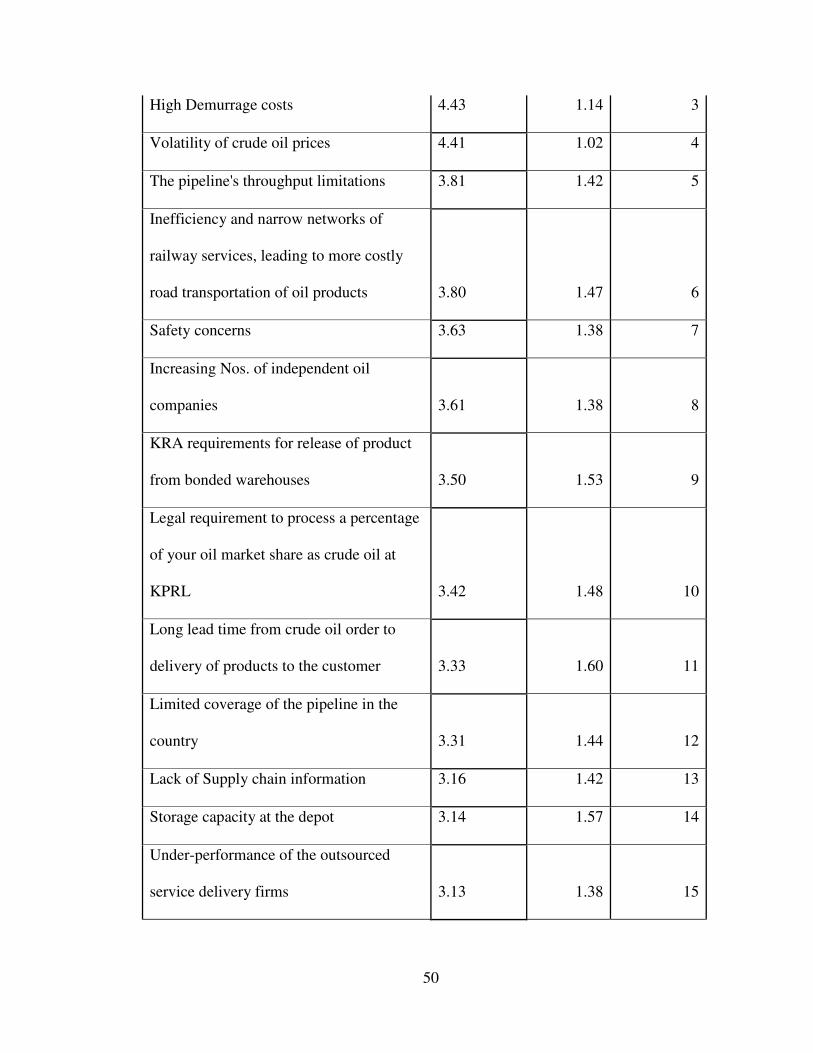
50
High Demurrage costs 4.43 1.14 3
Volatility of crude oil prices 4.41 1.02 4
The pipeline's throughput limitations 3.81 1.42 5
Inefficiency and narrow networks of
railway services, leading to more costly
road transportation of oil products 3.80 1.47 6
Safety concerns 3.63 1.38 7
Increasing Nos. of independent oil
companies 3.61 1.38 8
KRA requirements for release of product
from bonded warehouses 3.50 1.53 9
Legal requirement to process a percentage
of your oil market share as crude oil at
KPRL 3.42 1.48 10
Long lead time from crude oil order to
delivery of products to the customer 3.33 1.60 11
Limited coverage of the pipeline in the
country 3.31 1.44 12
Lack of Supply chain information 3.16 1.42 13
Storage capacity at the depot 3.14 1.57 14
Under-performance of the outsourced
service delivery firms 3.13 1.38 15
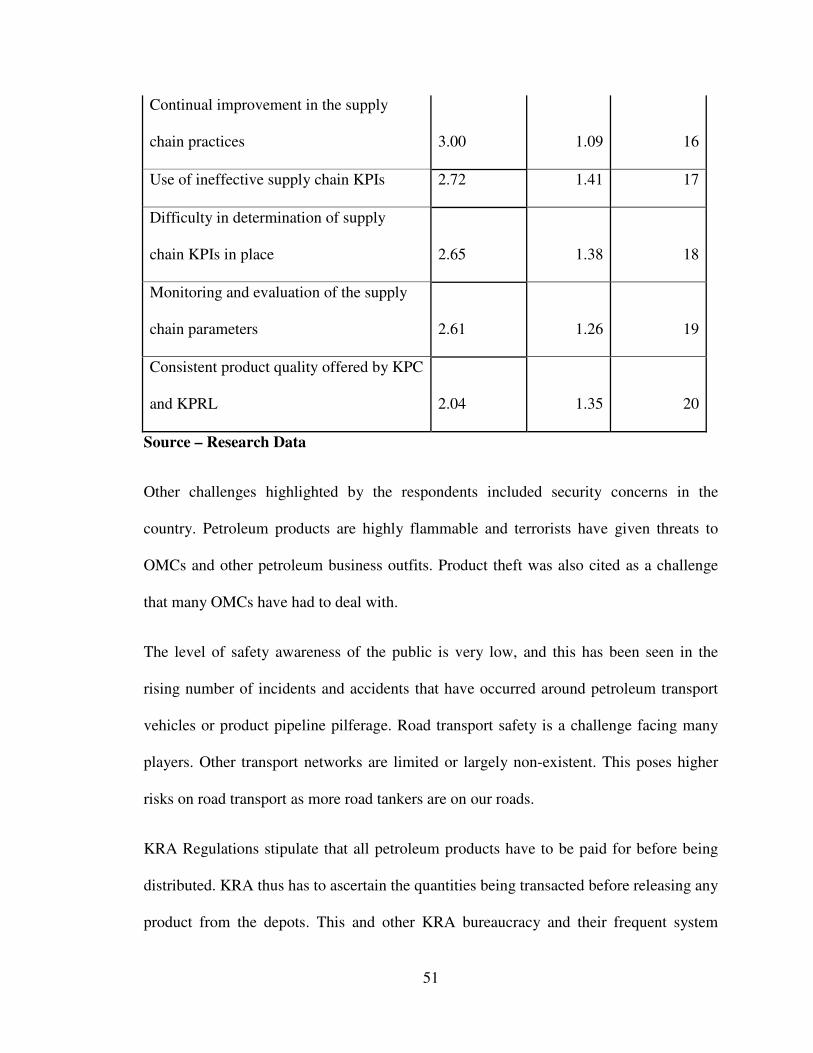
51
Continual improvement in the supply
chain practices 3.00 1.09 16
Use of ineffective supply chain KPIs 2.72 1.41 17
Difficulty in determination of supply
chain KPIs in place 2.65 1.38 18
Monitoring and evaluation of the supply
chain parameters 2.61 1.26 19
Consistent product quality offered by KPC
and KPRL 2.04 1.35 20
Source – Research Data
Other challenges highlighted by the respondents included security concerns in the
country. Petroleum products are highly flammable and terrorists have given threats to
OMCs and other petroleum business outfits. Product theft was also cited as a challenge
that many OMCs have had to deal with.
The level of safety awareness of the public is very low, and this has been seen in the
rising number of incidents and accidents that have occurred around petroleum transport
vehicles or product pipeline pilferage. Road transport safety is a challenge facing many
players. Other transport networks are limited or largely non-existent. This poses higher
risks on road transport as more road tankers are on our roads.
KRA Regulations stipulate that all petroleum products have to be paid for before being
distributed. KRA thus has to ascertain the quantities being transacted before releasing any
product from the depots. This and other KRA bureaucracy and their frequent system
52
downtime also pose as a challenge to many industry players. The Petroleum Industry is
highly capital intensive. Access to credit lines and to cheap products was also pointed out
as challenges faced by the industry players.
The Petroleum industry in Kenya is partly controlled by the Kenya Government bodies
like the Ministry of Energy (MoE), Kenya Revenue Authority (KRA) and Energy
Regulatory Commission (ERC). Many policy issues as well as other issues that relate to
the industry are raised with these government bodies by the OMCs. Such issues take long
to be addressed and the feedback normally takes too long.
In 2010, the ERC passed the Petroleum Pricing formula that caps the maximum
wholesale and retail prices of oil products in Kenya. With the increased number of
players in the industry, many respondents referred to shrinking profit margins as a
challenge. The Global Environmental and Emissions regulations stipulate more stringent
emission levels from petroleum products; all these are environmental concerns. This has
meant that the processing of these petroleum products has to be more complex, and
thereby more costly. This has also contributed to the shrinking profit margins as the price
of the products would not necessarily increase proportionately.
53
CHAPTER FIVE: SUMMARY, CONCLUSION AND
RECOMMENDATIONS
5.1 Introduction
This chapter presents the summary of the findings on the Downstream Supply Chain
Performance Measurement. The conclusions and recommendations are drawn thereto.
Limitations of the study and suggestions for further study are also outlined in the chapter.
5.2 Summary of Findings
The study had three objectives; to determine the extent to which OMCs measure their
downstream supply chain performance, to identify the KPIs used in the performance
measurements and to determine the challenges faced by Oil Marketing Companies in
Kenya while undertaking Downstream Supply Chain Performance Measurement. The
findings are summarized below;
The Petroleum Industry in Kenya is currently experiencing an increase in the number of
locally incorporated OMCs. Many of the firms are young, having operated for less than 5
years, and are the Independent Oil Marketing Companies. Many of the OMCs that have
operated for more than 10 years are still operating in the industry. Most of the OMCs use
the KPC pipeline facility to transport their products and most OMCs import oil products
for other neighbouring countries as well. The products that are marketed by most of the
OMCs are Diesel, Kerosene and Petrol. These products are the fast moving products in
the market, as they are used mostly in the transportation sector, and for domestic use.
Most of the OMCs import petroleum oil products through the Open Tender System, for
finished oil products and crude oil, driven by the Ministry of Energy.
54
The OMCs in Kenya realize the importance of measuring their downstream supply chain
performance and product quality, customer satisfaction and quick delivery of products to
consumers are considered highly by most OMCs to ensure efficient downstream supply
chain operations. Reliability of product supply and monitoring of downstream supply
chain operational costs was considered as extremely important in ensuring that the
downstream supply chain is optimized. Optimization of the supply chain would lead to
high levels of customer satisfaction and to higher profit margins. KPIs used to measure
the downstream supply chain included the setting of timelines and budgets, and
monitoring the cost per volume of product transacted against the budgeted costs.
Projection templates were used to measure and control supply chain operations and the
time to respond to customer queries was measured, with a view to reducing it.
The OMCs face various challenges while undertaking downstream supply chain
performance measurement. The petroleum oil industry in Kenya is governed by many
regulations and legislations. These include the KRA bureaucracies, the ERC regulations,
and the Ministry of Energy regulations. Oil products are jointly tendered by the OMCs.
The OMCs would therefore have little control on the cost of product. The retail and
wholesale price of petroleum products is capped by the ERC, and oil product
transportation is also regulated. This reduces the flexibility of the OMCs in deciding
some supply chain parameters. Storage capacity at the Kipevu Oil Storage Facility is
governed by an OMC’s market share. This was considered as a great challenge by most
OMCs as it limits the amount of product to trade and transport within the Kenyan market.
The storage capacity of petroleum products in Kenya is limited, and this reduces the
downstream supply chain flexibility of many OMCs as they have to share the existing
55
storage facilities. Other challenges included reduced profit margins and an increasing
number of independent oil marketers.
5.3 Conclusion
From the findings of the study, the following conclusions are drawn. The petroleum
industry in Kenya is very volatile and has many challenges ranging from petroleum
regulations, the industry is highly capital intensive, increasing competition from new
players in the market and decreasing profit margins. The OMCs therefore have to ensure
that their downstream supply chains performance is at its best to ensure optimized supply
chain operations. This could be achieved by measuring the downstream supply chain
performance using KPIs such as cost per volume of product, cost of transportation per
distance, time and cost of downstream supply chain information and communication,
number of customer complaints, and gate-to-gate time. These would ensure optimized
and reliable downstream supply chain activities.
The findings of this study indicate that firms would enjoy more efficient supply chain
performance by optimizing weak areas of the supply chain. These results relate to the
findings of Gwako (2008) who concluded that Kenya Airways measured its supply chain
using given industry metrics and they used these to improve their performance. Major
challenges included linking measures to customer care as well as mistrust between supply
chain participants. Many firms find it difficult to attribute performance results to any
particular entity.
This study focused on the Oil Marketing Companies in Kenya, which have peculiar
challenges that they face that may not be encountered by other industries in Kenya. For
56
this reason, many of the findings from this study may not mirror those of many other
studies as the industry downstream supply chain dynamics differ.
5.4 Recommendations
‘Anything measured improves’; ‘anything measured gets done’; ‘you cannot manage
what you do not measure’ (Lapide, 2000). Measurement of an organization’s
performance encourages systematic approach to solving apparent issues within a system
or an organisation. Based on the analysis of the study and from the findings and
conclusion, it is important that Oil Marketing Companies in Kenya consider the
following recommendations with regard to Downstream Supply Chain Performance
Measurement. Organisations should put more emphasis on the measurement of their
downstream supply chain performance through structured methods. This would ensure
that the performance of their supply chain is optimized to give the most value back to the
system. Oil marketing companies should make their organizational systems and supply
chain processes flexible to ensure that positive changes that may arise from performance
metrics can be adopted in the downstream supply chain operations. Cross-functional and
inter-firm conflicts should be minimized as these would prevent optimum downstream
supply chain operational performance.
The Petroleum industry has many factors that hamper the smooth operation of the
downstream supply chain that the OMCs may have no control over. The OMCs should
thus focus to measure and improve on downstream supply chain performance
measurement operations that they have control over, such as cost and inventory
management.
57
5.5 Limitations of the study
The study focused on the oil marketing companies in Kenya. The petroleum industry in
Kenya has other stakeholders who play an important role in the downstream supply
chain. These include the Kenya Petroleum Refineries Ltd. (KPRL), Kenya Pipeline
Company (KPC), Kenya Revenue Authority (KRA), the Ministry of Energy (MoE), the
Energy Regulatory Commission (ERC) and the Kenya Ports Authority (KPA). The
inclusion of these stakeholders to the study data would give a more elaborate analysis of
the whole industry.
It was difficult to reach many of respondents who were always busy at work. The
response rate was thus slow. Many of respondents did not complete all the sections of the
questionnaire and others did not fill-in the questionnaire.
5.6 Suggestions for Further Study
This study focused on measurement of the Downstream Supply Chain Performance in the
Oil Marketing Companies in Kenya. The Petroleum Industry in Kenya has many
stakeholders who influence the supply chain. These include the KPA, KRA, KPC, MoE,
KPRL and ERC. Further studies could thus examine the upstream and downstream
Supply Chain Performance Measurement in the Kenyan Petroleum Industry and how the
Government bodies affect the Performance of the Supply Chain.
The study also recommends that further studies be carried out on the effect of the
LAPSET (Lamu Port-Southern Sudan-Ethiopia Transport) Project on the Supply Chain of
petroleum products. Further studies could examine the future of the petroleum business in
58
Kenya and in the region in the long term after the discovery of crude oil in Uganda and
Kenya and the discovery of natural gas in Tanzania.
59
REFERENCES
Amolo, T. O. (2002). Benchmarking the Order Delivery Process for Continuous
Improvement: A case study of Kenya Oil Industry (Unpublished Master of
Business Administration Research Project). University of Nairobi, Kenya.
Ayugi, P. O. (2007). A Study on the Effectiveness and Efficiency of the Supply Chain
Model in Wrigley East Africa (Unpublished Master of Business Administration
Research Project). University of Nairobi, Kenya.
Burcher, P. G., Lee, G. L., and Sohal, A, S. (2006), “Production and Operations
Managers and Logistics Managers: A Cross-country comparison”, Journal of
Manufacturing Technology Management, Vol. 18 No. 5, pp.549-560.
Cai, J., Liu, X., Xiao, Z. & Liu, J. (2008). Improving Supply Chain Performance
Management: A Systematic Approach to Analyzing Iterative KPI
Accomplishment. Decision Support Systems, Vol. 46 pp 512-521
Chan, F. T. S. & Qi, H. J. (2003a). An innovative Performance Measurement for
Supply Chain Management. Supply Chain Management: An International
Journal, Vol. 8 No. 3, pp.209-223.
Chan, F. T. S. & Qi, H. J. (2003b). Feasibility of Performance Measurement System
for Supply Chain: A Process-Based Approach and Measures. Integrated
Manufacturing Systems, Vol. 14 No. 3, pp.179-190.
Chen, J. I. & Paulraj, A. (2004). Towards a Theory of Supply Chain Management:
The Constructs and Measurements. Journal of Operations Management, Vol. 22
pp. 119 – 150
Chopra, S. & Meindl, P. (2004). Supply Chain Management: Strategy, Planning and
Execution. Upper Saddle River, NJ: Pearson Education.
Christopher, M. (1998). Logistics and Supply Chain Management, London: Pitman.
60
Christopher, M. & Towill, D. (2001). An Integrated Model for the Design of Agile
Supply Chains. International Journal of Physical Distribution and Logistics
Management, Vol. 31
Cirtita, H. & Glaser-Segura, D. A. (2012). Measuring Downstream Supply Chain
Performance. Journal of Manufacturing Technology Management, Vol. 23 No. 3
pp. 299 – 314.
Cooper, M. C., Douglas M. L., and Janus D. P. (1997). Supply Chain Management:
More Than a New Name for Logistics. The International Journal of Logistics
Management, Vol. 8, No. 1, pp. 1-14.
Cox, A. (1999). Power, value and Supply Chain Management. Supply Chain
Management: an International Journal, Vol.4 No. 4, pp. 167-175.
Dempster M. A. H., Pedrón N. H., Medova E. A., and Scott J. E. (2000). Planning
Logistics Operations in the Oil Industry. The Journal of the Operational Research
Society, Vol. 51, No. 11, pp.1271-1288
Gatarwa, H.N. (2007). The Benefits of Upstream and Downstream Integration of
Supply Chain. A case of EABL (Unpublished Master of Business Administration
Research Project). University of Nairobi, Kenya.
Giunipero, L. C. & Brand, R. R. (1996). Purchasing’s Role in Supply Chain
Management. The International Journal of Logistics Management, Vol. 7 No. 1,
pp. 29-37
Gunasekaran, A., Patel, C. & Tirtiroglu, E. (2001). Performance Measures and
Metrics in a Supply Chain Environment. International Journal of Operations and
Production Management, Vol. 21, pp. 71 - 87.
Gunasekaran, A., Patel, C. & McGaughey, R. E. (2004). A Framework for Supply
Chain Performance Measurement. International Journal of Production
Economics, Vol. 87, pp 333-347.
61
Gwako, Z. (2008). Supply Chain Performance Measurement in the Aviation Industry:
A Case Study of Kenya Airways Ltd. (Unpublished Master of Business
Administration Research Project). University of Nairobi, Kenya.
Handfield, R. B., Monczka, R. M., Giunipero, L. C. & Patterson, J. L. (2009).
Sourcing and Supply Chain Management, Canada: Cengage Learning Academic
Resource Centre.
Harland, C. M. (1996). Supply Chain Management: Relationships, Chains and
Networks. British Journal of Management, Vol. 7 Iss.: S1 pp. 63 - 80
Harrison, A. & New, C. (2002). The Role of Coherent Supply Chain Strategy and
Performance Management in Achieving Competitive Advantage: An International
Survey. Journal of the Operations Research Society, Vol. 53 pp. 263 - 271.
Hausman, W.H. (2002). Supply Chain Performance Metrics. Management and
Engineering Dept., Stanford University. Retrieved from
http://www.gsb.stanford.edu/scforum
Holmberg, S. (2000). A Systems Perspective on Supply Chain Measurements.
International Journal of Physical Distribution and Logistics Management, Vol.
30 No. 10 pp. 847 – 868
Hugos, M. H. (2011). Essentials of Supply Chain Management. Hoboken. New
Jersey: John Wiley & Sons Inc.
Ip, W. H., Chan, S. L. & Lam, C. Y. (2011). Modeling supply chain performance and
Stability. Industrial Management and Data systems, Vol.111No. 8 pp1332 – 1354
Jie, F., Parton, K., & Cox, R. (2007). Supply Chain Practice, Supply Chain
Performance Indicators and Competitive Advantage of Australian Beef
Enterprises: A Conceptual Framework. Paper presented at the Australian
Agricultural and Resource Economics Society (AARES 51st Annual Conference).
Jonsson, P. (2008). Logistics and Supply Chain Management. U.K: McGraw-Hill
Education.
62
KPRL, (2012). The KPRL Entitlement Statement for May 2012.
Lambert, D. M., Cooper, M. C. & Pagh, J.D. (1998). Supply Chain Management
Implementation Issues and Research Opportunities. The International Journal of
Logistics Management, Vol. 9 No.2 pp. 1-19.
Lapide, L. (2000). What About Measuring Supply Chain Performance (White paper).
San Francisco, CA; Montgomery Research, Vol. 2. Issue 15, pp287 – 297
Lee, H. L. & Billington, C. (1992). Managing Supply Chain Inventory: Pitfalls and
Opportunities. Sloan Management Review, Vol. 33 No. 3 pp65-73
Lysons, K. and Farrington, B. (2006). Purchasing and Supply Chain Management.
Edinburgh Gate, Harlow Essex England: Pearson Education Ltd.
Monczka, R., Trent, R. and Handfield, R.(1998). Purchasing and Supply Chain
Management. Cincinnati, OH: South-Western College Publishing.
Mwanyota, J. L. (2004). Integrating Supply Chain Management and ERP systems: A
survey of Supermarkets in Nairobi (Unpublished Master of Business
Administration Research Project). University of Nairobi, Kenya.
Myers, M. B., Griffith, D. A., Daugherty, P. J., & Lusch, R. F. (2004). Maximizing
the Human Capital Equation in Logistics: Education, Experience and Skills.
Journal of Business Logistics, Vol. 25 No.1, pp. 211-32.
Mukhwana, V. M. (2010). The Impact of Supply Chain Management Practices on
Performance: The Case of Safaricom Limited (Unpublished Master of Business
Administration Research Project). University of Nairobi, Kenya.
Neely, A., Gregory, M. & Platts, K. (1995). Performance Measurement System
Design: A Literature Review and Research Agenda. International Journal of
Operations and Production Management, Vol. 15 No. 4, pp.80 – 116.
Ross, D. F. (1998). Competing Through Supply Chain Management. New York, NY:
Chapman & Hall.
63
Saad, M. & Patel, B. (2006). An Investigation of Supply Chain Performance
Measurement in the Indian Automotive Sector. Benchmarking: An International
Journal, Vol. 13 Iss: 1 pp. 36 – 53
Schorr, J.E. (1998). Purchasing in the 21st Century. New York, NY: Wiley.
Stevens, G. C. (1989). Integrating the Supply Chains. International Journal of
Physical Distribution and Materials Management, Vol. 8, No. 8, pp. 3-8.
Stevenson, W. J. (2002). Operations Management. New York: McGraw-Hill/Irwin
Companies Inc.
Su C.T. (1999). Dynamic Vehicle Control and Scheduling of Multi Depot Physical
distribution System. A research Paper, Integrated Manufacturing Systems, Vol.
10, No.1, pp 56 – 65
The Kenya Central Bureau of Statistics, (2007). The Economic Survey 2007. Kenya
Government Printer, Nairobi.
The Kenya Central Bureau of Statistics, (2011). The Economic Survey 2011. Kenya
Government Printer, Nairobi.
64
APPENDICES
APPENDIX 1: QUESTIONNAIRE
Declaration
This research aims to examine the extent to which OMCs measure their downstream
supply chain performance, and to identify the key KPIs used. It also aims to examine the
challenges faced by the OMCs while undertaking downstream supply chain performance
measurement.
The information received from this survey shall be kept confidential, and shall be used
strictly for academic purposes only. Your participation in this survey shall be highly
appreciated.
SECTION A
Name of organisation ___________________________________________________
Position held __________________________________________________________
Department / Function __________________________________________________
Please tick (�) as may be applicable to your firm
Q1. a) Is your organisation locally incorporated or a multinational subsidiary
Locally Incorporated [ ] Multinational Subsidiary [ ] Other [ ] please specify
b) What size classification does your organisation fall into?
Small [ ] Medium [ ] Large [ ]
65
Q2. How long has your organization been in the petroleum import and distribution
business?
i. More than 10 years [ ]
ii. Between 6 and 10 years [ ]
iii. Five years or less [ ]
Q3. What products among the ones listed does your organization distribute?
i. Aviation Jet A-1 [ ]
ii. Illuminating Kerosene [ ]
iii. Regular Motor Spirit [ ]
iv. Premium Motor Spirit [ ]
v. Liquefied Petroleum Gas [ ]
vi. Automotive Gas Oil [ ]
vii. Industrial Diesel [ ]
viii. Furnace Oils [ ]
ix. Bitumen [ ]
Q4. Does your organisation own storage facilities in Kenya?
Yes [ ] No [ ]
Q5. What are the sources of your products listed above?
i. Industrial imports of refined products [ ]
ii. Private import of refined products [ ]
iii. Crude processing at KPRL [ ]
66
iv. Purchases from other oil Companies [ ]
v. Other (specify) ______________________________
Q6. Does your organisation import products for neighbouring companies?
Yes [ ] No [ ]
Q7. Is your company utilizing the Transport and Storage facilities at Kenya Pipeline
Company?
Yes [ ] No [ ]
SECTION B
Q8. Please indicate by ticking (� ) on the given table, the level of importance you
accord the following supply chain measurement metrics in your organisation by
ticking where applicable using the scale below;
Not Important (1) Slightly important (2) Important (3) Very
important (4) Extremely Important (5)
Supply chain measurement metrics
Rating of Importance
1 2 3 4 5
i Tracking of order lead-time
ii Scale economies by importing bigger cargoes
iii Collaboration with other oil marketers
iv Flexibility of orders
v Accuracy of orders
vi Responsiveness of orders and order fulfillment
67
vii Information technology applications and
networking with suppliers and other service
providers
viii Ullage availability and product storage
utilization
ix Optimal transportation models
x Quality of services
xi Quality of products
xii Timeliness of delivery
xiii Cost of information processing
xiv Total distribution cost
xv Customer service and satisfaction
Other Metrics used? Please specify
________________________________________________________________
SECTION C
Q9. Indicate on the table below by ticking (�) the option that best suits your
organization on the extent to which your organisation measures the following
supply chain metrics and indicate the KPI used using the scale below.
Not Important (1) Slightly important (2) Important (3) Very
important (4) Extremely Important (5)
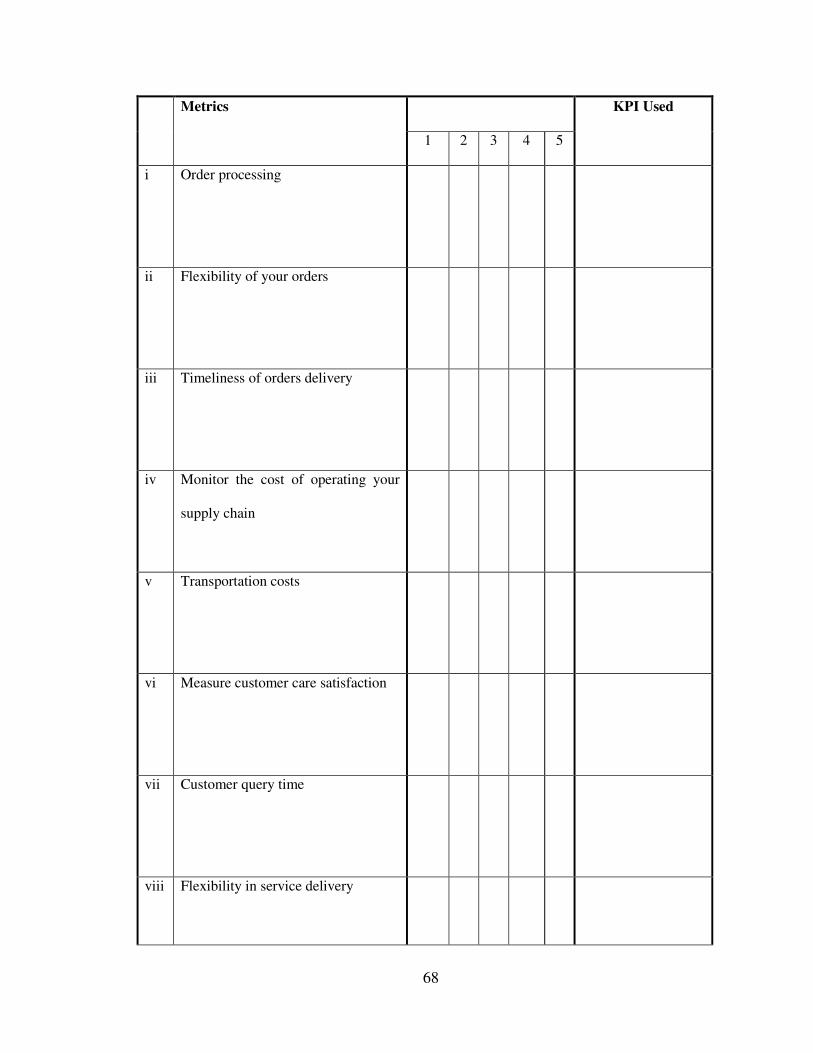
68
Metrics KPI Used
1 2 3 4 5
i Order processing
ii Flexibility of your orders
iii Timeliness of orders delivery
iv Monitor the cost of operating your
supply chain
v Transportation costs
vi Measure customer care satisfaction
vii Customer query time
viii Flexibility in service delivery
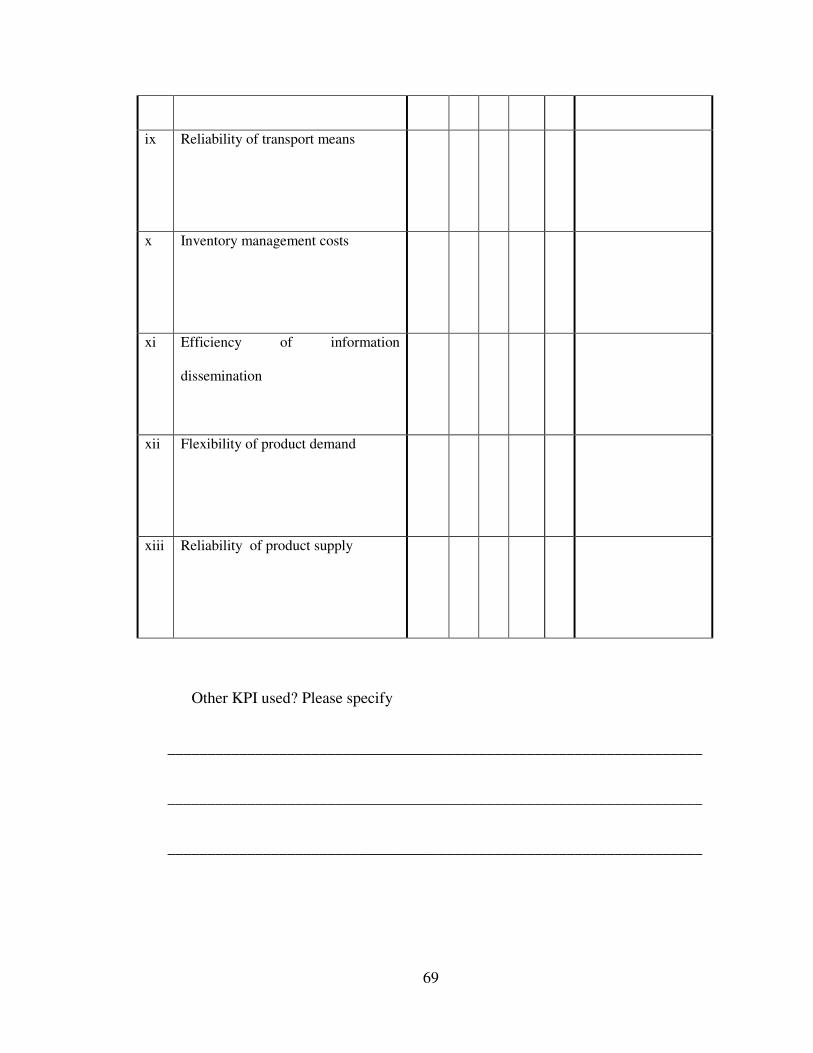
69
ix Reliability of transport means
x Inventory management costs
xi Efficiency of information
dissemination
xii Flexibility of product demand
xiii Reliability of product supply
Other KPI used? Please specify
___________________________________________________________________
___________________________________________________________________
___________________________________________________________________
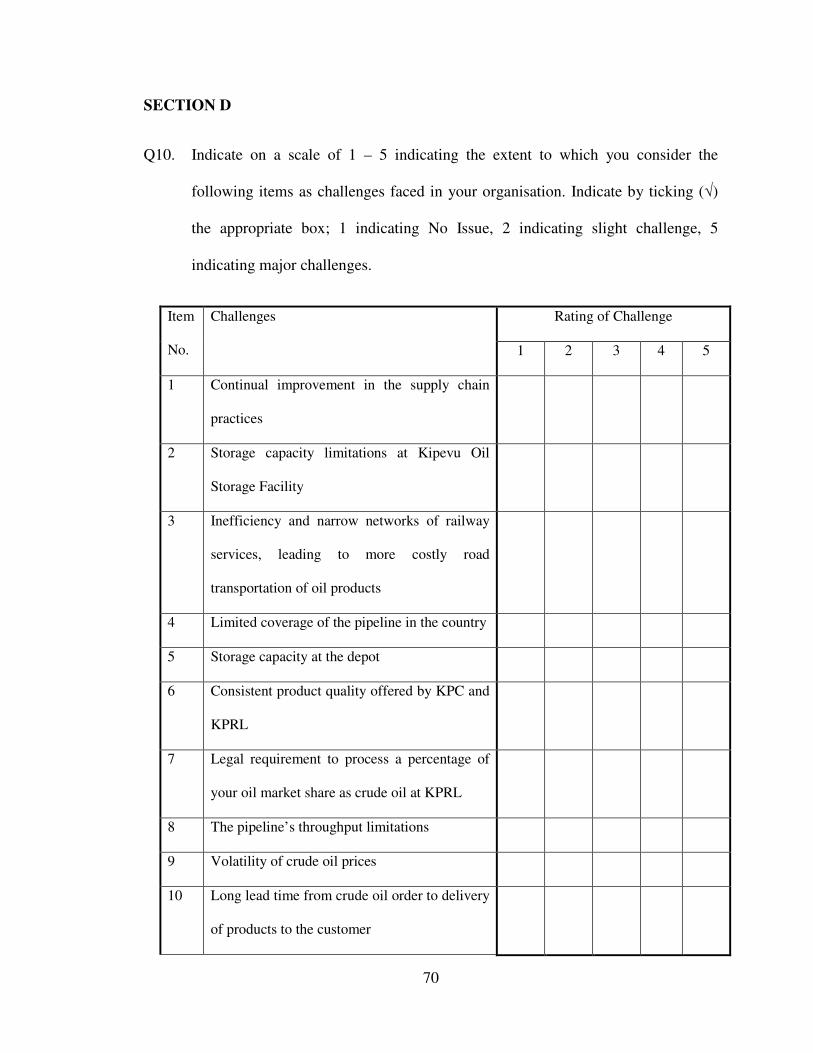
70
SECTION D
Q10. Indicate on a scale of 1 – 5 indicating the extent to which you consider the
following items as challenges faced in your organisation. Indicate by ticking (�)
the appropriate box; 1 indicating No Issue, 2 indicating slight challenge, 5
indicating major challenges.
Item
No.
Challenges Rating of Challenge
1 2 3 4 5
1 Continual improvement in the supply chain
practices
2 Storage capacity limitations at Kipevu Oil
Storage Facility
3 Inefficiency and narrow networks of railway
services, leading to more costly road
transportation of oil products
4 Limited coverage of the pipeline in the country
5 Storage capacity at the depot
6 Consistent product quality offered by KPC and
KPRL
7 Legal requirement to process a percentage of
your oil market share as crude oil at KPRL
8 The pipeline’s throughput limitations
9 Volatility of crude oil prices
10 Long lead time from crude oil order to delivery
of products to the customer
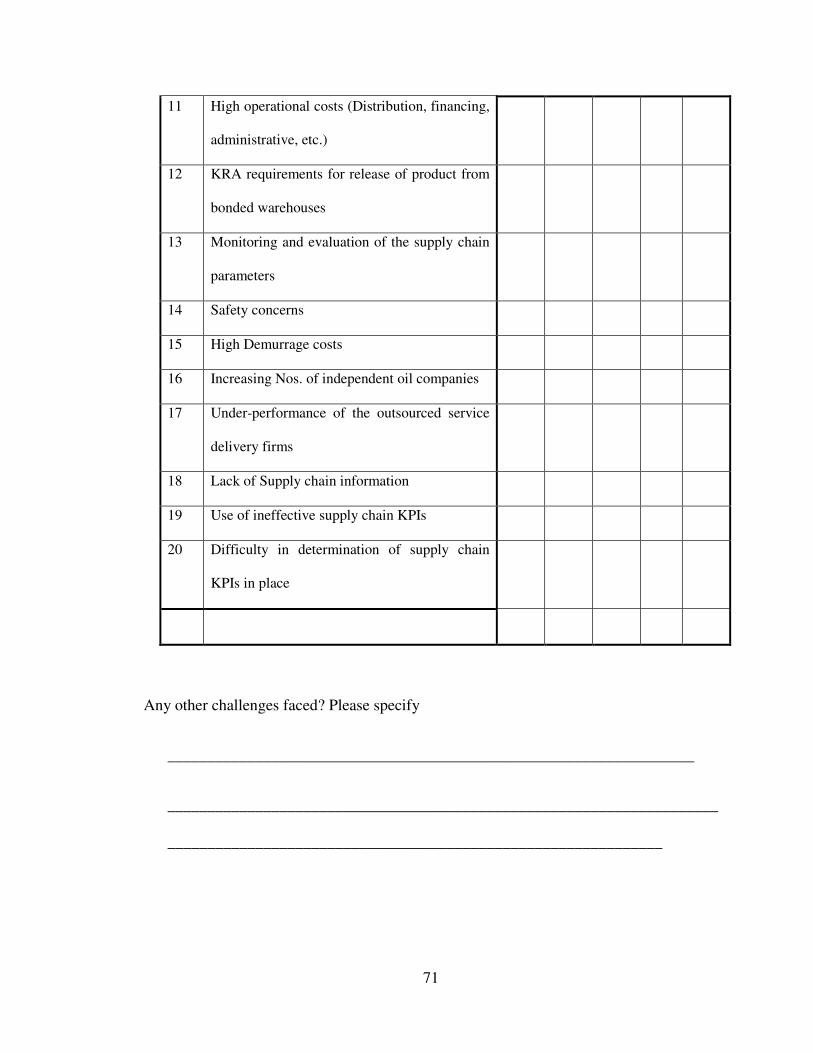
71
11 High operational costs (Distribution, financing,
administrative, etc.)
12 KRA requirements for release of product from
bonded warehouses
13 Monitoring and evaluation of the supply chain
parameters
14 Safety concerns
15 High Demurrage costs
16 Increasing Nos. of independent oil companies
17 Under-performance of the outsourced service
delivery firms
18 Lack of Supply chain information
19 Use of ineffective supply chain KPIs
20 Difficulty in determination of supply chain
KPIs in place
Any other challenges faced? Please specify
__________________________________________________________________
_____________________________________________________________________
______________________________________________________________
72
Please give any other information not captured in this questionnaire or comments that
you consider useful for this study.
_______________________________________________________________________
________________________________________________________________________
________________________________________________________________________
________________________________________________________________________
________________________________________________________________________
________________________________________________________________________
Thank you for taking time to answer this Questionnaire.
73
APPENDIX 2: INTRODUCTION LETTER
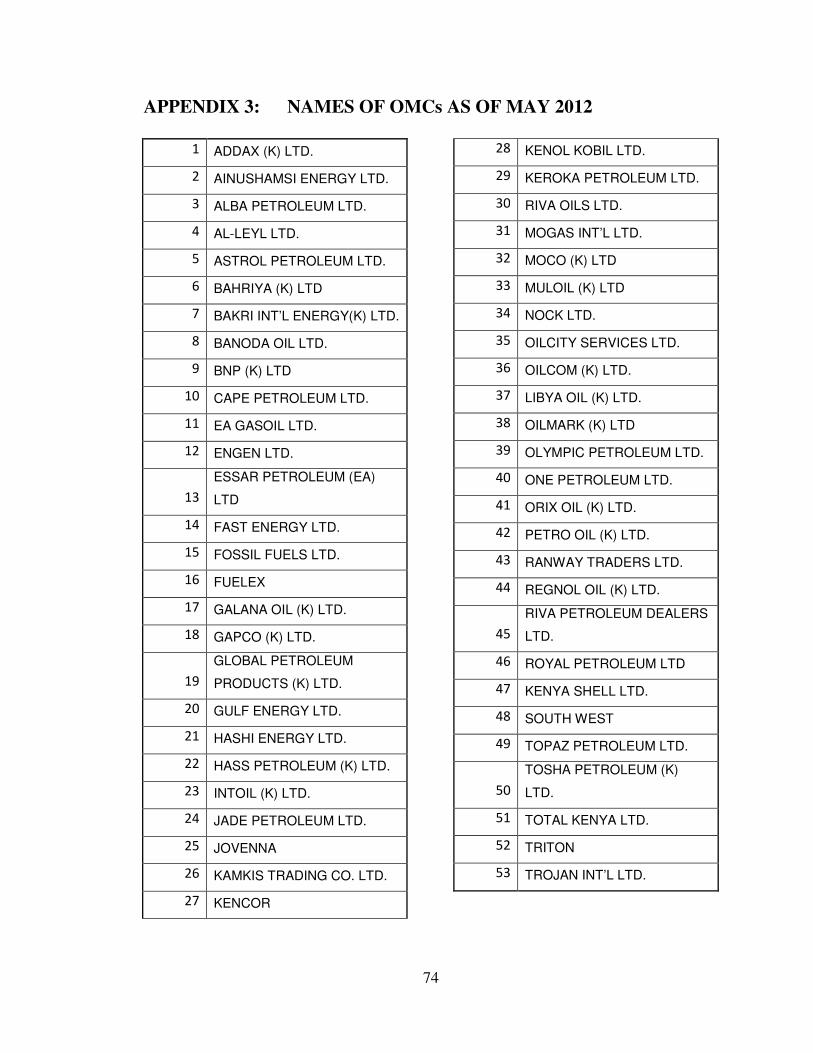
74
APPENDIX 3: NAMES OF OMCs AS OF MAY 2012
�� ADDAX (K) LTD.
�� AINUSHAMSI ENERGY LTD.
�� ALBA PETROLEUM LTD.
�� AL-LEYL LTD.
�� ASTROL PETROLEUM LTD.
� BAHRIYA (K) LTD
� BAKRI INT’L ENERGY(K) LTD.
�� BANODA OIL LTD.
'� BNP (K) LTD
��� CAPE PETROLEUM LTD.
��� EA GASOIL LTD.
��� ENGEN LTD.
���
ESSAR PETROLEUM (EA)
LTD
��� FAST ENERGY LTD.
��� FOSSIL FUELS LTD.
�� FUELEX
�� GALANA OIL (K) LTD.
��� GAPCO (K) LTD.
�'�
GLOBAL PETROLEUM
PRODUCTS (K) LTD.
��� GULF ENERGY LTD.
��� HASHI ENERGY LTD.
��� HASS PETROLEUM (K) LTD.
��� INTOIL (K) LTD.
��� JADE PETROLEUM LTD.
��� JOVENNA
�� KAMKIS TRADING CO. LTD.
�� KENCOR
��� KENOL KOBIL LTD.
�'� KEROKA PETROLEUM LTD.
��� RIVA OILS LTD.
��� MOGAS INT’L LTD.
��� MOCO (K) LTD
��� MULOIL (K) LTD
��� NOCK LTD.
��� OILCITY SERVICES LTD.
�� OILCOM (K) LTD.
�� LIBYA OIL (K) LTD.
��� OILMARK (K) LTD
�'� OLYMPIC PETROLEUM LTD.
��� ONE PETROLEUM LTD.
��� ORIX OIL (K) LTD.
��� PETRO OIL (K) LTD.
��� RANWAY TRADERS LTD.
��� REGNOL OIL (K) LTD.
���
RIVA PETROLEUM DEALERS
LTD.
�� ROYAL PETROLEUM LTD
�� KENYA SHELL LTD.
��� SOUTH WEST
�'� TOPAZ PETROLEUM LTD.
���
TOSHA PETROLEUM (K)
LTD.
��� TOTAL KENYA LTD.
��� TRITON
��� TROJAN INT’L LTD.