Embed Size (px)
Citation preview
Downstream processing and in situ product recovery techniques of
isopropanol and butanol production from biomass
Diogo Miguel Silva Felgueira
Thesis to obtain the Master of Science Degree in Chemical Engineering
Integrated Master in Chemical Engineering
Supervisors:
Prof. Dr. Filipe José da Cunha Monteiro Gama Freire
Dr. Vincent Coupard
Dra. Eszter Toth
Dra. Helena Gonzalez Penã
Examination Committee
Chairperson: Prof. Dr. Carlos Manuel Faria de Barros Henriques
Supervisor: Prof. Dr. Filipe José da Cunha Monteiro Gama Freire
Members of the Committee: Prof. Dr. Maria Cristina de Carvalho Silva Fernandes
October 2015

i
This page was left intentionally in blank.
ii
Acknowledgements
Firstly, I would like to express my sincere gratitude to my internship supervisors at IFP Energies
Nouvelles, Dra. Eszter Toth and Dra. Helena Gonzalez Penã, as well as my project director Dr. Vincent
Coupard for all the help provided during my internship. Their patience, motivation and immense
knowledge was an invaluable contribute to this work. In fact, without their guidance I would dare
affirm this work couldn’t have been possibly. For that they truly have my most sincere gratitude.
I would also like to thank my IST supervisor Prof. Dr. Filipe Gama Freire for is supervision and
patience, especially in the writing of the report. Besides my advisor, I would like to thank the rest of
my thesis committee: Prof. Dr. Carlos Henriques and Prof. Dr. Maria Fernandes, for accepting the
invitation to my thesis committee and providing their time for its examination.
My sincere thanks also goes to all my friends that have supported me during this internship, as well
as during this years at IST. I’m grateful for having met such unique people and I wish them a
successful future, carrer and personal wise. My special gratitude goes to Ana, Catarina, David, João,
Joana, Solange and Tiago who have been my IFP buddies and also André, Ricardo, Filipa and Rita for
their most sincere friendship. Lastly I would also like to thank Bárbara and Catarina their deepest
support during this six months and the last years.
I thank all my family for their support and for believing in me, even when I do not. For this I specially
mention my brothers and my cousin for being the examples anyone could desire and I hope to have
made them proud.
Moreover I dedicate this work to my mother, for all the sacrifices she had to make and to my
stepfather, without which, all this efforts wouldn’t have been possible. They will always have my
deepest gratitude.
“Believe you can and you’re halfway there.”
Theodore Roosevelt

iii
This page was left intentionally in blank.
iv
Abstract
This works considers a preliminary study of butanol and isopropanol production from biomass.
Therefore the downstream recovery of the fermentation broth was evaluated while having a bigger
focus in in situ product recovery techniques to achieve a higher fermentation productivity as well as
more concentrated process streams.
For that purpose an analysis of the effect of achieving more concentrated fermentation broth in the
downstream recovery has been made and three different distillation schemes for this separation
have been developed. Regarding the in situ product recovery techniques, four different process
schemes were obtained by varying the separation method between gas stripping, liquid-liquid
extraction and condensation. Different solvents were used and for each a possible configuration for
its regeneration was evaluated, when conceivable.
The results obtained are promising but there is still much more work needed to achieve final results
for an economically feasible project. A higher understanding of the advantages of each technology
for in situ product recovery has been possible and some of the process optimizations indicate the
improvement that can still be made. From this works a preliminary choice of the in situ recovery
technology to focus further studies can be decided.
There are still many possible improvements to this work that may focus in further optimization of the
in situ recovery technologies, in the downstream recovery process and as well in the economic
evaluation of the project in terms of the CAPEX, OPEX and raw material costs reduction achievable.
Keywords: n-Butanol, Isopropanol, IBE fermentation, Biomass, Clostridium

v
This page was left intentionally in blank.
vi
Resumo
Este trabalho consiste num estudo preliminário da produção de isopropanol e butanol através de
biomassa. Para tal foi feita uma breve análise do processo de separação e purificação dos álcoois do
meio de fermentação. No entanto este trabalho centra-se em técnicas de recuperação de produto
“in situ” para obter uma maior productividade e correntes de processo mais concentradas.
Três esquemas de distilação foram estudados para o processo de separação e purificação dos álcoois
de modo a avaliar o impacto de correntes de processo mais concentradas no consumo energético do
esquema. Relativamente a técnicas “in situ”, quatro esquemas de processo foram establecidos, entre
os quais variam as unidades de separação entre gas stripping, extacção líquido-líquido e
condensação. Deste modo, diferentes solventes foram ponderados e, para cada, um processo de
regeneração foi avaliado, quando possível.
Os resultados obtidos são promissores mas será necessário um estudo mais intenso de modo a obter
resultados finais sobre a viabilidade económica do projecto. Um estudo inicial das vantagens de cada
tecnologia de recuperação “in situ” foi feito e algumas optimizações de processo foram sugeridas.
Deste trabalho a escolha de um processo para um estudo mais profundo poderá ser decidida.
Existem ainda muitas melhorias possíveis para o projecto para uma melhor optimização do mesmo e
é também necessário obter valores de avaliação económica do projecto, relativamente a custos fixos
e custos operatórios.
Palavras chave: n-Butanol, Isopropanol, Fermentação IBE, Biomassa, Clostridium

vii
This page was left intentionally in blank.
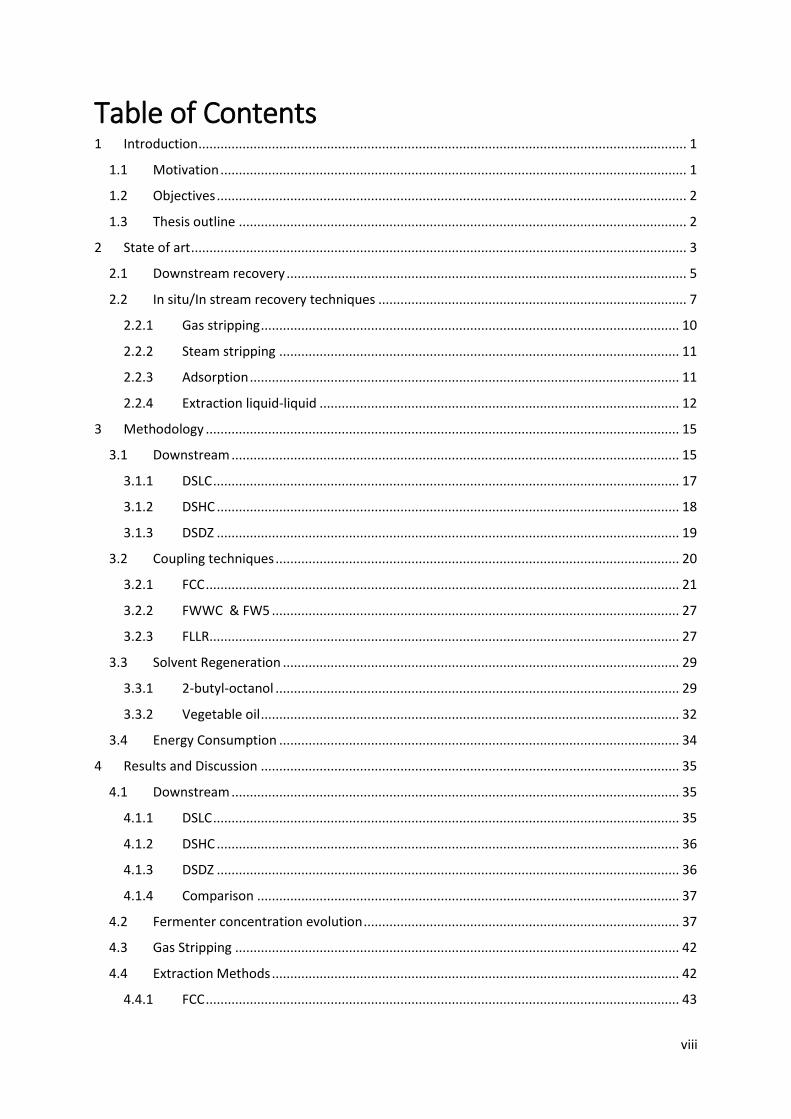
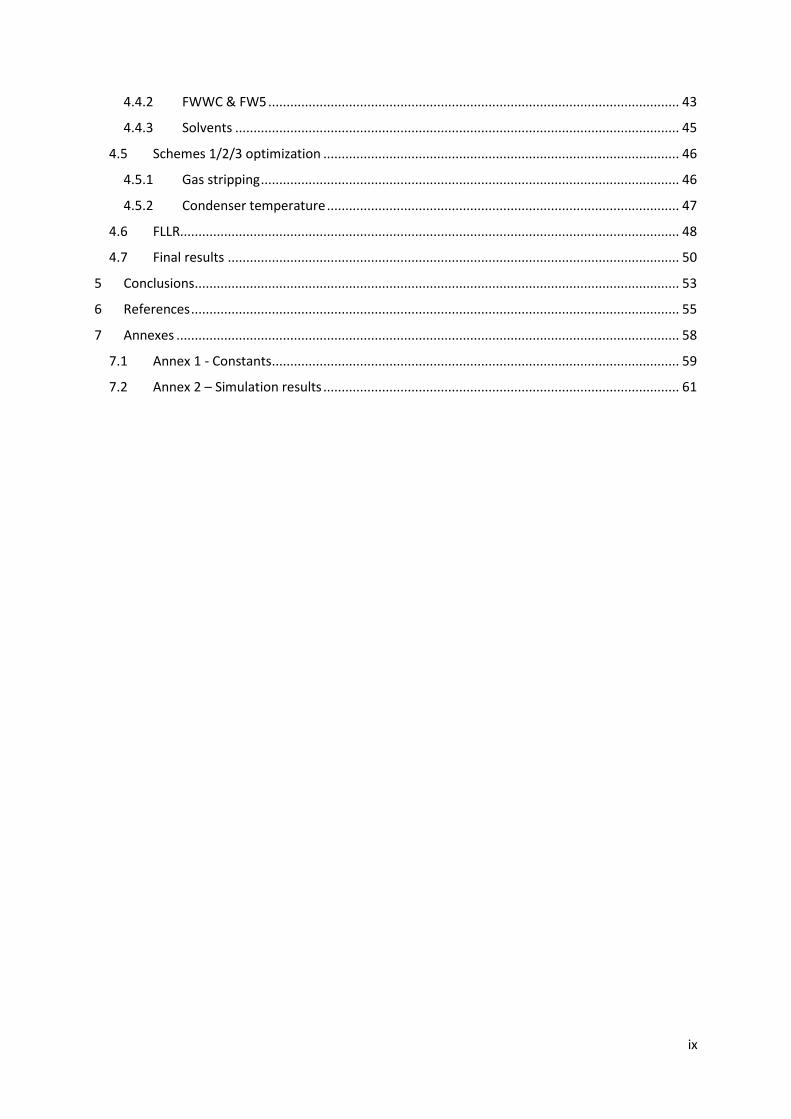
viii
Table of Contents 1 Introduction ..................................................................................................................................... 1
1.1 Motivation ............................................................................................................................... 1
1.2 Objectives ................................................................................................................................ 2
1.3 Thesis outline .......................................................................................................................... 2
2 State of art ....................................................................................................................................... 3
2.1 Downstream recovery ............................................................................................................. 5
2.2 In situ/In stream recovery techniques .................................................................................... 7
2.2.1 Gas stripping .................................................................................................................. 10
2.2.2 Steam stripping ............................................................................................................. 11
2.2.3 Adsorption ..................................................................................................................... 11
2.2.4 Extraction liquid-liquid .................................................................................................. 12
3 Methodology ................................................................................................................................. 15
3.1 Downstream .......................................................................................................................... 15
3.1.1 DSLC ............................................................................................................................... 17
3.1.2 DSHC .............................................................................................................................. 18
3.1.3 DSDZ .............................................................................................................................. 19
3.2 Coupling techniques .............................................................................................................. 20
3.2.1 FCC ................................................................................................................................. 21
3.2.2 FWWC & FW5 ............................................................................................................... 27
3.2.3 FLLR ................................................................................................................................ 27
3.3 Solvent Regeneration ............................................................................................................ 29
3.3.1 2-butyl-octanol .............................................................................................................. 29
3.3.2 Vegetable oil .................................................................................................................. 32
3.4 Energy Consumption ............................................................................................................. 34
4 Results and Discussion .................................................................................................................. 35
4.1 Downstream .......................................................................................................................... 35
4.1.1 DSLC ............................................................................................................................... 35
4.1.2 DSHC .............................................................................................................................. 36
4.1.3 DSDZ .............................................................................................................................. 36
4.1.4 Comparison ................................................................................................................... 37
4.2 Fermenter concentration evolution ...................................................................................... 37
4.3 Gas Stripping ......................................................................................................................... 42
4.4 Extraction Methods ............................................................................................................... 42
4.4.1 FCC ................................................................................................................................. 43
ix
4.4.2 FWWC & FW5 ................................................................................................................ 43
4.4.3 Solvents ......................................................................................................................... 45
4.5 Schemes 1/2/3 optimization ................................................................................................. 46
4.5.1 Gas stripping .................................................................................................................. 46
4.5.2 Condenser temperature ................................................................................................ 47
4.6 FLLR........................................................................................................................................ 48
4.7 Final results ........................................................................................................................... 50
5 Conclusions .................................................................................................................................... 53
6 References ..................................................................................................................................... 55
7 Annexes ......................................................................................................................................... 58
7.1 Annex 1 - Constants ............................................................................................................... 59
7.2 Annex 2 – Simulation results ................................................................................................. 61
x
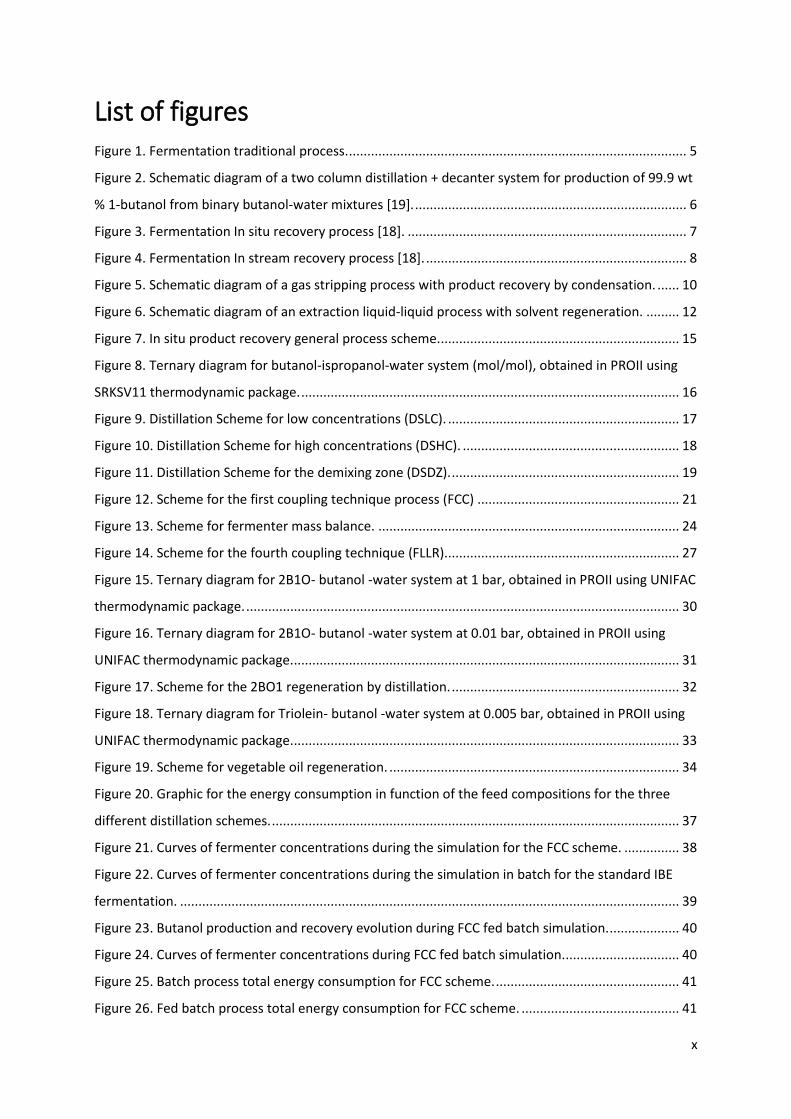
List of figures Figure 1. Fermentation traditional process. ............................................................................................ 5
Figure 2. Schematic diagram of a two column distillation + decanter system for production of 99.9 wt
% 1-butanol from binary butanol-water mixtures [19]. .......................................................................... 6
Figure 3. Fermentation In situ recovery process [18]. ............................................................................ 7
Figure 4. Fermentation In stream recovery process [18]. ....................................................................... 8
Figure 5. Schematic diagram of a gas stripping process with product recovery by condensation. ...... 10
Figure 6. Schematic diagram of an extraction liquid-liquid process with solvent regeneration. ......... 12
Figure 7. In situ product recovery general process scheme. ................................................................. 15
Figure 8. Ternary diagram for butanol-ispropanol-water system (mol/mol), obtained in PROII using
SRKSV11 thermodynamic package. ....................................................................................................... 16
Figure 9. Distillation Scheme for low concentrations (DSLC). ............................................................... 17
Figure 10. Distillation Scheme for high concentrations (DSHC). ........................................................... 18
Figure 11. Distillation Scheme for the demixing zone (DSDZ). .............................................................. 19
Figure 12. Scheme for the first coupling technique process (FCC) ....................................................... 21
Figure 13. Scheme for fermenter mass balance. .................................................................................. 24
Figure 14. Scheme for the fourth coupling technique (FLLR)................................................................ 27
Figure 15. Ternary diagram for 2B1O- butanol -water system at 1 bar, obtained in PROII using UNIFAC
thermodynamic package. ...................................................................................................................... 30
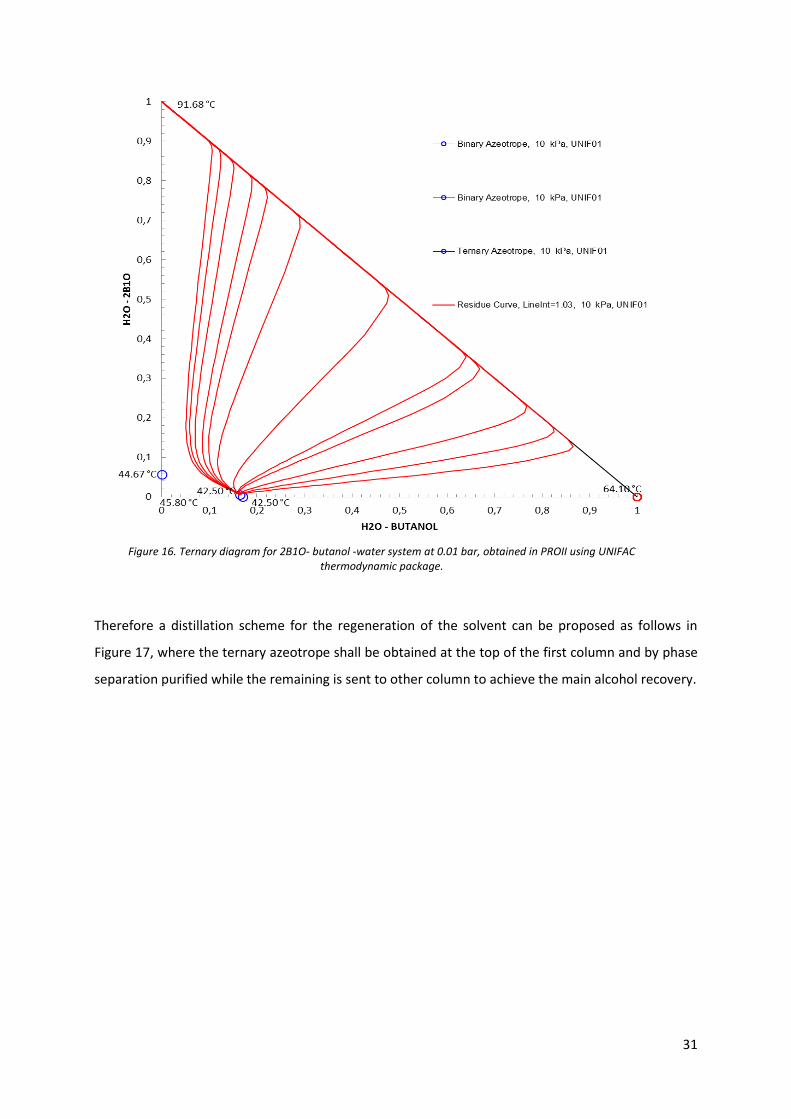
Figure 16. Ternary diagram for 2B1O- butanol -water system at 0.01 bar, obtained in PROII using
UNIFAC thermodynamic package. ......................................................................................................... 31
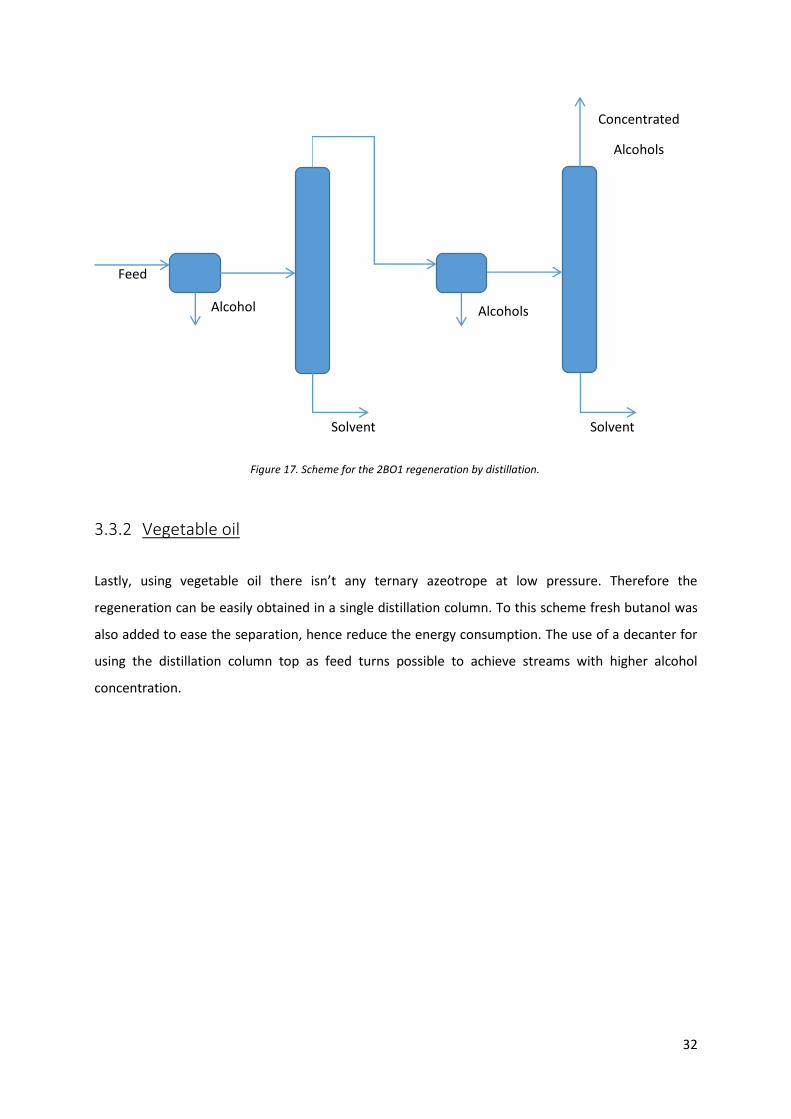
Figure 17. Scheme for the 2BO1 regeneration by distillation. .............................................................. 32
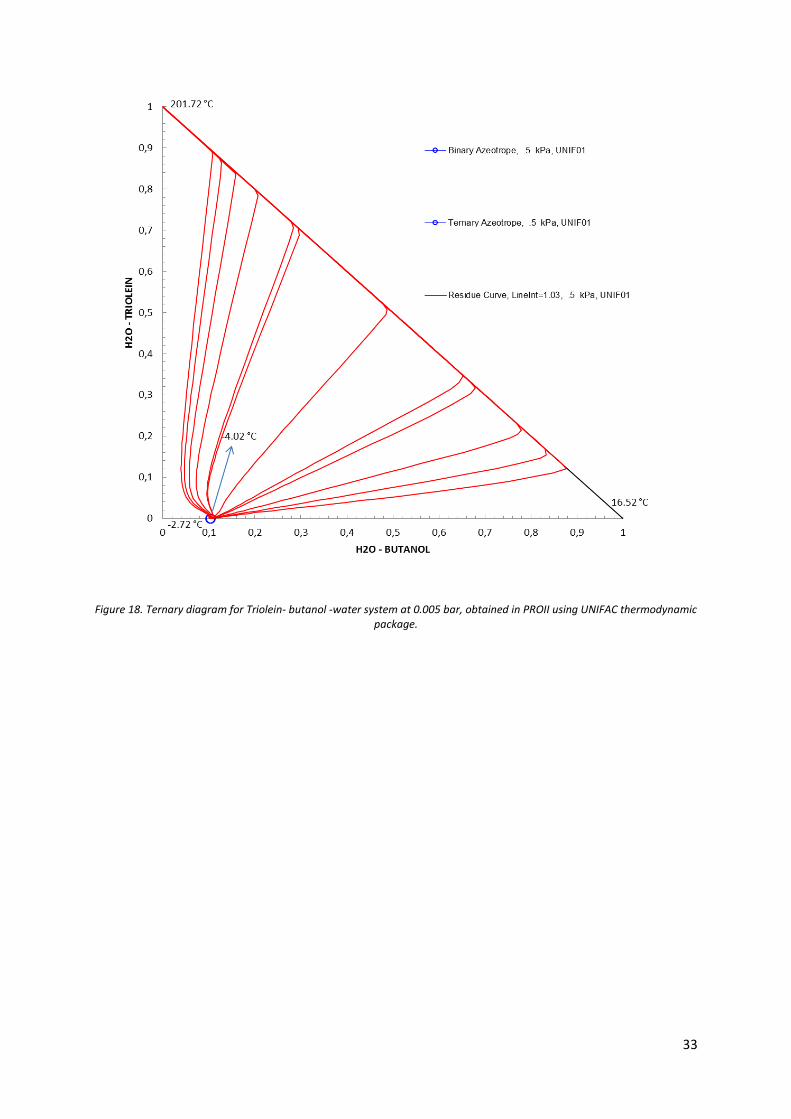
Figure 18. Ternary diagram for Triolein- butanol -water system at 0.005 bar, obtained in PROII using
UNIFAC thermodynamic package. ......................................................................................................... 33
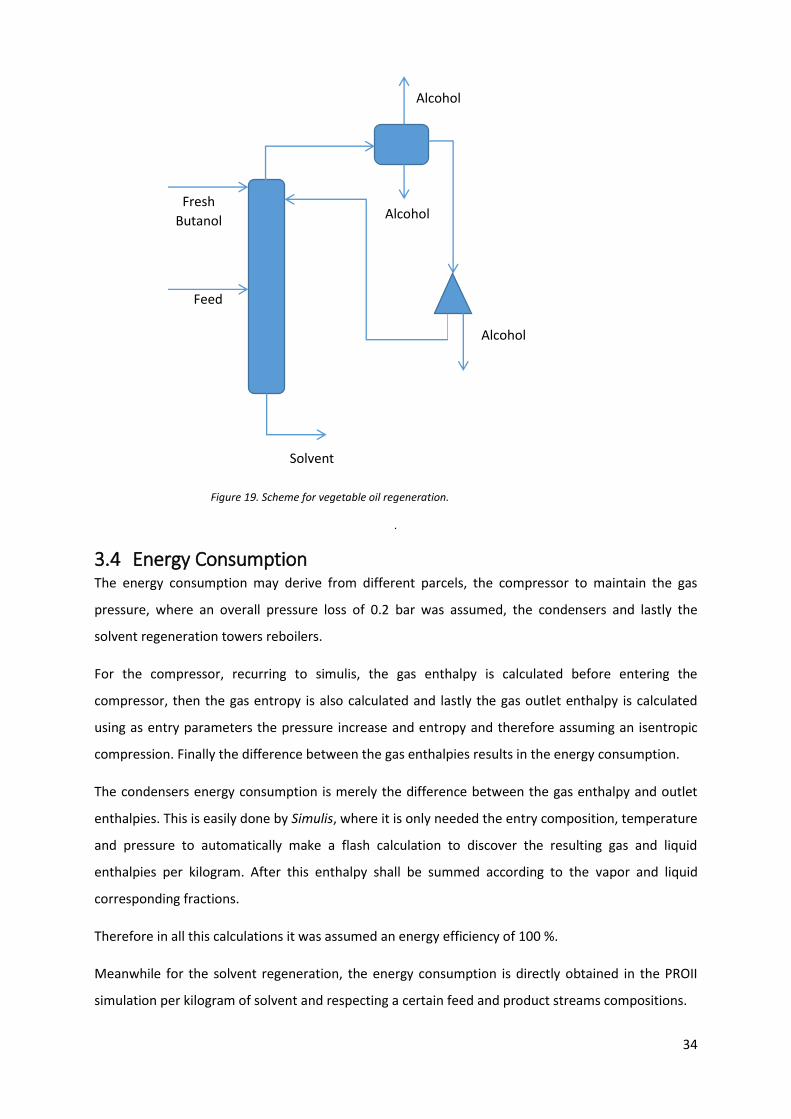
Figure 19. Scheme for vegetable oil regeneration. ............................................................................... 34
Figure 20. Graphic for the energy consumption in function of the feed compositions for the three
different distillation schemes. ............................................................................................................... 37
Figure 21. Curves of fermenter concentrations during the simulation for the FCC scheme. ............... 38
Figure 22. Curves of fermenter concentrations during the simulation in batch for the standard IBE
fermentation. ........................................................................................................................................ 39
Figure 23. Butanol production and recovery evolution during FCC fed batch simulation. ................... 40
Figure 24. Curves of fermenter concentrations during FCC fed batch simulation. ............................... 40
Figure 25. Batch process total energy consumption for FCC scheme. .................................................. 41
Figure 26. Fed batch process total energy consumption for FCC scheme. ........................................... 41

xi
Figure 27. Gas stripping extraction capacity for FCC scheme. .............................................................. 42
Figure 28. First condenser recovery capacity for FCC scheme. ............................................................. 43
Figure 29. First condenser recovery capacity for FCC scheme. ............................................................. 43
Figure 30. Recovery capacity for a standard FWWC scheme process unit. .......................................... 44
Figure 31. Fermenter concentration evolution in the organic phase. .................................................. 49
Figure 32. Fermenter concentration evolution in the aqueous phase. ................................................ 49
xii
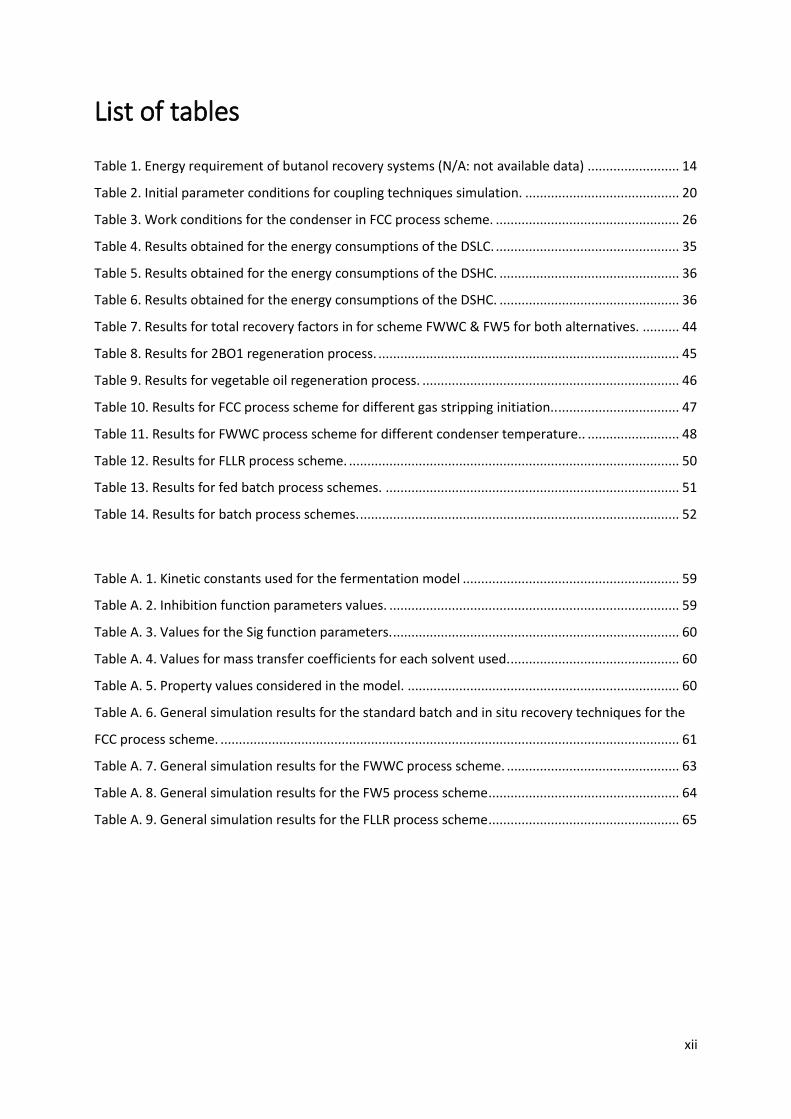
List of tables
Table 1. Energy requirement of butanol recovery systems (N/A: not available data) ......................... 14
Table 2. Initial parameter conditions for coupling techniques simulation. .......................................... 20
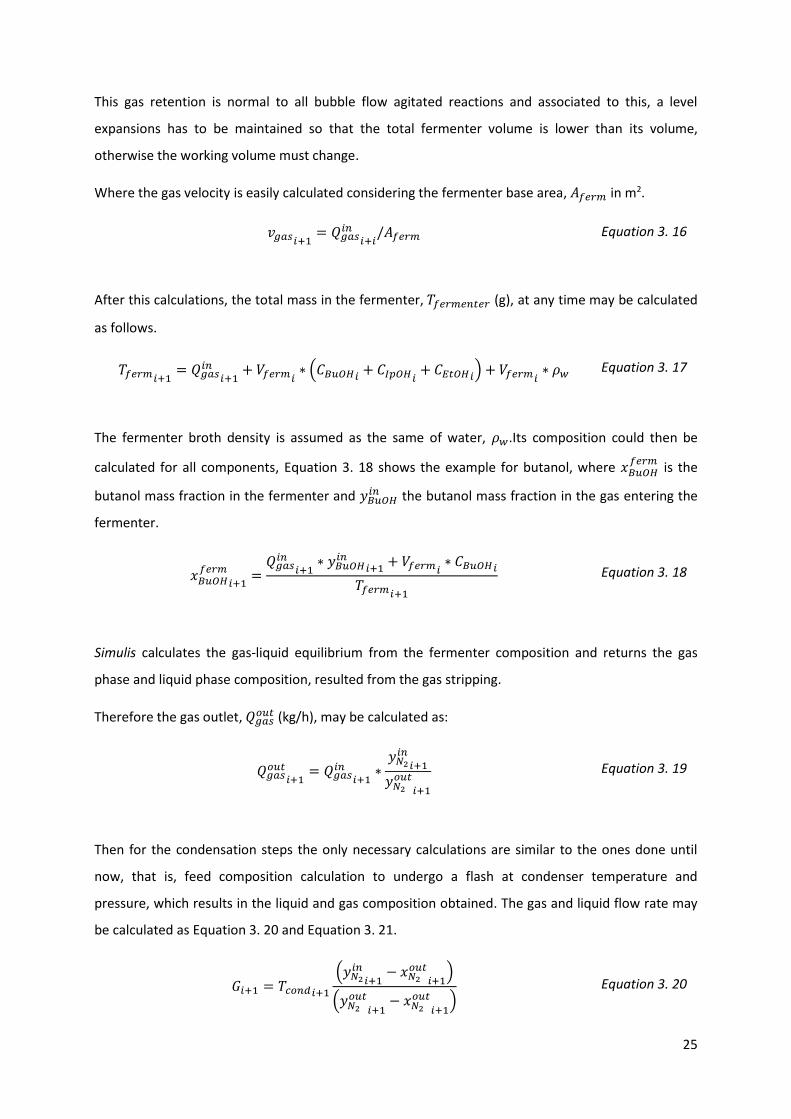
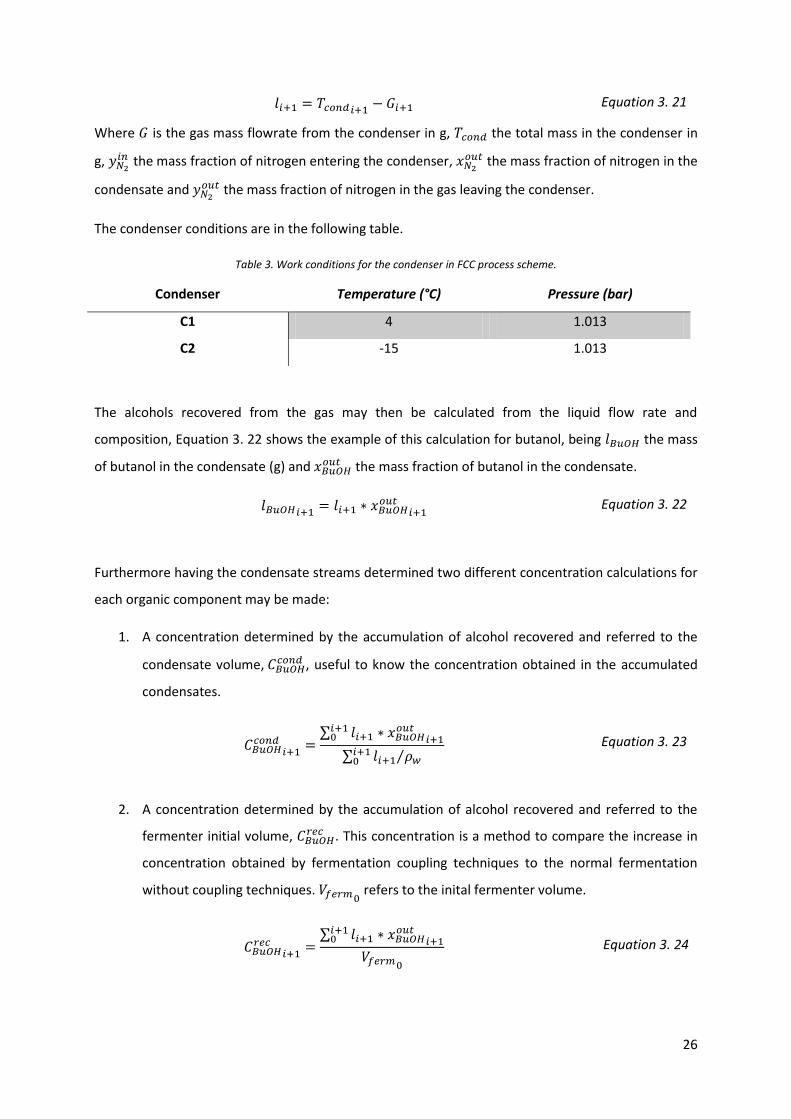
Table 3. Work conditions for the condenser in FCC process scheme. .................................................. 26
Table 4. Results obtained for the energy consumptions of the DSLC. .................................................. 35
Table 5. Results obtained for the energy consumptions of the DSHC. ................................................. 36
Table 6. Results obtained for the energy consumptions of the DSHC. ................................................. 36
Table 7. Results for total recovery factors in for scheme FWWC & FW5 for both alternatives. .......... 44
Table 8. Results for 2BO1 regeneration process. .................................................................................. 45
Table 9. Results for vegetable oil regeneration process. ...................................................................... 46
Table 10. Results for FCC process scheme for different gas stripping initiation.. ................................. 47
Table 11. Results for FWWC process scheme for different condenser temperature.. ......................... 48
Table 12. Results for FLLR process scheme. .......................................................................................... 50
Table 13. Results for fed batch process schemes. ................................................................................ 51
Table 14. Results for batch process schemes. ....................................................................................... 52
Table A. 1. Kinetic constants used for the fermentation model ........................................................... 59
Table A. 2. Inhibition function parameters values. ............................................................................... 59
Table A. 3. Values for the Sig function parameters. .............................................................................. 60
Table A. 4. Values for mass transfer coefficients for each solvent used. .............................................. 60
Table A. 5. Property values considered in the model. .......................................................................... 60
Table A. 6. General simulation results for the standard batch and in situ recovery techniques for the
FCC process scheme. ............................................................................................................................. 61
Table A. 7. General simulation results for the FWWC process scheme. ............................................... 63
Table A. 8. General simulation results for the FW5 process scheme .................................................... 64
Table A. 9. General simulation results for the FLLR process scheme .................................................... 65

xiii
This page was left intentionally in blank.
xiv
Nomenclature 𝐴 Area [𝑚2]
𝐶 Concentration [𝑔 𝑙⁄ ]
C1 Condenser 1
C2 Condenser 2
𝐶𝑚𝑎𝑥 Concentration of inhibition [𝑔 𝑙⁄ ]
𝐶𝐴𝐵,𝑐𝑟𝑖𝑡𝑖𝑐 Butyric acid critic concentration [𝑔 𝑙⁄ ]
𝐶𝐵𝑢𝑂𝐻𝑏 Butanol concentration to begin extraction [𝑔 𝑙⁄ ]
𝐺 Gas mass [𝑔]
ℎ𝑜𝑙𝑑 − 𝑢𝑝 Gas hold-up
𝑖𝑛𝑏 Inhibition function
𝑘𝑖 Kinetic parameter where i ranges between 1 and 12 [ℎ−1]
𝑘 Kinetic parameter for compounds mass transfer [(𝑔𝑜𝑟𝑔 𝑙𝑜𝑟𝑔⁄ )/(𝑔𝑎𝑞 𝑙𝑎𝑞⁄ )]
𝐾 Kinetic parameter [𝑔 𝑙⁄ ]
𝐾𝐺 Kinetic parameter for global mass transfer [ℎ−1]
𝐾𝑆 Affinity constant for the carbonic subtract [𝑔 𝑙⁄ ]
𝑙 Liquid mass [𝑔]
𝑚 Inhibition degree parameter
𝑀𝑔𝑎𝑠 Renewal gas mass [𝑔]
𝑀𝑀 Molecular weight [𝑔/𝑚𝑜𝑙]
𝑄𝐸𝑥𝑡 Solvent flowrate [𝑚3 ℎ⁄ ]
𝑄𝑔𝑎𝑠 Gas flowrate [𝑘𝑔 ℎ⁄ ]
𝑟 Solvent and gas ratio in wash stage entry
𝑠 Solvent mass [𝑔]
𝑠𝑖𝑔 Sig function
𝑆 Substrate concentration [𝑔 𝑙⁄ ]
𝑣𝑔𝑎𝑠 Gas velocity [𝑚 𝑠⁄ ]
𝑉 Volume [𝑚3]
𝑉𝑓𝑒𝑟𝑚0 Initial fermenter volume [𝑚3]
𝑡 Time [𝑠]
𝑇 Total mass [𝑔]
𝑥 Liquid fraction
𝑋 Biomass concentration [𝑔 𝑙⁄ ]
𝑦 Gas fraction
𝑧 Solvent and organic phase volume ratio in the fermeter
xv
Greek
𝜌𝑤 Water density [𝑔 𝑚3⁄ ]
µ Specific velocity of microorganisms production [ℎ−1]
µ𝑚𝑎𝑥 Maximum velocity of microorganisms production
𝜙 Fixed parameter for sig function
Indices
𝐴𝐴 Acetic acid
𝐴𝐵 Butyric acid
𝐵𝑢𝑂𝐻 Butanol
𝑐𝑜𝑛𝑑 Condenser
𝐸𝑡𝑂𝐻 Ethanol
𝑓𝑒𝑟𝑚 Fermenter
𝑖 Actual time step
𝑖 + 1 Next time step
𝐼𝑝𝑂𝐻 Isopropanol
𝑁2 Nitrogen
𝑠𝑜𝑙𝑣 Solvent
𝑤 Water
Exponents
𝑎𝑞 Aqueous phase
𝑐𝑜𝑛𝑑 Relative to condensate
𝑖𝑛 Inlet
𝑜𝑟𝑔 Organic
𝑜𝑢𝑡 Outlet
𝑟𝑒𝑐 Relative to initial fermenter volume
𝑤𝑎𝑠ℎ Washing unit
1
1 Introduction
This report describes the work done at IFP energies nouvelles under the subject of downstream
processing and in situ product recovery techniques of isopropanol and butanol production from
biomass. This work shall therefore include a brief analysis of the effect of concentrating the
fermentation product on its energy consumption for separation as well as a simplified model for in
situ product recovery process schemes. In the end the results obtained shall be compared between
the different schemes.
1.1 Motivation
Nowadays petroleum and other fossil fuels are the main source of energy. From them, petrochemical
industry supplies a wide range of products in sectors of automotive fuels, plastic material, rubbers,
cosmetics and pharmaceutics. Consequently the depletion of cheap fossil fuels and their negative
impact on the environment have been motivating future work on the use of sustainable sources of
energy and of bulk chemicals.
As a sustainable source of energy and bulk chemicals, biomass has become increasingly more
attractive. In fact in the last decades the use of biofuels for transportation from biomass has become
much more relevant.
Therefore several work has been done to identify methods to substitute current fossil fuel demands
by alcohols produced by biomass fermentation by microorganism. Most of the investigation focus in
the production of biobutanol by ABE (Acetone-Butanol-Ethanol) fermentation due to its easiness to
be blended with gasoline and having more interesting properties than ethanol
Nevertheless in this work a new alternative, the IBE (Isopropanol-Butanol-Ethanol) fermentation, will
be explored to produce not only butanol but also isopropanol. Isopropanol has a bigger market value
than acetone, being used in many industrial processes as a solvent and can also be blended with
gasoline.
2
1.2 Objectives
An economical study of the IBE fermentation process and downstream processing is underway at
IFP Energy Nouvelles to improve the process results and obtain a well-structured and economically
feasible project. Therefore the aim of this work is to make preliminary calculations for the energy
process consumption and process streams. The calculations were implemented in VBA (Visual basic
for applications).
This work will then be useful for further development of the process, as also for choosing which in
situ product recovery technologies to be focused on in order to achieve better process parameters at
lower project cost.
1.3 Thesis outline
This report has been divided in three sections. Firstly there is the State of Art, where can be found a
brief description of the use of butanol and isopropanol, the IBE fermentation basics, the traditional
IBE fermentation process and the most important constraints to the project. Then the fermentation
broth separation, the downstream recovery, is detailed, as also the increasing interest in achieving
higher fermentation broth concentrations. Lastly the most important difference in situ/in stream
product recovery techniques are described.
Henceforward, in the second section, the methods applied for the downstream processing and in situ
product recovery techniques are explained for different process schemes. For that, solvents may be
used and therefore there is also a brief methodology on the solvent regeneration. Lastly, equations
for energy consumption are explained.
In a third section, the results are presented and discussed by means of energy consumption,
concentration and extraction profiles as well as recurring to comparison by final results tables.
The report ends with a final conclusion where the remaining improvements are integrated and the
most important results are highlighted.
3
2 State of art
The current reduction of petroleum resources and the impact to the environment these derived fuels
represent have culminated into an increasing interest in the use of biofuels. This biofuels should have
a lower process cost, be produced in large quantities from a renewable source and be able to be
directly used in existing motor vehicles and inserted in the petroleum distribution system. The
increase of usage of biofuels is also expected to reduce the oil market supply instabilities and the
greenhouse gas emissions [1].
As petroleum substitutes are included, as some of the most promising, isopropanol and butanol due
to being more advanced biofuels then ethanol, having bigger carbon chains and replacing better
gasoline.
Butanol is a great candidate because it can be obtainable from renewable sources, such as rice straw
and corn fiber, further it also as interesting properties, having an average energy density of 30%
more than ethanol, its less soluble in water, has a lower volatility, lower corrosivity and can be
blended with gasoline in any desired proportion. It can also be used as solvent for the anibiotics,
vitamins and hormones production, but most of it is used in the production of butyl acrylate and
methacrylate esters used in latex surfaces, coating, enamels and lacquers [2], [3], [4].
Isopropanol is also an important candidate, it is used in many industrial processes as solvent, oil,
lacquers and cosmetic products or as antiseptic agent and disinfectant for home, hospital and
industries, [5]. In the biofuel market it can be used as precursor of propylene, used for plastics
manufacture, and, with dehydration, to form Di-isopropyl ether (DIPE) which has been proposed by
Knifton et Day (1999) as a substitute for Methyl-tert-butyl-ether (MTBE), [6], an oxygenated additive
in gasoline blending to enhance the gasoline RON. Also it can be blended to gasoline due to its
heating value and other properties [2].
The process ABE (Acetone-Butanol-Etanol) is the conventional fermentation process for butanol
production and has been roughly studied in the last years, but this study will focus in the IBE process
(Isopropanol-Butanol-Ethanol) which is very similar to the ABE process but since it also produces
isopropanol instead of acetone it has an higher product value since it can be used directly as a
biofuel, which isn’t possible with acetone, being it considered un-desirable in the ABE process for its
poor fuel properties and corrosiveness to rubber engine parts [7].
4
Both this fermentation processes are performed by microorganisms from the genus Clostridium and
the metabolic pathways are similar, also the ABE process is older and therefore more extensively
studied. Most known solventogenic microorganisms produce either acetone or isopropanol or
butanol, even so, the first report of butanol production by Clostidium bacteria was in 1861 by Louis
Pasteur, in 1905, Schardinger reported the production of acetone by Bacillus macerans and only in
1906 was the isopropanol production reported by Pringsheim [5].
ABE and IBE fermentations are known as solventogenic fermentations since its products are used as
solvents in various industrial processes. In fact ABE fermentation was almost uninterruptedly in
operation between 1910 and 1960 and the first plants were built in United Kingdom. Contrary to
nowadays the desired product from ABE fermentation during the two World Wars was acetone to be
used in the ammunitions manufacture. Butanol only started being desired with the development of
the automobile market, used in the manufacture of synthetic rubber and fast-dry car lacquer. While
this, IBE fermentation was being developed in Taiwan, but after the Second World War the
petrochemical industry developed and this fermentations market began to decline, ceasing to exist in
the beginning of the sixties in USA and Great Britain, while in Russia and China large scale plants
existed until the mid-1990s. Nowadays the ABE process as began to be introduced in China, Brazil
and South Africa [5].
Clostridium bacteria’s can use different carbon sources as fermentation substrates, including glucose,
xylose, cellobiose, sucrose and many others. Furthermore this bacteria’s have successfully produced
solvents from Jerusalem artichoke [8], liquefied corn starch [9] and starched package peanut [10],
[11].
The interest in studying the conversion of lignocellulosic biomass into biofuels by fermentation has
been increasing recently due to lignocellulosic biomass being one of the most abundant renewable
resources. This resource has a heterogeneous structure, being composed by cellulose (mainly
glucose), hemicellulose (glucose and pentoses) and lignin [12].A hydrolysis of the hemicellulose prior
to the fermentation is advised, obtaining a sugar solution of manly glucose and xylose and since
clostridium can ferment this substrates to produce solvents, these microorganisms have been gaining
more attention. Therefore there has been an extensively investigation in the production of solvents
from this lignocellulosic hydrolysates [13], [14], [15], [16] and [17].
An important characteristic of solvent-producing fermentations is the metabolic changes. Both ABE
and IBE fermentations show two phases, the acidogenesis during which acetic acid and butyric acid
are produced and the solventogenesis, the solvents production phase. During acidogenesis hydrogen
and carbon dioxide are also produced and with the acid increase the pH drops switching the
5
metabolism mechanic to the solventogenesis, where the acids are used as electron acceptors and
reassimilated by the bacteria to produce solvents. This dependency between both metabolisms
mean that as the solvents concentration increases lower will be the acid concentration [5].
The major setbacks for the production of biobutanol are due to the process high cost and the low
productivity, the fermentation inhibition threefold of butanol is very low, limiting its production to
usually only 2% (w/v) from the fermentation broth. The high process cost is mainly due to the high
energy required for the butanol recovery, but also because of the substrate cost and the low solvent
concentration [18].
The key for achieving an economical production is to increase the butanol concentration and
productivity, for this, studies focused in strain development, using inexpensive renewable
feedstocks, have been made.
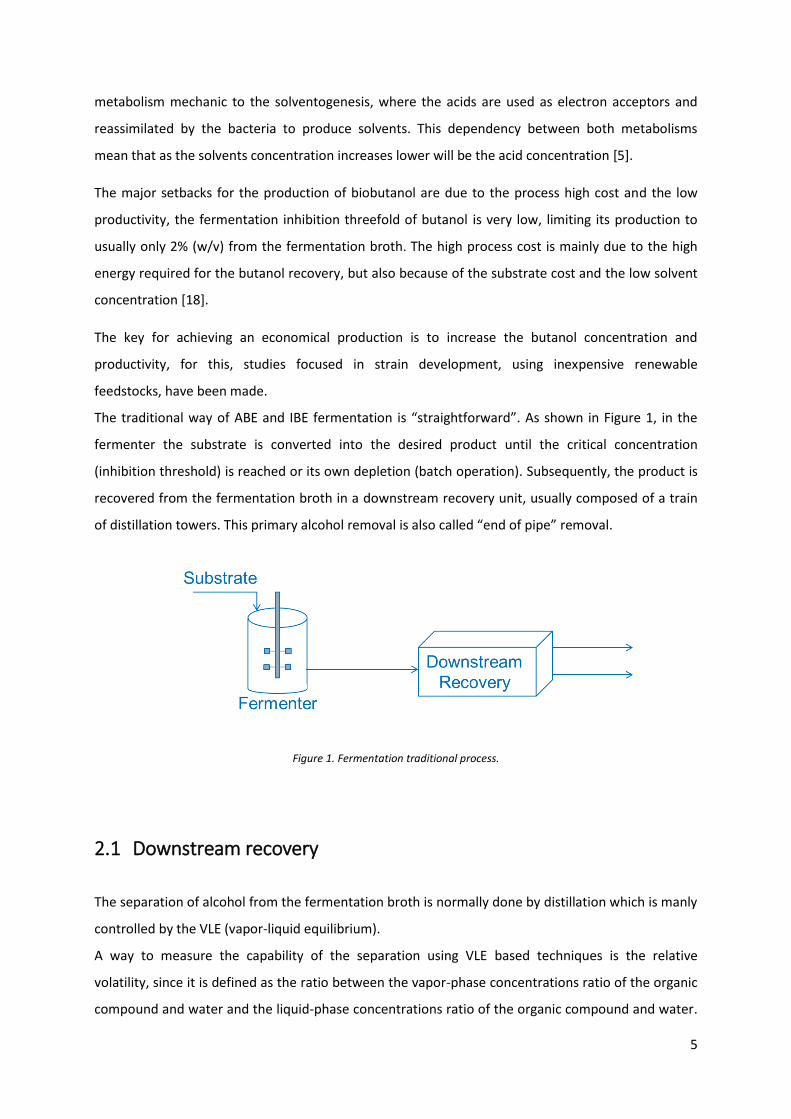
The traditional way of ABE and IBE fermentation is “straightforward”. As shown in Figure 1, in the
fermenter the substrate is converted into the desired product until the critical concentration
(inhibition threshold) is reached or its own depletion (batch operation). Subsequently, the product is
recovered from the fermentation broth in a downstream recovery unit, usually composed of a train
of distillation towers. This primary alcohol removal is also called “end of pipe” removal.
Figure 1. Fermentation traditional process.
2.1 Downstream recovery
The separation of alcohol from the fermentation broth is normally done by distillation which is manly
controlled by the VLE (vapor-liquid equilibrium).
A way to measure the capability of the separation using VLE based techniques is the relative
volatility, since it is defined as the ratio between the vapor-phase concentrations ratio of the organic
compound and water and the liquid-phase concentrations ratio of the organic compound and water.
6
The distillation scheme efficiency can be measured as the energy necessary to separate the
compound with the desired composition per mass unit of alcohol recovered. To evaluate the viability
of the separation, its required energy may be compared with the product fuel value since it is an
alcohol. Also the normal behavior in a distillation scheme is to have an increase in energy required
with a decrease of alcohol purity in the feed stream [19].
ABE and IBE fermentations would have more promising results if the alcohols concentration by the
end of the batch cycle were higher. In fact the alcohol recovery by distillation from a fermentation
broth that dilute is highly energy intensive at low alcohol concentrations.
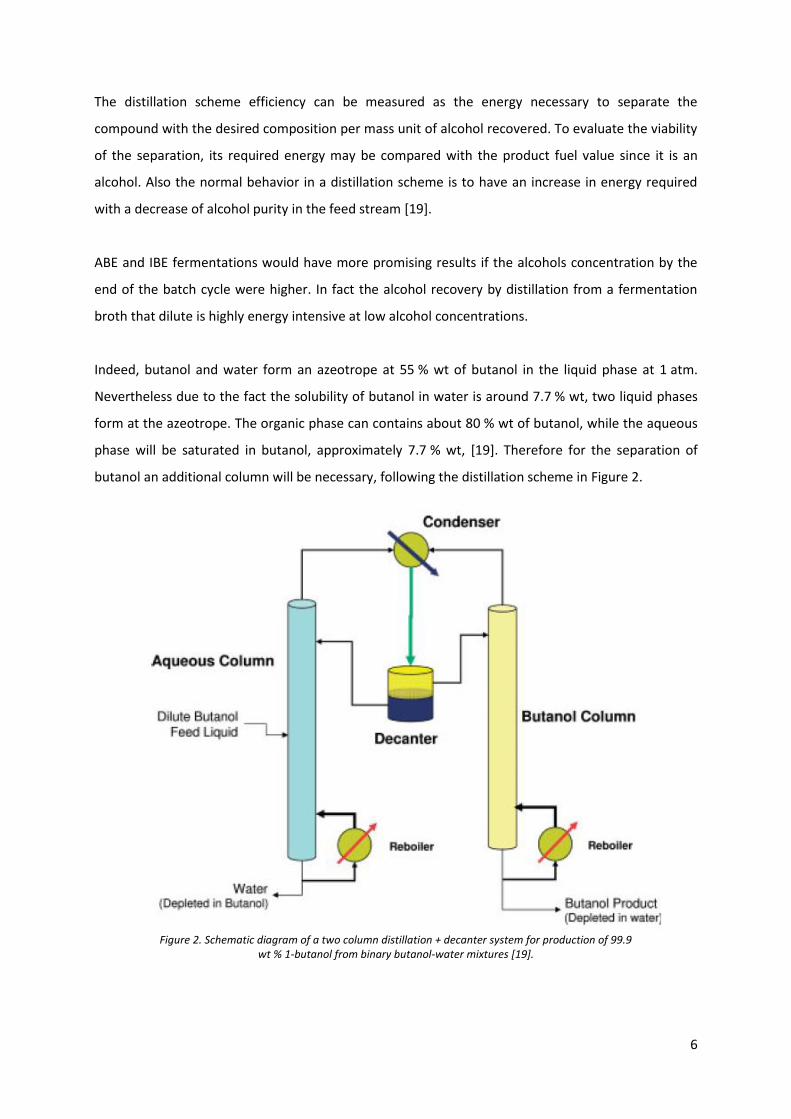
Indeed, butanol and water form an azeotrope at 55 % wt of butanol in the liquid phase at 1 atm.
Nevertheless due to the fact the solubility of butanol in water is around 7.7 % wt, two liquid phases
form at the azeotrope. The organic phase can contains about 80 % wt of butanol, while the aqueous
phase will be saturated in butanol, approximately 7.7 % wt, [19]. Therefore for the separation of
butanol an additional column will be necessary, following the distillation scheme in Figure 2.
Figure 2. Schematic diagram of a two column distillation + decanter system for production of 99.9 wt % 1-butanol from binary butanol-water mixtures [19].
7
Actually the butanol concentration during fermentation never reaches more than 1.5% wt and
consequently the high energy cost associated to the product recovery from such a low concentrated
broth turns the process economically unviable. Furthermore, associated to this large product
dilution, a huge volume of wastewater is generated. As that, there is a high process cost investment
due to the wastewater treatment.
It has been reported [19] that the energy required for producing 99% wt butanol using the previous
two-columns and decanter system from an aqueous stream at 20% wt butanol could decrease from
more than 30 to 4 MJ/ kg butanol produced, hence the energy consumption per unit of alcohol
recovered decreases as the concentration of alcohol at the end of the fermentation increases.
Therefore alternative technologies that are less energy expensive at low alcohol concentrations
would an interesting strategy to turn ABE and IBE fermentation in an economically viable process.
This could be achieved by applying an efficient technique that would allow the systematic removal of
the alcohols at a rate as fast as it is produced in the fermentation, improving the fermentation yields
and productivities in the reactor.
2.2 In situ/In stream recovery techniques
Optimization of the process has also been investigated with the use of in situ processes to remove
butanol. This technique consists in the removal of selective reaction products during fermentation.
Different approaches exist to develop an integrated product recovery system. This system consists of
a fermentation unit coupled to a product separation unit [20].
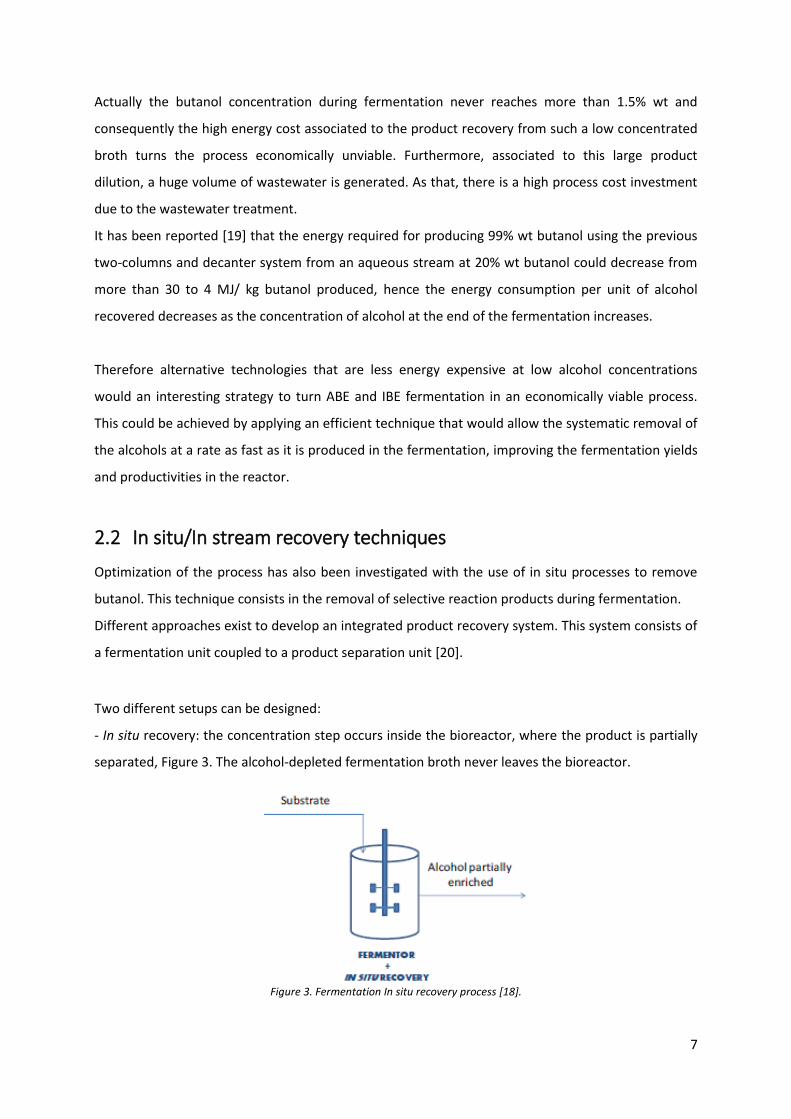
Two different setups can be designed:
- In situ recovery: the concentration step occurs inside the bioreactor, where the product is partially
separated, Figure 3. The alcohol-depleted fermentation broth never leaves the bioreactor.
Figure 3. Fermentation In situ recovery process [18].
8
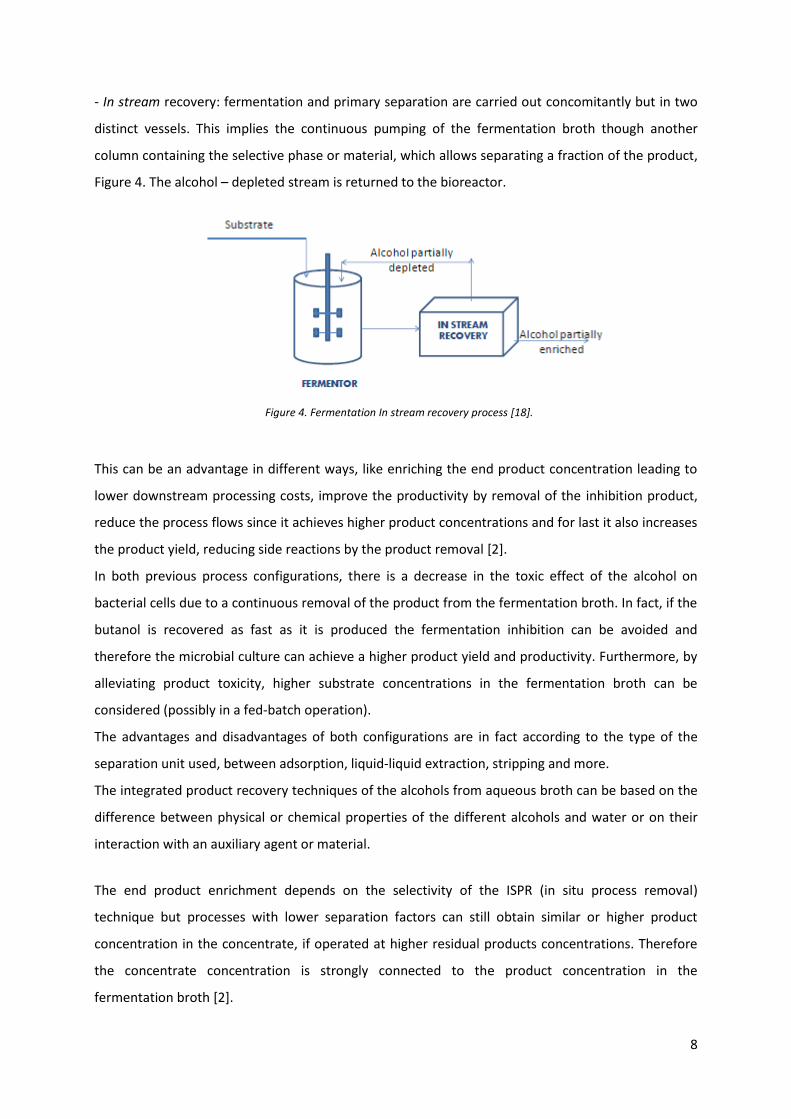
- In stream recovery: fermentation and primary separation are carried out concomitantly but in two
distinct vessels. This implies the continuous pumping of the fermentation broth though another
column containing the selective phase or material, which allows separating a fraction of the product,
Figure 4. The alcohol – depleted stream is returned to the bioreactor.
This can be an advantage in different ways, like enriching the end product concentration leading to
lower downstream processing costs, improve the productivity by removal of the inhibition product,
reduce the process flows since it achieves higher product concentrations and for last it also increases
the product yield, reducing side reactions by the product removal [2].
In both previous process configurations, there is a decrease in the toxic effect of the alcohol on
bacterial cells due to a continuous removal of the product from the fermentation broth. In fact, if the
butanol is recovered as fast as it is produced the fermentation inhibition can be avoided and
therefore the microbial culture can achieve a higher product yield and productivity. Furthermore, by
alleviating product toxicity, higher substrate concentrations in the fermentation broth can be
considered (possibly in a fed-batch operation).
The advantages and disadvantages of both configurations are in fact according to the type of the
separation unit used, between adsorption, liquid-liquid extraction, stripping and more.
The integrated product recovery techniques of the alcohols from aqueous broth can be based on the
difference between physical or chemical properties of the different alcohols and water or on their
interaction with an auxiliary agent or material.
The end product enrichment depends on the selectivity of the ISPR (in situ process removal)
technique but processes with lower separation factors can still obtain similar or higher product
concentration in the concentrate, if operated at higher residual products concentrations. Therefore
the concentrate concentration is strongly connected to the product concentration in the
fermentation broth [2].
Figure 4. Fermentation In stream recovery process [18].
9
Many previous investigations using gas stripping had disappointing results since the butanol
concentration in the fermenter decrease to < 5 g.L-1 but according to Xue et al. (2012), [3], only by
controlling the gas stripping device so that it would only be “on” while the butanol concentration in
the fermenter was between 8 and 13 g.L-1 obtained concentrations of 151 g.L-1 of butanol, reaching a
total of 196 g.L-1 of ABE.
However as many process parameters are interrelated, in this case this increase in concentration will
lead to a lower solvent productivity than if it other ISPR techniques were used, as pervaporation [21].
The removal of inhibitory product will also increase the productivity since it relieves the cells
inhibition and therefore leads to a higher cell growth and consequentially a faster product formation
rate. The productivity from an ABE fermentation without ISPR is normally 0.53 g.L-1.h-1, [22] but
according to [21], a productivity of 1.16 g.L-1.h-1 can be obtained using gas stripping and applying a
fed-batch, also values as high as 2.5 were reported by Bankar et al (2012) with the combined effect
of cell immobilization and extraction, [23].
The process flow reduction is achieved by the utilization of more concentrated substrate. In
fermentations severely product-inhibited, like ABE and IBE, there is a tendency to use dilute
substrate solutions since production concentrations as low as 2 % wt can inhibit the reaction. Ezeji et
al. (2003) as reported the use of substrate concentrations up to 162 g.L-1 for ABE fermentation, [24],
and even the use of a fed-batch as concentrated as 500 g.L-1 in 2004, [25]. This higher substrate
concentrations will lead to less dilute product flows and therefore decreases the energy needed in
the downstream product separation.
For last, the yield defined as the total product produced dividing by the substrate consumed, can also
be improved with ISPR techniques since a higher concentration feed allows a greater turnover to
product than biomass formation, relives the microorganism stress by the inhibitory component and
decreases the intercellular maintenance. Yield enhancements as high as 18% have been
experimentally reported [24], [25], [26].
Among the most promising alcohol recovery techniques are gas stripping, steam stripping,
adsorption, liquid-liquid extraction and pervaporation.
10
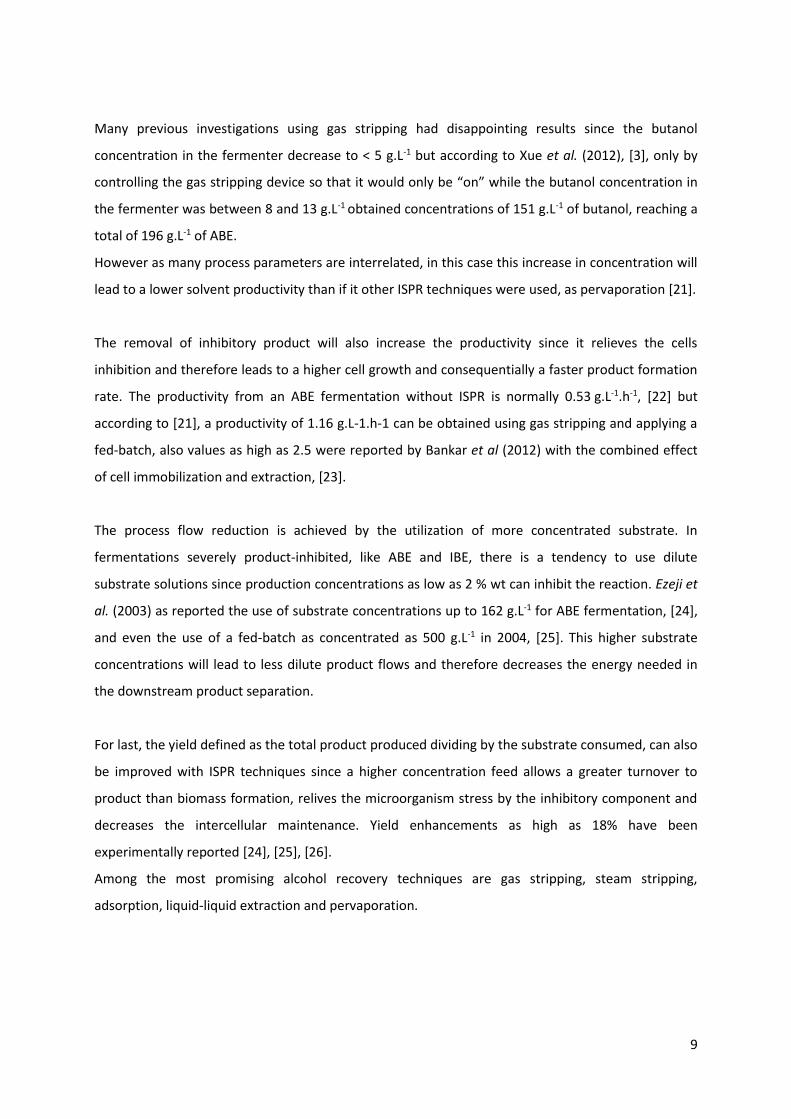
2.2.1 Gas stripping
The option to use an inert gas as the stripping agent and operate at fermenter temperatures
contributes to turn this technique appealing because of its relative simplicity and incapacity to harm
the fermentation culture.
The principle of the process is the stripping agent injection at the fermenter base, parallel to a
countercurrent gas-liquid contactor. The transference of butanol is controlled by the vapor-liquid
equilibrium, so vapor pressure is an important parameter which is highly sensitive to the fermenter
temperature, resulting in a significantly increase of alcohol concentration in the gas after a
temperature mild increase, [19].
To recover the butanol in the gas phase a condenser is used to remove a richer liquid phase, [27],
[28], different units could also be used, such as adsorption, liquid-liquid extraction and membrane
separation, [29], [30]. A multi-step or fractional condensation system could also be used.
The alcohol concentration in the recycle gas must be maintained low enough to effectuate the
butanol removal required. The evaporation and condensation of water is a major parameter since its
energy requirement is 3.86 times that of butanol, [19], so the water title has to be carefully analyzed.
A possible solution is to condense the majority of water at higher temperatures and use a second
condenser at lower temperatures to condensate the alchools.
In the literature, [28], [24], [27], [15], [9] there are several examples of this study that assure gas
stripping as a possible in situ recovery technique, since the volatile products are removed selectively,
eliminating toxicity effects by them, higher sugar utilization of concentrate sugar substrates, greater
biomass concentration in the fermenter and enhanced productivity in overall.
Figure 5. Schematic diagram of a gas stripping process with product recovery by condensation.
11
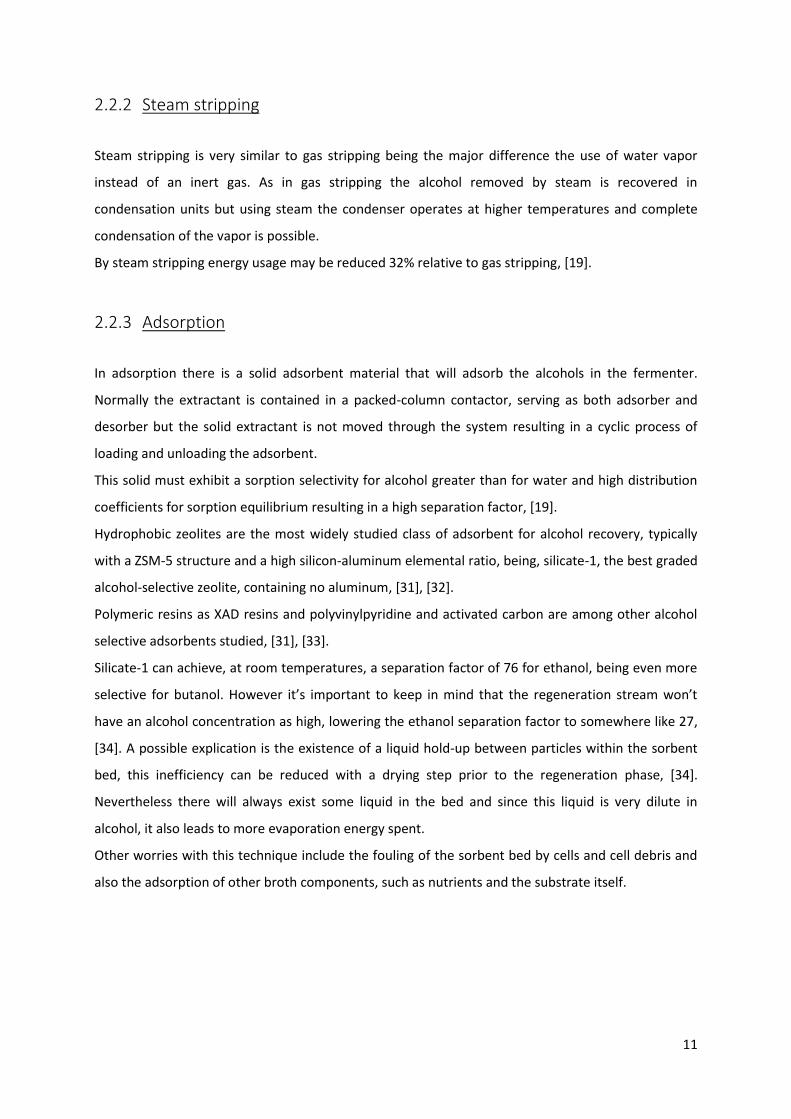
2.2.2 Steam stripping
Steam stripping is very similar to gas stripping being the major difference the use of water vapor
instead of an inert gas. As in gas stripping the alcohol removed by steam is recovered in
condensation units but using steam the condenser operates at higher temperatures and complete
condensation of the vapor is possible.
By steam stripping energy usage may be reduced 32% relative to gas stripping, [19].
2.2.3 Adsorption
In adsorption there is a solid adsorbent material that will adsorb the alcohols in the fermenter.
Normally the extractant is contained in a packed-column contactor, serving as both adsorber and
desorber but the solid extractant is not moved through the system resulting in a cyclic process of
loading and unloading the adsorbent.
This solid must exhibit a sorption selectivity for alcohol greater than for water and high distribution
coefficients for sorption equilibrium resulting in a high separation factor, [19].
Hydrophobic zeolites are the most widely studied class of adsorbent for alcohol recovery, typically
with a ZSM-5 structure and a high silicon-aluminum elemental ratio, being, silicate-1, the best graded
alcohol-selective zeolite, containing no aluminum, [31], [32].
Polymeric resins as XAD resins and polyvinylpyridine and activated carbon are among other alcohol
selective adsorbents studied, [31], [33].
Silicate-1 can achieve, at room temperatures, a separation factor of 76 for ethanol, being even more
selective for butanol. However it’s important to keep in mind that the regeneration stream won’t
have an alcohol concentration as high, lowering the ethanol separation factor to somewhere like 27,
[34]. A possible explication is the existence of a liquid hold-up between particles within the sorbent
bed, this inefficiency can be reduced with a drying step prior to the regeneration phase, [34].
Nevertheless there will always exist some liquid in the bed and since this liquid is very dilute in
alcohol, it also leads to more evaporation energy spent.
Other worries with this technique include the fouling of the sorbent bed by cells and cell debris and
also the adsorption of other broth components, such as nutrients and the substrate itself.
12
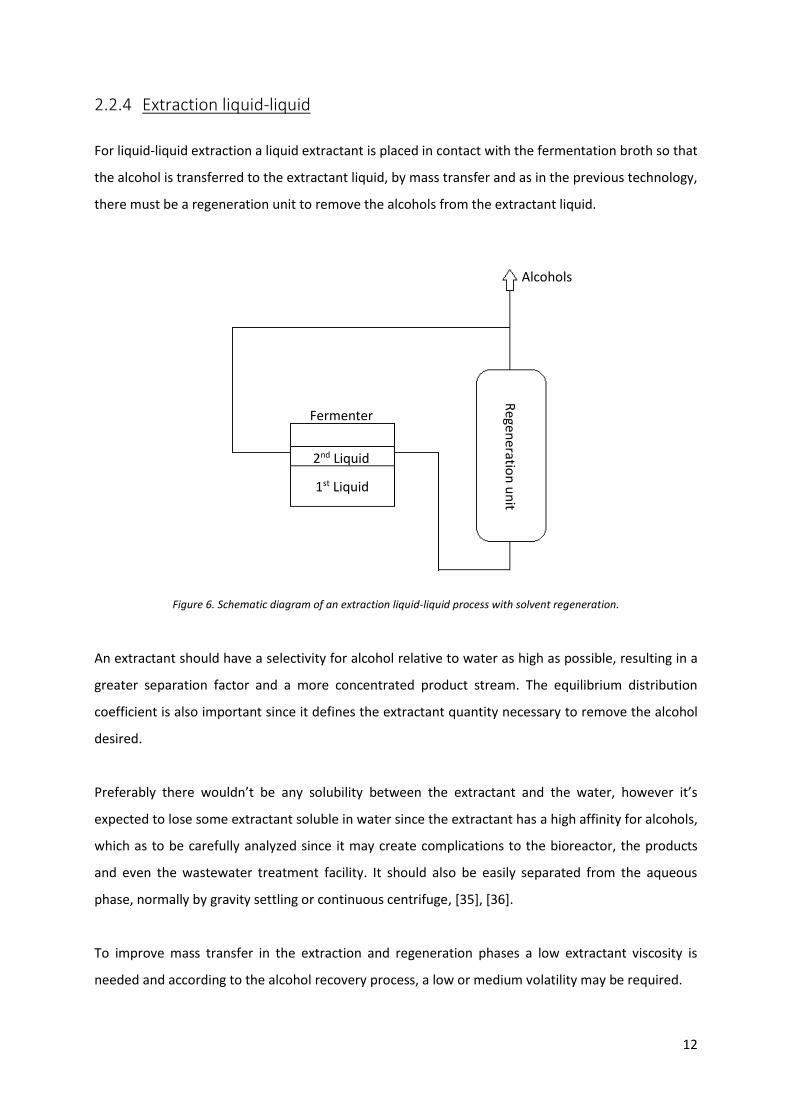
2.2.4 Extraction liquid-liquid
For liquid-liquid extraction a liquid extractant is placed in contact with the fermentation broth so that
the alcohol is transferred to the extractant liquid, by mass transfer and as in the previous technology,
there must be a regeneration unit to remove the alcohols from the extractant liquid.
Figure 6. Schematic diagram of an extraction liquid-liquid process with solvent regeneration.
An extractant should have a selectivity for alcohol relative to water as high as possible, resulting in a
greater separation factor and a more concentrated product stream. The equilibrium distribution
coefficient is also important since it defines the extractant quantity necessary to remove the alcohol
desired.
Preferably there wouldn’t be any solubility between the extractant and the water, however it’s
expected to lose some extractant soluble in water since the extractant has a high affinity for alcohols,
which as to be carefully analyzed since it may create complications to the bioreactor, the products
and even the wastewater treatment facility. It should also be easily separated from the aqueous
phase, normally by gravity settling or continuous centrifuge, [35], [36].
To improve mass transfer in the extraction and regeneration phases a low extractant viscosity is
needed and according to the alcohol recovery process, a low or medium volatility may be required.
Fermenter
2nd Liquid
1st Liquid
Regen
eration
un
it Alcohols
13
A thoughtfully report on the interaction between the extractant and the bioreactor components
must be made, as also for the toxicity that it may represent in wastewater and air releases. Other
security criteria’s must also be achieved to ensure the process safety, as flammability, flash point and
reactivity with other process compounds, [35], [36].
For last, the cost of the liquid extractant must also be analyzed since, due to process losses, some
fresh addition will be needed periodically.
For the regeneration step the most common methods are: vacuum flash vaporization, distillation, gas
stripping and membrane-based pervaporation, also normally there is a condensation step and in the
case of butanol a decanter operation. In order to achieve the higher regeneration possible the
distribution coefficient for alcohol between a gas phase and the liquid must increase with increasing
temperature so that the tendency of the alcohol to leave the extractant phase is greater, [37].
The regeneration phase must be efficient enough to at least reduce the alcohol concentration to the
value which would be in equilibrium with the treated liquid concentration. In this way the extraction
a regeneration efficiencies are deeply related and as greater the efficiency, bigger the energy
demand and capital costs.
An advantage from this technology is the little thermal energy involved since in the extraction both
phases are liquid and the separation occurs by mass transfer, allowing to be used at fermenter
temperatures. The energy demand is due to the extractant regeneration phase and as a first
approximation may be considered as the energy required to evaporate the alcohol and water from
the extractant. The alcohol distribution coefficient will also affect the energy demand since higher
coefficients means a lower extractant-feed ratio, [19].
To sum up, ISPR systems may allow a more concentrated stream as feed for the distillation train, thus
reducing energy consumptions as well as investment and operational costs. Furthermore these
techniques can present some other advantages over the traditional “straight forward” scheme. This
may be the systematic removal of product which reduces microbial inhibition, and thus improves
solvent yield and productivity and the fermentation broth is more concentrated, generating less
wastewater.
14
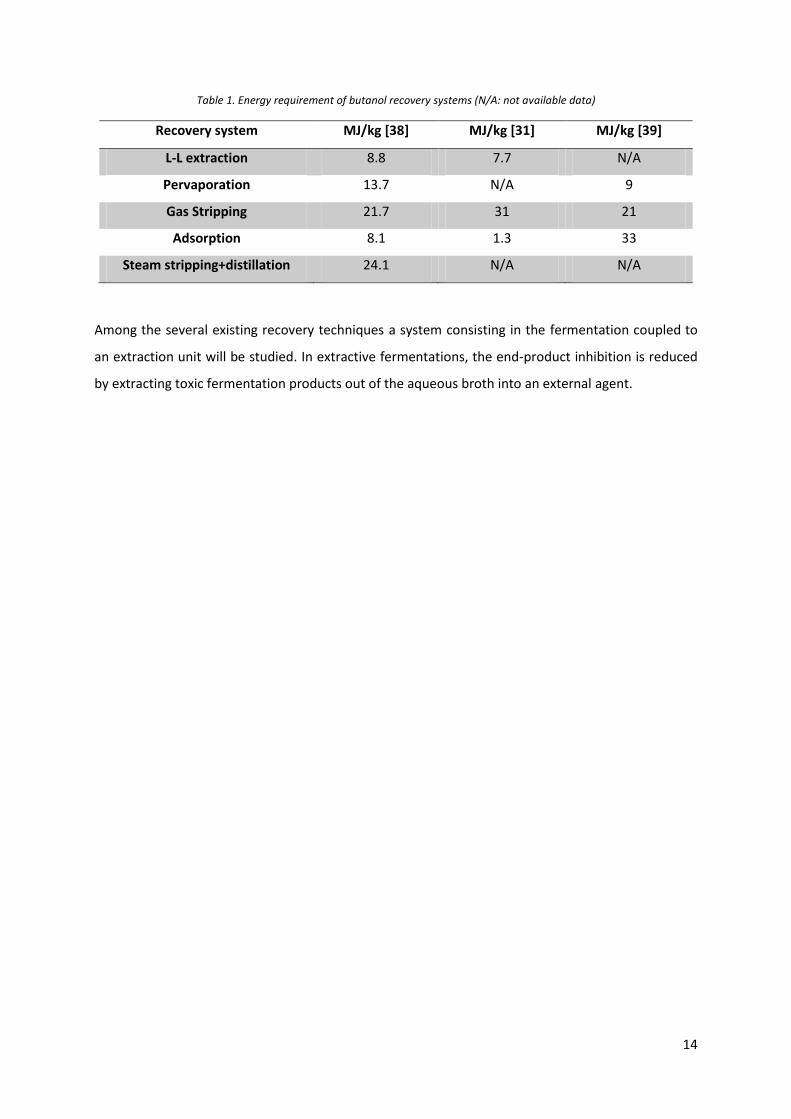
Table 1. Energy requirement of butanol recovery systems (N/A: not available data)
Recovery system MJ/kg [38] MJ/kg [31] MJ/kg [39]
L-L extraction 8.8 7.7 N/A
Pervaporation 13.7 N/A 9
Gas Stripping 21.7 31 21
Adsorption 8.1 1.3 33
Steam stripping+distillation 24.1 N/A N/A
Among the several existing recovery techniques a system consisting in the fermentation coupled to
an extraction unit will be studied. In extractive fermentations, the end-product inhibition is reduced
by extracting toxic fermentation products out of the aqueous broth into an external agent.
15
3 Methodology
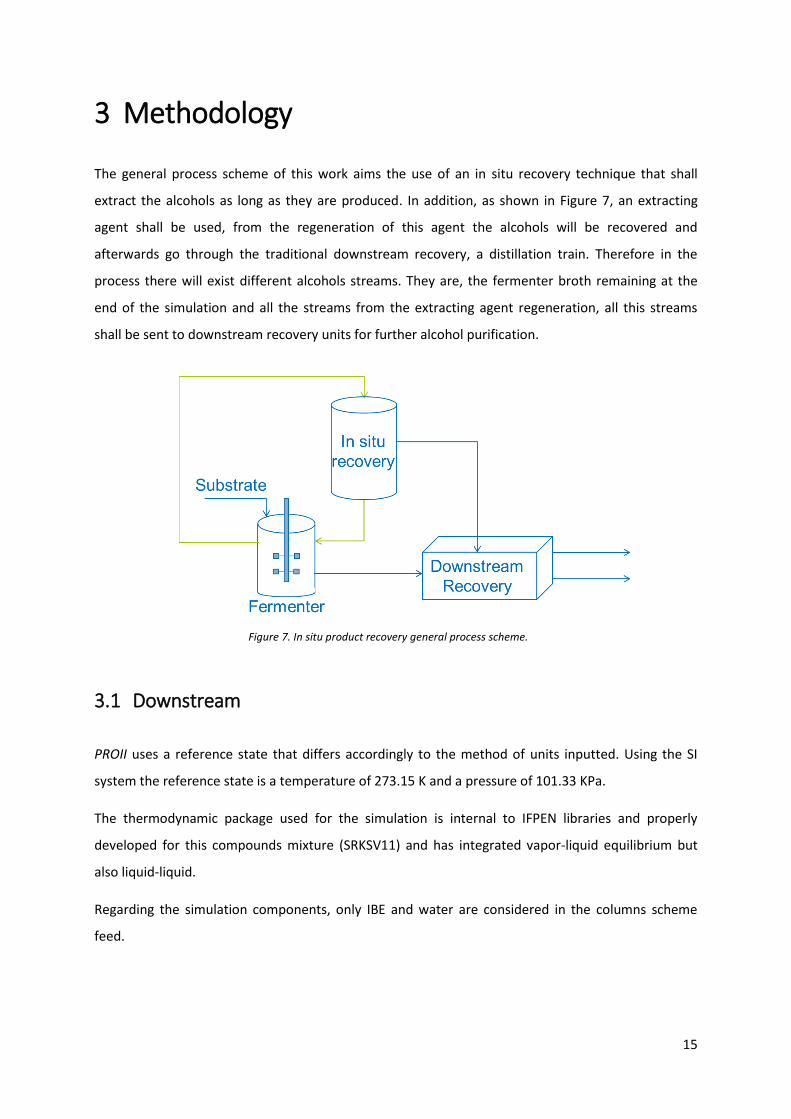
The general process scheme of this work aims the use of an in situ recovery technique that shall
extract the alcohols as long as they are produced. In addition, as shown in Figure 7, an extracting
agent shall be used, from the regeneration of this agent the alcohols will be recovered and
afterwards go through the traditional downstream recovery, a distillation train. Therefore in the
process there will exist different alcohols streams. They are, the fermenter broth remaining at the
end of the simulation and all the streams from the extracting agent regeneration, all this streams
shall be sent to downstream recovery units for further alcohol purification.
3.1 Downstream
PROII uses a reference state that differs accordingly to the method of units inputted. Using the SI
system the reference state is a temperature of 273.15 K and a pressure of 101.33 KPa.
The thermodynamic package used for the simulation is internal to IFPEN libraries and properly
developed for this compounds mixture (SRKSV11) and has integrated vapor-liquid equilibrium but
also liquid-liquid.
Regarding the simulation components, only IBE and water are considered in the columns scheme
feed.
Figure 7. In situ product recovery general process scheme.
16
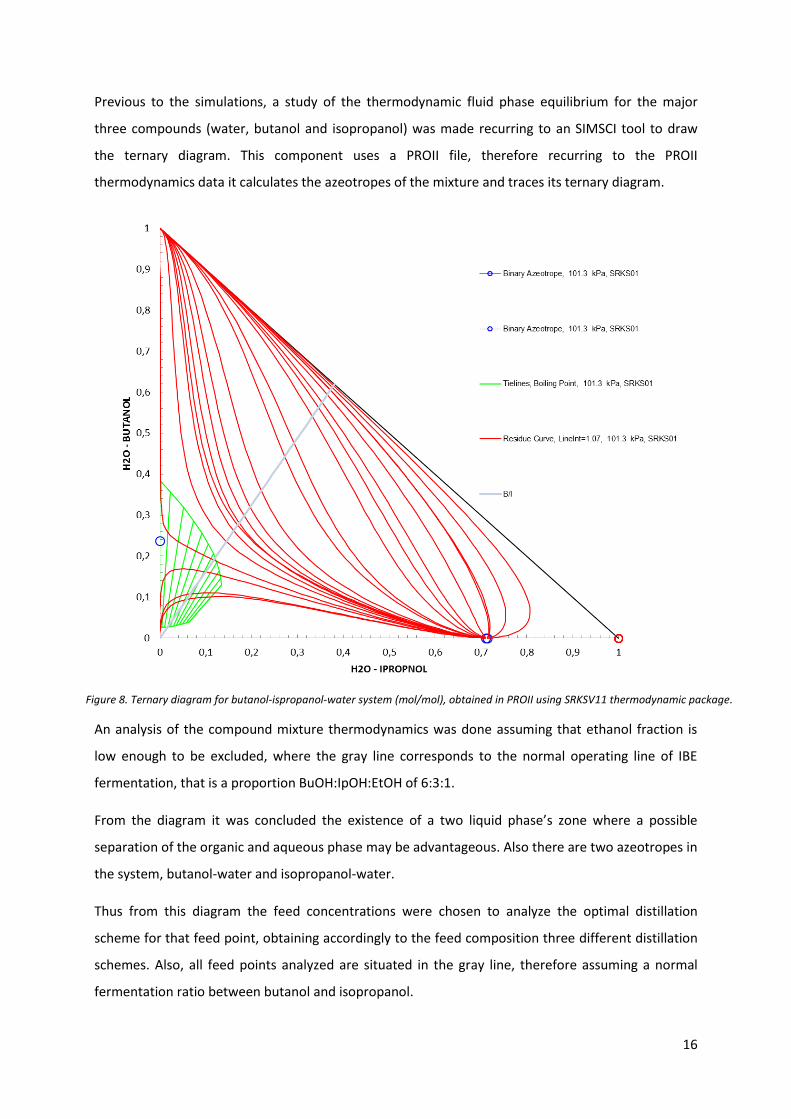
Previous to the simulations, a study of the thermodynamic fluid phase equilibrium for the major
three compounds (water, butanol and isopropanol) was made recurring to an SIMSCI tool to draw
the ternary diagram. This component uses a PROII file, therefore recurring to the PROII
thermodynamics data it calculates the azeotropes of the mixture and traces its ternary diagram.
An analysis of the compound mixture thermodynamics was done assuming that ethanol fraction is
low enough to be excluded, where the gray line corresponds to the normal operating line of IBE
fermentation, that is a proportion BuOH:IpOH:EtOH of 6:3:1.
From the diagram it was concluded the existence of a two liquid phase’s zone where a possible
separation of the organic and aqueous phase may be advantageous. Also there are two azeotropes in
the system, butanol-water and isopropanol-water.
Thus from this diagram the feed concentrations were chosen to analyze the optimal distillation
scheme for that feed point, obtaining accordingly to the feed composition three different distillation
schemes. Also, all feed points analyzed are situated in the gray line, therefore assuming a normal
fermentation ratio between butanol and isopropanol.
Figure 8. Ternary diagram for butanol-ispropanol-water system (mol/mol), obtained in PROII using SRKSV11 thermodynamic package.
17
3.1.1 DSLC
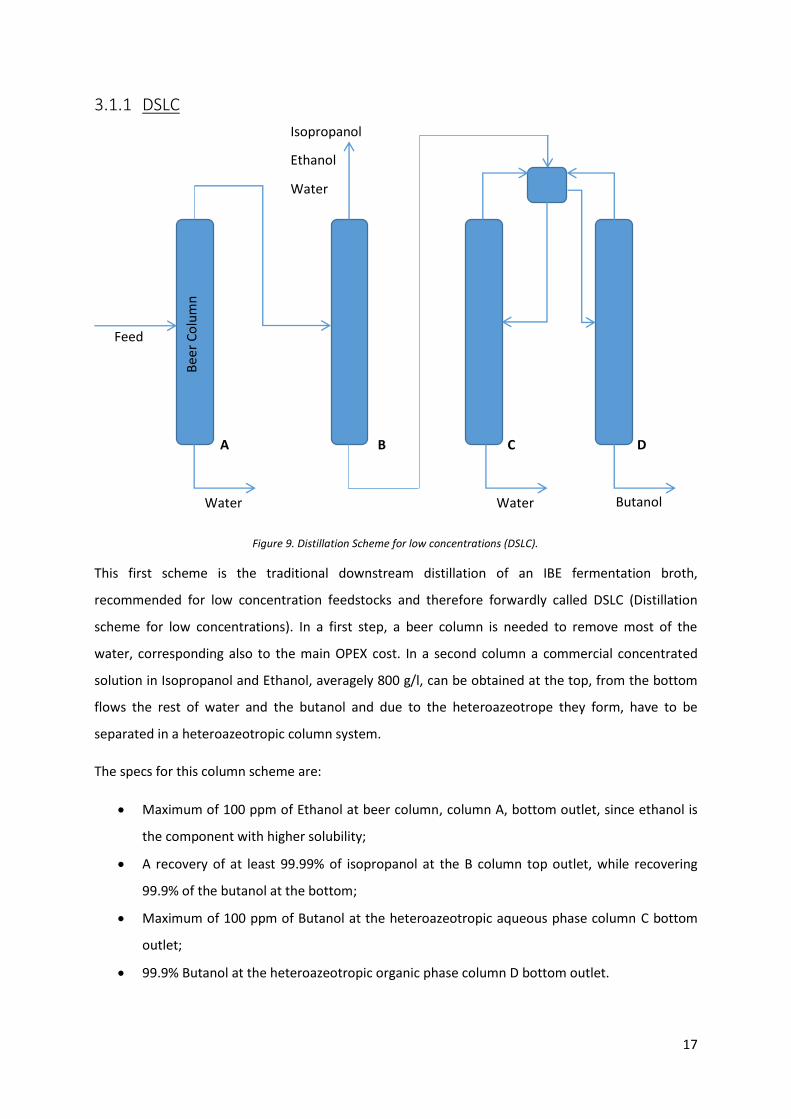
This first scheme is the traditional downstream distillation of an IBE fermentation broth,
recommended for low concentration feedstocks and therefore forwardly called DSLC (Distillation
scheme for low concentrations). In a first step, a beer column is needed to remove most of the
water, corresponding also to the main OPEX cost. In a second column a commercial concentrated
solution in Isopropanol and Ethanol, averagely 800 g/l, can be obtained at the top, from the bottom
flows the rest of water and the butanol and due to the heteroazeotrope they form, have to be
separated in a heteroazeotropic column system.
The specs for this column scheme are:
Maximum of 100 ppm of Ethanol at beer column, column A, bottom outlet, since ethanol is
the component with higher solubility;
A recovery of at least 99.99% of isopropanol at the B column top outlet, while recovering
99.9% of the butanol at the bottom;
Maximum of 100 ppm of Butanol at the heteroazeotropic aqueous phase column C bottom
outlet;
99.9% Butanol at the heteroazeotropic organic phase column D bottom outlet.
Feed
Water
Isopropanol
Ethanol
Water
Butanol Water
Bee
r C
olu
mn
A B C D
Figure 9. Distillation Scheme for low concentrations (DSLC).
18
3.1.2 DSHC
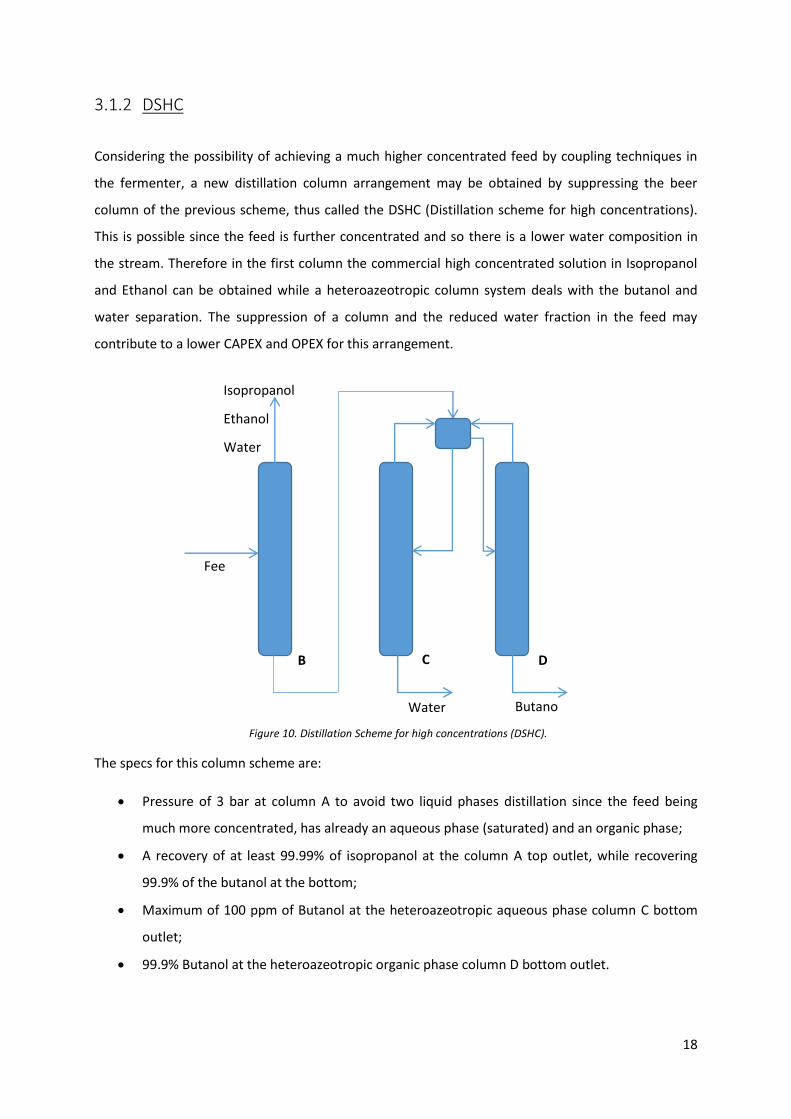
Considering the possibility of achieving a much higher concentrated feed by coupling techniques in
the fermenter, a new distillation column arrangement may be obtained by suppressing the beer
column of the previous scheme, thus called the DSHC (Distillation scheme for high concentrations).
This is possible since the feed is further concentrated and so there is a lower water composition in
the stream. Therefore in the first column the commercial high concentrated solution in Isopropanol
and Ethanol can be obtained while a heteroazeotropic column system deals with the butanol and
water separation. The suppression of a column and the reduced water fraction in the feed may
contribute to a lower CAPEX and OPEX for this arrangement.
The specs for this column scheme are:
Pressure of 3 bar at column A to avoid two liquid phases distillation since the feed being
much more concentrated, has already an aqueous phase (saturated) and an organic phase;
A recovery of at least 99.99% of isopropanol at the column A top outlet, while recovering
99.9% of the butanol at the bottom;
Maximum of 100 ppm of Butanol at the heteroazeotropic aqueous phase column C bottom
outlet;
99.9% Butanol at the heteroazeotropic organic phase column D bottom outlet.
Figure 10. Distillation Scheme for high concentrations (DSHC).
Fee
d
Isopropanol
Ethanol
Water
Butano
l
Water
B C D
19
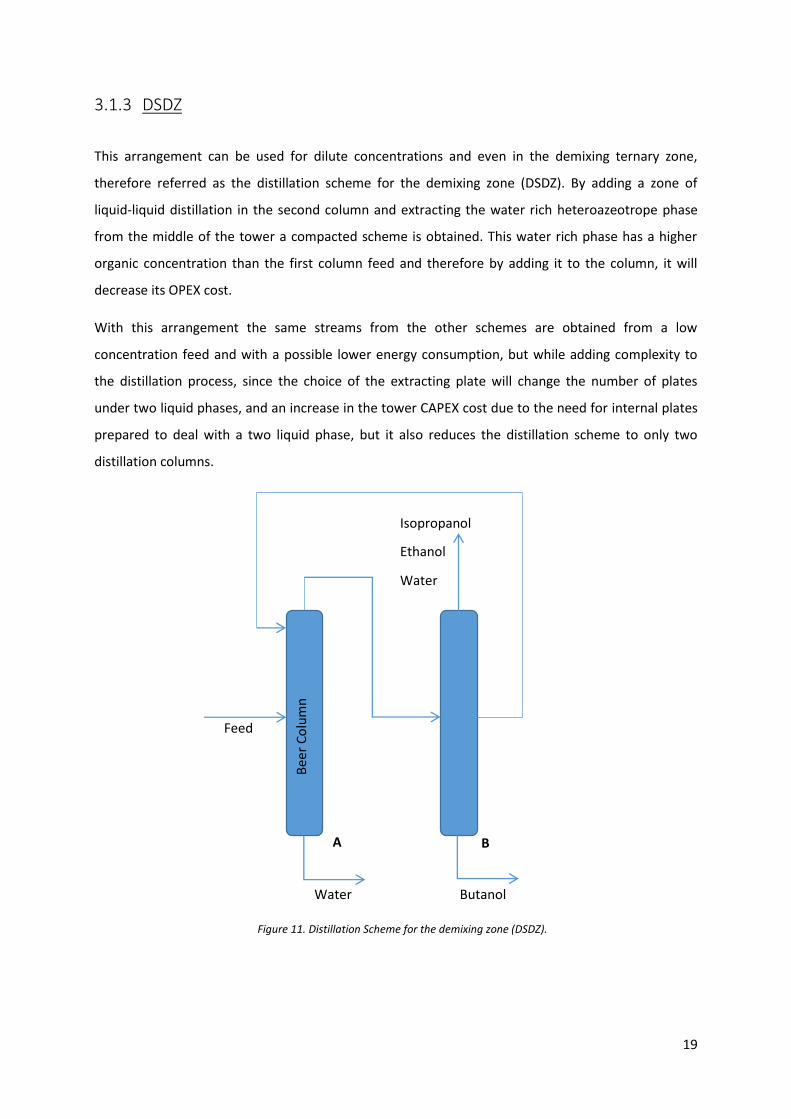
3.1.3 DSDZ
This arrangement can be used for dilute concentrations and even in the demixing ternary zone,
therefore referred as the distillation scheme for the demixing zone (DSDZ). By adding a zone of
liquid-liquid distillation in the second column and extracting the water rich heteroazeotrope phase
from the middle of the tower a compacted scheme is obtained. This water rich phase has a higher
organic concentration than the first column feed and therefore by adding it to the column, it will
decrease its OPEX cost.
With this arrangement the same streams from the other schemes are obtained from a low
concentration feed and with a possible lower energy consumption, but while adding complexity to
the distillation process, since the choice of the extracting plate will change the number of plates
under two liquid phases, and an increase in the tower CAPEX cost due to the need for internal plates
prepared to deal with a two liquid phase, but it also reduces the distillation scheme to only two
distillation columns.
Figure 11. Distillation Scheme for the demixing zone (DSDZ).
Feed
Water
Isopropanol
Ethanol
Water
Butanol
Bee
r C
olu
mn
A B
20
The specs for this column scheme are:
0.01% Butanol at the column B top outlet;
Existence of an extraction plate to remove a second liquid phase with an organics
concentration higher than fond in the feed.
0.01% Water at the column B bottom outlet.
3.2 Coupling techniques
As in situ alcohol removal techniques, the exploration of gas stripping and liquid-liquid extraction was
made. For that, 4 different process diagrams were studied with fixed parameters and a batch and fed
batch case were studied.
For each process diagram, a dynamic simulation was obtained in order to compare energy
consumption and product improvement over a common basis. For this, a simplified fermentation
kinetics model was used based on ABE fermentation literature. This model, whose aim is the dynamic
prediction of each metabolite evolution (except from fermentation gas) is developed in the next
pages and describes both phases of IBE fermentation (see section “State of Art“).
Recovery of alcohol thermodynamics and its energy consumption was achieved by using a
commercial software, Simulis by Prosim, FR, which as a developed thermodynamics package for IBE
components. In this software, just as Aspen or PROII, the main input is selecting the process
compounds, after that, Simulis can be called in excel recurring to a Simulis supplement called
“Calculators”. This “Calculators”, according to their name, can be used as excel functions to calculate
various thermodynamics calculations and therefore preview the process simulation.
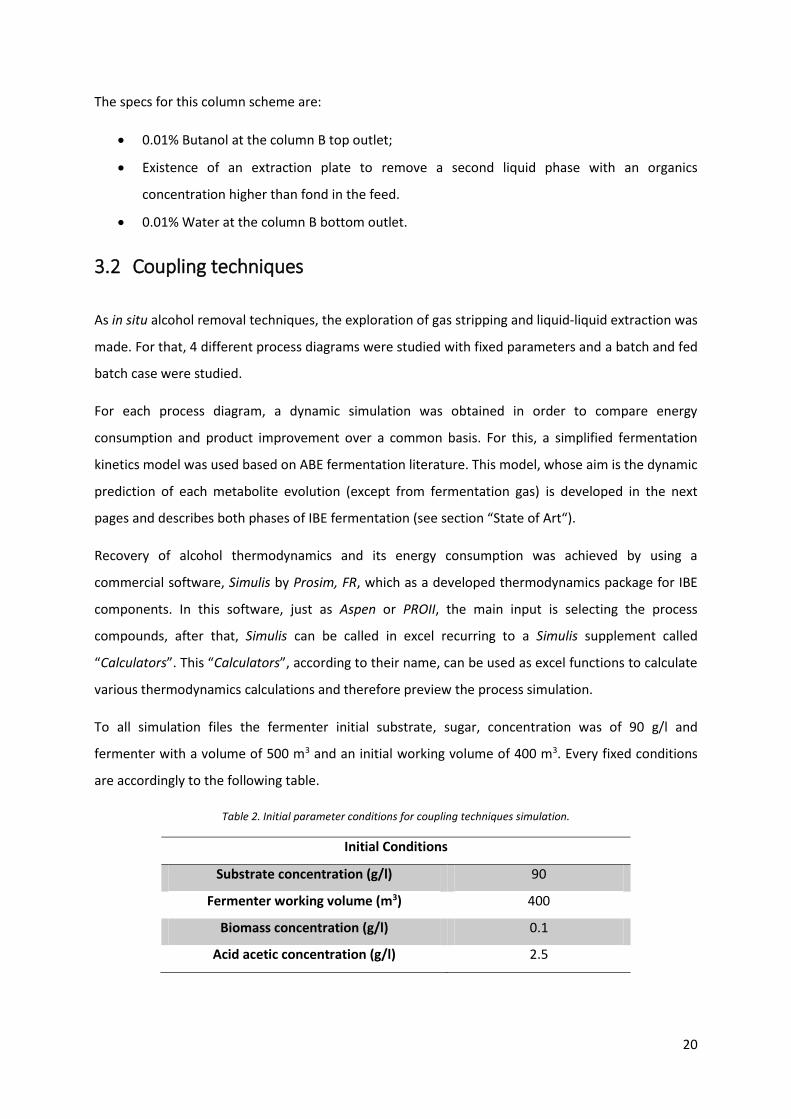
To all simulation files the fermenter initial substrate, sugar, concentration was of 90 g/l and
fermenter with a volume of 500 m3 and an initial working volume of 400 m3. Every fixed conditions
are accordingly to the following table.
Table 2. Initial parameter conditions for coupling techniques simulation.
Initial Conditions
Substrate concentration (g/l) 90
Fermenter working volume (m3) 400
Biomass concentration (g/l) 0.1
Acid acetic concentration (g/l) 2.5
21
Batch dynamic simulations end when the substrate concentration reaches zero since by then the
alcohol production will no longer continue, except for remaining acids conversion.
For the fed batch case study, for comparison reasons, a fixed substrate consumption was made as
the substrate addition equivalent to a concentration of 500 g/l referred to the initial fermenter
volume. This substrate addition is activated when the sugar concentration in the fermenter reaches
10 g/l during the dynamic simulation and, in process terms, is made as an addition of an highly sugar
concentrated solution (500 g/l) in the fermenter to maintain a minimum of 10 g/l in the fermenter.
This feed rate was fixed as 5% of the initial fermenter volume.
Lastly general assumptions have also been made:
No CO2 formation;
No acids, biomass or substrate transfer to the gas or solvent;
No heat loss in the process;
No heat of reaction in the fermenter;
No formation entalpies;
No solution entalpies.
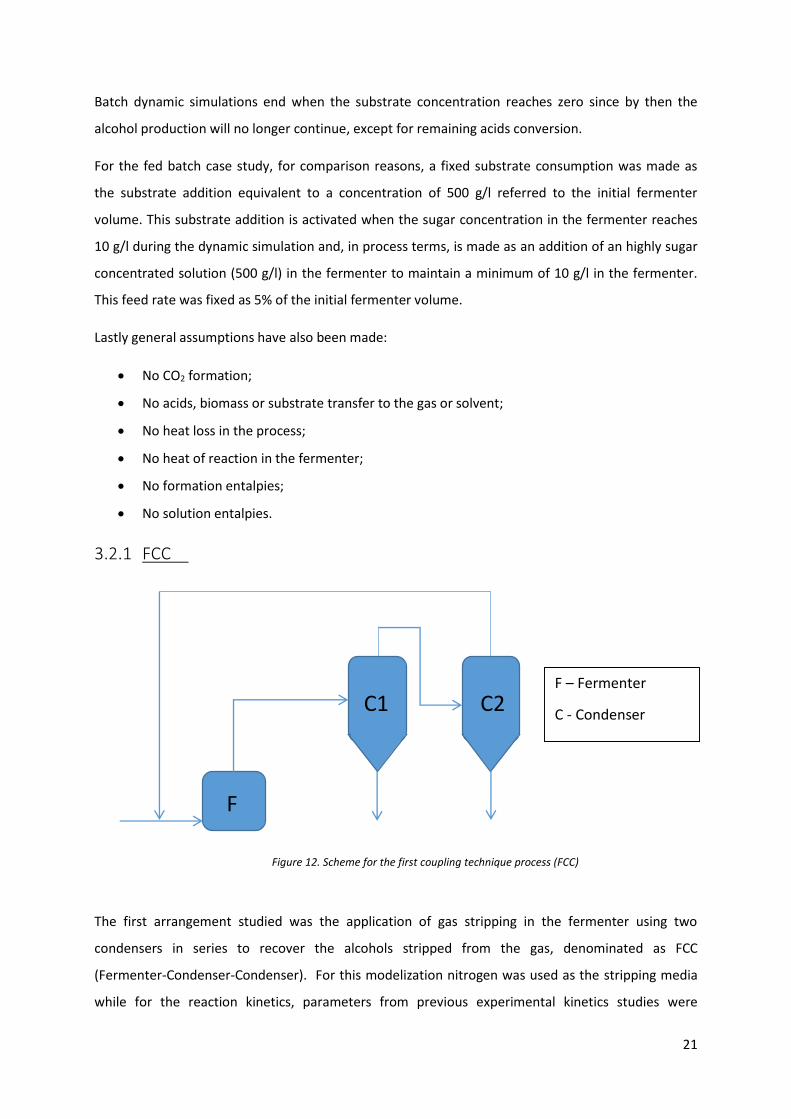
3.2.1 FCC
The first arrangement studied was the application of gas stripping in the fermenter using two
condensers in series to recover the alcohols stripped from the gas, denominated as FCC
(Fermenter-Condenser-Condenser). For this modelization nitrogen was used as the stripping media
while for the reaction kinetics, parameters from previous experimental kinetics studies were
Figure 12. Scheme for the first coupling technique process (FCC)
F
C1 C2 F – Fermenter
C - Condenser
22
available. With this the fermentation model could be easily constructed by writing the code for mass
balance.
The first step reaction is the formation of the butyl and acetic acids by sugar conversion.
𝑑𝑆
𝑑𝑡= −𝑘1µ𝑋−𝑘2
𝑆
𝑆 + 𝐾𝑆
𝐶𝐴𝐵
𝐶𝐴𝐵 + 𝐾𝐴𝐵𝑋−𝑘3
𝑆
𝑆 + 𝐾𝑆
𝐶𝐴𝐴
𝐶𝐴𝐴 + 𝐾𝐴𝐴𝑋 Equation 3. 1
Where 𝑆 is the sugar concentration in the fermenter (g/l), 𝑋 the biomass concentration (g/l), 𝐶𝐴𝐵 is
the concentration of butyric acid (g/l) and 𝐶𝐴𝐴 the acetic acid concentration (g/l). The remaining are
kinetic parameter that can be found in the Table A. 1. While that, µ, h-1, is the growth velocity
function that can be calculated as:
µ = µ𝑚𝑎𝑥
𝑆
𝑆 + 𝐾𝑆
(𝑖𝑛𝑏) Equation 3. 2
Therefore the grow velocity function depends on the maximum growth velocity, µ𝑚𝑎𝑥, h-1, the sugar
concentration and a function of inhibition, (𝑖𝑛𝑏).
𝑖𝑛𝑏 = 1 − (𝐶𝐴𝐵
𝐶𝐴𝐵𝑚𝑎𝑥)
𝑚𝐴𝐵
(𝐶𝐴𝐴
𝐶𝐴𝐴𝑚𝑎𝑥)
𝑚𝐴𝐴
(𝐶𝐵𝑢𝑂𝐻
𝐶𝐵𝑢𝑂𝐻𝑚𝑎𝑥 )
𝑚𝐵𝑢𝑂𝐻
(𝐶𝐼𝑝𝑂𝐻
𝐶𝐼𝑝𝑂𝐻𝑚𝑎𝑥 )
𝑚𝐼𝑝𝑂𝐻
(𝐶𝐸𝑡𝑂𝐻
𝐶𝐸𝑡𝑂𝐻𝑚𝑎𝑥 )
𝑚𝐸𝑡𝑂𝐻
Equation 3. 3
Regarding the inhibition function, it only depends on the concentration of the acids, 𝐶𝐴𝐵, 𝐶𝐴𝐴, and
organics, 𝐶𝐵𝑢𝑂𝐻, 𝐶𝐼𝑝𝑂𝐻, 𝐶𝐸𝑡𝑂𝐻 , in the fermenter. The remaining are all fixed parameters in the Table
A. 2.
The biomass concentration evolution also has to be calculated, being a function of the growth
velocity, µ, and the biomass concentration itself, 𝑋.
𝑑𝑋
𝑑𝑡= 𝑘1µ𝑋 Equation 3. 4
With all this the acids productions can then be calculated as:
𝑑𝐶𝐴𝐵
𝑑𝑡= 𝑘4𝑘1µ𝑋 − 𝑠𝑖𝑔 × 𝑘5
𝑆
𝑆 + 𝐾𝑆
𝐶𝐴𝐵
𝐶𝐴𝐵 + 𝐾𝐴𝐵𝑋 Equation 3. 5
𝑑𝐶𝐴𝐴
𝑑𝑡= 𝑘9𝑘1µ𝑋 − 𝑠𝑖𝑔 × 𝑘10
𝑆
𝑆 + 𝐾𝑆
𝐶𝐴𝐴
𝐶𝐴𝐴 + 𝐾𝐴𝐴𝑋 Equation 3. 6
23
Where sig is a simple function to simulate a physiologic state of the cellule and is calculated as:
𝑠𝑖𝑔 =𝑚𝑎𝑥[0, 𝑎𝑏𝑠(𝐶𝐴𝐵 − 𝐶𝐴𝐵,𝑐𝑟𝑖𝑡𝑖𝑐)]
𝜙 + 𝑚𝑎𝑥[0, 𝑎𝑏𝑠(𝐶𝐴𝐵 − 𝐶𝐴𝐵,𝑐𝑟𝑖𝑡𝑖𝑐)] Equation 3. 7
The critic butyric acid, 𝐶𝐴𝐵,𝑐𝑟𝑖𝑡𝑖𝑐, from where henceforward the butanol and ethanol production shall
begin, and 𝜙 are parameters fixed accordingly to the constant simulation parameters table in the
Table A. 3.
With this equation it is avoided the mathematic discontinuity of simply implying:
𝑆𝑖𝑔 = 0 if 𝐶𝐴𝐵,𝑎𝑞 < 𝐶𝐴𝐵,𝑐𝑟𝑖𝑡𝑖𝑐 Equation 3. 8
𝑆𝑖𝑔 = 1 if 𝐶𝐴𝐵,𝑎𝑞 ≥ 𝐶𝐴𝐵,𝑐𝑟𝑖𝑡𝑖𝑐 Equation 3. 9
After the inclusion of the acid production calculations, follows the equations related to the alcohols
production.
𝑑𝐶𝐵𝑢𝑂𝐻
𝑑𝑡= 𝑠𝑖𝑔 × (𝑘6𝑘1µ𝑋 + 𝑘7
𝑆
𝑆 + 𝐾𝑆
𝐶𝐴𝐵
𝐶𝐴𝐵 + 𝐾𝐴𝐵𝑋) Equation 3. 10
𝑑𝐶𝐼𝑝𝑂𝐻
𝑑𝑡= 𝑠𝑖𝑔 × 𝑘11𝑘1µ𝑋 + 𝑘12
𝑆
𝑆 + 𝐾𝑆
𝐶𝐴𝐴
𝐶𝐴𝐴 + 𝐾𝐴𝐴𝑋 Equation 3. 11
𝑑𝐶𝐸𝑡𝑂𝐻
𝑑𝑡= 𝑠𝑖𝑔 × 𝑘8𝑘1µ𝑋 Equation 3. 12
In all this equations there is a term related to the bacteria growth, recurring to the growth velocity,µ
and the biomass concentration, 𝑋. There is also another term that is dependent on the substrate
concentration and the acids concentration, in the case of butanol the butyric acid, 𝐶𝐴𝐵 and for the
isopropanol the acetic acid, 𝐶𝐴𝐴. Yet again, the remaining fixed parameters can be found in the Table
A. 1.
With all the previous equations the fermentation reactions can be simulated. Therefore what is
missing are the process calculations. For that, the gas flowrate can be calculated as follows if it is
considered that there is no N2 gas lost in the fermenter liquid. Also for the initial gas flow rate a vvm
of 2 liters of nitrogen per liter of water and per hour is assumed.
24
𝑄𝑔𝑎𝑠𝑖𝑛
𝑖+1= 𝑄𝑔𝑎𝑠
𝑖𝑛𝑖
∗𝑦𝑁2
𝑖𝑛
𝑖+1
𝑦𝑁2
𝑜𝑢𝑡
𝑖+1
Equation 3. 13
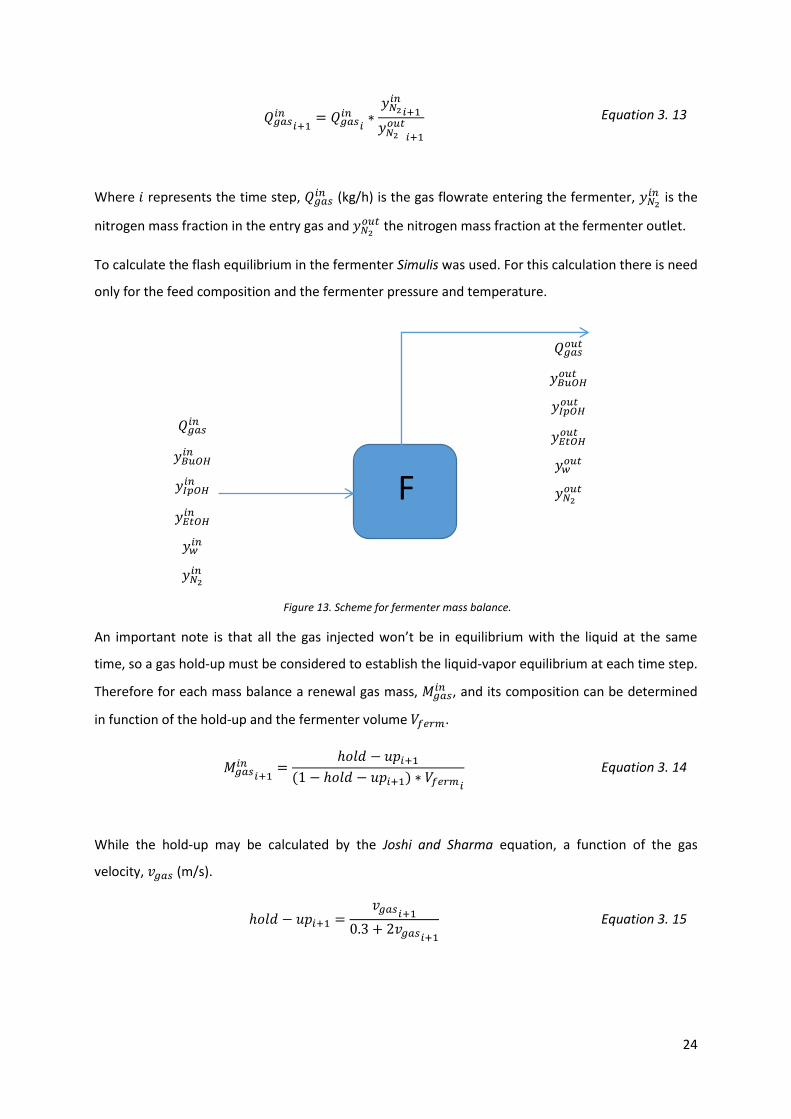
Where 𝑖 represents the time step, 𝑄𝑔𝑎𝑠𝑖𝑛 (kg/h) is the gas flowrate entering the fermenter, 𝑦𝑁2
𝑖𝑛 is the
nitrogen mass fraction in the entry gas and 𝑦𝑁2
𝑜𝑢𝑡 the nitrogen mass fraction at the fermenter outlet.
To calculate the flash equilibrium in the fermenter Simulis was used. For this calculation there is need
only for the feed composition and the fermenter pressure and temperature.
An important note is that all the gas injected won’t be in equilibrium with the liquid at the same
time, so a gas hold-up must be considered to establish the liquid-vapor equilibrium at each time step.
Therefore for each mass balance a renewal gas mass, 𝑀𝑔𝑎𝑠𝑖𝑛 , and its composition can be determined
in function of the hold-up and the fermenter volume 𝑉𝑓𝑒𝑟𝑚.
𝑀𝑔𝑎𝑠𝑖𝑛
𝑖+1=
ℎ𝑜𝑙𝑑 − 𝑢𝑝𝑖+1
(1 − ℎ𝑜𝑙𝑑 − 𝑢𝑝𝑖+1) ∗ 𝑉𝑓𝑒𝑟𝑚𝑖
Equation 3. 14
While the hold-up may be calculated by the Joshi and Sharma equation, a function of the gas
velocity, 𝑣𝑔𝑎𝑠 (m/s).
ℎ𝑜𝑙𝑑 − 𝑢𝑝𝑖+1 =𝑣𝑔𝑎𝑠𝑖+1
0.3 + 2𝑣𝑔𝑎𝑠𝑖+1
Equation 3. 15
𝑄𝑔𝑎𝑠𝑖𝑛
𝑦𝐵𝑢𝑂𝐻𝑖𝑛
𝑦𝐼𝑝𝑂𝐻𝑖𝑛
𝑦𝐸𝑡𝑂𝐻𝑖𝑛
𝑦𝑤𝑖𝑛
𝑦𝑁2
𝑖𝑛
F
𝑄𝑔𝑎𝑠𝑜𝑢𝑡
𝑦𝐵𝑢𝑂𝐻𝑜𝑢𝑡
𝑦𝐼𝑝𝑂𝐻𝑜𝑢𝑡
𝑦𝐸𝑡𝑂𝐻𝑜𝑢𝑡
𝑦𝑤𝑜𝑢𝑡
𝑦𝑁2
𝑜𝑢𝑡
Figure 13. Scheme for fermenter mass balance.
25
This gas retention is normal to all bubble flow agitated reactions and associated to this, a level
expansions has to be maintained so that the total fermenter volume is lower than its volume,
otherwise the working volume must change.
Where the gas velocity is easily calculated considering the fermenter base area, 𝐴𝑓𝑒𝑟𝑚 in m2.
𝑣𝑔𝑎𝑠𝑖+1= 𝑄𝑔𝑎𝑠
𝑖𝑛𝑖+𝑖
/𝐴𝑓𝑒𝑟𝑚 Equation 3. 16
After this calculations, the total mass in the fermenter, 𝑇𝑓𝑒𝑟𝑚𝑒𝑛𝑡𝑒𝑟 (g), at any time may be calculated
as follows.
𝑇𝑓𝑒𝑟𝑚𝑖+1= 𝑄𝑔𝑎𝑠
𝑖𝑛𝑖+1
+ 𝑉𝑓𝑒𝑟𝑚𝑖∗ (𝐶𝐵𝑢𝑂𝐻𝑖
+ 𝐶𝐼𝑝𝑂𝐻𝑖+ 𝐶𝐸𝑡𝑂𝐻𝑖
) + 𝑉𝑓𝑒𝑟𝑚𝑖∗ 𝜌𝑤 Equation 3. 17
The fermenter broth density is assumed as the same of water, 𝜌𝑤.Its composition could then be
calculated for all components, Equation 3. 18 shows the example for butanol, where 𝑥𝐵𝑢𝑂𝐻𝑓𝑒𝑟𝑚
is the
butanol mass fraction in the fermenter and 𝑦𝐵𝑢𝑂𝐻𝑖𝑛 the butanol mass fraction in the gas entering the
fermenter.
𝑥𝐵𝑢𝑂𝐻𝑓𝑒𝑟𝑚
𝑖+1=
𝑄𝑔𝑎𝑠𝑖𝑛
𝑖+1∗ 𝑦𝐵𝑢𝑂𝐻
𝑖𝑛𝑖+1
+ 𝑉𝑓𝑒𝑟𝑚𝑖∗ 𝐶𝐵𝑢𝑂𝐻𝑖
𝑇𝑓𝑒𝑟𝑚𝑖+1
Equation 3. 18
Simulis calculates the gas-liquid equilibrium from the fermenter composition and returns the gas
phase and liquid phase composition, resulted from the gas stripping.
Therefore the gas outlet, 𝑄𝑔𝑎𝑠𝑜𝑢𝑡 (kg/h), may be calculated as:
𝑄𝑔𝑎𝑠𝑜𝑢𝑡
𝑖+1= 𝑄𝑔𝑎𝑠
𝑖𝑛𝑖+1
∗𝑦𝑁2
𝑖𝑛
𝑖+1
𝑦𝑁2
𝑜𝑢𝑡
𝑖+1
Equation 3. 19
Then for the condensation steps the only necessary calculations are similar to the ones done until
now, that is, feed composition calculation to undergo a flash at condenser temperature and
pressure, which results in the liquid and gas composition obtained. The gas and liquid flow rate may
be calculated as Equation 3. 20 and Equation 3. 21.
𝐺𝑖+1 = 𝑇𝑐𝑜𝑛𝑑𝑖+1
(𝑦𝑁2
𝑖𝑛
𝑖+1− 𝑥𝑁2
𝑜𝑢𝑡
𝑖+1)
(𝑦𝑁2
𝑜𝑢𝑡
𝑖+1− 𝑥𝑁2
𝑜𝑢𝑡
𝑖+1)
Equation 3. 20
26
𝑙𝑖+1 = 𝑇𝑐𝑜𝑛𝑑𝑖+1− 𝐺𝑖+1 Equation 3. 21
Where 𝐺 is the gas mass flowrate from the condenser in g, 𝑇𝑐𝑜𝑛𝑑 the total mass in the condenser in
g, 𝑦𝑁2
𝑖𝑛 the mass fraction of nitrogen entering the condenser, 𝑥𝑁2
𝑜𝑢𝑡 the mass fraction of nitrogen in the
condensate and 𝑦𝑁2
𝑜𝑢𝑡 the mass fraction of nitrogen in the gas leaving the condenser.
The condenser conditions are in the following table.
Table 3. Work conditions for the condenser in FCC process scheme.
Condenser Temperature (°C) Pressure (bar)
C1 4 1.013
C2 -15 1.013
The alcohols recovered from the gas may then be calculated from the liquid flow rate and
composition, Equation 3. 22 shows the example of this calculation for butanol, being 𝑙𝐵𝑢𝑂𝐻 the mass
of butanol in the condensate (g) and 𝑥𝐵𝑢𝑂𝐻𝑜𝑢𝑡 the mass fraction of butanol in the condensate.
𝑙𝐵𝑢𝑂𝐻𝑖+1= 𝑙𝑖+1 ∗ 𝑥𝐵𝑢𝑂𝐻
𝑜𝑢𝑡𝑖+1
Equation 3. 22
Furthermore having the condensate streams determined two different concentration calculations for
each organic component may be made:
1. A concentration determined by the accumulation of alcohol recovered and referred to the
condensate volume, 𝐶𝐵𝑢𝑂𝐻𝑐𝑜𝑛𝑑 , useful to know the concentration obtained in the accumulated
condensates.
𝐶𝐵𝑢𝑂𝐻𝑐𝑜𝑛𝑑
𝑖+1=
∑ 𝑙𝑖+1 ∗ 𝑥𝐵𝑢𝑂𝐻𝑜𝑢𝑡
𝑖+1𝑖+10
∑ 𝑙𝑖+1 𝜌𝑤⁄𝑖+10
Equation 3. 23
2. A concentration determined by the accumulation of alcohol recovered and referred to the
fermenter initial volume, 𝐶𝐵𝑢𝑂𝐻𝑟𝑒𝑐 . This concentration is a method to compare the increase in
concentration obtained by fermentation coupling techniques to the normal fermentation
without coupling techniques. 𝑉𝑓𝑒𝑟𝑚0 refers to the inital fermenter volume.
𝐶𝐵𝑢𝑂𝐻𝑟𝑒𝑐
𝑖+1=
∑ 𝑙𝑖+1 ∗ 𝑥𝐵𝑢𝑂𝐻𝑜𝑢𝑡
𝑖+1𝑖+10
𝑉𝑓𝑒𝑟𝑚0
Equation 3. 24
27
3.2.2 FWWC & FW5
This schemes are not illustrated due to confidential reasons. Nevertheless the equations from the
previous scheme also apply for the fermentation kinetics. Also for this schemes there was an
increment of a new compound in the system, which will have to be taken in account in the former
equations for all mass balances and Simulis calculations.
Lastly, regarding the FWWC scheme, there exists a condenser unit for which the calculations made
are equivalent to the ones used for the FCC scheme and at atmospheric pressure while concerning
the temperature, simulations for both condenser temperatures from scheme FCC were done.
Lastly for both schemes, two different process alternatives were studied, corresponding to A and B.
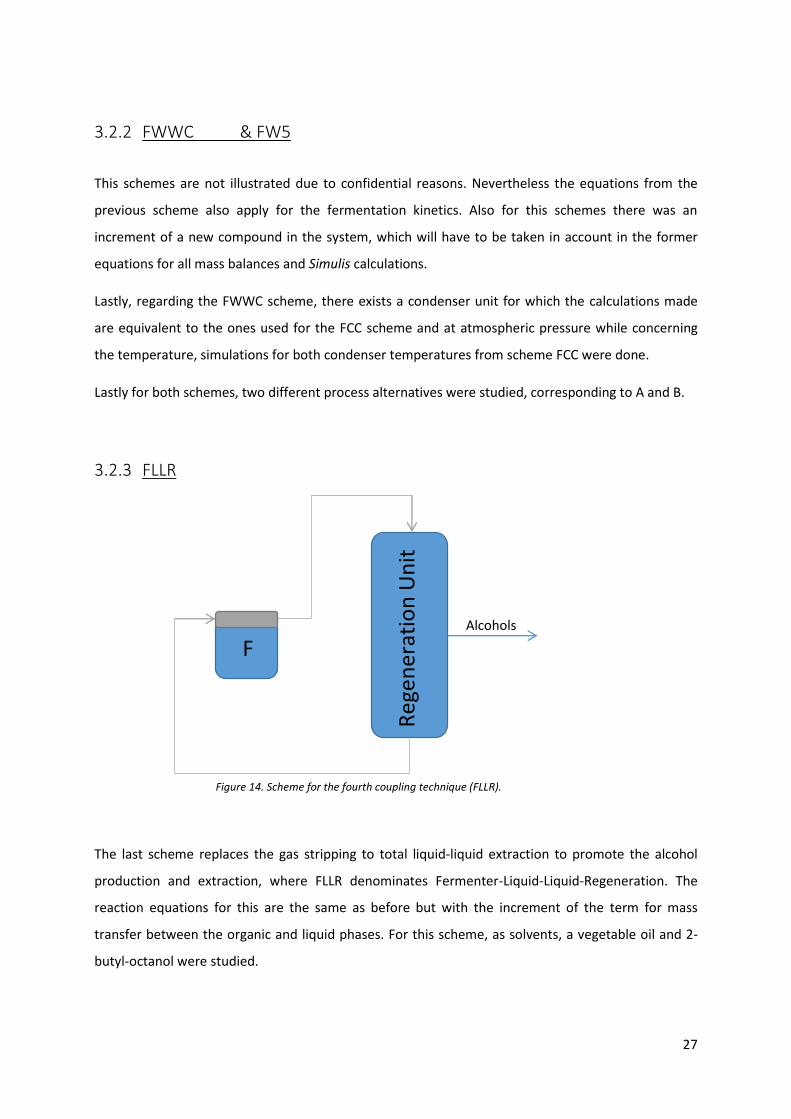
3.2.3 FLLR
The last scheme replaces the gas stripping to total liquid-liquid extraction to promote the alcohol
production and extraction, where FLLR denominates Fermenter-Liquid-Liquid-Regeneration. The
reaction equations for this are the same as before but with the increment of the term for mass
transfer between the organic and liquid phases. For this scheme, as solvents, a vegetable oil and 2-
butyl-octanol were studied.
Reg
ene
rati
on
Un
it
F Alcohols
Figure 14. Scheme for the fourth coupling technique (FLLR).
28
Every kinetic parameter for the liquid-liquid extraction was previously obtained experimentally at
IFPEN labs, therefore this models does not recur to Simulis thermodynamic package. Also 𝐾𝐺 as a
value high enough to considerate that mass transfer governs.
Equation 3. 25 and Equation 3. 26, exemplifies the addition of the term of mass transfer in the
previous equation of butanol production in the fermenter, Equation 3. 10.
𝑑𝐶𝐵𝑢𝑂𝐻𝑎𝑞
𝑑𝑡= 𝑠𝑖𝑔 × (𝑘6𝑘1µ𝑋 + 𝑘7
𝑆
𝑆 + 𝐾𝑆
𝐶𝐴𝐵
𝐶𝐴𝐵 + 𝐾𝐴𝐵𝑋) − 𝐵𝑢𝑂𝐻𝑜𝑟𝑔 Equation 3. 25
𝐵𝑢𝑂𝐻𝑜𝑟𝑔 = 𝐾𝐺 × (𝑉𝑎𝑞 + 𝑉𝑜𝑟𝑔)
𝑉𝑎𝑞 × (𝑘𝐵𝑢𝑂𝐻 ∗ 𝐶𝐵𝑢𝑂𝐻
𝑎𝑞 − 𝐶𝐵𝑢𝑂𝐻
𝑜𝑟𝑔) Equation 3. 26
Where 𝐵𝑢𝑂𝐻𝑜𝑟𝑔 is the butanol mass transferred to the organic phase, and is a function of the
aqueous phase volume, 𝑉𝑎𝑞 (m3), the organic phase volume fixed as 10% of the aqueous phase,
𝑉𝑜𝑟𝑔 (m3), the butanol concentration in the aqueous phase, 𝐶𝐵𝑢𝑂𝐻𝑎𝑞
(g/l) and the butanol
concentration in the organic phase, 𝐶𝐵𝑢𝑂𝐻𝑜𝑟𝑔
(g/l). The remaining parameters were obtained in the
laboratory and its values may be found in Table A. 4.
𝑉𝑎𝑞𝑖+1 = 𝑉𝑎𝑞
𝑖 +𝑑𝐶𝑤
𝑎𝑞𝑖
𝑑𝑡× 𝑑𝑡 ×
𝑉𝑎𝑞𝑖
𝜌𝑤 Equation 3. 27
Where 𝐶𝑤𝑎𝑞is the water concentration in the aqueous phase (g/l) and 𝑑𝑡 the time step used in the
simulation, in hour units.
For the organic phase it was implemented new equations to the model. Equation 3. 28, shows the
example for the butanol concentration in the organic phase.
𝑑𝐶𝐵𝑢𝑂𝐻𝑜𝑟𝑔
𝑑𝑡= 𝐾𝐺 ∗
(𝑉𝑎𝑞 + 𝑉𝑜𝑟𝑔)
𝑉𝑜𝑟𝑔 ∗ (𝑘𝐵𝑢𝑂𝐻 ∗ 𝐶𝐵𝑢𝑂𝐻
𝑎𝑞 − 𝐶𝐵𝑢𝑂𝐻
𝑜𝑟𝑔) Equation 3. 28
For the alcohols extraction an extraction solvent flow rate, 𝑄𝐸𝑥𝑡 (m3/h) was calculated as:
𝑄𝐸𝑥𝑡𝑖+1= 𝑧 × (
𝐶𝐵𝑢𝑂𝐻𝑎𝑞
𝐶𝐵𝑢𝑂𝐻𝑏 )
2.5
× 𝑉𝑜𝑟𝑔 Equation 3. 29
29
Where 𝐶𝐵𝑢𝑂𝐻𝑏 is the needed concentration of butanol to initiate extracting the alcohols and 𝑧 is the
ratio between the extraction solvent flow rate and the organic phase volume, assumed as 0.001.
The water and the alcohols recovered from the solvent are calculated exactly as for a condenser in
the previous schemes, where 𝑙𝑖+1changes to 𝑄𝐸𝑥𝑡𝑖+1 , Equation 3. 22, and since this flow rate is
volumetric instead of composition, concentrations of the organic phase are used.
3.3 Solvent Regeneration
Preliminary simulations with PROII of the solvents regeneration were made. For this, the same
thermodynamics model was used and the components not in SRKS V11 pushed the need to use an
UNIFAC predictive model other than the SRKS without any coefficients.
To evaluate the feasibility of the separation of the solvent and the butanol the ternary diagram was
also studied.
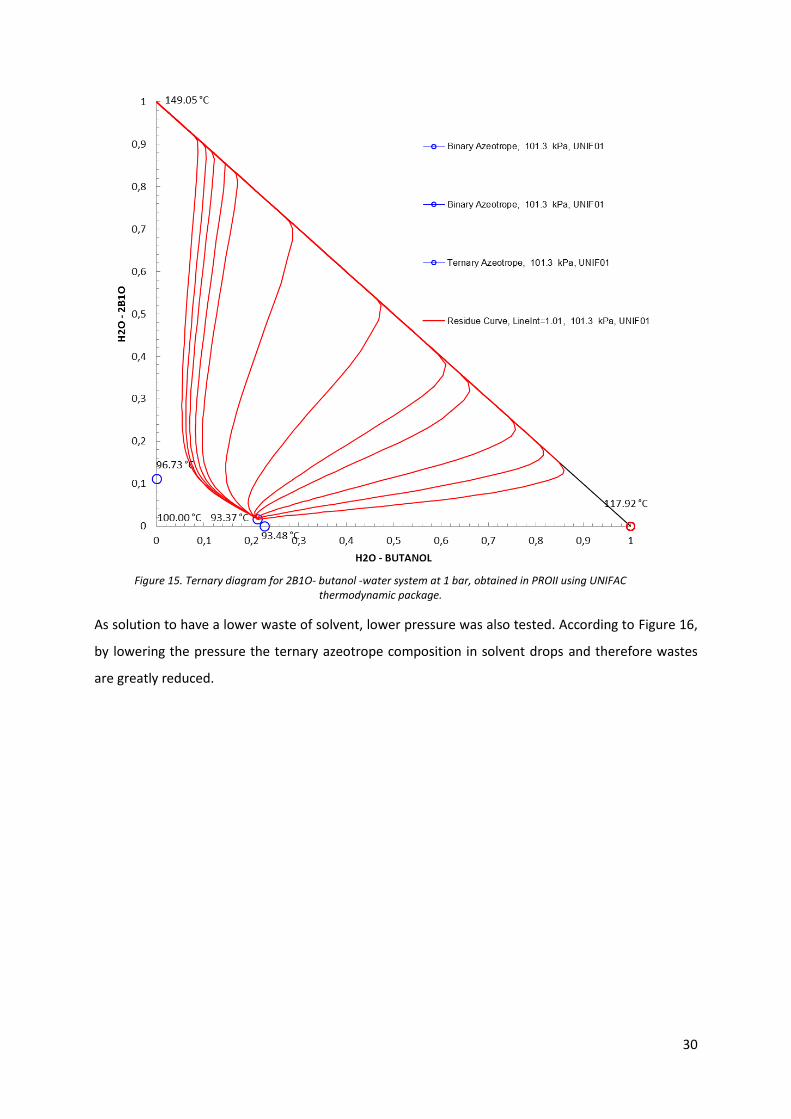
3.3.1 2-butyl-octanol
As can be seen, the mixture obtained with the use of 2B1O has a ternary azeotrope at 93.37 °C,
therefore by distillation the separation of alcohols will always have this constraint point. In fact in a
first column the solvent could be obtained at the bottom while the ternary azeotrope at the top.
Nevertheless at atmospheric pressure the ternary composition is already low in 2B1O, having almost
the composition of the binary azeotrope between water and butanol, hence following to a
heteroazeotropic distillation. However a solvent waste would always exist.
30
As solution to have a lower waste of solvent, lower pressure was also tested. According to Figure 16,
by lowering the pressure the ternary azeotrope composition in solvent drops and therefore wastes
are greatly reduced.
Figure 15. Ternary diagram for 2B1O- butanol -water system at 1 bar, obtained in PROII using UNIFAC thermodynamic package.
31
Therefore a distillation scheme for the regeneration of the solvent can be proposed as follows in
Figure 17, where the ternary azeotrope shall be obtained at the top of the first column and by phase
separation purified while the remaining is sent to other column to achieve the main alcohol recovery.
Figure 16. Ternary diagram for 2B1O- butanol -water system at 0.01 bar, obtained in PROII using UNIFAC thermodynamic package.
32
3.3.2 Vegetable oil
Lastly, using vegetable oil there isn’t any ternary azeotrope at low pressure. Therefore the
regeneration can be easily obtained in a single distillation column. To this scheme fresh butanol was
also added to ease the separation, hence reduce the energy consumption. The use of a decanter for
using the distillation column top as feed turns possible to achieve streams with higher alcohol
concentration.
Feed
Solvent
Alcohol
s Alcohols
Solvent
Concentrated
Alcohols
Figure 17. Scheme for the 2BO1 regeneration by distillation.
33
Figure 18. Ternary diagram for Triolein- butanol -water system at 0.005 bar, obtained in PROII using UNIFAC thermodynamic package.
34
.
3.4 Energy Consumption The energy consumption may derive from different parcels, the compressor to maintain the gas
pressure, where an overall pressure loss of 0.2 bar was assumed, the condensers and lastly the
solvent regeneration towers reboilers.
For the compressor, recurring to simulis, the gas enthalpy is calculated before entering the
compressor, then the gas entropy is also calculated and lastly the gas outlet enthalpy is calculated
using as entry parameters the pressure increase and entropy and therefore assuming an isentropic
compression. Finally the difference between the gas enthalpies results in the energy consumption.
The condensers energy consumption is merely the difference between the gas enthalpy and outlet
enthalpies. This is easily done by Simulis, where it is only needed the entry composition, temperature
and pressure to automatically make a flash calculation to discover the resulting gas and liquid
enthalpies per kilogram. After this enthalpy shall be summed according to the vapor and liquid
corresponding fractions.
Therefore in all this calculations it was assumed an energy efficiency of 100 %.
Meanwhile for the solvent regeneration, the energy consumption is directly obtained in the PROII
simulation per kilogram of solvent and respecting a certain feed and product streams compositions.
Figure 19. Scheme for vegetable oil regeneration.
Feed
Solvent
Alcohol
s
Fresh
Butanol
Alcohol
s
Alcohol
s
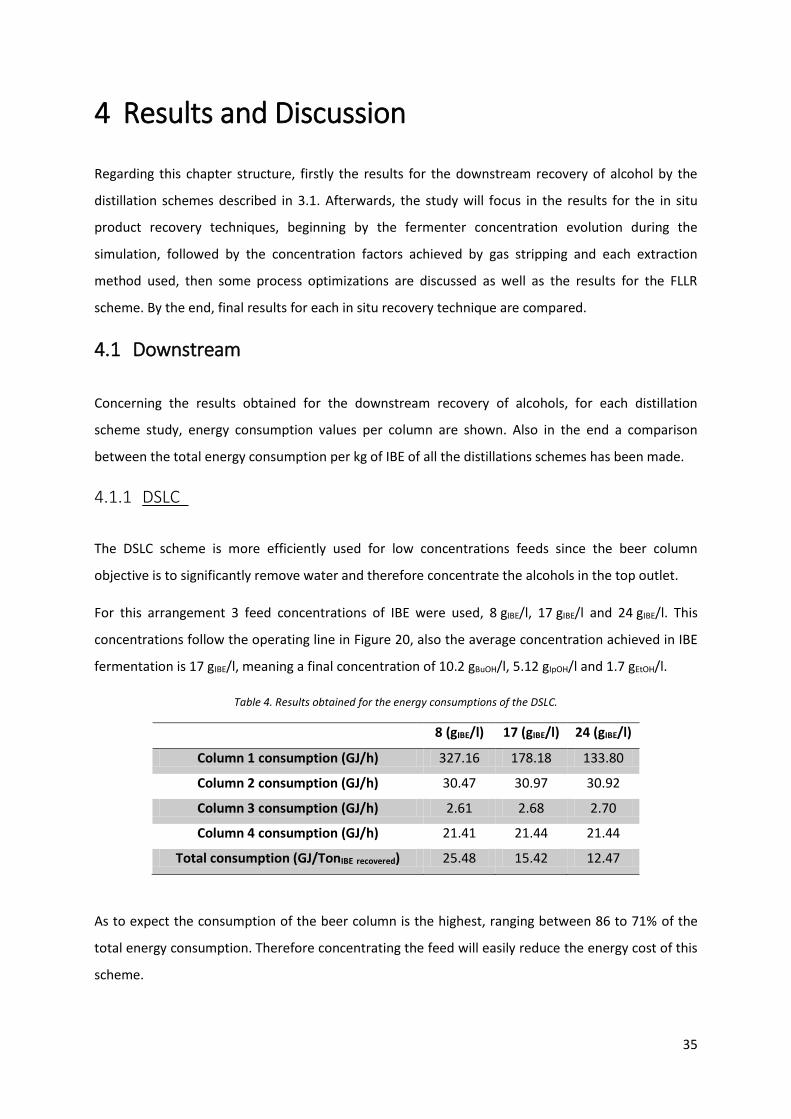
35
4 Results and Discussion
Regarding this chapter structure, firstly the results for the downstream recovery of alcohol by the
distillation schemes described in 3.1. Afterwards, the study will focus in the results for the in situ
product recovery techniques, beginning by the fermenter concentration evolution during the
simulation, followed by the concentration factors achieved by gas stripping and each extraction
method used, then some process optimizations are discussed as well as the results for the FLLR
scheme. By the end, final results for each in situ recovery technique are compared.
4.1 Downstream
Concerning the results obtained for the downstream recovery of alcohols, for each distillation
scheme study, energy consumption values per column are shown. Also in the end a comparison
between the total energy consumption per kg of IBE of all the distillations schemes has been made.
4.1.1 DSLC
The DSLC scheme is more efficiently used for low concentrations feeds since the beer column
objective is to significantly remove water and therefore concentrate the alcohols in the top outlet.
For this arrangement 3 feed concentrations of IBE were used, 8 gIBE/l, 17 gIBE/l and 24 gIBE/l. This
concentrations follow the operating line in Figure 20, also the average concentration achieved in IBE
fermentation is 17 gIBE/l, meaning a final concentration of 10.2 gBuOH/l, 5.12 gIpOH/l and 1.7 gEtOH/l.
Table 4. Results obtained for the energy consumptions of the DSLC.
8 (gIBE/l) 17 (gIBE/l) 24 (gIBE/l)
Column 1 consumption (GJ/h) 327.16 178.18 133.80
Column 2 consumption (GJ/h) 30.47 30.97 30.92
Column 3 consumption (GJ/h) 2.61 2.68 2.70
Column 4 consumption (GJ/h) 21.41 21.44 21.44
Total consumption (GJ/TonIBE recovered) 25.48 15.42 12.47
As to expect the consumption of the beer column is the highest, ranging between 86 to 71% of the
total energy consumption. Therefore concentrating the feed will easily reduce the energy cost of this
scheme.
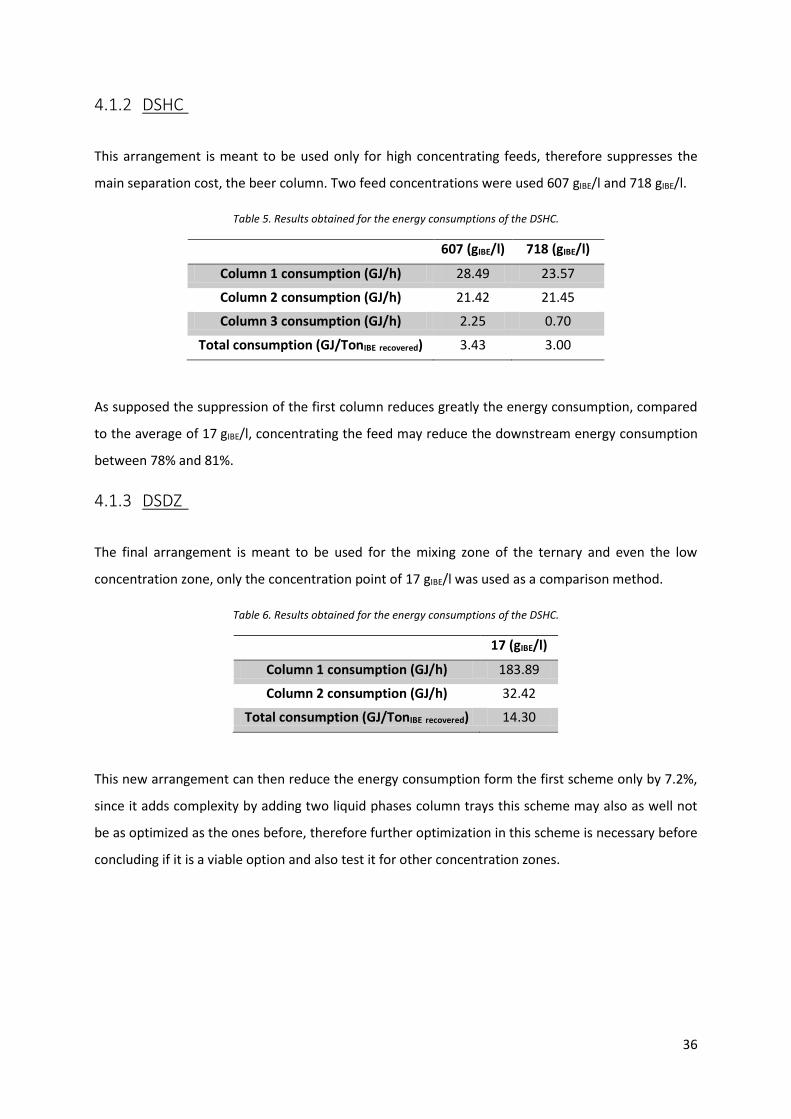
36
4.1.2 DSHC
This arrangement is meant to be used only for high concentrating feeds, therefore suppresses the
main separation cost, the beer column. Two feed concentrations were used 607 gIBE/l and 718 gIBE/l.
Table 5. Results obtained for the energy consumptions of the DSHC.
607 (gIBE/l) 718 (gIBE/l)
Column 1 consumption (GJ/h) 28.49 23.57
Column 2 consumption (GJ/h) 21.42 21.45
Column 3 consumption (GJ/h) 2.25 0.70
Total consumption (GJ/TonIBE recovered) 3.43 3.00
As supposed the suppression of the first column reduces greatly the energy consumption, compared
to the average of 17 gIBE/l, concentrating the feed may reduce the downstream energy consumption
between 78% and 81%.
4.1.3 DSDZ
The final arrangement is meant to be used for the mixing zone of the ternary and even the low
concentration zone, only the concentration point of 17 gIBE/l was used as a comparison method.
Table 6. Results obtained for the energy consumptions of the DSHC.
17 (gIBE/l)
Column 1 consumption (GJ/h) 183.89
Column 2 consumption (GJ/h) 32.42
Total consumption (GJ/TonIBE recovered) 14.30
This new arrangement can then reduce the energy consumption form the first scheme only by 7.2%,
since it adds complexity by adding two liquid phases column trays this scheme may also as well not
be as optimized as the ones before, therefore further optimization in this scheme is necessary before
concluding if it is a viable option and also test it for other concentration zones.
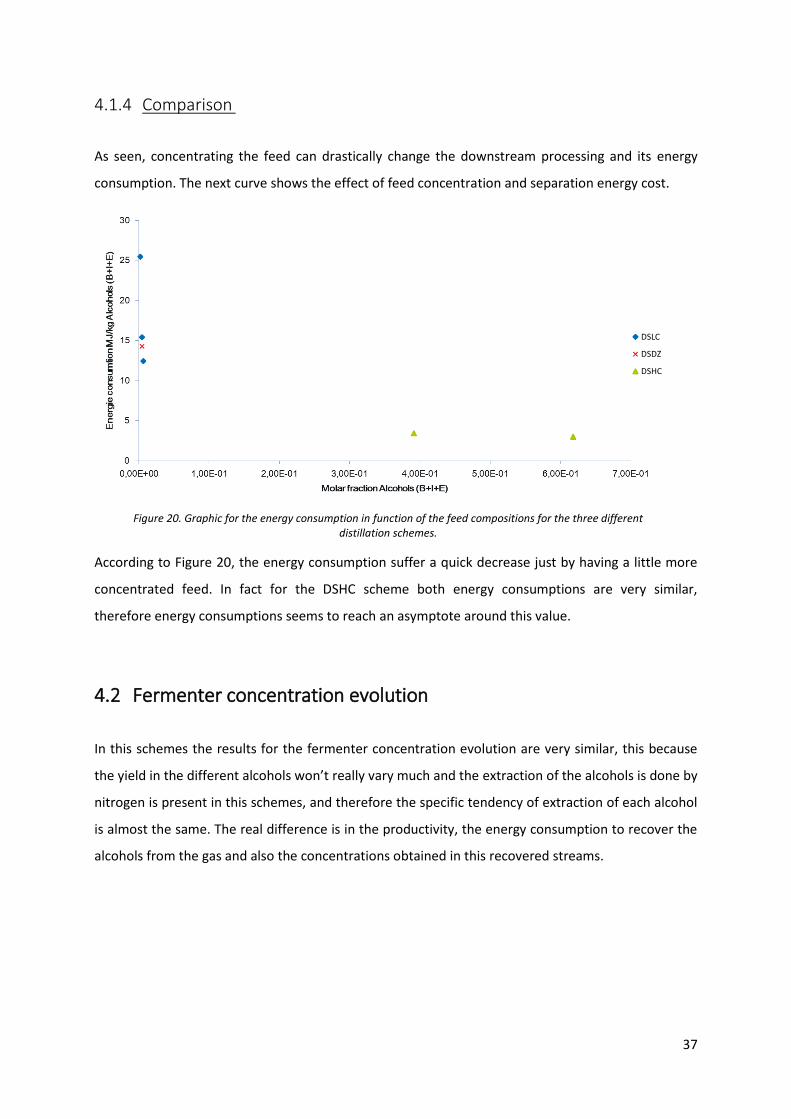
37
4.1.4 Comparison
As seen, concentrating the feed can drastically change the downstream processing and its energy
consumption. The next curve shows the effect of feed concentration and separation energy cost.
According to Figure 20, the energy consumption suffer a quick decrease just by having a little more
concentrated feed. In fact for the DSHC scheme both energy consumptions are very similar,
therefore energy consumptions seems to reach an asymptote around this value.
4.2 Fermenter concentration evolution
In this schemes the results for the fermenter concentration evolution are very similar, this because
the yield in the different alcohols won’t really vary much and the extraction of the alcohols is done by
nitrogen is present in this schemes, and therefore the specific tendency of extraction of each alcohol
is almost the same. The real difference is in the productivity, the energy consumption to recover the
alcohols from the gas and also the concentrations obtained in this recovered streams.
Figure 20. Graphic for the energy consumption in function of the feed compositions for the three different distillation schemes.
DSLC
DSDZ
DSHC
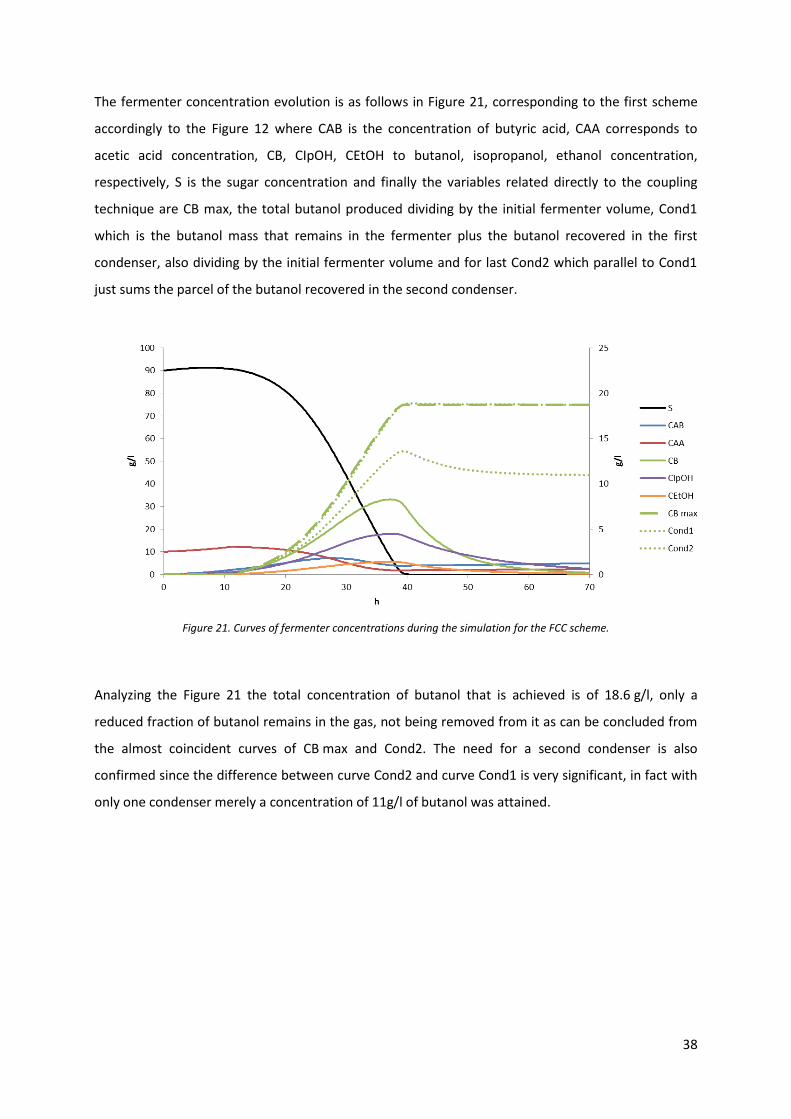
38
The fermenter concentration evolution is as follows in Figure 21, corresponding to the first scheme
accordingly to the Figure 12 where CAB is the concentration of butyric acid, CAA corresponds to
acetic acid concentration, CB, CIpOH, CEtOH to butanol, isopropanol, ethanol concentration,
respectively, S is the sugar concentration and finally the variables related directly to the coupling
technique are CB max, the total butanol produced dividing by the initial fermenter volume, Cond1
which is the butanol mass that remains in the fermenter plus the butanol recovered in the first
condenser, also dividing by the initial fermenter volume and for last Cond2 which parallel to Cond1
just sums the parcel of the butanol recovered in the second condenser.
Figure 21. Curves of fermenter concentrations during the simulation for the FCC scheme.
Analyzing the Figure 21 the total concentration of butanol that is achieved is of 18.6 g/l, only a
reduced fraction of butanol remains in the gas, not being removed from it as can be concluded from
the almost coincident curves of CB max and Cond2. The need for a second condenser is also
confirmed since the difference between curve Cond2 and curve Cond1 is very significant, in fact with
only one condenser merely a concentration of 11g/l of butanol was attained.
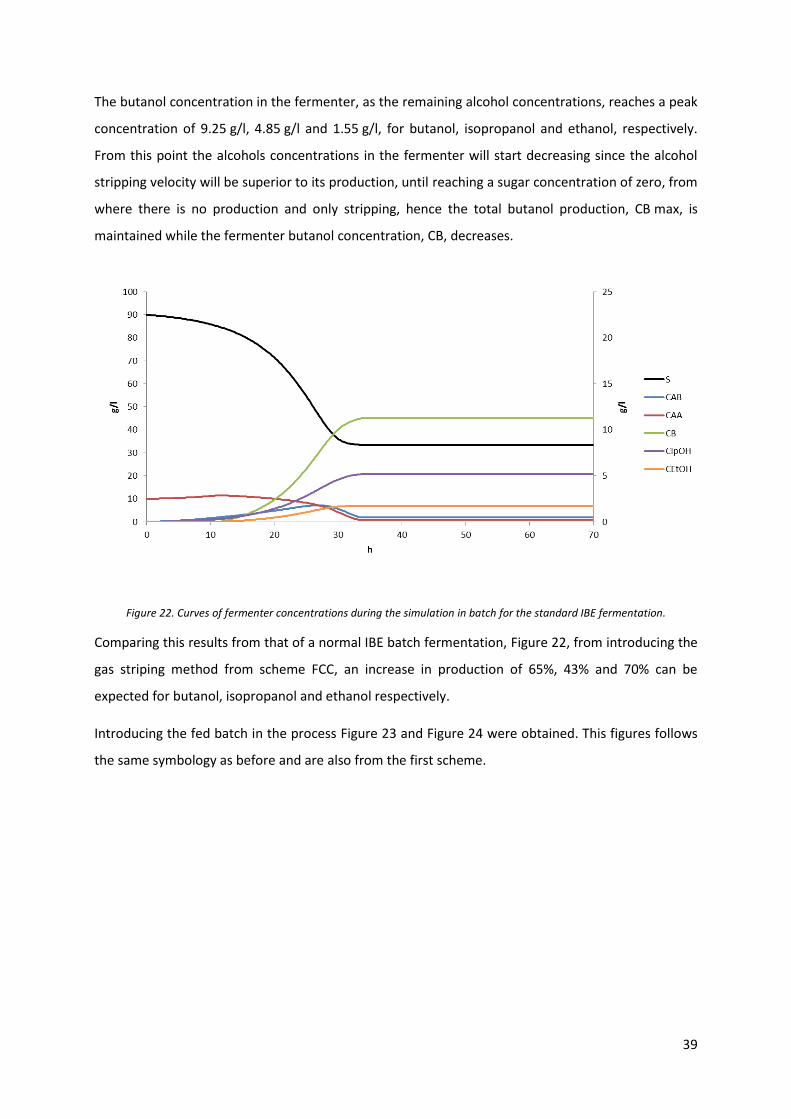
39
The butanol concentration in the fermenter, as the remaining alcohol concentrations, reaches a peak
concentration of 9.25 g/l, 4.85 g/l and 1.55 g/l, for butanol, isopropanol and ethanol, respectively.
From this point the alcohols concentrations in the fermenter will start decreasing since the alcohol
stripping velocity will be superior to its production, until reaching a sugar concentration of zero, from
where there is no production and only stripping, hence the total butanol production, CB max, is
maintained while the fermenter butanol concentration, CB, decreases.
Figure 22. Curves of fermenter concentrations during the simulation in batch for the standard IBE fermentation.
Comparing this results from that of a normal IBE batch fermentation, Figure 22, from introducing the
gas striping method from scheme FCC, an increase in production of 65%, 43% and 70% can be
expected for butanol, isopropanol and ethanol respectively.
Introducing the fed batch in the process Figure 23 and Figure 24 were obtained. This figures follows
the same symbology as before and are also from the first scheme.
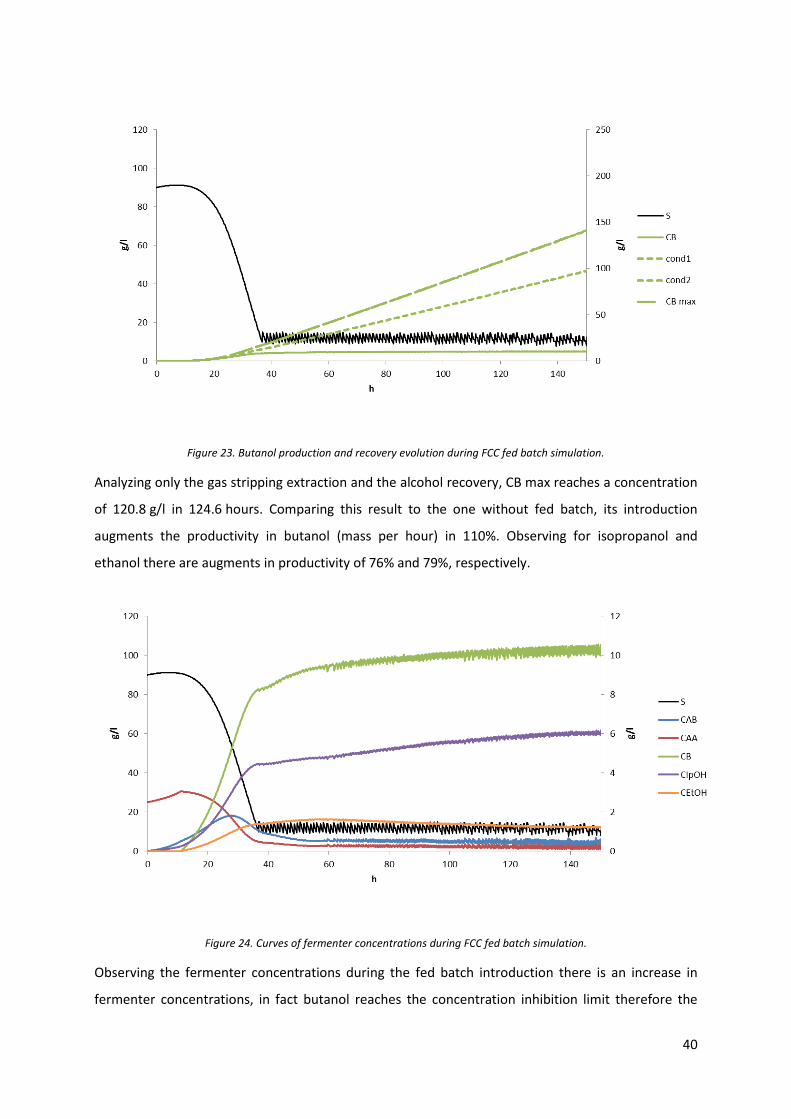
40
Figure 23. Butanol production and recovery evolution during FCC fed batch simulation.
Analyzing only the gas stripping extraction and the alcohol recovery, CB max reaches a concentration
of 120.8 g/l in 124.6 hours. Comparing this result to the one without fed batch, its introduction
augments the productivity in butanol (mass per hour) in 110%. Observing for isopropanol and
ethanol there are augments in productivity of 76% and 79%, respectively.
Figure 24. Curves of fermenter concentrations during FCC fed batch simulation.
Observing the fermenter concentrations during the fed batch introduction there is an increase in
fermenter concentrations, in fact butanol reaches the concentration inhibition limit therefore the
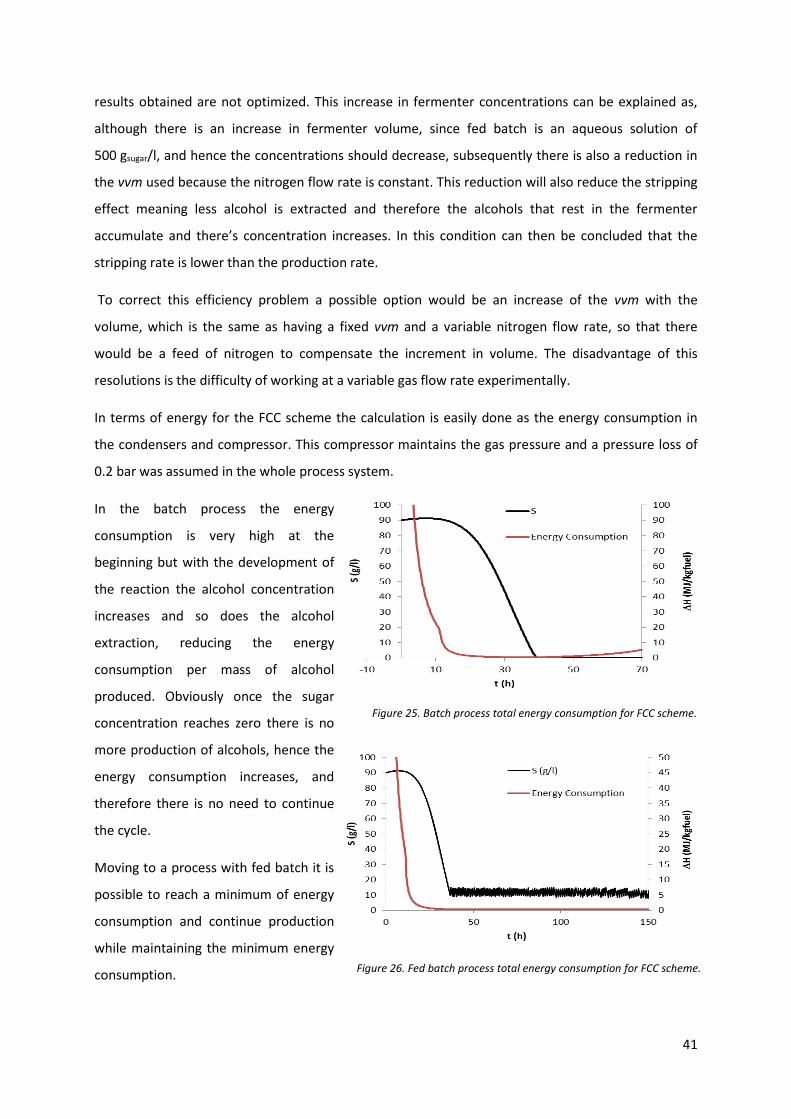
41
Figure 25. Batch process total energy consumption for FCC scheme.
Figure 26. Fed batch process total energy consumption for FCC scheme.
results obtained are not optimized. This increase in fermenter concentrations can be explained as,
although there is an increase in fermenter volume, since fed batch is an aqueous solution of
500 gsugar/l, and hence the concentrations should decrease, subsequently there is also a reduction in
the vvm used because the nitrogen flow rate is constant. This reduction will also reduce the stripping
effect meaning less alcohol is extracted and therefore the alcohols that rest in the fermenter
accumulate and there’s concentration increases. In this condition can then be concluded that the
stripping rate is lower than the production rate.
To correct this efficiency problem a possible option would be an increase of the vvm with the
volume, which is the same as having a fixed vvm and a variable nitrogen flow rate, so that there
would be a feed of nitrogen to compensate the increment in volume. The disadvantage of this
resolutions is the difficulty of working at a variable gas flow rate experimentally.
In terms of energy for the FCC scheme the calculation is easily done as the energy consumption in
the condensers and compressor. This compressor maintains the gas pressure and a pressure loss of
0.2 bar was assumed in the whole process system.
In the batch process the energy
consumption is very high at the
beginning but with the development of
the reaction the alcohol concentration
increases and so does the alcohol
extraction, reducing the energy
consumption per mass of alcohol
produced. Obviously once the sugar
concentration reaches zero there is no
more production of alcohols, hence the
energy consumption increases, and
therefore there is no need to continue
the cycle.
Moving to a process with fed batch it is
possible to reach a minimum of energy
consumption and continue production
while maintaining the minimum energy
consumption.
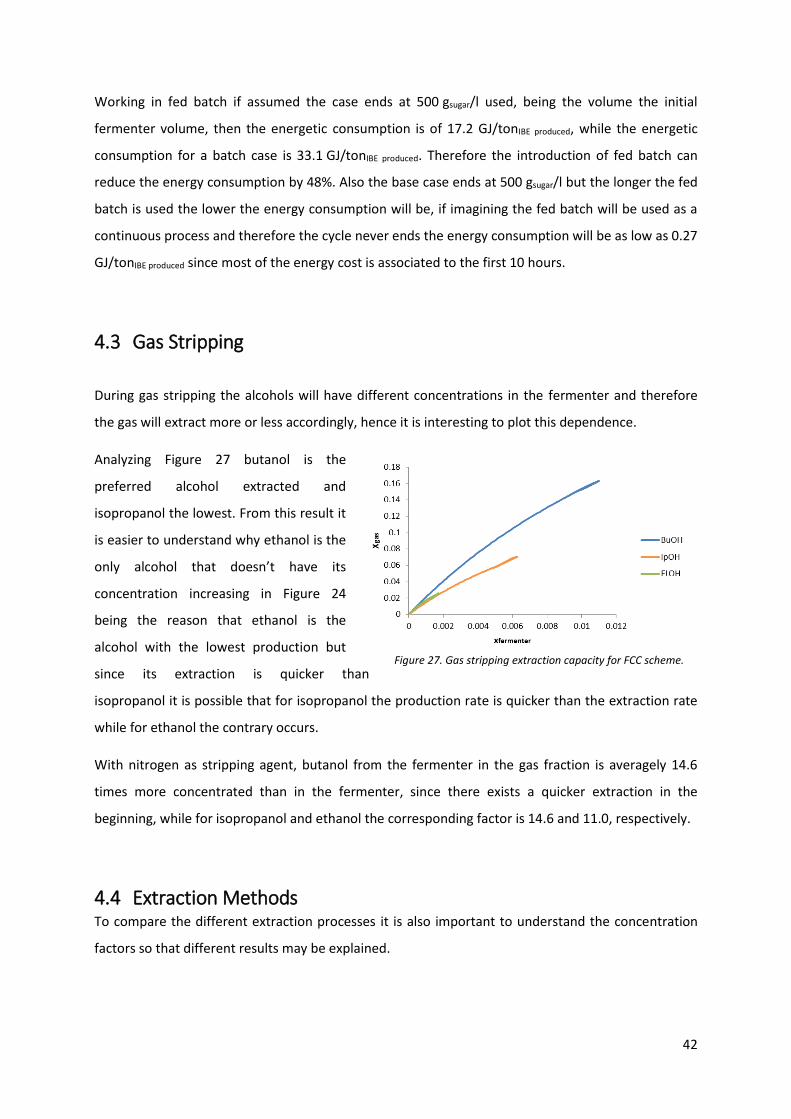
42
Working in fed batch if assumed the case ends at 500 gsugar/l used, being the volume the initial
fermenter volume, then the energetic consumption is of 17.2 GJ/tonIBE produced, while the energetic
consumption for a batch case is 33.1 GJ/tonIBE produced. Therefore the introduction of fed batch can
reduce the energy consumption by 48%. Also the base case ends at 500 gsugar/l but the longer the fed
batch is used the lower the energy consumption will be, if imagining the fed batch will be used as a
continuous process and therefore the cycle never ends the energy consumption will be as low as 0.27
GJ/tonIBE produced since most of the energy cost is associated to the first 10 hours.
4.3 Gas Stripping
During gas stripping the alcohols will have different concentrations in the fermenter and therefore
the gas will extract more or less accordingly, hence it is interesting to plot this dependence.
Analyzing Figure 27 butanol is the
preferred alcohol extracted and
isopropanol the lowest. From this result it
is easier to understand why ethanol is the
only alcohol that doesn’t have its
concentration increasing in Figure 24
being the reason that ethanol is the
alcohol with the lowest production but
since its extraction is quicker than
isopropanol it is possible that for isopropanol the production rate is quicker than the extraction rate
while for ethanol the contrary occurs.
With nitrogen as stripping agent, butanol from the fermenter in the gas fraction is averagely 14.6
times more concentrated than in the fermenter, since there exists a quicker extraction in the
beginning, while for isopropanol and ethanol the corresponding factor is 14.6 and 11.0, respectively.
4.4 Extraction Methods To compare the different extraction processes it is also important to understand the concentration
factors so that different results may be explained.
Figure 27. Gas stripping extraction capacity for FCC scheme.
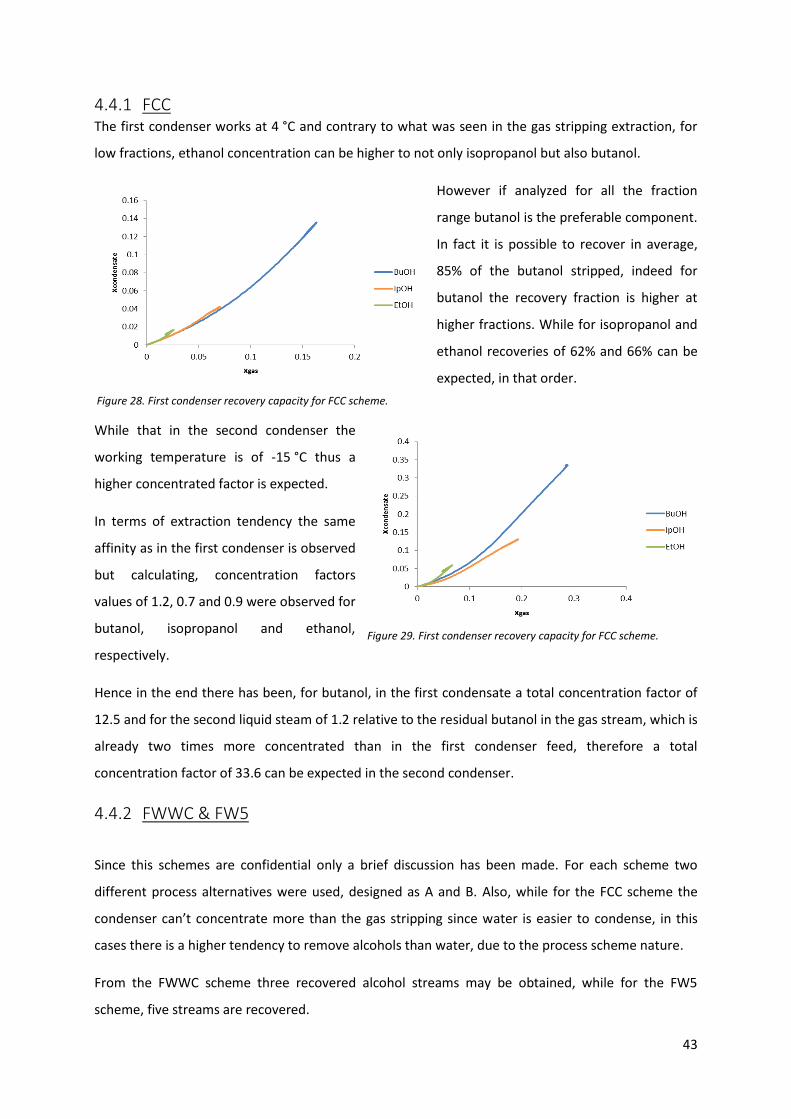
43
4.4.1 FCC The first condenser works at 4 °C and contrary to what was seen in the gas stripping extraction, for
low fractions, ethanol concentration can be higher to not only isopropanol but also butanol.
However if analyzed for all the fraction
range butanol is the preferable component.
In fact it is possible to recover in average,
85% of the butanol stripped, indeed for
butanol the recovery fraction is higher at
higher fractions. While for isopropanol and
ethanol recoveries of 62% and 66% can be
expected, in that order.
While that in the second condenser the
working temperature is of -15 °C thus a
higher concentrated factor is expected.
In terms of extraction tendency the same
affinity as in the first condenser is observed
but calculating, concentration factors
values of 1.2, 0.7 and 0.9 were observed for
butanol, isopropanol and ethanol,
respectively.
Hence in the end there has been, for butanol, in the first condensate a total concentration factor of
12.5 and for the second liquid steam of 1.2 relative to the residual butanol in the gas stream, which is
already two times more concentrated than in the first condenser feed, therefore a total
concentration factor of 33.6 can be expected in the second condenser.
4.4.2 FWWC & FW5
Since this schemes are confidential only a brief discussion has been made. For each scheme two
different process alternatives were used, designed as A and B. Also, while for the FCC scheme the
condenser can’t concentrate more than the gas stripping since water is easier to condense, in this
cases there is a higher tendency to remove alcohols than water, due to the process scheme nature.
From the FWWC scheme three recovered alcohol streams may be obtained, while for the FW5
scheme, five streams are recovered.
Figure 29. First condenser recovery capacity for FCC scheme.
Figure 28. First condenser recovery capacity for FCC scheme.
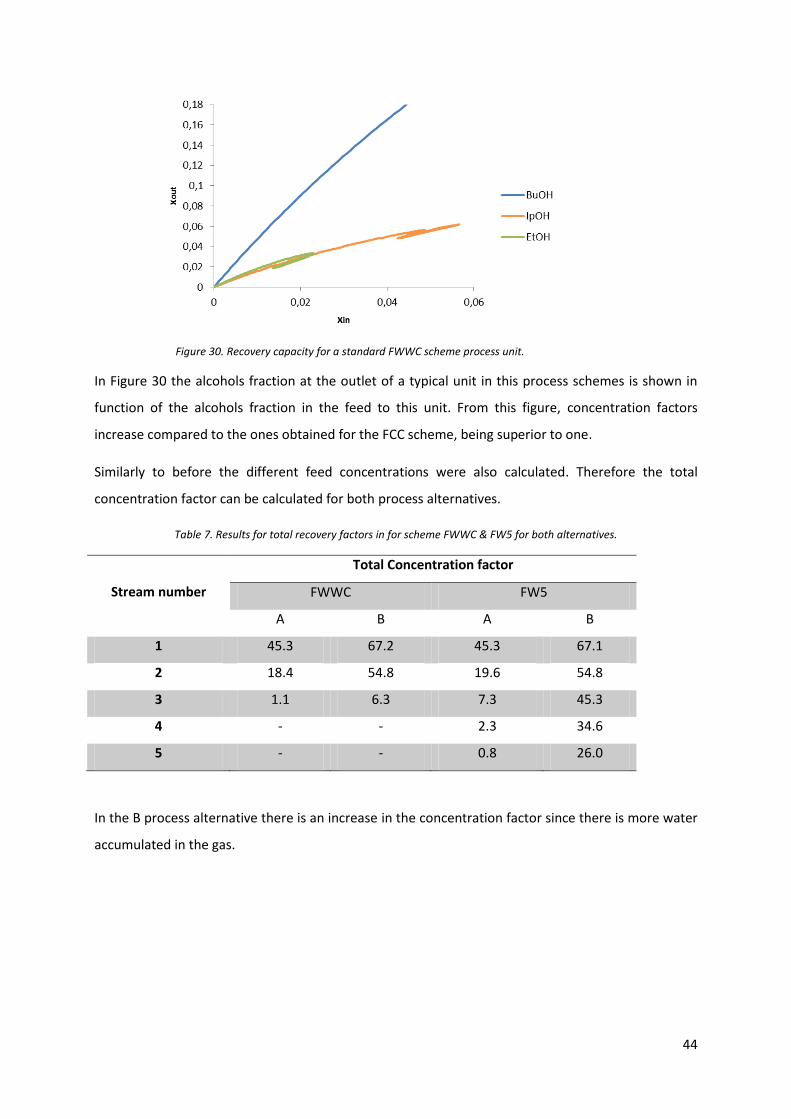
44
In Figure 30 the alcohols fraction at the outlet of a typical unit in this process schemes is shown in
function of the alcohols fraction in the feed to this unit. From this figure, concentration factors
increase compared to the ones obtained for the FCC scheme, being superior to one.
Similarly to before the different feed concentrations were also calculated. Therefore the total
concentration factor can be calculated for both process alternatives.
Table 7. Results for total recovery factors in for scheme FWWC & FW5 for both alternatives.
Stream number
Total Concentration factor
FWWC FW5
A B A B
1 45.3 67.2 45.3 67.1
2 18.4 54.8 19.6 54.8
3 1.1 6.3 7.3 45.3
4 - - 2.3 34.6
5 - - 0.8 26.0
In the B process alternative there is an increase in the concentration factor since there is more water
accumulated in the gas.
Figure 30. Recovery capacity for a standard FWWC scheme process unit.
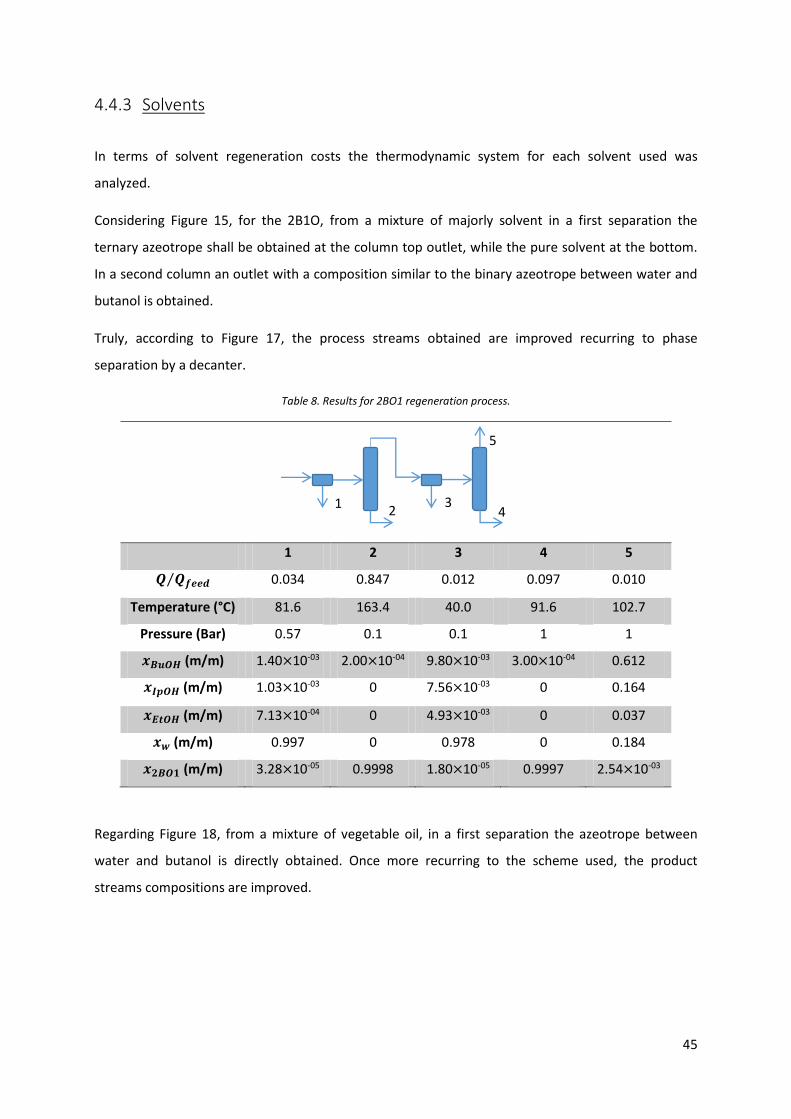
45
4.4.3 Solvents
In terms of solvent regeneration costs the thermodynamic system for each solvent used was
analyzed.
Considering Figure 15, for the 2B1O, from a mixture of majorly solvent in a first separation the
ternary azeotrope shall be obtained at the column top outlet, while the pure solvent at the bottom.
In a second column an outlet with a composition similar to the binary azeotrope between water and
butanol is obtained.
Truly, according to Figure 17, the process streams obtained are improved recurring to phase
separation by a decanter.
Table 8. Results for 2BO1 regeneration process.
1 2 3 4 5
𝑸 𝑸𝒇𝒆𝒆𝒅⁄ 0.034 0.847 0.012 0.097 0.010
Temperature (°C) 81.6 163.4 40.0 91.6 102.7
Pressure (Bar) 0.57 0.1 0.1 1 1
𝒙𝑩𝒖𝑶𝑯 (m/m) 1.40×10-03 2.00×10-04 9.80×10-03 3.00×10-04 0.612
𝒙𝑰𝒑𝑶𝑯 (m/m) 1.03×10-03 0 7.56×10-03 0 0.164
𝒙𝑬𝒕𝑶𝑯 (m/m) 7.13×10-04 0 4.93×10-03 0 0.037
𝒙𝒘 (m/m) 0.997 0 0.978 0 0.184
𝒙𝟐𝑩𝑶𝟏 (m/m) 3.28×10-05 0.9998 1.80×10-05 0.9997 2.54×10-03
Regarding Figure 18, from a mixture of vegetable oil, in a first separation the azeotrope between
water and butanol is directly obtained. Once more recurring to the scheme used, the product
streams compositions are improved.
2 3
4
5
1
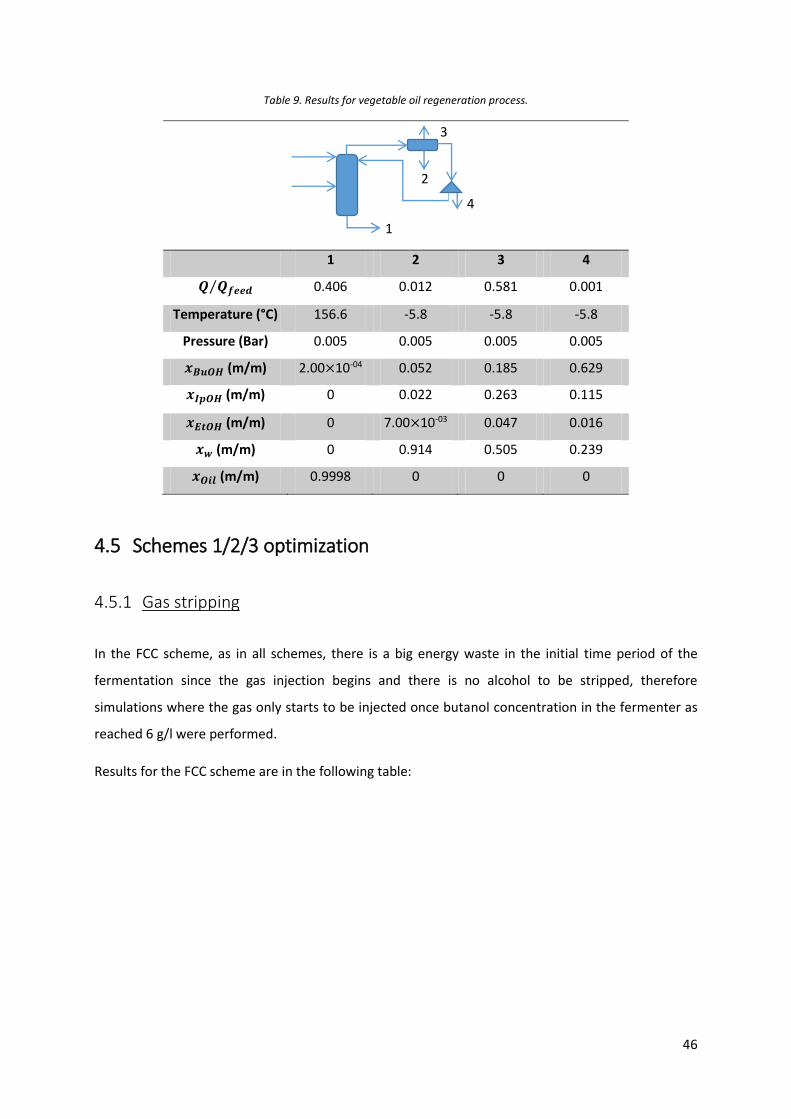
46
Table 9. Results for vegetable oil regeneration process.
1 2 3 4
𝑸 𝑸𝒇𝒆𝒆𝒅⁄ 0.406 0.012 0.581 0.001
Temperature (°C) 156.6 -5.8 -5.8 -5.8
Pressure (Bar) 0.005 0.005 0.005 0.005
𝒙𝑩𝒖𝑶𝑯 (m/m) 2.00×10-04 0.052 0.185 0.629
𝒙𝑰𝒑𝑶𝑯 (m/m) 0 0.022 0.263 0.115
𝒙𝑬𝒕𝑶𝑯 (m/m) 0 7.00×10-03 0.047 0.016
𝒙𝒘 (m/m) 0 0.914 0.505 0.239
𝒙𝑶𝒊𝒍 (m/m) 0.9998 0 0 0
4.5 Schemes 1/2/3 optimization
4.5.1 Gas stripping
In the FCC scheme, as in all schemes, there is a big energy waste in the initial time period of the
fermentation since the gas injection begins and there is no alcohol to be stripped, therefore
simulations where the gas only starts to be injected once butanol concentration in the fermenter as
reached 6 g/l were performed.
Results for the FCC scheme are in the following table:
1
4
2
3
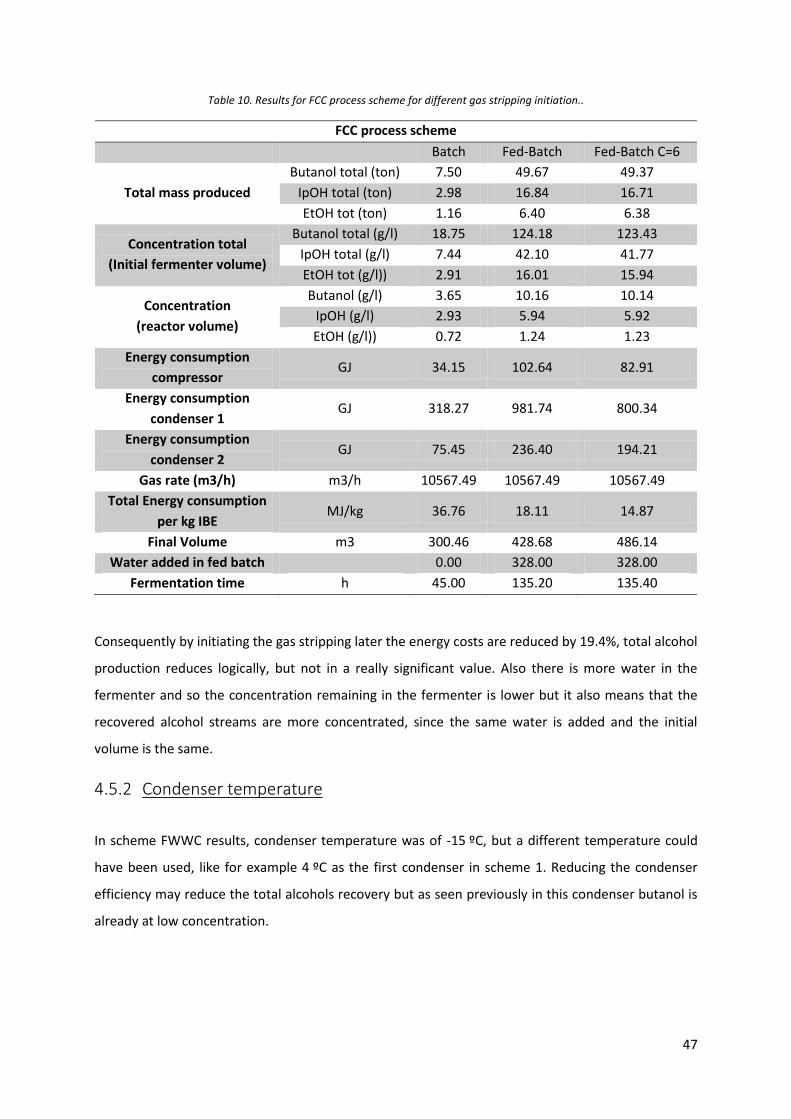
47
Table 10. Results for FCC process scheme for different gas stripping initiation..
FCC process scheme
Batch Fed-Batch Fed-Batch C=6
Total mass produced
Butanol total (ton) 7.50 49.67 49.37
IpOH total (ton) 2.98 16.84 16.71
EtOH tot (ton) 1.16 6.40 6.38
Concentration total
(Initial fermenter volume)
Butanol total (g/l) 18.75 124.18 123.43
IpOH total (g/l) 7.44 42.10 41.77
EtOH tot (g/l)) 2.91 16.01 15.94
Concentration
(reactor volume)
Butanol (g/l) 3.65 10.16 10.14
IpOH (g/l) 2.93 5.94 5.92
EtOH (g/l)) 0.72 1.24 1.23
Energy consumption
compressor GJ 34.15 102.64 82.91
Energy consumption
condenser 1 GJ 318.27 981.74 800.34
Energy consumption
condenser 2 GJ 75.45 236.40 194.21
Gas rate (m3/h) m3/h 10567.49 10567.49 10567.49
Total Energy consumption
per kg IBE MJ/kg 36.76 18.11 14.87
Final Volume m3 300.46 428.68 486.14
Water added in fed batch 0.00 328.00 328.00
Fermentation time h 45.00 135.20 135.40
Consequently by initiating the gas stripping later the energy costs are reduced by 19.4%, total alcohol
production reduces logically, but not in a really significant value. Also there is more water in the
fermenter and so the concentration remaining in the fermenter is lower but it also means that the
recovered alcohol streams are more concentrated, since the same water is added and the initial
volume is the same.
4.5.2 Condenser temperature
In scheme FWWC results, condenser temperature was of -15 ºC, but a different temperature could
have been used, like for example 4 ºC as the first condenser in scheme 1. Reducing the condenser
efficiency may reduce the total alcohols recovery but as seen previously in this condenser butanol is
already at low concentration.
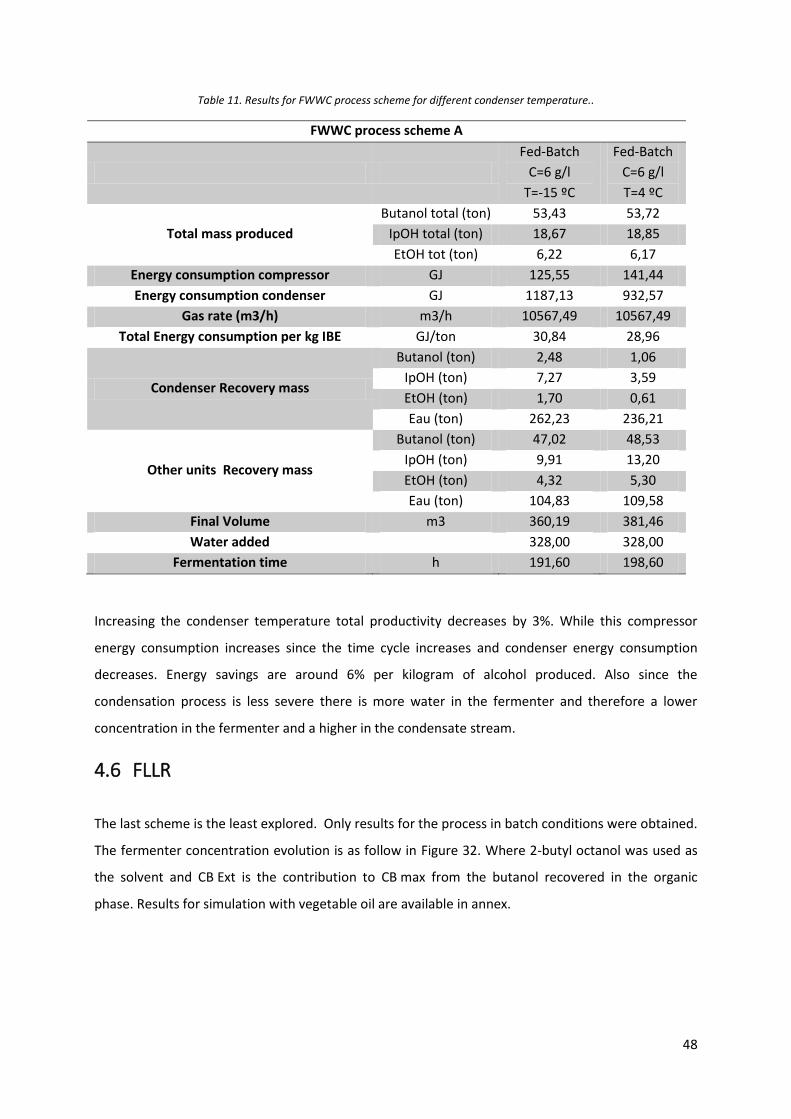
48
Table 11. Results for FWWC process scheme for different condenser temperature..
FWWC process scheme A
Fed-Batch
C=6 g/l
T=-15 ºC
Fed-Batch
C=6 g/l
T=4 ºC
Total mass produced
Butanol total (ton) 53,43 53,72
IpOH total (ton) 18,67 18,85
EtOH tot (ton) 6,22 6,17
Energy consumption compressor GJ 125,55 141,44
Energy consumption condenser GJ 1187,13 932,57
Gas rate (m3/h) m3/h 10567,49 10567,49
Total Energy consumption per kg IBE GJ/ton 30,84 28,96
Condenser Recovery mass
Butanol (ton) 2,48 1,06
IpOH (ton) 7,27 3,59
EtOH (ton) 1,70 0,61
Eau (ton) 262,23 236,21
Other units Recovery mass
Butanol (ton) 47,02 48,53
IpOH (ton) 9,91 13,20
EtOH (ton) 4,32 5,30
Eau (ton) 104,83 109,58
Final Volume m3 360,19 381,46
Water added 328,00 328,00
Fermentation time h 191,60 198,60
Increasing the condenser temperature total productivity decreases by 3%. While this compressor
energy consumption increases since the time cycle increases and condenser energy consumption
decreases. Energy savings are around 6% per kilogram of alcohol produced. Also since the
condensation process is less severe there is more water in the fermenter and therefore a lower
concentration in the fermenter and a higher in the condensate stream.
4.6 FLLR
The last scheme is the least explored. Only results for the process in batch conditions were obtained.
The fermenter concentration evolution is as follow in Figure 32. Where 2-butyl octanol was used as
the solvent and CB Ext is the contribution to CB max from the butanol recovered in the organic
phase. Results for simulation with vegetable oil are available in annex.
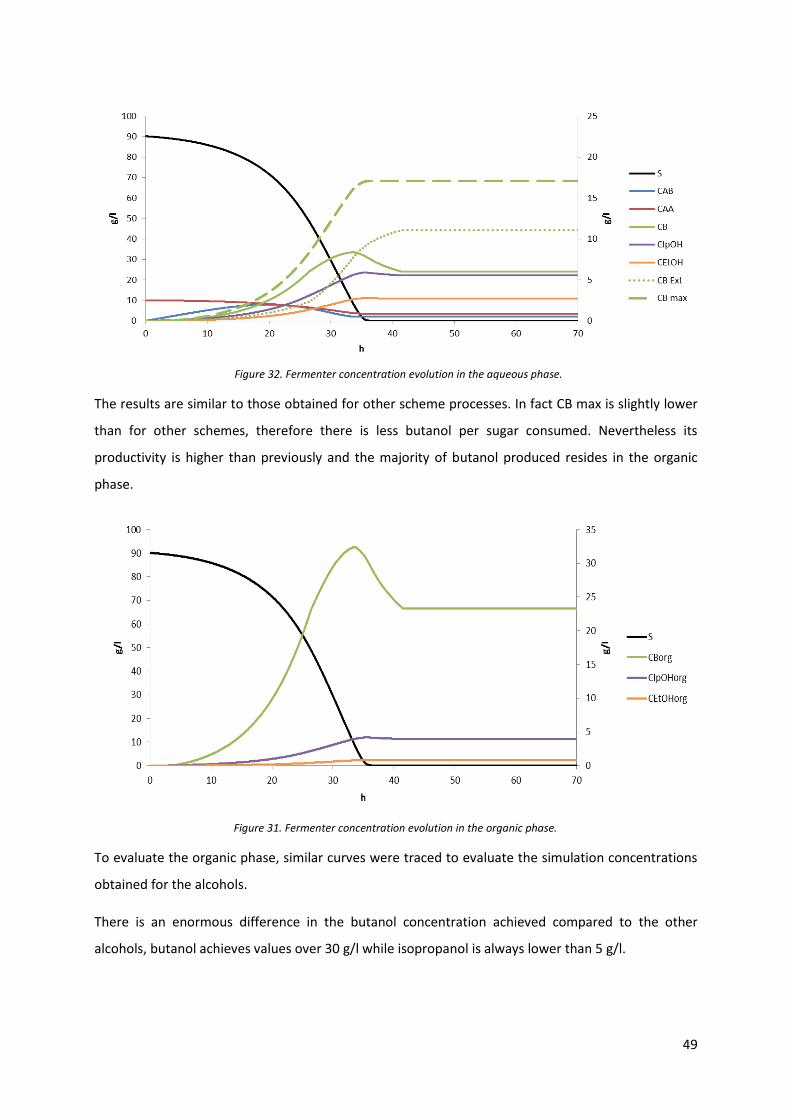
49
The results are similar to those obtained for other scheme processes. In fact CB max is slightly lower
than for other schemes, therefore there is less butanol per sugar consumed. Nevertheless its
productivity is higher than previously and the majority of butanol produced resides in the organic
phase.
To evaluate the organic phase, similar curves were traced to evaluate the simulation concentrations
obtained for the alcohols.
There is an enormous difference in the butanol concentration achieved compared to the other
alcohols, butanol achieves values over 30 g/l while isopropanol is always lower than 5 g/l.
Figure 32. Fermenter concentration evolution in the aqueous phase.
Figure 31. Fermenter concentration evolution in the organic phase.
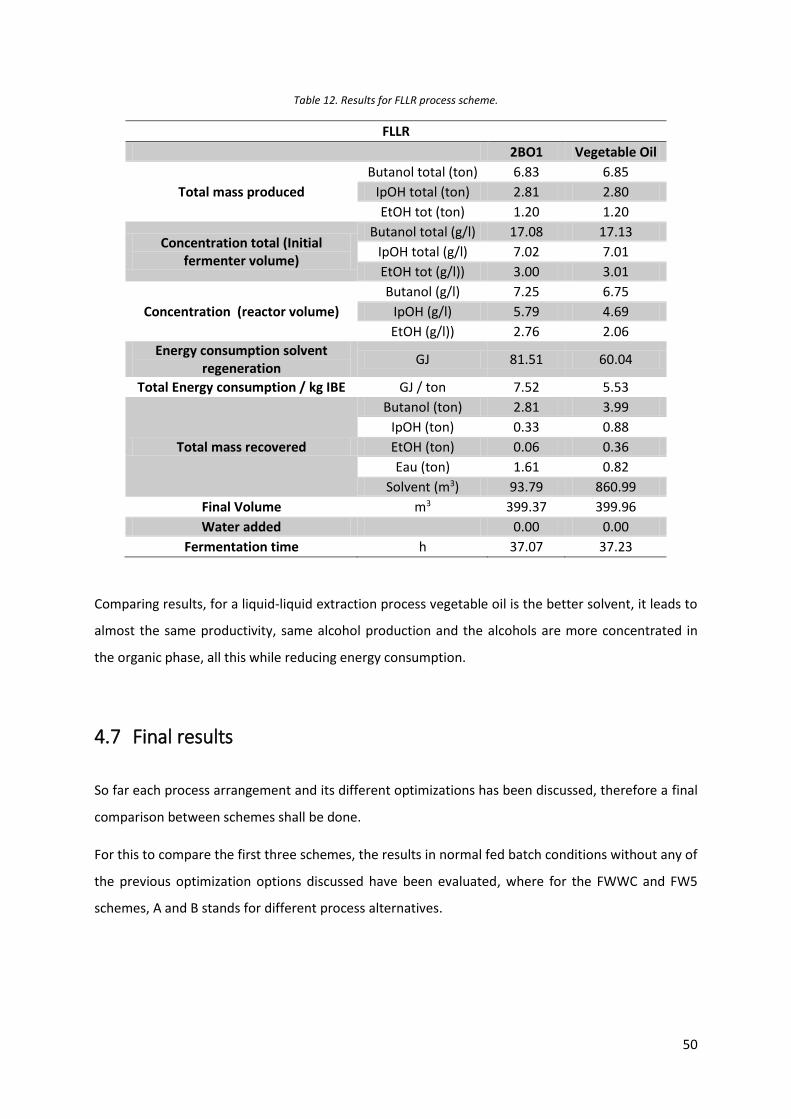
50
Table 12. Results for FLLR process scheme.
FLLR
2BO1 Vegetable Oil
Total mass produced
Butanol total (ton) 6.83 6.85
IpOH total (ton) 2.81 2.80
EtOH tot (ton) 1.20 1.20
Concentration total (Initial fermenter volume)
Butanol total (g/l) 17.08 17.13
IpOH total (g/l) 7.02 7.01
EtOH tot (g/l)) 3.00 3.01
Concentration (reactor volume)
Butanol (g/l) 7.25 6.75
IpOH (g/l) 5.79 4.69
EtOH (g/l)) 2.76 2.06
Energy consumption solvent regeneration
GJ 81.51 60.04
Total Energy consumption / kg IBE GJ / ton 7.52 5.53
Total mass recovered
Butanol (ton) 2.81 3.99
IpOH (ton) 0.33 0.88
EtOH (ton) 0.06 0.36
Eau (ton) 1.61 0.82
Solvent (m3) 93.79 860.99
Final Volume m3 399.37 399.96
Water added 0.00 0.00
Fermentation time h 37.07 37.23
Comparing results, for a liquid-liquid extraction process vegetable oil is the better solvent, it leads to
almost the same productivity, same alcohol production and the alcohols are more concentrated in
the organic phase, all this while reducing energy consumption.
4.7 Final results
So far each process arrangement and its different optimizations has been discussed, therefore a final
comparison between schemes shall be done.
For this to compare the first three schemes, the results in normal fed batch conditions without any of
the previous optimization options discussed have been evaluated, where for the FWWC and FW5
schemes, A and B stands for different process alternatives.
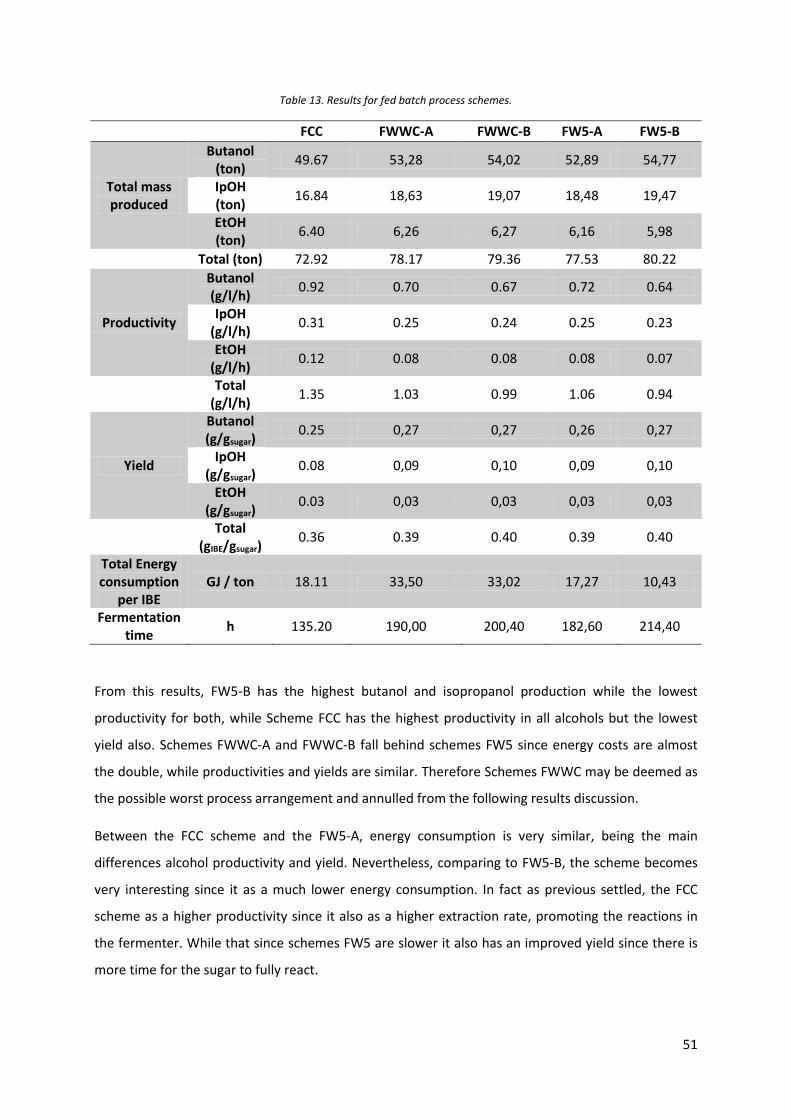
51
Table 13. Results for fed batch process schemes.
FCC FWWC-A FWWC-B FW5-A FW5-B
Total mass produced
Butanol (ton)
49.67 53,28 54,02 52,89 54,77
IpOH (ton)
16.84 18,63 19,07 18,48 19,47
EtOH (ton)
6.40 6,26 6,27 6,16 5,98
Total (ton) 72.92 78.17 79.36 77.53 80.22
Productivity
Butanol (g/l/h)
0.92 0.70 0.67 0.72 0.64
IpOH (g/l/h)
0.31 0.25 0.24 0.25 0.23
EtOH (g/l/h)
0.12 0.08 0.08 0.08 0.07
Total
(g/l/h) 1.35 1.03 0.99 1.06 0.94
Yield
Butanol (g/gsugar)
0.25 0,27 0,27 0,26 0,27
IpOH (g/gsugar)
0.08 0,09 0,10 0,09 0,10
EtOH (g/gsugar)
0.03 0,03 0,03 0,03 0,03
Total
(gIBE/gsugar) 0.36 0.39 0.40 0.39 0.40
Total Energy consumption
per IBE GJ / ton 18.11 33,50 33,02 17,27 10,43
Fermentation time
h 135.20 190,00 200,40 182,60 214,40
From this results, FW5-B has the highest butanol and isopropanol production while the lowest
productivity for both, while Scheme FCC has the highest productivity in all alcohols but the lowest
yield also. Schemes FWWC-A and FWWC-B fall behind schemes FW5 since energy costs are almost
the double, while productivities and yields are similar. Therefore Schemes FWWC may be deemed as
the possible worst process arrangement and annulled from the following results discussion.
Between the FCC scheme and the FW5-A, energy consumption is very similar, being the main
differences alcohol productivity and yield. Nevertheless, comparing to FW5-B, the scheme becomes
very interesting since it as a much lower energy consumption. In fact as previous settled, the FCC
scheme as a higher productivity since it also as a higher extraction rate, promoting the reactions in
the fermenter. While that since schemes FW5 are slower it also has an improved yield since there is
more time for the sugar to fully react.
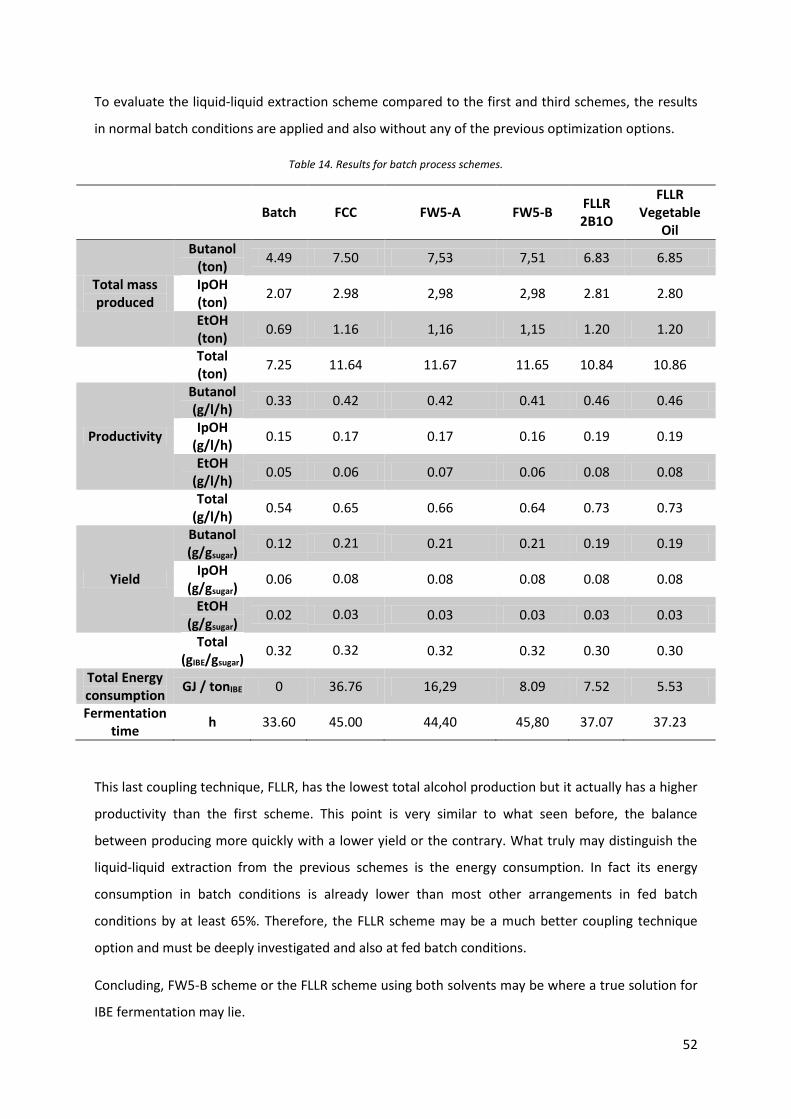
52
To evaluate the liquid-liquid extraction scheme compared to the first and third schemes, the results
in normal batch conditions are applied and also without any of the previous optimization options.
Table 14. Results for batch process schemes.
Batch FCC FW5-A FW5-B FLLR 2B1O
FLLR Vegetable
Oil
Total mass produced
Butanol (ton)
4.49 7.50 7,53 7,51 6.83 6.85
IpOH (ton)
2.07 2.98 2,98 2,98 2.81 2.80
EtOH (ton)
0.69 1.16 1,16 1,15 1.20 1.20
Total (ton)
7.25 11.64 11.67 11.65 10.84 10.86
Productivity
Butanol (g/l/h)
0.33 0.42 0.42 0.41 0.46 0.46
IpOH (g/l/h)
0.15 0.17 0.17 0.16 0.19 0.19
EtOH (g/l/h)
0.05 0.06 0.07 0.06 0.08 0.08
Total
(g/l/h) 0.54 0.65 0.66 0.64 0.73 0.73
Yield
Butanol (g/gsugar)
0.12 0.21 0.21 0.21 0.19 0.19
IpOH (g/gsugar)
0.06 0.08 0.08 0.08 0.08 0.08
EtOH (g/gsugar)
0.02 0.03 0.03 0.03 0.03 0.03
Total
(gIBE/gsugar) 0.32 0.32 0.32 0.32 0.30 0.30
Total Energy consumption
GJ / tonIBE 0 36.76 16,29 8.09 7.52 5.53
Fermentation time
h 33.60 45.00 44,40 45,80 37.07 37.23
This last coupling technique, FLLR, has the lowest total alcohol production but it actually has a higher
productivity than the first scheme. This point is very similar to what seen before, the balance
between producing more quickly with a lower yield or the contrary. What truly may distinguish the
liquid-liquid extraction from the previous schemes is the energy consumption. In fact its energy
consumption in batch conditions is already lower than most other arrangements in fed batch
conditions by at least 65%. Therefore, the FLLR scheme may be a much better coupling technique
option and must be deeply investigated and also at fed batch conditions.
Concluding, FW5-B scheme or the FLLR scheme using both solvents may be where a true solution for
IBE fermentation may lie.
53
5 Conclusions
A first study of the downstream recovery for different feed compositions and a model for in situ
coupling techniques has been developed.
Regarding the downstream processing study developed, three different distillation schemes were
established and results according to the bibliographic study were obtained in terms of great energy
reduction of separation only by concentrating the fermentation broth.
Concerning the model developed for the in situ recovering techniques four different process
schemes were studied and energy requirements similar to the shown in the state of art were
achieved. Also the impact of condenser temperatures and gas stripping initiation were evaluated.
Preliminary concentration potential of each process scheme was established.
Comparing the results for each process scheme the economic advantageous may be expected and
therefore the FWWC scheme was assumed as the less recommendable. While that the FLLR scheme
was deemed the most promising in spite of not having achieved results in fed batch conditions.
In terms of solvent selection, results using vegetable oil seem more promising in preliminary
calculations.
Nevertheless there are many improvements needed to achieve a final work and conclusion of the
impact of the many variables in the process to obtain the minimal project cost. For that the FLLR
scheme as to be simulated in fed batch conditions since is the most promising process and fed batch
conditions are desired. In the fermentation model CO2 formation should be included and this gas
should be used as extracting agent for gas stripping. The acids extraction by the extraction should
also be taken into account, as well as a more rigorous heat balance for each process scheme. All
process schemes can be further optimized in terms of the alcohols concentration range in which the
extraction agent is active.
Despite the model providing promising results it still takes much time to compute, hence further
optimization of the model is needed to be able to obtain optimizations results much quicker and
easier in order to provide a more rigorous study for the many process variables.
To grasp a real economic value distillation schemes can still be improved and also a deep study has to
be made focused in how to separate each process stream obtained in the in situ recovery technique
scheme. In fact different approaches can be made, all alcohol recovered streams may be mixed and
depending to its final concentration sent to the according distillation scheme or each stream can be

54
sent to different distillation schemes or even in the same distillation scheme but sent to different
columns according to its titer.
Last but not least the final evaluation of the project consists in the revenue obtained, thus a deeper
economic analysis as to be made to evaluate the total CAPEX, OPEX and raw material costs for each
process scheme and the possible separation by distillation alternatives.
55
6 References
[1] E. Sanchez-Ramírez, J. J. Quiroz-Ramírez, J. G. Segovia-Hernandez, S. Hernandez and A. Bonilla-
Petriciolet, "Process Alternatives for Biobutanol Purification: Design and Optimization," Ind. Eng.
Chem. Res., no. 54, p. 351−358, 2015.
[2] T. de Vrije, M. Budde, H. van der Wal, P. A. Claassen and A. M. López-Contreras, "‘‘In situ’’
removal of isopropanol, butanol and ethanol from fermentation broth by gas stripping," Elsevier,
no. Bioresource Technology 137, pp. 153-159, 2013.
[3] C. Xue, J. Zhao, F. Liu, C. Lu, S.-T. Yang and F.-W. Bai, "Two-stage in situ gas stripping for
enhanced butanol fermentation and energy-saving product recovery," Elsevier, no. Bioresource
Technology 135, p. 396–402, 2012.
[4] C. Xue, J.-B. Zhao, L.-J. Chen, F.-W. Bai, S.-T. Yang and J.-X. Sun, "Integrated butanol recovery for
an advanced biofuel: current state and prospects," Springer-Verlag Berlin Heidelberg , pp. 5561-
5566, 2014.
[5] F. Collas, "Production of isopropanol, butanol and ethanol by metabolic engineered Clostridia,"
AgroParisTech, Paris, 2012.
[6] J. Knifton and P. Dai , "Diisopropyl ether syntheses from crude acetone," Catalysis Letters, no.
57, pp. 193-197, 1999).
[7] S. B. Bankar, G. Jurgens, S. A. Survase, H. Ojamo and T. Granström, "Enhanced isopropanol–
butanol–ethanol (IBE) production in immobilized," Elsevier Ltd., no. Fuel 136, p. 226–232, 2014.
[8] M. Hermann , F. Fayolle , R. Marchal , L. Podvin and M. Sebald , "Isolation and characterization
of butanol-resistant mutants of Clostridium acetobutylicum.," Appl Environ Microbiol, no. 50, pp.
1238-1243, 1985.
[9] T. Ezeji, N. Qureshi and H. Blaschek , "Production of acetone butanol (AB) from liquefied corn
starch, a commercial substrate, using Clostridium beijerinckii coupled with product recovery by
gas stripping," Ind Microbiol Biotechnol , no. 34, pp. 771-777, 2007.
[10] T. Jesse , T. Ezeji , N. Qureshi and H. Blaschek , "Production of butanol from starch-based waste
packing peanuts and agricultural waste," Ind Microbiol Biotechnol, no. 29, pp. 117-123, 2002.
[11] T. Ezeji , M. Groberg , N. Qureshi and H. Blaschek, "Continuous production of butanol from
starch-based packing peanuts," Appl Biochem Biotechnol, no. 105, pp. 375-382, 2003.
[12] C. Lapierre , "Application of new methods for the investigation of lignin structure," in Forage Cell
Wall Structure and Digestibility, ASA-CSSA-SSSA, 1993, pp. 133-166.
[13] R. Marchal, M. Ropars and J. Vandecasteele , "Conversion into acetone and butanol of
lignocellulosic substrates pretreated by steam explosion," Biotechnol Lett, no. 8, pp. 365-370,
1986.
56
[14] R. Marchal, M. Ropars, J. Pourquie, F. Fayolle and J. Vandecasteele, "Large-scale enzymatic-
hydrolysis of agricultural lignocellulosic biomass conversion into acetone-butanol," Bioresource
Technology, no. 42, pp. 205-217, 1992.
[15] N. Qureshi, X. Li, S. Hughes, B. Saha and M. Cotta, "Butanol production from corn fiber xylan
using Clostridium acetobutylicum," Biotechnol Prog, no. 22, pp. 673-680, 2006.
[16] T. Ezeji and H. Blaschek, "Fermentation of dried distillers’ grains and solubles (DDGS)
hydrolysates to solvents and value-added products by solventogenic Clostridia," Bioresour
Technol, no. 99, pp. 5232-5242, 2008.
[17] J. Lee, E. Seo, D. Kweon, K. Park and Y. Jin, "Fermentation of Rice Bran and Defatted Rice Bran
for Butanol Production Using Clostridium beijerinckii NCIMB 8052," Microbiol Biotechn, no. 19,
pp. 482-490, 2009.
[18] H. G. Peñas, "Collaborative research project in the development of a biochemical production
process. Application: ABE extractive fermentation".
[19] L. M. Vane, "Separation technologies for the recovery and dehydration of alcohols from
fermentation broths," Biofuels, Bioprod. Bioref. 2, 2008.
[20] J. M. Woodley , M. Bisschops , A. . J. J. Straathof and M. Ottens , "Future directions for in –situ
product removal (ISPR)," J. Chem. Technol. Biotechnol., no. 83, pp. 121-123, 2008.
[21] W. V. Hecke, G. Kaur and H. De Wever, "Advances in in-situ product recovery (ISPR) in whole cell
biotechnology during the last decade," Elsevier, no. Biotechnology Advances 32, p. 1245–1255,
2014.
[22] C. Xue, J. Zhao, C. Lu, S.-T. Yang, F. Bai and I.-C. Tang, "High-titer n-butanol production by
clostridium acetobutylicum JB200 in fed-batch fermentation with intermittent gas stripping,"
Biotechnology and Bioengineering, vol. 109, no. 11, p. 2746–2756, 2012.
[23] S. Bankar, S. Survase, S. Singhal and T. Granström, "Continuous two-stage acetone-butanol-
ethanol fermentationwith integrated solvent removal using Clostridium acetobutylicum B 5313,"
Bioresour Technol, no. 106, p. 110–116, 2012.
[24] T. Ezeji, N. Qureshi and H. Blaschek , "Production of acetone, butanol and ethanol by Clostridium
beijerinckii BA101 and in situ recovery by gas stripping," World J Microbiol Biotechnol, no. 19, p.
595–603, 2003.
[25] T. Ezeji, N. Qureshi and H. Blaschek, "Acetone butanol ethanol (ABE) production from
concentrated substrate: reduction in substrate inhibition by fed-batch technique and product
inhibition by gas stripping," Appl Microbiol Biotechnol, no. 63, p. 653–658, 2004.
[26] N. Qureshi and I. Maddox, "Reduction in butanol inhibition by perstraction: utilization of
concentrated lactose/whey permeate by Clostridium acetobutylicum to enhance butanol
fermentation economics," Food Bioprod Process, no. 83, pp. 43-52, 2005.
[27] B. Ennis, C. Marshall, I. Maddox and A. Paterson, "Continuous product recovery by in-situ gas
stripping/condensation during solvent production from whey permeate using Clostridium
57
acetobutylicum," Biotechnol Lett, no. 8, p. 725–730, 1986.
[28] F. Taylor , M. Kurantz, N. Goldberg and J. Craig, "Continuous fermentation and stripping of
ethanol," Biotechnol Prog, no. 11, p. 693–698 , 1995.
[29] R. Baker, J. Kaschemekat, J. Wijmans and H. Kamaruddin, "Process for removing an organic
compound from water". Inc. US Patent Patent 5,273,572 , 1993.
[30] C. Ribeiro, C. Borges and P. Lage, "A new route combining direct-contact evaporation and vapor
permeation for obtaining high-quality fruit juice concentrates," Ind Eng Chem Res, no. 44, p.
6888–6902, 2005.
[31] W. J. Groot, R. van der Lans and K. Luyben, "Technologies for Butanol recovery integrated with
fermentations”," Process Biochem, no. 27, pp. 61-75, 1991.
[32] B. Ennis, N. Qureshi and I. Maddox, "In-line toxic product removal during solvent production by
continuous fermentation using immobilized Clostridium acetobutylicum," Enzyme Microb
Technol , no. 9, p. 672–675 , 1987.
[33] W. Groot and K. Luyben, "In situ product recovery by adsorption in the butanol/isopropanol
batch fermentation," Appl Microbiol Biotechnol, no. 25, p. 29–31, 1986.
[34] N. Milestone and D. Bibby, "Concentration of alcohols by adsorption on silicate," J Chem Technol
Biotechnol , no. 31, p. 732–736, 1981.
[35] C. Munson and C. King, "Factors influencing solvent selection for extraction of ethanol from
aqueous solutions," Ind Eng Chem Proc ResDev, no. 23, p. 109–115, 1984.
[36] R. Offeman, S. Stephenson, G. Robertson and W. Orts, "Solvent extraction of ethanol from
aqueous solutions. I. Screening methodology for solvents," Ind Eng Chem Res , no. 44, p. 6789–
6796, 2005.
[37] L. Vane, F. Alvarez, A. Mairal and R. Baker, "Separation of vapor-phase alcohol/water mixtures
via fractional condensation using a pilot-scale dephlegmator: Enhancement of the pervaporation
process separation factor," Ind Eng Chem Res , no. 43, p. 173–183, 2004.
[38] N. Qhreshi , S. Hughes , I. S. Maddox and M. A. Cotta, "Energy-efficient recovery of butanol from
model solutions and fermentation broth by adsorption," Bioprocess Biosyst. Eng., no. 27, pp.
215-222, 2005.
[39] N. Qhreshi , I. Maddox and A. Friedl , "Application of continuous substrate feeding to the ABE
fermentation: relief of product inhibition using extraction, perstraction, stripping and
pervaporation," Biotechnol Prog, no. 8, pp. 382-390, 1992.

58
This page was left intentionally in blank.
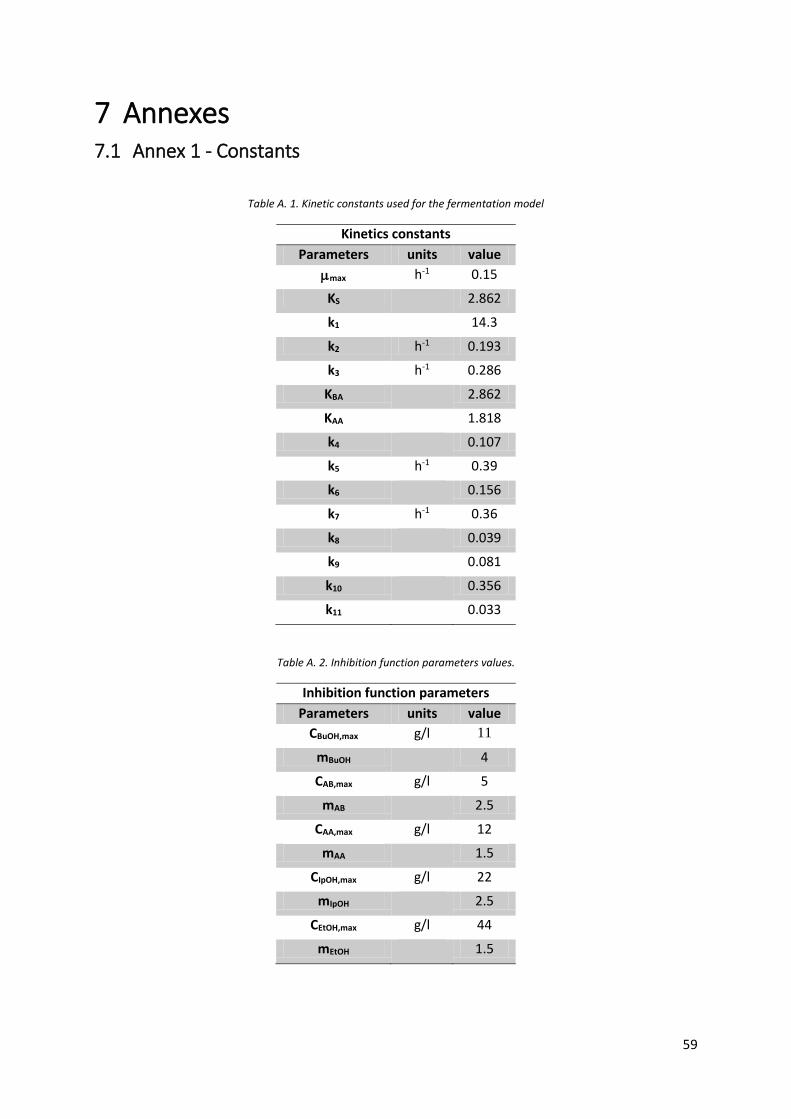
59
7 Annexes 7.1 Annex 1 - Constants
Table A. 1. Kinetic constants used for the fermentation model
Kinetics constants
Parameters units value
max h-1 0.15
KS 2.862
k1 14.3
k2 h-1 0.193
k3 h-1 0.286
KBA 2.862
KAA 1.818
k4 0.107
k5 h-1 0.39
k6 0.156
k7 h-1 0.36
k8 0.039
k9 0.081
k10 0.356
k11 0.033
Table A. 2. Inhibition function parameters values.
Inhibition function parameters
Parameters units value
CBuOH,max g/l 11
mBuOH 4
CAB,max g/l 5
mAB 2.5
CAA,max g/l 12
mAA 1.5
CIpOH,max g/l 22
mIpOH 2.5
CEtOH,max g/l 44
mEtOH 1.5
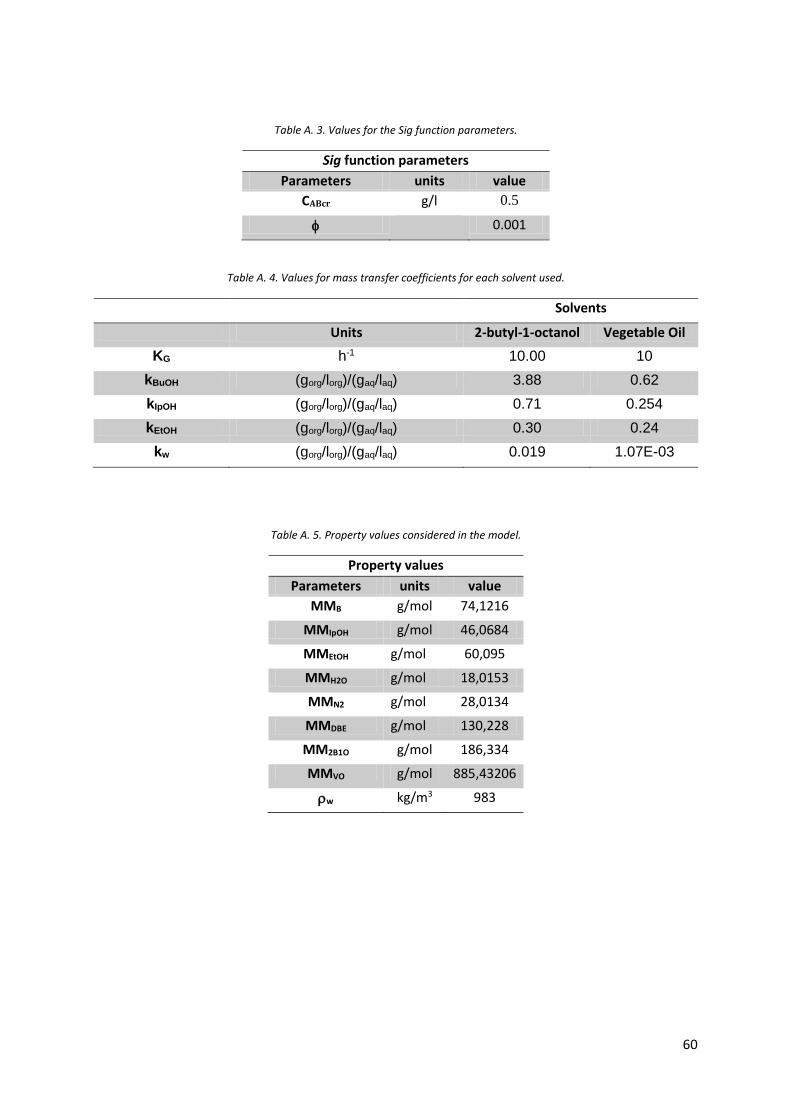
60
Table A. 3. Values for the Sig function parameters.
Sig function parameters
Parameters units value
CABcr g/l 0.5
0.001
Table A. 4. Values for mass transfer coefficients for each solvent used.
Solvents
Units 2-butyl-1-octanol Vegetable Oil
KG h-1 10.00 10
kBuOH (gorg/lorg)/(gaq/laq) 3.88 0.62
kIpOH (gorg/lorg)/(gaq/laq) 0.71 0.254
kEtOH (gorg/lorg)/(gaq/laq) 0.30 0.24
kw (gorg/lorg)/(gaq/laq) 0.019 1.07E-03
Table A. 5. Property values considered in the model.
Property values
Parameters units value
MMB g/mol 74,1216
MMIpOH g/mol 46,0684
MMEtOH g/mol 60,095
MMH2O g/mol 18,0153
MMN2 g/mol 28,0134
MMDBE g/mol 130,228
MM2B1O g/mol 186,334
MMVO g/mol 885,43206
w kg/m3 983
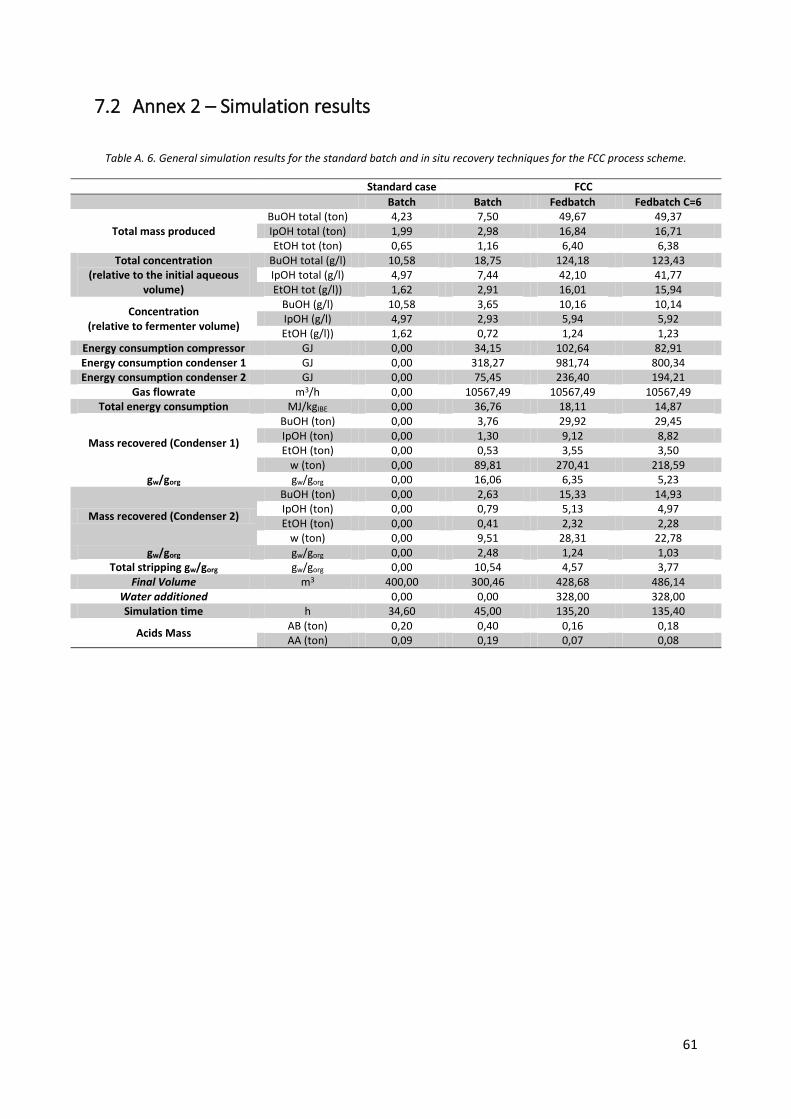
61
7.2 Annex 2 – Simulation results
Table A. 6. General simulation results for the standard batch and in situ recovery techniques for the FCC process scheme.
Standard case FCC
Batch Batch Fedbatch Fedbatch C=6
Total mass produced BuOH total (ton) 4,23 7,50 49,67 49,37 IpOH total (ton) 1,99 2,98 16,84 16,71 EtOH tot (ton) 0,65 1,16 6,40 6,38
Total concentration (relative to the initial aqueous
volume)
BuOH total (g/l) 10,58 18,75 124,18 123,43 IpOH total (g/l) 4,97 7,44 42,10 41,77 EtOH tot (g/l)) 1,62 2,91 16,01 15,94
Concentration (relative to fermenter volume)
BuOH (g/l) 10,58 3,65 10,16 10,14 IpOH (g/l) 4,97 2,93 5,94 5,92 EtOH (g/l)) 1,62 0,72 1,24 1,23
Energy consumption compressor GJ 0,00 34,15 102,64 82,91 Energy consumption condenser 1 GJ 0,00 318,27 981,74 800,34 Energy consumption condenser 2 GJ 0,00 75,45 236,40 194,21
Gas flowrate m3/h 0,00 10567,49 10567,49 10567,49 Total energy consumption MJ/kgIBE 0,00 36,76 18,11 14,87
Mass recovered (Condenser 1)
BuOH (ton) 0,00 3,76 29,92 29,45 IpOH (ton) 0,00 1,30 9,12 8,82 EtOH (ton) 0,00 0,53 3,55 3,50
w (ton) 0,00 89,81 270,41 218,59 gw/gorg gw/gorg 0,00 16,06 6,35 5,23
Mass recovered (Condenser 2)
BuOH (ton) 0,00 2,63 15,33 14,93 IpOH (ton) 0,00 0,79 5,13 4,97 EtOH (ton) 0,00 0,41 2,32 2,28
w (ton) 0,00 9,51 28,31 22,78 gw/gorg gw/gorg 0,00 2,48 1,24 1,03
Total stripping gw/gorg gw/gorg 0,00 10,54 4,57 3,77 Final Volume m3 400,00 300,46 428,68 486,14
Water additioned
0,00 0,00 328,00 328,00 Simulation time h 34,60 45,00 135,20 135,40
Acids Mass AB (ton) 0,20 0,40 0,16 0,18 AA (ton) 0,09 0,19 0,07 0,08

62
This page was left intentionally in blank.
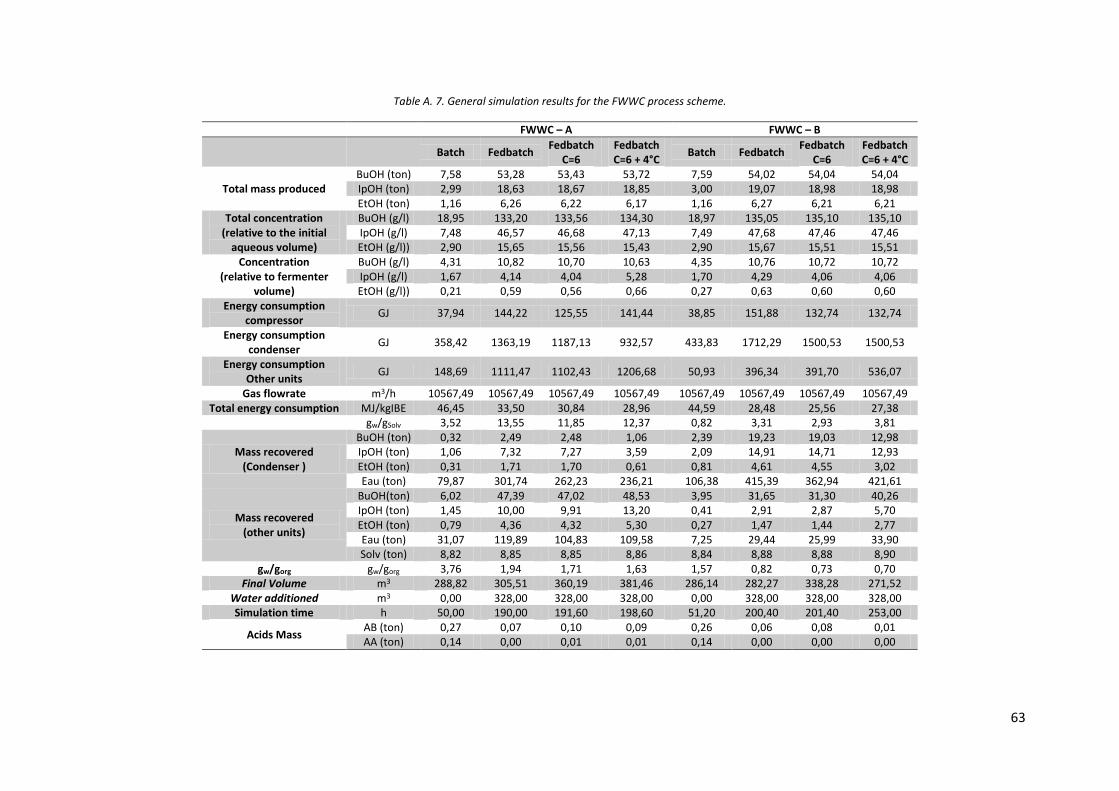
63
Table A. 7. General simulation results for the FWWC process scheme.
FWWC – A FWWC – B
Batch Fedbatch
Fedbatch C=6
Fedbatch C=6 + 4°C
Batch Fedbatch Fedbatch
C=6 Fedbatch C=6 + 4°C
Total mass produced BuOH (ton) 7,58 53,28 53,43 53,72 7,59 54,02 54,04 54,04 IpOH (ton) 2,99 18,63 18,67 18,85 3,00 19,07 18,98 18,98 EtOH (ton) 1,16 6,26 6,22 6,17 1,16 6,27 6,21 6,21
Total concentration (relative to the initial
aqueous volume)
BuOH (g/l) 18,95 133,20 133,56 134,30 18,97 135,05 135,10 135,10 IpOH (g/l) 7,48 46,57 46,68 47,13 7,49 47,68 47,46 47,46 EtOH (g/l)) 2,90 15,65 15,56 15,43 2,90 15,67 15,51 15,51
Concentration (relative to fermenter
volume)
BuOH (g/l) 4,31 10,82 10,70 10,63 4,35 10,76 10,72 10,72 IpOH (g/l) 1,67 4,14 4,04 5,28 1,70 4,29 4,06 4,06 EtOH (g/l)) 0,21 0,59 0,56 0,66 0,27 0,63 0,60 0,60
Energy consumption compressor
GJ 37,94 144,22 125,55 141,44 38,85 151,88 132,74 132,74
Energy consumption condenser
GJ 358,42 1363,19 1187,13 932,57 433,83 1712,29 1500,53 1500,53
Energy consumption Other units
GJ 148,69 1111,47 1102,43 1206,68 50,93 396,34 391,70 536,07
Gas flowrate m3/h 10567,49 10567,49 10567,49 10567,49 10567,49 10567,49 10567,49 10567,49 Total energy consumption MJ/kgIBE 46,45 33,50 30,84 28,96 44,59 28,48 25,56 27,38
gw/gSolv 3,52 13,55 11,85 12,37 0,82 3,31 2,93 3,81
Mass recovered (Condenser )
BuOH (ton) 0,32 2,49 2,48 1,06 2,39 19,23 19,03 12,98 IpOH (ton) 1,06 7,32 7,27 3,59 2,09 14,91 14,71 12,93 EtOH (ton) 0,31 1,71 1,70 0,61 0,81 4,61 4,55 3,02 Eau (ton) 79,87 301,74 262,23 236,21 106,38 415,39 362,94 421,61
Mass recovered (other units)
BuOH(ton) 6,02 47,39 47,02 48,53 3,95 31,65 31,30 40,26 IpOH (ton) 1,45 10,00 9,91 13,20 0,41 2,91 2,87 5,70 EtOH (ton) 0,79 4,36 4,32 5,30 0,27 1,47 1,44 2,77 Eau (ton) 31,07 119,89 104,83 109,58 7,25 29,44 25,99 33,90 Solv (ton) 8,82 8,85 8,85 8,86 8,84 8,88 8,88 8,90
gw/gorg gw/gorg 3,76 1,94 1,71 1,63 1,57 0,82 0,73 0,70 Final Volume m3 288,82 305,51 360,19 381,46 286,14 282,27 338,28 271,52
Water additioned m3 0,00 328,00 328,00 328,00 0,00 328,00 328,00 328,00 Simulation time h 50,00 190,00 191,60 198,60 51,20 200,40 201,40 253,00
Acids Mass AB (ton) 0,27 0,07 0,10 0,09 0,26 0,06 0,08 0,01 AA (ton) 0,14 0,00 0,01 0,01 0,14 0,00 0,00 0,00
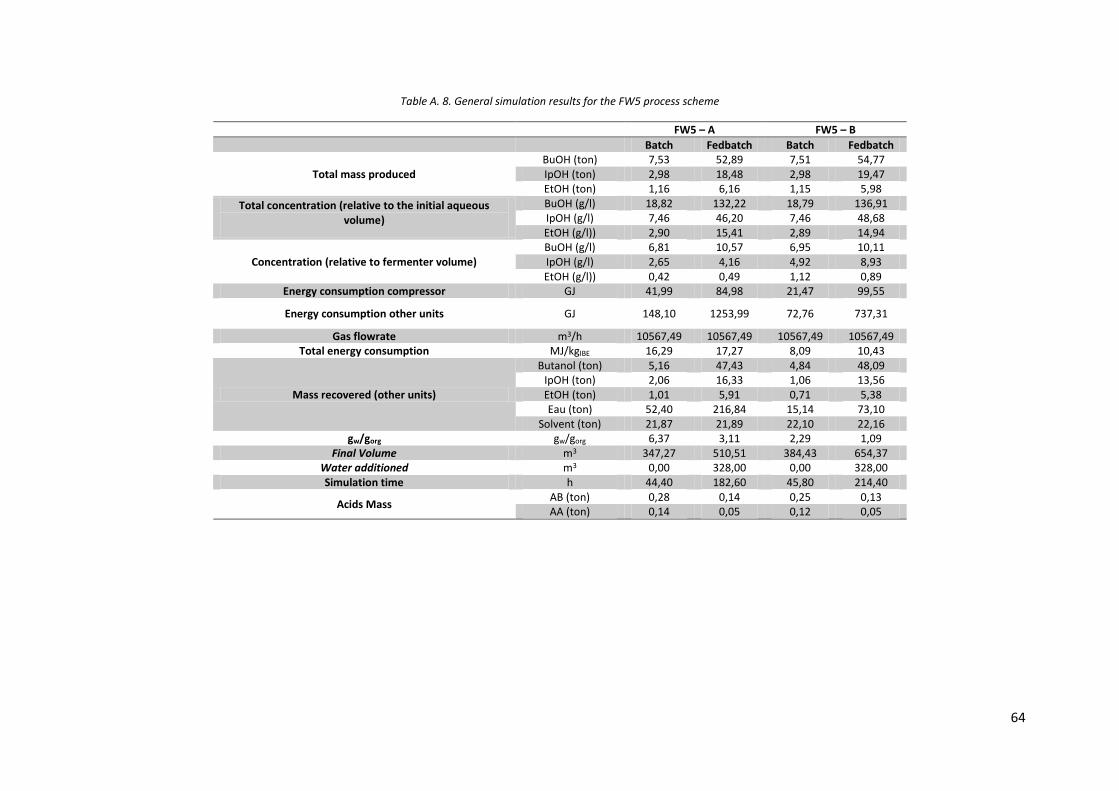
64
Table A. 8. General simulation results for the FW5 process scheme
FW5 – A FW5 – B
Batch Fedbatch Batch Fedbatch
Total mass produced BuOH (ton) 7,53 52,89 7,51 54,77 IpOH (ton) 2,98 18,48 2,98 19,47 EtOH (ton) 1,16 6,16 1,15 5,98
Total concentration (relative to the initial aqueous volume)
BuOH (g/l) 18,82 132,22 18,79 136,91 IpOH (g/l) 7,46 46,20 7,46 48,68 EtOH (g/l)) 2,90 15,41 2,89 14,94
Concentration (relative to fermenter volume) BuOH (g/l) 6,81 10,57 6,95 10,11 IpOH (g/l) 2,65 4,16 4,92 8,93 EtOH (g/l)) 0,42 0,49 1,12 0,89
Energy consumption compressor GJ 41,99 84,98 21,47 99,55
Energy consumption other units GJ 148,10 1253,99 72,76 737,31
Gas flowrate m3/h 10567,49 10567,49 10567,49 10567,49 Total energy consumption MJ/kgIBE 16,29 17,27 8,09 10,43
Mass recovered (other units)
Butanol (ton) 5,16 47,43 4,84 48,09 IpOH (ton) 2,06 16,33 1,06 13,56 EtOH (ton) 1,01 5,91 0,71 5,38 Eau (ton) 52,40 216,84 15,14 73,10
Solvent (ton) 21,87 21,89 22,10 22,16 gw/gorg gw/gorg 6,37 3,11 2,29 1,09
Final Volume m3 347,27 510,51 384,43 654,37 Water additioned m3 0,00 328,00 0,00 328,00 Simulation time h 44,40 182,60 45,80 214,40
Acids Mass AB (ton) 0,28 0,14 0,25 0,13 AA (ton) 0,14 0,05 0,12 0,05
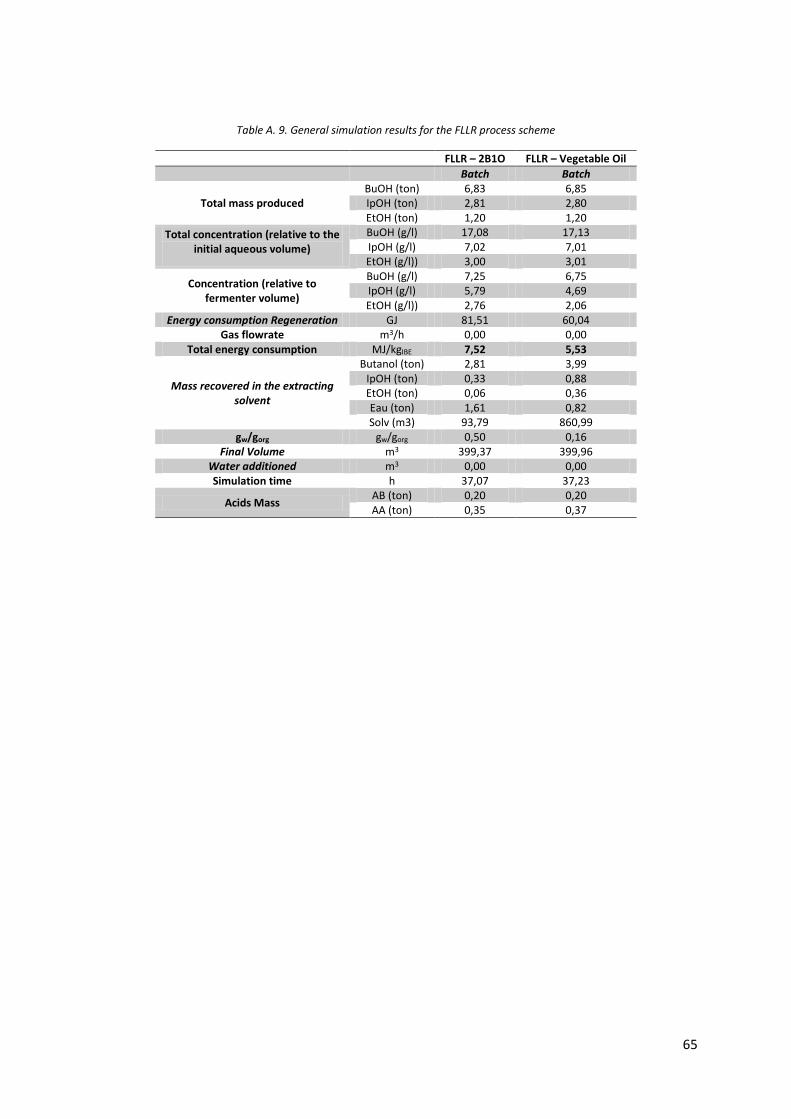
65
Table A. 9. General simulation results for the FLLR process scheme
FLLR – 2B1O FLLR – Vegetable Oil
Batch Batch
Total mass produced BuOH (ton) 6,83 6,85 IpOH (ton) 2,81 2,80 EtOH (ton) 1,20 1,20
Total concentration (relative to the initial aqueous volume)
BuOH (g/l) 17,08 17,13 IpOH (g/l) 7,02 7,01 EtOH (g/l)) 3,00 3,01
Concentration (relative to fermenter volume)
BuOH (g/l) 7,25 6,75 IpOH (g/l) 5,79 4,69 EtOH (g/l)) 2,76 2,06
Energy consumption Regeneration GJ 81,51 60,04 Gas flowrate m3/h 0,00 0,00
Total energy consumption MJ/kgIBE 7,52 5,53
Mass recovered in the extracting solvent
Butanol (ton) 2,81 3,99 IpOH (ton) 0,33 0,88 EtOH (ton) 0,06 0,36 Eau (ton) 1,61 0,82 Solv (m3) 93,79 860,99
gw/gorg gw/gorg 0,50 0,16 Final Volume m3 399,37 399,96
Water additioned m3 0,00 0,00 Simulation time h 37,07 37,23
Acids Mass AB (ton) 0,20 0,20 AA (ton) 0,35 0,37

66
This page was left intentionally in blank.