Embed Size (px)
Citation preview

Royal Dutch Shell March 21, 2018
Royal Dutch Shell plcMarch 21, 2018
Downstream Open HouseDelivering a world-class investment case
#makethefuture

Royal Dutch Shell March 21, 2018
John AbbottDownstream DirectorRoyal Dutch Shell

Royal Dutch Shell March 21, 2018 3
Definitions & cautionary note
Reserves: Our use of the term “reserves” in this presentation means SEC proved oil and gas reserves. Resources: Our use of the term “resources” in this presentation includes quantities of oil and gas not yet classified as SEC proved oil and gas reserves. Resources are consistent with the Society of Petroleum Engineers (SPE) 2P + 2C definitions.
The Mountains and Oceans scenarios are based on plausible assumptions and quantification, and they are designed to stretch management thinking and even to consider events that may only be remotely possible. Scenarios therefore, are not intended to be prediction of likely future events or outcomes. Accordingly, investors should not rely on them when making an investment decision with regard to Royal Dutch Shell plc securities.
Operating costs are defined as underlying operating expenses, which are operating expenses less identified items. Organic free cash flow is defined as free cash flow excluding inorganic capital investment and divestment proceeds. Unit costs for Refining and Trading are defined as operating expenses divided by refinery intake volumes. Yield on costs for Marketing are defined as CCS earnings excluding identified items divided by operating expenses. Integrated indicative margin is defined as a theoretical margin available to be captured by our integrated portfolio of Refining and Trading assets excluding portfolio impact. Breakeven margin is defined as minimum integrated margin required for zero earnings in Refining and Trading.. Gross margin is defined as net proceeds less cost of goods sold, on a CCS basis, and primary transport expenses. Income per site is defined as ratio of CCS earnings excluding identified items to the total number of Retail branded sites. Sales by region is defined as sales volumes across each of the regions Americas, East and Europe & Africa. Earnings per FTE is defined as ratio of CCS earnings excluding identified items to the number of employees in Lubricants, Aviation and Specialties. Clean CCS ROACE (Return on Average Capital Employed) is defined as defined as the sum of CCS earnings attributable to shareholders excluding identified items for the current and previous three quarters, as a percentage of the average capital employed for the same period. Capital employed consists of total equity, current debt and non-current debt. Capital investment comprises capital expenditure, exploration expense excluding well write-offs, new investments in joint ventures and associates, new finance leases and investments in Integrated Gas, Upstream and Downstream securities, all of which on an accruals basis.. Divestments comprises proceeds from sale of property, plant and equipment and businesses, joint ventures and associates, and other Integrated Gas, Upstream and Downstream investments, reported in “Cash flow from investing activities (CFFI)”, adjusted onto an accruals basis and for any share consideration received or contingent consideration recognised upon divestment, as well as proceeds from the sale of interests in entities while retaining control (for example, proceeds from sale of interest in Shell Midstream Partners, L.P.), This presentation contains the following forward-looking Non-GAAP measures: Organic Free Cash Flow, Free Cash Flow, Capital Investment, CCS Earnings less identified items, Operating Expenses, ROACE, Capital Employed and Divestments. We are unable to provide a reconciliation of the above forward-looking Non-GAAP measures to the most comparable GAAP financial measures because certain information needed to reconcile the above Non-GAAP measure to the most comparable GAAP financial measure is dependent on future events some which are outside the control of the company, such as oil and gas prices, interest rates and exchange rates. Moreover, estimating such GAAP measures consistent with the company accounting policies and the required precision necessary to provide a meaningful reconciliation is extremely difficult and could not be accomplished without unreasonable effort. Non-GAAP measures in respect of future periods which cannot be reconciled to the most comparable GAAP financial measure are calculated in a manner which is consistent with the accounting policies applied in Royal Dutch Shell plc’s financial statements. The financial measures provided by strategic themes represent a notional allocation of ROACE, capital employed, capital investment, free cash flow, organic free cash flow and underlying operating expenses of Shell’s strategic themes. Shell’s segment reporting under IFRS 8 remains Integrated Gas, Upstream, Downstream and Corporate.
The companies in which Royal Dutch Shell plc directly and indirectly owns investments are separate legal entities. In this presentation “Shell”, “Shell group” and “Royal Dutch Shell” are sometimes used for convenience where references are made to Royal Dutch Shell plc and its subsidiaries in general. Likewise, the words “we”, “us” and “our” are also used to refer to Royal Dutch Shell plc and subsidiaries in general or to those who work for them. These terms are also used where no useful purpose is served by identifying the particular entity or entities. ‘‘Subsidiaries’’, “Shell subsidiaries” and “Shell companies” as used in this presentation refer to entities over which Royal Dutch Shell plc either directly or indirectly has control. Entities and unincorporated arrangements over which Shell has joint control are generally referred to as “joint ventures” and “joint operations”, respectively. Entities over which Shell has significant influence but neither control nor joint control are referred to as “associates”. The term “Shell interest” is used for convenience to indicate the direct and/or indirect ownership interest held by Shell in an entity or unincorporated joint arrangement, after exclusion of all third-party interest.
This presentation contains forward-looking statements (within the meaning of the U.S. Private Securities Litigation Reform Act of 1995) concerning the financial condition, results of operations and businesses of Royal Dutch Shell. All statements other than statements of historical fact are, or may be deemed to be, forward-looking statements. Forward-looking statements are statements of future expectations that are based on management’s current expectations and assumptions and involve known and unknown risks and uncertainties that could cause actual results, performance or events to differ materially from those expressed or implied in these statements. Forward-looking statements include, among other things, statements concerning the potential exposure of Royal Dutch Shell to market risks and statements expressing management’s expectations, beliefs, estimates, forecasts, projections and assumptions. These forward-looking statements are identified by their use of terms and phrases such as “aim”, “ambition’, ‘‘anticipate’’, ‘‘believe’’, ‘‘could’’, ‘‘estimate’’, ‘‘expect’’, ‘‘goals’’, ‘‘intend’’, ‘‘may’’, ‘‘objectives’’, ‘‘outlook’’, ‘‘plan’’, ‘‘probably’’, ‘‘project’’, ‘‘risks’’, “schedule”, ‘‘seek’’, ‘‘should’’, ‘‘target’’, ‘‘will’’ and similar terms and phrases. There are a number of factors that could affect the future operations of Royal Dutch Shell and could cause those results to differ materially from those expressed in the forward-looking statements included in this presentation, including (without limitation): (a) price fluctuations in crude oil and natural gas; (b) changes in demand for Shell’s products; (c) currency fluctuations; (d) drilling and production results; (e) reserves estimates; (f) loss of market share and industry competition; (g) environmental and physical risks; (h) risks associated with the identification of suitable potential acquisition properties and targets, and successful negotiation and completion of such transactions; (i) the risk of doing business in developing countries and countries subject to international sanctions; (j) legislative, fiscal and regulatory developments including regulatory measures addressing climate change; (k) economic and financial market conditions in various countries and regions; (l) political risks, including the risks of expropriation and renegotiation of the terms of contracts with governmental entities, delays or advancements in the approval of projects and delays in the reimbursement for shared costs; and (m) changes in trading conditions. No assurance is provided that future dividend payments will match or exceed previous dividend payments. All forward-looking statements contained in this presentation are expressly qualified in their entirety by the cautionary statements contained or referred to in this section. Readers should not place undue reliance on forward-looking statements. Additional risk factors that may affect future results are contained in Royal Dutch Shell’s 20-F for the year ended December 31, 2017 (available at www.shell.com/investor and www.sec.gov ). These risk factors also expressly qualify all forward looking statements contained in this presentation and should be considered by the reader. Each forward-looking statement speaks only as of the date of this presentation, March 21, 2018. Neither Royal Dutch Shell plc nor any of its subsidiaries undertake any obligation to publicly update or revise any forward-looking statement as a result of new information, future events or other information. In light of these risks, results could differ materially from those stated, implied or inferred from the forward-looking statements contained in this presentation. We may have used certain terms, such as resources, in this presentation that United States Securities and Exchange Commission (SEC) strictly prohibits us from including in our filings with the SEC. U.S. Investors are urged to consider closely the disclosure in our Form 20-F, File No 1-32575, available on the SEC website www.sec.gov

Royal Dutch Shell March 21, 2018Royal Dutch Shell March 21, 2018 4
Summary Key messages
Significant and increasing cash and returns to support world-class investment case
Increasing portfolio resilience, leveraging technology, digitalisation and new business models
Transformational and profitable growth
Organic free cash flow per annum:
by 2020: $6-7 billion
by 2025: $9-12 billion
Capital employed by 2025: Oil Products: + 30-35%; Chemicals: +>50%
ROACE >15%
Leading through the Energy Transition
Thrive in the energy transition
World-class investment
case
Strong license
to operate

Royal Dutch Shell March 21, 2018Royal Dutch Shell March 21, 2018 5
Strategic themes delivery: on track
* 2019 – 21: 2016 RT $60 per barrel, mid-cycle Downstream
** Includes Deep water in cash engines and Shales in growth priorities by 2020
Price sensitivity:+/- $10 Brent = +/- ~$6 billion CFFO
Capital employed($ bln
end 2017)
Free cash flow($ bln p.a)
ROACE
(%)
~59% ~14 ~9
~27% ~2 ~4
~6% ~(1) ~(4)
~15
~12
283 ~28 ~6
Capital employed($ bln)
Free cash flow*($ bln p.a)
ROACE
(%)
~70% 25-30 >10
~20% 1-2 ~5
~5% (2) - (1) ~5
25-30
>5
~290 30-35 ~10
2019-21** ~$602017 ~$54
Strategic themes
Cash engines
Growth priorities
Emerging opportunities
Organic FCF
Divestments & acquisitions
Total (incl. Corporate)

Royal Dutch Shell March 21, 2018 6
Downstream: Leadership Team
John AbbottDownstream Director
Lori RyerkerkEVP Manufacturing
Huibert VigevenoEVP Global Commercial
István KapitányEVP Retail
Martin Bambridge*Downstream General Counsel
John Hollowell*EVP Pipelines
Fabian Ziegler*EVP Contracting & Procurement
Graham van’t HoffEVP Chemicals
Andrew SmithEVP Trading & Supply
Bjorn FerminEVP DownstreamFinance
Gerard PenningEVP Downstream Human Resources
* Not present today

Royal Dutch Shell March 21, 2018Royal Dutch Shell March 21, 2018 7
Downstream: An integrated story
Refining
Customers
Supply & Trading
Upstream & Integrated Gas
Chemicals
Retail
Global Commercial

Royal Dutch Shell March 21, 2018Royal Dutch Shell March 21, 2018
70
80
90
100
110
120
2010 2015 2020 2025 2030 2035 2040
8
Downstream: Business environment
* Cracker base chemicals (Aromatics, derivatives, Ethylene, Propylene and Isobutylene). Source HIS/Shell analysis
Million barrels per day
Oil and liquid demand outlook
Petrochemicals* demand in kT per annum
Chemicals demand outlook
Demand for Oil Products and petrochemicals is still growing in the 2030s
Major growth in demand, in excess of GDP growth
Chemicals enabling CO2 reduction
Demand still expands well into the 2030s
Passenger vehicles consumption represents ~25% of overall liquid hydrocarbon demand
N. America S. America EuropeMiddle East Asia Others
0
100.000
200.000
300.000
400.000
500.000
2000 2005 2010 2015 2020 2025 2030
Asia 37%
Asia 52%
IEA New Policy scenarioIEA Current Policy scenarioShell ‘Oceans’ scenario Shell ‘Mountains’ scenario

Royal Dutch Shell March 21, 2018Royal Dutch Shell March 21, 2018 9
Oil Products:Business environment
Company analysis
Million vehicles/year
Global vehicle sales
Million vehicles
Global vehicle fleet
0
20
40
60
80
100
120
140
2015 2020 2025 2030 2035 20400
500
1.000
1.500
2.000
2015 2020 2025 2030 2035 2040
Plug-in hybrid EV (PHEV) Battery EV (BEV)Internal combustion engine (ICE)
Royal Dutch Shell March 21, 2018
An aggressive EV scenario – not a forecast: one example

Royal Dutch Shell March 21, 2018Royal Dutch Shell March 21, 2018 10
Downstream
Capital employed and volumes based as per end Q4 2017. Capital investment is in period 2018-2020.
Further strengthen our financial performance
Upgrading our portfolio
Chemicals growth priority
Cash engine
Marketing Refining & Trading Chemicals
Growth priority
$17 billion
6.6 mboe/d
$24 billion
2.6 mboe/d
$15 billion
~18 mtpa
$3-4 billion
Capital employed: Capital employed:
Sales volumes:
Capital Investment:
Refinery processing:
Capital employed:
Sales volumes:
$4-5 billionCapital investment:

Royal Dutch Shell March 21, 2018Royal Dutch Shell March 21, 2018 11
Downstream strategy: A reminder
Source brand preference: Ipsos – Global Customer Tracker (covering 30+ markets)
HSSE – a core value
11
Cash engine
Marketing Refining & Trading Chemicals
Growth priority
Global #1 Brand
Differentiated Fuels & Lubricants
Growth
Non-fuels retailing
Low Carbon Fuels
Large, complex integrated sites
in Trading hubs
Competitiveness
Rationalization nearing
completion
Advantaged and flexible
feedstocks
Strong product portfolio
Proprietary technology
Enabling CO2 reduction
Driven through new business models, customer connectivity, innovation and digitalisation
Royal Dutch Shell March 21, 2018Royal Dutch Shell March 21, 2018
72
76
80
2010 2011 2012 2013 2014 2015 2016 2017
12Royal Dutch Shell March 21, 2018
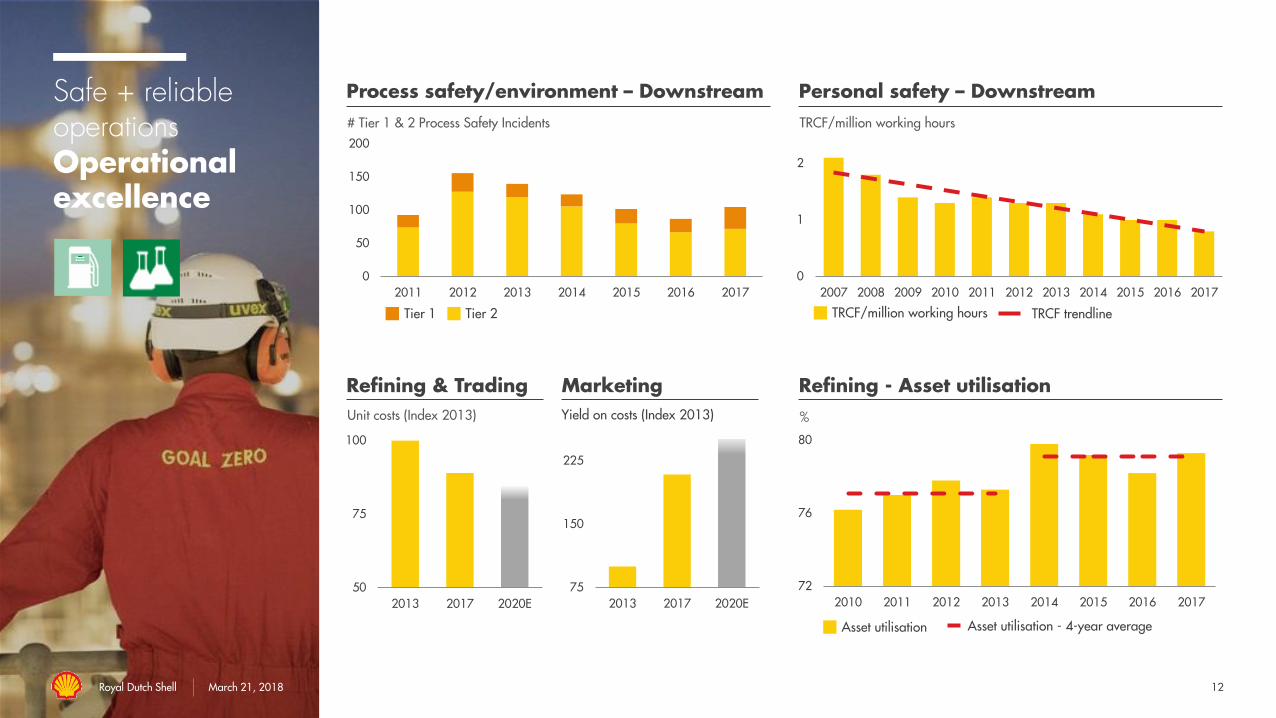
Safe + reliable operationsOperational excellence
Process safety/environment – Downstream
0
1
2
2007 2008 2009 2010 2011 2012 2013 2014 2015 2016 2017
Personal safety – Downstream# Tier 1 & 2 Process Safety Incidents TRCF/million working hours
Tier 1 Tier 2 TRCF trendlineTRCF/million working hours
50
75
100
2013 2017 2020E75
150
225
2013 2017 2020E
Refining & TradingUnit costs (Index 2013)
Refining - Asset utilisation%Yield on costs (Index 2013)
Marketing
Asset utilisation - 4-year average Asset utilisation
0
50
100
150
200
2011 2012 2013 2014 2015 2016 2017

Royal Dutch Shell March 21, 2018Royal Dutch Shell March 21, 2018
-20
0
20
40
60
80
100
-5
0
5
10
15
20
25
2013 2014 2015 2016 20170
10
20
0
5
10
2013 2014 2015 2016 2017
-10
-5
0
5
10
15
-10
-5
0
5
10
15
2013 2014 2015 2016 2017
13
Downstream Financial performance
Strong cash generation
Competitive returns
Refining & Trading Marketing ChemicalsWorking capital movementCFFO excluding working capital Free cash flow (RHS)
Downstream Upstream Integrated Gas Corporate
DS as of % RDS (RHS)
Marketing Refining & Trading Chemicals ROACE (RHS)Earnings and ROACE on CCS basis,
excluding identified items
Cash flow$ billion
Capital employed
$56 billion at end 2017
Earnings Earnings by sub-segment + ROACE$ billion
$ billion
$ billion % %

Royal Dutch Shell March 21, 2018Royal Dutch Shell March 21, 2018
0%
10%
20%
2010 2011 2012 2013 2014 2015 2016 20170
5
10
15
0
5
10
15
20
25
2013 2014 2015 2016 2017
14
Company analysis of competitors cash flow from operations; Earnings on local GAAP basis adjusted for inventory valuation differences and excluding identified items. 2016 Capital Employed is
used as proxy for calculating 2017 ROACE. Oil products peer group excludes Total: no separate oil products disclosure. Source brand preference: Ipsos – Global Customer Tracker (covering
30+markets)
Oil Products – ROACE%
Downstream – Cash flow from operations
$ billion
Chemicals – ROACE Global brand preference%%
Shell Peer groupShell Peer group
Shell Peer group range
2013 2014 2015 2016 2017
Royal Dutch Shell March 21, 2018
Competitive performance World-class investment case
Shell Peer group
0%
10%
20%
30%
2010 2011 2012 2013 2014 2015 2016 2017

Royal Dutch Shell March 21, 2018Royal Dutch Shell March 21, 2018
2017
6
7
8
9
10
2011-2013 2014-2017 2020E
Earnings on CCS basis, excluding identified items
15
“Exposure and resilience” Resilient today…and tomorrow
0
1
2
3
Base growth New customers Resilient sectors New revenues
2017 2021 20252025
Capital employed2025: Oil Products: +30-35%
Chemicals: +>50%
Geographical exposureEarnings per region
Chemicals – feedstock exposure
% of feedstock
Marketing – earnings growth to 2025 Refining & Trading – Breakeven margin$ per barrel$ billion
Oil Gas
East
Europe & Africa
Americas
Global commercialRetail

Royal Dutch Shell March 21, 2018Royal Dutch Shell March 21, 2018 16
Offering more and cleaner energy solutions
Nature-based and technology solutions to offset CO2 emissions
New businessesCCS, Emissions Trading, District heating, Solar
TransportLighter vehicles, Mobility efficiency
ConstructionInsulation and energy efficiency
BiofuelsConventional and advanced
CNG/LNGLight & Heavy Duty Vehicles and Marine
HydrogenNetwork development
ElectricitySmart and fast charging offer for EVs
ElectronicsDigitalisaton
Energy & waterFuel additives, Low temperature detergents

Royal Dutch Shell March 21, 2018Royal Dutch Shell March 21, 2018 17
Innovation & Customer
Shell is developing and adapting the technology of the future, building on our customer connectivity
Technology
Chemicals technology R&D
Improvement to refining technologies
New fuels and lubes development
Digitising the core
Data analytics
Technology use in monitoring and operation of plants, terminals and vessels
New business models
LubeChat
Pilots: Fitcar, TapUp, AccuPort
Connected customers (e.g. Jaguar Land Rover, Shell app)

Royal Dutch Shell March 21, 2018Royal Dutch Shell March 21, 2018 18
Summary Key messages
Significant and increasing cash and returns to support world-class investment case
Increasing portfolio resilience, leveraging technology, digitalisation and new business models
Transformational and profitable growth
Organic free cash flow per annum:
by 2020: $6-7 billion
by 2025: $9-12 billion
Capital employed by 2025: Oil Products: + 30-35%; Chemicals: +>50%
ROACE >15%
Leading through the Energy Transition
Thrive in the energy transition
World-class investment
case
Strong license
to operate

Royal Dutch Shell March 21, 2018
MarketingIstván Kapitány
EVP RetailRoyal Dutch Shell

Royal Dutch Shell March 21, 2018Royal Dutch Shell March 21, 2018 20
Shell has the most profitable Marketing businesses in the industry
Earnings and ROACE on CCS basis, excluding identified items; Peer group: BP and Total, published annual reports, Shell analysis
2 - Geographic distribution of Marketing earnings in 2017. Retail includes Raizen Combustiveis
+$1.4 billion2017 vs 2013earnings growth
Customers first Top line growth through differentiation Active portfolio management Simplification & Offshoring
0
2
4
2013 2014 2015 2016 2017
26%ROACE
Earnings: Marketing
East
EU + Africa
Retail
Global commercial
Others
Americas
Earnings split (2017)
Balancedportfolio2
$ billion
Peer groupShell
Chemicals
Refining &
Trading
Marketing
Downstream

Royal Dutch Shell March 21, 2018Royal Dutch Shell March 21, 2018
Shell Reference industry IOCs
21
Shell retail is the #1 mobility retailer
1 – Source: Latest published company annual reports:
Sites (in thousands): BP: ~18; Total: ~16.5; Gap: ~1.6; Zara: ~2.2; Carrefour: ~12; Starbucks: ~27
Retail includes Raizen Combustiveis
# of sites worldwide of selected retailers1
Aslam Khoso – Global Service Champion Winner 2016
Customers per day30M+70+Markets
44K+Locations
Shell
Starbucks
Carrefour
ZARAGAP
Total
BP

Royal Dutch Shell March 21, 2018Royal Dutch Shell March 21, 2018
0
1
2
2013 2017
0
100
200
2013 2017 2020
22
Shell retail has grown strongly since 2013
1 - Source: Latest published company annual reports for Carrefour, Couche Tard, Sainsbury’s, Starbucks, Tesco and Walmart. Earnings and ROACE on CCS basis, excluding identified items; Retail
includes Raizen Combustiveis. CAGR: compound annual growth rate
+~$600 million2017 vs 2013earnings growth
Earnings: retail
Differentiated Programmes
Active Portfolio Management
Simplification & Offshoring
100
154
Selected retailers1
Yield on cost Income per site
0
100
200
2013 2017
100131
50% Convenience retailV-Power™
Fleet solutionsLoyalty
Main-grade fuel
Gross margin contribution
Index (2013=100) Index (2013=100)
>7%
CAGR
ROACE24%
$ billion

Royal Dutch Shell March 21, 2018Royal Dutch Shell March 21, 2018 23
Shell retail success is built upon brand and differentiation
Brand value1 Preferred IOC across 62 countries2
5139
30
21
20
28
1 - Source: Brand Finance Global 500 (2018)
2 - Source: IPSOS, Global Customer Tracker – Shell analysis based on GCT, an independent survey conducted by Ipsos across 62 markets in 2017
Royal Dutch Shell March 21, 2018
Coca-Cola
Nike
Total
BP
Total
BP
Esso
Chevron
Mobil
$ billion
Royal Dutch Shell March 21, 2018
0%
10%
20%
2013 2015 2017 2020E
24
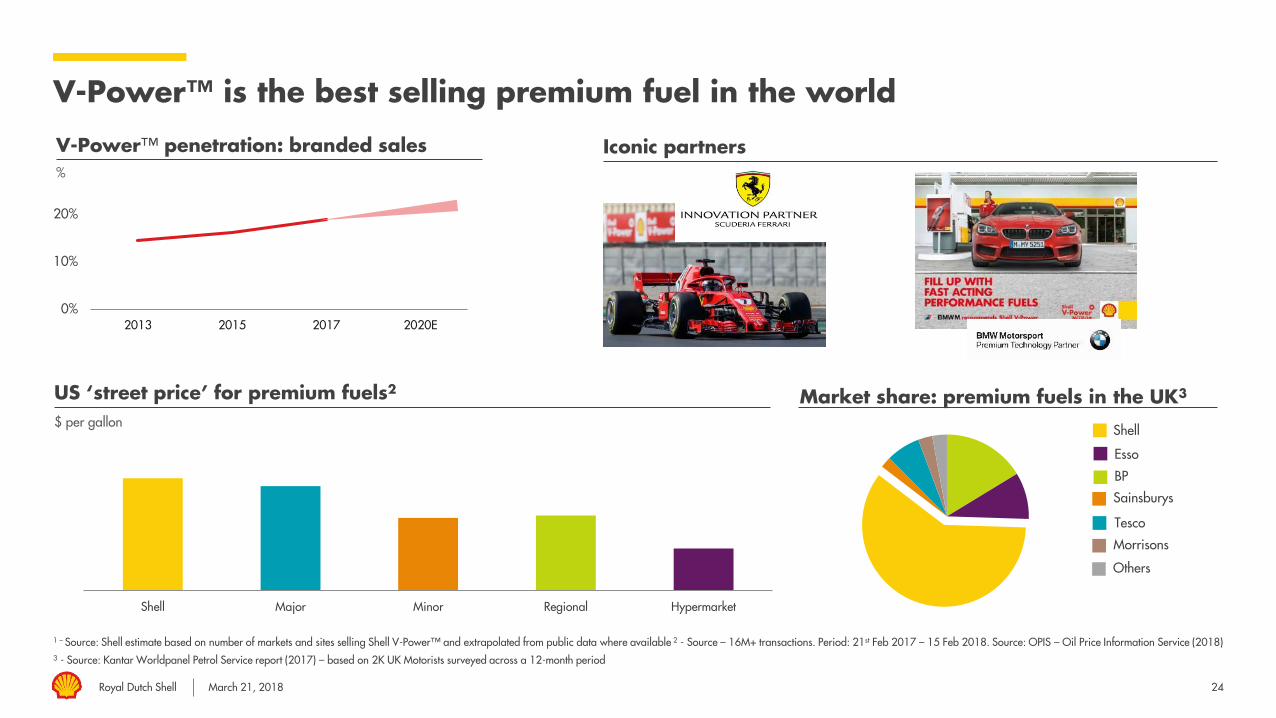
V-Power™ is the best selling premium fuel in the world
1 – Source: Shell estimate based on number of markets and sites selling Shell V-Power™ and extrapolated from public data where available 2 - Source – 16M+ transactions. Period: 21st Feb 2017 – 15 Feb 2018. Source: OPIS – Oil Price Information Service (2018) 3 - Source: Kantar Worldpanel Petrol Service report (2017) – based on 2K UK Motorists surveyed across a 12-month period
V-Power™ penetration: branded sales%
Iconic partners
US ‘street price’ for premium fuels2
Shell Major Minor Regional Hypermarket
$ per gallon
Market share: premium fuels in the UK3
Esso
BP
Shell
Sainsburys
Tesco
Morrisons
Others

Royal Dutch Shell March 21, 2018 25
Shell is the largest global provider of solutions for business fleets
Royal Dutch Shell March 21, 2018
2 MillionCustomers served every day
Fleet of trucks$2+ billion road services turnover
Quality and low emission fuels
Management information, advanced
controls & security
Fleet of cars/vansDigital offers & Mobility Services
CO2 offsetting & electric mobility
Growing through car-sharing, ride-sharing and leasing
#1Network
Shell cards are accepted in >200,000 roadside locations worldwide
>7 MillionActive Shell cards
Royal Dutch Shell March 21, 2018 26
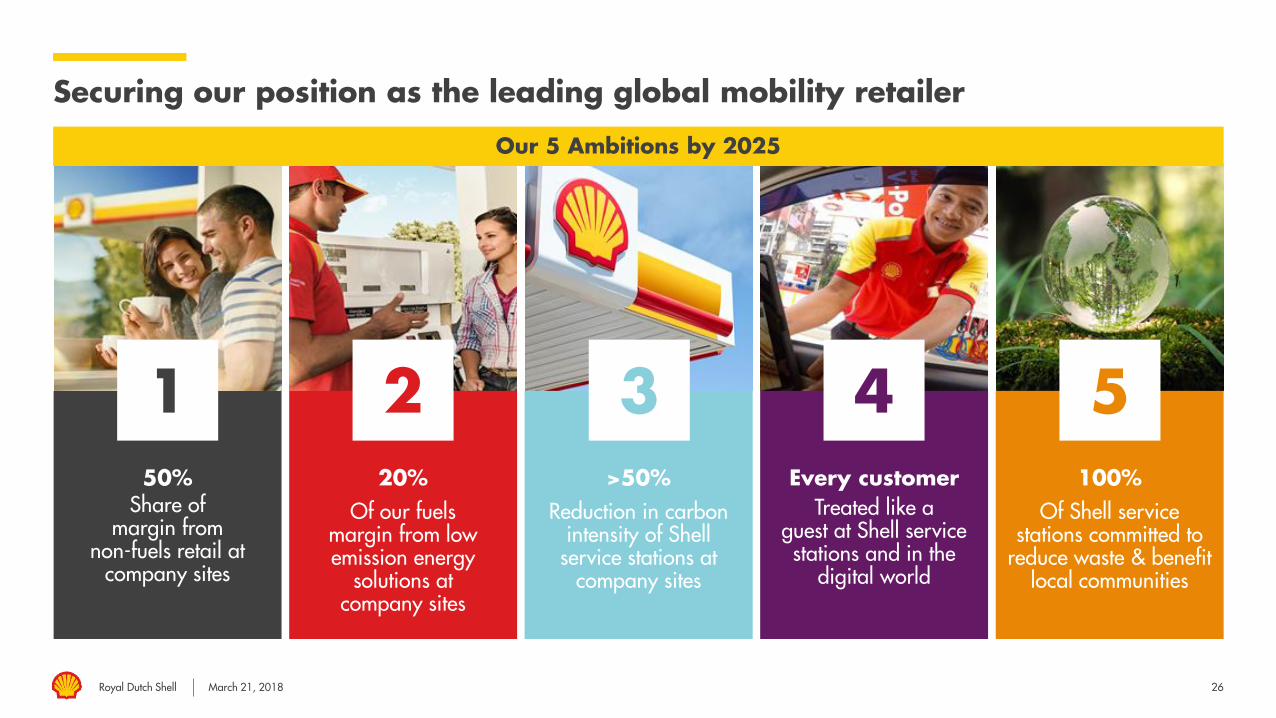
Securing our position as the leading global mobility retailer
150%
Share of margin from
non-fuels retail at company sites
20%Of our fuels
margin from low emission energy
solutions at company sites
2>50%
Reduction in carbon intensity of Shell
service stations at company sites
3Every customer
Treated like a guest at Shell service stations and in the
digital world
4100%
Of Shell service stations committed to
reduce waste & benefit local communities
5
Our 5 Ambitions by 2025

Royal Dutch Shell March 21, 2018 27
Significantly growing our convenience retail business
Shell convenience store - Singapore Broaden our range of coffee and food offers
Basket check out in 5 seconds (pilot with IBM) – United Kingdom
Developing unmanned cashier with Bingo Box Technology - China
2017 - 2020 2020 - 2025 2017 - 2025
>5,000
Growth in # of stores

Royal Dutch Shell March 21, 2018Royal Dutch Shell March 21, 2018
500 ultra-fast charge posts with IONITY in next 2 years – Europe
28
Leading through the energy transition with tangible actions
Hydrogen network development – USA & Germany 20+ ‘recharge’ locations – UK & The Netherlands
Integrated charging solutions

Royal Dutch Shell March 21, 2018 29
Innovating with award winning digital solutions for our customers
1- Shell App: Gold Award for Best Mobile App experience in EMEA in Dec 2017 by Mobile Marketing Association; GLOMO Award Winner for Best use of mobile for Retail, Brands & Commerce in Feb 2017 by Mobile World Congress - GSMA. 2- Available
from UK 2015, Turkey 2016, DE & China 2017 and US 2018
Shell Motorist App active in 36 markets and voted the Best Mobile App1
In-car payments with Jaguar Land Rover and General Motors
Mobile payment in UK, Turkey, Germany, China and US available to customers2
Fuel delivery to your door in NL with a ‘Tap’ on your phone

Royal Dutch Shell March 21, 2018Royal Dutch Shell March 21, 2018
Earnings: retail
30
Outlook to 2025 aiming for significant growth in retail
+>$1.5 billion2025 vs 2017earnings growth
Earnings and ROACE on CCS basis, excluding identified items
New revenues Grow convenience retail5,000 new stores New offers
Resilient sectors Grow fleet solutions
New customers 5,000 new sites: China, India, Indonesia, Mexico and Russia
Grow Base V-Power™5,000 new sites Customers
40M+ 90+Markets
55K+Locations
24% >20%ROACE >20%
$ billion
0
2
4
2013 2017 Growth levers 2020 Growth levers 2025

Royal Dutch Shell March 21, 2018
MarketingHuibert Vigeveno
EVP Global CommercialRoyal Dutch Shell

Royal Dutch Shell March 21, 2018Royal Dutch Shell March 21, 2018
1M+
32
Global commercial: the B2B arm of Shell
1 – Source: Kline & Company (2017)
Attractive industries Fully integrated Resilient
Lubricants - global lubricants market share1
0%
5%
10%
Supplier
Aviation - sales by region (in 2017)
Specialties - sales by region (in 2017)
B2B customers150
Markets
#1in Lubricants
%
TOTALExxon
MobilBP
East
Americas
Europe & Africa
East
Americas
Europe & Africa

Royal Dutch Shell March 21, 2018Royal Dutch Shell March 21, 2018
Earnings per FTE
0
100
200
2013 2017 2020
0
1
2
2013 2017
33
Global commercial delivered exceptional returns
1 - Source: Latest published company annual reports - Akzo Nobel, Fuchs, Valeo, Valvoline & World Fuel Services. Earnings and ROACE on CCS basis, excluding identified items. CAGR:
compound annual growth rate
+>$300 million 2017 vs 2013earnings growth
Earnings: global commercial
> 6%
CAGR
ROACE26%
$ billion
Selected retailers1
0
100
200
2013 2017
100
150
Index (2013=100) Index (2013=100)
100
212
Yield on cost1
Premium & organic growth
Supply chain footprint
Simplification & Offshoring

Royal Dutch Shell March 21, 2018Royal Dutch Shell March 21, 2018 34
Shell lubricants success is built on technology, brand and people
1 in 9 engine or equipment, world-wide, is protected by Shell lubricants
Volume share2 – comparison with BP and Total
Consumer
Shell Peer Group
Commercial
IndustrialResilient Sectors
Brand share of preference1 - markets worldwide*
20%16% 14%
Passenger Car Motor Oils
36%
21%
10%
Heavy Duty Engine Oils
1 – Source: Kantar Millward Brown (H1 ’17) – PCMO (22K respondents), HDEO (9K respondents) *- PCMO: USA, China, India, Russia, Brazil, Germany, Indonesia, Canada, Thailand, Egypt
and Malaysia; HDEO: USA, China, India, Russia, Brazil, Thailand, Egypt, Pakistan, Vietnam, Argentina and Colombia. 2 – Source: Kline & Company (2017)
Exxon
MobilBP
Exxon
Mobil
BP

Royal Dutch Shell March 21, 2018Royal Dutch Shell March 21, 2018 35
Shell lubricants is the IOC market leader in China
1 – Source: Millward Brown (2017 Q3) Motorist Loyalty Tracker 中国市场品牌调研- 6288 respondents annually in 33 cities in China2 – Source: Kline & Company (2017)
Shell market share2
in China in 2016: 8,5%
PCMO market: brand preference in China1
North
West East
South
TsingYi
Zhapu
Tianjin
NGG
Zhuhai
Supply chain footprint in China
Lube Oil PlantGrease PlantDistributor CenterGTL TerminalFlavex Process Oil Terminal
Operation Unit CN, HK
51511
Exceptional local team
Digital leadership
Retail integration
0
20
40
0 20 40 60 80
Preference
Awareness
TOTAL
SINOPEC
CASTROL
MOBIL

Royal Dutch Shell March 21, 2018Royal Dutch Shell March 21, 2018 36
Our uniqueglobal customers footprint can grow further
1 – Source: Kline & Company – Passenger Car Motor Oils with a viscosity of 0W and 5W, Compound Annual Growth Rate (2013-2017)
7 out of 10 largest car manufacturers choose Shell lubricants Lubricants & grease blending plants
Base oil manufacturing plants
R&D Centre
Customer operations
Passenger Car Motor Oil1Premium volume development
Market Shell0
5
10
%
DEEP TECHNICAL EXPERTS,

Royal Dutch Shell March 21, 2018Royal Dutch Shell March 21, 2018 37
Strengthening our position as a world class B2B business
1 – Source: Oxford Economics (2018); 2 Source: Shell analysis based on aggressive EV scenario; 3 – Source: Shell analysis; 4 – Source: Shell analysis – Ship capacity - Dead weight tonnage
LubeChat
2017 2025
+27%Ship capacity4
+36%Aircrafts3
+25%ICE Vehicles2
+24%Industrial Production1
Fitcar
Skypad
AccuPort

Royal Dutch Shell March 21, 2018Royal Dutch Shell March 21, 2018
0
1
2
3
2013 2017 Growth levers 2020 Growth levers 2025
38
Outlook to 2020 is very strong with exceptional returns
+>$1 billion2025 vs 2017earnings growth
ROACE 26% >25% >25%
B2B customers1M+ 150
Markets#1In lubricants
Grow Base2x market growth in premium Expand airport presence
New customersGrow market share in China, India, Indonesia, Mexico and Russia
Resilient sectors $1 billion investment in technology
New revenues Accelerate digital and services growth
Earnings and ROACE on CCS basis, excluding identified items
Earnings: global commercial$ billion

Royal Dutch Shell March 21, 2018Royal Dutch Shell March 21, 2018 39
Retail and global commercial are exceptional performers
+>$2.5 billion2025 vs 2017earnings growth
Earnings and ROACE on CCS basis, excluding identified items; CAGR: compound annual growth rate
Customers/day40M+ 150+
Markets#1In the industry
Strongest business performance in peer group
Attractive industries, superior returns
Resilient in the 2020s
0
2
4
6
2013 2017 Growth 2020 Growth 2025
>7%
CAGR
Earnings: retail + global commercial$ billion
Global Commercial Retail
ROACE 25% >20% >20%

Royal Dutch Shell March 21, 2018
Refining & Trading
Lori Ryerkerk & Andrew Smith
EVP Manufacturing & EVP Trading & SupplyRoyal Dutch Shell

Royal Dutch Shell March 21, 2018 41
Refining & Trading: Fully integrated and highly dynamic global system
Royal Dutch Shell March 21, 2018Royal Dutch Shell March 21, 2018
0
100
200
300
400
500
600
42
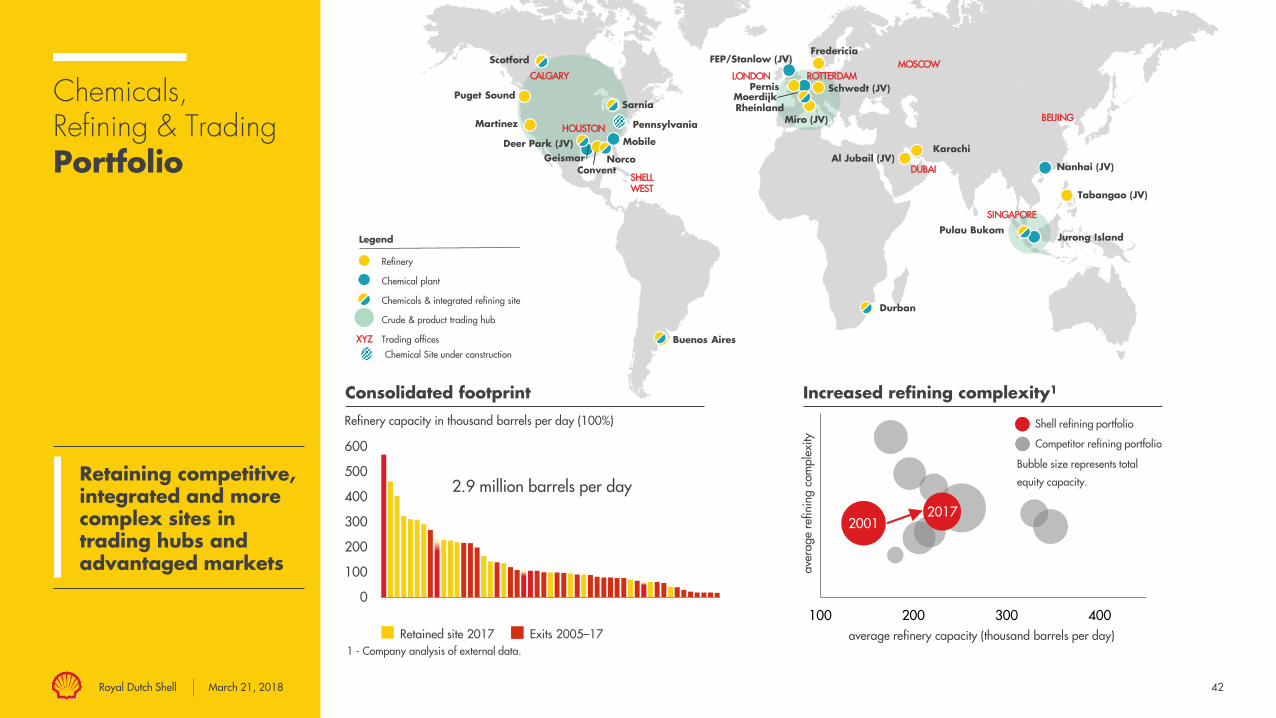
Chemicals, Refining & Trading Portfolio
1 - Company analysis of external data.
Retaining competitive, integrated and more complex sites in trading hubs and advantaged markets
Legend
Refinery
Chemical plant
Chemicals & integrated refining site
Crude & product trading hub
Trading officesXYZ
Exits 2005–17Retained site 2017
Consolidated footprint
Refinery capacity in thousand barrels per day (100%)
2.9 million barrels per day
average refinery capacity (thousand barrels per day)
aver
age
refin
ing
com
plex
ity
Shell refining portfolio
Competitor refining portfolio
Bubble size represents total
equity capacity.
Increased refining complexity1
20172001
100 200 300 400
Mobile
Geismar
Jurong Island
Moerdijk
HOUSTON
LONDON ROTTERDAM
SINGAPORE
Puget Sound
Martinez
Schwedt (JV)
Convent
Tabangao (JV)
Fredericia
Pernis
Scotford
Sarnia
Deer Park (JV)
Norco
Rheinland
Pulau Bukom
Durban
Buenos Aires
Nanhai (JV)
FEP/Stanlow (JV)
Miro (JV)
Al Jubail (JV)Karachi
Pennsylvania
MOSCOW
DUBAISHELL WEST
BEIJING
CALGARY
Chemical Site under construction

Royal Dutch Shell March 21, 2018Royal Dutch Shell March 21, 2018 43
Chemicals, Refining & Trading Integration
Integration and flexibility release the value of supply chain optionality
Crude & feedstock
optimisation
Oil Products“Make-Buy-Blend”
Oil-chemicals Integration
Highest value Crude and
feedstock, equity and non-equity
Highest-margin feedstocks from refinery or market
Best selection of purchased and
produced components
Refining Trading & supply
Product blending & supply Marketing
Chemicals manufacturing

Royal Dutch Shell March 21, 2018Royal Dutch Shell March 21, 2018 44
Chemicals, Refining & Trading US Gulf Coast & Northeast
Significant and sustainable value uplift created by integrated re-optimisationof the eastern US value chain
Northeast volume growth+30 thousand
barrels per day
“Make-Buy-Blend” optimisation and
exports
Operating Convent FCCU for another turnaround cycle
+$150-200 million per annum margin
Hurricane Harvey response business
continuity for customers
Shell terminals
Shell refineries
N o rcoC o n v en t
Royal Dutch Shell March 21, 2018Royal Dutch Shell March 21, 2018 45
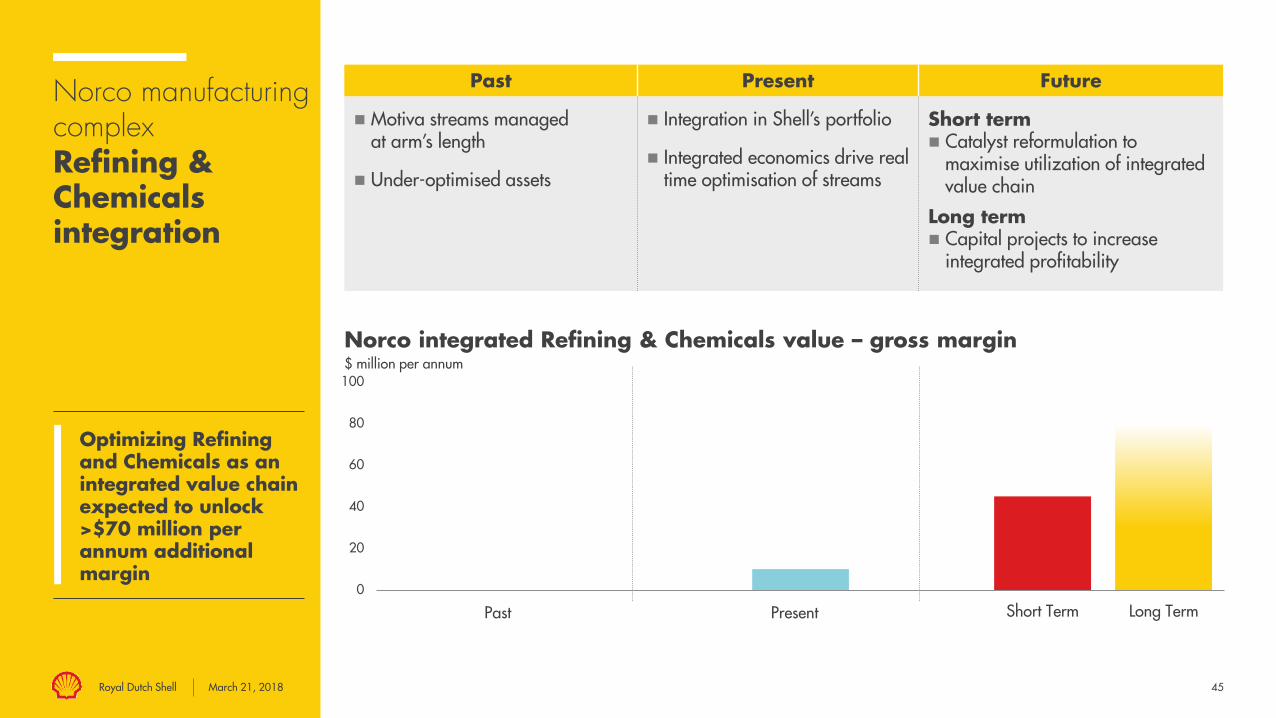
Norco manufacturing complexRefining & Chemicals integration
Optimizing Refining and Chemicals as an integrated value chain expected to unlock >$70 million per annum additional margin
Past Present Future
Motiva streams managed at arm’s length
Under-optimised assets
Integration in Shell’s portfolio
Integrated economics drive real time optimisation of streams
Short term Catalyst reformulation to
maximise utilization of integrated value chain
Long term Capital projects to increase
integrated profitability
Norco integrated Refining & Chemicals value – gross margin$ million per annum
0
20
40
60
80
100
Short Term Long TermPast Present

Royal Dutch Shell March 21, 2018Royal Dutch Shell March 21, 2018
74
75
76
77
78
79
80
81
2010 2011 2012 2013 2014 2015 2016 2017
46
Delivering operational excellence
Improving safety, reliability and cost efficiency in our operations
% utilisation
Asset utilisation – Refining Unit cost – Refining & TradingIndex (2013 =100)
Process safety & environment – Downstream
0
20
40
60
80
100
120
140
160
180
2011 2012 2013 2014 2015 2016 2017
# Tier 1 & 2 process safety incidents TRCF/million working hours
Personal safety – Downstream
0
1
2
50
75
100
2013 2017 2020E
Tier 1 Tier 2 TRCF trendlineTRCF/million working hours
Asset utilisation - 4-year average Asset utlisation

Royal Dutch Shell March 21, 2018Royal Dutch Shell March 21, 2018 47
Margin resilience and stability
$ per barrel
$ per barrel
02468
101214
6
7
8
9
10
2011-2013 2014-2017 2020E
Forward view based on average of the last ten years, covers most of typical volatility: $10.40 per barrel
Rule-of-thumb: $ per barrel margin = +/- ~$600 million earnings
Delivering more resilient and less volatile margin from a high graded and integrated portfolio
2008-2017 Average marginActual margin Indicative margin
Refining & Trading – Breakeven margin
Integrated indicative margin

Royal Dutch Shell March 21, 2018Royal Dutch Shell March 21, 2018 48
Building resilience for the future
Investing in refinery resilience Strengthening the core
New solutions Low carbon solutions
Strengthening the core assets while building capability through technology advances to adapt to a changing energy world
Growth
Non- and little discretionary spend
Capital investment:
$ 2-3 billion per year(2018-2020 average)
Bottom of barrel upgrading
Crude flexibility
Logistics and integration
Low sulphur fuel oil (IMO) preparedness
Biofuels Blending
Renewable Power
Offerings
Asset Carbon Offsets
Low Carbon
Solutions
Nature Based
Solutions
Shell refineries and businesses
3rd Party offerings, new value chains
Energy efficiency initiatives
Green energy
Cogeneration
Royal Dutch Shell March 21, 2018
ChemicalsGraham van’t HoffEVP ChemicalsRoyal Dutch Shell

Royal Dutch Shell March 21, 2018Royal Dutch Shell March 21, 2018 50
Growth priorityChemicals
Top 10 producer of Ethylene
Top 5 producer of Propylene
Top 5 producer of Benzene
Positioning in the competitive landscape
Base Chemicals/Intermediates
Performance Solutions
Access to advantaged feedstock
Process technologies
Big integrated projects
Large scale
Customised solutions
Product-materials innovation
Production close to markets
Medium scale projects
Pure Chemical Companies
Add Differentiation
FEED
STO
CKS
CO
NSU
MER
S

Royal Dutch Shell March 21, 2018Royal Dutch Shell March 21, 2018 51
ChemicalsStrategy
A highly profitable hydrocarbon upgrader
Advantaged feedstock First class footprint Strong product &
customer portfolioExcellence every day
& HSSE
Access advantaged feedstock Monetize with competitive advantage
Technology

Royal Dutch Shell March 21, 2018Royal Dutch Shell March 21, 2018 52
ChemicalsTechnology leader
Technology focus and operating expertise create winning position
Shell Chemicals proprietary technologies leverage key skills and experience to create market leading positions
OMEGA (MEG - Polyesters) SMPO (Styrene Monomer – Insulation / Polyols - Foams) SHOP (Detergents) DPC/PC (Diphenyl carbonate – Phone casings) Technology licensing and catalyst sales combine to create strong long-term value

Royal Dutch Shell March 21, 2018Royal Dutch Shell March 21, 2018
0
5
10
15
20
25
30
Q42012
Q42013
Q42014
Q42015
Q42016
Q42017
53
ChemicalsFinancial and competitive performance
Earnings and ROACE on CCS basis, excluding identified items; Shell ROACE calculations for 2012 has been restated for the impact of IAS 19; source: company reports, Shell analysis
$ billion
Earnings – Chemicals
%
Competitive performance – ROACE 4Q rolling
Ensure robust performance under different market conditions and grow base business
0
40
80
120
0
1
2
3
2010 2011 2012 2013 2014 2015 2016 2017
$/barrel
Average: $107
Average: $50
Average Brent oil price (RHS)Earnings
Average earnings 2010 - 2016ExxonMobilShell DOW/UCC
LBI

Royal Dutch Shell March 21, 2018Royal Dutch Shell March 21, 2018 54
Chemicals Competitiveness
Organisational, operational and cultural improvements deliver sustainable annual earnings increases Operational excellence
Costs
Volume growth
Unit margin
$500 million per annum

Royal Dutch Shell March 21, 2018Royal Dutch Shell March 21, 2018 55
ChemicalsGrowth projects
2006
Nanhai
2010
USGC go-light strategy
2010
Singapore
2016+
China + USA
Feedstock mix2025 Gas
Liquid
425,000 metric tonnesadditional Alpha Olefins capacity
New liquids cracker and derivatives units
Capacity: ~1.2 million metric tonnes ethylene per annum
50/50 JV CNOOC
Greenfield FID 2016
Capacity: ~1.5 million metrictonnes ethylene per annum and polyethylene derivatives
Remains on track to begin commercial production in 2H 2018
Geismar site will become largest AO facility in the world
Start-up of cracker and new downstream units in 1H 2018
SMPO/POD on-track for 2019/2020 start-up
Main construction phase started in late 2017
Under construction
Pennsylvania, USA
Royal Dutch Shell March 21, 2018
Geismar, USA
Nanhai, China

Royal Dutch Shell March 21, 2018Royal Dutch Shell March 21, 2018 56
ChemicalsOrganic growth
Earnings and ROACE on CCS basis, excluding identified items; Shell ROACE calculations for 2012 has been restated for the impact of IAS 19
Targets aspirationper year mid-’20s: Earnings:
~$3.5 – 4 billion Cash flow:
~$5 – 6 billion Base capex:
~$1 – $1.5 billion0
5
10
15
20
0
2
4
2009 2010 2011 2012 2013 2014 2015 2016 2017 ~2025
Earnings + ROACE
$ billion
Earnings ROACE (RHS)
Improve base business
Expand current base portfolio
Adding to portfolio – growth
%

Royal Dutch Shell March 21, 2018
John AbbottDownstream DirectorRoyal Dutch Shell

Royal Dutch Shell March 21, 2018Royal Dutch Shell March 21, 2018 58
DownstreamDelivering a world-class investment case
Royal Dutch Shell March 21, 2018
Downstream:
Customer-centric
Uniquely integrated
Competitive
Resilient
Leading through the energy transition
Delivering profitable growth
Thrive in the energy transition
World-class investment case
Strong license
to operate

Royal Dutch Shell March 21, 2018Royal Dutch Shell March 21, 2018 59
Questions & Answers
John AbbottDownstream Director
Lori RyerkerkEVP Manufacturing
Huibert VigevenoEVP Global Commercial
Istvan KapitanyEVP Retail
Graham van’t HoffEVP Chemicals
Andrew SmithEVP Trading & Supply
Bjorn FerminEVP DownstreamFinance
Gerard PenningEVP Downstream Human Resources

Royal Dutch Shell March 21, 2018