Embed Size (px)
Citation preview
Transportation
Power Generation
Agriculture
Forestry
Waste Management
Energy Exploration and Production
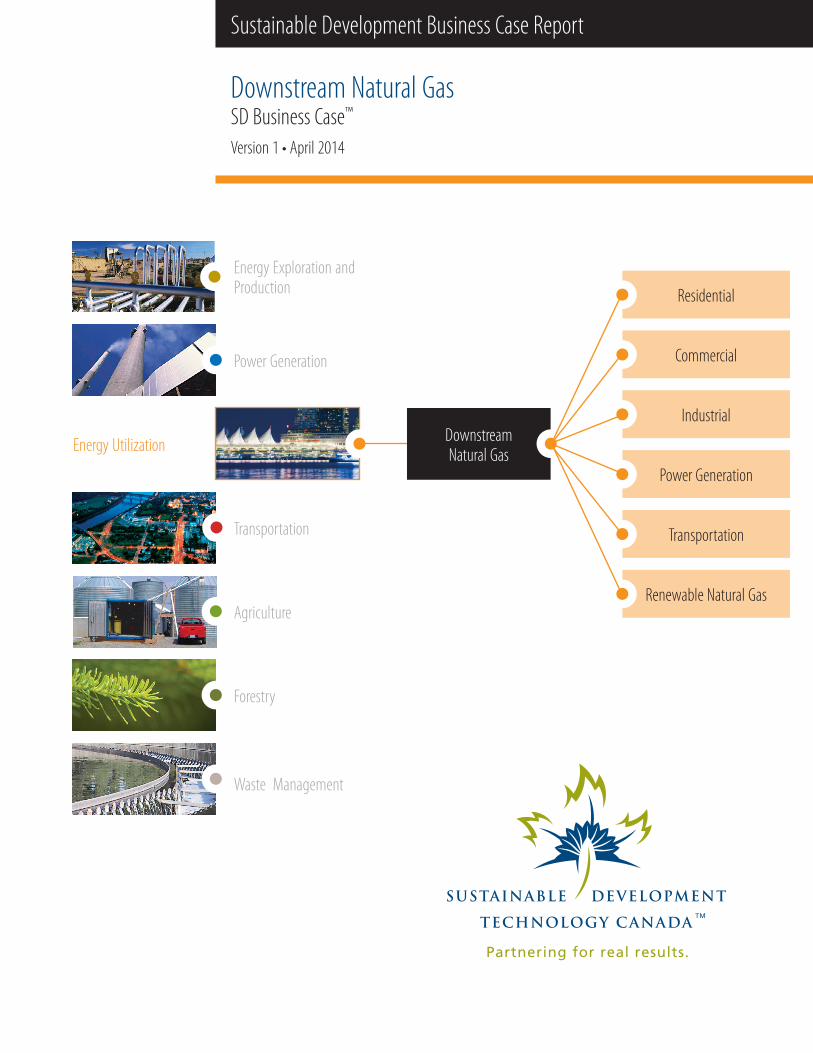
Sustainable Development Business Case Report
Downstream Natural Gas SD Business Case™ Version 1 • April 2014
Energy Utilization
Residential
Downstream Natural Gas
Commercial
Industrial
Power Generation
Transportation
Renewable Natural Gas

* Copyright © 2014 by Canada Foundation for Sustainable Development Technology (“SDTC™”). All Copyright Reserved. Published in Canada by SDTC™. No part of the SD Business Case™ may be produced, reproduced, modified, distributed, sold, published, broadcast, retransmitted, communicated to the public by telecommunication or circulated in any form without the prior written consent of SDTC, except to the extent that such use is fair dealing for the purpose of research or private study (unpublished, or an insubstantial copy). To request consent please contact SDTC. All insubstantial copies for research or private study must include this copyright notice.
The SD Business Case™ is provided “as is” without warranty or representation of any kind. Use of the information provided in the SD Business Case is at your own risk. SDTC does not make any representation or warranty as to the quality, accuracy, reliability, completeness, or timeliness of the information provided in the SD Business Case.
Sustainable Development Technology Canada™, SDTC™, SD Business Case™, SD Natural Gas Fund™, and SDTC STAR™ are trade marks of Canada Foundation for Sustainable Development Technology.
Sustainable Development Business Case Report
Downstream Natural Gas SD Business Case™ Version 1 • April 2014
Energy Utilization
Residential
Downstream Natural Gas
Commercial
Industrial
Power Generation
Transportation
Renewable Natural Gas
Acknowledgements
SDTC would like to gratefully acknowledge the contribution and assistance provided by the Canadian Gas Association and its venture, Energy Technology & Innovation Canada, whose management and team have provided valuable insight into Canada’s natural gas delivery industry.
John Adams Vice-President, Industry Sustainable Development Technology Canada
Table of Contents1 The SD Natural Gas Fund™ ..............................................................................................................................................................1
1.1 About SDTC ........................................................................................................................................................................................................... 1Figure 1: SDTC Total Portfolio Value Across Canada .......................................................................................................................................... 1Figure 2: The Companies Delivering Natural Gas ............................................................................................................................................. 2
1.2 About the Canadian Gas Association (CGA) .............................................................................................................................................. 2
2 Executive Summary ........................................................................................................................................................................... 32.1 Downstream Natural Gas Use ....................................................................................................................................................................... 3
Figure 3: Breakdown of Natural Gas Consumption in Canada, 2012 ............................................................................................................ 3
2.2 Downstream Natural Gas Vision Statements ......................................................................................................................................... 4Figure 4: Downstream Natural Gas Vision Statement, GHG Emissions ......................................................................................................... 4Figure 5: GHG Emissions Reductions from the Downstream Natural Gas Vision, by Sub-Sector ............................................................. 4
2.3 Investment Priorities ....................................................................................................................................................................................... 52.3.1 Near Term Investment Priorities ........................................................................................................................................................... 5Table 1: Near Term High Priority Investments .................................................................................................................................................. 5Table 2: Near Term Medium Priority Investments ............................................................................................................................................ 52.3.2 Long Term Investment Priorities .......................................................................................................................................................... 5Table 3: Long Term High Priority Investments .................................................................................................................................................. 5Table 4: Long Term Medium Priority Investments ........................................................................................................................................... 5
2.4 Non-technical Priorities .................................................................................................................................................................................. 62.4.1 Integration of Natural Gas and Electricity Provision ......................................................................................................................... 62.4.2 Energy Literacy ........................................................................................................................................................................................ 62.4.3 Demonstration Opportunities for New Technologies ....................................................................................................................... 62.4.4 Clarification of Financial and Regulatory Structures ........................................................................................................................ 6
3 Report Process, Scope and Structure ............................................................................................................................... 63.1 Report Process .................................................................................................................................................................................................... 6
Figure 6: The SDTC STAR™ Process....................................................................................................................................................................... 7Figure 7: SDTC’s Mandate ..................................................................................................................................................................................... 8
3.2 Report Scope ....................................................................................................................................................................................................... 83.2.1 Downstream Natural Gas Sub-Sectors ................................................................................................................................................ 8
3.3 Structure of Report........................................................................................................................................................................................... 9
4 Background .............................................................................................................................................................................................104.1 Natural Gas Use in Canada ........................................................................................................................................................................... 10
Figure 8: Breakdown of Natural Gas Consumption in Canada, 2012 .......................................................................................................... 10Figure 9: Natural Gas Consumption in Canada, PJ, 1995 – 2012 ................................................................................................................. 11Figure 10: Natural Gas Consumption by Sector in Canada, PJ, 1995-2012 ............................................................................................... 11Table 5: Increase in Natural Gas Consumption by Sector in Canada, 2012 vs. 1995 ................................................................................ 12
4.2 Projected Natural Gas Use............................................................................................................................................................................ 13Figure 11: Projection of Natural Gas Consumption by Sector in Canada, PJ, 2014-2030 ....................................................................... 13
5 Applicant Technologies for SDTC Funding ................................................................................................................14Figure 12: SOIs by Sub-Sector ........................................................................................................................................................................... 14
6 Industry Vision .....................................................................................................................................................................................16Figure 13: Downstream Natural Gas Vision Statement, GHG Emissions ..................................................................................................... 17Figure 14: GHG Emissions Reductions from the Downstream Natural Gas Vision, by Sub-Sector ......................................................... 17
6.1 Residential ......................................................................................................................................................................................................... 19Figure 15: Residential Sub-Sector Vision Statement, GHG Emissions ......................................................................................................... 19Table 6: General Data and Assumptions Used in the Residential Vision Statement Calculations .......................................................... 20Table 7: Technology Data and Assumptions Used in the Residential Vision Statement Calculations .................................................... 20
6.2 Commercial ........................................................................................................................................................................................................ 21Figure 16: Commercial Sub-Sector Vision Statement, GHG Emissions ....................................................................................................... 21Table 8: General Data and Assumptions Used in the Commercial Vision Statement Calculations ......................................................... 22Table 9: Technology Bin Data and Assumptions Used in the Commercial Vision Statement Calculations ............................................ 22
6.3 Industrial ............................................................................................................................................................................................................ 23Figure 17: Industrial Sub-Sector Vision Statement, GHG Emissions ........................................................................................................... 23Table 10: General Data and Assumptions Used in the Industrial Vision Statement Calculations........................................................... 24Table 11: Technology Bin Data and Assumptions Used in the Industrial Vision Statement Calculations ............................................. 24
6.4 Power Generation ........................................................................................................................................................................................... 25Figure 18: Power Generation Sub-Sector Vision Statement, GHG Emissions ............................................................................................ 25Figure 19: Transportation Sub-Sector Vision Statement, GHG Emissions .................................................................................................. 26Table 12: Technology Bin Data and Assumptions Used in the Power Generation Vision Statement Calculations .............................. 26
6.5 Transportation ................................................................................................................................................................................................. 26Table 13: Market Adoption Assumptions Used in Transportation Vision Calculations ............................................................................. 27Table 14: GHG Reductions Associated with Fuel Switching in Transportation Sub-Sectors.................................................................... 27Figure 20: Renewable Natural Gas Sub-Sector Vision Statement, GHG Emissions ................................................................................... 28
6.6 Renewable Natural Gas................................................................................................................................................................................. 28
7 Needs Assessment ............................................................................................................................................................................297.1 Technical Needs ................................................................................................................................................................................................ 29
7.1.1 Residential ............................................................................................................................................................................................. 297.1.2 Commercial ............................................................................................................................................................................................ 297.1.3 Industrial ................................................................................................................................................................................................ 297.1.4 Power Generation ................................................................................................................................................................................. 307.1.5 Transportation ....................................................................................................................................................................................... 307.1.6 Renewable Natural Gas (RNG) ............................................................................................................................................................ 30
7.2 Non-technical Needs ...................................................................................................................................................................................... 317.2.1 Cross-Cutting ......................................................................................................................................................................................... 317.2.2 Residential ............................................................................................................................................................................................. 317.2.3 Commercial ............................................................................................................................................................................................ 317.2.4 Industrial ................................................................................................................................................................................................ 317.2.5 Power Generation ................................................................................................................................................................................. 327.2.6 Transportation ....................................................................................................................................................................................... 327.2.7 Renewable Natural Gas (RNG) ............................................................................................................................................................ 32
8 Market Assessment .........................................................................................................................................................................33Table 15: Rationale for Market Analysis - Key Points .................................................................................................................................... 33Figure 21: Market Analysis for the Residential, Commercial and Industrial Sub-Sectors ....................................................................... 34Figure 22: Market Analysis for the Renewable Natural Gas, Power Generation and Transportation Sub-Sectors .............................. 34
9 Technical Needs Assessment ..................................................................................................................................................359.1 Cross-cutting Technology Needs ................................................................................................................................................................ 35
9.2 Residential ......................................................................................................................................................................................................... 35Table 16: Residential Technology Summary ................................................................................................................................................... 36Figure 23: Residential Technology Plot ............................................................................................................................................................ 36
9.3 Commercial ........................................................................................................................................................................................................ 37Table 17: Commercial Technology Summary .................................................................................................................................................. 37Figure 24: Commercial Technology Plot ........................................................................................................................................................... 38
9.4 Industrial ............................................................................................................................................................................................................ 38Table 18: Industrial Technology Summary ...................................................................................................................................................... 39Figure 25: Industrial Technology Plot ............................................................................................................................................................... 39
9.5 Power Generation ........................................................................................................................................................................................... 40Table 19: Power Generation Technology Summary ....................................................................................................................................... 41Figure 26: Power Generation Technology Plot ................................................................................................................................................ 41
9.6 Transportation ................................................................................................................................................................................................. 42Table 20: Transportation Technology Summary ............................................................................................................................................. 43Figure 27: Transportation Technology Plot ...................................................................................................................................................... 43
9.7 Renewable Natural Gas................................................................................................................................................................................. 44Table 21: Renewable Natural Gas Technology Summary.............................................................................................................................. 44Figure 28: Renewable Natural Gas Technology Plot ...................................................................................................................................... 44
10 Investment Priorities ....................................................................................................................................................................4510.1 Near Term Investment Priorities ............................................................................................................................................................... 45
Table 22: Near Term High Priority Investments .............................................................................................................................................. 45Table 23: Near Term Medium Priority Investments........................................................................................................................................ 45
10.2 Long Term Investment Priorities............................................................................................................................................................... 45Table 24: Long Term High Priority Investments .............................................................................................................................................. 45Table 25: Long Term Medium Priority Investments ....................................................................................................................................... 46
11 National Strategy Impacts .......................................................................................................................................................4711.1 Integration of Natural Gas and Electricity Provision ......................................................................................................................... 47
11.2 Energy Literacy ................................................................................................................................................................................................ 47
11.3 Demonstration Opportunities for New Technologies ....................................................................................................................... 47
11.4 Clarification of Financial and Regulatory Structures ........................................................................................................................ 47
12 Acknowledgements ........................................................................................................................................................................4813 Glossary .......................................................................................................................................................................................................5014 Appendix A: Market and Technology Assessment Methodology ......................................................5114.1 Market Assessment......................................................................................................................................................................................... 51
Table 26: Market Plot Indicators ....................................................................................................................................................................... 51
14.2 Technology Assessment ................................................................................................................................................................................ 52Table 27: Market Plot Indicators ....................................................................................................................................................................... 52
15 References ................................................................................................................................................................................................53
Copyright © 2014 by SDTC™ Sustainable Development Business Case 1
1 The SD Natural Gas Fund™
Natural gas has a central place in Canada’s energy mix, meeting 30 per cent of the country’s energy needs. Today, over 6.4 million customers representing well over half the Canadian population rely on natural gas for heat and power in homes, apartments, buildings, businesses, hospitals and schools. In 2012, approximately 3,900 PJ (100,000 gigalitres) of natural gas was consumed in Canada. According to the National Energy Board, approximately 5,700 PJ of natural gas will be consumed in Canada in 2030. This represents an increase in consumption of approximately 45% from 2012, with the greatest absolute increases in the power generation and industrial sub-sectors. By the year 2030, commercialization of new technologies in the downstream natural gas sector in Canada will achieve GHG emissions reductions of 30.7 Mt-CO2e per year from the the business as usual emissions projection.
The SD Natural Gas Fund™ is the result of collaboration between Sustainable Development Technology Canada (SDTC) and the Canadian Gas Association (CGA), through its venture “Energy Technology Innovation Canada” (ETIC), that will see $15 million provided by the CGA and matched by SDTC, creating a fund valued at $30 million over 3 years. The Fund will be managed by SDTC and will support the development and demonstration of new downstream natural gas technologies.
The SD Natural Gas Fund™ will invest in technology areas outlined in the Business Case and technologies that are attractive to the international export market. SDTC will accept applications to the Fund twice per year. Successful applicants will be invited to submit a detailed proposal that will be subjected to SDTC’s rigorous due diligence process, with a final funding decision made by SDTC’s Board of Directors. The Fund will support, on average, 33% of overall project costs, subject to the successful completion of project milestones.
The SD Business Case™ for Downstream Natural Gas identifies and prioritizes emerging clean technologies which have, or will have, the highest impact in addressing particular industry needs related to the SD Natural Gas Fund™.
1.1 About SDTCOn behalf of the Government of Canada, Sustainable Development Technology Canada (SDTC) helps move Canadian clean technologies forward, readying them for growth and export markets. With a portfolio of companies under management valued at more than $2 billion, SDTC is demonstrating that cleantech is a driver of jobs, productivity and economic prosperity.
SDTC operates two funds aimed at the development and demonstration of innovative technological solutions. The SD Tech Fund™ supports projects that address © climate change, air quality, clean water, and clean soil. The NextGen Biofuels Fund™ supports the establishment of first-of-kind large demonstration-scale facilities for the production of next-generation renewable fuels.
SDTC works with the private sector, the financial sector and all levels of government to meet the Government of Canada’s commitment to create a healthy environment and a high quality of life for all Canadians. SDTC operates as a not-for-profit corporation.
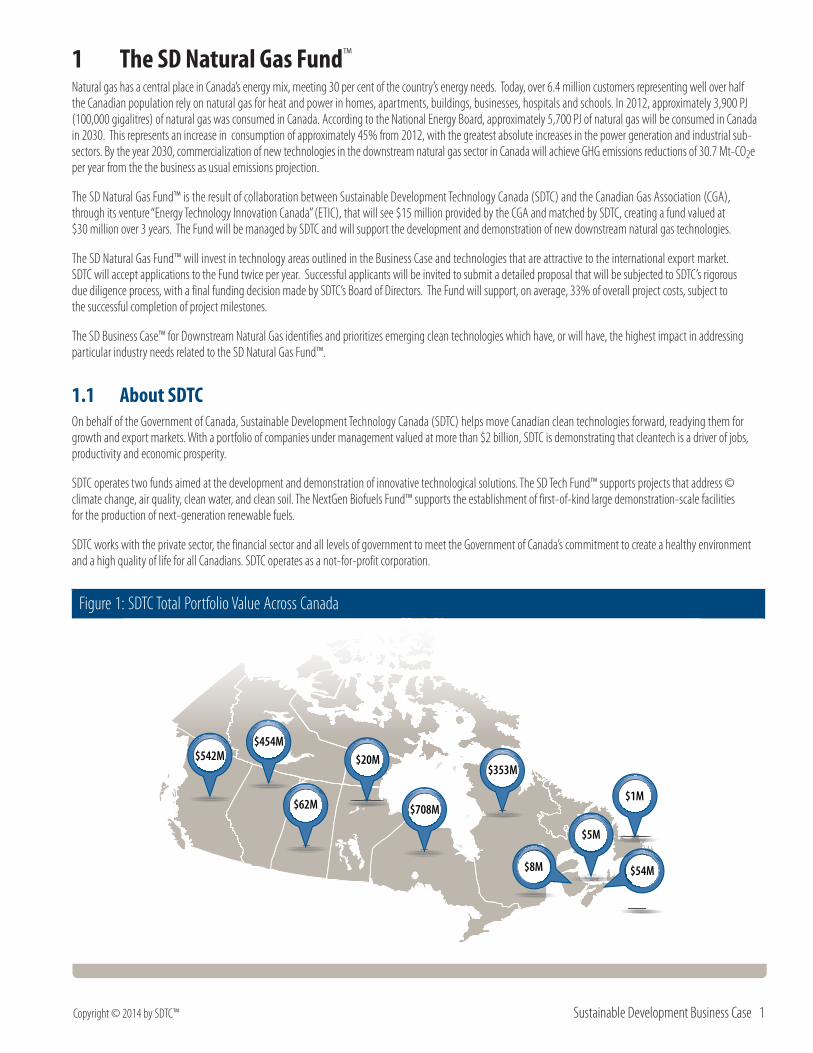
Figure 1: SDTC Total Portfolio Value Across Canada
$542M$454M
$62M
$20M
$708M
$353M
$1M
$5M
$8M $54M
2 Downstream Natural Gas Copyright © 2014 by SDTC™
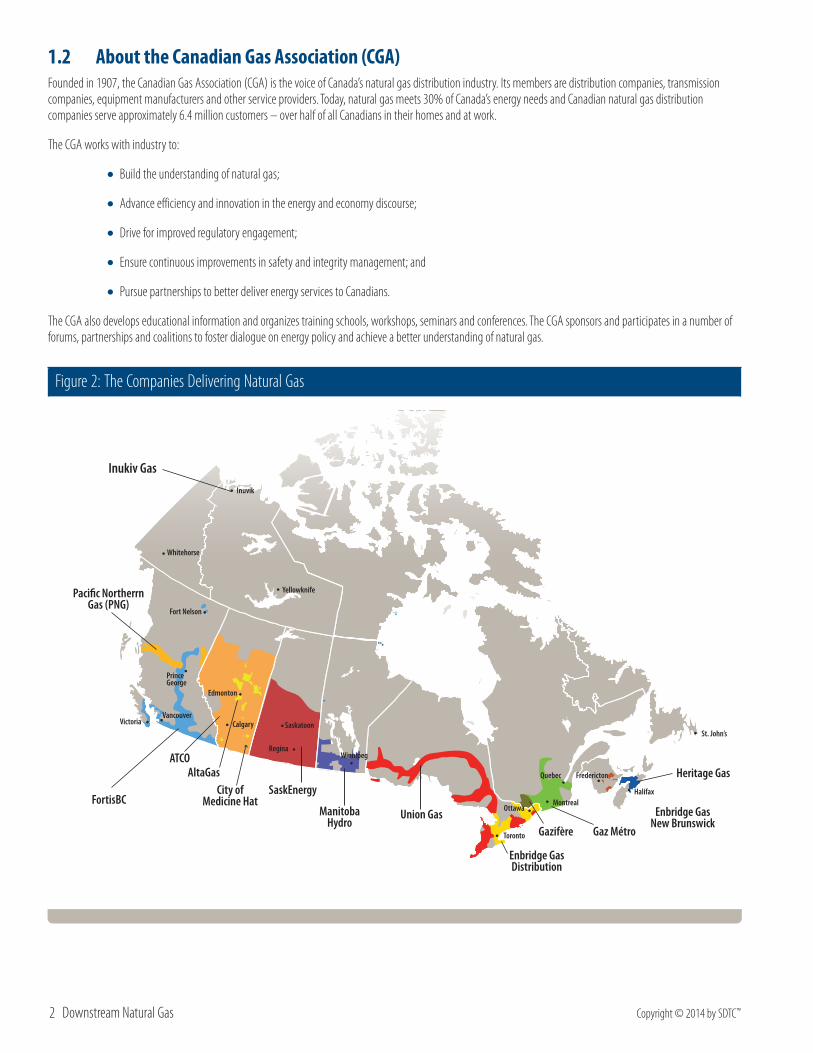
1.2 About the Canadian Gas Association (CGA)Founded in 1907, the Canadian Gas Association (CGA) is the voice of Canada’s natural gas distribution industry. Its members are distribution companies, transmission companies, equipment manufacturers and other service providers. Today, natural gas meets 30% of Canada’s energy needs and Canadian natural gas distribution companies serve approximately 6.4 million customers – over half of all Canadians in their homes and at work.
The CGA works with industry to:
•Build the understanding of natural gas;
•Advance efficiency and innovation in the energy and economy discourse;
•Drive for improved regulatory engagement;
• Ensure continuous improvements in safety and integrity management; and
•Pursue partnerships to better deliver energy services to Canadians.
The CGA also develops educational information and organizes training schools, workshops, seminars and conferences. The CGA sponsors and participates in a number of forums, partnerships and coalitions to foster dialogue on energy policy and achieve a better understanding of natural gas.
Figure 2: The Companies Delivering Natural Gas
St. John’s
Halifax
FrederictonQuebec
MontrealOttawa
Toronto
WinnipegRegina
Calgary
Edmonton
Yellowknife
VancouverVictoria
Prince George
Fort Nelson
Whitehorse
Inuvik
Saskatoon
Inukiv Gas
Pacific Northerrn Gas (PNG)
FortisBC
ATCOAltaGas
City of Medicine Hat
SaskEnergy
ManitobaHydro
Union Gas
Enbridge GasDistribution
Enbridge GasNew Brunswick
Heritage Gas
Gazifère Gaz Métro
Copyright © 2014 by SDTC™ Sustainable Development Business Case 3
2 Executive SummaryThis SD Business Case™ report focuses on impacts of downstream natural gas use in Canada. For the purpose of the analysis, downstream natural gas has been divided into six sub-sectors including:
•Residential
• Commercial
• Industrial
•Power Generation
• Transportation
•Renewable Natural Gas (RNG)
The renewable natural gas sub-sector is treated differently than the other sub-sectors, which only include downstream applications. For RNG, the sub-sector also includes production and gas cleanup.
This report does not include an analysis or needs assessment of upstream and midstream natural gas.
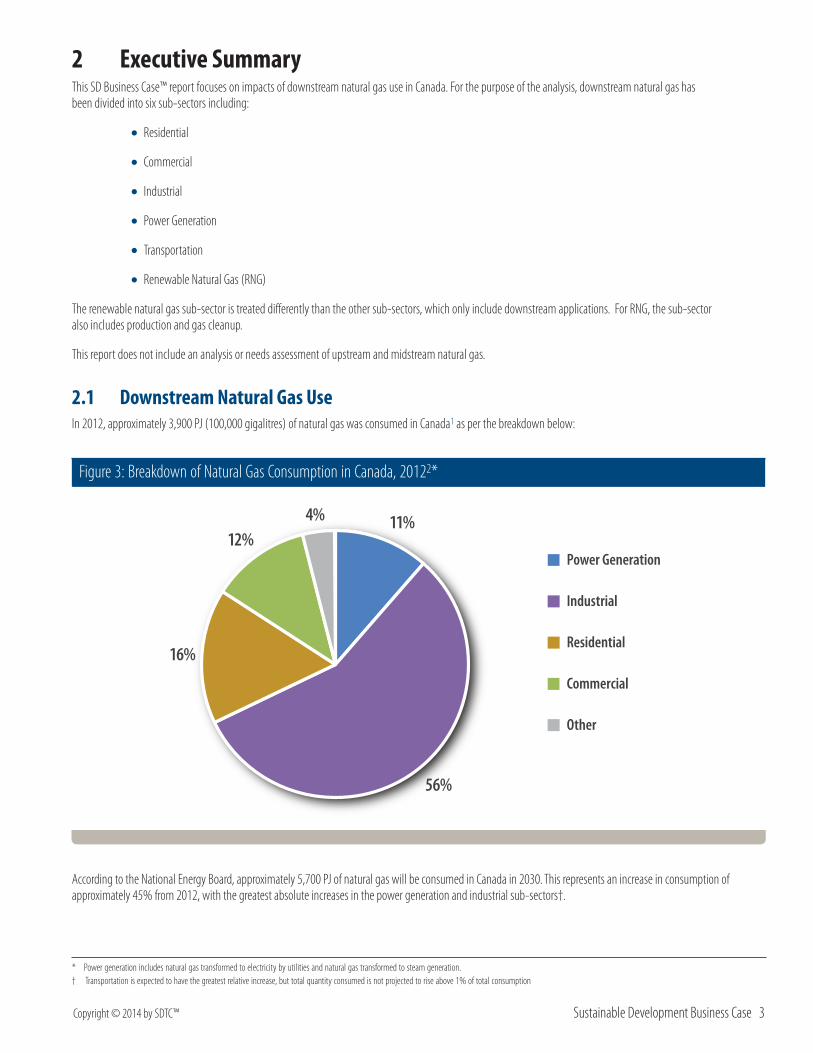
2.1 Downstream Natural Gas UseIn 2012, approximately 3,900 PJ (100,000 gigalitres) of natural gas was consumed in Canada1 as per the breakdown below:
Figure 3: Breakdown of Natural Gas Consumption in Canada, 20122*
11%
56%
16%
12%4%
Power Generation
Industrial
Residential
Commercial
Other
According to the National Energy Board, approximately 5,700 PJ of natural gas will be consumed in Canada in 2030. This represents an increase in consumption of approximately 45% from 2012, with the greatest absolute increases in the power generation and industrial sub-sectors†.
* Power generation includes natural gas transformed to electricity by utilities and natural gas transformed to steam generation.† Transportation is expected to have the greatest relative increase, but total quantity consumed is not projected to rise above 1% of total consumption
4 Downstream Natural Gas Copyright © 2014 by SDTC™
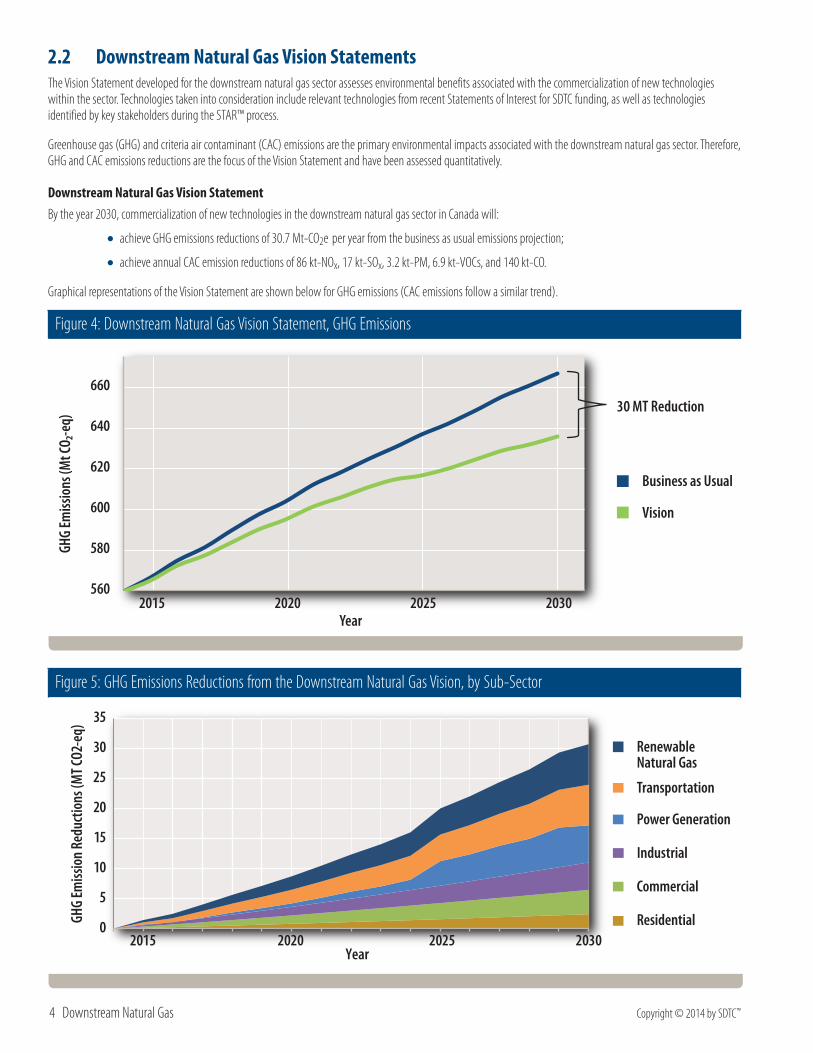
2.2 Downstream Natural Gas Vision StatementsThe Vision Statement developed for the downstream natural gas sector assesses environmental benefits associated with the commercialization of new technologies within the sector. Technologies taken into consideration include relevant technologies from recent Statements of Interest for SDTC funding, as well as technologies identified by key stakeholders during the STAR™ process.
Greenhouse gas (GHG) and criteria air contaminant (CAC) emissions are the primary environmental impacts associated with the downstream natural gas sector. Therefore, GHG and CAC emissions reductions are the focus of the Vision Statement and have been assessed quantitatively.
Downstream Natural Gas Vision StatementBy the year 2030, commercialization of new technologies in the downstream natural gas sector in Canada will:
• achieve GHG emissions reductions of 30.7 Mt-CO2e per year from the business as usual emissions projection;
• achieve annual CAC emission reductions of 86 kt-NOx, 17 kt-SOx, 3.2 kt-PM, 6.9 kt-VOCs, and 140 kt-CO.
Graphical representations of the Vision Statement are shown below for GHG emissions (CAC emissions follow a similar trend).
Figure 4: Downstream Natural Gas Vision Statement, GHG Emissions
560
580
600
620
640
660
2015 2020 2025 2030
GHG
Emiss
ions
(Mt C
O₂-e
q)
Year
Business as Usual
Vision
30 MT Reduction
Figure 5: GHG Emissions Reductions from the Downstream Natural Gas Vision, by Sub-Sector
0
5
10
15
20
25
30
35
2015 2020 2025 2030
GHG
Emiss
ion
Redu
ctio
ns (M
T CO2
-eq)
Year
Residential
Commercial
Industrial
Power Generation
Transportation
Renewable Natural Gas
Copyright © 2014 by SDTC™ Sustainable Development Business Case 5
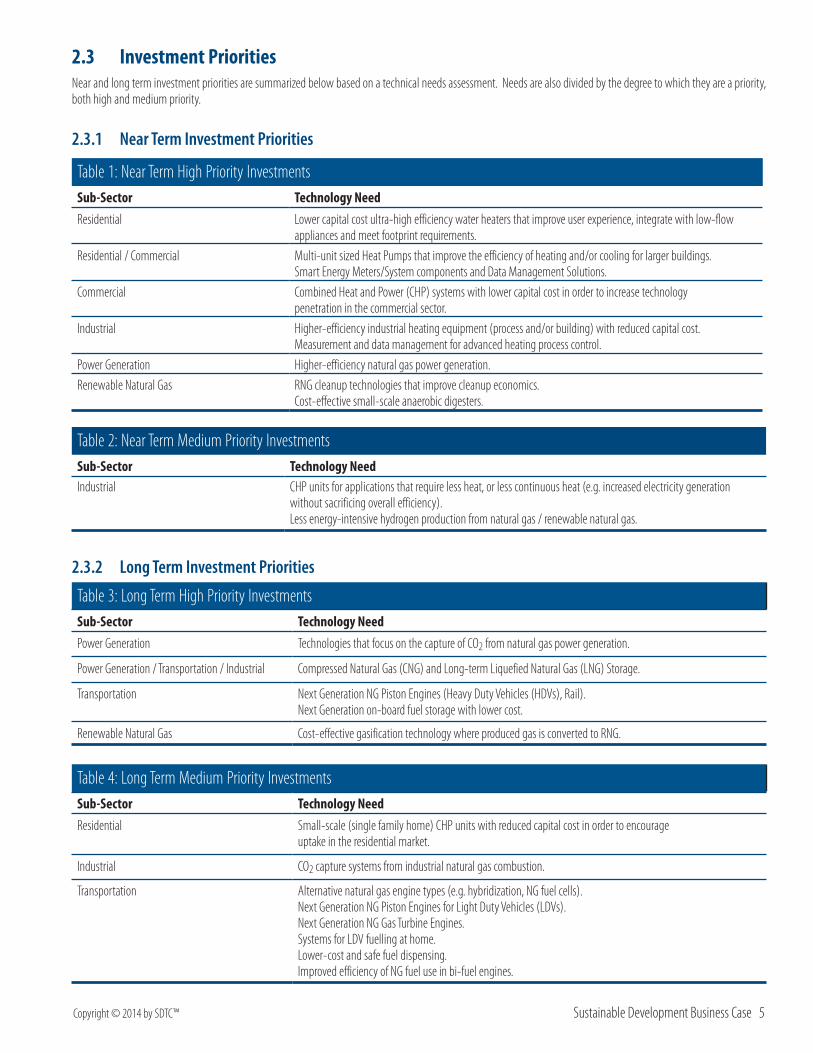
2.3 Investment PrioritiesNear and long term investment priorities are summarized below based on a technical needs assessment. Needs are also divided by the degree to which they are a priority, both high and medium priority.
2.3.1 Near Term Investment Priorities
Table 1: Near Term High Priority InvestmentsSub-Sector Technology NeedResidential Lower capital cost ultra-high efficiency water heaters that improve user experience, integrate with low-flow
appliances and meet footprint requirements. Residential / Commercial Multi-unit sized Heat Pumps that improve the efficiency of heating and/or cooling for larger buildings.
Smart Energy Meters/System components and Data Management Solutions.Commercial Combined Heat and Power (CHP) systems with lower capital cost in order to increase technology
penetration in the commercial sector.Industrial Higher-efficiency industrial heating equipment (process and/or building) with reduced capital cost.
Measurement and data management for advanced heating process control.Power Generation Higher-efficiency natural gas power generation.Renewable Natural Gas RNG cleanup technologies that improve cleanup economics.
Cost-effective small-scale anaerobic digesters.
Table 2: Near Term Medium Priority InvestmentsSub-Sector Technology NeedIndustrial CHP units for applications that require less heat, or less continuous heat (e.g. increased electricity generation
without sacrificing overall efficiency). Less energy-intensive hydrogen production from natural gas / renewable natural gas.
2.3.2 Long Term Investment Priorities
Table 3: Long Term High Priority InvestmentsSub-Sector Technology NeedPower Generation Technologies that focus on the capture of CO2 from natural gas power generation.
Power Generation / Transportation / Industrial Compressed Natural Gas (CNG) and Long-term Liquefied Natural Gas (LNG) Storage.
Transportation Next Generation NG Piston Engines (Heavy Duty Vehicles (HDVs), Rail). Next Generation on-board fuel storage with lower cost.
Renewable Natural Gas Cost-effective gasification technology where produced gas is converted to RNG.
Table 4: Long Term Medium Priority InvestmentsSub-Sector Technology NeedResidential Small-scale (single family home) CHP units with reduced capital cost in order to encourage
uptake in the residential market.
Industrial CO2 capture systems from industrial natural gas combustion.
Transportation Alternative natural gas engine types (e.g. hybridization, NG fuel cells). Next Generation NG Piston Engines for Light Duty Vehicles (LDVs). Next Generation NG Gas Turbine Engines. Systems for LDV fuelling at home. Lower-cost and safe fuel dispensing. Improved efficiency of NG fuel use in bi-fuel engines.
6 Downstream Natural Gas Copyright © 2014 by SDTC™
2.4 Non-technical Priorities
2.4.1 Integration of Natural Gas and Electricity ProvisionGiven Canada’s current energy landscape, minimizing the life-cycle environmental impact of energy-use within the residential and commercial sectors would involve the use of a combination of electricity and natural gas by region. However, separate regulation governing electricity and gas provision to the same customer presents a barrier to integrated solutions designed to minimize environmental impact.
2.4.2 Energy LiteracyThere is a need for the education of policy makers, stakeholders and consumers with respect to the life-cycle impacts of various power generation alternatives, as well as Canada’s capacity to generate power through various alternatives in the short, medium and long terms. By simultaneously educating key decision makers while building social understanding and acceptance, the goal of energy literacy would be to ensure that energy decisions are made based on the best available information.
Also identified within this broader category is a need for improved education on how products and services use energy. This could empower end-users to make environmentally-based decisions, which could then impact the decisions of suppliers related to efficiency and energy source considerations.
2.4.3 Demonstration Opportunities for New TechnologiesMany of the downstream NG sub-sectors are considered risk averse, and even those sub-sectors that may be more receptive to newer technologies look to demonstrated performance prior to adoption. Demonstration opportunities could come in the form of government programs or other methods to incentivize or reward utilities to incubate, install and nurture new technologies.
2.4.4 Clarification of Financial and Regulatory StructuresAdoption of some technologies with significant GHG reduction potentials will be reliant on financial and regulatory structures. Lack of clarity on these structures will have the potential to negatively impact adoption. They include:
•Natural gas taxation as a transportation fuel.
• Clarification from regulators regarding potential GHG emissions regulations.
•How the RNG cost premium will be overcome as RNG is not expected to be cost-competitive with NG in the short and medium term.
• CCS requirements for NG electric power generation.
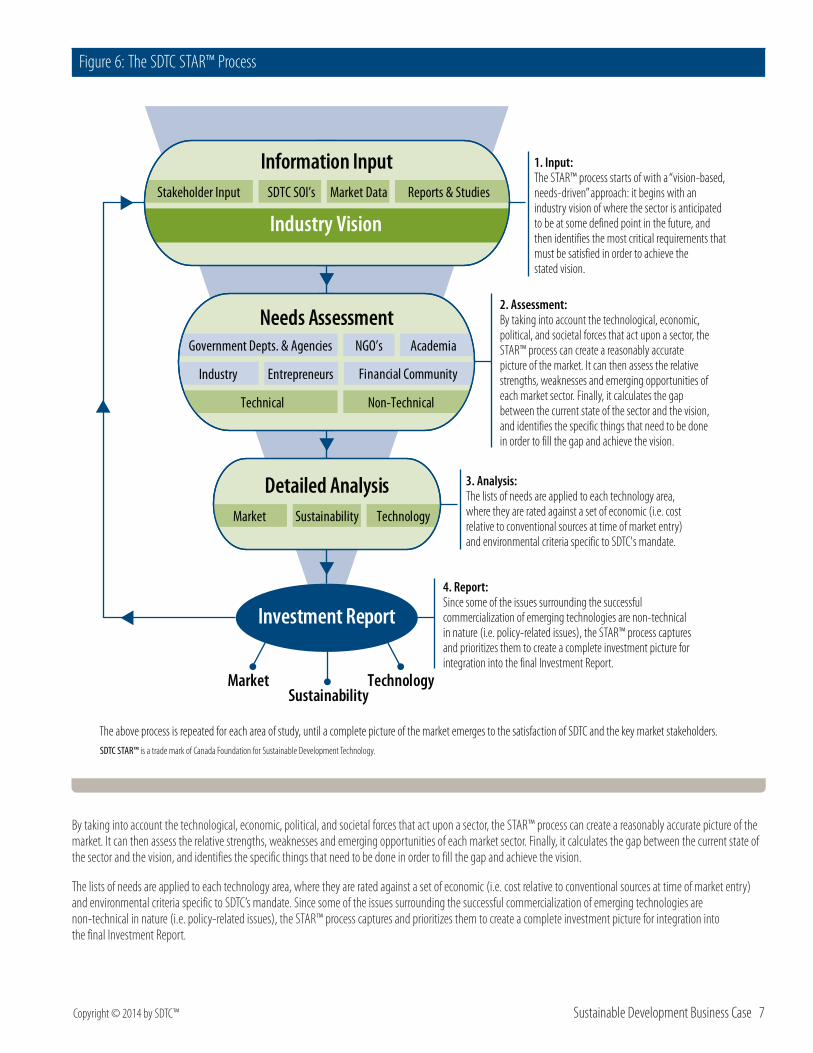
3 Report Process, Scope and Structure3.1 Report ProcessThe SDTC STAR™ ToolThe Sustainable Technology Assessment Roadmap (STAR™) is an analytical tool that is used to produce the SD Business Case reports. It is an iterative analytical process that combines data, reports, stakeholder input, and industry intelligence in a common information platform. It uses a series of criteria selection screens to assess and sort relevant information from a variety of sources. The output is an Investment Report that highlights key technology investment opportunities for the sector under study.
The SDTC STAR™ Process: Data Collection and AnalysisThe STAR™ process uses a “vision-based, needs-driven” approach: it begins with an industry vision of where the sector is anticipated to be at some defined point in the future, and then identifies the most critical requirements that must be satisfied in order to achieve the stated vision.
Copyright © 2014 by SDTC™ Sustainable Development Business Case 7
Figure 6: The SDTC STAR™ Process
Industry Vision
SDTC SOI’sStakeholder Input Market Data Reports & Studies
Industry Entrepreneurs
Government Depts. & Agencies
Financial Community
NGO’s
Needs Assessment
Non-TechnicalTechnical
Information Input
Market Sustainability Technology
Detailed Analysis
MarketSustainability
Technology
Investment Report
Academia
1. Input: The STAR™ process starts of with a “vision-based, needs-driven” approach: it begins with an industry vision of where the sector is anticipated to be at some defined point in the future, and then identifies the most critical requirements that must be satisfied in order to achieve the stated vision.
2. Assessment: By taking into account the technological, economic, political, and societal forces that act upon a sector, the STAR™ process can create a reasonably accurate picture of the market. It can then assess the relative strengths, weaknesses and emerging opportunities of each market sector. Finally, it calculates the gap between the current state of the sector and the vision, and identifies the specific things that need to be done in order to fill the gap and achieve the vision.
3. Analysis: The lists of needs are applied to each technology area, where they are rated against a set of economic (i.e. cost relative to conventional sources at time of market entry) and environmental criteria specific to SDTC's mandate.
4. Report: Since some of the issues surrounding the successful commercialization of emerging technologies are non-technical in nature (i.e. policy-related issues), the STAR™ process captures and prioritizes them to create a complete investment picture for integration into the final Investment Report.
The above process is repeated for each area of study, until a complete picture of the market emerges to the satisfaction of SDTC and the key market stakeholders.SDTC STAR™ is a trade mark of Canada Foundation for Sustainable Development Technology.
By taking into account the technological, economic, political, and societal forces that act upon a sector, the STAR™ process can create a reasonably accurate picture of the market. It can then assess the relative strengths, weaknesses and emerging opportunities of each market sector. Finally, it calculates the gap between the current state of the sector and the vision, and identifies the specific things that need to be done in order to fill the gap and achieve the vision.
The lists of needs are applied to each technology area, where they are rated against a set of economic (i.e. cost relative to conventional sources at time of market entry) and environmental criteria specific to SDTC’s mandate. Since some of the issues surrounding the successful commercialization of emerging technologies are non-technical in nature (i.e. policy-related issues), the STAR™ process captures and prioritizes them to create a complete investment picture for integration into the final Investment Report.
8 Downstream Natural Gas Copyright © 2014 by SDTC™
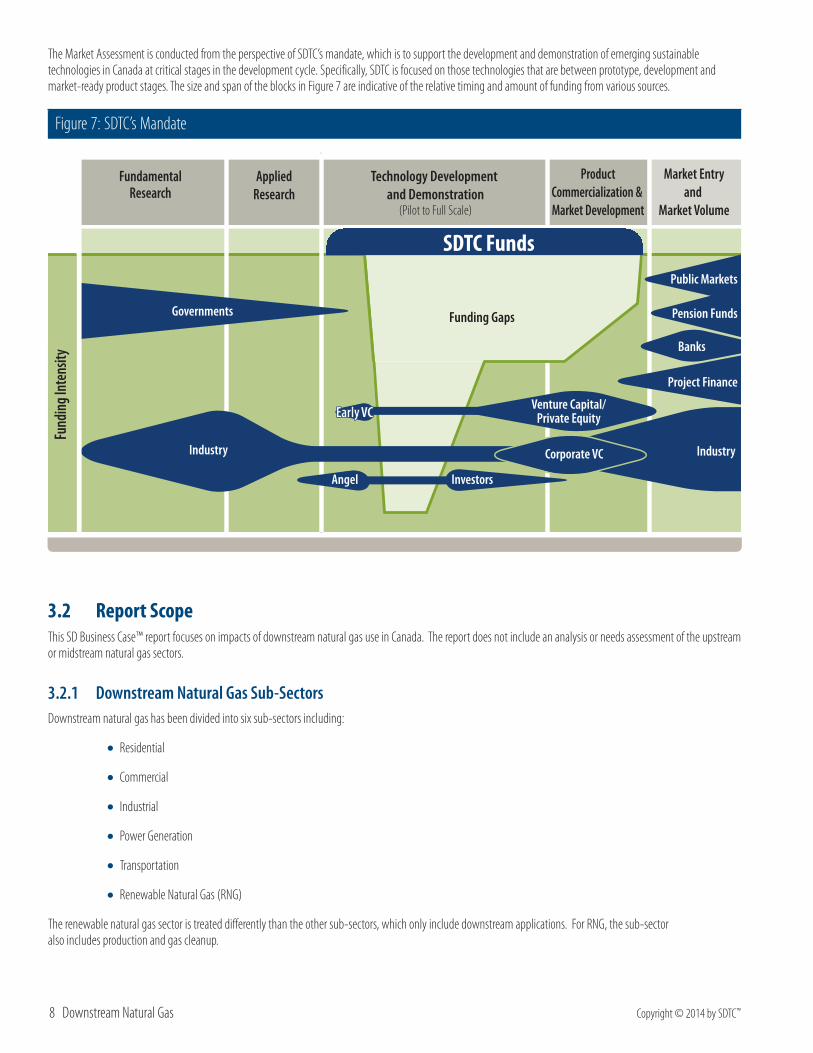
The Market Assessment is conducted from the perspective of SDTC’s mandate, which is to support the development and demonstration of emerging sustainable technologies in Canada at critical stages in the development cycle. Specifically, SDTC is focused on those technologies that are between prototype, development and market-ready product stages. The size and span of the blocks in Figure 7 are indicative of the relative timing and amount of funding from various sources.
Figure 7: SDTC’s Mandate
Funding Gaps
Industry Industry
Governments
Banks
InvestorsAngel
Pension Funds
Project Finance
Corporate VC
Venture Capital/Private Equity
Public Markets
Technology Development and Demonstration
(Pilot to Full Scale)
FundamentalResearch
AppliedResearch
ProductCommercialization & Market Development
Market Entryand
Market Volume
Fund
ing I
nten
sity
SDTC Funds
3.2 Report ScopeThis SD Business Case™ report focuses on impacts of downstream natural gas use in Canada. The report does not include an analysis or needs assessment of the upstream or midstream natural gas sectors.
3.2.1 Downstream Natural Gas Sub-SectorsDownstream natural gas has been divided into six sub-sectors including:
•Residential
• Commercial
• Industrial
•Power Generation
• Transportation
•Renewable Natural Gas (RNG)
The renewable natural gas sector is treated differently than the other sub-sectors, which only include downstream applications. For RNG, the sub-sector also includes production and gas cleanup.
Copyright © 2014 by SDTC™ Sustainable Development Business Case 9
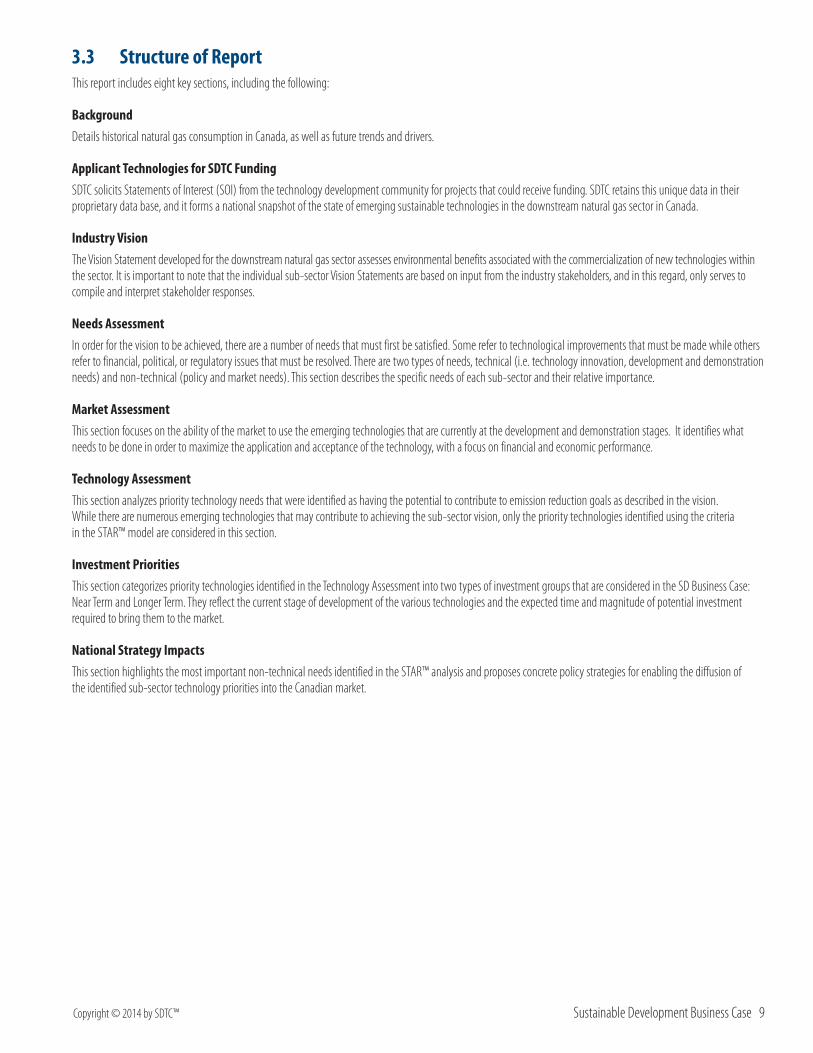
3.3 Structure of ReportThis report includes eight key sections, including the following:
BackgroundDetails historical natural gas consumption in Canada, as well as future trends and drivers.
Applicant Technologies for SDTC FundingSDTC solicits Statements of Interest (SOI) from the technology development community for projects that could receive funding. SDTC retains this unique data in their proprietary data base, and it forms a national snapshot of the state of emerging sustainable technologies in the downstream natural gas sector in Canada.
Industry VisionThe Vision Statement developed for the downstream natural gas sector assesses environmental benefits associated with the commercialization of new technologies within the sector. It is important to note that the individual sub-sector Vision Statements are based on input from the industry stakeholders, and in this regard, only serves to compile and interpret stakeholder responses.
Needs AssessmentIn order for the vision to be achieved, there are a number of needs that must first be satisfied. Some refer to technological improvements that must be made while others refer to financial, political, or regulatory issues that must be resolved. There are two types of needs, technical (i.e. technology innovation, development and demonstration needs) and non-technical (policy and market needs). This section describes the specific needs of each sub-sector and their relative importance.
Market AssessmentThis section focuses on the ability of the market to use the emerging technologies that are currently at the development and demonstration stages. It identifies what needs to be done in order to maximize the application and acceptance of the technology, with a focus on financial and economic performance.
Technology AssessmentThis section analyzes priority technology needs that were identified as having the potential to contribute to emission reduction goals as described in the vision. While there are numerous emerging technologies that may contribute to achieving the sub-sector vision, only the priority technologies identified using the criteria in the STAR™ model are considered in this section.
Investment PrioritiesThis section categorizes priority technologies identified in the Technology Assessment into two types of investment groups that are considered in the SD Business Case: Near Term and Longer Term. They reflect the current stage of development of the various technologies and the expected time and magnitude of potential investment required to bring them to the market.
National Strategy ImpactsThis section highlights the most important non-technical needs identified in the STAR™ analysis and proposes concrete policy strategies for enabling the diffusion of the identified sub-sector technology priorities into the Canadian market.
10 Downstream Natural Gas Copyright © 2014 by SDTC™
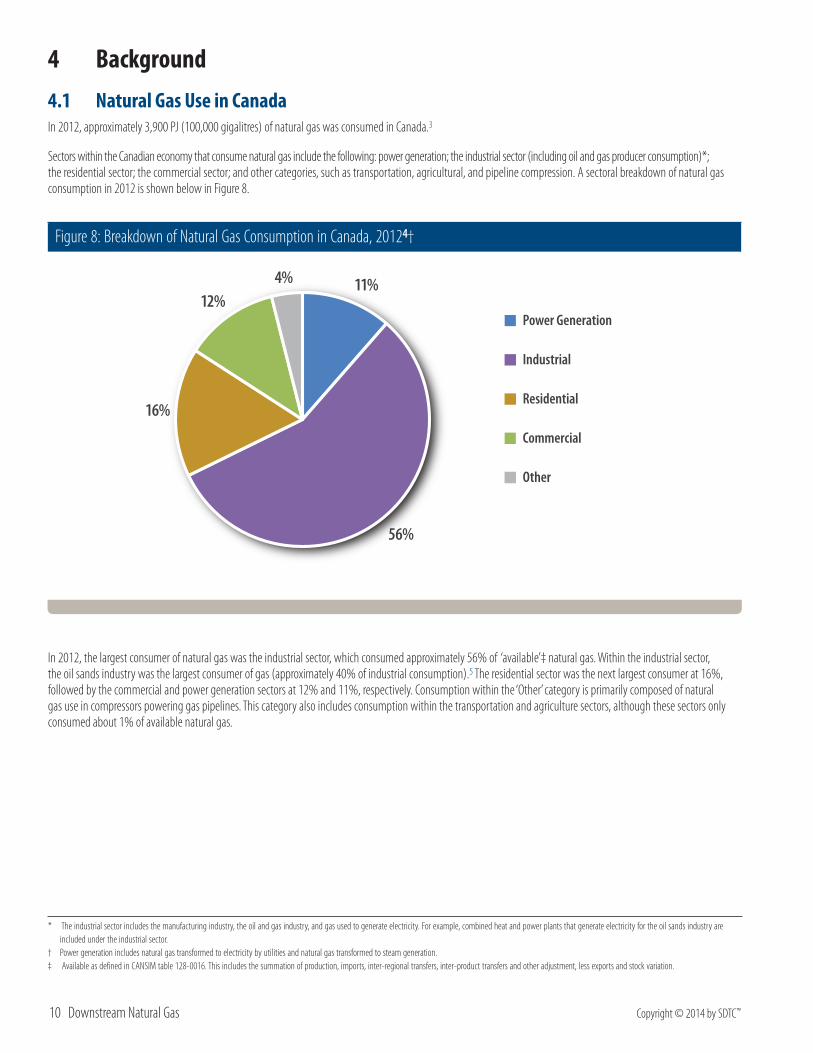
4 Background4.1 Natural Gas Use in CanadaIn 2012, approximately 3,900 PJ (100,000 gigalitres) of natural gas was consumed in Canada.3
Sectors within the Canadian economy that consume natural gas include the following: power generation; the industrial sector (including oil and gas producer consumption)*; the residential sector; the commercial sector; and other categories, such as transportation, agricultural, and pipeline compression. A sectoral breakdown of natural gas consumption in 2012 is shown below in Figure 8.
Figure 8: Breakdown of Natural Gas Consumption in Canada, 20124†
11%
56%
16%
12%4%
Power Generation
Industrial
Residential
Commercial
Other
In 2012, the largest consumer of natural gas was the industrial sector, which consumed approximately 56% of ‘available’‡ natural gas. Within the industrial sector, the oil sands industry was the largest consumer of gas (approximately 40% of industrial consumption).5 The residential sector was the next largest consumer at 16%, followed by the commercial and power generation sectors at 12% and 11%, respectively. Consumption within the ‘Other’ category is primarily composed of natural gas use in compressors powering gas pipelines. This category also includes consumption within the transportation and agriculture sectors, although these sectors only consumed about 1% of available natural gas.
* The industrial sector includes the manufacturing industry, the oil and gas industry, and gas used to generate electricity. For example, combined heat and power plants that generate electricity for the oil sands industry are included under the industrial sector.
† Power generation includes natural gas transformed to electricity by utilities and natural gas transformed to steam generation.‡ Available as defined in CANSIM table 128-0016. This includes the summation of production, imports, inter-regional transfers, inter-product transfers and other adjustment, less exports and stock variation.
Copyright © 2014 by SDTC™ Sustainable Development Business Case 11
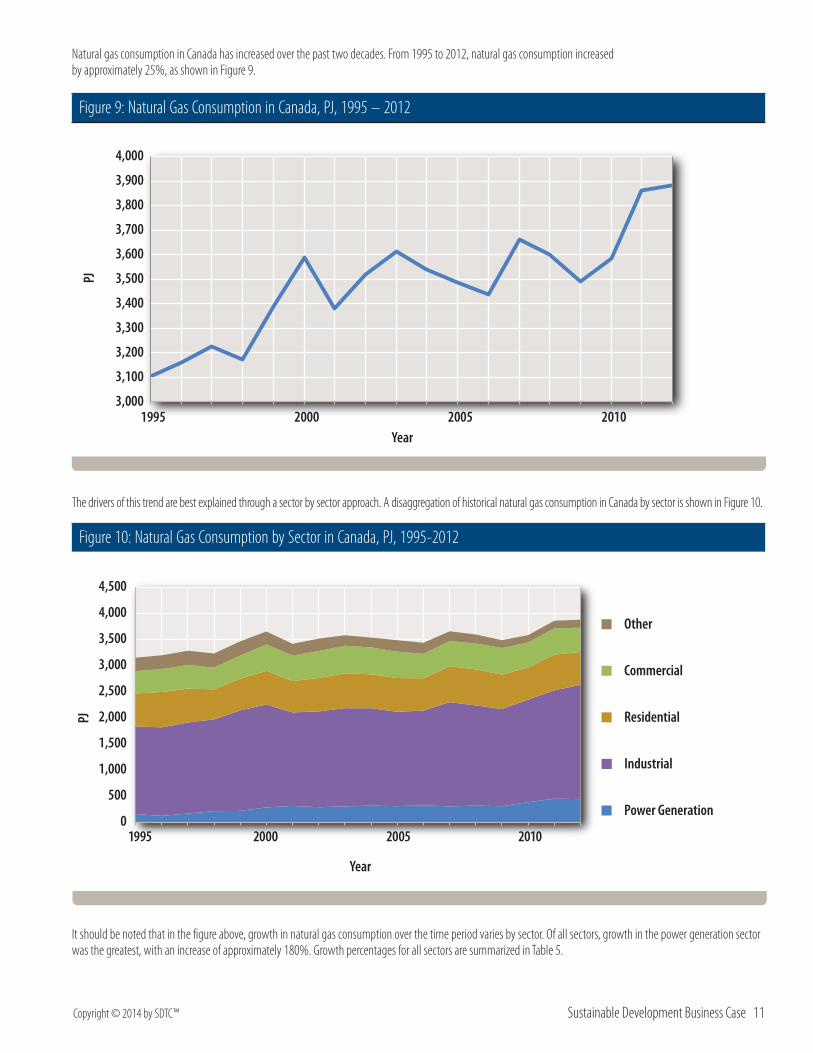
Natural gas consumption in Canada has increased over the past two decades. From 1995 to 2012, natural gas consumption increased by approximately 25%, as shown in Figure 9.
Figure 9: Natural Gas Consumption in Canada, PJ, 1995 – 2012
3,000
3,100
3,200
3,300
3,400
3,500
3,600
3,700
3,800
3,900
4,000
1995
PJ
2000 2005 2010Year
The drivers of this trend are best explained through a sector by sector approach. A disaggregation of historical natural gas consumption in Canada by sector is shown in Figure 10.
Figure 10: Natural Gas Consumption by Sector in Canada, PJ, 1995-2012
0
500
1,000
1,500
2,000
2,500
3,000
3,500
4,000
4,500
Year
1995 2000 2005 2010
Residential
Commercial
Industrial
Power Generation
Other
PJ
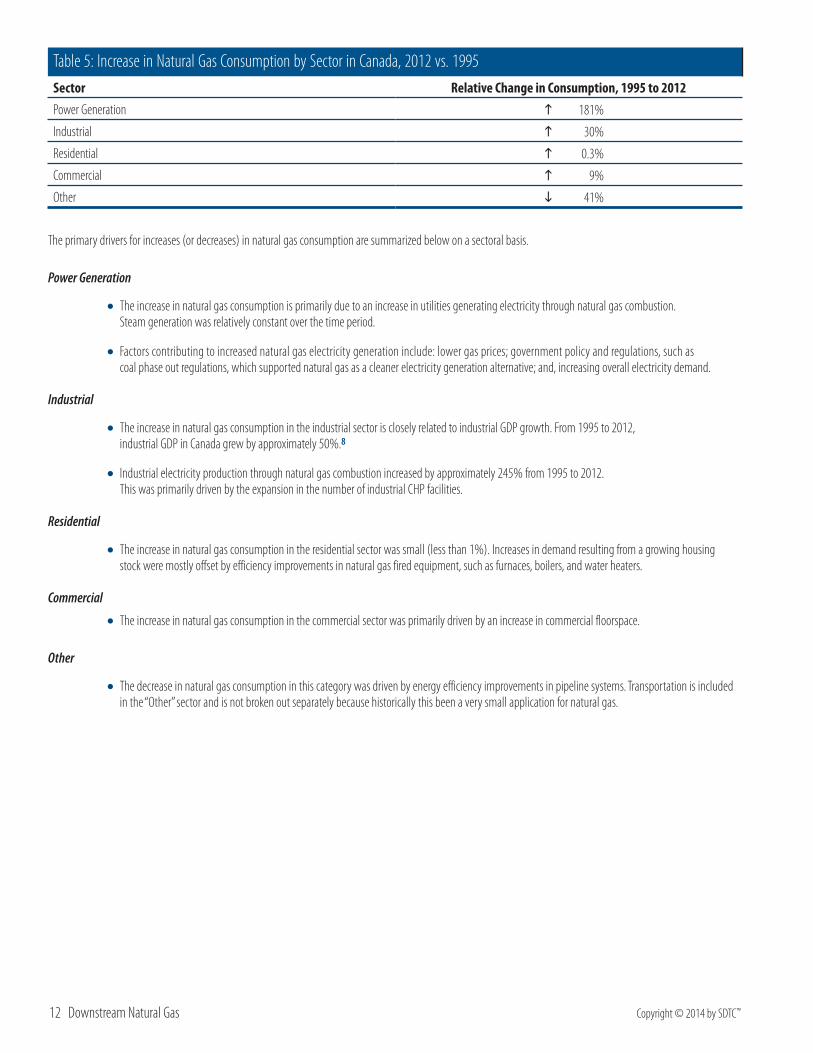
It should be noted that in the figure above, growth in natural gas consumption over the time period varies by sector. Of all sectors, growth in the power generation sector was the greatest, with an increase of approximately 180%. Growth percentages for all sectors are summarized in Table 5.
12 Downstream Natural Gas Copyright © 2014 by SDTC™
Table 5: Increase in Natural Gas Consumption by Sector in Canada, 2012 vs. 1995Sector Relative Change in Consumption, 1995 to 2012Power Generation 181%
Industrial 30%
Residential 0.3%
Commercial 9%
Other 41%
The primary drivers for increases (or decreases) in natural gas consumption are summarized below on a sectoral basis.
Power Generation
• The increase in natural gas consumption is primarily due to an increase in utilities generating electricity through natural gas combustion. Steam generation was relatively constant over the time period.
• Factors contributing to increased natural gas electricity generation include: lower gas prices; government policy and regulations, such as coal phase out regulations, which supported natural gas as a cleaner electricity generation alternative; and, increasing overall electricity demand.
Industrial
• The increase in natural gas consumption in the industrial sector is closely related to industrial GDP growth. From 1995 to 2012, industrial GDP in Canada grew by approximately 50%.8
• Industrial electricity production through natural gas combustion increased by approximately 245% from 1995 to 2012. This was primarily driven by the expansion in the number of industrial CHP facilities.
Residential
• The increase in natural gas consumption in the residential sector was small (less than 1%). Increases in demand resulting from a growing housing stock were mostly offset by efficiency improvements in natural gas fired equipment, such as furnaces, boilers, and water heaters.
Commercial
• The increase in natural gas consumption in the commercial sector was primarily driven by an increase in commercial floorspace.
Other
• The decrease in natural gas consumption in this category was driven by energy efficiency improvements in pipeline systems. Transportation is included in the “Other” sector and is not broken out separately because historically this been a very small application for natural gas.
Copyright © 2014 by SDTC™ Sustainable Development Business Case 13
4.2 Projected Natural Gas UseThe National Energy Board (NEB) provides energy supply and demand projections in its annual Energy Future publication. The most recent report, Canada’s Energy Future 2013 - Energy Supply and Demand Projections to 2035 (Energy Future Report), was used as a reference source for natural gas consumption projections.9
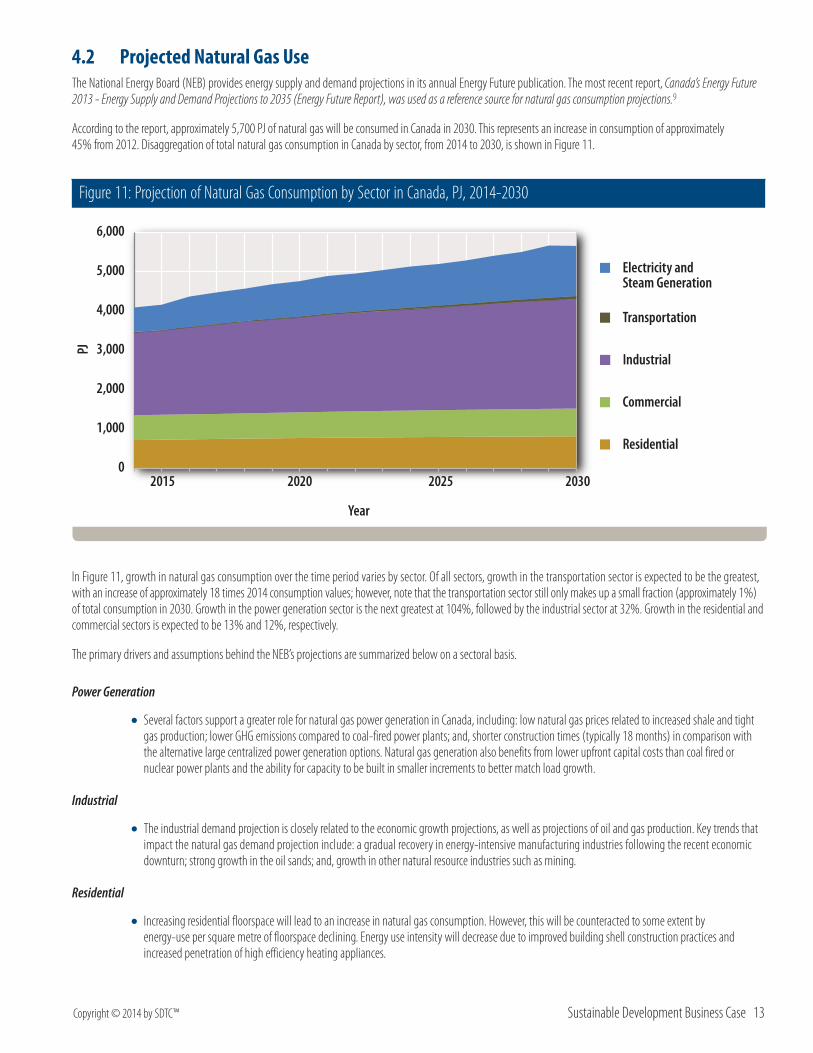
According to the report, approximately 5,700 PJ of natural gas will be consumed in Canada in 2030. This represents an increase in consumption of approximately 45% from 2012. Disaggregation of total natural gas consumption in Canada by sector, from 2014 to 2030, is shown in Figure 11.
Figure 11: Projection of Natural Gas Consumption by Sector in Canada, PJ, 2014-2030
0
1,000
2,000
3,000
4,000
5,000
6,000
2015 2020 2025 2030
Residential
Commercial
Industrial
Electricity andSteam Generation
Transportation
PJ
Year
In Figure 11, growth in natural gas consumption over the time period varies by sector. Of all sectors, growth in the transportation sector is expected to be the greatest, with an increase of approximately 18 times 2014 consumption values; however, note that the transportation sector still only makes up a small fraction (approximately 1%) of total consumption in 2030. Growth in the power generation sector is the next greatest at 104%, followed by the industrial sector at 32%. Growth in the residential and commercial sectors is expected to be 13% and 12%, respectively.
The primary drivers and assumptions behind the NEB’s projections are summarized below on a sectoral basis.
Power Generation
• Several factors support a greater role for natural gas power generation in Canada, including: low natural gas prices related to increased shale and tight gas production; lower GHG emissions compared to coal-fired power plants; and, shorter construction times (typically 18 months) in comparison with the alternative large centralized power generation options. Natural gas generation also benefits from lower upfront capital costs than coal fired or nuclear power plants and the ability for capacity to be built in smaller increments to better match load growth.
Industrial
• The industrial demand projection is closely related to the economic growth projections, as well as projections of oil and gas production. Key trends that impact the natural gas demand projection include: a gradual recovery in energy-intensive manufacturing industries following the recent economic downturn; strong growth in the oil sands; and, growth in other natural resource industries such as mining.
Residential
• Increasing residential floorspace will lead to an increase in natural gas consumption. However, this will be counteracted to some extent by energy-use per square metre of floorspace declining. Energy use intensity will decrease due to improved building shell construction practices and increased penetration of high efficiency heating appliances.
14 Downstream Natural Gas Copyright © 2014 by SDTC™
Commercial
•As with the residential sector, increasing commercial floorspace will lead to an increase in natural gas consumption. This increase will be limited by a revised National Energy Code for Buildings (NECB), which was finalized in 2011. The code change is expected to improve energy performance in new commercial and institutional buildings by 25 per cent compared to the previous code (1997).
Transportation
• The forecast takes into account the current interest in natural gas (often LNG) for medium and heavy-duty trucks, particularly in operations where the vehicles return to central locations often and use key regional transport corridors. In the forecast, freight Natural Gas Vehicles (NGVs) use 100 PJ or 7.4 106m³/d (260 MMcf/d) of natural gas in 2035, representing 6% of total freight demand. This is approximately equivalent to 60 000 medium- and heavy-duty freight NGVs.
5 Applicant Technologies for SDTC FundingAn analysis of Statements of Interest (SOIs) was undertaken in order to develop an overview of the current state of sustainable downstream natural gas technologies within the sub-sectors considered in this report.
SOIs are received by SDTC as part of their funding process. Proponents identify the nature of the technology being proposed and provide a business rationale for funding support. Only projects that meet the technology development and financial integrity criteria are considered, so the information provided in the SOIs is considered timely and relevant. Taken together, these applications provide a unique and accurate snapshot of the state of late-stage sustainable technology developments in Canada.
The SOIs related to the downstream natural gas sector received by SDTC from 2009 to 2013 were reviewed as part of the analysis. Applicant information regarding the type of technology proposed, GHG reduction potential, total project costs, request for SDTC funding, and year of submission were documented for the assessment. SOIs were categorized by sub-sector and technology type.
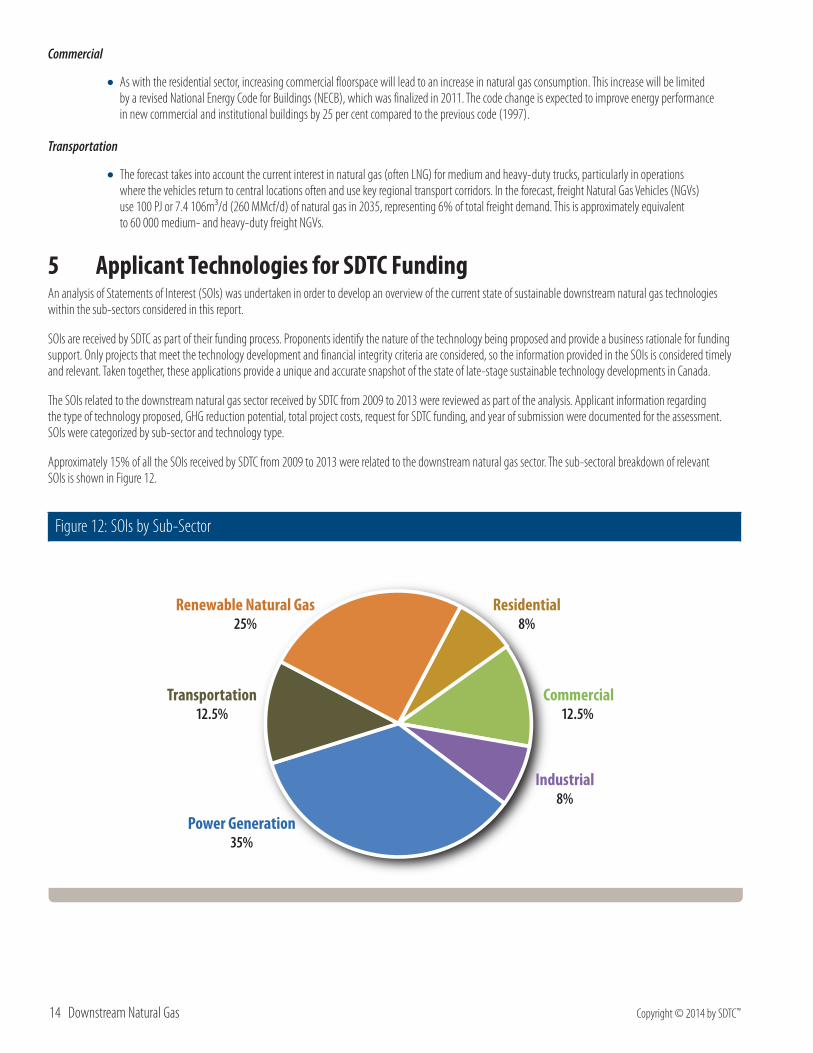
Approximately 15% of all the SOIs received by SDTC from 2009 to 2013 were related to the downstream natural gas sector. The sub-sectoral breakdown of relevant SOIs is shown in Figure 12.
Figure 12: SOIs by Sub-Sector
Residential8%
Commercial12.5%
Industrial8%
Power Generation35%
Transportation12.5%
Renewable Natural Gas25%

Copyright © 2014 by SDTC™ Sustainable Development Business Case 15
SOIs received were most relevant to power generation, with approximately 35% of the technology applications falling within this sub-sector. This was followed by RNG (25%), commercial (13%), transportation (13%), industrial (8%), and residential (8%).
Specific technologies and technology areas identified during the SOI analysis are summarized below for each sub-sector.
Residential
•High efficiency combined heat and power systems
Commercial
• Energy and data management systems
• Combined heat and power systems
•Natural gas cooling
Industrial
• Efficient heating systems
Power Generation
• Fuel cell technologies
• Integration of renewable energy with natural gas generators
•Power to gas technologies
Transportation
•NG/LNG fuelled vehicles
RNG
•Biogas purification technologies
•Biomass gasification technologies
•Anaerobic digestion technologies

16 Downstream Natural Gas Copyright © 2014 by SDTC™
6 Industry VisionThe Vision Statement developed for the downstream natural gas sector assesses environmental benefits associated with the commercialization of new technologies within the sector. Technologies taken into consideration include those identified during the SOI analysis in Section 5, as well as technologies identified by key stakeholders.
Greenhouse gas (GHG) and criteria air contaminant (CAC) emissions are the primary environmental impacts associated with the downstream natural gas sector. Therefore, GHG and CAC emissions reductions are the focus of the Vision Statement and have been assessed quantitatively.
Note that some of the technologies considered may provide benefits other than GHG and CAC emissions reductions. For example, some CHP systems in the residential, commercial, and industrial sectors are able to provide heat and power during electrical grid outages thereby increasing supply resiliency.*
Note on Soil and Water Impacts
The Vision Statement focuses on GHG and CAC emissions, as they result in the direct environmental impacts associated with the downstream natural gas sector. Direct impacts on soil and water quality are more evident during natural gas extraction (e.g., hydraulic fracturing), which is considered outside the scope of this study.
Impacts on soil and water quality resulting from activities in the downstream natural gas sector are typically indirect. For example, NOx and SOx emissions contribute to acid rain, which in turn impacts soil and water quality. Therefore, the CAC emissions reductions achieved in the Vision Statement may result in environmental benefits to soil and water quality. However, an attempt to quantify these benefits has not been undertaken, due to the high degree of uncertainty associated with the quantification methodologies and data sources.
Downstream Natural Gas Vision StatementBased on the prevailing market trends and input from key stakeholders, the following Vision Statement has been derived for the downstream natural gas sector in Canada. The goal year is 2030, representing a 16 year timeframe over which technology innovation is expected. This was chosen to be consistent with the time required to realize major shifts in practices, attitudes and technologies within the sector.
By the year 2030, commercialization of new technologies in the downstream natural gas sector in Canada will:
• achieve GHG emissions reductions of 30.7 Mt-CO2e per year from the business as usual emissions projection;
• achieve annual CAC emission reductions of 86 kt-NOx, 17 kt-SOx, 3.2 kt-PM, 6.9 kt-VOCs, and 140 kt-CO.
* For CHP systems to operating during grid outages, they must be capable of operating in ‘island mode’. The design elements necessary so that a CHP system can be isolated from the grid are system-specific and include additional controls and switchgear.
Copyright © 2014 by SDTC™ Sustainable Development Business Case 17
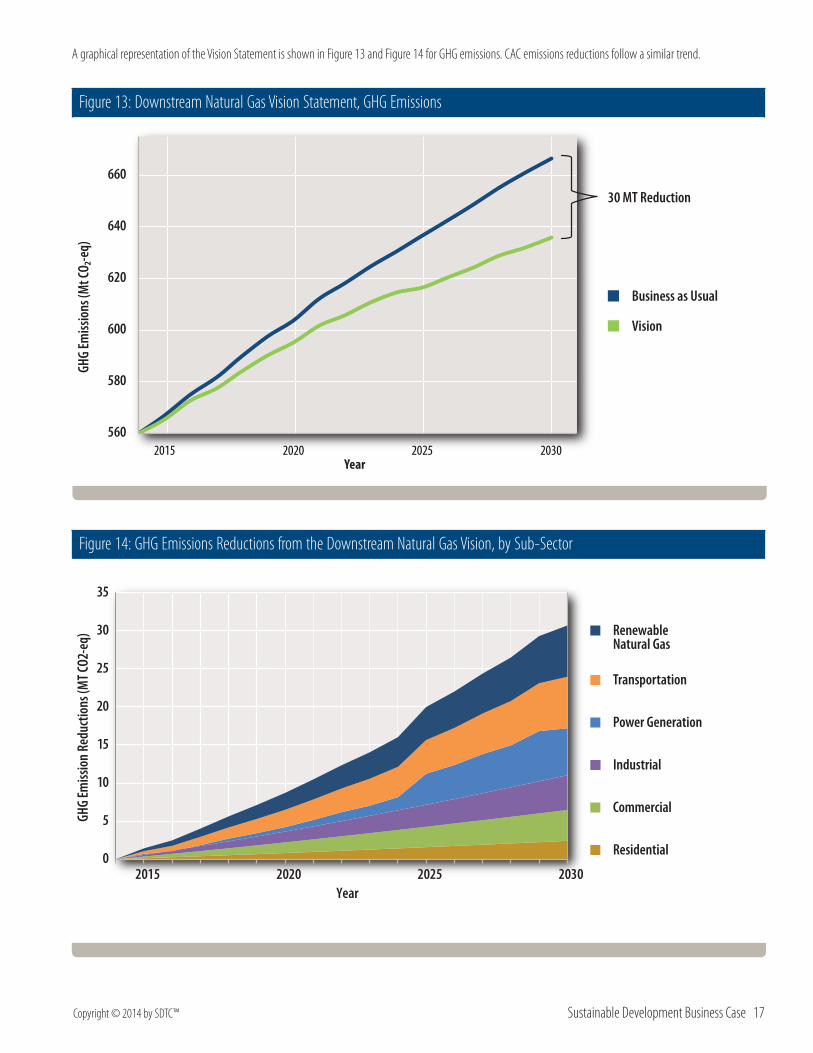
A graphical representation of the Vision Statement is shown in Figure 13 and Figure 14 for GHG emissions. CAC emissions reductions follow a similar trend.
Figure 13: Downstream Natural Gas Vision Statement, GHG Emissions
560
580
600
620
640
660
2015 2020 2025 2030
GHG
Emiss
ions
(Mt C
O₂-e
q)
Year
Business as Usual
Vision
30 MT Reduction
Figure 14: GHG Emissions Reductions from the Downstream Natural Gas Vision, by Sub-Sector
0
5
10
15
20
25
30
35
2015 2020 2025 2030
GHG
Emiss
ion
Redu
ctio
ns (M
T CO2
-eq)
Year
Residential
Commercial
Industrial
Power Generation
Transportation
Renewable Natural Gas

18 Downstream Natural Gas Copyright © 2014 by SDTC™
Downstream Natural Gas Vision Details
Business as Usual Emissions
Business as usual GHG emissions are based on projections contained within the NEB Energy Future Report. Details on specific data used to generate the business as usual scenario for each sub-sector are given in the sections below.
For all sub-sectors, the NEB Energy Future Report assumes that both process (e.g., building codes, social practices) and device (equipment) efficiency improvements will lead to reductions in future fuel consumption. These assumptions are high-level and have not been disaggregated to the extent necessary to remove from the business as usual cases; therefore, the efficiency assumptions have been retained in the sub-sectoral business as usual cases. This may cause some Vision Statement technology efficiency gains to lead to smaller reductions in natural gas consumption than would be the case if the Report’s efficiency assumptions were removed; however, it should also result in conservative emissions reductions projections.
Fuel and electricity consumption values were converted to life-cycle (upstream production* and combustion) GHG and CAC emissions using emission factors from the following sources:
•Natural Resources Canada’s GHGenius v4.03a model for lifecycle assessment of transportation fuels.10 GHGenius was also used for CAC emission factors for various equipment, such as building heaters and industrial boilers;
• Environment Canada’s National Inventory Report 1990-2011: Greenhouse Gas Sources and Sinks in Canada for natural gas combustion emission factors and grid electricity emission factors11;
• Environment Canada’s National Pollutant Release Inventory for grid electricity CAC emission factors12.
Emissions Reductions within Sub-Sectors
The Vision Statements for each sub-sector attempt to demonstrate the impact of SDTC funding on emissions reductions. In certain sub-sectors, emissions reductions attributable to natural gas technologies are already occurring. For example, in the power generation sub-sector, the recent switch from coal to natural gas electricity generation has led to (and will lead to further) emissions reductions. However, these emission reductions cannot be attributed to SDTC funding and are therefore considered to be a part of the business as usual case. If SDTC funding resulted in the commercialization of more efficient natural gas generators, then the resulting reduction in natural gas consumption within the power generation sector could be attributed to SDTC funding. It is this type of emissions reductions that the Vision Statement attempts to quantify.
Within each sub-sector, technologies expected to lead to GHG and CAC emissions reductions were identified based on input from key stakeholders. In general, these technologies lead to GHG and CAC reductions in two ways: (1) by reducing the amount of natural gas consumed within a sub-sector through, for example, efficiency improvements; and, (2) by fuel switching to natural gas from a higher emitting fuel, such as gasoline or diesel in the transportation sub-sector.
In cases where a technology leads to reductions in natural gas consumption, the methodology used to calculate GHG and CAC reductions involves estimating a percent reduction in natural gas use attributable to that technology. Data used to calculate this percent include, for example: increase in efficiency over the business as usual technology; percentage of market where the technology is applicable; and, the market adoption rate within a sub-sector by 2030. GHG and CAC reductions are then directly proportional to the percent reduction in natural gas consumption caused by the commercialization of a particular technology.
In cases where a technology leads to fuel switching, the methodology used to calculate GHG and CAC reductions involves estimating the market uptake of the technology, which was based on input from key stakeholders. GHG and CAC reductions attributable to a particular technology are then calculated using GHG and CAC emissions reduction factors for fuel switching, for example from gasoline vehicles to natural gas vehicles.
A more detailed discussion of the technological drivers and assumptions used to calculate GHG and CAC reductions is presented below for each sub-sector.
* The GHGenius default emission factor for natural gas production, processing, and distribution in Canada was used to estimate upstream GHG and CAC emissions. This is based on current recovery from Canadian reservoirs and includes emissions from conventional, shale, and tight gas production.
Copyright © 2014 by SDTC™ Sustainable Development Business Case 19
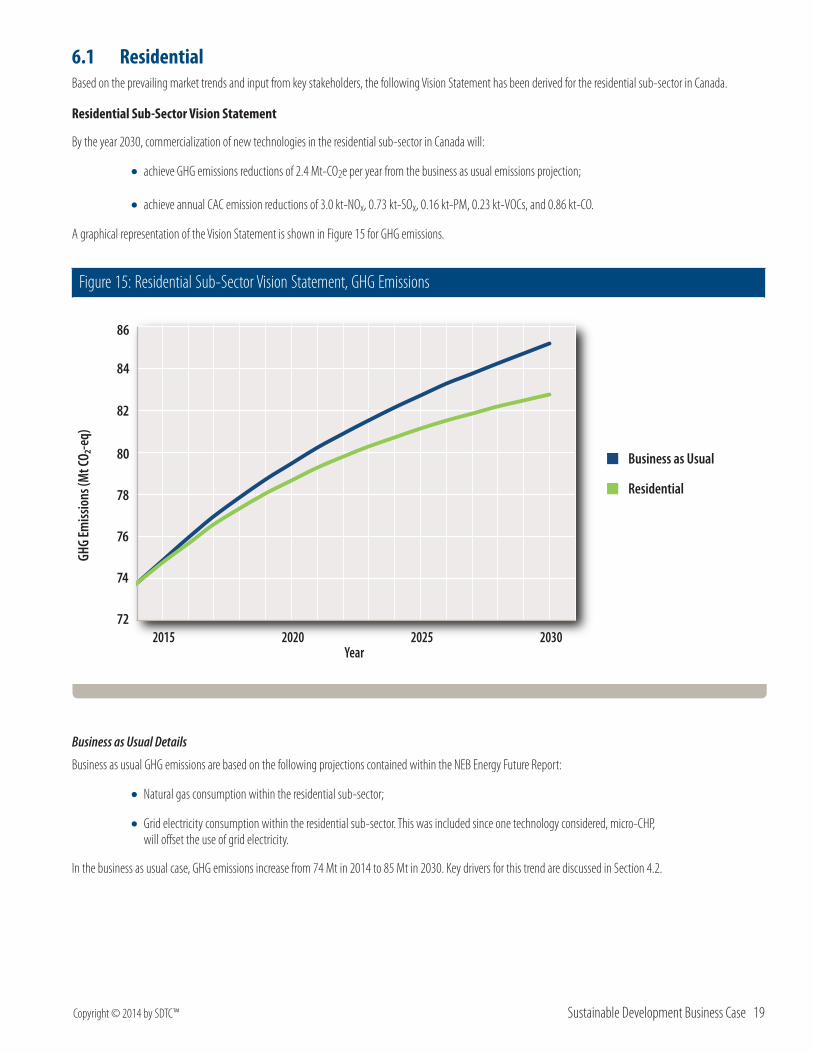
6.1 ResidentialBased on the prevailing market trends and input from key stakeholders, the following Vision Statement has been derived for the residential sub-sector in Canada.
Residential Sub-Sector Vision Statement
By the year 2030, commercialization of new technologies in the residential sub-sector in Canada will:
• achieve GHG emissions reductions of 2.4 Mt-CO2e per year from the business as usual emissions projection;
• achieve annual CAC emission reductions of 3.0 kt-NOx, 0.73 kt-SOx, 0.16 kt-PM, 0.23 kt-VOCs, and 0.86 kt-CO.
A graphical representation of the Vision Statement is shown in Figure 15 for GHG emissions.
Figure 15: Residential Sub-Sector Vision Statement, GHG Emissions
72
74
76
78
80
82
84
86
GHG
Emiss
ions
(Mt C
O₂-e
q)
2015 2020 2025 2030Year
Business as Usual
Residential
Business as Usual Details
Business as usual GHG emissions are based on the following projections contained within the NEB Energy Future Report:
•Natural gas consumption within the residential sub-sector;
•Grid electricity consumption within the residential sub-sector. This was included since one technology considered, micro-CHP, will offset the use of grid electricity.
In the business as usual case, GHG emissions increase from 74 Mt in 2014 to 85 Mt in 2030. Key drivers for this trend are discussed in Section 4.2.
20 Downstream Natural Gas Copyright © 2014 by SDTC™
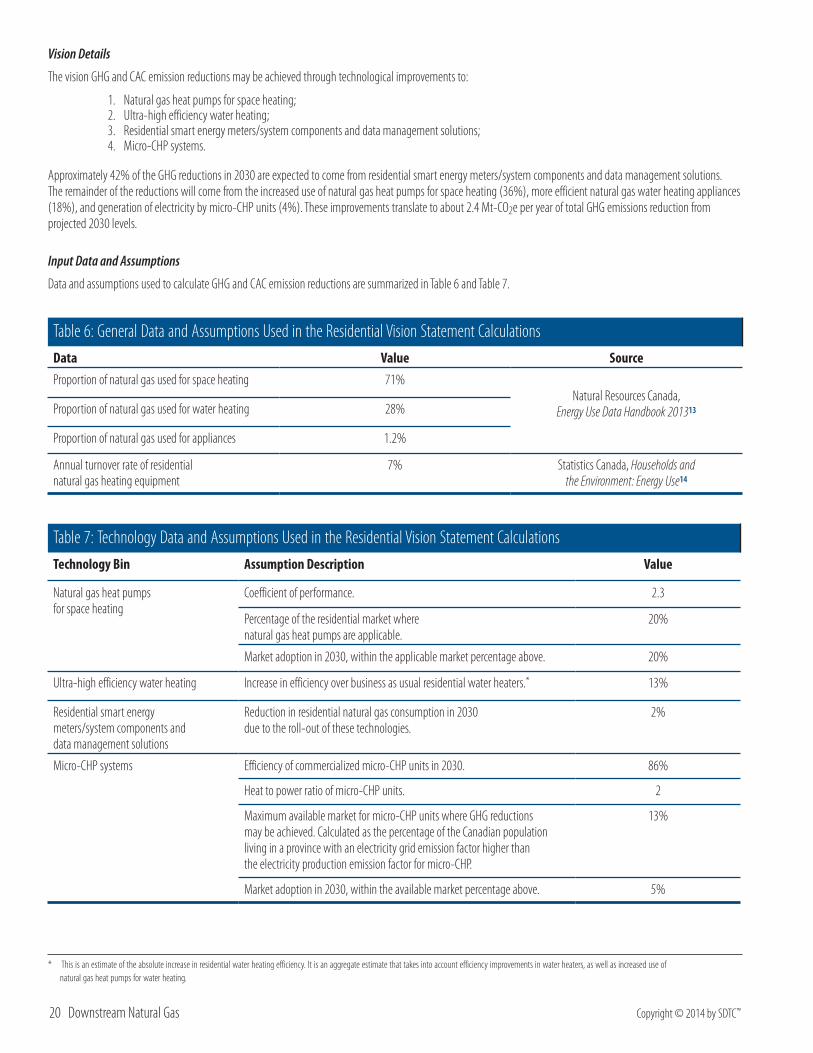
Vision Details
The vision GHG and CAC emission reductions may be achieved through technological improvements to:
1. Natural gas heat pumps for space heating; 2. Ultra-high efficiency water heating; 3. Residential smart energy meters/system components and data management solutions; 4. Micro-CHP systems.
Approximately 42% of the GHG reductions in 2030 are expected to come from residential smart energy meters/system components and data management solutions. The remainder of the reductions will come from the increased use of natural gas heat pumps for space heating (36%), more efficient natural gas water heating appliances (18%), and generation of electricity by micro-CHP units (4%). These improvements translate to about 2.4 Mt-CO2e per year of total GHG emissions reduction from projected 2030 levels.
Input Data and Assumptions
Data and assumptions used to calculate GHG and CAC emission reductions are summarized in Table 6 and Table 7.
Table 6: General Data and Assumptions Used in the Residential Vision Statement CalculationsData Value SourceProportion of natural gas used for space heating 71%
Natural Resources Canada, Energy Use Data Handbook 201313Proportion of natural gas used for water heating 28%
Proportion of natural gas used for appliances 1.2%
Annual turnover rate of residential natural gas heating equipment
7% Statistics Canada, Households and the Environment: Energy Use14
Table 7: Technology Data and Assumptions Used in the Residential Vision Statement CalculationsTechnology Bin Assumption Description Value
Natural gas heat pumps for space heating
Coefficient of performance. 2.3
Percentage of the residential market where natural gas heat pumps are applicable.
20%
Market adoption in 2030, within the applicable market percentage above. 20%
Ultra-high efficiency water heating Increase in efficiency over business as usual residential water heaters.* 13%
Residential smart energy meters/system components and data management solutions
Reduction in residential natural gas consumption in 2030 due to the roll-out of these technologies.
2%
Micro-CHP systems Efficiency of commercialized micro-CHP units in 2030. 86%
Heat to power ratio of micro-CHP units. 2
Maximum available market for micro-CHP units where GHG reductions may be achieved. Calculated as the percentage of the Canadian population living in a province with an electricity grid emission factor higher than the electricity production emission factor for micro-CHP.
13%
Market adoption in 2030, within the available market percentage above. 5%
* This is an estimate of the absolute increase in residential water heating efficiency. It is an aggregate estimate that takes into account efficiency improvements in water heaters, as well as increased use of natural gas heat pumps for water heating.
Copyright © 2014 by SDTC™ Sustainable Development Business Case 21
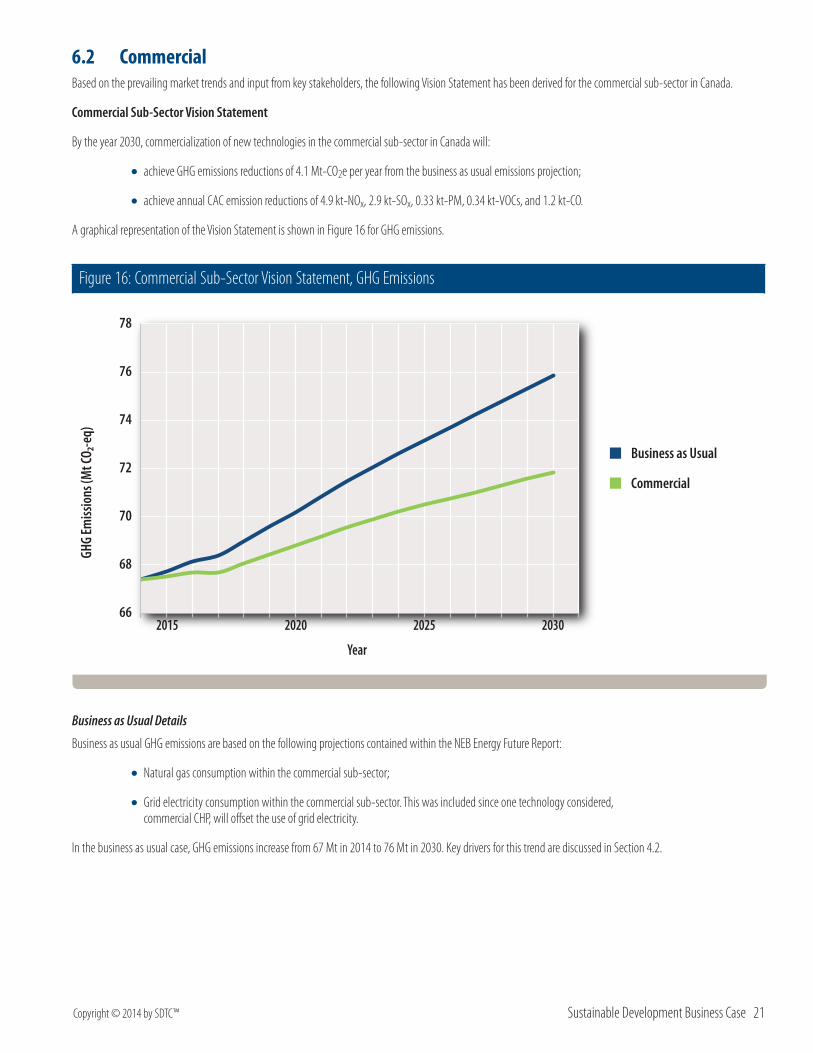
6.2 CommercialBased on the prevailing market trends and input from key stakeholders, the following Vision Statement has been derived for the commercial sub-sector in Canada.
Commercial Sub-Sector Vision Statement
By the year 2030, commercialization of new technologies in the commercial sub-sector in Canada will:
• achieve GHG emissions reductions of 4.1 Mt-CO2e per year from the business as usual emissions projection;
• achieve annual CAC emission reductions of 4.9 kt-NOx, 2.9 kt-SOx, 0.33 kt-PM, 0.34 kt-VOCs, and 1.2 kt-CO.
A graphical representation of the Vision Statement is shown in Figure 16 for GHG emissions.
Figure 16: Commercial Sub-Sector Vision Statement, GHG Emissions
66
68
70
72
74
76
78
2015 2020 2025 2030
GHG
Emiss
ions
(Mt C
O₂-e
q)
Year
Business as Usual
Commercial
Business as Usual Details
Business as usual GHG emissions are based on the following projections contained within the NEB Energy Future Report:
•Natural gas consumption within the commercial sub-sector;
•Grid electricity consumption within the commercial sub-sector. This was included since one technology considered, commercial CHP, will offset the use of grid electricity.
In the business as usual case, GHG emissions increase from 67 Mt in 2014 to 76 Mt in 2030. Key drivers for this trend are discussed in Section 4.2.
22 Downstream Natural Gas Copyright © 2014 by SDTC™
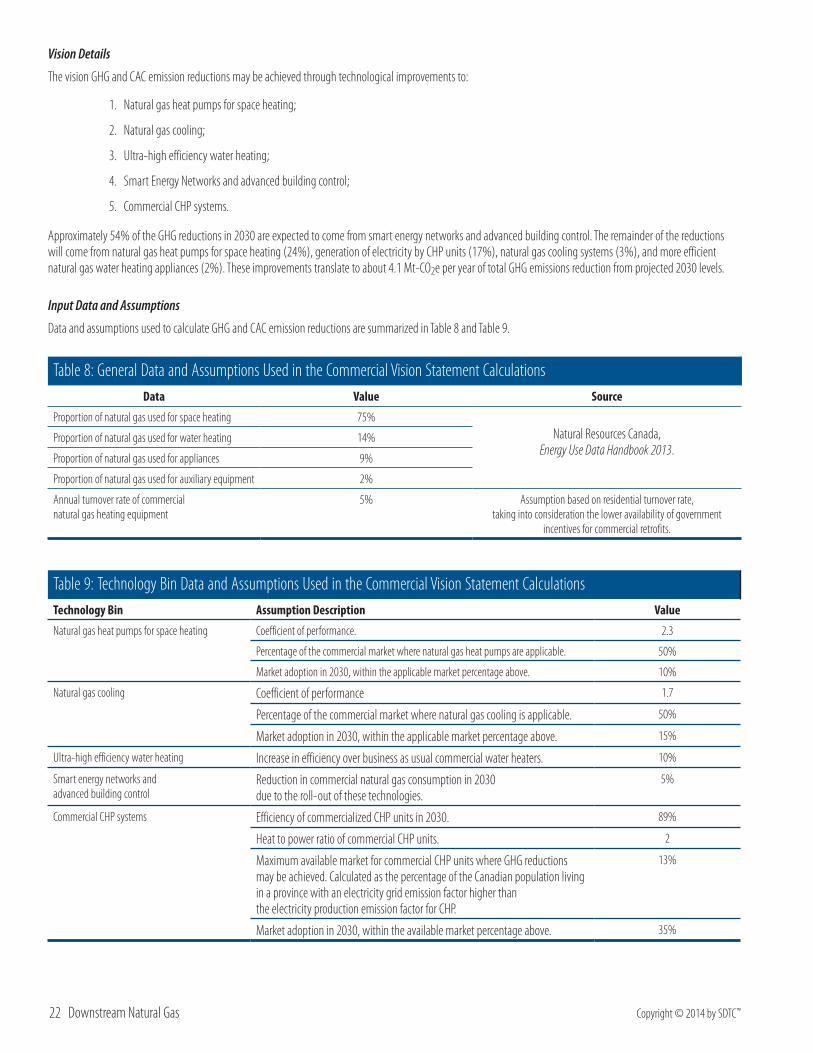
Vision Details
The vision GHG and CAC emission reductions may be achieved through technological improvements to:
1. Natural gas heat pumps for space heating;
2. Natural gas cooling;
3. Ultra-high efficiency water heating;
4. Smart Energy Networks and advanced building control;
5. Commercial CHP systems.
Approximately 54% of the GHG reductions in 2030 are expected to come from smart energy networks and advanced building control. The remainder of the reductions will come from natural gas heat pumps for space heating (24%), generation of electricity by CHP units (17%), natural gas cooling systems (3%), and more efficient natural gas water heating appliances (2%). These improvements translate to about 4.1 Mt-CO2e per year of total GHG emissions reduction from projected 2030 levels.
Input Data and Assumptions
Data and assumptions used to calculate GHG and CAC emission reductions are summarized in Table 8 and Table 9.
Table 8: General Data and Assumptions Used in the Commercial Vision Statement CalculationsData Value Source
Proportion of natural gas used for space heating 75% Natural Resources Canada,
Energy Use Data Handbook 2013.Proportion of natural gas used for water heating 14%
Proportion of natural gas used for appliances 9%
Proportion of natural gas used for auxiliary equipment 2%
Annual turnover rate of commercial natural gas heating equipment
5% Assumption based on residential turnover rate, taking into consideration the lower availability of government
incentives for commercial retrofits.
Table 9: Technology Bin Data and Assumptions Used in the Commercial Vision Statement CalculationsTechnology Bin Assumption Description Value
Natural gas heat pumps for space heating Coefficient of performance. 2.3
Percentage of the commercial market where natural gas heat pumps are applicable. 50%
Market adoption in 2030, within the applicable market percentage above. 10%
Natural gas cooling Coefficient of performance 1.7
Percentage of the commercial market where natural gas cooling is applicable. 50%
Market adoption in 2030, within the applicable market percentage above. 15%
Ultra-high efficiency water heating Increase in efficiency over business as usual commercial water heaters. 10%
Smart energy networks and advanced building control
Reduction in commercial natural gas consumption in 2030 due to the roll-out of these technologies.
5%
Commercial CHP systems Efficiency of commercialized CHP units in 2030. 89%
Heat to power ratio of commercial CHP units. 2
Maximum available market for commercial CHP units where GHG reductions may be achieved. Calculated as the percentage of the Canadian population living in a province with an electricity grid emission factor higher than the electricity production emission factor for CHP.
13%
Market adoption in 2030, within the available market percentage above. 35%
Copyright © 2014 by SDTC™ Sustainable Development Business Case 23
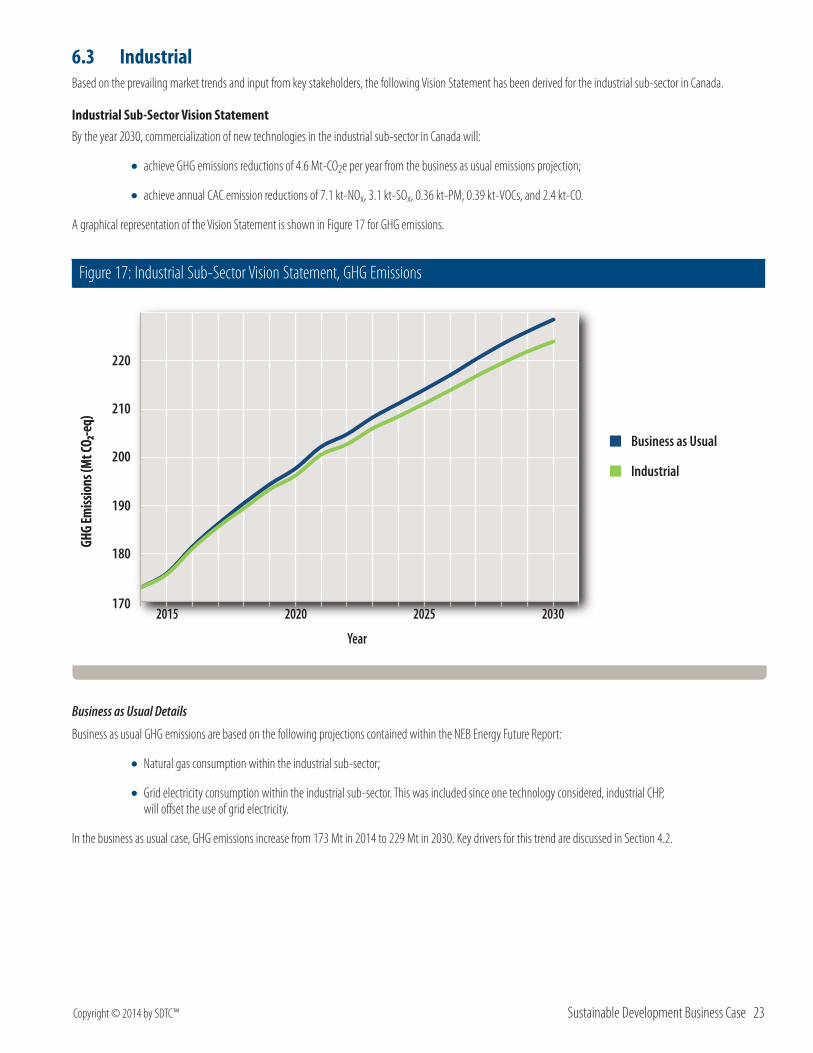
6.3 IndustrialBased on the prevailing market trends and input from key stakeholders, the following Vision Statement has been derived for the industrial sub-sector in Canada.
Industrial Sub-Sector Vision StatementBy the year 2030, commercialization of new technologies in the industrial sub-sector in Canada will:
• achieve GHG emissions reductions of 4.6 Mt-CO2e per year from the business as usual emissions projection;
• achieve annual CAC emission reductions of 7.1 kt-NOx, 3.1 kt-SOx, 0.36 kt-PM, 0.39 kt-VOCs, and 2.4 kt-CO.
A graphical representation of the Vision Statement is shown in Figure 17 for GHG emissions.
Figure 17: Industrial Sub-Sector Vision Statement, GHG Emissions
2015 2020 2025 2030
GHG
Emiss
ions
(Mt C
O₂-e
q)
Year
170
180
190
200
210
220
GHG
Emiss
ions
(Mt C
O₂-e
q)
Business as Usual
Industrial
Business as Usual Details
Business as usual GHG emissions are based on the following projections contained within the NEB Energy Future Report:
•Natural gas consumption within the industrial sub-sector;
•Grid electricity consumption within the industrial sub-sector. This was included since one technology considered, industrial CHP, will offset the use of grid electricity.
In the business as usual case, GHG emissions increase from 173 Mt in 2014 to 229 Mt in 2030. Key drivers for this trend are discussed in Section 4.2.
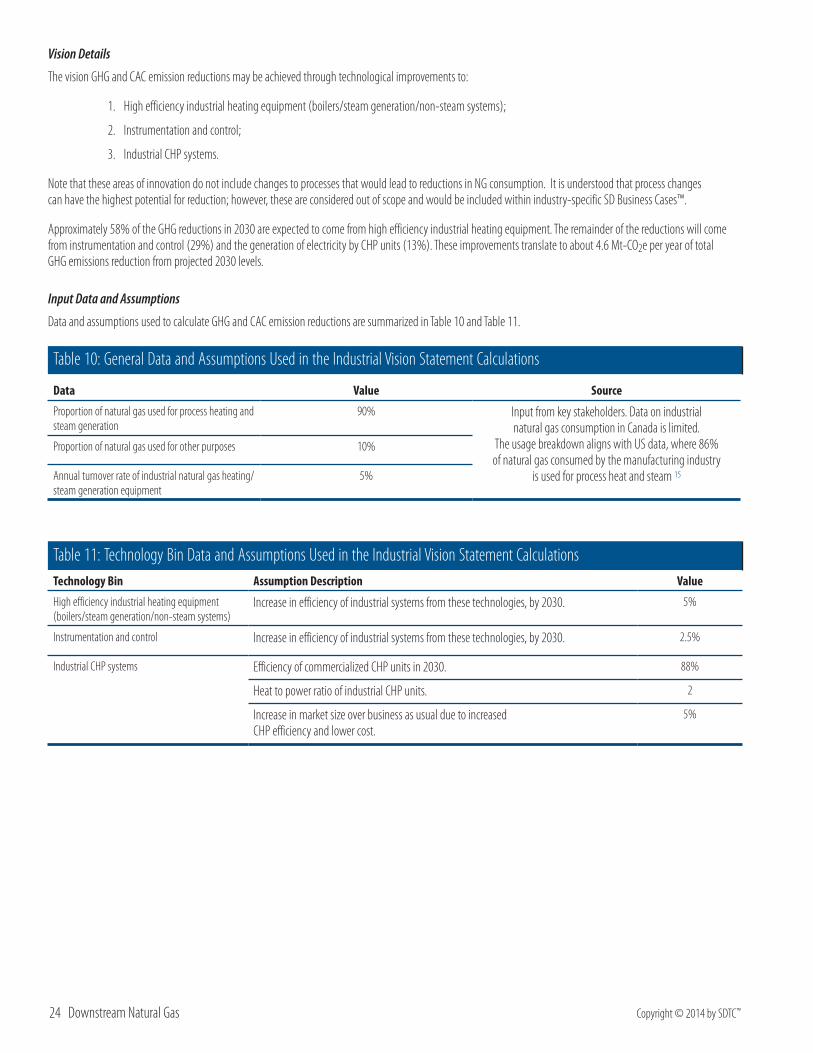
24 Downstream Natural Gas Copyright © 2014 by SDTC™
Vision Details
The vision GHG and CAC emission reductions may be achieved through technological improvements to:
1. High efficiency industrial heating equipment (boilers/steam generation/non-steam systems);
2. Instrumentation and control;
3. Industrial CHP systems.
Note that these areas of innovation do not include changes to processes that would lead to reductions in NG consumption. It is understood that process changes can have the highest potential for reduction; however, these are considered out of scope and would be included within industry-specific SD Business Cases™.
Approximately 58% of the GHG reductions in 2030 are expected to come from high efficiency industrial heating equipment. The remainder of the reductions will come from instrumentation and control (29%) and the generation of electricity by CHP units (13%). These improvements translate to about 4.6 Mt-CO2e per year of total GHG emissions reduction from projected 2030 levels.
Input Data and Assumptions
Data and assumptions used to calculate GHG and CAC emission reductions are summarized in Table 10 and Table 11.
Table 10: General Data and Assumptions Used in the Industrial Vision Statement Calculations
Data Value Source
Proportion of natural gas used for process heating and steam generation
90% Input from key stakeholders. Data on industrial natural gas consumption in Canada is limited.
The usage breakdown aligns with US data, where 86% of natural gas consumed by the manufacturing industry
is used for process heat and steam 15
Proportion of natural gas used for other purposes 10%
Annual turnover rate of industrial natural gas heating/steam generation equipment
5%
Table 11: Technology Bin Data and Assumptions Used in the Industrial Vision Statement CalculationsTechnology Bin Assumption Description Value
High efficiency industrial heating equipment (boilers/steam generation/non-steam systems)
Increase in efficiency of industrial systems from these technologies, by 2030. 5%
Instrumentation and control Increase in efficiency of industrial systems from these technologies, by 2030. 2.5%
Industrial CHP systems Efficiency of commercialized CHP units in 2030. 88%
Heat to power ratio of industrial CHP units. 2
Increase in market size over business as usual due to increased CHP efficiency and lower cost.
5%
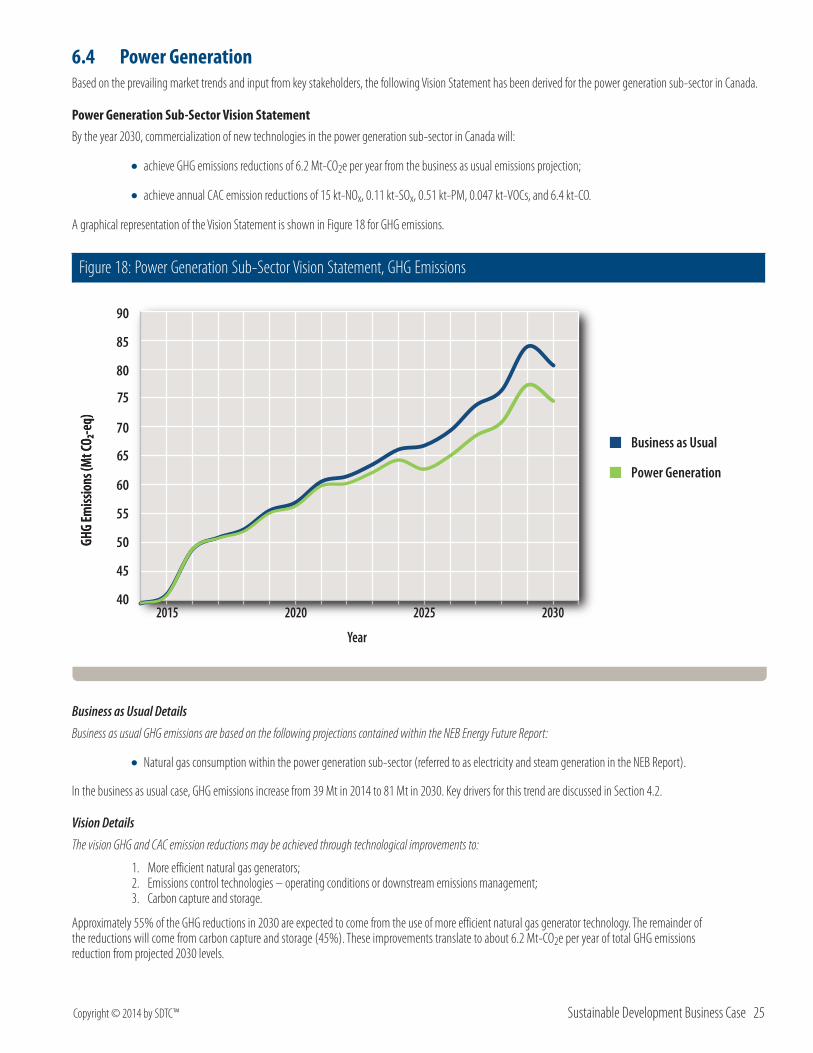
Copyright © 2014 by SDTC™ Sustainable Development Business Case 25
6.4 Power GenerationBased on the prevailing market trends and input from key stakeholders, the following Vision Statement has been derived for the power generation sub-sector in Canada.
Power Generation Sub-Sector Vision StatementBy the year 2030, commercialization of new technologies in the power generation sub-sector in Canada will:
• achieve GHG emissions reductions of 6.2 Mt-CO2e per year from the business as usual emissions projection;
• achieve annual CAC emission reductions of 15 kt-NOx, 0.11 kt-SOx, 0.51 kt-PM, 0.047 kt-VOCs, and 6.4 kt-CO.
A graphical representation of the Vision Statement is shown in Figure 18 for GHG emissions.
Figure 18: Power Generation Sub-Sector Vision Statement, GHG Emissions
2015 2020 2025 2030
GHG
Emiss
ions
(Mt C
O₂-e
q)
Year
65
75
GHG
Emiss
ions
(Mt C
O₂-e
q)
Business as Usual
Power Generation
45
40
50
55
60
70
80
85
90
Business as Usual Details
Business as usual GHG emissions are based on the following projections contained within the NEB Energy Future Report:
•Natural gas consumption within the power generation sub-sector (referred to as electricity and steam generation in the NEB Report).
In the business as usual case, GHG emissions increase from 39 Mt in 2014 to 81 Mt in 2030. Key drivers for this trend are discussed in Section 4.2.
Vision Details
The vision GHG and CAC emission reductions may be achieved through technological improvements to:
1. More efficient natural gas generators; 2. Emissions control technologies – operating conditions or downstream emissions management; 3. Carbon capture and storage.
Approximately 55% of the GHG reductions in 2030 are expected to come from the use of more efficient natural gas generator technology. The remainder of the reductions will come from carbon capture and storage (45%). These improvements translate to about 6.2 Mt-CO2e per year of total GHG emissions reduction from projected 2030 levels.
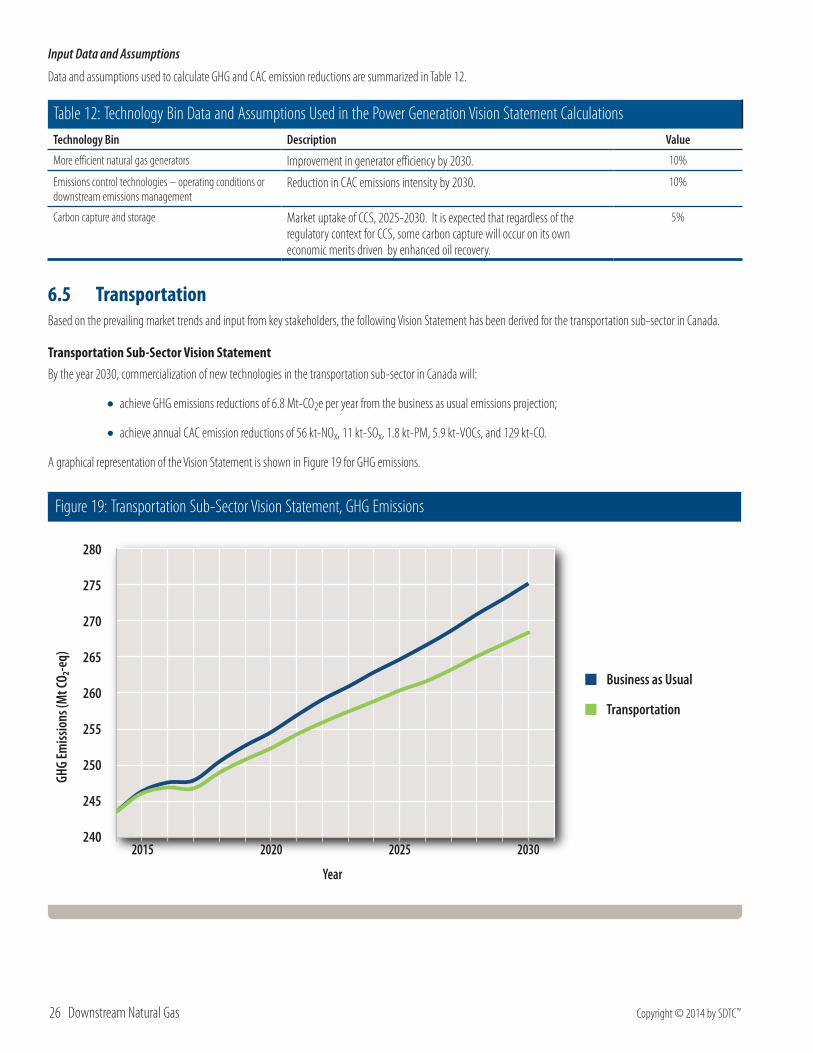
26 Downstream Natural Gas Copyright © 2014 by SDTC™
Input Data and Assumptions
Data and assumptions used to calculate GHG and CAC emission reductions are summarized in Table 12.
Table 12: Technology Bin Data and Assumptions Used in the Power Generation Vision Statement CalculationsTechnology Bin Description Value
More efficient natural gas generators Improvement in generator efficiency by 2030. 10%
Emissions control technologies – operating conditions or downstream emissions management
Reduction in CAC emissions intensity by 2030. 10%
Carbon capture and storage Market uptake of CCS, 2025-2030. It is expected that regardless of the regulatory context for CCS, some carbon capture will occur on its own economic merits driven by enhanced oil recovery.
5%
6.5 TransportationBased on the prevailing market trends and input from key stakeholders, the following Vision Statement has been derived for the transportation sub-sector in Canada.
Transportation Sub-Sector Vision StatementBy the year 2030, commercialization of new technologies in the transportation sub-sector in Canada will:
• achieve GHG emissions reductions of 6.8 Mt-CO2e per year from the business as usual emissions projection;
• achieve annual CAC emission reductions of 56 kt-NOx, 11 kt-SOx, 1.8 kt-PM, 5.9 kt-VOCs, and 129 kt-CO.
A graphical representation of the Vision Statement is shown in Figure 19 for GHG emissions.
Figure 19: Transportation Sub-Sector Vision Statement, GHG Emissions
2015 2020 2025 2030
GHG
Emiss
ions
(Mt C
O₂-e
q)
Year
240
245
250
255
260
265
270
275
280
Business as Usual
Transportation
Copyright © 2014 by SDTC™ Sustainable Development Business Case 27
Business as Usual Details
Business as usual GHG emissions are based on the following projections contained within the NEB Energy Future Report:
• Total fuel and electricity consumption within the transportation sub-sector;
•Breakdown of fuel consumption by vehicle/transport mode type.
In the business as usual case, GHG emissions increase from 245 Mt in 2014 to 275 Mt in 2030. Key drivers for this trend are discussed in Section 4.2.
Vision Details
GHG and CAC reductions are achieved in this sub-sector primarily through the market adoption of natural gas vehicles. Market adoption rates by transport mode used in the vision calculations are shown below in Table 13.
Table 13: Market Adoption Assumptions Used in Transportation Vision CalculationsTransportation Sub-Sector Market Adoption by 2030
Rail 40%
Marine 40%
Off-Road 10%
On-Road Light Duty Vehicles (LDVs) 5%
On-Road Heavy Duty Vehicles (HDVs)* Light (LHDV) Medium (MHDV) Heavy (HHDV)
10% 10% 25%
GHG emissions reductions were calculated based on the above market adoption rates and emissions reductions percentages arising from fuel switching to natural gas within each transport mode, which are shown below in Table 14.
Table 14: GHG Reductions Associated with Fuel Switching in Transportation Sub-SectorsTransportation Sub-Sector GHG Emissions Reductions 16
Rail 19%
Marine 14%
Off-Road Vehicles 21%
On-Road Light Duty Vehicles (LDVs) 16%
On-Road Heavy Duty Vehicles (HDVs) Light (LHDV) Medium (MHDV) Heavy (HHDV)
21% 21% 21%
Approximately 76% of the GHG reductions in 2030 are expected to come from on-road heavy duty vehicles. The remainder of the reductions will come from on-road light duty vehicles (10%), rail (9%), marine (5%), and off-road vehicles (1%). These improvements translate to about 6.8 Mt-CO2e per year of total GHG emissions reduction from projected 2030 levels.
* Refer to the Glossary for more information on vehicle classes included in each sub-category of Heavy Duty Vehicles.
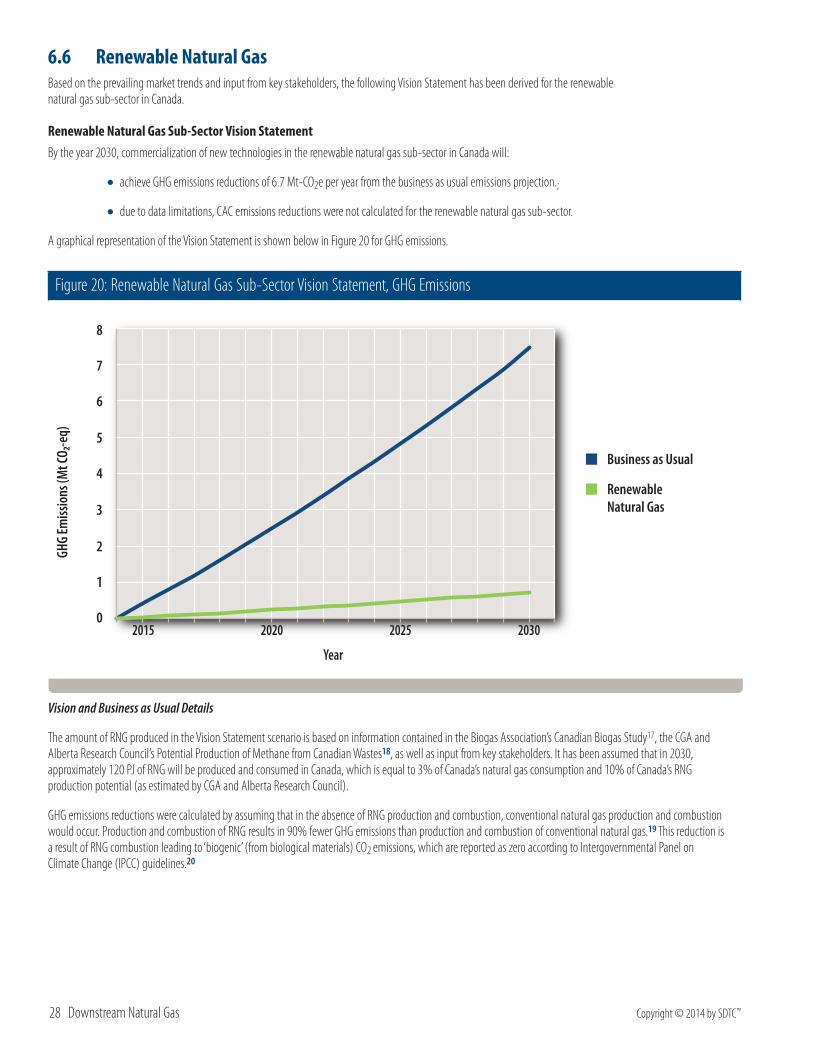
28 Downstream Natural Gas Copyright © 2014 by SDTC™
6.6 Renewable Natural GasBased on the prevailing market trends and input from key stakeholders, the following Vision Statement has been derived for the renewable natural gas sub-sector in Canada.
Renewable Natural Gas Sub-Sector Vision StatementBy the year 2030, commercialization of new technologies in the renewable natural gas sub-sector in Canada will:
• achieve GHG emissions reductions of 6.7 Mt-CO2e per year from the business as usual emissions projection.;
•due to data limitations, CAC emissions reductions were not calculated for the renewable natural gas sub-sector.
A graphical representation of the Vision Statement is shown below in Figure 20 for GHG emissions.
Figure 20: Renewable Natural Gas Sub-Sector Vision Statement, GHG Emissions
2015 2020 2025 2030
GHG
Emiss
ions
(Mt C
O₂-e
q)
Year
0
1
2
3
4
5
6
7
8
Business as Usual
RenewableNatural Gas
Vision and Business as Usual Details
The amount of RNG produced in the Vision Statement scenario is based on information contained in the Biogas Association’s Canadian Biogas Study17, the CGA and Alberta Research Council’s Potential Production of Methane from Canadian Wastes18, as well as input from key stakeholders. It has been assumed that in 2030, approximately 120 PJ of RNG will be produced and consumed in Canada, which is equal to 3% of Canada’s natural gas consumption and 10% of Canada’s RNG production potential (as estimated by CGA and Alberta Research Council).
GHG emissions reductions were calculated by assuming that in the absence of RNG production and combustion, conventional natural gas production and combustion would occur. Production and combustion of RNG results in 90% fewer GHG emissions than production and combustion of conventional natural gas.19 This reduction is a result of RNG combustion leading to ‘biogenic’ (from biological materials) CO2 emissions, which are reported as zero according to Intergovernmental Panel on Climate Change (IPCC) guidelines.20
Copyright © 2014 by SDTC™ Sustainable Development Business Case 29
7 Needs AssessmentThere are a number of barriers impeding rapid and sustained improvement in the efficient downstream use of natural gas. In order to achieve the industry vision, these barriers must be identified and overcome. The STAR™ process categorizes the barriers into technical and non-technical needs. They are interdependent and both need to be satisfied in order to achieve the industry vision.
7.1 Technical Needs
7.1.1 ResidentialAs discussed in the industry vision, space and water heating represent 99% of natural gas consumption in the residential sub-sector. Identified needs within the sub-sector mainly focused on technologies that reduce natural gas consumed for space and water heating, the exception being CHP which reduces upstream electricity generation.
• Small-scale (single family home) CHP units with reduced capital cost in order to encourage uptake in the residential market;
• Lower capital cost ultra-high efficiency water heaters that improve user experience, integrate with low-flow appliances and meet footprint requirements;
• Technologies that improve the efficiency of residential heating and/or cooling for apartment buildings;
• Smart energy measurement and data management to better control natural gas consumption in residential buildings;
• Integrated systems that combine a renewable energy source with natural gas to meet either heating or cooling demands.
7.1.2 CommercialSimilarly to residential, technologies are mainly focused on reducing natural gas use for space conditioning and water heating with the addition of CHP to reduce grid electricity generation. The main opportunity in space conditioning remains heating, but there is also a modest need for NG space cooling technologies:
• CHP systems with lower capital cost in order to increase technology penetration in the commercial sector;
• Technologies that improve the efficiency of heating commercial buildings;
• Smart energy measurement and data management to better control natural gas consumption in commercial buildings;
•Natural gas cooling systems;
• Integrated systems that combine a renewable energy source with natural gas to meet either heating or cooling demands.
7.1.3 IndustrialThe scope of considered needs for the industrial sector was limited to technologies that consume natural gas and not to technologies that change industrial processes that result in decreased NG demand. It is understood that changes to processes can have the greatest potential for environmental benefit; however, these would be considered within SD Business Cases™ targeted at individual industries.
Technology needs identified include:
•Higher-efficiency industrial heating equipment (process and/or building) with reduced capital cost;
• Smart energy measurement and data management for advanced heating process control;
• CHP units for applications that require less heat, or less continuous heat (e.g. increased electricity generation without sacrificing overall efficiency);
• CO2 capture systems from industrial natural gas combustion;
• Less energy-intensive hydrogen production from natural gas / renewable natural gas;
•NG storage solutions for remote locations;
• Smaller-scale economic LNG production to serve remote locations.
30 Downstream Natural Gas Copyright © 2014 by SDTC™
7.1.4 Power GenerationTechnology needs for power generation include:
•Higher-efficiency and quicker transient-responding natural gas power generation*;
• Emissions control technologies for CACs, either operating conditions or downstream emissions management;
• Technologies that use electricity to generate hydrogen or methane as a means of power storage;
•NG storage solutions for remote locations;
• Smaller-scale economic LNG production to serve remote locations;
• Technologies that focus on the capture of CO2 from natural gas power generation;
7.1.5 TransportationThe first generation of NG engines is deemed to be a commercialized technology for many engine sizes and modes of transportation. Technology needs focus on the next generation of NG engines, fuel storage and fuelling infrastructure.
•More efficient and lower emission natural gas turbine engines;
•More efficient and lower emission natural gas piston engines across a range of engine sizes;
•Alternative natural gas engine types (e.g. NG fuel cells);
• Lower-cost and safe fuel dispensing;
•Next generation on-board fuel storage with lower cost;
•NG storage solutions for fuelling infrastructure;
• Smaller-scale economic LNG production to serve distributed fueling infrastructure;
• Systems for LDV fuelling at home;
• Improved efficiency of NG fuel use in bi-fuel engines.
7.1.6 Renewable Natural Gas (RNG)Technical needs for RNG focus on gas production and cleanup. Large-scale anaerobic digestion is considered to be a commercialized technology, but there is a need for both economic efficiency at smaller scales, and for gasification technology which will open access to a broader range of RNG feedstock.
•RNG cleanup technologies that improve cleanup economics;
• Cost-effective small-scale anaerobic digesters;
• Cost-effective gasification technology where the syngas produced is converted to RNG.
* Note that this includes both utility scale and smaller scale natural gas generators.
Copyright © 2014 by SDTC™ Sustainable Development Business Case 31
7.2 Non-technical NeedsThe STAR™ process collected a range of non-technical needs for each of the sub-sectors. These needs were then prioritized according to stage of development and their importance in ensuring that technology solutions can reach the market. The stage of development refers to the likelihood of the need being met within the short (higher priority), medium or long term (lower priority).
Cross-cutting needs, along with those for each of the sub-sectors, addressing a variety of issues are listed below.
7.2.1 Cross-Cutting
• Federal and provincial environmental regulations should be developed with both CAC and GHG emissions reductions in mind, since these are related and could involve trade-offs. This will help avoid inconsistent policy decisions.
• The development of improved business cases, or value propositions, for downstream natural gas technologies that recognize and balance multiple environmental and reliability benefits and trade-offs. Many available technologies need a more robust business case, along with the acceptance of longer payback thresholds of 5-10 years.
7.2.2 Residential
•Policy/regulatory changes to allow integrated provision of household energy and/or collaboration between gas and electric utilities:
- Both electricity and natural gas are used within many Canadian homes, and minimizing environmental impact may require collaborative instead of competitive service provision.
•Policy/regulatory changes to allow individual unit thermal metering in multi-unit residential buildings:
- Allocation of thermal energy costs to users within a multi-unit building is seen as a tool to promote energy efficiency via increased adoption of high-efficiency centralized CHP, heating/cooling equipment, and district energy.
•Policy/regulatory changes to allow use of side wall venting:
- Current regulations create barriers to the installation of high-efficiency furnaces in some applications.
7.2.3 Commercial
•Better integration between NG and electricity providers:
- As per the residential sector.
• Funding for R&D of NG equipment/technologies relevant to the commercial sector:
- The commercial sector is seen as a market that often leads the acceptance and integration of new technologies with an ability to capitalize on R&D funding.
•Advocacy/policy changes that encourage development of district energy systems:
- District energy represents a significant opportunity for energy savings in both the residential and commercial sectors, but faces multiple challenges. Key challenges include lack of knowledge and awareness, absence of project champions, difficulty in developing a viable business case (high capital cost of piping) and lack of technical awareness21 as well as lack of Canadian regulations for thermal/hot water metering for residential multi-unit buildings.
7.2.4 IndustrialThe industrial sub-sector can be risk-averse and is considered to be a difficult market for new technology, requiring significant evidence of demonstration. The two needs below would explore options to provide easier access to market.
• Early demonstration for new technologies to establish performance under a range of operating conditions.
•Policy or financial mechanisms to encourage adoption of new technologies.
32 Downstream Natural Gas Copyright © 2014 by SDTC™
7.2.5 Power Generation
•A full quantification of life-cycle costs for various power generation options and education of regulators and politicians:
- This need is for a better understanding of how the environmental impacts of various power generation options compare to each other. Much of this information exists and there is also an education component of this need to ensure that stakeholders and decision makers understand the analysis results.
•Marketplace education around Canada’s production potential and it’s likely effects on the market:
- Lack of education is seen as a key barrier to greater use of NG. This need is linked to the need above.
•Public energy literacy:
- Education incorporating upstream and downstream considerations is expected to help the social license to use natural gas.
•Regulations for LNG transportation need to allow movement of LNG from liquefaction site to the communities:
- There are currently gaps in existing regulation.
•Government subsidies for diesel in remote communities will need to include natural gas:
- Existing subsidies can give diesel a market advantage, discouraging the adoption of natural gas.
•Regulatory framework for CCS:
- There are significant regulatory requirements for the implementation of broader scale CCS.
7.2.6 Transportation
•Clear policy on the taxation of NG as vehicle fuel and timelines for policy changes:
- Fuel taxation has the potential to be a very significant barrier to NG vehicle adoption, since these vehicles and related technologies are in the very early stages of market adoption. Excise taxes would negatively affect the expected rate of return for vehicle purchasers/operators. Clarity is required on when and if a taxation regime is expected to be introduced.
•Regulations / certifications for existing stock conversion:
- The long process for approving conversion technologies is expected to result in few being available on the market and conversion playing only a small part in the adoption of NG as a transportation fuel.
•Harmonization of CNG operating pressures:
- Lack of harmonization will impact standardization across fleets and fuelling infrastructure.
7.2.7 Renewable Natural Gas (RNG)The two non-technical needs identified in this sub-sector are linked. It is not expected that RNG will be cost-competitive with NG in the short to medium term, so in order to incentivise the use of RNG, there will need to be regulations, incentives, or some other way of paying the ‘cost premium’.
•Regulations or incentives to promote adoption and investment in RNG.
•Mechanism for payment of ‘cost premium’ associated with generating RNG.
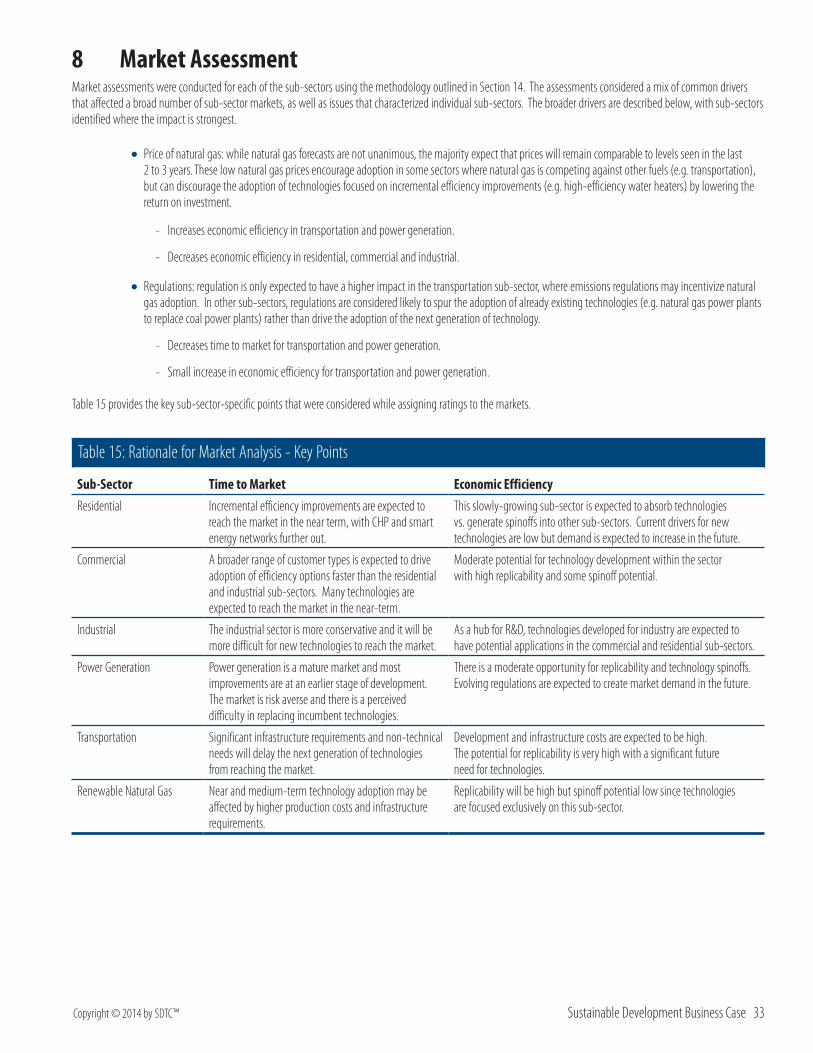
Copyright © 2014 by SDTC™ Sustainable Development Business Case 33
8 Market AssessmentMarket assessments were conducted for each of the sub-sectors using the methodology outlined in Section 14. The assessments considered a mix of common drivers that affected a broad number of sub-sector markets, as well as issues that characterized individual sub-sectors. The broader drivers are described below, with sub-sectors identified where the impact is strongest.
•Price of natural gas: while natural gas forecasts are not unanimous, the majority expect that prices will remain comparable to levels seen in the last 2 to 3 years. These low natural gas prices encourage adoption in some sectors where natural gas is competing against other fuels (e.g. transportation), but can discourage the adoption of technologies focused on incremental efficiency improvements (e.g. high-efficiency water heaters) by lowering the return on investment.
- Increases economic efficiency in transportation and power generation.
- Decreases economic efficiency in residential, commercial and industrial.
•Regulations: regulation is only expected to have a higher impact in the transportation sub-sector, where emissions regulations may incentivize natural gas adoption. In other sub-sectors, regulations are considered likely to spur the adoption of already existing technologies (e.g. natural gas power plants to replace coal power plants) rather than drive the adoption of the next generation of technology.
- Decreases time to market for transportation and power generation.
- Small increase in economic efficiency for transportation and power generation.
Table 15 provides the key sub-sector-specific points that were considered while assigning ratings to the markets.
Table 15: Rationale for Market Analysis - Key Points
Sub-Sector Time to Market Economic EfficiencyResidential Incremental efficiency improvements are expected to
reach the market in the near term, with CHP and smart energy networks further out.
This slowly-growing sub-sector is expected to absorb technologies vs. generate spinoffs into other sub-sectors. Current drivers for new technologies are low but demand is expected to increase in the future.
Commercial A broader range of customer types is expected to drive adoption of efficiency options faster than the residential and industrial sub-sectors. Many technologies are expected to reach the market in the near-term.
Moderate potential for technology development within the sector with high replicability and some spinoff potential.
Industrial The industrial sector is more conservative and it will be more difficult for new technologies to reach the market.
As a hub for R&D, technologies developed for industry are expected to have potential applications in the commercial and residential sub-sectors.
Power Generation Power generation is a mature market and most improvements are at an earlier stage of development. The market is risk averse and there is a perceived difficulty in replacing incumbent technologies.
There is a moderate opportunity for replicability and technology spinoffs. Evolving regulations are expected to create market demand in the future.
Transportation Significant infrastructure requirements and non-technical needs will delay the next generation of technologies from reaching the market.
Development and infrastructure costs are expected to be high. The potential for replicability is very high with a significant future need for technologies.
Renewable Natural Gas Near and medium-term technology adoption may be affected by higher production costs and infrastructure requirements.
Replicability will be high but spinoff potential low since technologies are focused exclusively on this sub-sector.
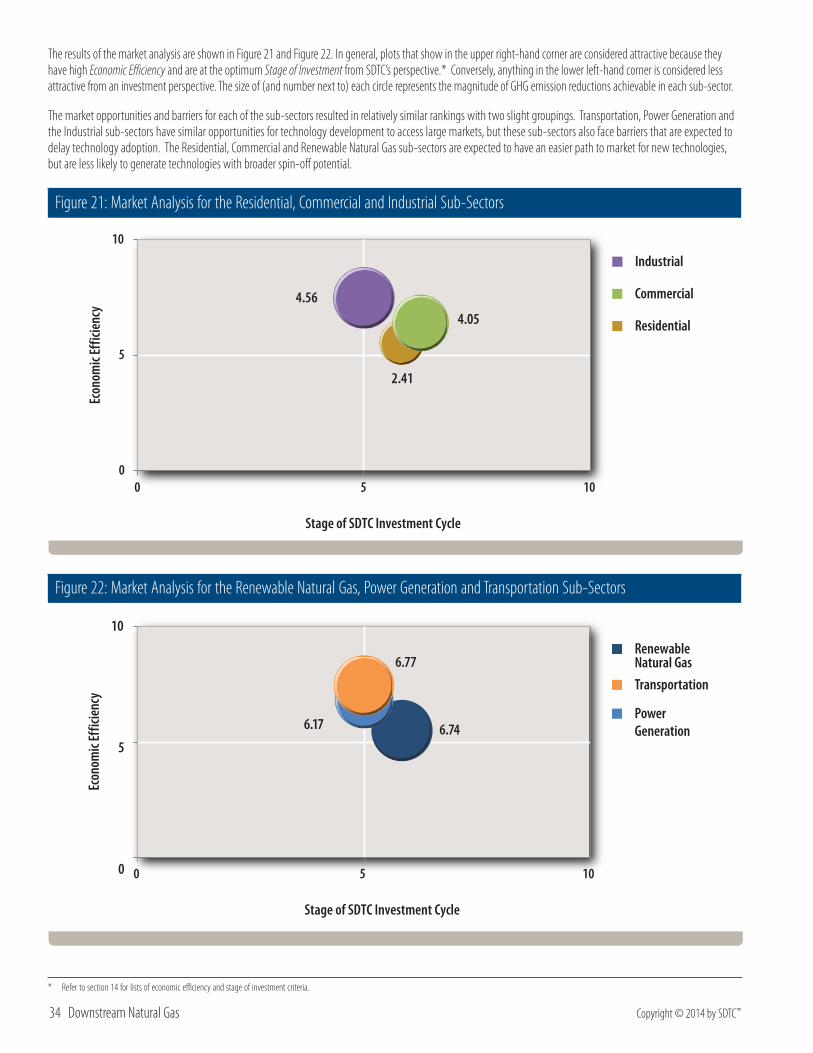
34 Downstream Natural Gas Copyright © 2014 by SDTC™
The results of the market analysis are shown in Figure 21 and Figure 22. In general, plots that show in the upper right-hand corner are considered attractive because they have high Economic Efficiency and are at the optimum Stage of Investment from SDTC’s perspective.* Conversely, anything in the lower left-hand corner is considered less attractive from an investment perspective. The size of (and number next to) each circle represents the magnitude of GHG emission reductions achievable in each sub-sector.
The market opportunities and barriers for each of the sub-sectors resulted in relatively similar rankings with two slight groupings. Transportation, Power Generation and the Industrial sub-sectors have similar opportunities for technology development to access large markets, but these sub-sectors also face barriers that are expected to delay technology adoption. The Residential, Commercial and Renewable Natural Gas sub-sectors are expected to have an easier path to market for new technologies, but are less likely to generate technologies with broader spin-off potential.
Figure 21: Market Analysis for the Residential, Commercial and Industrial Sub-Sectors
2.41
4.05
4.56
0
5
10
0 5 10
Econ
omic
Effic
ienc
y
Stage of SDTC Investment Cycle
Residential
Commercial
Industrial
Figure 22: Market Analysis for the Renewable Natural Gas, Power Generation and Transportation Sub-Sectors
0
5
10
Econ
omic
Effic
ienc
y
Stage of SDTC Investment Cycle
6.746.17
6.77
Power Generation
Transportation
Renewable Natural Gas
0 5 10
* Refer to section 14 for lists of economic efficiency and stage of investment criteria.
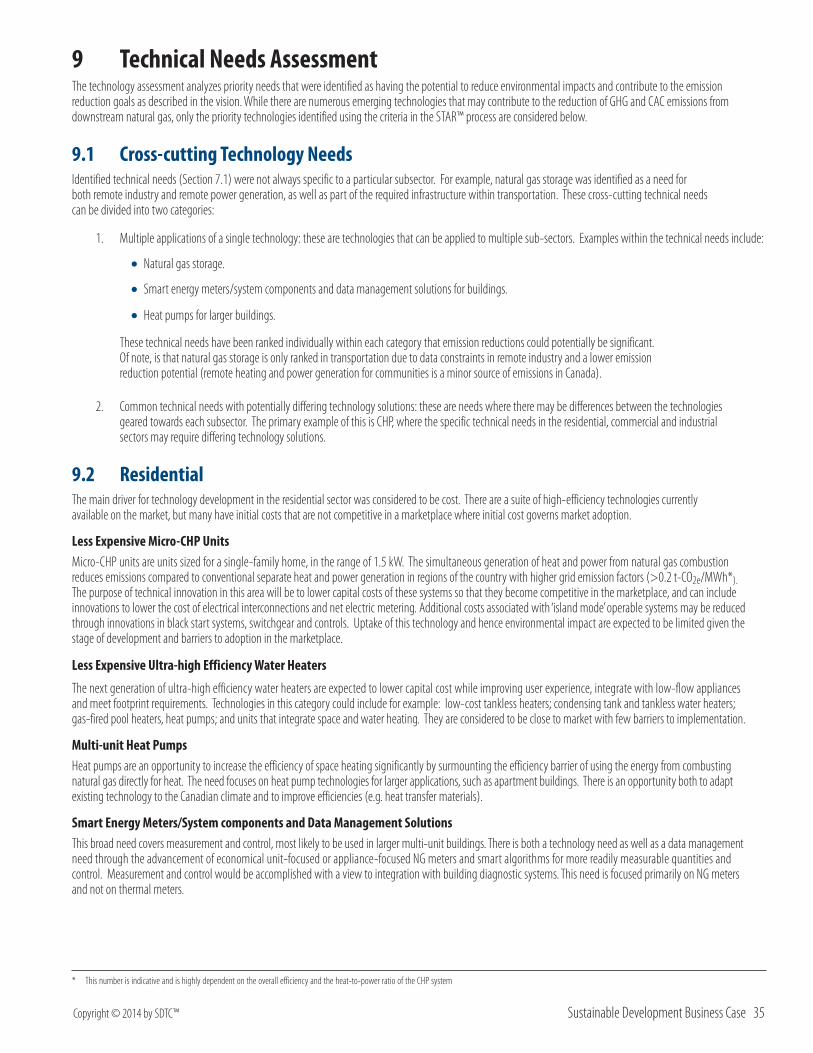
Copyright © 2014 by SDTC™ Sustainable Development Business Case 35
9 Technical Needs AssessmentThe technology assessment analyzes priority needs that were identified as having the potential to reduce environmental impacts and contribute to the emission reduction goals as described in the vision. While there are numerous emerging technologies that may contribute to the reduction of GHG and CAC emissions from downstream natural gas, only the priority technologies identified using the criteria in the STAR™ process are considered below.
9.1 Cross-cutting Technology NeedsIdentified technical needs (Section 7.1) were not always specific to a particular subsector. For example, natural gas storage was identified as a need for both remote industry and remote power generation, as well as part of the required infrastructure within transportation. These cross-cutting technical needs can be divided into two categories:
1. Multiple applications of a single technology: these are technologies that can be applied to multiple sub-sectors. Examples within the technical needs include:
•Natural gas storage.
• Smart energy meters/system components and data management solutions for buildings.
•Heat pumps for larger buildings.
These technical needs have been ranked individually within each category that emission reductions could potentially be significant. Of note, is that natural gas storage is only ranked in transportation due to data constraints in remote industry and a lower emission reduction potential (remote heating and power generation for communities is a minor source of emissions in Canada).
2. Common technical needs with potentially differing technology solutions: these are needs where there may be differences between the technologies geared towards each subsector. The primary example of this is CHP, where the specific technical needs in the residential, commercial and industrial sectors may require differing technology solutions.
9.2 ResidentialThe main driver for technology development in the residential sector was considered to be cost. There are a suite of high-efficiency technologies currently available on the market, but many have initial costs that are not competitive in a marketplace where initial cost governs market adoption.
Less Expensive Micro-CHP UnitsMicro-CHP units are units sized for a single-family home, in the range of 1.5 kW. The simultaneous generation of heat and power from natural gas combustion reduces emissions compared to conventional separate heat and power generation in regions of the country with higher grid emission factors (>0.2 t-CO2e/MWh*). The purpose of technical innovation in this area will be to lower capital costs of these systems so that they become competitive in the marketplace, and can include innovations to lower the cost of electrical interconnections and net electric metering. Additional costs associated with ‘island mode’ operable systems may be reduced through innovations in black start systems, switchgear and controls. Uptake of this technology and hence environmental impact are expected to be limited given the stage of development and barriers to adoption in the marketplace.
Less Expensive Ultra-high Efficiency Water Heaters
The next generation of ultra-high efficiency water heaters are expected to lower capital cost while improving user experience, integrate with low-flow appliances and meet footprint requirements. Technologies in this category could include for example: low-cost tankless heaters; condensing tank and tankless water heaters; gas-fired pool heaters, heat pumps; and units that integrate space and water heating. They are considered to be close to market with few barriers to implementation.
Multi-unit Heat PumpsHeat pumps are an opportunity to increase the efficiency of space heating significantly by surmounting the efficiency barrier of using the energy from combusting natural gas directly for heat. The need focuses on heat pump technologies for larger applications, such as apartment buildings. There is an opportunity both to adapt existing technology to the Canadian climate and to improve efficiencies (e.g. heat transfer materials).
Smart Energy Meters/System components and Data Management SolutionsThis broad need covers measurement and control, most likely to be used in larger multi-unit buildings. There is both a technology need as well as a data management need through the advancement of economical unit-focused or appliance-focused NG meters and smart algorithms for more readily measurable quantities and control. Measurement and control would be accomplished with a view to integration with building diagnostic systems. This need is focused primarily on NG meters and not on thermal meters.
* This number is indicative and is highly dependent on the overall efficiency and the heat-to-power ratio of the CHP system
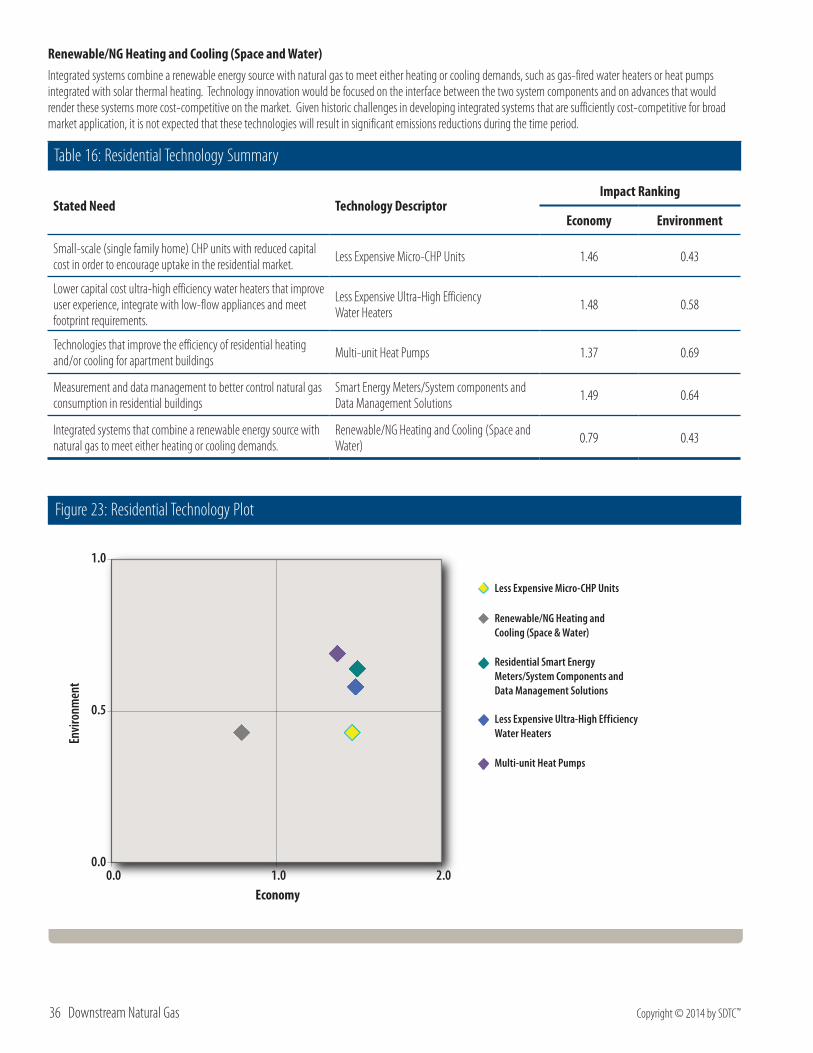
36 Downstream Natural Gas Copyright © 2014 by SDTC™
Renewable/NG Heating and Cooling (Space and Water)Integrated systems combine a renewable energy source with natural gas to meet either heating or cooling demands, such as gas-fired water heaters or heat pumps integrated with solar thermal heating. Technology innovation would be focused on the interface between the two system components and on advances that would render these systems more cost-competitive on the market. Given historic challenges in developing integrated systems that are sufficiently cost-competitive for broad market application, it is not expected that these technologies will result in significant emissions reductions during the time period.
Table 16: Residential Technology Summary
Stated Need Technology DescriptorImpact Ranking
Economy Environment
Small-scale (single family home) CHP units with reduced capital cost in order to encourage uptake in the residential market. Less Expensive Micro-CHP Units 1.46 0.43
Lower capital cost ultra-high efficiency water heaters that improve user experience, integrate with low-flow appliances and meet footprint requirements.
Less Expensive Ultra-High Efficiency Water Heaters 1.48 0.58
Technologies that improve the efficiency of residential heating and/or cooling for apartment buildings Multi-unit Heat Pumps 1.37 0.69
Measurement and data management to better control natural gas consumption in residential buildings
Smart Energy Meters/System components and Data Management Solutions 1.49 0.64
Integrated systems that combine a renewable energy source with natural gas to meet either heating or cooling demands.
Renewable/NG Heating and Cooling (Space and Water) 0.79 0.43
Figure 23: Residential Technology Plot
0.0
0.5
1.0
0.0 1.0 2.0
Envi
ronm
ent
Economy
Less Expensive Micro-CHP Units
Renewable/NG Heating and Cooling (Space & Water)
Residential Smart Energy Meters/System Components and Data Management Solutions
Less Expensive Ultra-High Efficiency Water Heaters
Multi-unit Heat Pumps
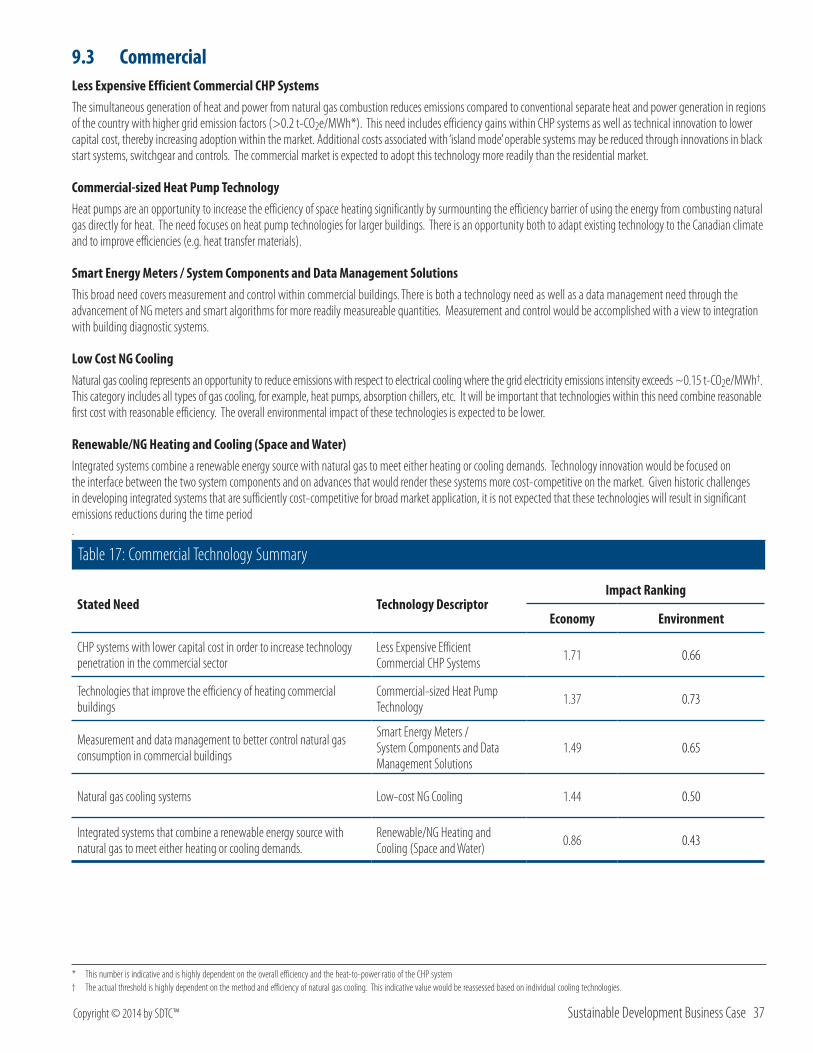
Copyright © 2014 by SDTC™ Sustainable Development Business Case 37
9.3 CommercialLess Expensive Efficient Commercial CHP SystemsThe simultaneous generation of heat and power from natural gas combustion reduces emissions compared to conventional separate heat and power generation in regions of the country with higher grid emission factors (>0.2 t-CO2e/MWh*). This need includes efficiency gains within CHP systems as well as technical innovation to lower capital cost, thereby increasing adoption within the market. Additional costs associated with ‘island mode’ operable systems may be reduced through innovations in black start systems, switchgear and controls. The commercial market is expected to adopt this technology more readily than the residential market.
Commercial-sized Heat Pump TechnologyHeat pumps are an opportunity to increase the efficiency of space heating significantly by surmounting the efficiency barrier of using the energy from combusting natural gas directly for heat. The need focuses on heat pump technologies for larger buildings. There is an opportunity both to adapt existing technology to the Canadian climate and to improve efficiencies (e.g. heat transfer materials).
Smart Energy Meters / System Components and Data Management SolutionsThis broad need covers measurement and control within commercial buildings. There is both a technology need as well as a data management need through the advancement of NG meters and smart algorithms for more readily measureable quantities. Measurement and control would be accomplished with a view to integration with building diagnostic systems.
Low Cost NG CoolingNatural gas cooling represents an opportunity to reduce emissions with respect to electrical cooling where the grid electricity emissions intensity exceeds ~0.15 t-CO2e/MWh†. This category includes all types of gas cooling, for example, heat pumps, absorption chillers, etc. It will be important that technologies within this need combine reasonable first cost with reasonable efficiency. The overall environmental impact of these technologies is expected to be lower.
Renewable/NG Heating and Cooling (Space and Water)Integrated systems combine a renewable energy source with natural gas to meet either heating or cooling demands. Technology innovation would be focused on the interface between the two system components and on advances that would render these systems more cost-competitive on the market. Given historic challenges in developing integrated systems that are sufficiently cost-competitive for broad market application, it is not expected that these technologies will result in significant emissions reductions during the time period .
Table 17: Commercial Technology Summary
Stated Need Technology DescriptorImpact Ranking
Economy Environment
CHP systems with lower capital cost in order to increase technology penetration in the commercial sector
Less Expensive Efficient Commercial CHP Systems 1.71 0.66
Technologies that improve the efficiency of heating commercial buildings
Commercial-sized Heat Pump Technology 1.37 0.73
Measurement and data management to better control natural gas consumption in commercial buildings
Smart Energy Meters / System Components and Data Management Solutions
1.49 0.65
Natural gas cooling systems Low-cost NG Cooling 1.44 0.50
Integrated systems that combine a renewable energy source with natural gas to meet either heating or cooling demands.
Renewable/NG Heating and Cooling (Space and Water) 0.86 0.43
* This number is indicative and is highly dependent on the overall efficiency and the heat-to-power ratio of the CHP system† The actual threshold is highly dependent on the method and efficiency of natural gas cooling. This indicative value would be reassessed based on individual cooling technologies.
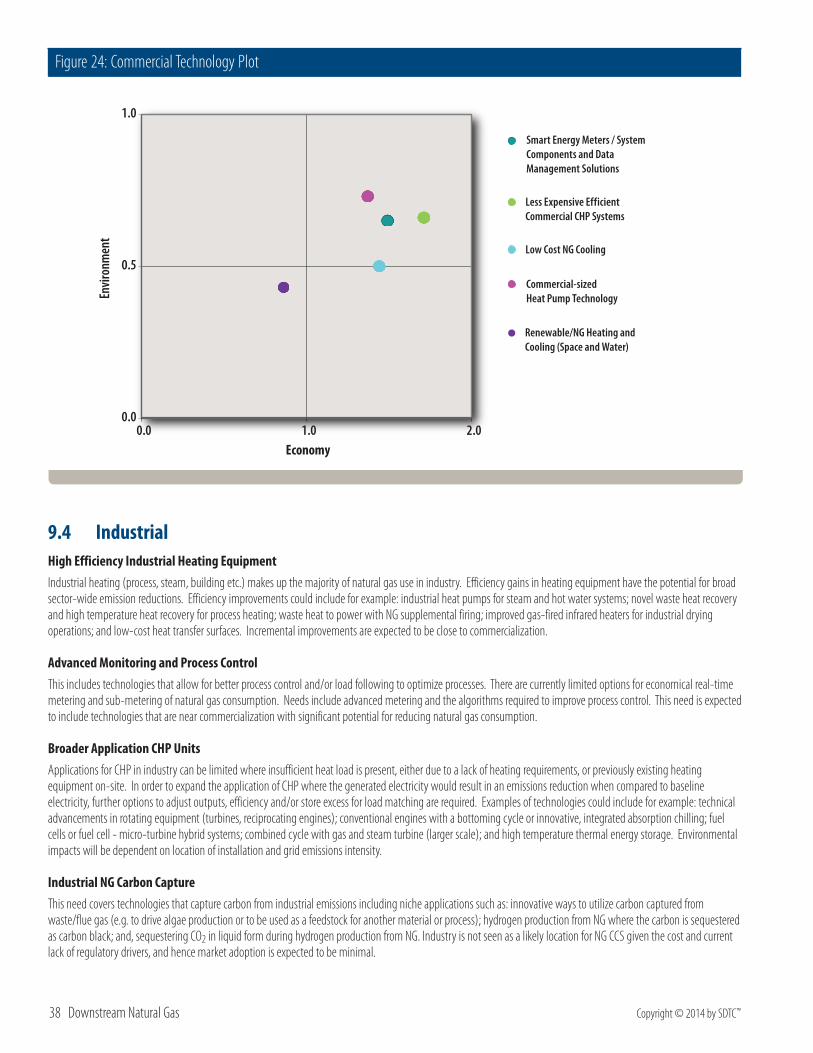
38 Downstream Natural Gas Copyright © 2014 by SDTC™
Figure 24: Commercial Technology Plot
0.0
0.5
1.0
0.0 1.0 2.0
Envi
ronm
ent
Economy
Renewable/NG Heating and Cooling (Space and Water)
Low Cost NG Cooling
Smart Energy Meters / System Components and Data Management Solutions
Commercial-sized Heat Pump Technology
Less Expensive EfficientCommercial CHP Systems
9.4 IndustrialHigh Efficiency Industrial Heating EquipmentIndustrial heating (process, steam, building etc.) makes up the majority of natural gas use in industry. Efficiency gains in heating equipment have the potential for broad sector-wide emission reductions. Efficiency improvements could include for example: industrial heat pumps for steam and hot water systems; novel waste heat recovery and high temperature heat recovery for process heating; waste heat to power with NG supplemental firing; improved gas-fired infrared heaters for industrial drying operations; and low-cost heat transfer surfaces. Incremental improvements are expected to be close to commercialization.
Advanced Monitoring and Process ControlThis includes technologies that allow for better process control and/or load following to optimize processes. There are currently limited options for economical real-time metering and sub-metering of natural gas consumption. Needs include advanced metering and the algorithms required to improve process control. This need is expected to include technologies that are near commercialization with significant potential for reducing natural gas consumption.
Broader Application CHP UnitsApplications for CHP in industry can be limited where insufficient heat load is present, either due to a lack of heating requirements, or previously existing heating equipment on-site. In order to expand the application of CHP where the generated electricity would result in an emissions reduction when compared to baseline electricity, further options to adjust outputs, efficiency and/or store excess for load matching are required. Examples of technologies could include for example: technical advancements in rotating equipment (turbines, reciprocating engines); conventional engines with a bottoming cycle or innovative, integrated absorption chilling; fuel cells or fuel cell - micro-turbine hybrid systems; combined cycle with gas and steam turbine (larger scale); and high temperature thermal energy storage. Environmental impacts will be dependent on location of installation and grid emissions intensity.
Industrial NG Carbon CaptureThis need covers technologies that capture carbon from industrial emissions including niche applications such as: innovative ways to utilize carbon captured from waste/flue gas (e.g. to drive algae production or to be used as a feedstock for another material or process); hydrogen production from NG where the carbon is sequestered as carbon black; and, sequestering CO2 in liquid form during hydrogen production from NG. Industry is not seen as a likely location for NG CCS given the cost and current lack of regulatory drivers, and hence market adoption is expected to be minimal.
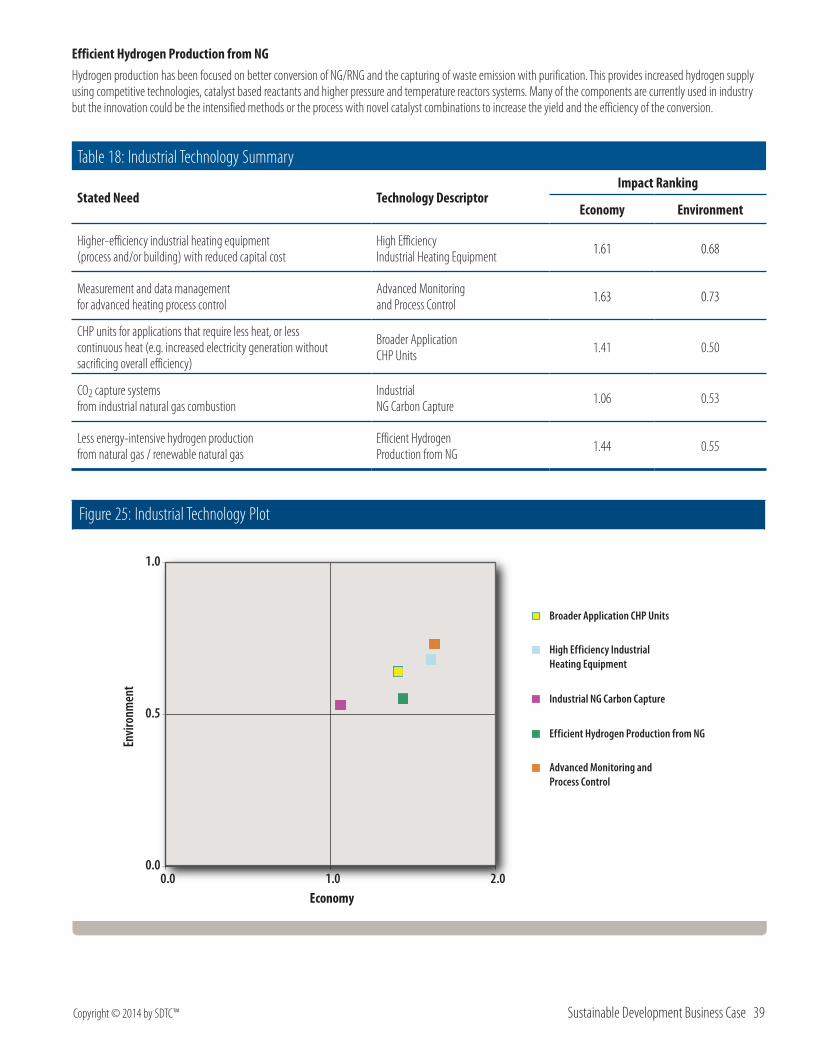
Copyright © 2014 by SDTC™ Sustainable Development Business Case 39
Efficient Hydrogen Production from NGHydrogen production has been focused on better conversion of NG/RNG and the capturing of waste emission with purification. This provides increased hydrogen supply using competitive technologies, catalyst based reactants and higher pressure and temperature reactors systems. Many of the components are currently used in industry but the innovation could be the intensified methods or the process with novel catalyst combinations to increase the yield and the efficiency of the conversion.
Table 18: Industrial Technology Summary
Stated Need Technology DescriptorImpact Ranking
Economy Environment
Higher-efficiency industrial heating equipment (process and/or building) with reduced capital cost
High Efficiency Industrial Heating Equipment 1.61 0.68
Measurement and data management for advanced heating process control
Advanced Monitoring and Process Control 1.63 0.73
CHP units for applications that require less heat, or less continuous heat (e.g. increased electricity generation without sacrificing overall efficiency)
Broader Application CHP Units 1.41 0.50
CO2 capture systems from industrial natural gas combustion
Industrial NG Carbon Capture 1.06 0.53
Less energy-intensive hydrogen production from natural gas / renewable natural gas
Efficient Hydrogen Production from NG 1.44 0.55
Figure 25: Industrial Technology Plot
0.0
0.5
1.0
0.0 1.0 2.0
Envi
ronm
ent
Economy
Advanced Monitoring and Process Control
Broader Application CHP Units
Efficient Hydrogen Production from NG
Industrial NG Carbon Capture
High Efficiency Industrial Heating Equipment

40 Downstream Natural Gas Copyright © 2014 by SDTC™
9.5 Power GenerationMore Efficient NG-fueled Electric GeneratorsEnergy use projections show a rise in natural gas power generation in the near and medium term. Improvements to generator efficiency, both at the utility scale and small/medium scale, will have the potential for significant reductions compared to current technology. Technologies in this category include a variety of options to improve the efficiency of NG generators including power augmentation techniques and advanced materials. These could include for example: innovative intercooler and recuperative heat exchangers; novel heat transfer surfaces; low-cost corrosion-resistant metals or materials; and higher-temperature-resistant metals, ceramics, and other materials; and innovative waste heat capture/re-use.
Improvement in NG generators can also be in the area of transient response. NG generators are set up to do this well compared to their coal and nuclear counterparts. The quicker transient responses (currently at 8-24 hours for NG gens) will make them complimentary to renewable power generation plants – picking up the load quickly when renewables slow down due to climatic conditions. Needs for enabling technologies include heat recovery and steam systems that are able to withstand transient operations.
CAC ControlThis category includes technologies designed to reduce CAC emissions from power generation, including technologies that address operating conditions as well as downstream technologies. Technologies could include innovative, economical low-emission control technologies for reciprocating engines - commercialized in vehicles but not yet in a stationary market. Since there is often a trade-off between CAC emissions control and power generation efficiency, these technologies must balance CAC emission reductions with system efficiency and reliability.
Power to GasPower to gas presents a method of power storage through the generation of hydrogen or methane from excess electricity. The gas can be transferred to the existing natural gas infrastructure. Innovation could include for example: higher-power PEM electrolysis; high temperature and pressure electrolysis; solid oxide electrolysis cells; and catalysts for CO2 and H2 reactions to form methane. High CAPEX costs for power to gas plants, round trip inefficiencies and market pricing of electricity and natural gas in North America drives the value proposition down as compared to the European market, thereby limiting adoption.
CNG and Long-term LNG StorageLong-term LNG storage and compact CNG storage is considered to be required for the use of LNG for remote power generation, especially in northern regions where site-access is not possible through the entire year. It could include novel tank insulation systems, tank materials, and storage mechanisms such as carbon nanotubes and metal organic frameworks. Technologies improving on current storage capacity are understood to be at a relatively preliminary stage of development, but could also apply to transportation applications.
PowerGen NG Carbon CaptureThis need includes technologies that focus on the capture of CO2 from NG generation. This can include syngas-hydrogen capture, inherent separation, post-process capture, and oxy-fuel combustion, with the first two considered to be in the R&D phase and the latter two at the demonstration phase. In the absence of regulatory drivers, adoption is expected to be minimal until the longer term.
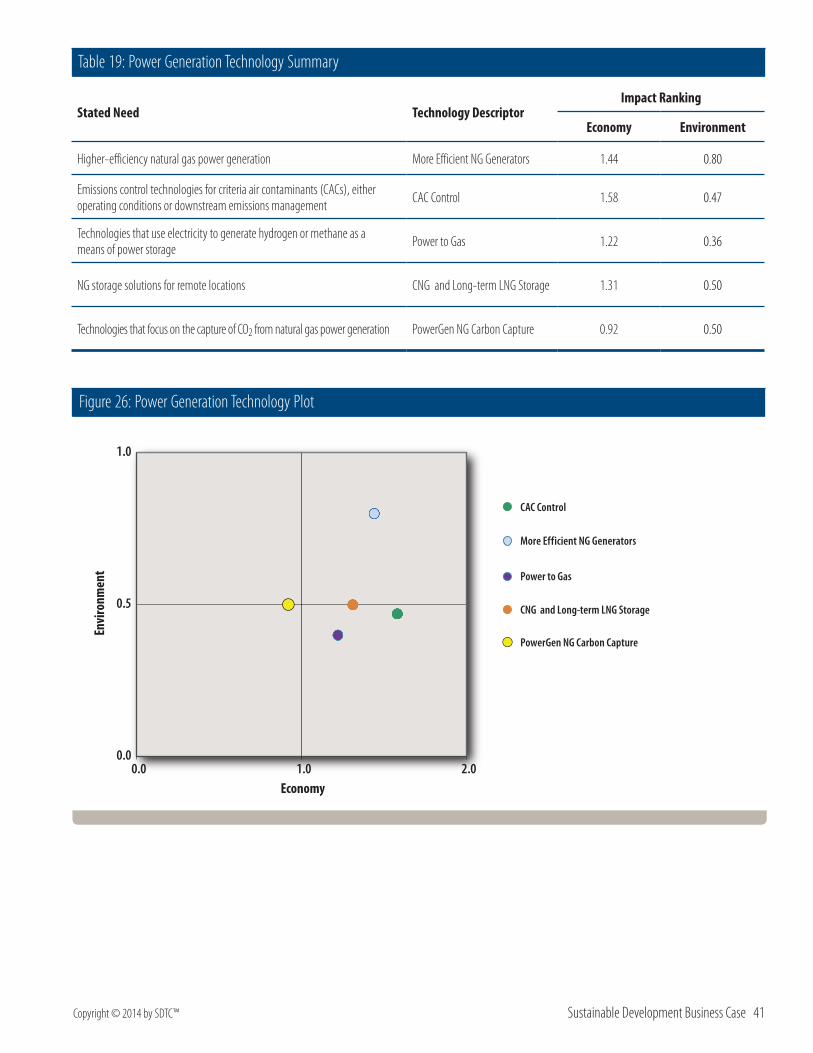
Copyright © 2014 by SDTC™ Sustainable Development Business Case 41
Table 19: Power Generation Technology Summary
Stated Need Technology DescriptorImpact Ranking
Economy Environment
Higher-efficiency natural gas power generation More Efficient NG Generators 1.44 0.80
Emissions control technologies for criteria air contaminants (CACs), either operating conditions or downstream emissions management CAC Control 1.58 0.47
Technologies that use electricity to generate hydrogen or methane as a means of power storage Power to Gas 1.22 0.36
NG storage solutions for remote locations CNG and Long-term LNG Storage 1.31 0.50
Technologies that focus on the capture of CO2 from natural gas power generation PowerGen NG Carbon Capture 0.92 0.50
Figure 26: Power Generation Technology Plot
0.0
0.5
1.0
0.0 1.0 2.0
Envi
ronm
ent
Economy
PowerGen NG Carbon Capture
CNG and Long-term LNG Storage
Power to Gas
More Efficient NG Generators
CAC Control
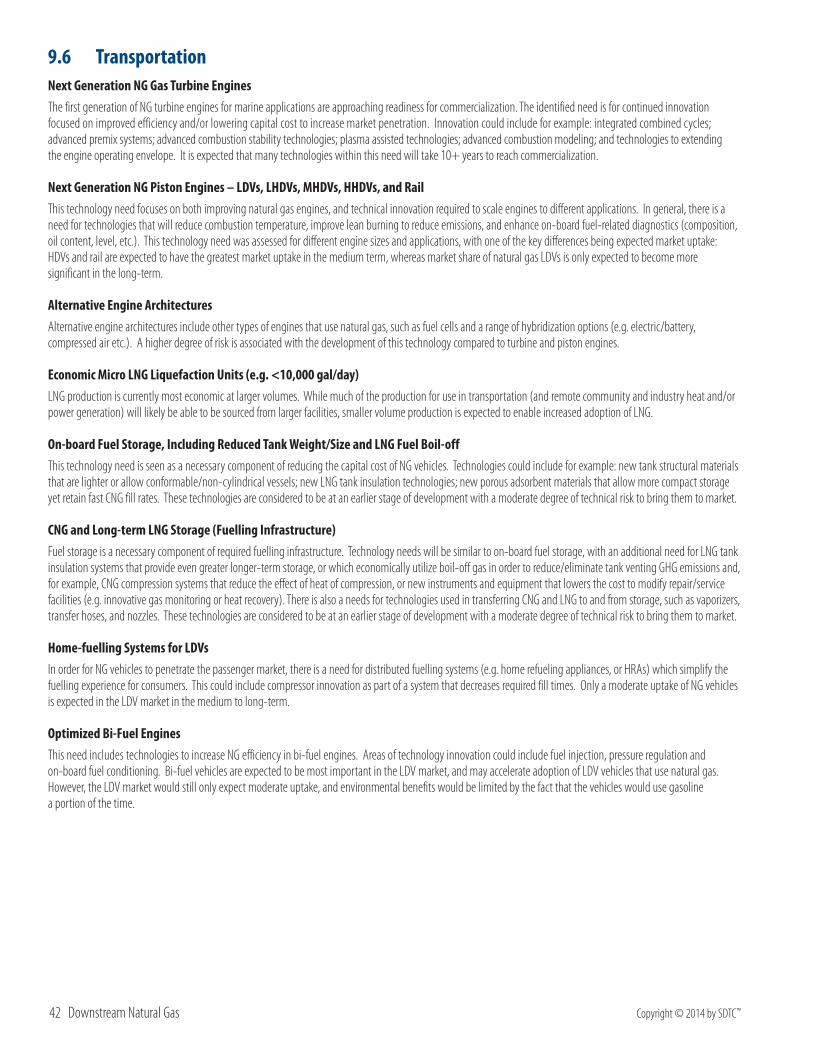
42 Downstream Natural Gas Copyright © 2014 by SDTC™
9.6 TransportationNext Generation NG Gas Turbine EnginesThe first generation of NG turbine engines for marine applications are approaching readiness for commercialization. The identified need is for continued innovation focused on improved efficiency and/or lowering capital cost to increase market penetration. Innovation could include for example: integrated combined cycles; advanced premix systems; advanced combustion stability technologies; plasma assisted technologies; advanced combustion modeling; and technologies to extending the engine operating envelope. It is expected that many technologies within this need will take 10+ years to reach commercialization.
Next Generation NG Piston Engines – LDVs, LHDVs, MHDVs, HHDVs, and RailThis technology need focuses on both improving natural gas engines, and technical innovation required to scale engines to different applications. In general, there is a need for technologies that will reduce combustion temperature, improve lean burning to reduce emissions, and enhance on-board fuel-related diagnostics (composition, oil content, level, etc.). This technology need was assessed for different engine sizes and applications, with one of the key differences being expected market uptake: HDVs and rail are expected to have the greatest market uptake in the medium term, whereas market share of natural gas LDVs is only expected to become more significant in the long-term.
Alternative Engine ArchitecturesAlternative engine architectures include other types of engines that use natural gas, such as fuel cells and a range of hybridization options (e.g. electric/battery, compressed air etc.). A higher degree of risk is associated with the development of this technology compared to turbine and piston engines.
Economic Micro LNG Liquefaction Units (e.g. <10,000 gal/day)LNG production is currently most economic at larger volumes. While much of the production for use in transportation (and remote community and industry heat and/or power generation) will likely be able to be sourced from larger facilities, smaller volume production is expected to enable increased adoption of LNG.
On-board Fuel Storage, Including Reduced Tank Weight/Size and LNG Fuel Boil-offThis technology need is seen as a necessary component of reducing the capital cost of NG vehicles. Technologies could include for example: new tank structural materials that are lighter or allow conformable/non-cylindrical vessels; new LNG tank insulation technologies; new porous adsorbent materials that allow more compact storage yet retain fast CNG fill rates. These technologies are considered to be at an earlier stage of development with a moderate degree of technical risk to bring them to market.
CNG and Long-term LNG Storage (Fuelling Infrastructure)Fuel storage is a necessary component of required fuelling infrastructure. Technology needs will be similar to on-board fuel storage, with an additional need for LNG tank insulation systems that provide even greater longer-term storage, or which economically utilize boil-off gas in order to reduce/eliminate tank venting GHG emissions and, for example, CNG compression systems that reduce the effect of heat of compression, or new instruments and equipment that lowers the cost to modify repair/service facilities (e.g. innovative gas monitoring or heat recovery). There is also a needs for technologies used in transferring CNG and LNG to and from storage, such as vaporizers, transfer hoses, and nozzles. These technologies are considered to be at an earlier stage of development with a moderate degree of technical risk to bring them to market.
Home-fuelling Systems for LDVsIn order for NG vehicles to penetrate the passenger market, there is a need for distributed fuelling systems (e.g. home refueling appliances, or HRAs) which simplify the fuelling experience for consumers. This could include compressor innovation as part of a system that decreases required fill times. Only a moderate uptake of NG vehicles is expected in the LDV market in the medium to long-term.
Optimized Bi-Fuel EnginesThis need includes technologies to increase NG efficiency in bi-fuel engines. Areas of technology innovation could include fuel injection, pressure regulation and on-board fuel conditioning. Bi-fuel vehicles are expected to be most important in the LDV market, and may accelerate adoption of LDV vehicles that use natural gas. However, the LDV market would still only expect moderate uptake, and environmental benefits would be limited by the fact that the vehicles would use gasoline a portion of the time.
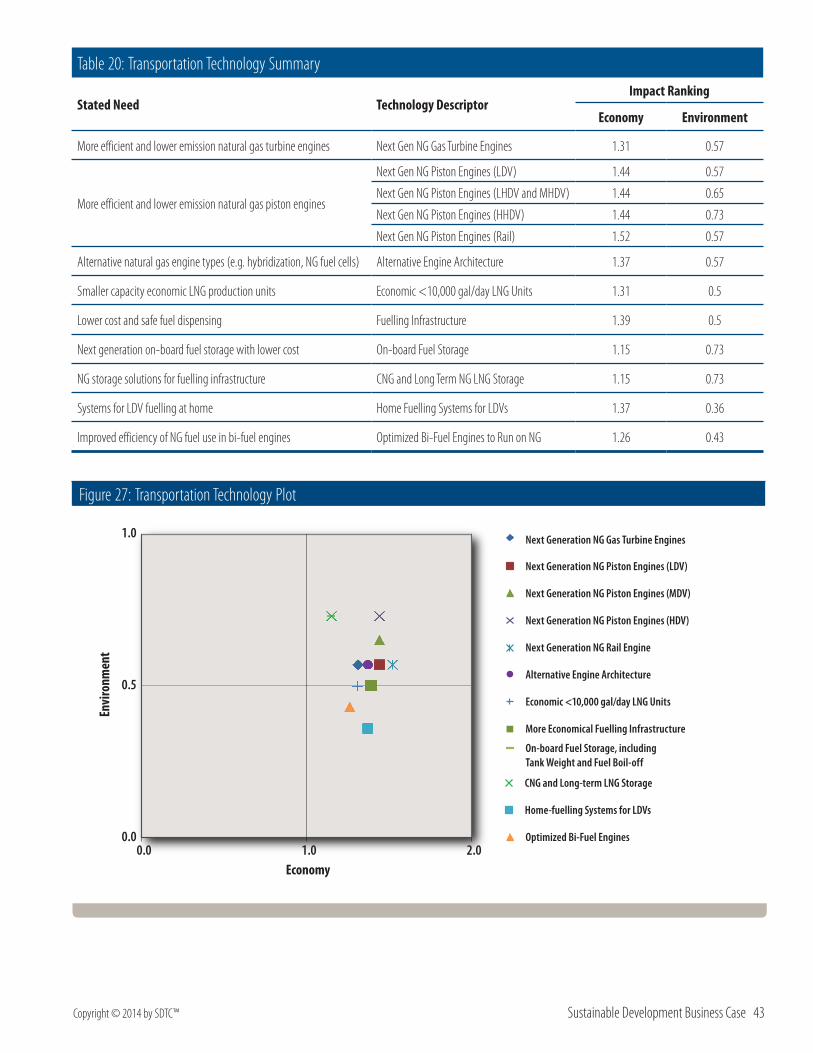
Copyright © 2014 by SDTC™ Sustainable Development Business Case 43
Table 20: Transportation Technology Summary
Stated Need Technology DescriptorImpact Ranking
Economy Environment
More efficient and lower emission natural gas turbine engines Next Gen NG Gas Turbine Engines 1.31 0.57
More efficient and lower emission natural gas piston engines
Next Gen NG Piston Engines (LDV) 1.44 0.57
Next Gen NG Piston Engines (LHDV and MHDV) 1.44 0.65
Next Gen NG Piston Engines (HHDV) 1.44 0.73
Next Gen NG Piston Engines (Rail) 1.52 0.57
Alternative natural gas engine types (e.g. hybridization, NG fuel cells) Alternative Engine Architecture 1.37 0.57
Smaller capacity economic LNG production units Economic <10,000 gal/day LNG Units 1.31 0.5
Lower cost and safe fuel dispensing Fuelling Infrastructure 1.39 0.5
Next generation on-board fuel storage with lower cost On-board Fuel Storage 1.15 0.73
NG storage solutions for fuelling infrastructure CNG and Long Term NG LNG Storage 1.15 0.73
Systems for LDV fuelling at home Home Fuelling Systems for LDVs 1.37 0.36
Improved efficiency of NG fuel use in bi-fuel engines Optimized Bi-Fuel Engines to Run on NG 1.26 0.43
Figure 27: Transportation Technology Plot
0.0
0.5
1.0
0.0 1.0 2.0
Envi
ronm
ent
Economy
Optimized Bi-Fuel Engines
Home-fuelling Systems for LDVs
CNG and Long-term LNG Storage
On-board Fuel Storage, including Tank Weight and Fuel Boil-off
More Economical Fuelling Infrastructure
Economic <10,000 gal/day LNG Units
Alternative Engine Architecture
Next Generation NG Rail Engine
Next Generation NG Piston Engines (HDV)
Next Generation NG Piston Engines (MDV)
Next Generation NG Piston Engines (LDV)
Next Generation NG Gas Turbine Engines
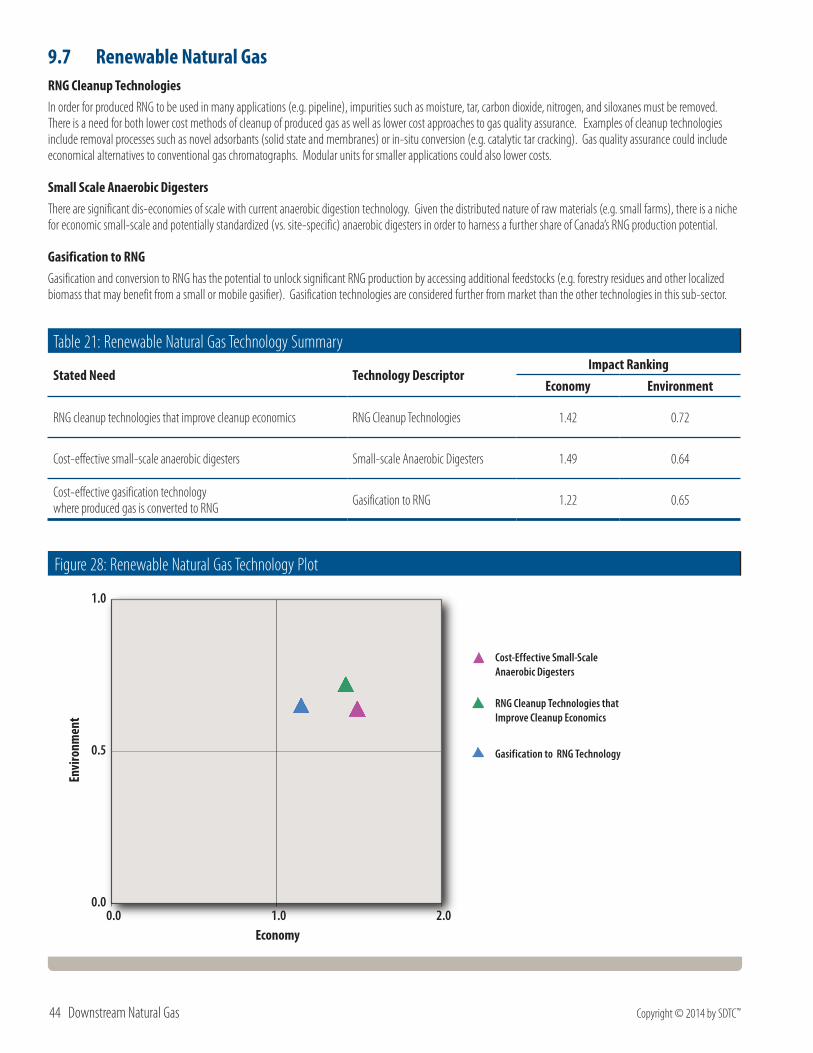
44 Downstream Natural Gas Copyright © 2014 by SDTC™
9.7 Renewable Natural GasRNG Cleanup TechnologiesIn order for produced RNG to be used in many applications (e.g. pipeline), impurities such as moisture, tar, carbon dioxide, nitrogen, and siloxanes must be removed. There is a need for both lower cost methods of cleanup of produced gas as well as lower cost approaches to gas quality assurance. Examples of cleanup technologies include removal processes such as novel adsorbants (solid state and membranes) or in-situ conversion (e.g. catalytic tar cracking). Gas quality assurance could include economical alternatives to conventional gas chromatographs. Modular units for smaller applications could also lower costs.
Small Scale Anaerobic DigestersThere are significant dis-economies of scale with current anaerobic digestion technology. Given the distributed nature of raw materials (e.g. small farms), there is a niche for economic small-scale and potentially standardized (vs. site-specific) anaerobic digesters in order to harness a further share of Canada’s RNG production potential.
Gasification to RNGGasification and conversion to RNG has the potential to unlock significant RNG production by accessing additional feedstocks (e.g. forestry residues and other localized biomass that may benefit from a small or mobile gasifier). Gasification technologies are considered further from market than the other technologies in this sub-sector.
Table 21: Renewable Natural Gas Technology Summary
Stated Need Technology DescriptorImpact Ranking
Economy Environment
RNG cleanup technologies that improve cleanup economics RNG Cleanup Technologies 1.42 0.72
Cost-effective small-scale anaerobic digesters Small-scale Anaerobic Digesters 1.49 0.64
Cost-effective gasification technology where produced gas is converted to RNG Gasification to RNG 1.22 0.65
Figure 28: Renewable Natural Gas Technology Plot
0.0
0.5
1.0
0.0 1.0 2.0
Envi
ronm
ent
Economy
Gasification to RNG Technology
RNG Cleanup Technologies that Improve Cleanup Economics
Cost-Effective Small-Scale Anaerobic Digesters
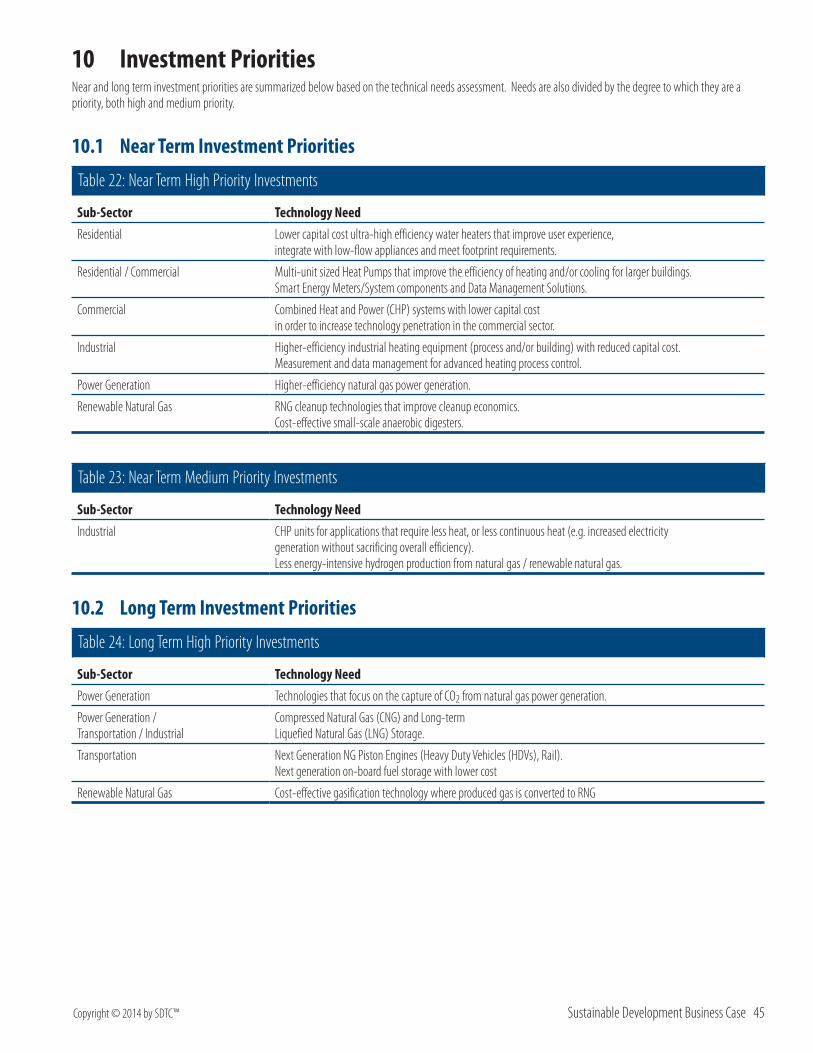
Copyright © 2014 by SDTC™ Sustainable Development Business Case 45
10 Investment PrioritiesNear and long term investment priorities are summarized below based on the technical needs assessment. Needs are also divided by the degree to which they are a priority, both high and medium priority.
10.1 Near Term Investment Priorities
Table 22: Near Term High Priority Investments
Sub-Sector Technology NeedResidential Lower capital cost ultra-high efficiency water heaters that improve user experience,
integrate with low-flow appliances and meet footprint requirements.
Residential / Commercial Multi-unit sized Heat Pumps that improve the efficiency of heating and/or cooling for larger buildings. Smart Energy Meters/System components and Data Management Solutions.
Commercial Combined Heat and Power (CHP) systems with lower capital cost in order to increase technology penetration in the commercial sector.
Industrial Higher-efficiency industrial heating equipment (process and/or building) with reduced capital cost. Measurement and data management for advanced heating process control.
Power Generation Higher-efficiency natural gas power generation.
Renewable Natural Gas RNG cleanup technologies that improve cleanup economics. Cost-effective small-scale anaerobic digesters.
Table 23: Near Term Medium Priority Investments
Sub-Sector Technology NeedIndustrial CHP units for applications that require less heat, or less continuous heat (e.g. increased electricity
generation without sacrificing overall efficiency). Less energy-intensive hydrogen production from natural gas / renewable natural gas.
10.2 Long Term Investment Priorities
Table 24: Long Term High Priority Investments
Sub-Sector Technology NeedPower Generation Technologies that focus on the capture of CO2 from natural gas power generation.
Power Generation / Transportation / Industrial
Compressed Natural Gas (CNG) and Long-term Liquefied Natural Gas (LNG) Storage.
Transportation Next Generation NG Piston Engines (Heavy Duty Vehicles (HDVs), Rail). Next generation on-board fuel storage with lower cost
Renewable Natural Gas Cost-effective gasification technology where produced gas is converted to RNG

46 Downstream Natural Gas Copyright © 2014 by SDTC™
Table 25: Long Term Medium Priority Investments
Sub-Sector Technology Need
Residential Small scale (single family home) CHP units with reduced capital cost in order to encourage uptake in the residential market.
Industrial CO2 capture systems from industrial natural gas combustion.
Transportation Alternative natural gas engine types (e.g. hybridization, NG fuel cells). Next Generation NG Piston Engines for Light Duty Vehicles (LDVs). Next Generation NG Gas Turbine Engines. Systems for LDV fuelling at home. Lower cost and safe fuel dispensing. Improved efficiency of NG fuel use in bi-fuel engines.
Copyright © 2014 by SDTC™ Sustainable Development Business Case 47
11 National Strategy ImpactsThis section highlights the most important non-technical needs identified within the STAR™ process.
11.1 Integration of Natural Gas and Electricity ProvisionGiven Canada’s current energy landscape, minimizing the life-cycle environmental impact* of energy-use within the residential and commercial sectors would involve the use of a combination of electricity and natural gas by region. However, separate regulation governing electricity and gas provision to the same customer presents a barrier to integrated solutions designed to minimize environmental impact.
11.2 Energy LiteracyThere is a need for the education of policy makers, stakeholders and consumers with respect to the life cycle impacts of various power generation alternatives, as well as Canada’s capacity to generate power through various alternatives in the short, medium and long terms. By simultaneously educating key decision makers while building social understanding and acceptance, the goal of energy literacy would be to ensure that energy decisions are made based on the best available information.
Also identified within this broader category is a need for improved education on how products and services use energy. This could empower end-users to make environmentally-based decisions, which could then impact the decisions of suppliers related to efficiency and energy source considerations.
11.3 Demonstration Opportunities for New TechnologiesMany of the downstream NG sub-sectors are considered risk averse, and even those sub-sectors that may be more receptive to newer technologies look to demonstrated performance prior to adoption. Demonstration opportunities could come in the form of government programs or governmental/regulator ways to incentivize or reward utilities to incubate, install and nurture new technologies.
11.4 Clarification of Financial and Regulatory StructuresAdoption of some technologies with significant GHG reduction potentials will be reliant on financial and regulatory structures. Lack of clarity on these structures will have the potential to negatively impact adoption. They include:
•Natural gas taxation as a transportation fuel;
• Clarification from regulators regarding potential GHG emissions regulations;
•How the RNG cost premium will be overcome as RNG is not expected to be cost-competitive with NG in the short and medium term;
• CCS requirements for NG electric power generation.
* The life-cycle environmental impact should include a balanced approach to GHG emissions, CAC emissions, and water impacts.
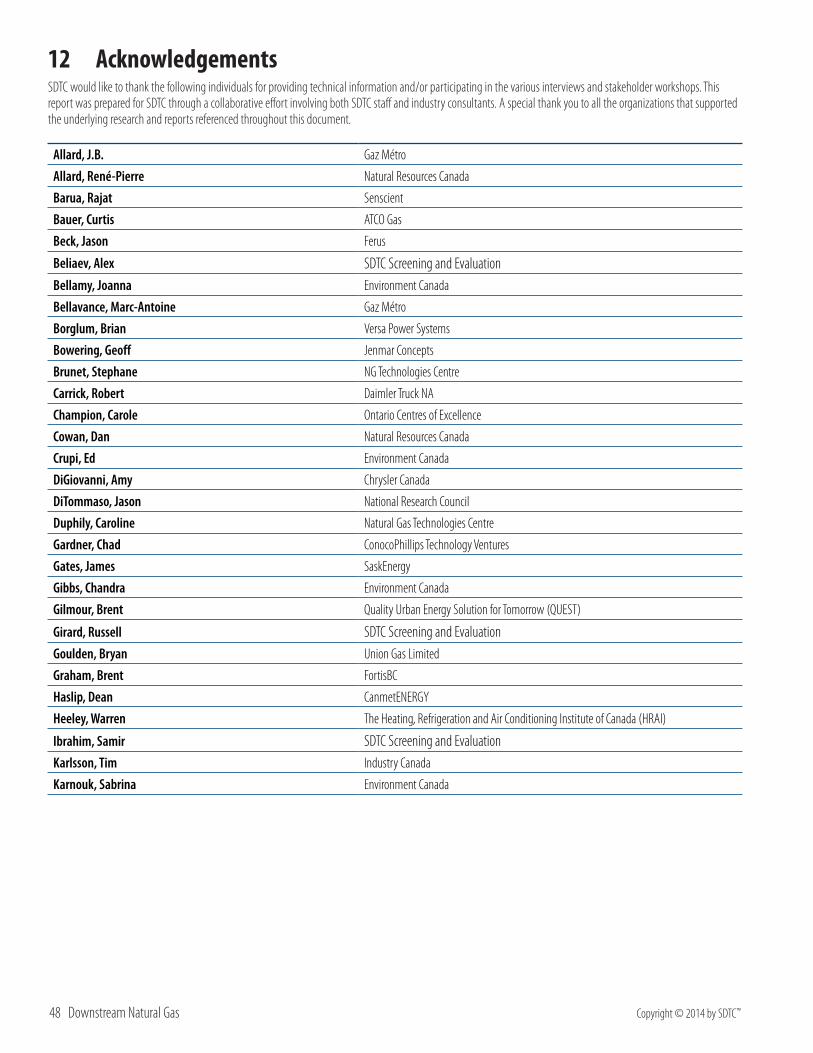
48 Downstream Natural Gas Copyright © 2014 by SDTC™
12 AcknowledgementsSDTC would like to thank the following individuals for providing technical information and/or participating in the various interviews and stakeholder workshops. This report was prepared for SDTC through a collaborative effort involving both SDTC staff and industry consultants. A special thank you to all the organizations that supported the underlying research and reports referenced throughout this document.
Allard, J.B. Gaz Métro
Allard, René-Pierre Natural Resources Canada
Barua, Rajat Senscient
Bauer, Curtis ATCO Gas
Beck, Jason Ferus
Beliaev, Alex SDTC Screening and EvaluationBellamy, Joanna Environment Canada
Bellavance, Marc-Antoine Gaz Métro
Borglum, Brian Versa Power Systems
Bowering, Geoff Jenmar Concepts
Brunet, Stephane NG Technologies Centre
Carrick, Robert Daimler Truck NA
Champion, Carole Ontario Centres of Excellence
Cowan, Dan Natural Resources Canada
Crupi, Ed Environment Canada
DiGiovanni, Amy Chrysler Canada
DiTommaso, Jason National Research Council
Duphily, Caroline Natural Gas Technologies Centre
Gardner, Chad ConocoPhillips Technology Ventures
Gates, James SaskEnergy
Gibbs, Chandra Environment Canada
Gilmour, Brent Quality Urban Energy Solution for Tomorrow (QUEST)
Girard, Russell SDTC Screening and EvaluationGoulden, Bryan Union Gas Limited
Graham, Brent FortisBC
Haslip, Dean CanmetENERGY
Heeley, Warren The Heating, Refrigeration and Air Conditioning Institute of Canada (HRAI)
Ibrahim, Samir SDTC Screening and EvaluationKarlsson, Tim Industry Canada
Karnouk, Sabrina Environment Canada
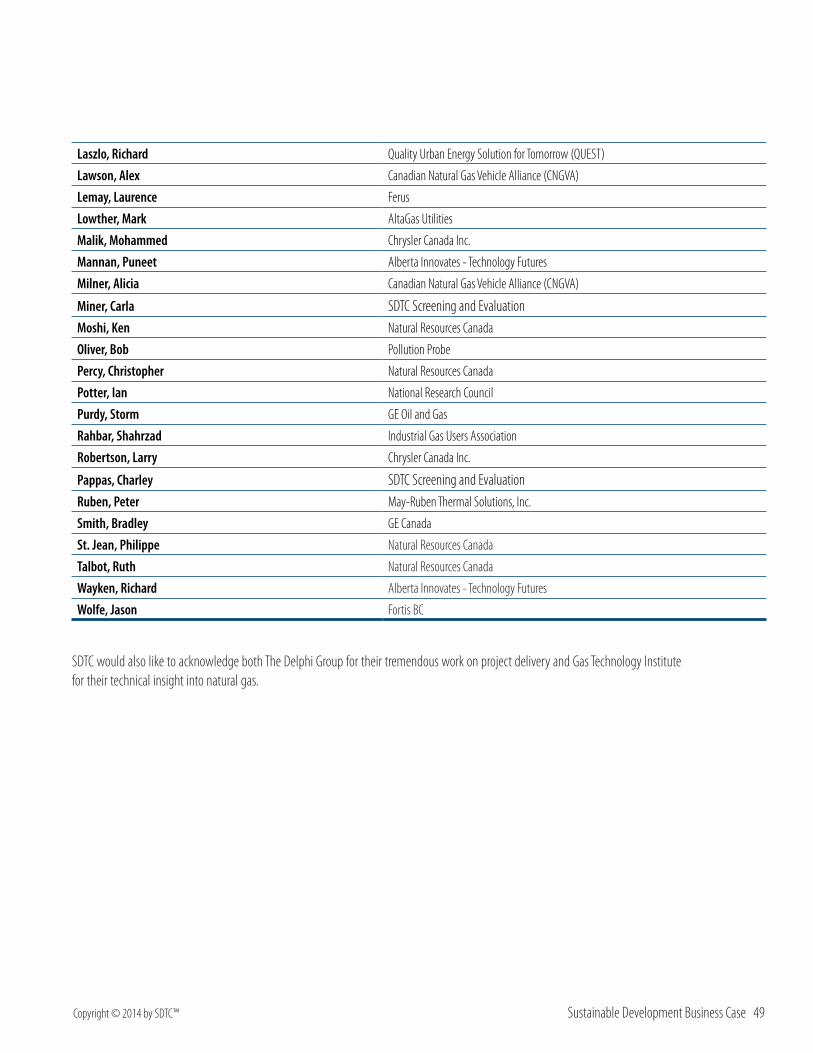
Copyright © 2014 by SDTC™ Sustainable Development Business Case 49
Laszlo, Richard Quality Urban Energy Solution for Tomorrow (QUEST)
Lawson, Alex Canadian Natural Gas Vehicle Alliance (CNGVA)
Lemay, Laurence Ferus
Lowther, Mark AltaGas Utilities
Malik, Mohammed Chrysler Canada Inc.
Mannan, Puneet Alberta Innovates - Technology Futures
Milner, Alicia Canadian Natural Gas Vehicle Alliance (CNGVA)
Miner, Carla SDTC Screening and EvaluationMoshi, Ken Natural Resources Canada
Oliver, Bob Pollution Probe
Percy, Christopher Natural Resources Canada
Potter, Ian National Research Council
Purdy, Storm GE Oil and Gas
Rahbar, Shahrzad Industrial Gas Users Association
Robertson, Larry Chrysler Canada Inc.
Pappas, Charley SDTC Screening and EvaluationRuben, Peter May-Ruben Thermal Solutions, Inc.
Smith, Bradley GE Canada
St. Jean, Philippe Natural Resources Canada
Talbot, Ruth Natural Resources Canada
Wayken, Richard Alberta Innovates - Technology Futures
Wolfe, Jason Fortis BC
SDTC would also like to acknowledge both The Delphi Group for their tremendous work on project delivery and Gas Technology Institute for their technical insight into natural gas.
50 Downstream Natural Gas Copyright © 2014 by SDTC™
13 Glossary Bi-Fuel Vehicle – a vehicle capacity of running on two different fuels. For example, a vehicle capacity of running on gasoline and natural gas. Biogas – a methane containing gas produced from the decomposition of biomass in landfills, digesters, and wastewater plants.
Combined Heat and Power (CHP) – the use of a heat engine or power station to simultaneously generate electricity and useful heat or steam.
Compressed Natural Gas (CNG) – natural gas that has been compressed to a pressure of 3,000 to 3,600 psi.
CO2 Equivalent (CO2e) – The products of the volume of fuel consumed, the constituent emission factor, and constituent global warming potential, summed to represent a carbon dioxide equivalent impact value.
Criteria Air Contaminant (CAC) – air pollutants that cause smog, acid rain, and other environmental and human health hazards. CACs quantified in this report include nitrogen oxides (NOx), sulfur oxides (SOx), particulate matter (PM), volatile organic compounds (VOCs), and carbon monoxide (CO).
Emission Factor – The average mass of a product of combustion emitted from the combustion of a fuel per volume of fuel consumed (g/L or kg/L).
Greenhouse Gas (GHG) – a gas in the atmosphere that contributes to the greenhouse effect by absorbing infrared radiation. Greenhouse gases quantified in this report include carbon dioxide (CO2), methane (CH4), and nitrous oxide (N2O).
Heavy Duty Vehicle (HDV) – class 2b to 8b vehicles with a gross vehicle weight ranging from 3.9 tonnes to greater than 27 tonnes. In this report HDVs have been further classified as Light (LHDV), Medium (MHDV), and Heavy Duty (HHDV). Light HDVs are class 2b to 5 vehicles with a gross vehicle weight ranging from 3.9 to 8.8 tonnes. Medium HDVs are class 6 and 7 vehicles with a gross vehicle weight ranging from 8.8 to 15 tonnes. Heavy HDVs are class 8a and 8b vehicles with a gross vehicle weight greater than 15 tonnes.
Life Cycle Assessment (LCA) – a technique used to assess the environmental impacts associated with all stages of a product`s or process`s life from cradle to grave, including raw material extraction, materials processing, manufacture, distribution, use, repair and maintenance, and final disposal or recycling.
Light Duty Vehicle (LDV) – class 1 and 2 vehicles with a gross vehicle weight of up to 3.9 tonnes.
Liquefied Natural Gas (LNG) – natural gas in liquid form, made by compressing and cooling natural gas to around -162˚C.
Natural Gas Vehicle (NGV) – an alternative fuel vehicle that uses CNG or LNG as the primary fuel.
Renewable Natural Gas (RNG) – biogas that has been upgraded to the quality of saleable natural gas through a purification process.
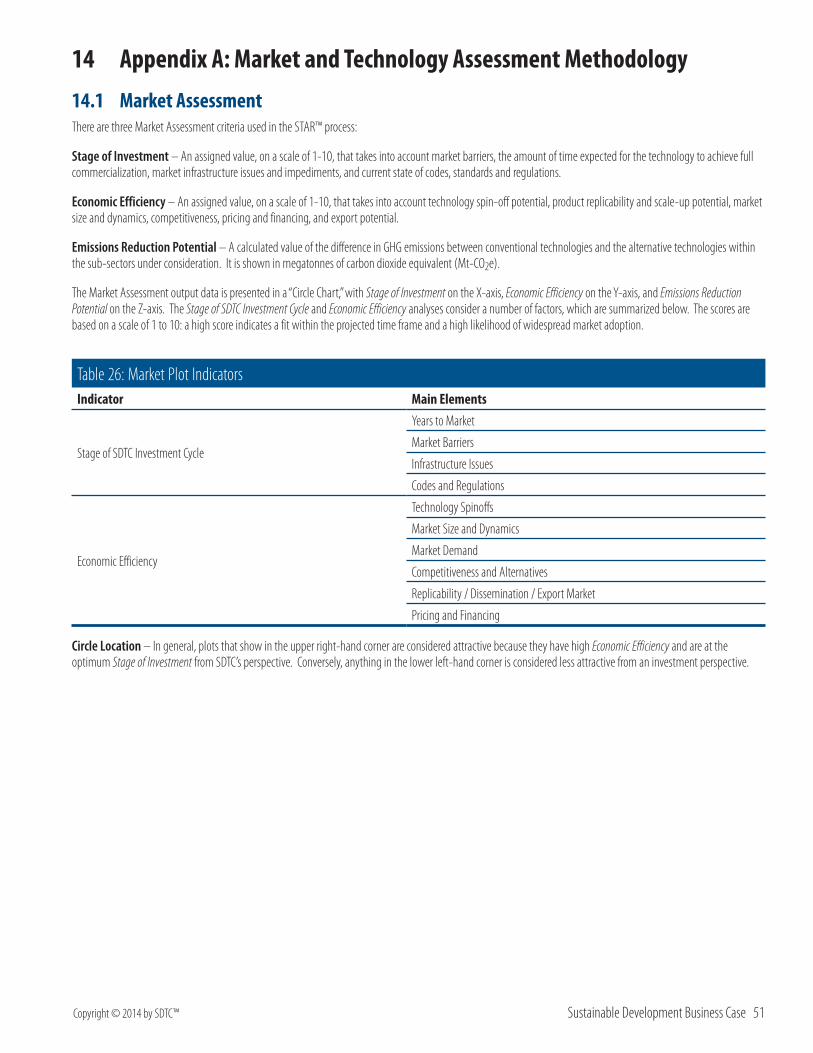
Copyright © 2014 by SDTC™ Sustainable Development Business Case 51
14 Appendix A: Market and Technology Assessment Methodology14.1 Market AssessmentThere are three Market Assessment criteria used in the STAR™ process:
Stage of Investment – An assigned value, on a scale of 1-10, that takes into account market barriers, the amount of time expected for the technology to achieve full commercialization, market infrastructure issues and impediments, and current state of codes, standards and regulations.
Economic Efficiency – An assigned value, on a scale of 1-10, that takes into account technology spin-off potential, product replicability and scale-up potential, market size and dynamics, competitiveness, pricing and financing, and export potential.
Emissions Reduction Potential – A calculated value of the difference in GHG emissions between conventional technologies and the alternative technologies within the sub-sectors under consideration. It is shown in megatonnes of carbon dioxide equivalent (Mt-CO2e).
The Market Assessment output data is presented in a “Circle Chart,” with Stage of Investment on the X-axis, Economic Efficiency on the Y-axis, and Emissions Reduction Potential on the Z-axis. The Stage of SDTC Investment Cycle and Economic Efficiency analyses consider a number of factors, which are summarized below. The scores are based on a scale of 1 to 10: a high score indicates a fit within the projected time frame and a high likelihood of widespread market adoption.
Table 26: Market Plot IndicatorsIndicator Main Elements
Stage of SDTC Investment Cycle
Years to Market
Market Barriers
Infrastructure Issues
Codes and Regulations
Economic Efficiency
Technology Spinoffs
Market Size and Dynamics
Market Demand
Competitiveness and Alternatives
Replicability / Dissemination / Export Market
Pricing and Financing
Circle Location – In general, plots that show in the upper right-hand corner are considered attractive because they have high Economic Efficiency and are at the optimum Stage of Investment from SDTC’s perspective. Conversely, anything in the lower left-hand corner is considered less attractive from an investment perspective.
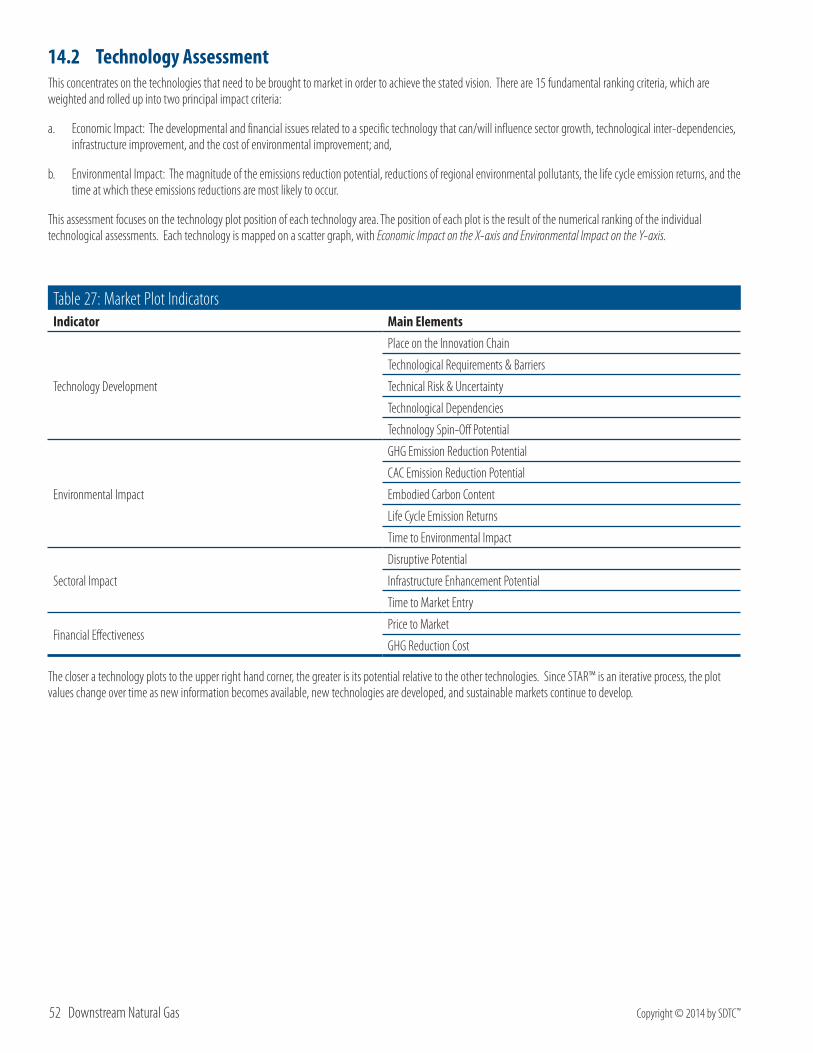
52 Downstream Natural Gas Copyright © 2014 by SDTC™
14.2 Technology AssessmentThis concentrates on the technologies that need to be brought to market in order to achieve the stated vision. There are 15 fundamental ranking criteria, which are weighted and rolled up into two principal impact criteria:
a. Economic Impact: The developmental and financial issues related to a specific technology that can/will influence sector growth, technological inter-dependencies, infrastructure improvement, and the cost of environmental improvement; and,
b. Environmental Impact: The magnitude of the emissions reduction potential, reductions of regional environmental pollutants, the life cycle emission returns, and the time at which these emissions reductions are most likely to occur.
This assessment focuses on the technology plot position of each technology area. The position of each plot is the result of the numerical ranking of the individual technological assessments. Each technology is mapped on a scatter graph, with Economic Impact on the X-axis and Environmental Impact on the Y-axis.
Table 27: Market Plot IndicatorsIndicator Main Elements
Technology Development
Place on the Innovation Chain
Technological Requirements & Barriers
Technical Risk & Uncertainty
Technological Dependencies
Technology Spin-Off Potential
Environmental Impact
GHG Emission Reduction Potential
CAC Emission Reduction Potential
Embodied Carbon Content
Life Cycle Emission Returns
Time to Environmental Impact
Sectoral Impact
Disruptive Potential
Infrastructure Enhancement Potential
Time to Market Entry
Financial EffectivenessPrice to Market
GHG Reduction Cost
The closer a technology plots to the upper right hand corner, the greater is its potential relative to the other technologies. Since STAR™ is an iterative process, the plot values change over time as new information becomes available, new technologies are developed, and sustainable markets continue to develop.
Copyright © 2014 by SDTC™ Sustainable Development Business Case 53
15 References1 Statistics Canada. (No Date). Table 128-0016 Supply and demand of primary and secondary energy in terajoules, annual (table). CANSIM.
http://www5.statcan.gc.ca/cansim/a26?lang=eng&retrLang=eng&id=1280016
2 Chart generated using data in CANSIM table 128-0016.
3 Statistics Canada. (No Date). Table 128-0016 Supply and demand of primary and secondary energy in terajoules, annual (table). CANSIM. http://www5.statcan.gc.ca/cansim/a26?lang=eng&retrLang=eng&id=1280016
4 Chart generated using data in CANSIM table 128-0016.
5 National Energy Board. (2013). Canadian Energy Overview 2012 – Energy Briefing Note. Available online: https://www.neb-one.gc.ca/clf-nsi/rnrgynfmtn/nrgyrprt/nrgyvrvw/cndnnrgyvrvw2012/cndnnrgyvrvw2012-eng.html
6 Statistics Canada. (No Date). Table 128-0016 Supply and demand of primary and secondary energy in terajoules, annual (table). CANSIM. http://www5.statcan.gc.ca/cansim/a26?lang=eng&retrLang=eng&id=1280016
7 Chart generated using data in CANSIM table 128-0016.
8 Statistics Canada. (No Date). Table 379-0031 Gross Domestic Product (GDP) at basic prices, by North American Industry Classification System (NAICS).CANSIM. Available online: http://www5.statcan.gc.ca/cansim/a26?lang=eng&retrLang=eng&id=3790031
9 National Energy Board. (2013). Canada’s Energy Future 2013 - Energy Supply and Demand Projections to 2035 - An Energy Market Assessment. Available online: http://www.neb-one.gc.ca/clf-nsi/rnrgynfmtn/nrgyrprt/nrgyftr/2013/nrgftr2013-eng.html
10 (S&T)2. (2013). GHGenius, Model Version 4.03a. (S&T)2 Consultants Inc. for Natural Resources Canada: Delta, British Columbia.
11 Environment Canada. (2013). National Inventory Report 1990-2011: Greenhouse Gas Sources and Sinks in Canada. Available online: http://unfccc.int/national_reports/annex_i_ghg_inventories/national_inventories_submissions/items/7383.php
12 Environment Canada. (2013). National Pollutant Release Inventory. Available online: http://www.ec.gc.ca/inrp-npri/
13 Natural Resources Canada. (2013). Energy Use Data Handbook 1990 to 2010. Available online: http://oee.nrcan.gc.ca/publications/statistics/handbook2010/handbook2013.pdf.
14 Statistics Canada. (2013). Households and the Environment: Energy Use 2011. Available online: http://www.statcan.gc.ca/pub/11-526-s/11-526-s2013002-eng.pdf
15 U.S. Energy Information Administration. (2013). Manufacturing Energy Consumption Survey (MECS), Table 5.2 Energy Consumed as a Fuel by End Use by Manufacturing Industry. Available online: http://www.eia.gov/consumption/manufacturing/data/2010/
16 Lifecycle (including production and vehicle use) GHG reductions were calculated using GHGenius v4.03a. Emission factors for off-road vehicles were not available; therefore, heavy duty trucking emission factors were assumed to be applicable.
17 Kelleher Robbins. (2013). Canadian Biogas Study Technical Document. Available online: http://www.biogasassociation.ca/bioExp/images/uploads/documents/2014/biogas_study/Canadian_Biogas_Study_Technical_Document_Dec_2013.pdf
18 Alberta Research Council and Canadian Gas Association. (2010). Potential Production of Methane from Canadian Wastes.
19 Calculated using GHGenius v4.03a.
20 IPCC, Task Force on National Greenhouse Gas Inventories. (No Date). Frequently Asked Questions. Available online: http://www.ipcc-nggip.iges.or.jp/faq/faq.html
21 Natural Resources Canada. An Action Plan for Growing District Energy Systems Across Canada. 2011. http://www.canurb.com/cui-publications/an-action-plan-for-growing-district-energy-systems-across-canada.html

54 Downstream Natural Gas Copyright © 2014 by SDTC™
Sustainable Development Technology Canada will act as the primary catalyst in building
a sustainable development technology infrastructure in Canada.
www.sdtc.ca