Embed Size (px)
Citation preview
Downside Risk and Corporate Policies: A Text-based Analysis
Doron Avramov Minwen Li Hao Wang*
ABSTRACT
This paper develops a text-based downside risk measure using corporate annual reports and
assesses its implications for corporate policies. Our measure is forward-looking and it
dynamically captures downside possibilities evolving from firm fundamentals. We show that
an increase in the text-based measure is followed by long-lasting diminishing leverage,
investment, R&D, and employment, while the implications of increasing return volatility are
insignificant. In addition, firms increase cash holdings and reduce dividends when either
volatility or our text measure rises. Overall, our proposed measure delivers robust and
persistent results consistent with economic theories and field surveys.
* Hebrew University of Jerusalem, Tsinghua University, and Tsinghua University, respectively. Avramov can
be reached at [email protected], Li can be reached at [email protected], and Wang can
be reached at [email protected]. We thank Jeawon Choi, Ran Duchin, Campbell Harvey, Gerald
Hoberg, Si Li, Nagpurnanand Prabhala, Gordon Phillips, Yongxiang Wang, Xuan Tian, Jianfeng Yu, Lihong
Zhang, Hao Zhou, and seminar participants at Tsinghua Finance Group Workshop 2013, PBC School of
Finance at Tsinghua University, Xiamen University, Peking University, Summer Institute of Finance 2015 by
CKGSB, Shanghai Advanced Institute of Finance (SAIF) and China International Conference in Finance
(2016) for their comments. Hao Wang acknowledges financial support from the National Science Foundation
of China (Grant No. 71272023). Minwen Li acknowledges financial support from the National Science
Foundation of China (Grant No. 71402078).

1
1. Introduction
This paper develops a text-based downside risk measure and studies, in a unified framework, how
capital structure, investment, R&D, employment, cash holdings, dividend payouts, and stock
repurchases adjust to changing business conditions. We use computer linguistics to analyze 76,676
annual reports covering 10,940 firms from January 1994 to September 2015. We construct a dictionary
of 84 keywords that reflect downside possibilities characterizing firms’ fundamentals (e.g.,
“competition”, “loss”, “downturn”, and “downgrade”). We define a risk level measure as the ratio of
downside risk-relevant keywords to total word usage in a report, and a risk shock as the change in such
ratio from the previous year.
The newly proposed measure displays several important merits. First, it is forward-looking in
capturing perceived business conditions, unlike existing proxies such as earnings volatility that reflects
historical outcomes. Second, the text-based measure is constructed from keywords that reflect
downside possibilities, while the existing risk measures are derived from second moments capturing
both upside and downside prospects.1 As Bloom (2009) states, first and second moment shocks may
exert different implications for investment and employment. In particular, second moment shocks may
cause management to adopt a “wait-and-see” strategy rather than comprehensive adjustments of
corporate policies implied by first moment shocks. Indeed, the text-based approach allows one to
measure downside risk in a forward-looking manner, thereby expanding our understanding of corporate
risk and opening up new research opportunities.2
Next, the text is extracted from annual report descriptions that must be representative and
meaningful in order to meet regulatory standards, and it integrates risk discussions about corporate
fundamentals, including competition, credit risk, operational risk, and downturn. Therefore, the
1 According to Merriam-Webster dictionary’s definition of risk: "Risk is the possibility that something bad or unpleasant (such as an
injury or a loss) will happen". Our focus on the downside feature of corporate risk, therefore, is consistent with the dictionary definition. 2 We present a detailed discussion of the relevant literature on risk and corporate policies and hypothesis development in Section 2.

2
text-based measure can be less prone to investor clienteles, behavioral biases, short-term market
frictions, and investor sentiment.3 Finally, the correlation between the text-based risk measure and
stock return volatility (earnings volatility) is significant but only at 7.76% (5.42%), implying that the
text-based measure is potentially informative of downside risk uncaptured by existing proxies.
The new measure delivers intuitive results: the financial, insurance, and real estate industries
display the highest risk exposure during the sample period, while agriculture and utility firms exhibit
the lowest risk. At the firm level, less profitable firms with lower credit ratings and less tangible assets
are associated with higher level of downside risk. The largest risk shocks are recorded in the 2008
financial crisis. The textual analysis also helps identify other major shocks faced by the firms, such as
demand shocks, manufacturing overcapacity, industry consolidation (M&As), and increasing volatility
in product and raw material prices (see examples of the largest downside risk shocks in Table 2). While
such results could be expected, we show below that the text-based measure offers new insights in
making a coherent link between changing risk and corporate policies.
In the first place, the coefficient estimates of risk shocks are strongly statistically significant for
all corporate policies examined in the context: risk shocks are followed by diminishing leverage,
capital expenditure, R&D, employment, and dividend payouts and stock repurchases, along with
increasing cash holdings. Such strong significance is recorded after controlling for year and industry
fixed effects and then implementing robust standard errors clustered at both the firm and year levels.
The economic significance of policy adjustments also stands out. Controlling for previously
identified determinants and changes in return volatility, we show that about 12.21%, 16.96%, 7.70%,
6.87%, and 98% of the annual median changes in the book leverage ratio, capital expenditure,
3 Return volatility often reflects factors unrelated to changing fundamentals, such as investor clientele (e.g., investor horizon as in Cella,
Ellul, and Giannetti, 2013; investor preferences as in Baker and Wurgler, 2004), behavioral trading patterns (e.g., herding,
overconfidence, and loss aversion as in Scharfstein and Stein, 1990; Barberis and Thaler, 2003), short-term market frictions (e.g., market
illiquidity as in Amihud and Mendelson, 1986; Pastor and Stambaugh, 2003), and investor sentiment (Baker and Wulger, 2007; Da,
Engelberg, and Gao, 2015; De Long et al., 1990; Shiller, 1981). Market-based measures are also likely to be the equilibrium of multiple
economic forces, thereby casting concerns raised by Qiu and Welch (2006): “How does one test a theory that is about from inputs to
outputs with an output measure?”

3
employment, R&D, and cash holdings, respectively, emerge following a median risk shock. Further, as
the risk shock exceeds the sample median by one standard deviation, the likelihood of dividend
omission advances by 12.36%, and the likelihood of large stock repurchases (over 1% of total assets)
diminishes by 8.94%.
In contrast, the relations between changes in return volatility and capital structure, investment,
R&D, and employment decisions are mostly insignificant, adding to the existing mixed evidence
related to such corporate decisions.4 However, consistent with Hoberg and Prabhala (2009), Hoberg,
Phillips, and Prabhala (2014), and Gao, Hartford, and Li (2014), we find that firms significantly
increase cash holdings and cut dividends following rising return volatility.
The overall implications of downside risk shocks for corporate policies are persistent. Capital
structure, capital expenditure, R&D, employment, and cash holding adjustments could last over three
years following the shocks, while adjustments in dividends and stock repurchases last over one to two
years. In that perspective, the firm-level evidence here complements the findings in Bloom (2009) that
first-moment shocks exert long-lasting impact on economy-wide investment and employment.
Furthermore, we find that firms take on defensive actions when downside risk rises and reverse these
policies when risk resolves. The evidence is consistent for majority of the corporate policies examined,5
suggesting that the text-based downside risk measure could capture the dynamics (both the
deterioration and resolution) of business conditions.
We find that firm characteristics play a remarkable role in shaping the relations between risk
shocks and corporate policies. Essentially, small, non-profitable, and low credit rating firms are more
responsive to risk shocks. The presence of a median risk shock is associated with 55.61% (11.76%) of
the median change in leverage (percentage change in employment) for small firms, but only 6.42%
4As an example, Harris and Raviv (1991) conclude in their comprehensive survey that the relation between corporate risk exposure and
capital structure is inconclusive. In the same vein, Frank and Goyal (2009) find that stock return volatility constitutes only a “minor
factor” in explaining book leverage, and Panousi and Papanikolaou (2012) show that the risk-investment relation is economically weak. 5 The only exception exists for dividend and stock repurchase policy, where we find that firms tend to reduce their dividend and
repurchases when downside risk arises, but they may not immediately increase their dividend and repurchases when such risk resolves.
4
(5.56%) for large firms. Firms with negative earnings react more prominently to risk shocks with
employment and dividend payout reductions. High credit risk firms are more likely to terminate
dividends and are less likely to repurchase stocks after experiencing risk shocks.
Our evidence is robust to a comprehensive battery of robustness checks. In the first place, we
account for the potential effects of CEO traits on their risk perceptions and writing styles, as Graham,
Harvey, and Puri (2013) and others show that such traits also affect corporate decisions. Second, we
account for potential implications of hedging activities for the relation between risk shocks and
corporate decisions. Indeed, while hedging activities affect a wide range of decisions, such as leverage,
investment, cash holdings, and payouts, both hedging and non-hedging firms significantly respond to
risk shocks. Third, while some of the largest risk shocks appear for financial firms during the global
financial crisis, our results are robust to excluding financial firms as well as robust to excluding the
2007-2008 financial crises period. Fourth, our focus is on providing a text-based downside risk
measure that can be used to predict the dynamics of a variety of corporate policies, rather than making
casual claims. We acknowledge the potential endogeneity issue in our study and show that our results
are robust to using a matching-firm approach based on firm size, industry and profitability.
As some 10-K sections may be boilerplate or not forward-looking we consider alternative
downside risk measures based on the Item 7 and 7a (Managerial Discussion and Analysis), Item
1(Business), and Item 1A (Risk Factor), respectively. The results here are qualitatively similar. We also
consider an alternative dictionary based on the list of negative words in Loughran and McDonald
(2011), and find that our measure yields stronger and more coherent results in predicting corporate
decisions.
In sum, our paper adds to the literature on risk and corporate polices. By constructing a
forward-looking downside risk measure based on firm fundamentals, we obtain strikingly robust and
persistent empirical evidence consistent with economic theories and comprehensive surveys in the
field. Our new measure particularly outperforms the market-based return volatility in predicting

5
longer-term leverage and investment related decisions, where existing empirical evidence is quite
weak. Our findings are consistent with the idea that corporations take into account downside risk
arising firm fundamentals, rather than short-term market factors such as investor sentiment, short-term
market frictions, and behavioral trading patterns, in making leverage and investment decisions.
A large body of work using text analysis is tightly related to ours. Antweiler and Frank (2004)
employ Naive Bayes algorithms and find that internet stock messages predict market volatility. Li
(2006) develops textual measures of corporate risk and shows that the change in risk exposure predicts
future stock return, volatility, and trading volume. Tetlock (2007) and Tetlock, Saar-Tsechansky, and
Macskassy (2008) employ Harvard psychosocial dictionary to find that the tones of Wall Street Journal
articles and corporate annual reports predict future stock returns and earnings. Loughran and McDonald
(2011) construct their own dictionary of negative tone words, and relate them to stock returns, trading
volume, and unexpected earnings. Loughran and McDonald (2013) develop a text-based uncertainty
measure, and examine its implications on post-IPO stock performance. Hoberg, Phillips, and Prabhala
(2014) develop a textual measure of product market fluidity as a proxy for product market risk, and
relate it to dividend payouts, share repurchases, and cash holdings. Hoberg and Maksimovic (2015) and
Bodnaruk, Loughran and Mcdonald (2013) innovate textual measures of financial constraints.
Our research design differs from the above stream of textual analysis literature in two important
ways. First, we study an ecosystem of real corporate decisions such as investment and capital structure,
while the existing literature generally focuses on earnings and stock market performance (e.g.,
Antweiler and Frank, 2004; Li, 2006; Tetlcok, 2007; Kravet and Muslu, 2013; Loughran and Mcdonald,
2011, 2013).6 Second, in constructing the downside risk measure, our keywords are not limited to the
word “risk” per se (Li, 2006), words with negative tones (Loughran and McDonald, 2013), or words
characterizing competition (Li, Lundholm and Minnis, 2013). Rather, our dictionary aims to capture a
6 Hoberg, Phillips, and Prabhala (2014) , Hoberg and Maksimovic (2015) and Bodnaruk, Loughran, and McDonald (2015) belong to the
exceptions that also study multiple corporate decisions. Specifically, Hoberg, Phillips, and Prabhala (2014) and Bodnaruk, Loughran, and
McDonald (2015) examine different aspects of corporate payout policies, while Hoberg and Maksimovic (2015) study corporate
investment and SEO issuance.

6
comprehensive set of well-documented risk factors, for example, “downgrade”, “downturn”, and
“crisis”. Compared with Hoberg, Phillips and Prabhala (2014), our risk measure not only reflect
competitive threats in product development, but also capture risk from macro conditions, financial
market, counterparties, and day-to-day operations.
2. Related Literature and Hypothesis Development
A large body of corporate finance theory (e.g., Leland, 1994; Hennessy, Levy, and Whited, 2007;
Bolton, Chen, and Wang, 2011, 2013) and field surveys (e.g., Brav, Graham, Harvey, and Michaely,
2005; Lintner, 1956) suggests that firms adopt more conservative investment and financial policies in
response to increasing risk exposure. We discuss the existing literature and develop our main
hypotheses regarding each corporate policy below.
The trade-off theory (Modigliani and Miller, 1958; Merton, 1974) asserts that firms choose
capital structure to balance the benefits of debt financing and the direct and indirect costs associated
with financial distress. Risk shocks essentially lead to higher default probability and thus to increasing
borrowing costs, which could induce corporations to reduce debt. In addition, more volatile cash flows
reduce the likelihood that tax shields will be fully utilized. Thus, risk shocks are likely to exert an
adverse effect on leverage based on the trade-off theory.
The existing empirical evidence on risk and capital structure, however, is mixed. A large number
of past studies focusing on earnings volatility (e.g., Titman and Wessels, 1988; Kester, 1986) or return
volatility (e.g., Welch, 2004; Frank and Goyal, 2009) document a weak relation between risk and
leverage ratio. Harris and Raviv (1991) conclude in their comprehensive survey that the relation
between corporate risk exposure and capital structure is inconclusive. Frank and Goyal (2009) also find
that stock return volatility constitutes only a “minor factor” in explaining book leverage. Based on this
literature, we now formulate our first hypothesis according to the prediction of the trade-off theory.
Hypothesis 1. All else equal, firms should decrease their leverage following risk shocks.

7
A large body of theoretical literature examines the relation between uncertainty and corporate
investment using real option models. As an example, Bolton, Chen, and Wang (2011, 2013) show
theoretically that corporate investment will be reduced when uncertainty rises. The overall theoretical
conclusions, however, are ambiguous as the sign may depend on the shape of adjustment costs and
other factors. Empirical findings on the sign and significance of the investment-stock return volatility
relation are also sensitive to the estimation method.7 Further, as noted in the introduction, Bloom
(2009) models the difference between first and second moment shocks and predicts that first moment
shocks lead to long-lasting reductions in investment and employment, while second moment shocks
may cause management to adopt a “wait-and-see” strategy. We thereby form our second hypothesis
based on the theoretical models by Bolton, Chen, and Wang (2011, 2013) and Bloom (2009).
Hypothesis 2. All else equal, firms should decrease their investment following risk shocks.
Past work shows that firms primarily hold cash for precautionary motives to hedge against
adverse risk shocks. For instance, Bates, Kahle, and Stulz (2009) attribute the rising cash holdings of
US manufacturing firms to increasing cash flow risk. Hoberg, Phillips, and Prabhala (2014) and Gao,
Harford, and Li (2014), among other studies, find that cash holdings of both public and private firms in
the U.S. are positively related to their risk exposure. This leads to our third hypothesis.
Hypothesis 3. All else equal, firms should increase their cash holdings following risk shocks.
Classic field surveys (Lintner, 1956; Brav, Graham, Harvey, and Michaely, 2005) indicate that
risk is an important consideration for managers in making payout decisions. Empirical evidence
generally supports this view. For example, Hoberg and Prabhala (2009) and Hoberg, Phillips, and
Prabhala (2014) show that firms with higher risk exposure are associated with less dividend payouts
and stock repurchases. Bliss, Cheng, and Denis (2015) also document significant reductions in
dividends and repurchases during the global financial crisis. Floyd, Li, and Skinner (2015), however,
find that banks have a higher propensity to pay dividends and resist cutting dividends as the 2007–2008
7 Please see Panousi and Papanikolaou (2012) for a comprehensive review of the theoretical and empirical literature.

8
financial crisis begins, implying that banks use dividends to signal financial strength. Since the
majority of the literature finds a negative relation between risk and payout policy, we form the
following hypothesis on adjustments in payout policies.
Hypothesis 4. All else equal, firms should reduce their dividends and stock repurchases following
risk shocks.
Finally, different types of firms may respond differently to risk shocks. For one, it is relatively
easier for large and low credit risk firms to raise external capital when facing such shocks. Moreover,
profitable firms can generate capital internally, making them more capable of weathering through
shocks. As in Alfaro, Bloom, and Lin (2016)’s model, real and financial frictions amplify the impact of
uncertainty shocks. Such frictions are more binding for small, non-profitable, and high credit risk firms.
Hypothesis 5. All else equal, small, non-profitable, and high credit risk firms should be more
responsive to risk shocks.
3. Measuring Downside Risk
3.1. Textual Analysis
We develop a web crawling program to collect 10-K corporate filings from the Security and
Exchange Commission’s EDGAR website. Our sample spans the January 1994 through September
2015 period. Merging the corporate filings with CRSP and COMPUSTAT databases leaves us with
76,676 filings corresponding to 10,940 distinct firms. To analyze the textual content of the filings, we
delete numbers, tables, graphs, propositions, articles, and pronouns.8 We further decompose the texts
into word stems, hence, our analysis is based on the underlying meaning of words regardless of their
different tenses or formats.
We build upon existing textual analysis literature (Li; 2006; Loughran and McDonald, 2011,
2013; Li, Lundholm and Minnis, 2013) to construct a dictionary of keywords characterizing managerial
8 Propositions, articles and pronouns are considered non-meaningful words in standard textual analysis.
9
perception of downside risk regarding firm fundamentals. The dictionary is composed of 84 downside
risk-related keywords (see Appendix 1A for the key word stems and keywords and 1B for examples of
sentences from the annual reports containing each key word stem).
Our keyword list starts with common words with negative tones to highlight the downside feature
of corporate risk. In particular, we borrow from the negative word list in Loughran and McDonald
(2011, 2013) and select among them those that appear most frequently in our sample.9 Next, our
keywords include various formats of the word "risk" per se (e.g., “risky”, “risks”) as in Li (2006). To
make the measure comprehensive and informative,10 we further include keywords describing specific
types of firm risk, such as “competition”, “downgrade”, “downturn”, “crisis”, all of which are well
documented risk characteristics in the finance literature.11
As noted in the introduction, we define risk level as the ratio of downside risk-relevant keywords
to total words in those reports (excluding propositions, articles, and pronouns). Risk shock is the annual
change in the risk level. We also consider two dummy versions of risk shocks. A dummy for rising risk
is equal to one when a firm experiences rising risk in a magnitude larger than the median increase in
risk and zero otherwise. A dummy for diminishing risk is equal to one when a firm experiences
decreasing risk in a magnitude larger than the median decrease in risk and zero otherwise.
3.2. Distribution by Industry and Firm Characteristics
Panel A of Table 1 presents the distribution of average risk levels by industry groups. We divide
the sample into ten broad industry groups based on the SIC codes and compute the average downside
9 For example, our dictionary includes words such as “ loss” and “losses”, which are also the most frequently occurring negative words in
the sample of corporate reports in Loughran and McDonald (2011). 10 The word "risk" itself is subject to the criticism of being boilerplate (Kravet and Muslu, 2013). 11 We start with listing word stems that appear most frequently (i.e., more than ten times) in the full sample of 10-K filings, and then
select from them the keywords describing specific types of firm risk in the following way: First, each researcher is assigned to read 100
randomly selected 10-K reports representing different industries and years. Every researcher judges independently whether a specific
word stem reflects a type of firm risk in the context. A word is included in the preliminary dictionary if and only if all three researchers
agree so based on their independent judgment. Words in the preliminary dictionary are then checked for consistency with their definitions
in the Merriam-Webster dictionary. Further, we solicit opinions from other financial researchers and professionals, and eliminate words
that might be controversial. For example, words such as “mergers”, “acquisitions” and “fluctuate” are dropped from our dictionary as
these words might not necessarily convey downside possibilities. In general, our methodology tilts toward the conservative side in
developing the dictionaries of risk-relevant words.
10
risk for all groups. Risk levels are typically different across industries. Finance, insurance, and real
estate groups exhibit the highest risk, consistent with the notion that the financial sector plays a crucial
role in consolidating and managing risks emerging from real activities. In contrast, firms in the utility
and agriculture industry are associated with lower level of risks due to stringent regulations and various
subsidy and insurance programs.
Insert Table 1 here
Panel B of Table 1 presents the distribution of the text-based risk measure by firm characteristics
including credit ratings, profitability (EBIT/Asset), tangibility, and existing risk measures. We find that
less profitable firms face higher downside risk levels, consistent with the notion that such firms are
more likely to be financially constrained and thus are prone to liquidity risk related to external
financing. Similarly, firms with low credit ratings and less tangible assets have higher financing costs
in the external capital markets and thus face higher level of downside risk.
3.3. Examples of Large Downside Risk Shocks
To better comprehend the proposed risk measure, Table 2 lists examples of firms with the largest
downside risk shock. Our results highlight the severe impact of the 2007-2008 global financial crisis, as
11 out of the 15 extreme risk shocks are attributable to that period. In particular, seven commercial
banks and insurance companies (e.g., First Financial and BB&T) faced substantial increases in credit
risk and liquidity risk. Construction, TV and radio broadcast, and hotel industries were also challenged
by severe liquidity concerns, in addition to sharp drop in their product demand (e.g., the broadcast
companies were impacted by diminishing advertising expenses, especially by the financial sector).
Other sources of extreme risk shocks include large demand shocks from downstream industry, industry
consolidation, manufacturing overcapacity, and increasing volatility in product and raw material prices.
Insert Table 2 here
While extreme shocks seem to concentrate in the financial industry and during the crisis period,

11
we show, in Section 5, that our main results are not driven by financial firms or by the global financial
crisis. Particularly, similar results obtain as we exclude financial firms from our sample, when we
restrict our sample to manufacturing firms, or when we exclude the years of 2007–2008.
4. Data and Summary Statistics
Our sample consists of 76,676 observations of risk shocks, involving 10,940 distinct firms
spanning 68 two-digit SIC industries. Policy variables, i.e., leverage, capital expenditure, employment,
R&D, cash holdings, dividend payouts, and stock repurchases, are from COMPUSTAT. Firm-level
control variables, all of which are based on past related work, such as stock returns, credit ratings, and
sales growth, are from CRSP and COMPUSTAT. The macro control variables including
option-implied volatility (VIX), industrial production growth, and constant one-year maturity Treasury
bill yields are from the website of the Federal Reserve Bank of St. Louis.
We describe the construction of data, both corporate policies and control variables at the firm and
economy-wide levels, in Appendix 2. Detailed variable definitions are presented in Appendix 3. The
descriptive statistics of key variables are reported in Table 3. All continuous variables, except for
macro variables, are winsorized at the 1% and 99% level. The median and standard deviation of book
leverage are 55.03% and 27.45%, respectively. The median active change in book leverage is 0.12%.
The median annual percentage changes in capital expenditure, employment, R&D and advertising
expenses are 1.77%, 1.35%, 2.41%, and 3.95%, respectively.
Insert Table 3 here
The median change in the ratio of cash to assets is -0.03%, with a standard deviation of 8.09%.
About 1%–2% of the sample firms initiate or omit dividends, while 28% of the firms increase
dividends and 9% of the firms shrink dividends. Further, 32% of the firms are engaged in stock
repurchase whose value exceeds 1% of total assets, consistent with the recognition that stock
repurchases have become a more popular form of payouts (e.g., Bliss, Cheng and Denis, 2015; Floyd,

12
Li and Skinner, 2015). Overall, statistics of our key variables are similar to those reported in past work.
5. The Empirical Evidence: Changing Downside Risk and Adjustments in Corporate
Policies
This section examines adjustments in leverage, investment, employment, R&D, cash holdings, and
payout policies in response to risk shocks. For leverage, investment, employment, R&D, and cash
holdings, we apply the OLS panel regression analysis, while we apply logistic panel regression for
policies characterized by dummy variables including dividend payouts and repurchases. The policy
regression is formulated as
△POLICYi,t+1 = α + β1RISKSHOCKi,t + βjCONTROLi,j,t + εi,t, (1)
where i is a firm-specific subscript, △POLICYi,t+1 represents future annual change in various
corporate policies, and RISKSHOCKi,t denotes risk shocks. Control variables for each distinct policy
are listed in the data section. Since managers consider different factors in making different corporate
decisions, we follow existing work to control for a unique set of control variables in examining each
type of corporate policy. As such, the number of observations varies across corporate decisions due to
different numbers of controls employed. We further control for year and industry fixed effects in all
regressions. Since large risk shocks can reflect changes in aggregate fundamentals, standard errors may
be correlated across firms. We therefore compute standard errors clustered by both firm and year
throughout the paper to address that concern (Peterson, 2009).
5.1. Capital Structure
Table 4 reports the results on adjustments in capital structure (Hypothesis 1).12 We examine the
impact of risk shocks on the book leverage ratio (Panel A), as well as debt and equity adjustments
12 Note that the number of observations drops substantially from 76.676 in the full sample (Table 3) to 22,311 in the main regressions
(Table 4). The reasons are twofold: first, we lose a large number of observations due to lack of corporate information from the previous
year. Therefore, we cannot compute the annual change in these variables. In addition, there are many missing values regarding one control
variable: Financial Deficit.

13
(Panel B). Risk shocks are followed by a significant downward adjustment in leverage, confirming our
first hypothesis. The impact of risk shocks on leverage is economically significant, as 12.21% of the
median absolute change in leverage can be explained by the presence of a median risk shock. More
strikingly, a one standard deviation increase in risk shock is associated with a drop in the book leverage
ratio in a magnitude of 1.5 times of the average annual change in leverage in our sample.
Insert Table 4 here
The statistical and economic power of our text-based risk measure in predicting leverage
adjustments is considerably stronger than that of change in stock return volatility, as none of the
coefficient estimates of change in volatility are statistically significant. As noted before, a large number
of past studies focusing on earnings volatility (e.g., Titman and Wessels, 1988; Kester, 1986) or return
volatility (e.g., Welch, 2004; Frank and Goyal, 2009) also document a weak relation between risk and
leverage ratio, further highlighting the predictive power of our new text-based measure.13
The coefficient estimates of firm characteristics, such as leverage, size, ROA, are consistent with
past work. Large firms are more likely to increase their leverage (e.g., Frank and Goyal, 2009;
Faulkender and Petersen, 2006). In addition, firms with higher equity returns are associated with
reducing leverage (e.g., Welch, 2004; Faulkender and Petersen, 2006). The leverage ratio is negatively
correlated with future change in leverage, confirming that leverage ratios are mean-reverting (Fama and
French, 2002; Baker and Wurgler, 2002; Leary and Roberts, 2005).
We then decompose the change in the book leverage ratio into change in debt and change in
equity, and analyze the effects of risk shocks on these two components. Panel B of Table 4 reports the
results. Risk shocks significantly and negatively affect subsequent changes in debt. Furthermore, such
changes are symmetric in response to rising versus resolving risk shocks. The absolute values of
coefficient estimates and significance level are similar, indicating that the economic impact of rising
13 Bradley, Jarrell, and Kim (1984) and Friend and Long (1988) document a negative relation between earnings volatility and leverage.
These papers focus on the cross-sectional effects (i.e., investigating the relation of contemporary risk level to leverage ratio), while our
paper analyzes changes in leverage after experiencing risk shocks.

14
and resolving shocks is similar. On the other hand, risk shocks are not significantly correlated with
subsequent change in equity, suggesting that their impact on leverage is attributable to the debt
channel.
In sum, firms substantially reduce debt and leverage when risk increases, and correspondingly
increase debt and leverage ratio when risk resolves. Meanwhile, firms in general tend not to
significantly change their equity level when they face risk shocks. Our evidence here is largely
consistent with the trade-off theory.14
5.2. Investment decisions
In this section, we employ the text-based risk shock measure to investigate the relation between
risk shock and adjustments in a wide range of investment decisions including capital expenditure,
employment, and R&D decisions (Hypothesis 2). Table 5 reports the relation between risk shocks and
adjustments in capital expenditure in Panel A. Consistent with Hypothesis 2, risk shocks are negatively
correlated with future changes in capital expenditure. The reduction in capital expenditure following a
median risk shock accounts for 16.96% of the median annual percentage change in capital expenditure,
while changes in the conventional volatility-based risk measure cannot significantly explain
adjustments in capital expenditure. Furthermore, a one standard deviation increase in risk shock is
associated with a decrease in investment with a magnitude of 9.77% of the sample average. The overall
negative relation between risk shocks and capital expenditure displays symmetric responses to rising
versus resolving shocks.
Insert Table 5 here
Employment can be regarded as investment in human capital. Panel A also reports adjustments of
employment decisions. Experiencing risk shocks, firms lower not only their capital expenditure but
14 In unreported analysis we find that the negative relation between risk shocks and firm debt is likely due to demand-side factors. In
particular, the negative effect of risk shocks on debt is largely concentrated among large, profitable, and investment grade firms, all of
which are mostly financially flexible.

15
also employment. A median level of risk shock is associated with a 7.77% of median annual change in
employment. More strikingly, a one standard deviation increase in risk shock is associated with a drop
in employment in a magnitude of 12.27% of the sample average. In comparison, the volatility-based
measure is statistically insignificant after controlling for the continuous measure of risk shocks.15 The
overall impact of our risk shock measure on employment is symmetric for rising versus resolving
shocks.
While R&D expenses may not yield immediate profitability, they are crucial for innovation and
long-term growth prospects. R&D projects exhibit higher probability of failure and their ultimate
outcome is largely uncertain. To obtain a more complete outlook of corporate investment, we examine
the impact of risk shocks on R&D as measured by R&D expenses and advertising expenses,
respectively, in Panel B. We include advertising expenses because it is shown to be related to product
development and R&D investment by previous studies. In addition, data on advertising expenses
involve less missing observations.
Our results reveal that R&D and advertising expenses significantly decrease upon experiencing
risk shocks. The economic impact is as follows: a median risk shock is associated with a 6.87% median
change in R&D expenses. Alternatively, a one standard deviation increase in risk shock implies a drop
in R&D in a magnitude of 30.25% of the sample average. Firms also respond symmetrically to rising
versus resolving shocks. They increase their R&D when risk rises, and diminish their R&D when risk
resolves.
5.3. Cash Holdings
In this section, we test Hypothesis 3. Table 6 reports the results. A median risk shock explains
almost 98% of the median annual change in cash-to-assets ratio during the sample period. Meanwhile,
a one standard deviation increase in risk shock is associated with an increase in cash-to-assets ratio in a
15 Economically, a median change in return volatility leads to a 0.97% of median annual change in employment.

16
magnitude of 63.24% of the sample average. That is consistent with Opler et al. (1999) and Bates,
Kahle, and Stulz (2009), who show that the ratio of cash to total non-cash assets is higher for firms
with riskier cash flows.
Insert Table 6 here
Economic implications of change in volatility on cash holdings are smaller even when the
relation between change in volatility and cash holdings is statistically significant. To illustrate, a
median risk shock explains 28.39% of the median change in the cash-to-asset ratio. Consistent with
previous studies, large firms with more net working capital tend to increase their cash holdings. In
contrast, firms with higher level of cash or with large increase in cash-to-asset ratio are more likely to
reduce subsequent cash holdings. Analyzing rising versus resolving shocks reveals symmetric
responses. Increasing risk leads to increasing cash holdings and vice versa.
5.4. Payout Policy
In this section, we test Hypothesis 4 by comprehensively examining dividend payout policies,
including dividend initiations, omissions, increases, and decreases, as well as share repurchases,
following risk shocks.
Table 7 reports the results on dividends, while Table 8 focuses on repurchase decisions. Panel A
of Table 7 presents the logistic regressions where the dependent variable is a dummy variable reflecting
dividend initiation, dividend omission, dividend increase, and dividend decrease, respectively. The
evidence shows that risk shocks are positively and significantly correlated with dividend omission and
decrease, and negatively correlated with dividend initiation and increase. As the risk shock increases by
one standard deviation above the sample mean, there are 12.36% and 10.34% increases in the
likelihood of dividend omission and dividend decrease, respectively. Such increases in risk shocks are
also associated with 12.86% and 4.62% decreases in the likelihood of dividend initiation and dividend
increase, respectively.

17
Insert Table 7 here
It should be noted that the change in volatility is also statistically significant in predicting
dividend policies, and it is of similar economic magnitude to our text-based measure. For example,
increasing the annual stock return volatility by one standard deviation above the sample mean leads to a
15.46% decrease in the propensity of dividend initiation. Taking together, we find that stock return
volatility has better predictive power in explaining dividend policies than investment and other policies,
suggesting that dividend policies are likely to be affected by market-wide factors along with firm level
fundamentals.
Panels B examines whether rising and resolving shocks affect dividend policy in the same
manner. Our results show that firms respond to rising risk shocks by substantially adjusting dividend
policy along multiple dimensions. In particular, dividend-paying firms are less likely to increase
dividends. Some of them may choose to moderately reduce dividend payouts, while others dramatically
terminate dividend payouts. On the other hand, when risk shocks resolve, dividend-paying firms may
not immediately increase dividends.
Share repurchases is as an alternative way to pay dividends. Jagannathan, Stephens, and
Weisbach (2000) and Guay and Harford (2000) find that repurchases is used to distribute cash flow
shocks that are primarily transient, while dividend changes typically follow cash flow shocks with a
relatively large permanent component. Table 8 reports the results on stock repurchases.
Insert Table 8 here
The impact of risk shocks on share repurchases is quite similar to that on dividend payouts,
suggesting that our text-based risk shock measure captures both permanent and transient component of
cash flow shocks. First, we show that risk shocks are followed by a significant reduction in the
propensity of large stock repurchases. Particularly, a one standard deviation increase in the risk shock
correlates with an 8.94% decrease in the probability of large stock repurchases. Moreover, the net value
of repurchase is negatively related to risk shocks. Net stock repurchases decreases in the magnitude of
18
0.39 million following a median risk shock, while the median change in the net repurchases is only
0.03 million in the full sample. In contrast, change in stock return volatility cannot significantly predict
either net repurchases or the likelihood of large repurchases. Our results also reveal that firms adjust
repurchase policies upon facing rising risk shocks but may not reverse these policies when risk shocks
resolve.
Our empirical results on payout policies are largely consistent with the idea that an increase in
risk increases the precautionary demand for cash. Thus, managers, being characterized as conservative
in field surveys (Lintner, 1956; Brav, Graham, Harvey, and Michaely, 2005), would reduce payouts
and retain cash for future investment. In the next section (Table 9), we further show that the negative
relation between risk shocks and payouts is largely concentrated among negative earning and low credit
rating firms, all of which are more prone to the adverse impact of risk shocks.
5.5. Interaction with Firm Characteristics
In order to test Hypothesis 5, we employ OLS and logit regressions to examine how firm size,
profitability, and credit conditions interact with the impact of downside risk shocks on the various
corporate policies examined earlier. We use the following specification.
△POLICYi,t+1=α+β1RISKSHOCKi,t+β2RISKSHOCKi,t x FIRMDUMMYi,t +
β3 FIRMDUMMYi,t +βjCONTROLi,j,t + εi,t (2)
The additional explanatory variables here are the interaction terms between risk shocks and
dummy versions of firm size, profitability, and credit ratings, and the standalone variables of firm
dummies. In particular, FirmDummy equals one if the firm's assets are larger than the sample median, if
the firm's earning (EBIT) is negative, or if the firm's S&P long term bond rating is higher than or equal
to BBB. That dummy variable equals zero otherwise. For each policy examined, we use the same
control variables as in previous analyses, except that in regressions related to firm size, we drop log
sales as the control variable to avoid the potential collinearity issue between log sales and the dummy
19
variable of firm size.
Table 9 reports the results. The dependent variables are change in the book leverage ratio (Panel
A), percentage change in capital expenditure, employment and R&D (Panel B), change in cash-to-asset
ratio (Panel C), dividend payout dummy (Panel D), and repurchase dummy variable (Panel E).
Insert Table 9 here
Size Effects. We find that small firms reduce leverage to a greater degree in the presence of risk
shocks. The coefficient of the interaction term between risk shock and Large Firms Dummy is 1.915,
with a t-statistics of 2.44, indicating that the presence of a median risk shock explains 55.61% of the
median absolute change in leverage for small firms, but only 6.42% for large firms.
Smaller firms are also associated with larger reductions in employment as risk shocks emerge.
The coefficient of the interaction term between risk shock and Large Firms Dummy is 2.792, with a
t-statistics of 1.80. The presence of a median shock explains 11.76% of the median percentage change
in employment for small firms, but only 5.56% of the median percentage change in employment for
large firms. There are no significant differences between large and small firms with respect to all other
corporate decisions, i.e., capital expenditure, cash holdings, and payout policies.
Profitability Effects. Firms with negative earnings react more prominently to the presence of
risk shocks with employment reduction. The coefficient of the interaction term between risk shock and
Negative Earning Dummy is -4.417, significant at the 1% level, indicating that the presence of a
median risk shock explains 14.61% (4.81%) of the median change in leverage for negative (positive)
earnings firms.
Negative earnings firm are also more responsive to risk shocks through reducing dividend and
repurchase payouts. Such firms are more likely to terminate or reduce divide payouts after experiencing
risk shocks, and are less likely to increase dividends when shocks resolve. Since profitable firms have
greater financing independence and flexibility, our results suggest that financial constraints play
significant roles in shaping up both investment and payout policies.

20
Credit Rating Effects. Credit ratings play an important role in affecting payout policies upon
experiencing risk shocks. High credit risk firms are more likely to terminate dividends and are less
likely to repurchase stocks after experiencing risk shocks.
5.6. Duration of the Impact of Risk Shocks
We examine the duration of the impact of risk shocks on corporate policies by including lagged
terms of shocks measured at time t, t-1, and t-2, while keeping the control variables observed at time t.
More specifically, we use the following specifications
△POLICYi,t+1 = α + β1RISKSHOCKi,t +β2 RISKSHOCKi,t-1 +β3RISKSHOCKi,t-2 +
βjCONTROLi,j,t + εi,t (3)
Table 10 reports the results. Panels A through E present the results on leverage, investment, cash
holdings, dividend payouts, and stock repurchases, respectively. The evidence shows that the impact of
risk shocks on payout policies including dividends and repurchases persists for two years, while the
impact on leverage, investment, and cash holdings lasts for at least three years after the introduction of
risk shocks.
Insert Table 10 here
Taking together the findings exhibited in Tables 10, we show that the impact of risk shocks on
corporate policies exists not only in terms of scale and strength, but also in terms of duration. We argue
that the impact of risk shocks is persistent as they create clear expectations on changing long-term
business prospects, rather than short-lasting investor sentiment or biases in investors’ expectations.
Managers, therefore, are more likely to make persistent adjustment decisions following such shocks.
This argument is further supported by our finding that adjustments in payout policies are less persistent
than investment and capital structure policies that are shown to be less affected by market-based return
volatility.

21
6. Robustness Checks
This section implements a comprehensive battery of robustness checks. First and foremost, we
account for potential effects of CEO traits on our study. Graham, Harvey, and Puri (2013) document
that CEOs and CFOs around the world possess different personal traits such as risk aversion and
optimism, which could affect corporate leverage and investment decisions. In our context, there is a
possibility that risk averse managers overestimate a firm’s risk level and in the meantime undertake
less debt. Therefore, risk aversion or other CEO personal traits, rather than risk per se, may affect
corporate leverage among other decisions. By studying the effect of change in risk on change in
corporate policies, we mitigates such concerns, as long as CEO traits are time-invariant, or CEO traits
lead to systematic under or over-evaluation of corporate risk.
We further account for potential effects of CEO characteristics by adding controls for CEO
gender, age, education, and experience, as younger and male CEOs, and CEOs with MBA degrees and
longer financial industry experience may adopt more aggressive financial policies (Graham, Harvey,
and Puri, 2013). We measure CEO education from a variety of dimensions, including whether the CEO
has a bachelor, master, or PhD degree, whether the CEO graduates from an Ivy-league college, whether
the CEO obtains an MBA degree, whether the CEO obtains an MBA degree from the “US News
(2010)” top 20 MBA programs, and whether the CEO obtains a Master of Finance degree. We also
account for CEO prior experience by examining the number of years the CEO has worked in the
finance industry, the number of years the CEO has worked for the same industry as the current firm, the
number of years the CEO has worked in the same firm, and the number of working years in general.
Finally, we control for CEO ownership as a large number of finance literature (see, for example, Jensen,
1986; Panousi and Papanikolaou, 2012; Nikolov and Whited, 2014) shows that managerial ownership
is an important determinant of corporate investment, capital structure, cash holdings and payout

22
policies. Our results are essentially the same after controlling for all above noted CEO characteristics.16
Our next robustness check accounts for potential effects of hedging activities on the relation
between risk shocks and corporate decisions. Past work shows that some corporations manage their risk
by implementing hedging to stabilize their earnings and cash flows, lower their bankruptcy costs, and
ease their credit and financial constraints. Managerial risk tolerance may also play a role in corporate
hedging decisions ((Bodnar, Giambona, Graham, and Harvey, 2014). Depending on hedging activities,
mangers facing risk shocks may adjust corporate policies differently.
We construct a text-based measure of corporate hedging by counting the frequency of
hedge-related word stems, including different forms of the word “hedge” and “derivative”, in the 10-K
reports. Our main variable, Hedge, is then computed as the frequency of hedge-related word stems
divided by the total number of word stems in the 10-K reports. To examine the effect of hedging
activities, we first add the change in the variable Hedge (i.e., dHedge) as a control in our baseline
regressions. We also construct an interaction term between dHedge and risk shock to test whether the
relation between risk shocks and corporate decisions differs for hedging corporations.
Hedging activities indeed affect a wide range of corporate decisions, such as leverage, investment,
cash holding and payout policies. Specifically, an increase in hedging activities is associated with an
increase in leverage and employment, and a decrease in cash holdings and dividend payouts. Ultimately,
however, the documented relation between risk shocks and corporate decisions is robust to considering
hedging. Both hedging and non-hedging firms significantly adjust their corporate policies subsequent
to risk shocks, yet hedging firms adjust their corporate policies more mildly.
One possible concern is that our main results are attributable to financial firms since the 15
extreme risk shock examples are concentrated in the finance industry. We conduct subsample analyses
on different industry groups and obtain similar results when restricting our sample to nonfinancial firms
16 We acknowledge that our attempt to address the effect of CEO characteristics is based on reduced-form estimations, which are subject
to various assumptions and limitations.
23
or manufacturing firms. Interestingly, financial firms are more responsive to risk shocks through
reduction in leverage and are non-responsive through adjustments in cash holdings. Furthermore,
unlike Floyd et al. (2015), we find that financial firms are more likely to terminate their dividends
following risk shocks than nonfinancial firms. In comparison, manufacturing firms and firms in the
service industry cut capital expenditure and R&D to a greater degree following risk shocks. Our results
are also robust to excluding the 2007-2008 period of the global financial crisis, during which we find
firms reduce leverage to a greater extent than the rest of the sample period.
We also examine alternative downside risk measures based on different sections of 10-K texts
and an alternative dictionary. In particular, Item 7 and 7a (MD&A section) in 10-K filings contain
comprehensive managerial discussions on corporate risk profile and business prospects. Using a risk
shock measure derived solely from Item 7 and 7a texts, our results remain unchanged. Moreover,
Hoberg, Prabhala, and Phillips (2014) find that product market risk information extracted from Item 1
(Business) can predict future cash holdings and payout policies. Here, we find that a risk shock
measure based on Item 1 yields similar results as our benchmark measures. Finally, since listed
companies are mandated by SEC to include Item 1a to discuss "the most significant factors that make
the company speculative or risky" after 2005 December, we analyze risk information embedded in Item
1a separately.17 Our overall evidence remains unchanged, supporting the finding in Campbell et al.
(2014) that risk disclosure in Item 1a is firm-specific, meaningful, and relevant to different types of
risks, both systematic and idiosyncratic. Finally, we consider an alternative dictionary based on the list
of negative words in Loughran and McDonald (2011). We find that our measure yields stronger and
more coherent results in predicting corporate decisions than the measure based on the negative words
in Loughran and McDonald (2011).
Our results are robust to using market leverage and adjusted book and market leverage as the
17 One may argue that some sections in the 10-K, even those in Item 7, may be used to describe what has happened in the past. The
downside risk measures developed based on these sections, therefore, may not be as forward-looking. Only including disclosure on Item
1a can alleviate such concerns since the entire section is limited to forward-looking discussions on risk factors.
24
proxy for capital structure. We also derive similar results using the absolute change in capital
expenditure and employment, rather than the percentage change in these measures, as dependent
variables. Regarding payout policies, we further investigate the impact of risk shocks on the percentage
increase or decrease in dividend and repurchase payouts. We find similar results upon using these
continuous measures, rather than the dummy variables.
Our text-based measure of risk shocks could merely capture deteriorating profitability.
Managers tend to use more negative and cautionary words in annual reports when profitability
diminishes (Li, 2006). A plausible story is that profitability drop, rather than rising risk, leads to the
reduction in leverage, investment, dividend payouts, and the increase in cash holdings. To alleviate
such concerns, we add controls for change in earnings (i.e., EBIT/Assets) or change in earnings
volatility in all regressions. Controlling for these variables, risk shocks still significantly predict
changes in leverage, investment, employment, cash holdings, and dividend and repurchase policies.
Meanwhile, change in earnings volatility performs even worse than change in return volatility in
predicting these policies. Risk shocks remain significant statistically and economically also when we
include in policy regressions changes in the following alternative risk measures: (1) implied volatility
of individual stock options; (2) realized S&P 500 index return volatility.
Our focus is on providing a text-based downside risk measure that can be used to predict dynamic
changes in a variety of corporate policies, rather than making casual claims. We acknowledge that
endogeneity could be a concern in our context: For example, firms experiencing risk shocks could be
fundamentally different from firms that are not subject to shocks. If so, future policy adjustments could
merely reflect latent firm factors unrelated to risk shocks. To partially address that concern, we use a
matching firm approach based on firm industry, size and profitability for robustness.18 We find similar
18 In particular, for each firm (treatment firm) experiencing a risk shock in the full sample, we select one matched firm (control firm)
according to four criteria: (1) the matched firm does not experience a risk shock at the same year; (2) the matched firm must belong to the
same industry characterized by the three-digit SIC code; (3) the market capitalization of the matched firm is within the range of 80% to
120% of that of the treatment firm; (4) the profitability (EBIT/asset) of the matched firm is within the range of 80% to 120% of that of the
treatment firm. Criteria (2) through (4) refer to one year prior to the presence of a risk shock.

25
results based on the matched sample. Such results should be interpreted with caution, however, since
they cannot exclude the possibility that unobservable firm factors or factors unrelated to industry, size
and profitability drive the differences in future policy adjustments.
7. Conclusion
This paper develops a new methodology to measure firm-level downside risk through analyzing
the textual contents of corporate 10-K reports. It then examines adjustments of various corporate
policies in response to shocks to the surrounding risk environments.
Our new measure is based on keywords characterizing managerial perception of downside risk in
76,676 10-Ks for the period January 1994 through September 2015. Compared with existing risk
measures such as stock return and earnings volatility, the text-based measure focuses exclusively on
future downside possibilities and information related to firms’ fundamentals. Using this measure, we
show that risk shocks are followed by persistent reductions in leverage, capital expenditure, R&D,
employment, and dividend payouts and stock repurchases, along with increasing cash holdings.
The text-based measure substantially outperforms existing risk measures in predicting capital
structure and investment decisions, as the relation between changes in stock return and earnings
volatility and changes in leverage and investment is shown to be non-significant. Furthermore, the
impact of risk shocks on these policies lasts for over three years, implying that our text-based measure
is based on clear information about fundamental business conditions. This is further supported by the
finding that firms actively adjust these policies when downside risk rises and reverse these policies
when risk resolves.
Taking together, using the text-based downside risk measure, we obtain strikingly consistent,
robust, and long-lasting implications for a wide range of corporate policies in response to changing
business conditions. Relative to existing measures, our text-based downside risk measure provides
results that are more consistent with theories in corporate finance and comprehensive surveys in the

26
field.

27
Reference
Amihud, Yakov, and Haim Mendelson, 1986, Asset pricing and the bid-ask spread, Journal of
Financial Economics 17, 223–49.
Antweiler, Werner and Murray Z. Frank, 2004, Is all that talk just noise? The information content of
Internet stock message boards, Journal of Finance 52, 1259–94.
Baker, Malcolm, and Jeffrey Wurgler, 2002, Market timing and capital structure, Journal of Finance
57, 1–30.
Baker, Malcolm, and Jeffrey Wurgler, 2004, A catering theory of dividends, Journal of Finance 59,
1125–66.
Baker, Malcolm, Jeffrey Wurgler, 2007, Investor sentiment in the stock market, Journal of Economic
Perspectives 21, 129–51.
Barberis Nicholas C., and Richard Thaler, 2003, A survey of behavioral finance, Handbook of the
Economics of Finance, M. Harris eds., North Holland, Amsterdam.
Bates, Thomas, Kathleen Kahle, and Rene Stulz, 2009, Why do U.S. firms hold so much more cash
than they used to?, Journal of Finance 64, 1985–2021.
Bradley, Michael, Gregg Jarrell, and E. Han Kim, 1984, On the existence of an optimal capital
structure: Theory and evidence, Journal of Finance 39, 857–78.
Bliss, Barbara A., Yingmei Cheng, and David J. Denis, 2015, Corporate payout, cash retention, and the
supply of credit: Evidence from the 2008–2009 credit crisis, Journal of Financial Economics
115, 521–40.
Bloom, Nick, 2009, The impact of uncertainty shocks, Econometrica 77, 623–85.
Bodnar, Gordon M., Erasmo Giambona, John R. Graham, and Campbell R. Harvey, 2014, A view
inside corporate risk management, Duke University, Working paper.
28
Bodnaruk, A., Loughran, T. and McDonald, B., 2015, Using 10-K text to gauge financial constraints.
Journal of Financial and Quantitative Analysis 50, 623–46.
Bolton, Patrick, Hui Chen, and Neng Wang, 2011, A unified theory of Tobin's q, corporate investment,
financing, and risk ,management, Journal of Finance 66, 1545–78.
Bolton, Patrick, Hui Chen, and Neng Wang, 2013, Market timing, investment, and risk management,
Journal of Financial Economics 109, 40-62.
Brav, A., John R. Graham, Campbell R. Harvey, and Roni Michaely, 2005, Payout policy in the 21st
century, Journal of Financial Economics 77, 483–527.
Campbell, John L., Hsinchun Chen, Dan S. Dhaliwal, Hsin-min Lu, and Logan B. Steele, 2014, The
information content of mandatory risk factor disclosure in corporate filings, Review of
Accounting Studies 19, 396–455.
Cella, Cristina, Andrew Ellul, and Mariassunta Giannetti, 2013, Investors' Horizons and the
Amplification of Market Shocks, Review of Financial Studies 26, 1607–48.
Chen, Hui, Hao Wang, and Hao Zhou, 2014, Stock return volatility and capital structure decisions,
Massachusset Institute of Technology, Working Paper.
Da Zhi, Joseph Engelberg, and Pengjie Gao, 2015, The sum of all FEARS investor sentiment and asset
prices, Review of Financial Studies 28, 1-32.
De Long, J. Bradford, Andrei Shleifer, Lawrence Summers, and Robert Waldmann, 1990, Noise trader
risk in financial markets, Journal of Political Economy 98, 703–38.
Fama, Eugene F., and Kenneth R. French, 2002, Testing tradoff and pecking order predictions about
dividends and debt, Review of Financial Studies 15, 1–33.
Farre-Mensa, Joan, Roni Michaely, and Martin Schmalz, 2014, Payout Policy, Annual Review of
Financial Economics 6, 75–134.
Faulkender, Michael, and Mitchell A. Peterson, 2006, Does the source of capital affect capital structure,
Review of Financial Studies 19, 45–79.

29
Floyd, Eric, Nan Li, and Douglas Skinner, 2015, Payout policy through the financial crisis: The growth
of repurchases and the resilience of dividends, Journal of Financial Economics 118, 299–316.
Frank, Murray Z., and Vidhan K. Goyal, 2009, Capital decisions: which factors are reliably important?,
Financial Management 38, 1–37.
Friend, Irwinand, and Larry Lang, 1988, An empirical test of the impact of managerial self-interest on
corporate capital structure, Journal of Finance 43, 271–81.
Gao, Huangsheng, Jarrad Harford, and Kai Li, 2014, Determinants of corporate cash policy: Insights
from private firms, Journal of Financial Economics 109, 623–39.
Graham, John R., Campbell R. Harvey, and Manju Puri, 2013, Managerial attitudes and corporate
actions, Journal of Financial Economics 109, 103–21.
Guay, Wayne, and Jarrad Harford, 2000, The cash flow permanence and information content of
dividend increases vs. repurchases, Journal of Financial Economics 57, 385–415.
Harris, Milton, and Arthur Raviv, 1991, The theory of capital structure, Journal of Finance 46,
297–355.
Hennessy, Christopher A., Levy Amnon, and Toni M. Whited, 2007, Testing Q theory with financing
frictions, Journal of Financial Economics 83, 691–717.
Hoberg, Gerard, and Vojislav Maksimovic, 2015, Redefining financial constraints: a text-based
analysis, Review of Financial Studies 28, 1312–52.
Hoberg, Gerard, and Nagpurnanand Prabhala, 2009, Disappearing dividends, catering, and risk, Review
of Financial Studies 22, 79–116.
Hoberg, Gerard, Gordon Phillips, and Nagpurnanand Prabhala, 2014, Product market threats, payouts,
and financial flexibility, Journal of Finance 69, 297–324.
Jagannathan, M., C. P. Stephens and M. S. Weisbach, 2000, Financial flexibility and the choice
between dividends and stock repurchases, Journal of Financial Economics 57, 355–84.
30
Jensen, Michael C., 1986, Agency costs of free cash flow, corporate finance, and takeovers, American
Economic Review 76, 323-9.
Kester, Carl W., 1986, Capital and ownership structure: A comparison of United States and Japanese
manufacturing corporations, Financial Management 15, 5–16.
Kravet, Todd, and Volkan Muslu, 2013, Textual risk disclosures and investors’ risk perceptions,
Review of Accounting Studies 18, 1088-1122.
Leary, Mark T., and Michael R. Roberts, 2005, Do firms rebalance their capital structure, Journal of
Finance 60, 2575–619.
Leland, Hayne E., 1994, Corporate Debt Value, Bond Covenants, and Optimal Capital Structure,
Journal of Finance 49, 1213–52.
Lemmon, Michael L, Michael R Roberts, and Jaime F Zender, 2008, Back to the beginning: persistence
and the cross-section of corporate capital structure, The Journal of Finance 63, 1575–608.
Li, Feng, 2006, Do stock market investors understand the risk sentiment of corporate annual reports?,
University of Michigan, Working Paper.
Li, Feng, 2010, Textual analysis of corporate disclosures: A survey of literature, Journal of Accounting
Literature 29, 143–65.
Li, F., Lundholm, R. and Minnis, M., 2013, A Measure of Competition Based on 10‐K Filings,
Journal of Accounting Research 51, 399–436.
Lintner, J., 1956, Distribution of incomes of corporations among dividends, retained earnings, and
taxes, American Economic Review 46, 97–113.
Loughran, Tim, and Bill McDonald, 2011, When is a liability not a liability? Textual analysis,
dictionaries, and 10-Ks, Journal of Finance 66, 35–65.
Loughran, Tim, and Bill McDonald, 2013, IPO first-day returns, offer price revisions, volatility, and
Form S-1 language, Journal of Financial Economics 109, 307–326.

31
Merton, Robert, 1974, On the pricing of corporate debt: The risk structure of interest rates, Journal of
Finance 29, 449–79.
Modigliani, Franco, and Merton Miller, 1958, The cost of capital, corporation finance and the theory of
investment, American Economic Review 48, 261–97.
Nikolov, Boris, and Toni Whited, 2014, Agency conflicts and cash: estimates from a dynamic model,
Journal of Finance 69, 883–1921.
Opler, Tim, Lee Pinkowitz, Rene Stulz, and Rohan Williamson, 1999, The determinants and
implications of corporate cash holdings, Journal of Financial Economics 52, 3–46.
Pastor, Lubos, and Robert F. Stambaugh, 2003, Liquidity risk and expected stock returns, Journal of
Political Economy 111, 642–85.
Panousi, Vasia, and Dimitris Papanikolaou, 2012, Investment, idiosyncratic risk and ownership,
Journal of Finance 67, 1113–48.
Peterson, Mitchell A., 2009, Estimating standard errors in finance panel data sets: comparing
approaches, Review of Financial Studies 22, 435–80.
Qiu, Lily, and Ivo Welch, 2006, Investor Sentiment Measures, Working Paper, Brown University.
Scharfstein, David S., and Jeremy Stein, 1990, Herd Behavior and Investment, American Economic
Review 80, 465–47.
Shiller, Robert J.,1981, Do stock prices move too much to be justified by subsequent changes in
dividends?, American Economic Review 71, 421–36.
Tetlock, Paul C., 2007, Giving content to investor sentiment: The role of media in the stock market,
Journal of Finance 62, 1139–68.
Tetlock, Paul, Maytal Saar-Tsechanksy, and Sofus Macskassy, 2008, More than words: Quantifying
language to measure firms’ fundamentals, Journal of Finance 63, 1437–67.
Titman, Sheridan and Roberto Wessels, 1988, The determinants of capital structure choice, Journal of
Finance 43, 1–19.

32
Welch, I., 2004, Capital structure and stock returns, Journal of Political Economy 112, 106–131.
33
Table 1: Characteristics of the Text-Based Downside Risk Measure
This table describes the text-based downside risk measure. Panel A presents average, min, and max measures for ten
industry groups. Panel B considers above- and below-median size, market-to-book, credit rating, earnings, stock return
volatility and cash flow volatility firms. Reported are the average, difference in average, and its t-statistics (in parentheses).
The sample consists of U.S. listed companies that filed 10-K reports over the time period of 1994 January and 2015
September. Risk level is the ratio of downside risk-related keywords to total words in 10-K files (excluding propositions,
articles, and pronouns). Definitions of all variables are provided in Appendix 2.
Panel A: Distribution of Downside Risk by Industry Groups
Industry Group Min Max
Agriculture, Forestry, and Fishing 154 0.84% 0.07% 1.57%
Mining 2,928 0.94% 0.10% 2.20%
Construction 860 1.01% 0.04% 1.99%
Manufacturing 29,697 1.00% 0.02% 2.89%
Transportation, Communications, Electric, Gas, and Sanitary Services 6,208 0.87% 0.01% 2.49%
Wholesale Trade 2,404 0.90% 0.04% 2.26%
Retail Trade 4,434 0.87% 0.04% 2.10%
Finance, Insurance and Real Estate 17,579 1.32% 0.03% 3.89%
Services 11,922 1.06% 0.03% 2.62%
Conglomrates 490 1.06% 0.23% 2.35%
Total 76,676 1.06% 0.01% 3.89%
RangeObs. Mean
Panel B: Distribution of Downside Risk by Firm Characteristics
Above-the-median Firms Below-the-median Firms Difference (1)-(2)
Firm Characteristics (1) (2) (3)
Return Volatility 1.083% 1.033% 0.050% (14.54)
Cash Flow Volatility 1.112% 1.104% 0.008% (2.00)
Credit Ratings 0.985% 1.063% -0.078% (-12.07)
EBIT/Asset 0.897% 1.220% -0.324% (-104.55)
Tangibility 0.903% 1.211% -0.308% (-99.94)
Mean Risk Level
34
Table 2: Examples of Large Downside Risk Shocks
This table describe 15 examples of the largest downside risk shocks. The sample consists of U.S. listed companies that filed 10-K reports over the time period of
1994 January and 2015 September. Firms are sorted in descending order based on the value of downside risk shocks.
RankFiscal
YearCompany Name Industry Group Risk Shock Factors
1 2005SUPERIOR
INDUSTRIES INTL
Industry
Manufacturing
reductions in the forecast of new vehicle productions by customers; continued consolidation of the automotive industry; global pricing
pressure driven by competiters and cost-cutting initiatives of customers; the need to seek a buyer for the aluminum suspension
components business due to significant losses incurred by this invest project; whether the cost-cutting innitives could be achieved.
2 2009 FNB UNITED CORPFinancial
Services
an increase in nonperforming real estate loans; incapability of renewing or accepting brokered deposits without prior regulatory
approval and the possibility of paying higher insurance premiums to the FDICa due to decline in the bank's capital position; inability to
access the capital markets.
3 2008FIRST FINL
BANCORP INC/OH
Financial
Services
massive writeoffs due to credit performance of real estate related loans; inability to access capital because of the tightening of credit
market; impairment of goodwill due to unpredecended market volatilities and disruptions; credit risk imposed by the default events of
financial institutions.
4 2007 D R HORTON INC Constructiondeclines in demand for new homes; elevated sales cancellation rate, reduction in availability of mortgage financing; declines in profit
margine because the company offers higher levels of incentives and price concessions in attempts to stimulate demand.
5 2009
CITIZENS
COMMUNITY
BANCORP
Financial
Services
deteriorating credit quality; ability to maintain the required capital levels and adequate source of funding and liquidity; further
writedowns in residential mortgage backed securities portfolio; ability to implement the cost-savings innitiatives; potential impairment
of investment securities, goodwill and other intangible assets; high volatility of stock price since the stocks are thinly traded.
6 2009 BB&T CORPFinancial
Services
credit deterioration related to the commercial real estate and contruction loan porfolios of the newly acquired Colonial Bank and the
residential mortgage loans of the bank itself; the ability to expand into the new areas after the acquisition of Colonial Bank; decreases in
real estate values, primarily in Georgia, Florida and metro Washington, D.C..
7 2009SOUTH FINANCIAL
GROUP INC
Financial
Services
a series of risk factors related to a restatement process: downgrades in credit ratings; acceleration of public debt securities and other
debt arrangements due to inability to comply with certain reporting covenants; material weaknesses in internal control over financial
reporting; not able to access the public capital markets until all of its filings with the SEC are up to date; incapbility of attractting and
retaining key employees.
8 2004DORAL FINANCIAL
CORP
Financial
Services
difficulty in obtaining additional borrowings or issuing additional equity due to market conditions and recent downgrades of credit
ratings; subject to regulatory enforcement actions if not adequately capitalized; failure to comply with the Nasdaq one-dollar minimum
bid price requirement; a net increase in Federal income tax if there is an "ownership change" due to new equity issuance or other events;
credit losses and impairment charges.

35
Table 2: Examples of Large Risk Shocks (Continued)
RankFiscal
YearCompany Name Industry Group Risk Shock Factors
9 2008FIFTH THIRD
BANCORP
Financial
Services
systematic risk faced by the entire industry; increases in compeitition due to recent consolidation of the financial industry; inability to
hire or retain the most qualified senior managers due to the CPP's restrictions on the compensations of senior managers.
10 2002PROGRESS ENERGY
INCUtility
energy crisis in California during 2001; the recent volatility of natural gas prices in North America; increased amount of public and
regulatoryscrutiny due to the the bankruptcy filing by the Enron Corporation and recently discovered accounting irregularities of
certain public companies; downgradings of senior unsecure debt by S&P and Moody's; drought conditions and related water
restrictions in the southeast United States.
11 2002 FIBERCORE INCMaterials and
Related Products
manufacturing overcapacity due to decreased growth in telecommunication industry; a significant and continuing downturn in the South
American market; intense competition with several competitors having significantly greater resources and associated pricing pressure;
the ability to achieve the cost reduction plans; low cash reserves and limited ability to gain additional capital; possibility of being
delisted from Nasdaq due to failure to comply with the one-dollar minimum bid price requirement.
12 2007AMBAC FINANCIAL
GROUP INC
Financial
Services
inablility to write new financial guarantee business due to a downgrade of financial strength rating by S&P; an increase in borrowing
costs due to downgrades of long term credit rating by multiple rating agencies; a substantial increase in credit risk related to residential
mortgage backed securities and CDOs of ABS; potential disruptions caused by decsions to suspend and discontinue certain business..
13 2009
SALEM
COMMUNICATIONS
CORP
Tele-
communications
a significant decrease in advertising by customers in financial services and automotive industries; impairment of braodcast liscences,
mastheads and goodwill balances due to increased cost of capital and a decline in the estimated terminal or exit values as a result of
industry wide declines in radio station transaction multiples and magazines; ability to integrate the operations and management of two
newly acquired radio stations; high credit risk due to substantial previous and new debt obligations.
14 2008JOURNAL
COMMUNICATIONS
Tele-
communications
impairment of goodwill, tv and radio broadcast licenses, other intangible assets and property, plant and equipment due to deteriorating
market conditions and a further decline in the stock price;the adverse impact of changing economic and financial market conditions on
liquidity and the availability of capital; the possbility of violating the financial covenants of revolving credit facility;decreases in
advertising spending in automotive industry, political advertising and professional sports contracts.
15 2009 MARRIOTT INTL Services
significantly reduced demand for hotel rooms and timeshare products around the world; the growing risks of doing business
internationally due to growing significance of operations abraod; a downgrade of long-term debt ratings by the three major agencies in
2009; the anticipation that many of the jurisdictions in which the company does business will review tax and other revenue raising laws
in response to recent economic crisis; weakened sales of timeshare loans due to disruptions in the credit markets; significant
restructuring costs and impairment charges of the timeshare segment.

36
Table 3: Summary Statistics
This table reports summary statistics for text-based variables, firm-level corporate policy variables and control
variables, and macro-wide control variables in Panel A, B, C, and D, respectively. All continuous variables, except
those in Panel D, are winsorized at the 1% and 99% level. Definitions of these variables are provided in Appendix 2.
The sample consists of U.S. listed companies that filed 10-K reports over the time period of 1994 January and 2015
September.
Variable Obs. Mean Median Std. Dev. Skewness Kurtosis
Total Meaningful Words in 10K Files 76,676 21,410 19,468 12,742 0.86 3.63
Downside Risk-related Words in 10K Files 76,676 251 208 207 1.48 5.85
Risk Level 76,676 1.06% 1.04% 0.45% 0.50 3.25
Risk Shock 58,607 0.04% 0.02% 0.16% 0.93 10.67
Rising Risk Shock 58,607 0.28 0.00 0.45 0.96 1.91
Resolving Risk Shock 58,607 0.22 0.00 0.41 1.38 2.91
Book Leverage 76,676 55.15% 55.03% 27.45% 0.14 2.37
Active Change in Book Leverage (dlev) 57,442 0.09% 0.12% 8.61% -0.88 8.97
% Change in Debt (%dDebt) 58,585 19.84% 5.72% 60.93% 3.97 22.68
% Change in Equity (%dEquity) 57,441 14.03% 1.23% 54.49% 4.58 28.04
Capital Expenditure (millions) 71,713 113.63 8.91 354.68 5.08 30.96
% Change in Capital Expenditure (%dcapx) 51,439 28.18% 1.77% 134.64% 3.86 21.77
Employment (thousands) 74,085 6.90 0.98 17.99 4.61 26.54
% Change in Employment (%demp) 55,360 7.77% 1.35% 26.93% 2.46 13.22
R&D Expense (millions) 76,676 27.24 0.00 110.43 6.28 45.08
% Change in R&D Expense (%dxrd) 22,694 5.02% 2.41% 29.91% 2.73 15.30
Advertising Expense (millions) 76,676 15.21 0.00 69.84 6.35 45.45
% Change in Avertising Expense (%dxad) 19,540 11.08% 3.95% 65.44% 3.06 18.29
Cash (millions) 76,665 289.24 35.79 949.21 5.75 38.90
Cash/Assets 76,665 18.00% 7.96% 22.48% 1.67 5.03
Change in Cash/Assets (dcash) 58,596 -0.39% -0.03% 8.09% -0.41 7.14
Dividends (per share) 76,357 0.33 0.00 0.60 2.39 8.94
Dividend Innitiation 58,357 0.02 0.00 0.15 6.39 41.77
Dividend Omission 58,357 0.01 0.00 0.12 8.44 72.26
Dividend Increase 58,357 0.28 0.00 0.45 1.00 2.01
Dividend Decrease 58,357 0.09 0.00 0.28 2.92 9.53
Net Repurchases (millions) 50,868 72.77 0.03 278.68 5.63 37.09
Repurchase More than 1% Asset Dummy 66,180 0.32 0.00 0.47 0.76 1.58
Panel B: Corporate Policy Variables
Panel A: Text-based Variables
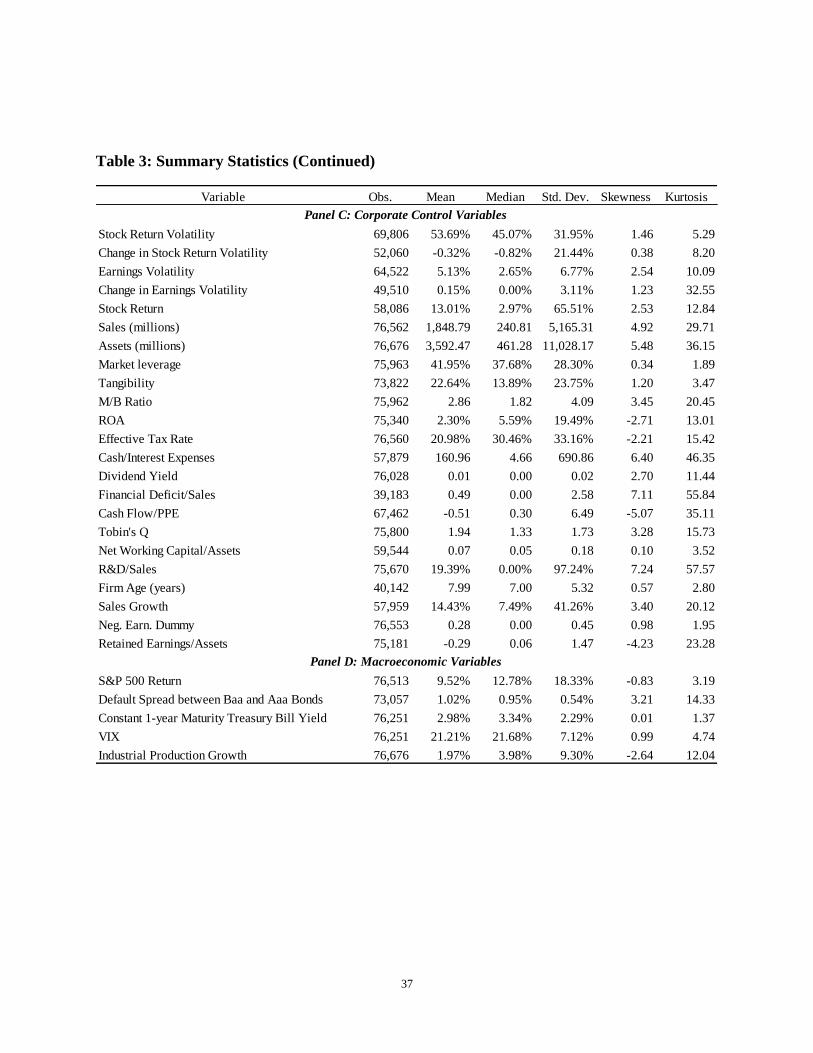
37
Table 3: Summary Statistics (Continued)
Variable Obs. Mean Median Std. Dev. Skewness Kurtosis
Stock Return Volatility 69,806 53.69% 45.07% 31.95% 1.46 5.29
Change in Stock Return Volatility 52,060 -0.32% -0.82% 21.44% 0.38 8.20
Earnings Volatility 64,522 5.13% 2.65% 6.77% 2.54 10.09
Change in Earnings Volatility 49,510 0.15% 0.00% 3.11% 1.23 32.55
Stock Return 58,086 13.01% 2.97% 65.51% 2.53 12.84
Sales (millions) 76,562 1,848.79 240.81 5,165.31 4.92 29.71
Assets (millions) 76,676 3,592.47 461.28 11,028.17 5.48 36.15
Market leverage 75,963 41.95% 37.68% 28.30% 0.34 1.89
Tangibility 73,822 22.64% 13.89% 23.75% 1.20 3.47
M/B Ratio 75,962 2.86 1.82 4.09 3.45 20.45
ROA 75,340 2.30% 5.59% 19.49% -2.71 13.01
Effective Tax Rate 76,560 20.98% 30.46% 33.16% -2.21 15.42
Cash/Interest Expenses 57,879 160.96 4.66 690.86 6.40 46.35
Dividend Yield 76,028 0.01 0.00 0.02 2.70 11.44
Financial Deficit/Sales 39,183 0.49 0.00 2.58 7.11 55.84
Cash Flow/PPE 67,462 -0.51 0.30 6.49 -5.07 35.11
Tobin's Q 75,800 1.94 1.33 1.73 3.28 15.73
Net Working Capital/Assets 59,544 0.07 0.05 0.18 0.10 3.52
R&D/Sales 75,670 19.39% 0.00% 97.24% 7.24 57.57
Firm Age (years) 40,142 7.99 7.00 5.32 0.57 2.80
Sales Growth 57,959 14.43% 7.49% 41.26% 3.40 20.12
Neg. Earn. Dummy 76,553 0.28 0.00 0.45 0.98 1.95
Retained Earnings/Assets 75,181 -0.29 0.06 1.47 -4.23 23.28
S&P 500 Return 76,513 9.52% 12.78% 18.33% -0.83 3.19
Default Spread between Baa and Aaa Bonds 73,057 1.02% 0.95% 0.54% 3.21 14.33
Constant 1-year Maturity Treasury Bill Yield 76,251 2.98% 3.34% 2.29% 0.01 1.37
VIX 76,251 21.21% 21.68% 7.12% 0.99 4.74
Industrial Production Growth 76,676 1.97% 3.98% 9.30% -2.64 12.04
Panel C: Corporate Control Variables
Panel D: Macroeconomic Variables
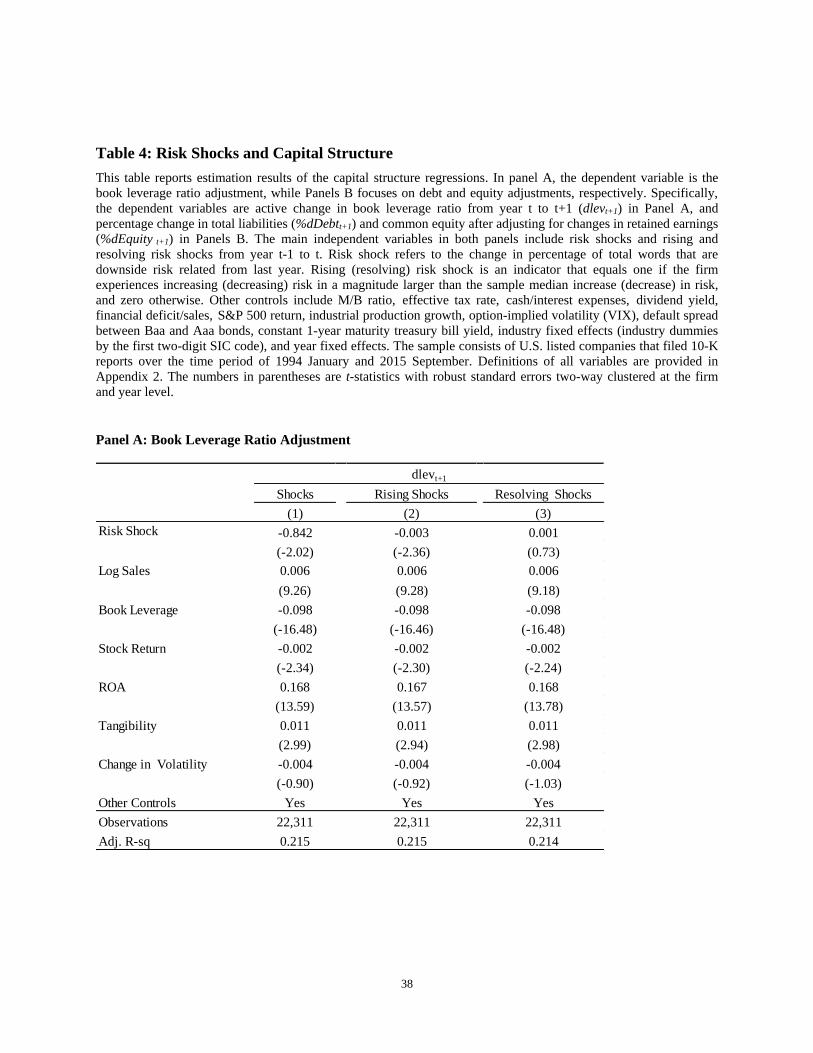
38
Table 4: Risk Shocks and Capital Structure
This table reports estimation results of the capital structure regressions. In panel A, the dependent variable is the
book leverage ratio adjustment, while Panels B focuses on debt and equity adjustments, respectively. Specifically,
the dependent variables are active change in book leverage ratio from year t to t+1 (dlevt+1) in Panel A, and
percentage change in total liabilities (%dDebtt+1) and common equity after adjusting for changes in retained earnings
(%dEquity t+1) in Panels B. The main independent variables in both panels include risk shocks and rising and
resolving risk shocks from year t-1 to t. Risk shock refers to the change in percentage of total words that are
downside risk related from last year. Rising (resolving) risk shock is an indicator that equals one if the firm
experiences increasing (decreasing) risk in a magnitude larger than the sample median increase (decrease) in risk,
and zero otherwise. Other controls include M/B ratio, effective tax rate, cash/interest expenses, dividend yield, financial deficit/sales, S&P 500 return, industrial production growth, option-implied volatility (VIX), default spread
between Baa and Aaa bonds, constant 1-year maturity treasury bill yield, industry fixed effects (industry dummies
by the first two-digit SIC code), and year fixed effects. The sample consists of U.S. listed companies that filed 10-K
reports over the time period of 1994 January and 2015 September. Definitions of all variables are provided in
Appendix 2. The numbers in parentheses are t-statistics with robust standard errors two-way clustered at the firm
and year level.
Panel A: Book Leverage Ratio Adjustment
Shocks Rising Shocks Resolving Shocks
(1) (2) (3)
-0.842 -0.003 0.001
(-2.02) (-2.36) (0.73)
Log Sales 0.006 0.006 0.006
(9.26) (9.28) (9.18)
Book Leverage -0.098 -0.098 -0.098
(-16.48) (-16.46) (-16.48)
Stock Return -0.002 -0.002 -0.002
(-2.34) (-2.30) (-2.24)
ROA 0.168 0.167 0.168
(13.59) (13.57) (13.78)
Tangibility 0.011 0.011 0.011
(2.99) (2.94) (2.98)
Change in Volatility -0.004 -0.004 -0.004
(-0.90) (-0.92) (-1.03)
Other Controls Yes Yes Yes
Observations 22,311 22,311 22,311
Adj. R-sq 0.215 0.215 0.214
Risk Shock
dlevt+1

39
Table 4: Risk Shocks and Capital Structure (Continued)
Panel B: Debt versus Equity Adjustment
%dEquityt+1
Shocks Rising shocks Resolving Shocks Shocks Rising shocks Resolving Shocks
(1) (2) (3) (4) (5) (6)
-8.704 -0.020 0.019 -1.310 0.001 0.009
(-2.44) (-2.81) (2.63) (-0.50) (0.07) (1.07)
Log Sales -0.001 -0.001 -0.001 -0.021 -0.021 -0.021
(-0.19) (-0.25) (-0.24) (-9.35) (-9.31) (-9.23)
Book Leverage -0.465 -0.465 -0.466 0.034 0.035 0.034
(-13.00) (-12.99) (-12.97) (0.89) (0.89) (0.88)
Stock Return 0.065 0.066 0.066 0.039 0.039 0.039
(4.55) (4.59) (4.63) (2.68) (2.68) (2.66)
ROA 0.073 0.075 0.079 -0.718 -0.716 -0.717
(1.19) (1.22) (1.28) (-7.66) (-7.69) (-7.71)
Tangibility 0.022 0.022 0.023 -0.002 -0.002 -0.002
(0.83) (0.81) (0.84) (-0.08) (-0.08) (-0.07)
Change in Volatility -0.029 -0.031 -0.033 0.017 0.016 0.016
(-0.84) (-0.91) (-0.97) (0.68) (0.65) (0.67)
Other Controls Yes Yes Yes Yes Yes Yes
Observations 22,680 22,680 22,680 22,311 22,311 22,311
Adj. R-sq 0.072 0.071 0.071 0.194 0.194 0.194
%dDebt t+1
Risk Shock
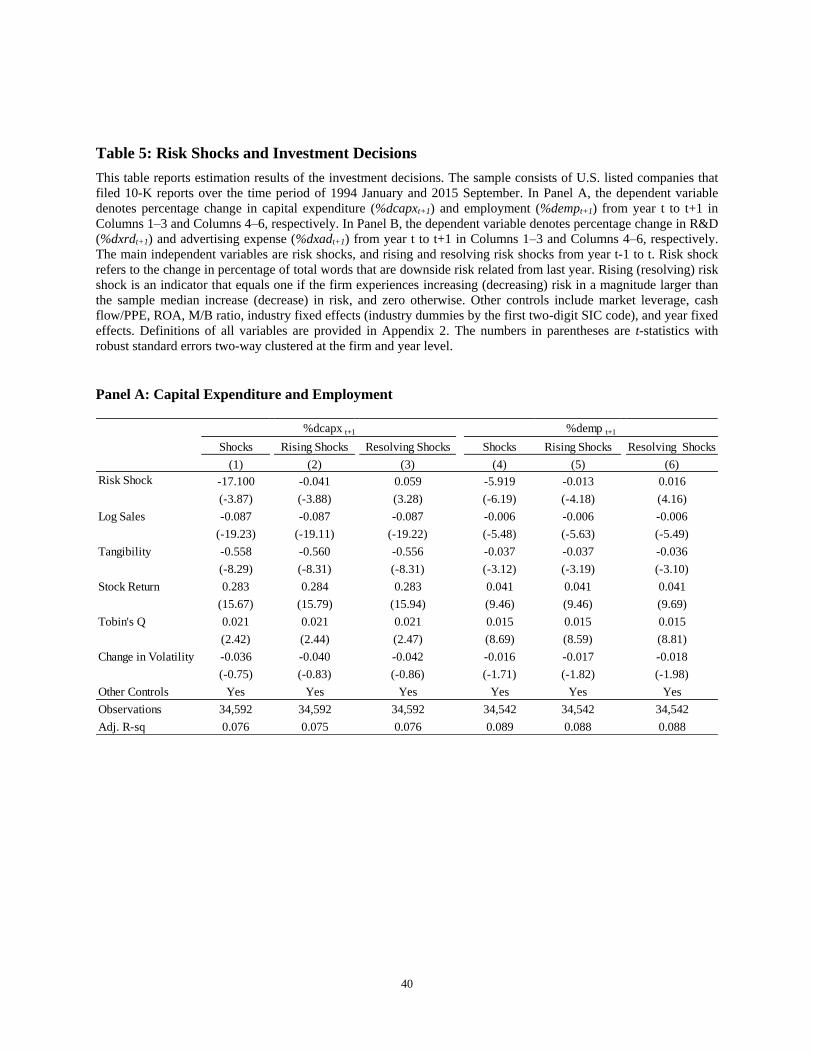
40
Table 5: Risk Shocks and Investment Decisions
This table reports estimation results of the investment decisions. The sample consists of U.S. listed companies that
filed 10-K reports over the time period of 1994 January and 2015 September. In Panel A, the dependent variable
denotes percentage change in capital expenditure (%dcapxt+1) and employment (%dempt+1) from year t to t+1 in
Columns 1–3 and Columns 4–6, respectively. In Panel B, the dependent variable denotes percentage change in R&D
(%dxrdt+1) and advertising expense (%dxadt+1) from year t to t+1 in Columns 1–3 and Columns 4–6, respectively.
The main independent variables are risk shocks, and rising and resolving risk shocks from year t-1 to t. Risk shock
refers to the change in percentage of total words that are downside risk related from last year. Rising (resolving) risk
shock is an indicator that equals one if the firm experiences increasing (decreasing) risk in a magnitude larger than
the sample median increase (decrease) in risk, and zero otherwise. Other controls include market leverage, cash
flow/PPE, ROA, M/B ratio, industry fixed effects (industry dummies by the first two-digit SIC code), and year fixed
effects. Definitions of all variables are provided in Appendix 2. The numbers in parentheses are t-statistics with
robust standard errors two-way clustered at the firm and year level.
Panel A: Capital Expenditure and Employment
Shocks Rising Shocks Resolving Shocks Shocks Rising Shocks Resolving Shocks
(1) (2) (3) (4) (5) (6)
-17.100 -0.041 0.059 -5.919 -0.013 0.016
(-3.87) (-3.88) (3.28) (-6.19) (-4.18) (4.16)
Log Sales -0.087 -0.087 -0.087 -0.006 -0.006 -0.006
(-19.23) (-19.11) (-19.22) (-5.48) (-5.63) (-5.49)
Tangibility -0.558 -0.560 -0.556 -0.037 -0.037 -0.036
(-8.29) (-8.31) (-8.31) (-3.12) (-3.19) (-3.10)
Stock Return 0.283 0.284 0.283 0.041 0.041 0.041
(15.67) (15.79) (15.94) (9.46) (9.46) (9.69)
Tobin's Q 0.021 0.021 0.021 0.015 0.015 0.015
(2.42) (2.44) (2.47) (8.69) (8.59) (8.81)
Change in Volatility -0.036 -0.040 -0.042 -0.016 -0.017 -0.018
(-0.75) (-0.83) (-0.86) (-1.71) (-1.82) (-1.98)
Other Controls Yes Yes Yes Yes Yes Yes
Observations 34,592 34,592 34,592 34,542 34,542 34,542
Adj. R-sq 0.076 0.075 0.076 0.089 0.088 0.088
%dcapx t+1 %demp t+1
Risk Shock
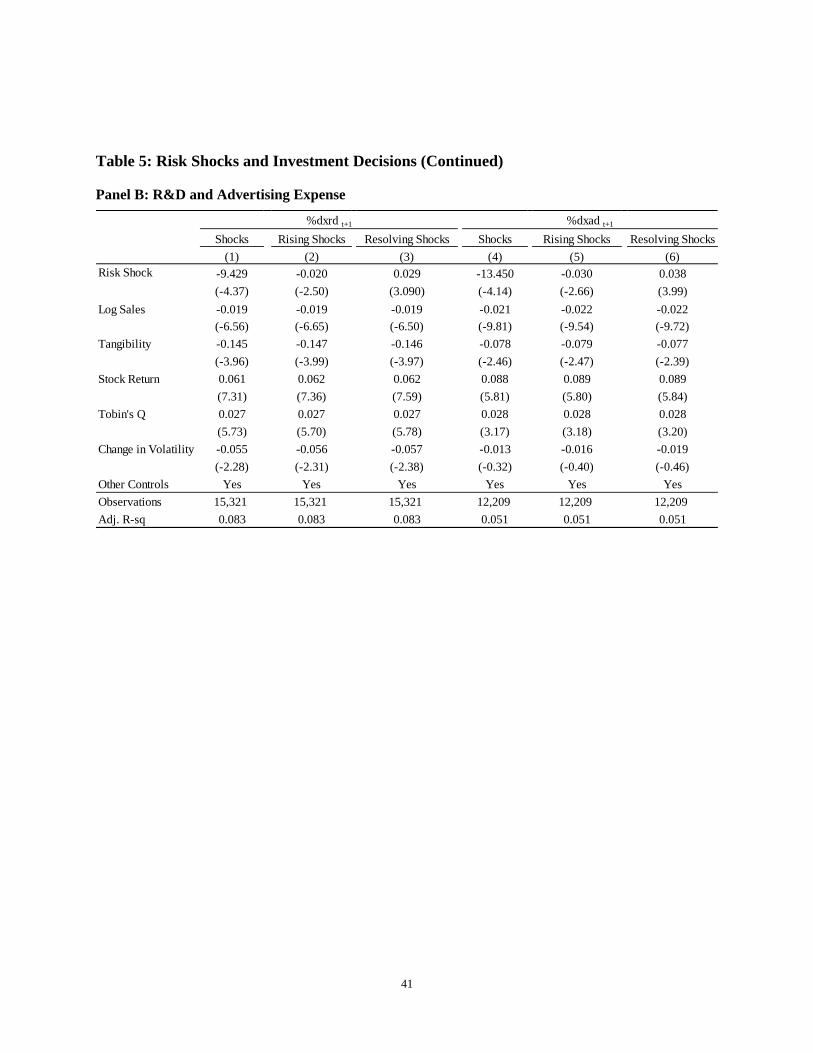
41
Table 5: Risk Shocks and Investment Decisions (Continued)
Panel B: R&D and Advertising Expense
Shocks Rising Shocks Resolving Shocks Shocks Rising Shocks Resolving Shocks
(1) (2) (3) (4) (5) (6)
-9.429 -0.020 0.029 -13.450 -0.030 0.038
(-4.37) (-2.50) (3.090) (-4.14) (-2.66) (3.99)
Log Sales -0.019 -0.019 -0.019 -0.021 -0.022 -0.022
(-6.56) (-6.65) (-6.50) (-9.81) (-9.54) (-9.72)
Tangibility -0.145 -0.147 -0.146 -0.078 -0.079 -0.077
(-3.96) (-3.99) (-3.97) (-2.46) (-2.47) (-2.39)
Stock Return 0.061 0.062 0.062 0.088 0.089 0.089
(7.31) (7.36) (7.59) (5.81) (5.80) (5.84)
Tobin's Q 0.027 0.027 0.027 0.028 0.028 0.028
(5.73) (5.70) (5.78) (3.17) (3.18) (3.20)
Change in Volatility -0.055 -0.056 -0.057 -0.013 -0.016 -0.019
(-2.28) (-2.31) (-2.38) (-0.32) (-0.40) (-0.46)
Other Controls Yes Yes Yes Yes Yes Yes
Observations 15,321 15,321 15,321 12,209 12,209 12,209
Adj. R-sq 0.083 0.083 0.083 0.051 0.051 0.051
%dxrd t+1 %dxad t+1
Risk Shock
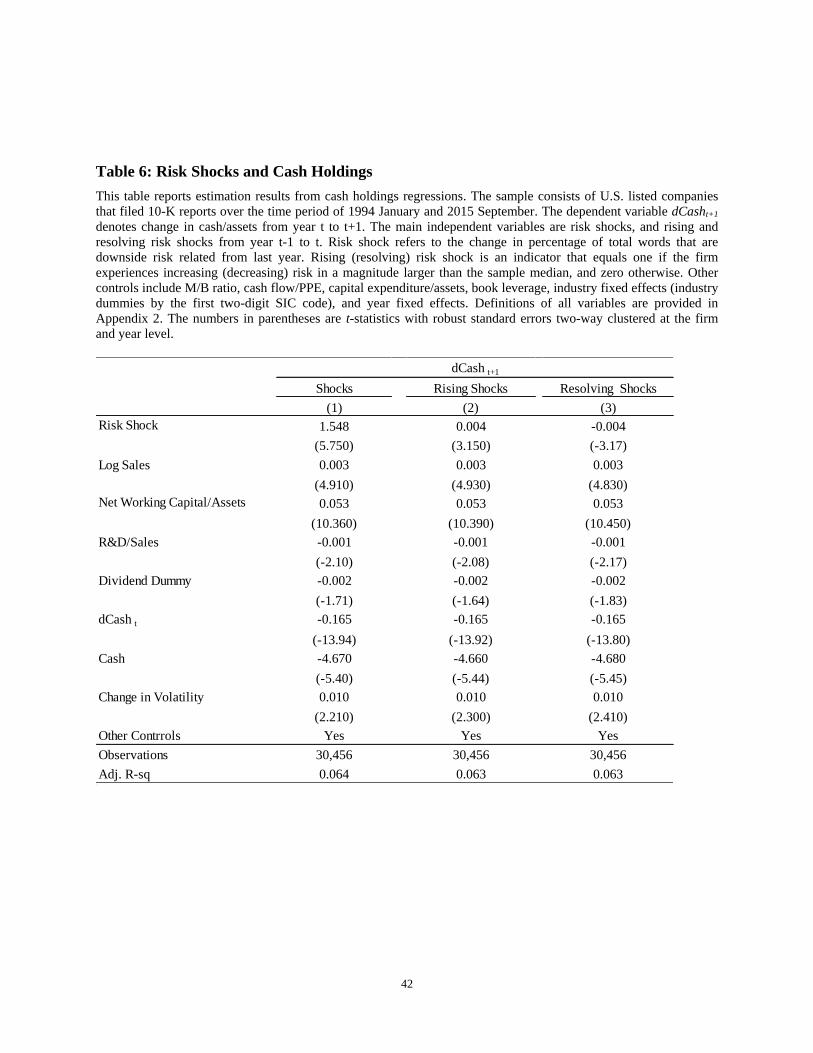
42
Table 6: Risk Shocks and Cash Holdings
This table reports estimation results from cash holdings regressions. The sample consists of U.S. listed companies
that filed 10-K reports over the time period of 1994 January and 2015 September. The dependent variable dCasht+1
denotes change in cash/assets from year t to t+1. The main independent variables are risk shocks, and rising and
resolving risk shocks from year t-1 to t. Risk shock refers to the change in percentage of total words that are
downside risk related from last year. Rising (resolving) risk shock is an indicator that equals one if the firm
experiences increasing (decreasing) risk in a magnitude larger than the sample median, and zero otherwise. Other
controls include M/B ratio, cash flow/PPE, capital expenditure/assets, book leverage, industry fixed effects (industry
dummies by the first two-digit SIC code), and year fixed effects. Definitions of all variables are provided in
Appendix 2. The numbers in parentheses are t-statistics with robust standard errors two-way clustered at the firm
and year level.
Shocks Rising Shocks Resolving Shocks
(1) (2) (3)
1.548 0.004 -0.004
(5.750) (3.150) (-3.17)
Log Sales 0.003 0.003 0.003
(4.910) (4.930) (4.830)
0.053 0.053 0.053
(10.360) (10.390) (10.450)
R&D/Sales -0.001 -0.001 -0.001
(-2.10) (-2.08) (-2.17)
Dividend Dummy -0.002 -0.002 -0.002
(-1.71) (-1.64) (-1.83)
dCash t -0.165 -0.165 -0.165
(-13.94) (-13.92) (-13.80)
Cash -4.670 -4.660 -4.680
(-5.40) (-5.44) (-5.45)
Change in Volatility 0.010 0.010 0.010
(2.210) (2.300) (2.410)
Other Contrrols Yes Yes Yes
Observations 30,456 30,456 30,456
Adj. R-sq 0.064 0.063 0.063
dCash t+1
Risk Shock
Net Working Capital/Assets
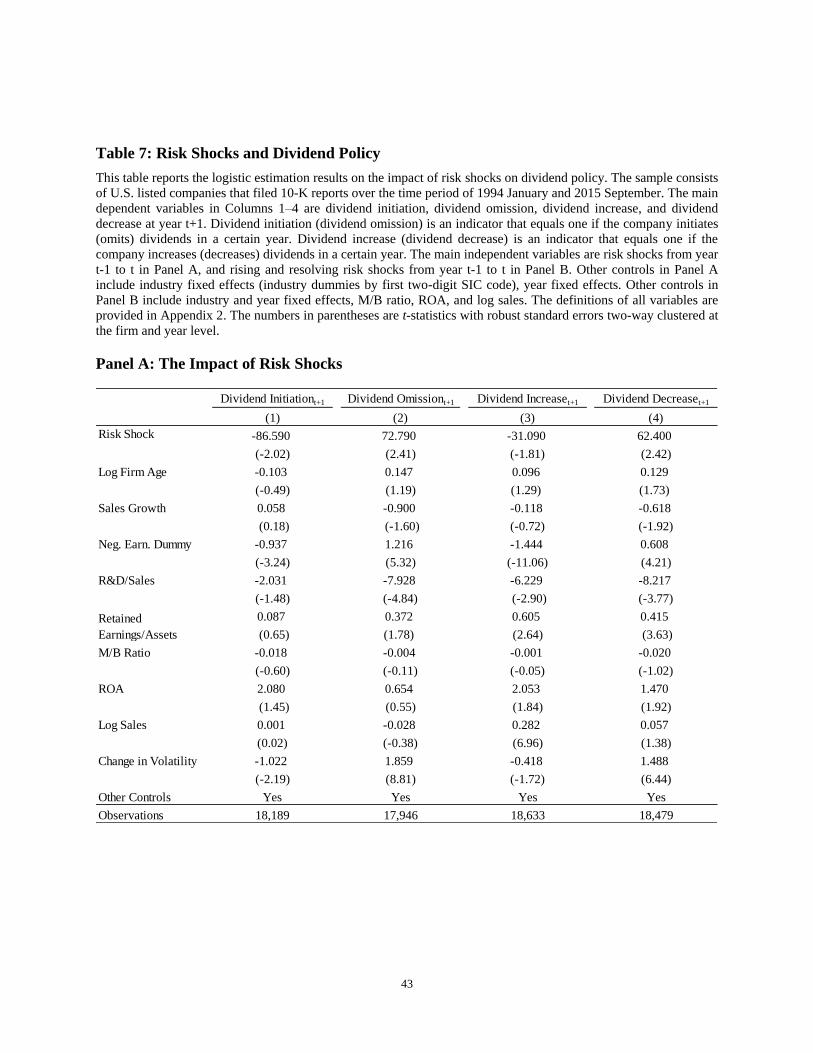
43
Table 7: Risk Shocks and Dividend Policy
This table reports the logistic estimation results on the impact of risk shocks on dividend policy. The sample consists
of U.S. listed companies that filed 10-K reports over the time period of 1994 January and 2015 September. The main
dependent variables in Columns 1–4 are dividend initiation, dividend omission, dividend increase, and dividend
decrease at year t+1. Dividend initiation (dividend omission) is an indicator that equals one if the company initiates
(omits) dividends in a certain year. Dividend increase (dividend decrease) is an indicator that equals one if the
company increases (decreases) dividends in a certain year. The main independent variables are risk shocks from year
t-1 to t in Panel A, and rising and resolving risk shocks from year t-1 to t in Panel B. Other controls in Panel A
include industry fixed effects (industry dummies by first two-digit SIC code), year fixed effects. Other controls in
Panel B include industry and year fixed effects, M/B ratio, ROA, and log sales. The definitions of all variables are
provided in Appendix 2. The numbers in parentheses are t-statistics with robust standard errors two-way clustered at
the firm and year level.
Panel A: The Impact of Risk Shocks
Dividend Initiationt+1 Dividend Omissiont+1 Dividend Increaset+1 Dividend Decreaset+1
(1) (2) (3) (4)
-86.590 72.790 -31.090 62.400
(-2.02) (2.41) (-1.81) (2.42)
Log Firm Age -0.103 0.147 0.096 0.129
(-0.49) (1.19) (1.29) (1.73)
Sales Growth 0.058 -0.900 -0.118 -0.618
(0.18) (-1.60) (-0.72) (-1.92)
Neg. Earn. Dummy -0.937 1.216 -1.444 0.608
(-3.24) (5.32) (-11.06) (4.21)
R&D/Sales -2.031 -7.928 -6.229 -8.217
(-1.48) (-4.84) (-2.90) (-3.77)
0.087 0.372 0.605 0.415
(0.65) (1.78) (2.64) (3.63)
M/B Ratio -0.018 -0.004 -0.001 -0.020
(-0.60) (-0.11) (-0.05) (-1.02)
ROA 2.080 0.654 2.053 1.470
(1.45) (0.55) (1.84) (1.92)
Log Sales 0.001 -0.028 0.282 0.057
(0.02) (-0.38) (6.96) (1.38)
Change in Volatility -1.022 1.859 -0.418 1.488
(-2.19) (8.81) (-1.72) (6.44)
Other Controls Yes Yes Yes Yes
Observations 18,189 17,946 18,633 18,479
Risk Shock
Retained
Earnings/Assets
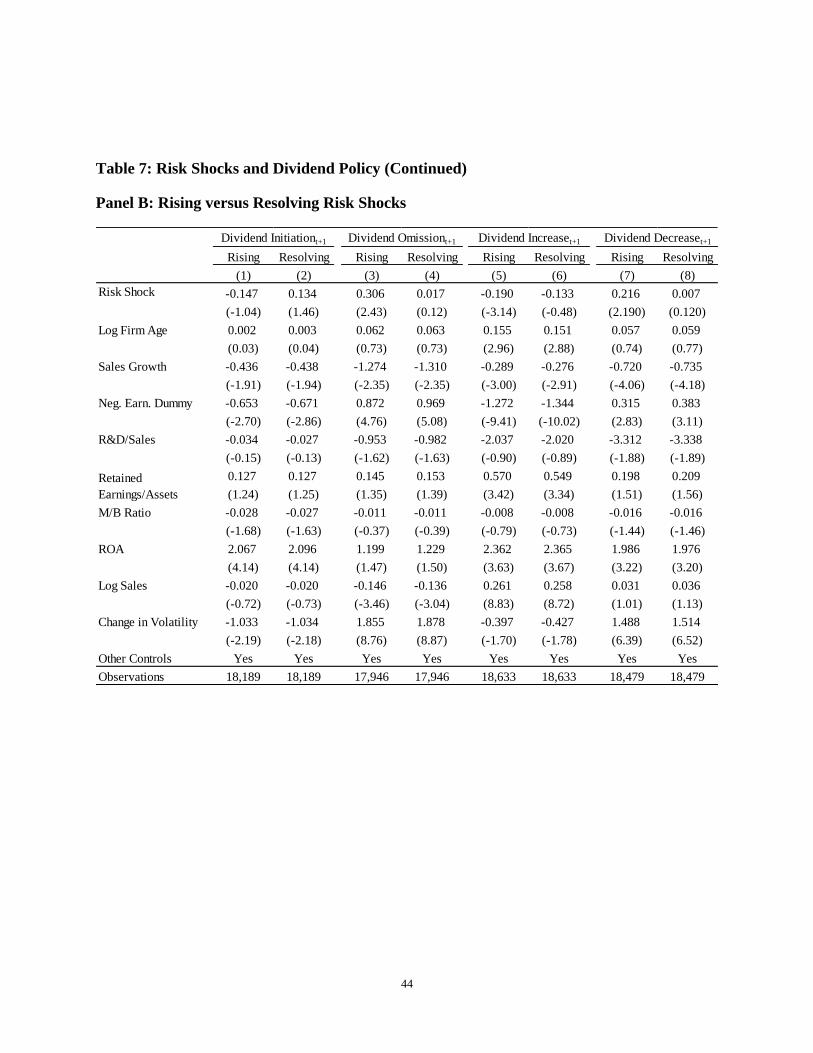
44
Table 7: Risk Shocks and Dividend Policy (Continued)
Panel B: Rising versus Resolving Risk Shocks
Rising Resolving Rising Resolving Rising Resolving Rising Resolving
(1) (2) (3) (4) (5) (6) (7) (8)
-0.147 0.134 0.306 0.017 -0.190 -0.133 0.216 0.007
(-1.04) (1.46) (2.43) (0.12) (-3.14) (-0.48) (2.190) (0.120)
Log Firm Age 0.002 0.003 0.062 0.063 0.155 0.151 0.057 0.059
(0.03) (0.04) (0.73) (0.73) (2.96) (2.88) (0.74) (0.77)
Sales Growth -0.436 -0.438 -1.274 -1.310 -0.289 -0.276 -0.720 -0.735
(-1.91) (-1.94) (-2.35) (-2.35) (-3.00) (-2.91) (-4.06) (-4.18)
Neg. Earn. Dummy -0.653 -0.671 0.872 0.969 -1.272 -1.344 0.315 0.383
(-2.70) (-2.86) (4.76) (5.08) (-9.41) (-10.02) (2.83) (3.11)
R&D/Sales -0.034 -0.027 -0.953 -0.982 -2.037 -2.020 -3.312 -3.338
(-0.15) (-0.13) (-1.62) (-1.63) (-0.90) (-0.89) (-1.88) (-1.89)
0.127 0.127 0.145 0.153 0.570 0.549 0.198 0.209
(1.24) (1.25) (1.35) (1.39) (3.42) (3.34) (1.51) (1.56)
M/B Ratio -0.028 -0.027 -0.011 -0.011 -0.008 -0.008 -0.016 -0.016
(-1.68) (-1.63) (-0.37) (-0.39) (-0.79) (-0.73) (-1.44) (-1.46)
ROA 2.067 2.096 1.199 1.229 2.362 2.365 1.986 1.976
(4.14) (4.14) (1.47) (1.50) (3.63) (3.67) (3.22) (3.20)
Log Sales -0.020 -0.020 -0.146 -0.136 0.261 0.258 0.031 0.036
(-0.72) (-0.73) (-3.46) (-3.04) (8.83) (8.72) (1.01) (1.13)
Change in Volatility -1.033 -1.034 1.855 1.878 -0.397 -0.427 1.488 1.514
(-2.19) (-2.18) (8.76) (8.87) (-1.70) (-1.78) (6.39) (6.52)
Other Controls Yes Yes Yes Yes Yes Yes Yes Yes
Observations 18,189 18,189 17,946 17,946 18,633 18,633 18,479 18,479
Dividend Omissiont+1 Dividend Increaset+1 Dividend Decreaset+1Dividend Initiationt+1
Risk Shock
Retained
Earnings/Assets
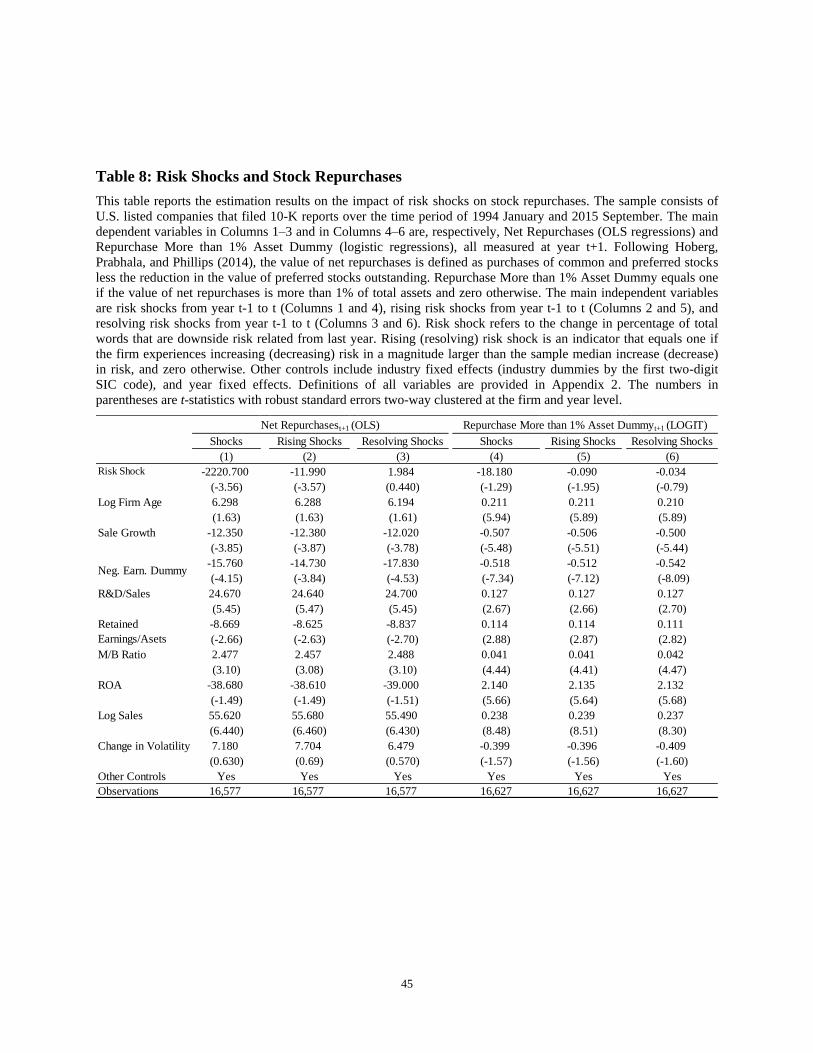
45
Table 8: Risk Shocks and Stock Repurchases
This table reports the estimation results on the impact of risk shocks on stock repurchases. The sample consists of
U.S. listed companies that filed 10-K reports over the time period of 1994 January and 2015 September. The main
dependent variables in Columns 1–3 and in Columns 4–6 are, respectively, Net Repurchases (OLS regressions) and
Repurchase More than 1% Asset Dummy (logistic regressions), all measured at year t+1. Following Hoberg,
Prabhala, and Phillips (2014), the value of net repurchases is defined as purchases of common and preferred stocks
less the reduction in the value of preferred stocks outstanding. Repurchase More than 1% Asset Dummy equals one
if the value of net repurchases is more than 1% of total assets and zero otherwise. The main independent variables
are risk shocks from year t-1 to t (Columns 1 and 4), rising risk shocks from year t-1 to t (Columns 2 and 5), and
resolving risk shocks from year t-1 to t (Columns 3 and 6). Risk shock refers to the change in percentage of total
words that are downside risk related from last year. Rising (resolving) risk shock is an indicator that equals one if
the firm experiences increasing (decreasing) risk in a magnitude larger than the sample median increase (decrease)
in risk, and zero otherwise. Other controls include industry fixed effects (industry dummies by the first two-digit
SIC code), and year fixed effects. Definitions of all variables are provided in Appendix 2. The numbers in
parentheses are t-statistics with robust standard errors two-way clustered at the firm and year level.
Shocks Rising Shocks Resolving Shocks Shocks Rising Shocks Resolving Shocks
(1) (2) (3) (4) (5) (6)
-2220.700 -11.990 1.984 -18.180 -0.090 -0.034
(-3.56) (-3.57) (0.440) (-1.29) (-1.95) (-0.79)
Log Firm Age 6.298 6.288 6.194 0.211 0.211 0.210
(1.63) (1.63) (1.61) (5.94) (5.89) (5.89)
Sale Growth -12.350 -12.380 -12.020 -0.507 -0.506 -0.500
(-3.85) (-3.87) (-3.78) (-5.48) (-5.51) (-5.44)
-15.760 -14.730 -17.830 -0.518 -0.512 -0.542
(-4.15) (-3.84) (-4.53) (-7.34) (-7.12) (-8.09)
R&D/Sales 24.670 24.640 24.700 0.127 0.127 0.127
(5.45) (5.47) (5.45) (2.67) (2.66) (2.70)
-8.669 -8.625 -8.837 0.114 0.114 0.111
(-2.66) (-2.63) (-2.70) (2.88) (2.87) (2.82)
M/B Ratio 2.477 2.457 2.488 0.041 0.041 0.042
(3.10) (3.08) (3.10) (4.44) (4.41) (4.47)
ROA -38.680 -38.610 -39.000 2.140 2.135 2.132
(-1.49) (-1.49) (-1.51) (5.66) (5.64) (5.68)
Log Sales 55.620 55.680 55.490 0.238 0.239 0.237
(6.440) (6.460) (6.430) (8.48) (8.51) (8.30)
Change in Volatility 7.180 7.704 6.479 -0.399 -0.396 -0.409
(0.630) (0.69) (0.570) (-1.57) (-1.56) (-1.60)
Other Controls Yes Yes Yes Yes Yes Yes
Observations 16,577 16,577 16,577 16,627 16,627 16,627
Net Repurchasest+1 (OLS) Repurchase More than 1% Asset Dummyt+1 (LOGIT)
Risk Shock
Retained
Earnings/Asets
Neg. Earn. Dummy

46
Table 9: Interactions with Firm Characteristics
This table examines interaction effects between risk shocks and firm characteristics. The sample consists of U.S.
listed companies that filed 10-K reports over the time period of 1994 January and 2015 September. We examine
change in leverage in Panel A, investment in Panel B, cash holdings in Panel C, and dividend and repurchase policy
in Panel D and E, all measured at year t+1. The key independent variables include risk shock, firm dummy, and the
interaction term between them, all measured at year t. For each policy examined, we use the same control variables
as in previous analyses, except that in regressions related to firm size, we drop log sales as the control variable to
avoid the potential collinearity issue between log sales and the dummy variable of firm size. Firm dummy is an
indicator that equals one if the firm's asset is larger than sample median asset level in Column 1, if the firm's earning
(EBIT) is negative in Column 2, or if the firm's S&P long term bond rating is higher than or equal to BBB, and zero
otherwise in Column 3. The numbers in parentheses are t-statistics with robust standard errors clustered at the firm
and year level.
Large Firms Negative Earning Investment Grade
(1) (2) (3)
Risk Shock -2.165 -1.628 0.346
(-3.12) (-3.10) (0.52)
1.915 0.966 -0.178
(2.44) (1.18) (-0.18)
Risk Shock -10.120 -0.264 -9.556
(-1.39) (-0.05) (-1.15)
13.430 -7.428 1.183
(1.52) (-0.83) (0.11)
Risk Shock -5.297 -2.166 -0.713
(-3.98) (-2.32) (-0.44)
2.792 -4.417 -0.599
(1.80) (-2.68) (-0.29)
Risk Shock -22.810 -10.060 -11.720
(-4.51) (-2.43) (-1.83)
15.350 -4.761 7.849
(3.28) (-0.61) (0.98)
Risk Shock 1.182 0.631 0.211
(1.93) (1.3) (0.31)
-0.40 0.85 0.49
(-0.53) (1.06) (0.49)
Risk Shock *Firm Dummy
Risk Shock *Firm Dummy
Risk Shock *Firm Dummy
Panel A: Leverage Adjustment
Panel B: Investment Adjustment
Dependent Variable: %dxrd t+1
Dependent Variable: %demp t+1
Risk Shock *Firm Dummy
Dependent Variable: dlev t+1
Dependent Variable: %dcapx t+1
Risk Shock *Firm Dummy
Panel C: Cash Holdings Adjustment
Dependent Variable: dcash t+1

47
Table 9: Interactions with Firm Characteristics (Continued)
Large Firms Negative Earning Investment Grade
(1) (2) (3)
Risk Shock 25.29 -11.84 -182.50
(0.47) (-0.25) (-1.95)
-78.37 -32.370 67.320
(-1.00) (-0.29) (0.40)
Risk Shock -31.39 -20.44 164.40
(-0.50) (-0.38) (1.77)
191.70 154.90 -254.10
(1.53) (2.06) (-1.97)
Risk Shock 11.25 -32.53 -63.28
(0.34) (1.87) (-1.48)
16.58 -95.59 62.91
(0.45) (-1.74) (0.96)
Risk Shock -15.91 -3.717 77.48
(-0.35) (-0.12) (-1.48)
64.07 91.33 -103.9
(1.22) (1.88) (-0.94)
Risk Shock -1.76 -9.35 -75.08
(-0.09) (-0.66) (-1.91)
-30.80 -27.33 140.90
(-1.27) (-0.99) (1.87)
Risk Shock *Firm Dummy
Dependent Variable: Dividend Increase t+1 (Logistic Model)
Dependent Variable: Dividend Decrease t+1 (Logistic Model)
Dependent Variable: Net Repurchases t+1
Panel E: Repurchase Policy Adjustment
Risk Shock *Firm Dummy
Risk Shock *Firm Dummy
Risk Shock *Firm Dummy
Risk Shock *Firm Dummy
Panel D: Dividend Policy Adjustment
Dependent Variable: Dividend Initiation t+1 (Logistic Model)
Dependent Variable: Dividend Omission t+1 (Logistic Model)
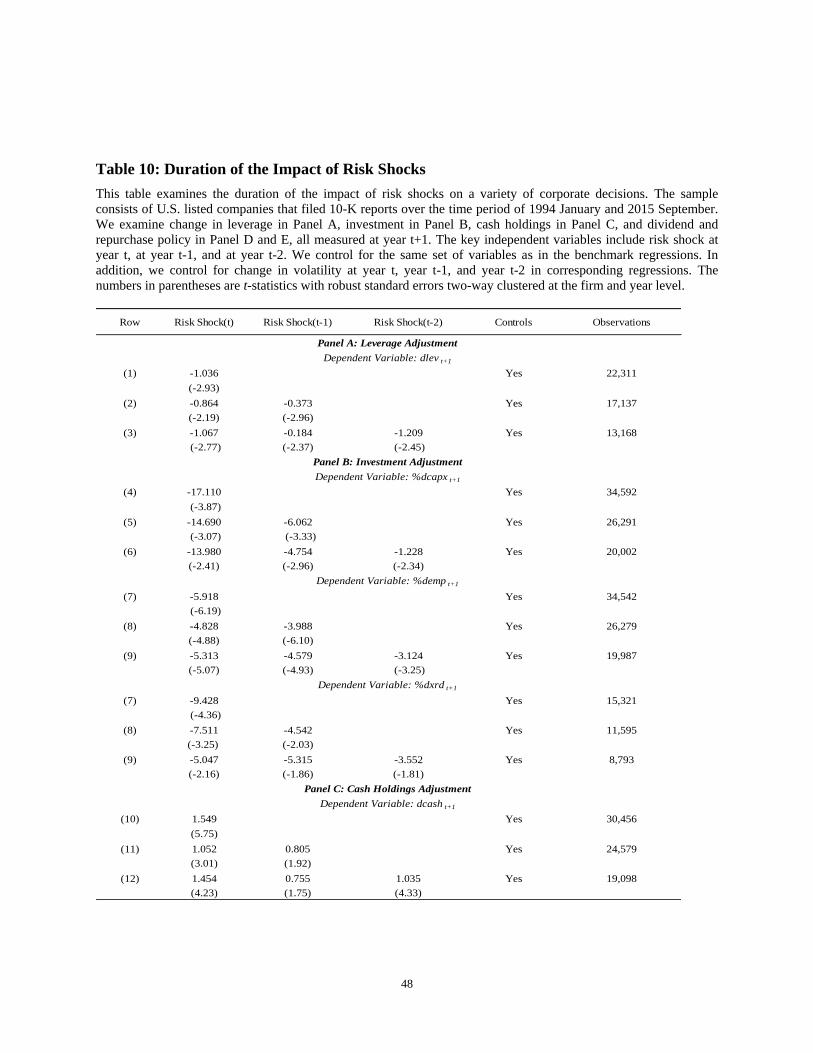
48
Table 10: Duration of the Impact of Risk Shocks
This table examines the duration of the impact of risk shocks on a variety of corporate decisions. The sample
consists of U.S. listed companies that filed 10-K reports over the time period of 1994 January and 2015 September.
We examine change in leverage in Panel A, investment in Panel B, cash holdings in Panel C, and dividend and
repurchase policy in Panel D and E, all measured at year t+1. The key independent variables include risk shock at
year t, at year t-1, and at year t-2. We control for the same set of variables as in the benchmark regressions. In
addition, we control for change in volatility at year t, year t-1, and year t-2 in corresponding regressions. The
numbers in parentheses are t-statistics with robust standard errors two-way clustered at the firm and year level.
Row Risk Shock(t) Risk Shock(t-1) Risk Shock(t-2) Controls Observations
(1) -1.036 Yes 22,311
(-2.93)
(2) -0.864 -0.373 Yes 17,137
(-2.19) (-2.96)
(3) -1.067 -0.184 -1.209 Yes 13,168
(-2.77) (-2.37) (-2.45)
(4) -17.110 Yes 34,592
(-3.87)
(5) -14.690 -6.062 Yes 26,291
(-3.07) (-3.33)
(6) -13.980 -4.754 -1.228 Yes 20,002
(-2.41) (-2.96) (-2.34)
(7) -5.918 Yes 34,542
(-6.19)
(8) -4.828 -3.988 Yes 26,279
(-4.88) (-6.10)
(9) -5.313 -4.579 -3.124 Yes 19,987
(-5.07) (-4.93) (-3.25)
(7) -9.428 Yes 15,321
(-4.36)
(8) -7.511 -4.542 Yes 11,595
(-3.25) (-2.03)
(9) -5.047 -5.315 -3.552 Yes 8,793
(-2.16) (-1.86) (-1.81)
(10) 1.549 Yes 30,456
(5.75)
(11) 1.052 0.805 Yes 24,579
(3.01) (1.92)
(12) 1.454 0.755 1.035 Yes 19,098
(4.23) (1.75) (4.33)
Dependent Variable: %demp t+1
Panel A: Leverage Adjustment
Dependent Variable: dlev t+1
Panel B: Investment Adjustment
Dependent Variable: %dcapx t+1
Dependent Variable: %dxrd t+1
Panel C: Cash Holdings Adjustment
Dependent Variable: dcash t+1

49
Table 10: Duration of the Impact of Risk Shocks (Continued)
Row Risk Shock(t) Risk Shock(t-1) Risk Shock(t-2) Controls Observations
(13) -86.590 Yes 18,189
(-2.02)
(14) -84.650 15.990 Yes 13,248
(-1.77) (0.47)
(15) -72.340 34.140 10.930 Yes 9,426
(-1.16) (1.00) (0.25)
(16) 72.790 Yes 17,946
(2.41)
(17) 79.150 74.270 Yes 12,952
(2.30) (1.45)
(18) 53.850 53.730 -67.330 Yes 8,735
(1.11) (0.79) (-1.18)
(19) -31.090 Yes 18,633
(-1.81)
(20) -25.700 -21.490 Yes 13,517
(-1.18) (-0.99)
(21) -8.480 -2.818 17.780 Yes 9,823
(-0.37) (-0.11) (0.79)
(22) 62.400 Yes 18,479
(2.79)
(23) 60.120 12.050 Yes 13,384
(2.31) (1.48)
(24) 62.270 12.330 11.770 Yes 9,705
(2.04) (2.36) (1.04)
(25) -2221.500 Yes 16,577
(-3.56)
(26) -2868.300 -1687.900 Yes 12,177
(-3.15) (-3.40)
(27) -3531.300 -1692.500 -508.700 Yes 8,952
(-3.72) (-2.19) (-0.58)
Dependent Variable: Dividend Decrease t+1 (Logistic Model)
Panel E: Repurchase Policy Adjustment
Dependent Variable: Net Repurchase t+1
Panel D: Dividend Policy Adjustment
Dependent Variable: Dividend Initiation t+1 (Logistic Model)
Dependent Variable: Dividend Omission t+1 (Logistic Model)
Dependent Variable: Dividend Increase t+1 (Logistic Model)

50
Appendix 1.A: List of Downside Risk Related Keywords
This table present the list of key word stem and corresponding key words for constructing the downside risk
measure.
Key Word Stem Key Words
accid accident accidents
advers adverse adversely adversity adversities
compet compete competent competing competes competencies competence competency competed competently
competi competition competitions
competit competitive competitiveness competitively
competitor competitors competitor
crisis crisis
difficult difficult
difficulti difficulties difficulty
downgrad downgrade downgraded downgrades downgrading
downturn downturn downturns
downward downward
fail fail fails failed failing
failur failure failures
impair impairment impaired impair impairments impairing impairs
inconsist inconsistent inconsistency inconsistencies inconsistently
lose lose losing loses
loss loss losses
lost lost
neg negative negatively negatives
nonperform nonperforming nonperformance
pressur pressure pressures pressured pressurized pressurization pressuring pressurizer pressurize
risk risk risks risked risking
riski risky riskiness
slowdown slowdown slowdowns
unabl unable
weaken weakening weakened weaken weakens
weaker weaker
weak weaknesses weakness

51
Appendix 1.B: Examples with Downside Risk Related Key Word Stems This table presents examples of sentences in 10-K filings for each downside risk related key word stems.
Key Word Stem Sentences
accid* While we believe that we are currently in compliance with all material rules and regulations governing the
use of hazardous materials and, to date, we have not had any adverse experiences, in the event of an accident
or environmental discharge, we may be held liable for any resulting damages, which may exceed our
financial resources and may materially harm our business, financial condition and results of operations.(
AVALON PHARMACEUTICALS INC, 2008/03/31)
advers* We cannot assure you that future compliance with these regulations, future environmental liabilities, the cost
of defending environmental claims, conducting any environmental remediation or generally resolving
liabilities caused by us or related third parties will not have a material adverse effect on our business,
financial condition or results of operations. (AMERCO, 2006/06/13)
compet* Our inability to compete effectively against these companies or to maintain our relationships with the
various automobile dealers through whom we offer consumer loans could limit the growth of our
consumer loan business. Economic and credit market downturns could reduce the ability of our customers
to repay loans, which could cause our consumer loan portfolio losses to increase. (FRANKLIN
RESOURCES INC, 2002/12/18)
competi* Our profitability is therefore affected by the prices of lumber which may fluctuate based on a number of
factors beyond our control, including, among others, changes in supply and demand, general economic
conditions, labor costs, competition and, in some cases, government regulation.( WII Components, Inc.,
2007/03/28)
competit* Changes in industry conditions and the competitive environment may impact the accuracy of the Company's
projections.( ALPINE GROUP INC, 2002/04/04)
competitor* The determination as to when in the product development cycle technological feasibility has been
established, and the expected product life, require judgments and estimates by management and can be
affected by technological developments, innovations by competitors and changes in market conditions
affecting demand.( HURCO COMPANIES INC, 2005/01/21)
crisis* The current credit crisis may also have a potential impact on our need to obtain additional financing in the
future and may impact the determination of fair values, financial instrument classification, or require
impairments in the future.( IDM PHARMA, INC., 2009/03/31)
difficult* Although the acquisition of Carlisle Power Transmission was accretive in 2001, earnings in this segment fell
due to extremely difficult market conditions and much lower production levels. Also contributing to the
lower earnings was intense competitive pressure requiring price concessions to maintain market share.(
CARLISLE COMPANIES INC, 2002/03/21)
difficulti* Thus, our chances of financial and operational success should be evaluated in light of the risks, uncertainties,
expenses, delays and difficulties associated with operating a business in a relatively new and unproven
market or a new business in an existing market, many of which may be beyond our control.( GLOBAL
SPORTS INC, 2002/04/04)
downgrad* If uncertainties in these markets continue, these markets deteriorate further or the Company experiences any
additional ratings downgrades on any investments in its portfolio (including on ARS), the Company may
incur additional impairments to its investment portfolio, which could negatively affect the Company ’ s
financial condition, cash flow and reported earnings.( BRISTOL MYERS SQUIBB CO, 2008/02/22)
downturn* Furthermore, customers who benefit from shorter lead times may defer some purchases to future periods,
which could affect our demand and revenues for the short term. As a result, we may experience downturns or
fluctuations in demand in the future and experience adverse effects on our operating results and financial
condition.( LSI LOGIC CORP, 2000/12/31)

52
downward* Tunneling gross margins continued to suffer in 2005 from the continuation of large projects that experienced
downward gross margin revisions.( INSITUFORM TECHNOLOGIES INC, 2007/02/23)
fail* If we fail to obtain additional capital, we may be required to significantly reduce, or refocus, our operations
and our business, results of operations and financial condition could be materially and adversely effected.
( ANDREA ELECTRONICS CORP, 2001/03/30)
failur* A failure of the Company to improve its accounts receivable collections from the State of California could
have a material adverse effect on the Company ’ s business, financial condition and operating results.
( CURATIVE HEALTH SERVICES INC, 2006/04/11)
impair* Our investment in DISC common stock at October 31, 2009 is recorded at fair value of approximately
$198,000 including a write-down of approximately $124,000 as a result of an other than temporary
impairment, and has exposure to price risk.( COPYTELE INC, 2010/01/29)
inconsist* Acquisition candidates brought to our attention through Mr. Penteliuk may include clients of Genuity
Financial Group or its subsidiaries and Genuity Financial Group and its subsidiaries may have contractual,
fiduciary or other obligations to these clients which may be inconsistent with, or adverse to, our interests
and the interests of our stockholders. ( TAILWIND FINANCIAL INC, 2008/09/15)
lose* Qualifying a new contract manufacturer and commencing volume production can be expensive and time
consuming. If we are required to change or choose to change contract manufacturers, we may lose revenue
and damage our customer relationships.(MCDATA CORP, 2001/03/02)
loss* Notwithstanding this, inflation can directly affect the value of loan collateral, in particular real estate. Sharp
decreases in real estate prices have, in past years, resulted in significant loan losses and losses on real estate
acquired. Inflation, or disinflation, could significantly affect NewMil's earnings in future periods.(NEWMIL
BANCORP INC, 2002/03/29)
lost We have experienced delays in the introduction of new products due to various factors, resulting in lost
revenue.( NOVELL INC, 2007/05/25)
neg* As a result of the activities of the FDA, the CDC and the Secretary's Advisory Committee on Genetic Testing,
it is possible that our existing and future assays may be subject to a regulatory approval similar to the pre-
marketing approval process which the FDA applies to drugs and medical devices, or may be subject to other
increased regulatory standards, which could have a negative effect on our business.(SPECIALTY
LABORATORIES, 2001/03/30)
nonperform* Sotheby’s counterparties to these sharing arrangements are typically international art dealers or prominent art
collectors. Sotheby’ s could be exposed to losses in the event of nonperformance by these counterparties.
(SOTHEBYS, 2009/02/27)
pressur* These competitive pressures could result in increased pricing pressures on a number of our products and
services, particularly as competitors seek to win market share, and may harm our ability to maintain or
increase our profitability.( HARTFORD LIFE INSURANCE CO, 2007/02/23)
risk* Because we market products to the public, we face an inherent business risk of financial exposure to product
liability claims. As a publisher of online content, we face potential liability for defamation, negligence,
copyright, patent or trademark infringement, or other claims based on the nature and content of materials that
we publish or distribute.( SCIENTIFIC LEARNING CORP, 2002/03/29)
riski* If we acquire additional businesses, these acquisitions will involve financial uncertainties as well as
personnel contingencies, and may be risky and difficult to integrate.( PARLEX CORP, 2003/10/14)
slowdown* The current economic slowdown has been more profound in the telecommunications market resulting in a
significant reduction in capital expenditures for products such as our DWDMs and our fiber optic
components. It is impossible to predict how long the slowdown will last.(APA OPTICS INC, 2003/07/01)

53
unabl* If the Company loses the services of key personnel or if it is unable to attract additional qualified personnel,
the Company’s business and the price of its Common Stock could be materially and adversely affected.(CT
COMMUNICATIONS INC, 2007/03/07)
weaken* In fiscal 2001, weakening local currencies negatively impacted translated revenue compared to the prior
year. Revenue in the region would have increased 6% if foreign exchange rates were constant with those of
the prior year.( MICROSOFT CORP, 2001/09/18)
weaker For example, higher gasoline prices in 2007 contributed to weaker demand in North America for certain
vehicles for which we supply products, especially full-size SUVs and pick-up trucks. If gasoline prices
remain high or continue to rise, the demand for such vehicles could weaken further and the recent shift in
consumer interest to passenger cars and CUVs, in preference to SUVs and pick-up trucks, could be
accelerated.(DANA HOLDING CORP, 2008/03/14)
weak* As a result, our financial results could be significantly affected by factors such as changes in foreign currency
exchange rates or weak economic conditions in the foreign markets in which we distribute our products.(
INTERFACE INC, 2010/03/16)
54
Appendix 2 Data Construction
We use the book leverage ratio, measured by the ratio of total liabilities to total assets, as a
proxy for capital structure. The main independent variable, active change in book leverage (dlev
t+1), is then computed as change in book leverage ratio from year t to t+1, excluding the effects
of change in retained earnings. Following previous literature (see, for example, Harris and Raviv,
1991; Frank and Goyal, 2009), our control variables in capital structure regressions include: (1)
lagged book leverage ratio; (2) change in stock return volatility; (3) log of sales as a proxy for
size; (4) annual stock return; (5) tangibility measured by the ratio of gross properties, plant, and
equipment (PPE) to total assets; (6) market-to-book ratio as a proxy for growth; (7) EBIT
divided by total assets (ROA) as a proxy for profitability; (8) effective corporate tax rate; (9)
short-term solvency measured by the ratio of cash to interest expenses; (10) dividend yield
measured by the ratio of common equity dividends to the market value of common equity; (11)
external financing, measured by financial deficit normalized by sales.1 We also control for
macro conditions including the annual S&P 500 value-weighted return, constant one-year
maturity Treasury bill yield, default risk premium measured by the yield difference between the
Moody’s Baa and Aaa rated corporate bonds, VIX, and industrial production growth.
Next, we compute the percentage change in capital expenditure from year t to t+1, %dcapx
t+1, as one primary policy variable in investment regressions. We also compute %dempt+1 as the
1 We follow Chen, Wang, and Zhou (2014) to compute financial deficit as the difference between cash outflow and internally
generated cash flow. In particular, cash outflow includes investment in PPE and intangible assets, and increase in working capital.
Internally generated cash flow is the sum of net income, depreciation and amortization, and deferred tax minus dividend payouts.
55
percentage change in employment to proxy for firms’ investment in human capital. The
percentage change in R&D expenses and advertising expenses, %dxrdt+1 and %dxadt+1,
establishes longer-term investment in R&D and product development. Following Panousi and
Papanikolaou (2012), our control variables in predicting adjustments in capital expenditure,
employment, and R&D policies are: (1) ratio of cash flow (measured as earnings before
extraordinary items plus depreciation) to PPE; (2) Tobin’s Q computed as the ratio of market
value of assets to book value of assets; (3) change in return volatility; (4) market leverage,
measured as total liabilities divided by the sum of total liabilities and market value of equity; (5)
log of sales; (6) ROA; (7) tangibility measured by the ratio of gross properties, plant, and
equipment (PPE) to total assets; (8) market-to-book ratio as a proxy for growth.
We define change in cash holdings, dcasht+1, as the change in the ratio of the sum of cash,
cash equivalent and short-term investments to total assets. Following previous literature (e.g.,
Bates, Kahle, and Stulz, 2009; Hoberg, Phillips, and Prabhala, 2014; Gao, Harford, and Li, 2014),
we incorporate the following control variables: (1) lagged cash as the sum of cash and short-term
investments (cashi,t); (2) lagged change in cash holdings (dcashi,t); (3) ratio of net working
capital to total assets; (4) Dividend Dummy, which equals one if common dividends are paid and
zero otherwise; (5) ratio of R&D expenses to sales; (6) ratio of capital expenditure to total assets;
(7) log of sales; (8) change in stock return volatility; (9) book leverage ratio; (10)market-to-book
ratio as a proxy for growth; (11) ratio of cash flow (measured as earnings before extraordinary
items plus depreciation) to PPE.
As in Hoberg, Phillips, and Prabhala (2014), we develop four measures to examine
56
changes in dividend payout policy: (i) Dividend Initiation i,t+1, which equals one if a firm initiates
dividend payments and zero otherwise; (ii) Dividend Omission i,t+1, which equals one if a firm
terminates dividends and zero otherwise; (iii) Dividend Increase i,t+1, which equals one if a firm
increases dividend payments and zero otherwise; (iv) Dividend Decrease i,t+1, which equals one
if a firm decreases dividend payments and zero otherwise. The first two measures capture abrupt
changes in dividend policy, while the follow-ups reflect moderate adjustment in payouts.
Following Hoberg, Phillips, and Prabhala (2014) and Farre-Mensa, Michaely, and Schmalz
(2014), we consider the following control variables in the dividend policy regressions: (1) log
firm age where age is the number of years since the date of IPO; (2) sales growth as percentage
change in net sales; (3) Negative Earnings Dummy equals one if net income is negative and zero
otherwise; (4) ratio of retained earnings to total assets as a proxy for firm maturity; (5) log of
sales; (6) ratio of R&D to sales; (7) market-to-book ratio; (8) change in stock return volatility;
and (9) ROA.
We construct an indicator variable, Repurchase More than 1% Asset Dummy, which equals
one if the value of net stock repurchases is over 1% of total assets, and zero otherwise. Following
Hoberg, Prabhala, and Phillips (2014), we define the value of net repurchases as purchase of
common and preferred stocks less the reduction in the value of outstanding preferred stocks. We
also use the value of net repurchases as an alternative policy variable. We use the same set of
control variables as in the dividend policy regressions.

57
Appendix 3: Variable Definitions
Variable Definitions
Text-based Risk Variables
Total Meaningful Words in 10K Files Total number of meaningful word stems in the entire 10k file.
Downside Risk-Related Words in
10K Files
Total number of downside risk related word stems (shown in Appendix 1) in the entire 10k
file.
Risk Level The ratio of downside risk-related words to total meangingful words in 10K files.
Risk Shock Annual change in Risk Level.
Rising Risk Shock A dummy variable that equals one when the firm experiences rising risk in a magnitude
larger than the median increase in risk level (i.e., 0.09%), and zero otherwise
Resolving Risk Shock A dummy variable that equals one when the firm experiences decreasing risk in a
magnitude larger than the median decrease in risk level (i.e., -0.06%), and zero otherwise.Corporate Policy Variables
Book Leverage Total liabilities/total assets.
Active change in Book Leverage
(dlev)
total liabilitiest/(total assetst-(retained earningst- retained earningst-1))- total liabilitiest-
1/total assetst-1
% Change in Debt (%dDebt) Annual percentage change in total liabilities: (total liabilitiest-total liabilitiest-1)/total
liabilitiest-1
% Change in Equity (%dEquity) Annual increase in stockholders' equity minus annual increase in retained earnings divided
by stockholders' equity last year: (shareholder's equityt-shareholder's equityt-1-(retained
earningst- retained earningst-1))/shareholder's equityt-1
Capital Expenditure Capital expenditure in million dollars.
% Change in Capital Expenditure
(%dcapx)
Percentage change in capital expenditure.
Employment Number of employees in thousand dollars.
% Change in Employment (%demp) Percentage change in Employment.
R&D Research and development expenses. We replace missing values with zero.
% Change in R&D (%dxrd) Percentage change in R&D.
Advertising Expense Research and development expenses. We replace missing values with zero.
% Change in Advertising Expense
(%dxad)
Percentage change in advertising expense.
Cash Cash and short term investments in million dollars.
Cash/Assets Cash and short term investments divided by total assets.
Change in Cash/Assets (dcash) Annual change in Cash/Assets.
Dividends (millions) Dividends declared on common equities in million dollars.
Dividend Initiation A dummy variable that equals one if the company innitiates dividends and zero otherwise.
Dividend Omission A dummy variable that equals one if the company omits dividends and zero otherwise.
Dividend Decrease A dummy variable that equals one if the company decreases dividends and zero otherwise.
Dividend Increase A dummy variable that equals one if the company increases dividends, and zero otherwise.
Net Repurchases Purchases of common and preferred stock (Compustat item "prstkc") less the reduction in
the value of preferred stocks outstanding (Compustat item "pstkrv").
Repurchase More than 1% Asset
Dummy
An indicator variable that equals one if Net Repurchases is more than 1% of total assets
and zero otherwise.

58
Appendix 3: Variable Definitions (Cont.)
Variable Definitions
Corporate Control Variables
Assets Total assets in million dollars.
Cash Flow/PPE Earnings before extraordinary items plus depreciation normalized by the amount of
property, plant, and equipment.
Cash/Interest Expenses Cash and short term investments divided by interest expense.
Credit Rating An indicator variable for S&P Domestic Long Term Issuer Credit Rating. It ranges from 2
(for "AAA" rating) to 29 ( for "SD" rating) .Dividend Yield Dividends per share divided by fiscal year end stock market price.
Earnings Volatility Standard deviation of operating income/total asset using past five year data.
Effective Tax Rate Income tax divided by pretax income.
Financial Deficit/Sales Difference between cash outflow and internally generated cash flow. Cash outflow includes
investment in PPE, intangible assets, and increase in net working capital. Internally
generated cash flow includes net income plus depreciation and amortization and deferred
tax minus dividends.
Firm Age Number of years since date of IPO.
Market Leverage (total assets - stockholders' equity)/(total assets - stockholders' equity + market value of
equity).
M/B Ratio Market value of equity divided by book value of equity.
Neg. Earn. Dummy A dummy variable that equals one if net income is negative, and zero otherwise.
Net Working Capital/Assets Net working capital divided by total assets.
R&D/Sales R&D divided by net sales.
Retained Earnings/Assets Retained earnings divided by total assets.
ROA EBIT divided by total assets.
Sales Net sales in million dollars.
Sales Growth Percentage of change in net sales.
Stock Return Annualized daily stock return in the fiscal year.
Stock Return Volatility Annualized daily stock return volatility including dividend.
Tangibility Net property, plants and equipments divided by total assets.
Tobin's Q The sum of total liabilities and market value of equities divided by book value of assets.
Macroeconomic Variables
Default Spread between Baa and
Aaa Bonds
Default Spread between Baa and Aaa rated Bonds.
Industrial Production Growth Industry production growth from one year ago.
Constant 1-year Maturity Treasury Bill
YieldConstant 1-year Maturity Treasury Bill Rate .
S&P 500 Return Annual return of S&P 500 index.
VIX CBOT option-implied annaulized volatility.


![View Filing Data - Energy ElevenAccounting Policies [Abstract] Significant Accounting Policies [Text Block] Note 2. Summary of Significant Accounting Policies Basis of Presentation](https://img.pdfslide.us/doc/110x75/603b5e6986e82e41465695c7/view-filing-data-energy-eleven-accounting-policies-abstract-significant-accounting.jpg)