Embed Size (px)
Citation preview

UCC Library and UCC researchers have made this item openly available.Please let us know how this has helped you. Thanks!
Title Optimisation of the food dairy coop supply chain
Author(s) Quinlan, Carrie Brigid
Publication date 2013
Original citation Quinlan, C. B. 2013. Optimisation of the food dairy coop supply chain.PhD Thesis, University College Cork.
Type of publication Doctoral thesis
Rights © 2013, Carrie Quinlanhttp://creativecommons.org/licenses/by-nc-nd/3.0/
Embargo information Please note that Chapter 9 (pp.225-261) is currently unavailable due to arestriction requested by the author.
Embargo lift date 10000-01-01
Item downloadedfrom
http://hdl.handle.net/10468/1197
Downloaded on 2021-12-25T18:24:09Z

i
Optimisation of the Food Dairy Coop Supply Chain
A dissertation presented to the Department of Food
Business and Development,
National University of Ireland, Cork,
In complete fulfilment of the requirements for the
Degree of Ph.D.
By
Carrie Quinlan B.Sc. M.Sc.
Supervisor: Dr. Michael Keane, Dr, Declan O’Connor, Dr. Pat
Enright and Dr. Laurence Shalloo
Head of Department: Professor Michael Ward
May 2013

ii
TABLE OF CONTENTS
LIST OF FIGURES viii
LIST OF TABLES x
DECLARATION xii
ACKNOWLEDGMENTS xiii
THESIS PUBLICATIONS AND PRESENTATIONS xiv
ABSTRACT xvi
Chapter 1: Introduction to the Research 1
1.1 Introduction to Research 1
1.2 Background to Research 1
1.3 Research Questions and Sub-questions 4
1.4 Research Objectives 5
1.5 Framework of Thesis 5
1.6 Conclusion 7
References 8
Chapter 2: Conceptual Framework 11
2.1 Introduction 11
2.2 Least cost location theory 11
2.3 Transport costs 12
2.4 Processing costs 13
2.5 Optimum costs 13
2.5 Conceptual framework of the thesis 14
2.6 Summary 14
References 16
Chapter 3: Competitiveness of the Irish Dairy Industry 19
3.1 Introduction 19

iii
3.2 Common Agricultural Policy 19
3.3. History of the Irish Dairy Industry 23
3.4. Milk Production Sector and Dairy Processing Sector 29
3.4.1 Milk Production Sector 29
3.4.2 Processing sector in Ireland 33
3.5 SWOT Analysis of the Irish Dairy Industry 35
3.5.1 Strengths 36
3.5.2 Weaknesses 36
3.5.3 Opportunities 37
3.5.4 Threats 40
3.5.6 SWOT summary 42
3.6 Conclusion 42
References 42
Chapter 4: Location theories and applications of operation
research-based techniques to location problems 46
4.1 Introduction 46
4.2 Plant location Theory 47
4.2.1 Classical location theory 48
4.2.2 Economic Geography 56
4.2.3 New Economic Geography 57
4.2.4 Porter’s Cluster theory 57
4.3 Operation research and application of operation research techniques
to location problems 59
4.3.1 Olson model to determine the optimal size of milk-processing plants
and optimal distances between plants in a cooperative dairy 59
4.3.2 Stollsteimer’s model to determine the number, size and location of
plants that minimise the combined transportation and processing 61
4.3.3 King and Logan’s model to determine the optimal location and size of
California cattle slaughtering plants 63
4.3.4 Polopolus model for determining the optimum plant numbers and
locations for multiple product processing 65

iv
4.3.5 O’ Dwyer’s model for determining of the optimum number, location,
and size of dairy manufacturing plants 67
4.3.6 Benseman production planning in the short/medium term in the New
Zealand dairy industry 70
4.3.7 Mellalieu/Hall production planning in the long term in the New
Zealand dairy industry 73
4.3.8 Optimisation of Nutricia supply network in Hungary 74
4.3.9 Tursun model to optimise biorefinery locations and transportation
network for the future biofuels industry in Illinois 77
4.3.10 Buschendorf, Boysen and Schroder models’ to optimise the German dairy
industry 79
4.4 Optimum location of the Irish dairy processing sector 83
4.5 Conclusion 89
References 92
Chapter 5: Methodology 96
5.1 Introduction 96
5.2 Data Collection 100
5.3 Research Methodology 105
5.4 Summary of steps in the methodology process 109
5.7 Conclusion 110
References 111
Chapter 6: The Transport Implications for Ireland of the
Elimination of the Milk Quota Regime in 2015 115
6.1 Introduction 118
6.2 Materials and Methods 121
6.2.1 Dairy Industry 121
6.2.1.1. Dairy Farmers 121
6.2.1.2 Milk Processors 122
6.2.1.3. Seasonality of Milk Production 122
6.2.2 Milk Transport Model 123
6.2.3 Description of Milk Transport Model 123

v
6.2.3.1 Capital Costs 124
6.2.3.2 Labour Costs 125
6.2.3.3 Running Costs 126
6.2.3.4 Carbon Emissions 127
6.2.3.5 Outputs 127
6.2.3.6 Assumptions 128
6.2.4 Milk Transport Scenarios 128
6.3 Results 129
6.3.1 Physical Outputs 129
6.3.1.1 Mileage from sub model 130
6.3.1.2 Total mileage 130
6.3.2 Financial outputs 130
6.3.2.1 Capital costs 130
6.3.2.2 Running costs 131
6.3.2.3 Labour costs 131
6.3.2.4 Total transport cost 131
6.3.3 Carbon Dioxide Emissions 131
6.4 Discussion 131
6.4.1 Transport Costs 131
6.4.2 Carbon Emissions 135
6.5 Conclusion 136
References 137
Chapter 7: Milk Transport Costs under differing seasonality
assumptions for the Irish Dairy Industry 149
7.1 Introduction 150
7.2 Materials and Methods 153
7.2.1 Components of Milk Transport 154
7.2.2 Cost data 155
7.2.3 Carbon emission 157
7.2.4 Scenarios explored 158
7.3 Results and Discussion 160
7.3.1 Physical outputs 160
7.3.2 Seasonal pattern of milk transport costs 161

vi
7.3.3 Impact of different milk supply patterns on milk transport costs 161
7.3.4 Effect of different milk supply output on transport costs 163
7.3.5 Environmental impacts 163
7.4 Conclusions 165
References 166
Chapter 8: Expansion Strategies for the Irish Dairy Industry 181
8.1 Introduction 182
8.2 Methodological Framework 185
8.2.1. Model Description 186
8.2.2: Scenarios 189
8.3 Results 191
8.3.1 Regional Expansion Capacity 191
8.3.2 Capacity of processors to absorb changes in milk production 191
8.3.3 Expansion of existing milk processing sites and collection by (2008 milk
supply) catchment area – Scenario 1 192
8.3.4 Expansion of existing milk processing sites and collection by optimum
catchment area – Scenario 2 193
8.3.5 Greenfield sites process the additional milk supply – Scenario 3 194
8.3.6 Optimum number and location of additional processing facilities 194
8.3.7 Sensitivity analysis 195
8.4 Discussion 196
References 200
Chapter 9: The interaction between economies of scale and
transport costs in the Irish dairy industry 225
ABSTRACT 226
9.1 Introduction 227
9.2 Materials and methods 229
9.2.1 Model Description 229
9.2.2 Scenario Analysis 237
9.2.3 Sensitivity Analysis 238
9.3 Results 238

vii
9.3.1 Industry Configuration 238
9.3.2 Total Costs 241
9.3.3 Capital requirement 241
9.3.4 Sensitivity Analysis 241
9.4 Discussion 242
9.4.1 Interaction between Economies of Scale and Transport Costs 242
9.4.2 Linear Processing Cost Function 244
9.4.3 Transport Costs 245
9.4.4 Product Mix 246
9.4.5 Other Factors 247
9.5 Conclusion 248
REFERENCES 249
Chapter 10: Conclusions 262
10.1 Introduction 262
10.2 Research Conclusions and Discussion 262
10.2.1. National milk transport model which allows for the examination of a
wide range of efficiency factors in milk transport 263
10.2.2 Milk processing capacity and the location of milk processing capacity
in 2020 267
10.2.3 Optimum dairy processing sector configuration in 2020 taking
cognisance of regional milk supply, processing and milk transport costs 269
10.3 Overall Conclusions 272
10.4 Recommendations to Stakeholders in the Dairy Processing Sector 273
10.5 Suggestions for Further Research 274
10.6 Summary 276

viii
LIST OF FIGURES
Chapter 2
Figure 2. 1: Conceptual framework of the research 15
Chapter 3
Figure 3.1: The CAP: Reforms to Date 22
Figure 3.2: Evolution of Irish processing sector 28
Figure 3.3: Number of active milk quota holders in Ireland (1994-2010) 30
Figure 3.4: Number of dairy cows in Ireland (‘000) 30
Figure 3.5: Milk production in Ireland in million litres 31
Figure 3.6: Milk production costs 32
Figure 3.7: Manufacturing utilisation 2007-2009 in Republic of Ireland 33
Figure 3.8: Self sufficiency in dairy products in Ireland (2010) 34
Figure 3.9: Destinations of Irish exports (2010) 34
Chapter 4
Figure 4. 1: Review of theory on optimal location 49
Figure 4. 2: Von Thunen Model 51
Figure 4. 3: Webers’s Triangle 53
Figure 4. 4: Length of haul to market centre 85
Figure 4. 5: Assembly driving: 2 routes 87
Figure 4. 6: Assembly driving: 1 route 87
Figure 4. 7: Optimum scale of output 88
Figure 4. 8: Review of applications of theory of optimal locations 91
Chapter 5
Figure 5. 1: Model of marketing research process 99
Chapter 6
Figure 6. 1: Milk supply 2009 141

ix
Figure 6. 2: Milk Transport Model 142
Figure 6. 3: Rural districts in Ireland 143
Figure 6. 4: Illustration of Milk Transport 143
Chapter 7
Figure 7. 1: Alternative milk supply pattern examined 179
Figure 7. 2: Current Milk Supply Pattern 179
Figure 7. 3: Moderate Reduction in Current Milk Supply 180
Figure 7. 4: Seasonal Milk Supply Pattern 180
Chapter 8
Figure 8.1: Actual catchment areas of milk processors in Ireland 215
Figure 8.2: Schematic diagram of model 216
Figure 8.3: Expansion Capacity for Dairy Farms in Ireland in 2020 217
Figure 8.4: Optimum versus actual catchment areas % saving in transport costs 218
Figure 8.5: Additional milk supply: 3 sites versus 2 sites and 1 site (Actual
catchment areas) 219
Figure 8.6: Additional milk supply: 3 sites versus 2 sites and 1 site (Optimum
catchment areas) 220
Figure 8.7: Additional milk supply: 3 sites versus 2 sites and 1 site
(Greenfield sites) 221
Figure 8.8: Current processing sites/actual catchment areas: 3 best sites
highlighted 222
Figure 8.9: Current processing sites/optimum catchment areas: 3 best sites
highlighted 223
Figure 8.10: Greenfield site locations 224
Chapter 9
Figure 9.1: Milk transport cost (cent/litre) for each scenario 260
Figure 9.2: Catchment areas for each of the six integrated site locations
(North West, Mid West, Munster West, Munster SW, Munster East and
South Leinster). 261

x
LIST OF TABLES
Chapter 3
Table 3. 1: Distribution of creameries by province, 1906 24
Table 3. 2: Milk production across various countries 32
Table 3.3:% of Home market milk supply processed, quantity of milk processed
and ownership structure of dairy processing companies 35
Chapter 4
Table 4.1: Number of plants 81
Table 4.2: Scenarios explored and corresponding costs 81
Chapter 6
Table 6. 1: Fuel Consumption and CO2 Emissions from Different Truck
Sizes/Technologies 144
Table 6. 2: Key Attributes of Scenarios 145
Table 6. 3: Industry Data 146
Table 6. 4: Number of Loads per day and Number of Working Hours per day 147
Table 6. 5: Milk Transport Costs and Tonnes CO2 Emitted for each Scenario 148
Chapter 7
Table 7.1: Capital cost per truck/tanker 172
Table 7.2: Running cost per truck/tanker per annum 172
Table 7.3: Fuel Consumption and CO2 Emissions from Different Truck Sizes 173
Table 7.4: Summary of scenarios explored 174
Table 7.5: Physical Outputs 175
Table 7.6:Number of Tankers 176
Table 7.7: Milk Transport Costs 177
Table 7.8: Carbon dioxide emissions for alternative milk supply patterns 178
xi
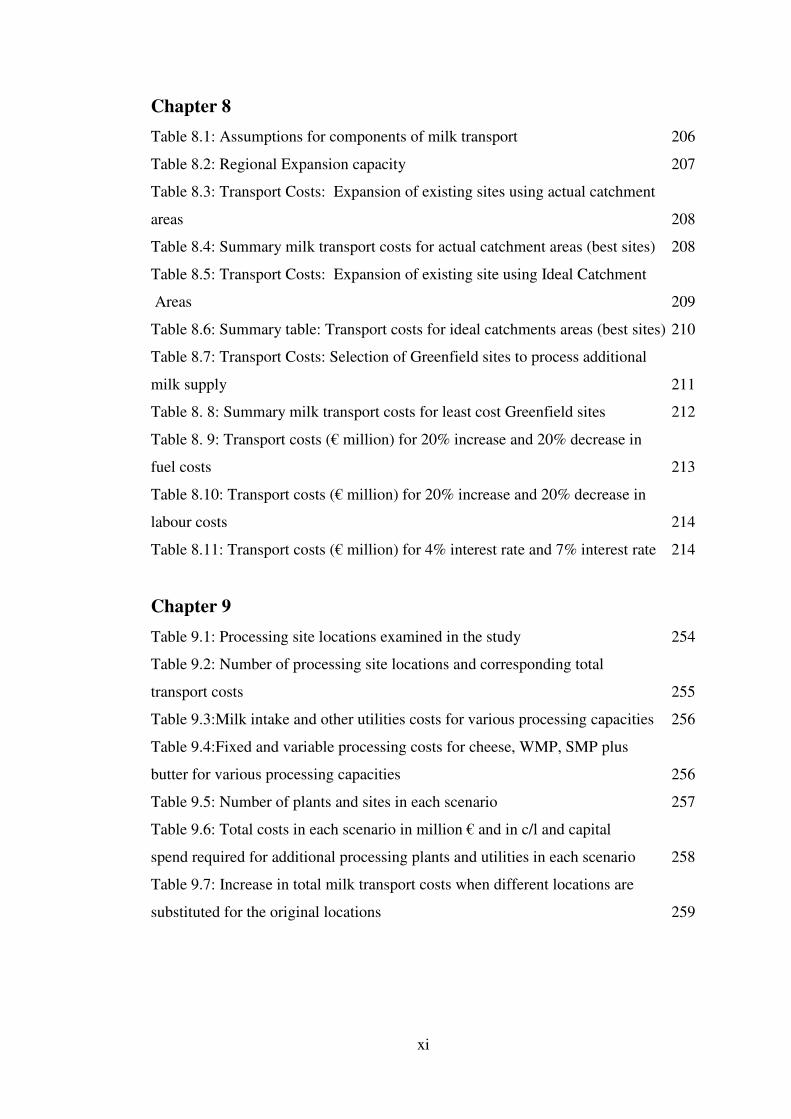
Chapter 8
Table 8.1: Assumptions for components of milk transport 206
Table 8.2: Regional Expansion capacity 207
Table 8.3: Transport Costs: Expansion of existing sites using actual catchment
areas 208
Table 8.4: Summary milk transport costs for actual catchment areas (best sites) 208
Table 8.5: Transport Costs: Expansion of existing site using Ideal Catchment
Areas 209
Table 8.6: Summary table: Transport costs for ideal catchments areas (best sites) 210
Table 8.7: Transport Costs: Selection of Greenfield sites to process additional
milk supply 211
Table 8. 8: Summary milk transport costs for least cost Greenfield sites 212
Table 8. 9: Transport costs (€ million) for 20% increase and 20% decrease in
fuel costs 213
Table 8.10: Transport costs (€ million) for 20% increase and 20% decrease in
labour costs 214
Table 8.11: Transport costs (€ million) for 4% interest rate and 7% interest rate 214
Chapter 9
Table 9.1: Processing site locations examined in the study 254
Table 9.2: Number of processing site locations and corresponding total
transport costs 255
Table 9.3:Milk intake and other utilities costs for various processing capacities 256
Table 9.4:Fixed and variable processing costs for cheese, WMP, SMP plus
butter for various processing capacities 256
Table 9.5: Number of plants and sites in each scenario 257
Table 9.6: Total costs in each scenario in million € and in c/l and capital
spend required for additional processing plants and utilities in each scenario 258
Table 9.7: Increase in total milk transport costs when different locations are
substituted for the original locations 259

xii
DECLARATION
I declare that this thesis has not previously been submitted as an exercise
for a degree at the National University of Ireland, or any other
university, and I further declare that the work embodied in it is my own.
___________________
Carrie Quinlan
xiii
ACKNOWLEDGMENTS
First, I would like to thank my supervisors Dr. Michael Keane, Dr. Laurence Shalloo, Dr. Declan O’ Connor and Dr. Pat Enright for their guidance, and insightful contribution to this study.
I would also like to collectively thank all members of the Department of Food Business and Development, UCC, it’s been a great 9 years! In particular, I would like to acknowledge Michael Ward, Brid Drake and Monica O’ Brien for their assistance in the past.
It would not have been possible to undertake this research without the financial assistance provided by Teagasc through the Walsh Fellowship. I would also like to acknowledge the Department of Agriculture, Food and Fisheries for their contribution to this research through the Stimulus fund.
I would like to thank all the members of the great team that I worked with on this Stimulus project, Una Geary, Doris Lapelle, Thia Hennessey and Michael Wallace. It was a pleasure working with you all.
To Darren, thank you so much for your patience and encouragement, and for always believing in me. Thank you also for proof-reading!
To my parents and my sisters Timms, Betty and Patrice, thank for your continual love and interest in my work and never doubting that I could succeed. It’s been a tough three years and I could not of done it without you all, I will be forever grateful.
Carrie Quinlan
May, 2013

xiv
THESIS PUBLICATIONS AND PRESENTATIONS Quinlan, C. , Shalloo L., Keane, M., O'Connor, D., Enright, P. and Geary, U. The
interaction between economies of scale and transport costs in the Irish dairy industry.
Submitted to Journal Dairy Science January 2012.
Quinlan, C. , Shalloo L., Keane, M. and O'Connor, D. Expansion Strategies post
Milk Quota. ICOS Dairy Digest, September 2011.
Quinlan, C. , Shalloo L., Keane, M. and O'Connor, D. Modelling the Impact of
Changes in Regional and National Milk Supply on The Irish Dairy Processing
Sector. Young Researcher Seminar, AESI conference November 25th 2011.
Quinlan, C. , Shalloo L., Keane, M. and O'Connor, D. Milk Transport Options for
an Expanded Dairy Industry Post Milk Quota Abolition in 2015. AESI conference
November 24th 2011.
Quinlan, C. , Shalloo L., Keane, M. and O'Connor, D. Expansion Strategies for the
Irish Dairy Industry. Submitted to Agribusiness July 2011.
Quinlan, C., Keane, M., O’ Connor, D. and Shalloo L. 2011. Milk transport costs
under differing seasonality assumptions for the Irish Dairy Industry. International
Journal of Dairy Technology, Volume 65, Issue 1, pages 22–31, February 2012.

xv
Quinlan, C. , Keane, M., O'Connor, D. and Laurence Shalloo. Co-operation among
co-operatives to ensure the overall competitiveness of the Irish dairy sector. UCC
Doctoral conference June 21st 2011.
Quinlan, C. , Keane, M., O'Connor, D. and Laurence Shalloo. Expansion Strategies
for the Irish Dairy Industry. IDF World Dairy Summit 2011.
Quinlan, C. , Keane, M., O'Connor, D. and Laurence Shalloo. Seasonality of Milk
Production-Implications for Irish Milk Transport Costs. AESI conference October
14th 2011.
Quinlan C, Keane M, O’Connor D and Shalloo L (2010). The Transport
Implications for Ireland of the Elimination of the Milk Quota Regime in 2015. Paper
presented at ITRN Conference September 2010, Dublin. Peer reviewed.
http://www.itrn.ie/uploads/Part%209.pdf.
Quinlan, C. , Keane, M., O'Connor, D. and Laurence Shalloo. .A transportation
model for estimating milk transport costs and carbon emissions from milk transport.
IRSS conference in August 2010.
Quinlan, C. , Keane, M., O'Connor, D. and Laurence Shalloo. Planning for the future
of the Irish dairy Industry post milk quota elimination. UCC Doctoral Showcase
2010.

xvi
ABSTRACT In the European Union under the Common Agricultural Policy (CAP) milk
production was restricted by milk quotas since 1984. However, due to recent changes
in the Common Agricultural Policy (CAP), milk quotas will be abolished by 2015.
Therefore, the European dairy sector will soon face an opportunity, for the first time
in a generation, to expand. Numerous studies have shown that milk production in
Ireland will increase significantly post quotas (Laepple and Hennessy (2010),
Donnellan and Hennessy (2007) and Lips and Reider (2005)).
The research in this thesis explored milk transport and dairy product processing in
the Irish dairy processing sector in the context of milk quota removal and expansion
by 2020.In this study a national milk transport model was developed for the Irish
dairy industry, the model was used to examine different efficiency factors in milk
transport and to estimate milk transport costs post milk quota abolition. Secondly,
the impact of different milk supply profiles on milk transport costs was investigated
using the milk transport model. Current processing capacity in Ireland was compared
against future supply, it was concluded that additional milk processing capacity
would not be sufficient to process the additional milk. Thirdly, the milk transport
model was used to identify the least cost locations (based on transport costs) to
process the additional milk supply in 2020. Finally, an optimisation model was
developed to identify the optimum configuration for the Irish dairy processing sector
in 2020 taking cognisance of increasing transport costs and decreasing processing
costs.

xvii
It is hoped that the results from this thesis will help improve the decision making
process around the inevitable changes in the milk processing sector in Ireland.

1
Chapter 1: Introduction to the Research
1.1 Introduction to Research
In Ireland the dairy industry is one of the most important indigenous industries and
comprises a vital part of the agri-food sector accounting for 29% of agricultural
output in 2010 (Bord Bia 2010a). Milk production in Ireland is primarily grass
based; therefore it varies widely on a seasonal basis throughout the year. Supplies are
highest during the months from mid-April to August and lowest during the months
of December and January (Promar and Prospectus 2009). This results in low
processing plant capacity utilisation, with approximately 60% of peak capacity being
utilised on an annual average basis. It also results in a product range, which is
dominated by commodity products such as butter, milk powders and cheese. The
processing sector is highly export orientated with approximately 85% of all
manufactured output being exported (Promar and Prospectus 2009).
1.2 Background to Research
In the European Union under the Common Agricultural Policy (CAP), milk
production has been restricted by milk quotas since 1984. However, due to recent
changes in the Health Check (2008) of the Common Agricultural Policy (CAP), Irish
milk quotas will increase by 9.3% between 2007 and 2013 (Shalloo, 2011) with their
eventual abolishment in 2015. In parallel to this development worldwide demand for
dairy products is expected to rise as a result of global population growth and
projected increases in per capita disposable income. Rabobank forecasts growth of
2.5% annually up to 2014 (Department of Agriculture. Food and Fisheries, 2010).

2
Consequently, numerous studies have been done on the expansion capacity of
Ireland post milk quota elimination. Laepple and Hennessy (2010) forecasted an
increase of 45% in milk output post milk quota abolition. Lips and Reider (2005)
found that the potential for increased milk production post milk quotas was
comparatively greater in Ireland, with a projected (38.6%) relative to the average of
all EU member states. Donnellan and Hennessy (2007) also revealed that Ireland had
capacity to increase milk supply by 20% using existing resources on dairy farms.
In response to policy reforms the Department of Agriculture, Fisheries, and Food
published Food Harvest 2020; a vision for smart, green growth in the agriculture and
food industries. Supported by a number of implementations to secure Ireland’s
competitiveness on the international marketplace, it also aims to ensure that the
country can play its part in meeting the increased global demand for food. Food
Harvest 2020 sets ambitious, yet achievable targets, which include a 50% increase in
milk production by 2020. If that opportunity is to be grasped, significant structural
and operational changes need to be implemented. Smart plus green, with excellent
implementation, will deliver growth. As the capability of Ireland Inc. to produce
more milk grows over the next ten years, this growth must be market, customer and
consumer led, in order to maximise value-added for the nation and for all
stakeholders in the industry. Innovation is the driving force for companies that want
to be part of this growth, and it is critically important that the food and beverage
industry lead the way in applying science and technology to develop new market-led
products. The key driver will be the emerging needs and demands from the market
and from customers. Ireland has an excellent reputation all around the world for

3
producing, selling and marketing high quality food, and this will have to be further
built upon over the next decade if the dairy industry is to step up to the challenge of
succeeding as a world class industry (Department of Agriculture, Food and Fisheries,
2010).
In order to realise the potential of the dairy sector the Food Harvest report
recommended that the processing industry must move toward a small number of
scaled operators who have the scale and culture to drive efficiency and value added
in line with key international competitors who have already achieved
consolidationDepartment of Agriculture, Food and Fisheries, 2010). Numerous other
reports conducted on the Irish dairy industry have recommended similar strategies.
Promar and Prospectus (2009) notes that the industry is fragmented in its current
structure and in need of urgent consolidation, the report concluded that existing
structures are now inefficient and out-dated in comparison with Ireland’s
international peers. Bloxham (2009) recommended a radical rationalisation plan for
the Irish dairy industry, stating that the number of plants producing butter, powder
and cheese needed to be reduced. The Irish Co-operative Organisation Society (Irish
Farmers Journal, 2009) and Bord Bia (2010b) also recommended that processors
need to work more closely together and develop synergies.
Taking this into consideration this thesis set out to answer the following questions:
Will milk supply increase post milk quota abolition?
Does Ireland need additional capacity to process milk?
If so, what processing sites should be expanded?
How many sites should be expanded?

4
Are economies of scale available in dairy processing?
Should milk processors co-operate with each other?
In endeavouring to streamline the dairy industry, all components of costs must be
investigated. Milk transport is a component of these costs and requires examination;
clear savings have been highlighted in previous studies (Quinlan 2005). As there is
an obvious gap in literature on milk transport costs in Ireland, it was decided to
examine milk transport activities in detail in this thesis.
Both economic theory and international studies suggest that as plant size increases
dairy processing costs fall due to economies of scale (Buschendorf, 2008; Boysen
and Schröder, 2009). There is limited literature on processing costs in Ireland.
Therefore, in this study processing costs were examined in detail.
This thesis will contribute to the current debate around the future structure of the
Irish dairy industry as it enters a period when significant expansion is possible for
the first time in 3 decades.
1.3 Research Questions and Sub-questions
The research question that guided this study was: What is the least cost industry
configuration for the Irish dairy industry post milk abolition in 2020?
The main research question was broken down into the following research sub-
questions:

5
Sub-question 1:What are the effects of various efficiency factors on milk transport
costs in Ireland? What are the effects of different milk production patterns on milk
transport costs in Ireland?
Sub-question 2:Will milk production increase post milk quota abolition, if so where
will it increase? How many processing plants should Ireland have post milk quota
abolition? Where should the plants be located? How large should each plant be?
Where should the milk to be processed at each plant should be sourced? How should
milk be collected?
Sub-question 3:What will the total processing and transport costs be post milk
quota abolition? What is the capital requirement for the Irish milk processing sector
post milk quota abolition?
1.4 Research Objectives
The objectives of this study were: (i) to develop, validate and describe a national
milk transport model for simulating milk transport activities in Ireland and (ii) to
develop a model to determine the least cost dairy processing sector configuration in
2020 taking cognisance of regional milk supply, processing and milk transport costs.
1.5 Framework of Thesis
This thesis can be broken down into ten chapters.
Following this introduction, chapter 2 introduces the conceptual framework of the
study.
6
Chapter 3 provides an overview of the Irish dairy industry; the chapter is concluded
with a SWOT (Strengths, Weaknesses, Opportunities and Threats) analysis of the
Irish dairy industry.
Location theories (classical location theory, least cost site, interdependency and
market areas, regional science and new economic geography) are discussed in
Chapter 4. The applications of operation research-based techniques to location
problems are also reviewed in this chapter.
Chapter 5 outlines the research methodology used in this study.
Chapter 6 details the transport implications for the elimination of milk quota regime
in 2015. In this chapter the transport model is described in detail and an application
of the model is demonstrated.
In Chapter 7, milk transport costs and carbon emissions from milk transport
associated with alternative milk supply patterns and output levels in Ireland are
estimated.
Chapter 8 uses regional and national milk supply change projections post milk quota
abolition and current processing capacities to determine milk transport costs in the
Irish Dairy Industry in 2020.
7
Chapter 9 establishes the least cost configuration for the Irish dairy processing sector
taking into account expected expansion by 2020 and includes both transport costs
and processing costs.
Chapter 10 consists of the conclusions, recommendations and limitations of this
research.
1.6 Conclusion
This chapter introduced both the conceptual and contextual basis for the research
presented in this study. Chapter 1 presented the research question, sub-questions and
research objectives that guided this study. In Chapter 2 the conceptual framework for
this study is presented.
8
References
Bloxham. 2009. Irish Agri-food; Big bang for Irish milk? Bloxham Stockbrokers,
Dublin, Ireland.
Bord Bia. 2010a. Factsheet on the Irish Agriculture and Food & Drink Sector.
Accessed June 20, 2011.
http://www.bordbia.ie/industryinfo/agri/pages/default.aspx.
Bord Bia. 2010b. Pathways for Growth. Accessed Feb. 25, 2011.
http://www.bordbia.ie/industryinfo/publications/bbreports/PathwaysForGrowth/Path
ways%20for%20Growth%20Report.pdf.
Boysen, O. and Schröder, C. 2009. Economies of Scale in Production versus
Diseconomies in Transportation: On Structural Change in the German Dairy
Industry. Accessed Nov. 11, 2011.
http://econpapers.repec.org/paper/tcdtcduee/tep0209.html.
Buschendorf, H. 2008. Optimierung der Betriebsstättenstruktur als
Ausgangspunkt unternehmensstrategischer Optionen der Molkereiwirtschaft
Deutschlands. Vollständiger Abdruck der von der Fakultät für
Wirtschaftswissenschaften derTechnischen Universität München zur Erlangung
des akademischen Grades eines Doktors der Wirtschaftswissenschaften (Dr. rer.
pol.) genehmigten Dissertation.

9
Department of Agriculture, Food and Fisheries (2010). Implementation of Food
Harvest 2020 in the Dairy Sector. Accessed Feb. 10, 2011.
http://www.agriculture.ie/media/migration/farmingsectors/dairy/RoadmapRevised08
0211.pdf.
Donnellan, T. and Hennessy. T. (2007). The effect of milk quota ‘expansion’ on
EU/Ireland production. In Exploiting the freedom of milk: Proceedings of the
Teagasc National Dairy Conference, 2007, pp. 1-19, Kilkenny, Ireland. Accessed
June. 05, 2011.
http: www.teagasc.ie/publications 2007/53/53 NationalDairyConf2007.pdf.
Irish Farmers Journal. 2009. ICOS launch Milk Ireland initiative. The Irish
Farmers Journal. Accessed April 20, 2011.
http://www.farmersjournal.ie/2009/0418/agribusiness/companycoop/feature.shml.
Laepple, D. and Hennessy, T. (2010) The Capacity to Expand Milk Production: The
Evidence from the National Farm Survey, paper prepared for the Food Harvest 2020
Implementation Committee.
Lips, M. and Reider., P. (2005). Abolition of raw milk quota in the European Union:
A CGE analysis at the member country level. Journal of Agricultural Economics 56
(1), 1-17.

10
Promar and Prospectus. 2009. The Irish Dairy Industry. Decision time is now.
Accessed Oct. 10, 2010.
http://www.ifa.ie/LinkClick.aspx?fileticket=NJCDGlrKPX8%3d&tabid=606.
Quinlan C., Enright P., Keane M. and O’Connor,D. 2005. The Cost and Efficiency
of Milk Transport from Farms in Ireland. Agribusiness Discussion Paper No 46.
Dept of Food Business and Development. University College, Cork.
Shalloo L. 2011. Milk quota management 2011 to 2015. In Proceedings of Planning
for Post Quotas. Irish Grassland association annual dairy conference. Tuesday 11th
&Wednesday 12th of January, Ardboyne hotel, Navan, Co. Meath & Morans Siver
Springs Hotel, Cork. Page56-73.

11
Chapter 2: Conceptual Framework
2.1 Introduction
This chapter presents the conceptual framework arising from a review of key
empirical research and relevant literature on transport costs and processing costs in
the dairy industry, which form the basis for this study. The conceptual framework of
this study can be divided into a number of interlinking topics: least cost location
theory, transport costs, processing costs and operational research techniques used in
solving location problems.
2.2 Least cost location theory
Location theory dates back to Von Thunen (1826), according to Von Thunen
identifying the least location cost involves balancing the cost of transportation, land
and profit (Rosenberg, 2011). According to Weber (1909 and 1929) three factors;
transportation costs, labour costs and agglomeration forces should be used to
determine the optimum-manufacturing site (Al-Nowaihi and Norman,
1992).Hotelling (1929) dealt with interfirm competition between duopolists in
location and price of an identical good. He claimed that firms should locate where
the greatest profit is generated and this was determined by identifying production
costs at various locations, and then taking into account the size of the market area
that each location is able to control (D’Aspremont et al., 1979). Losch (1954)
analysis the optimum placement of the individual enterprise in different sites can be

12
determined from the cost and demand curves (Al-Nowaihi and Norman, 1992).
Isard’s theory stated that optimum plant location is at the point of minimum
transportation costs, however if there is factor substitution between all inputs the
optimum location will very with the level of output (Al-Nowaihi and Norman,
1992). Krugman theory on the optimum location is based on the interaction of three
factors: increasing returns of scale, transportation costs and demand (Al-Nowaihi
and Norman, 1992).
2.3 Transport costs
Keane (1986) examined the effect of various efficiency factors on milk transport in
Ireland; including tanker size, frequency of collection, transport mileage and supplier
size. Clear savings in milk transport costs were highlighted in his study. Quinlan et
al. (2006) broke milk transport costs down into six components namely transport
driving, assembly driving, on-farm routine activities, plant non-pumping, farm
pumping and plant pumping. This study concluded that when the number of
processing sites is reduced the transport-driving component of milk transport
increases and in turn milk transport costs increase; therefore milk transport activities
were central to the strategic plans for the future of the Irish dairy industry. Butler et
al. (2005) citied that milk transport is a challenging logistical problem that has long
been of interest to operational researchers for many years (Butler et al. 2005).
Cornell (1998) developed the US dairy sector simulation model to simulate milk
transport costs in the US associated with different milk tanker sizes and different
milk transport wage rates. The US Dairy Sector Simulator was seen as an important

13
tool, which was able to provide useful policy guidance in the dairy processing sector.
Dooley et al. (2005) also developed a milk transport simulation model to estimate
transport costs in New Zealand, this model used to evaluate alternative transport
management strategies for the New Zealand dairy industry.
2.4 Processing costs
According to Hsu and Li (2009) average processing costs decrease with increasing
scale as a result of economies of scale. Many studies have identified common
sources of economies of scale as the division of labour, technological development
and scale, the economies of massed reserves and dynamic economies through
learning processes (Searcy and Flynn, 2009, Promar and Prospectus 2009, 2003 and
Hay and Morris, 1991).
2.5 Optimum costs
Hsu and Li (2009) stressed that the optimum dairy processing sector structure
involves a balancing of decreasing average processing plant cost with increasing
scale against increasing milk transportation costs. Stollsteimer (1963) developed a
linear programming model that simultaneously determined the number, size and
location of pear packing plants in California that minimised the combined
transportation and processing costs. O’Dwyer (1968) developed a linear
programming model that determined the optimum number, location, and size of
dairy manufacturing plants in Ireland. Wouda et al. (2002) developed a mixed
integer model that optimised the supply network for a leading dairy manufacturer in

14
Hungary by minimising total processing and transport costs. Buschendorf (2008)
developed a mixed integer processing model that optimised the German dairy
processing sector taking into account regional increases in milk supply in Germany
projected for after 2013.
2.5 Conceptual framework of the thesis
The conceptual framework guiding this study illustrates the relationship between
location theory transport and processing costs and operational techniques used in
solving location problems, which are strongly linked to determining the least cost
processing structure.
2.6 Summary
This chapter presented the conceptual framework of this research. Chapter 3
provides an overview of the Irish dairy industry and the Common Agricultural
Policy. A SWOT analysis is performed on the Irish dairy-processing sector.

15
Source: Own diagram

16
References
Al-Nowaihi, A. and Norman, G. 1992. Spatial competition by quantity setting firms:
a comparison of simultaneous and two-stage quantity-location games. University of
Leicester Discussion Paper in Economics.
Buschendorf, H. 2008. Optimierung der Betriebsstättenstruktur als
Ausgangspunkt unternehmensstrategischer Optionen der Molkereiwirtschaft
Deutschlands. Vollständiger Abdruck der von der Fakultät für
Wirtschaftswissenschaften derTechnischen Universität München zur Erlangung
des akademischen Grades eines Doktors der Wirtschaftswissenschaften (Dr. rer.
pol.) genehmigten Dissertation.
Butler, M, Herlihy, P, and Keenan, PB. 2005. Integrating Information Technology
and Operational Research in the Management of Milk Collection, Journal of Food
Engineering, 70(3):341-349.
Cornell (1998) A Description of the Methods and Data Employed in the U.S. Dairy
Sector Simulator, Version 97.3. Accessed Jan. 10, 2011.
http://www.cpdmp.cornell.edu/CPDMP/Pages/Publications/Pubs/rb9709.pdf.
D’Aspremont, C., Gabszewicz, J. Jaskold and Thisse J. F. 1979. On Hotellings
“Stability in Competition”’, Econometrica, Volume 47, No.5.

17
Dooley A E, Parker W J and Blair H T (2005) Modelling of transport costs and
logistics for on-farm milk segregation in New Zealand dairying. Computers and
Electronics in Agriculture, 48 75-91.
Hay, D.A. and Morris, D.J. (1991). Industrial Economics and Organisation:
Theory and Evidence, Oxford Univ. Press.
Hsu, C.I and Li, H.C. 2009. An integrated plant capacity and production planning
model for high-tech manufacturing firms with economies of scale. International
Journal of Production Economics. 18(2): 486-500.
Keane M. 1986. The Economics of Milk Transport, Agribusiness Discussion Paper
No. 5. University College, Cork.
O’ Dwyer, T. 1968. Determination of the Optimum Number, Location and Size
of Dairy Manufacturing Plants. Irish Journal of Agricultural Economics and Rural
Sociology. 1(3): 267-281.
Promar and Prospectus. 2003. Strategic Development Plan for the Irish Dairy
Processing Sector. PROMAR International, Alexandria, VA.
Promar and Prospectus. 2009. The Irish Dairy Industry: Decision Time is Now.
PROMAR International, Alexandria, VA.

18
Quinlan C., Enright P., Keane M., O’Connor D. 2006. The Milk Transport Cost
Implications of Alternative Dairy Factory Location. Agribusiness Discussion Paper
No 47. Dept of Food Business and Development. University College, Cork.
Rosenberg, M. 2011. The Von Thunen Model. Accessed April 10, 2011.
http://geography.about.com/od/urbaneconomicgeography/a/vonthunen.htm.
Searcy, E. and Flynn, P. 2009. The Impact of Biomass Availability and
Processing Cost on Optimum Size and Processing Technology Selection.
Appl Biochem Biotechnol.154: 271-286.
Stollsteimer, JF. 1963, A working model for plant numbers and locations. Am J
Agric Econ. 45: 631-645
Wouda, F.H.E., Beek, P.V., Van Der Vorst, J.G.A.J., Tacke, H. 2002. An application
of mixed-integer linear programming models on the redesign of the supply network
of Nutricia Dairy & Drinks Group in Hungary. OR Spectrum. 24:4

19
Chapter 3: Competitiveness of the Irish Dairy Industry
3.1 Introduction
The purpose of this chapter is to provide the reader with a background to the Irish
dairy industry. Firstly, the Common Agricultural Policy is discussed. Secondly, the
Irish dairy industry is examined in detail. Finally, the major issues facing the
industry are identified using a SWOTanalysis .
3.2 Common Agricultural Policy
Since Ireland joined the European Union in 1973, the Irish dairy sector came under
the governance of the Common Agricultural Policy. As a result policy, in particular
EU policy plays a very important role in agriculture in Ireland. In this section the
Common Agricultural Policy is examined in detail.
Upon joining the European Union in 1973 Ireland enjoyed the benefits of the CAP.
The CAP has its roots in 1950s Western Europe, whose societies had been damaged
by years of war, and where agriculture had been crippled and food supplies could not
be guaranteed (Europa, 2012).The introduction of the CAP was an attempt by the
founding European Economic Council (EEC) members to become self-sufficient in
food and agriculture at regional level. The tools used by the CAP to support
agriculture were import tariffs (border taxes which are charged by the EU on imports
from third countries), export subsidies (paid to those who export outside the
community) and intervention (buying prices that the national intervention agencies
are obliged to pay for produce which meets the required quality standards, unless

20
buying-in has been suspended) and subsidised consumption. These tools ensured
farmers received a relatively steady income and were lifted out of poverty. Farmers
depended on CAP funding for a livelihood (Department of Agriculture, Food and
the Marine, 2012).
The CAP succeeded in achieving its objective. In the 1980’s production had grown
to a level, which surpassed EU demand. This had negative effects on the
environment, for example water pollution and soil impoverishment. Public storage
for surpluses became increasingly expensive. Criticisms of the CAP at this time
included all of the support funding was not reaching primary producers, the CAP did
not always distribute support equitably between large and small producers, and the
development of excessively intensive farming practices in some Member States had
an adverse impact on the environment and animal welfare (Europa, 2012).
The first significant reform of the CAP saw the introduction of milk quotas in 1984.
Quotas were a means to control milk production and overall EU expenditures on
agriculture. Each country got a quota of the amount of milk, which they were,
allowed produce. Quotas restricted member countries on the amount of milk that
they could produce through very large fines for excess production. Quotas stabilised
production however 10% still had to be exported outside EU(Europa, 2012).
There was a further reform of the CAP in 1992 referred to as the MacSharry reform.
This saw the introduction of direct payments. Substantial cuts were made in the level
of support prices for products; to counteract this, income support payments linked to

21
production were made directly to farmers to compensate them for the price cuts. In
recent years environmental objectives, landscape preservation, the viability of rural
economies and their cultural heritage, food quality and animal health and welfare
standards have become prominent issues. This is reflected in reforms such as Agenda
2000, the Luxembourg Agreement in 2003 and recent policy adjustments mainly
Healthcheck 2008. In these reforms there were further price cuts applied to
intervention prices and decoupling of price supports (bundling of all production-
linked payments into a single farm payment to be paid to farmers on the basis of
their historic entitlements during the period of 2000-2002). In the most recent reform
(Healthcheck 2008) it was decided that milk quotas would be abolished in 2015
(Department of Environment, Food and Rural Affairs, 2012).
The Irish dairy industry has developed strongly since Ireland’s entry to the EU in
1973. The industry has developed an extensive infrastructure both in Ireland and
overseas. A summary of the reforms to date and the main points from each reform is
provided in Figure 3.1. The next section examines the evolution of the dairy industry
in Ireland.

22
Figure 3. 1:The CAP: Reforms to Date
Source: Own diagram
Price Support
-CAP was saviour to Irish
farmers on Entry to EEC
- Productivity improved
- EU agricultural markets
stabilised
- Income support for
Farmers
1973: Ireland joins EEC
Production control
- Butter mountains in EU
- Reduced surpluses
- Negative environmental
impacts
- Quotas introduced to
control production
- Reduced international
friction
Price Cuts and compensation Direct payments were based on the area on which certain crops were planted. In order to be eligible for these payments farmers also had to set aside a certain amount of their land and limit the amount of agriculture per hectare.
More Price Cuts and second pillar of CAP formed - 15% cut in intervention prices for butter and skimmed milk powder in three steps starting 2005-2006 - More emphasis on measures for rural development and the environment (second pillar of CAP)
Single Farm Payments - Decoupling of single payment from production - Cross compliance: Payment linked to environmentally friendly production methods - Modulation: Reduction in direct payments for bigger farms to finance new rural development policy - An extra 10% cut in intervention price for butter over 4 years (compared with agenda 2000)
1984: Introduction of
milk quotas
1992: Mac Sharry Reform
2000: Agenda 2000 2003: Luxembourg
Agreement
2008: Health Check
Phasing out milk quotas - 1% increase in quotas every year from 2009-2010 to 2013-2014 - Elimination of quotas in 2015 - Decoupling of support

23
3.3. History of the Irish Dairy Industry
In the Early 19th century Ireland was the world’s leading exporter of dairy produce,
in particular butter. Dairy farming was concentrated in Munster (in particular
Limerick, north Kerry, north and north-west Cork and west Tipperary), and in
southwest Ulster and adjoining parts of Leinster and Connacht (in particular Cavan,
Monaghan, Sligo and Roscommon) (Breathnach, 2000). Production of butter
occurred at the farm level. Butter was then sold onto local merchants, who sold the
butter onto merchants at ports. Butter was exported mainly to the UK. The
introduction of the centrifugal separator in the late 19th century saw the movement of
dairy processing to centralised plants, which were called creameries. The early
growth in the dairy processing industry resulted in the establishment of a creamery in
almost every town and village in the dairying regions of the country, as proximity to
a perishable and bulk raw material such as milk is a very important locational
determinant. Creameries were both privately and co-operatively owned. By 1906,
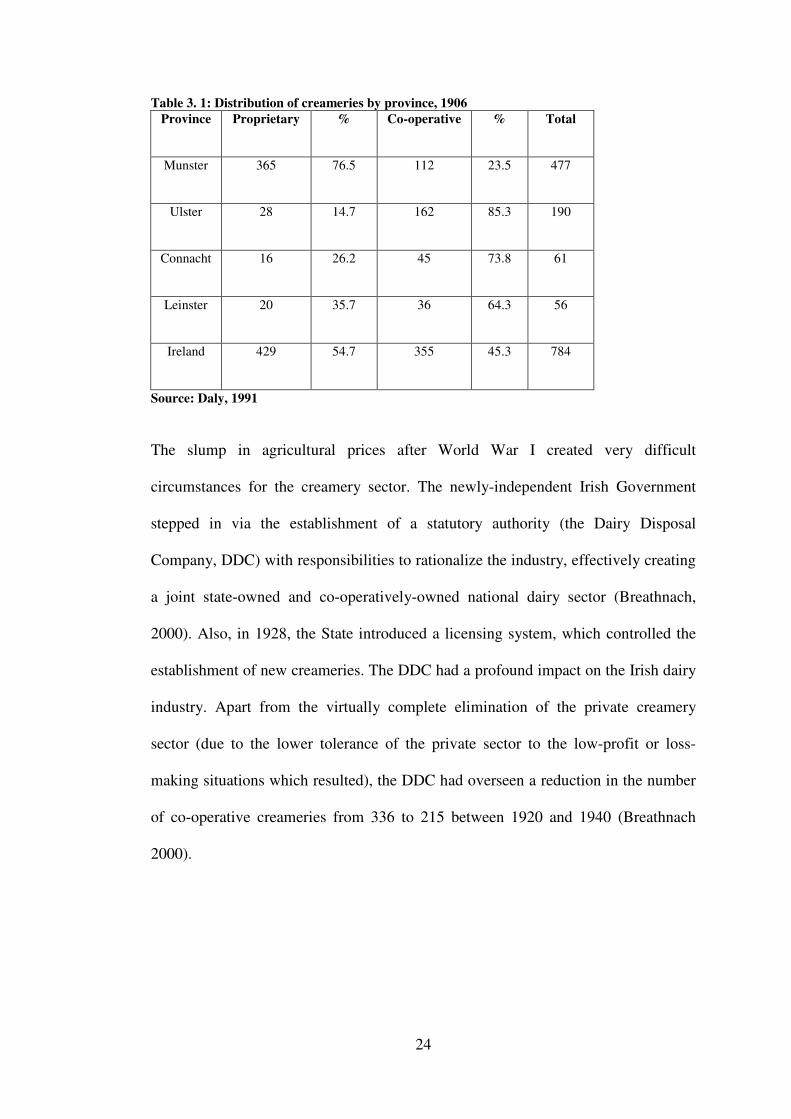
there were 800 creameries in Ireland (Table 3.1) (Daly, 1991). The creamery system
also had a positive impact on the quality of life in rural Ireland, it acted as a meeting
point for people in communities where they could discuss current affairs.
24
Table 3. 1: Distribution of creameries by province, 1906
Province Proprietary % Co-operative % Total
Munster 365 76.5 112 23.5 477
Ulster 28 14.7 162 85.3 190
Connacht 16 26.2 45 73.8 61
Leinster 20 35.7 36 64.3 56
Ireland
429 54.7 355 45.3 784
Source: Daly, 1991
The slump in agricultural prices after World War I created very difficult
circumstances for the creamery sector. The newly-independent Irish Government
stepped in via the establishment of a statutory authority (the Dairy Disposal
Company, DDC) with responsibilities to rationalize the industry, effectively creating
a joint state-owned and co-operatively-owned national dairy sector (Breathnach,
2000). Also, in 1928, the State introduced a licensing system, which controlled the
establishment of new creameries. The DDC had a profound impact on the Irish dairy
industry. Apart from the virtually complete elimination of the private creamery
sector (due to the lower tolerance of the private sector to the low-profit or loss-
making situations which resulted), the DDC had overseen a reduction in the number
of co-operative creameries from 336 to 215 between 1920 and 1940 (Breathnach
2000).

25
After a decade of relative stagnation in the 1950s, the Irish dairy industry entered a
phase of rapid expansion in the 1960s. The State became more actively involved in
promoting growth, investment and change in the industry as they tried to prepare the
industry for membership of the EU. Improvements in technology also facilitated
milk to be transported longer distances. A number of sectorial studies were carried
out in pursuit of this objective; one carried out in 1963 by Knapp recommended the
amalgamation of dairy co-operatives into larger groups in order to achieve
economies of scale and specialisation. Larger processing plants were also required in
order to absorb the growing output of milk that resulted from new Government
supports: national milk output rose from 480 million gallons in 1960 to 740 million
gallons in 1973. It was also important to diversify processing away from butter,
which was the sole product of the great majority of creameries, to alternative
products such as cheese and milk powder. (Breathnach 2000). Analysis shows that
80% of creameries in Munster were within six miles of each other, while
improvements in transport and roads had long made such proximity redundant.
Taking on board the remit recommended by Knapp, the Irish Agricultural
Organisation Society (IAOS) in 1966 published detailed proposals for the
reorganisation of the dairy industry from 192 to 19 units. The idea was to
amalgamate neighbouring plants therefore the milk supply would gravitate to the
processing plant nearest to the primary producer. The amalgamation process took off
and the 192 units were reduced to just 46 by 1978. However, a geographical
patchwork of milk supply territories emerged rather than the rational and compact
geographical units that were planned. Many co-operatives were resistant to

26
amalgamation as they feared local job losses and also they did not want to lose
control of their co-operatives especially to their rivals (Breathnach, 2000).
With the introduction of milk quotas in 1984, a limit was placed on the expansion of
milk production and consequently on the scope for expansion for dairy processors.
Against this background and with the increasing globalisation of economic activities,
overseas expansion (particularly in the UK and the US) through acquisition of
existing facilities has been a principal focus of the larger processors in the Irish
industry. Turning to change within Ireland; expansion was only possible by merging
or acquiring other processors (O’ Connell et al. 1997). In 2004, the three largest
cooperatives (Kerrygroup, Glanbia, and Dairygold) accounted for approximately
67% of Irish milk intake.
At the same time as making these acquisitions, some Irish cooperatives were
restructuring their capital bases. This has involved these cooperatives establishing
holding companies to manage and own downstream processing operations. At one
level the development of these hybrid cooperative-private capital businesses
responded to desires to raise equity in a situation where farmers were unable or
unwilling to provide capital. At another level however it responded to a general bias
in capital markets and in management circles against cooperatives (Breathnach,
2000).
In January 2012 as a result of rationalisation and amalgamation, the industry has
gradually concentrated into a tiered structure. Geographically, the result is an

27
industry dominated by three large processors located adjacent to each other in a band
running through mid-Munster and south Leinster which is the heartland of dairy
farming in Ireland. Many of the larger processors have more than one processing site
in this region, with liquid milk plants also located in the main urban centres outside
the region. The three large processors are; Glanbia, Dairygold and Kerry. Between
them they have nine processing plants. The second tier of processing companies is
divided between the North East (the second dairying region in Ireland), the West (a
region relatively new to dairy farming) and the South (O’Connell et al. 2007).
Processors in the North East include Lakelands and Town of Monaghan. Connacht
Gold and Arrabawn process most of the milk in the West. Other dairies in the South
are Carbery, Newmarket, North Cork, Boherbue, Tipperary and Wexford creameries.
In 2008 Ireland had in total 10butter plants, 11 powder plants, 9 cheese plants and 7
casein plants. There is intense rivalry among dairy processors in Ireland (Irish Dairy
Board, 2009). Vigorous local competition also pressures domestic firms to look
abroad in order to grow, they are forced to look outward in the pursuit of greater
efficiency and higher profitability. This is happening with Irish dairy processors,
they are currently present in America, Asia, Middle East and throughout Europe. A
summary of the evolution of the Irish dairy processing sector is provided in Figure
3.2.

28
Figure 3.2: Evolution of Irish processing sector
Early 19th century: Ireland was world’s leading exporter of dairy produce (butter)
Butter sold to local merchants→ blended together→ exported at ports
↓
Late 19th century: Introduction of creamery system (centrifugal separator)
Processing moved to factory (privately-owned +proprietary creameries)
↓
1906: 800 creameries
Butter produced from cream, skim milk used on farm for feeding calves and pigs
Creamery created a new social interaction pattern for rural Ireland
↓
1927: Slump in agricultural prices and frequent milk wars
Establishment of Dairy Disposal Company
Aim: to close down any insolvent dairies and regulate establishment of new
creameries
↓
1940’s: 215 creameries: mostly cooperative creameries
Co-operation between co-operatives to diversify away from butter
Expanding product mix: cheese + chocolate crumb
↓
1960’s: rapid expansion+ government supports
Milk output rose from 480m gallons in 1960 to 740m gallons in 1973
Knapp report 1966: recommended amalgamation of co-operatives from 192 to 19
units
↓
1964: First major amalgamation: to form Waterford co-op
↓
1978:46 co-ops 1990: 35 co-ops 2008: 23 co-ops
Industry not efficient from economic or geography point of view
Source: Own diagram

29
3. 4 Milk Production Sector and Dairy Processing Sector
The following section examines the production and processing sectors in Ireland in detail.
3.4.1 Milk Production Sector
Seasonality of Milk Production Sector
With the exception of liquid milk producers, Irish dairy farmers have continually adjusted
the date of calving, so that through compact calving, the majority of the herd calves during
spring to maximise the quantity of grass in the lactating cow’s diet. While this maximizes
production cost efficiency from a grass-based production perspective, it also results in
increasing supply levels in the peak months of April to August inclusive(Shalloo et al.
2004). Ireland’s main EU competitors do not have a corresponding seasonality pattern.
This seasonality leads to poor capacity utilization in the Irish processing sector, adding to
the operating costs of processors (Promar and Prospectus, 2009).
Seasonality also causes a mismatch between market demand, which for many products is
relatively constant all year round. Crucially, this seasonality also restricts the types of
products that can be produced, and continues to act as a significant constraint on the Irish
industry. The inability to store short shelf life products from summer to winter limits the
options available in terms of the overall product mix, effectively locking processors into
making storable products such as butter, hard cheese, milk powders and casein (Quinlan et
al. 2012). The predominance of grass-based production, and the seasonality of that
production in Ireland, results in inconsistency and variability in the milk produced. This
inhibits the processors as they attempt to meet the demands of their customers for standard
products all year round. Fundamentally, when processors cannot produce a consistent
product year round, they face major problems selling certain products where consistency of
texture, flavour, functionality and year round supply are essential (Promar and Prospectus,
2009).

30
Dairy Farmers
Ireland has a long and successful tradition as a major producer of quality dairy products.
The grass based production system has provided significant competitive advantages in
terms of production costs and the naturalness of Irish dairy produce. Irish dairy farmers are
considered to be both technically competent and commercially focused, with major
changes having taken place in the structure of the industry at production level (Promar and
Prospectus, 2003).
There has been a continual reduction in the number of producers involved in milk
production in Ireland since the introduction of the quota regime in 1984 (Figure 3.3)
(Department of Agriculture, Food and Fisheries, 2011).
Figure 3. 3 Number of active milk quota holders in Ireland (1994-2010)
Source: Department of Agriculture, Food and Fisheries, 2011
Figure 3.4: Number of dairy cows in Ireland (‘000)
Source: CSO, 2011(a)
0
500
1000
1500
2000
1984
1986
1988
1990
1992
1994
1996
1998
2000
2002
2004
2006
2008
Axis
Titl
e
number of dairy cows ('000)
number of dairy cows ('000)

31
There has also been a reduction in the number of dairy cows since the introduction of the
quota regime (Figure 3.4) (Central Statistics Office, 2011(a)).
Figure 3.5: Milk production in Ireland in million litres
Source: CSO, 2011(b)
Even though there has been a reduction in the number of farmers in Ireland (19,000
farmers in 2009) and the number of dairy cattle, milk production has remained relatively
constant over the years (Figure 3.5) (Central Statistics Office, 2011(b)). Therefore the size
of dairy herd per farmer has increased.
Irish milk production sector compared with some main competitors
Milk production in New Zealand, USA and Denmark is more concentrated than in Ireland.
In Ireland, the average number of dairy cows per farm is 57, in Denmark the figure is 140,
in USA there are on average 172 cows per farm and in New Zealand there are about 400
cows per farm (International Dairy Federation, 2011).However, in Finland there are only
28 dairy cows per farm. Milk production in Ireland represents 0.9% of worldwide milk
production, compared with 14.5% from USA and 2.9% from New Zealand. Milk
45004600
4700
48004900
50005100
52005300
1992
1993
1994
1995
1996
1997
1998
1999
2000
2001
2002
2003
2004
2005
2006
2007
2008
2009
2010
Domestic Milk Production in Ireland (million litres)
Domestic

32
production in Denmark and Finland represents a smaller proportion of worldwide milk
production, 0.8% and 0.4% respectively (International Dairy Federation, 2011)(Table 3.2).
Table 3. 2: Milk production across various countries
Milk Production(‘000 tonnes )
% of worldwide production
Number of farmers
Number of dairy cows (‘000)
Average quantity of cows per farm
Ireland 5,437 0.9% 18,300 1027 57 USA 87,461 14.5% 53,127 9117 172 New Zealand 17,143 2.9% 11,700 4,680 400 Denmark 4,965 0.8% 4,120 573 140
Finland 2,334 0.4% 10,586 287 28 Source: International Dairy Federation, 2011
Costs of milk production in Ireland are lower than our European competitors such as the
Netherlands and Denmark. However production costs are higher than that in New Zealand
and Australia (Figure 3.6) (Teagasc, 2008). Their lower production costs may be due to the
larger herd sizes.
Figure 3.6:Milk production costs
Source: Teagasc, 2008

33
3.4.2 Processing sector in Ireland
Utilisation of milk supply
In Ireland, approximately 10% of the milk supply is utilised for liquid milk and the
remaining 90% is used in the manufacture of a range of dairy products. Butter and skim
milk products account for approximately 60% manufacturing milk utilisation, Cheese and
whey products account for approximately 30% and whole milk powder account for 10%
(FAOSTAT, 2011) (Figure 3.7).
Figure 3. 7: Manufacturing utilisation 2007-2009 in Republic of Ireland
Source: FAOSTAT. 2011
Sales of dairy products
Ireland has 4% of the EU milk quota EU15, but Ireland has only 1% of the EU15
population. Ireland has the highest self sufficiency rates for dairy products in Europe
(figure 3.8) (Central Statistics Office, 2011c).
2007
2008
2009
0% 20% 40% 60% 80% 100%
Utilisation of manufacturing milk supply 2007-2009
Milk Whole Dried
Butter and Ghee + (Total)
Cheese (All Kinds) + (Total)

34
Figure 3.8: Self sufficiency in dairy products in Ireland (2010)
Source: CSO, 2011a
Therefore, Ireland has a very significant dairy product surplus. In Ireland; 80% of dairy
products are exported; in 2010 50% were exported to the EU and the remaining 50% to
North America and others (IDB, 2011) (figure 3.9).
Figure 3.9:Destinations of Irish exports (2010)
Source: Irish Dairy Board, 2011
Irish milk processing sector compared with its main competitors
While Fonterra (New Zeland), Valio (Finland) and Arla (Denmark) process 80% of their
home country’s milk supply in contrast Glanbia (Ireland) and Dean Foods (United States
of America) process 25% and 15% of the milk supply in their home countries respectively.
Therefore, Fonterra, Valio and Arla process higher volumes of milk compared with
0
1000
2000
30004000
1992
1993
1994
1995
1996
1997
1998
1999
2000
2001
2002
2003
2004
2005
2006
2007
2008
2009
2010
Self Sufficiency (%)
Cheese ButterCream Milk PowderDrinking Milk & Buttermilk

35
Glanbia. This illustrates the multiplicity of fragmented processors in Ireland and the slower
rate of restructuring that has taken place at processing level.
Arla, Fonterra and Valio are owned 100% by dairy co-operatives whereas Glanbia and
Dean Foods are PLC’s. (Table 3.3)
Table 3.3:% of Home market milk supply processed, quantity of milk processed and ownership structure of dairy processing companies
% of Home Market Milk
Supply Processed
Quantity of
milk
processed
(million litres)
Ownership
Structure
Glanbia (Ireland)
Processes 25% of Ireland’s milk supply 1,250 PLC
Arla (Denmark)
Processes 80% of Denmark’s milk supply
8,243 Co-operative
Fonterra (New Zealand)
Processes 96% of New Zealand’s milk supply
13,860 Co-operative
Valio (Finland) Processes 79% of Finland’s milk supply 2,000 Co-operative
Dean Foods (United States of America)
Processes 15% of USA’s milk supply 13,200 PLC
Source: Company Websites
3.5 SWOT Analysis of the Irish Dairy Industry
The next section will provide a SWOT analysis of the Irish dairy industry. It will examine
the strengths and weaknesses of the Irish dairy industry and also identify the existing
opportunities and threats. This analysis was completed in order to help the reader gain a
better understanding of the current position of the Irish dairy industry. This was complied
by conducting a review of the relevant literature and reports.

36
3.5.1 Strengths
• Irish dairy farmers are considered to be both technically competent and
commercially focused (Promar and Prospectus, 2009)
• Ireland has a comparative advantage in the production of milk
This is due to the grass-based feeding system for its dairy herd. This is facilitated
by the country’s moderate climate, which makes it very suitable for grass
production. The grass-based feeding system has been more cost efficient than the
mainly grain-fed systems used in continental EU countries (Promar and Prospectus,
2009)
• Known as a natural producer of dairy products
The pasture-based feeding system has the advantage of being able to be portrayed
as a more natural production for dairy cows and milk production. Ireland has been
able to build on this to develop an industry in which over 80% of its processed
output is exported (Promar and Prospecus, 2009)
• Irish processors have become international companies with instant name
recognition for dairy product buyers overseas
• Direct access to the EU market (480 million people), the largest and most affluent
consumer market in the world
• World leader in R+D of important dairy ingredients. In 2008,a national functional
foods research centre opened in Cork, Ireland, it is funded by government and
industry (Promar and Prospectus, 2009)
3.5.2 Weaknesses
• The seasonality of milk supply is a major feature of production in Ireland
With the exception of liquid milk producers, Irish dairy farmers have adjusted the
date of calving, so that through compact calving the total herd calves around the

37
time of lowest milk production cost. While this maximises production cost
efficiency from a grass-based production perspective, it also results in increasing
supply levels in the peak months of April to September. This seasonality restricts
the types of products that can be produced, and continues to act as a significant
constraint on the Irish industry. If seasonality remains it will continue to constrict
the ability to produce certain products that require year round milk supply (Quinlan
et al., 2011)
• Poor capacity utilisation in the processing sector (approx. 60%)
This is a result of seasonality; it leads to higher operating costs of processor
(Promar and Prospectus, 2009)
• Fragmented processing industry
Four dairy companies process 80% of milk production in Ireland. However in New
Zealand, Netherlands and Denmark only one company processes 80% of milk
production. The larger processors are able to take advantage of cost savings as a
result of economies of scale (Promar and Prospectus, 2009).
• The rate of increase in scale of milk production has been significantly lower than
that of our main competitors over the past 20 years (Promar and Prospectus, 2009)
• Lack of capital
As a result of the fragmented industry there is a lack of capital available for
activities such as R&D (Promar and Prospectus, 2003)
• 60% of products produced in Ireland are commodity type products which typically
have low margins (Promar and Prospectus, 2009)
3.5.3 Opportunities
• Role for smaller niche processors

38
Smaller niche processors can also play an important role in the industry, these
processors can succeed through innovation and specialisation
• Increasing R&D and product innovation
Given the higher prices that can be achieved in EU markets through effective
market segmentation and customisation, product differentiation, branding, etc., to
compete effectively the Irish industry will require a greater market and customer
focus. A key element in building this market focus is the requirement for
continuous re-investment through research and development and product
innovation
• Abolition of milk quotas
In 2015 milk quotas will be abolished. Since 1984 quotas capped milk production.
Previous to this Irelands’ milk production rose by about 6% each year (Teagasc,
2008). By restricting EU production competitors fill other growing markets;
therefore the EU has lost its dominant position in world markets. Quotas also
hindered structural development at farm level and increased cost of milk
production. The abolition of quota will now allow Ireland to significantly increase
national milk supply. In EU 15 there are only six countries expected to increase
milk production in line with quota increases. Ireland is one of these countries
(Teagasc, 2008)
• ICOS, the voice if the Irish Co-operative movement, is pushing for radical change
in the dairy sector. They are looking at ways of rationalising the number of plants
and processors involved in production of base products thus eliminating
duplication, cost inefficiencies and unnecessary overheads (Irish Farmers Journal,
2009)
• Development of strong brands

39
Brands are now more essential than ever for communicating with consumers. It is
often the best means of holding market share and has the best potential for growing
it
• Market opportunities in the following countries: Asia, Africa and Central America
(including Mexico) (International Dairy Federation, 2011)
• Increased cheese output
The huge depth of technological know-how for cheddar coupled with the use of
existing plants could be used to pursue such a strategy
• Growing demand for food with specific health benefits
Dairy products have an inherently good nutritional image and are uniquely suitable
from a technological viewpoint. Consumers are keen to look after their health, but
will be reluctant to spend too much in the process. The fortification of other dairy
products with vitamins, minerals or anti-cholesterol plant sterols could, however,
prove popular selling points for many new products. These will be targeted not only
towards a general audience paying greater attention to their health, but more
frequently niche groups such as children or older consumers (Euromonitor, 2011)
• Growth in demand in dairy products with perceived health benefits
Consumers are demanding products lower in fat to traditional dairy products such
as full-fat milk and cream. Consumers are also demanding products with specific
functional ingredients such as omega 3 essential fatty acids, fibre, plant sterols,
enzymes and isoflavones (Euromonitor, 2011).This trend is also sweeping Ireland.
The Irish consumers are demanding products with health benefit
• Growth in demand for ‘convenient’ dairy products
Convenience, driven by the acceleration of consumer lifestyles, is also altering the
nature of demand for dairy products. The main causes of this acceleration are the
growth of single-occupancy households due to family breakdown and later

40
marriage, longer working hours and a higher proportion of families with both
parents working outside the home. The impact of these changes on eating habits
includes a reduction in the time spent preparing food, a reduction in the number and
frequency of families sitting down together to eat, fewer people eating a proper
breakfast and an increase in informal eating habits such as snaking and eating on
the move (Euromonitor, 2008). This trend also holds true in Ireland
• Growth in demand for products for ageing population
Across the Developed World, birth rates are falling and life expectancy is
increasing, a trend sometimes referred to as the “greying” of the population.
Products with anti-ageing properties and those promoting good digestion will do
particularly well in this segment. Products containing calcium, omega 3s, which
may slow the onset of mental degeneration caused by Alzheimer ’s disease, and
probiotic yoghurts, are likely to be particularly attractive to this group
(Euromonitor, 2011). In Ireland a growing proportion of the population is ageing,
hence these consumers are putting pressure on dairy processors to produce what
they demand
• Rising global dairy prices
The gap between world and EU dairy prices has been closing over time due to
changes in EU policy and rising world prices. As a result, world (New Zealand)
milk prices are converging on EU and US milk prices (Teagasc, 2011). While
volatility concerns remain, Rabobank expects a general trend of relatively high
product and milk prices because the cost of producing exportable milk will remain
high (Irish Farmers Association, 2012)
3.5.4 Threats
• Ageing plant in need of replacement in the medium term

41
There are indications that another round of major capital investment may be
required to replace existing plant in the medium term. Over 70% of the processors
surveyed by Promar and Prospectus in 2003 indicated that part of their current
technology was either in need of upgrade, or only adequate for current needs
(Promar and Prospectus, 2009). Also as a result of quota abolishment there will be
a need for additional processing facilities post 2015. There is currently a debate
within the industry concerning who should pay for the new facilities
• Increasing costs and compliance requirements placed on processors to meet
environmental, food safety and quality demands
Processors are likely to continue to face increasing pressure from numerous sources
to improve their quality assurance systems so that they will be able to meet the
increasing levels of environmental and food safety standards. Consumers are now
demanding that companies measure the carbon footprint of their products.
Processors will need to make significant investments, imposing a significant cost
that will be difficult to absorb
• Price volatility
With the elimination of quotas dairy companies will need to deal with price
volatility (tendency of markets to fluctuate sharply and frequently). Approximately,
7% of dairy production is traded on the international marketplace, as a result any
changes in milk production from key dairy producing countries can impact trade
and prices internationally (International Dairy Federation, 2011)
• During the current economic recession people are trading down i.e. they are
looking for cheaper substitutes (rice, wheat) for dairy products (Euromonitor, 2011)
• Potential Food scares
There is always risk of foot and mouth disease, BSE etc.
• Global recession

42
The global economy is unstable; consumers have reduced their spending on non-
essential and luxury items. Since this category carries products such as chilled and
shelf-stable desserts, chilled snacks and cream, as consumers cut back on spending
on such non-core food items, the category as a whole suffered in value terms
(Euromonitor, 2011)
3.5.6 SWOT summary
The Irish dairy industry is known as a natural producer of dairy products, producers are
technically competent and Irish processors sell their products worldwide. However, the
processing sector is fragmented compared with international competitors and operating
costs in Ireland are higher due to poor capacity utilisation. However, as a result of
impending quota removal the industry is now at a crossroads, the industry has the potential
to expand substantially. In order to achieve this, the Irish processing sector will need to
examine the current industry structure in terms of the number of players and the type of
products it produces. In the face of increasing competitive and market challenges the
processing sector cannot afford to stand still.
3.6 Conclusion
The dairy industry will undergo considerable change in the years ahead because of changes
in European Union Common Agricultural Policy (Hennessy and Thorne, 2006).The Irish
dairy industry has had a very successful past. The purpose of this chapter was to give the
reader an insight into the current structure of the Irish dairy industry. Chapter 4 examines
location theories and operational techniques applied to location problems.
References
Breathnach P. 2000. The Evolution of the Spatial Structure of the Irish Dairy

43
Processing Industry, Irish Geography, Vol. 33.2.
Central Statistics Office, 2011a. Number of Livestock in June by Region, Type of
Animal and Year. Accessed Dec. 4, 2011.
http://www.cso.ie/px/pxeirestat/Statire/SelectVarVal/saveselections.asp.
Central Statistics Office, 2011b. Intake of Cow’s Milk by Creameries and Pasteurisers by
Domestic or Import Source, Year and Statistic. Accessed Dec. 12, 2011.
http://www.cso.ie/px/pxeirestat/Statire/SelectVarVal/saveselections.asp.
Central Statistics Office, 2011c. Supply Balance for Dairy Products by Product
Type, Year and Statistic. Accessed Dec. 12,2011.
http://www.cso.ie/px/pxeirestat/Statire/SelectVarVal/saveselections.asp.
Daly, P. 1991. The early development of the creamery system in Ireland 1880-1914.
Unpublished MA. thesis. Maynooth: Department of Geography, National University of
Ireland, Maynooth.
Department of Agriculture, Food and Fisheries. 2011. Annual Review and Outlook for
Agriculture, Fisheries and Food 2010/2011.Accessed Dec. 4, 2011.
http://www.agriculture.gov.ie/publications/2011/annualreviewandoutlook20102011.
Department of Agriculture, Food and the Marine, 2012. The Common Agricultural Policy.
Accessed Nov. 20, 2012.
http://www.agriculture.gov.ie/contentarchive/farmingschemesandpayments/commonagricu
lturalpolicycap.

44
Department for Environment, Food and Rural Affairs, 2012. Common Agricultural Policy
reform. Accessed Nov. 20, 2012.
http://www.defra.gov.uk/food-farm/farm-manage/cap-reform.
Euromonitor, 2011. Other Dairy in Ireland. Category briefing. Euromonitor International
Ltd.
Europa, 2012. Reform of the Common Agricultural Policy. Accessed April. 5, 2012.
http://europa.eu/legislation_summaries/agriculture/general_framework/l60002_en.html.
FAOSTAT. 2011. Agriculture statistics. Accessed Dec. 2, 2011.
http://faostat.fao.org/site/603/DesktopDefault.aspx?PageID=603#ancor.
Hennessy, T. and Thorne, F. 2006. The impact of the WTO Doha Development Round on
Farming in Ireland. Galway, Ireland: Teagasc Rural Economy Research Centre.
Irish Dairy Board, 2009. The Dairy Industry in Ireland, Dublin, Ireland.
Irish Dairy Board, 2011.Sales Analysis by Destination. Accessed Dec. 3, 2011.
http://www.idb.ie/action/FinancialHighlights.
International Dairy Federation, 2011.The World Dairy Situation 2011. Bulletin of the
International Dairy Federation 452/2011.
Irish Farmers Association. 2012. Dairy Newsletter February 2012. Accessed Jan.20, 2012.
http://www.ifa.ie/portals/11/files/652/Newsletter%20-%20February%202012.pdf.

45
Irish Farmers Journal. 2009. ICOS launch Milk Ireland initiative. The Irish
Farmers Journal. Accessed April 20, 2011.
http://www.farmersjournal.ie/2009/0418/agribusiness/companycoop/feature.shml.
O’ Connell, L, Van Egeraat and Enright, P. 1997. Clusters in Ireland: The Irish Dairy
Processing Industry: An Application of Porters Cluster Analysis. NESC Research Series,
Paper 1.
Promar and Prospectus. 2003. Strategic Development Plan for the Irish Dairy Processing
Sector, Dept. of Agriculture and Food, Dublin.
Promar and Prospectus. 2009. The Irish Dairy Industry. Decision time is now. Accessed
Oct. 10, 2011.
http://www.ifa.ie/LinkClick.aspx?fileticket=NJCDGlrKPX8%3d&tabid=606.
Quinlan, C., Keane, M., O’ Connor, D. and Shalloo L. 2012. Milk transport costs
under differing seasonality assumptions for the Irish Dairy Industry. International
Journal of Dairy Technology DOI: 10.1111/j.1471-0307.2011.00734.x
Shalloo L, Dillion P, Rath M and Wallace M. 2004. Description and Validation of the
Moorepark Dairy System Model. J. Dairy Science. 87 1945–1959.
Teagasc, 2008. National Dairy Conference 2008 Proceedings. Accessed Oct. 10, 2011.
http://www.teagasc.ie/publications/2008/20081126/dairyconfproceedings2008.pdf.
Teagasc, 2011. Study of the International Competitiveness of the Irish Dairy Sector at
Farm Level. Teagasc, Ireland.

46
Chapter 4: Location theories and applications of operation research-based techniques to location problems
4.1 Introduction
Where to locate a business is a crucial decision because this will have an important impact
on profits. Typically businesses will seek locations that maximise revenues and minimise
costs. Simple location decisions are rare in agriculture; most agricultural location problems
are complex. The theory of optimal location has interested economists since the early 19th
century. Location theory tackles the questions of what economic activities are located
where and why. Numerous factors, which affect location, are considered such as localized
materials and services, however most weight is placed on transport costs. Location
decisions have also interested operation researchers. Operation researchers use analytical
techniques to improve decision making and they have demonstrated significant efforts to
apply, adapt, and even advance theoretical location models to fulfil the field’s specific
needs.
The purpose of this chapter is to give a brief overview of location theories. This chapter
will also review the applications of operation research-based techniques to location
problems.

47
4.2 Plant location Theory
Insights into location theory can be grouped intro three types: classical, regional science
and new economic geography. Von Thunen (1826) , Launhardt (1882), Weber (1909),
Hotelling (1929) and Losch (1954) contributed towards classical theory of location. Isaard
(2003) provided valuable insight towards regional science and Krugman was the founder
of new economic geography. A brief initial overview of the evolution of the theory of
optimal location over time is shown in Figure 4.1.
Classical location theories can be broken into three stages: the first stage is called least cost
theory; the second is called interdependence theory and the final stage is called maximum
profit theory of location (Al-Nowaihi and Norman, 1992). Von Thunen (1826) developed
the general framework for the economic analysis of location theory. He was primarily
concerned with the aggregate analysis of agricultural location. He utilized the "least-cost"
approach to determine the ideal location for agricultural products. Launhardt
(1882)provided very significant contributions as he explained the differences in the
location of industry by variations in cost and demand factors at alternative locations.
Weber (1909 and 1929) developed a comprehensive theory in 1909 for the location of
manufacturing activities. According to Weber three factors: transportation costs, labour
costs and agglomeration forces should be used to determine the optimum manufacturing
site (Al-Nowaihi and Norman, 1992). Many location studies still use the Weberian theory
to better understand the decision making process. Hotelling (1929) established the
foundation of locational interdependence. He claimed that firms would tend to locate
toward the centre of the market area rather than disperse. He introduced the notion of
competition in location decisions (Al-Nowaihi and Norman, 1992). Losch (1954) presented
the maximum-profit theory in 1939. Losch's analysis assumes a free economy where the
optimum placement of the individual enterprise in different sites can be determined from
the cost and demand curves (Al-Nowaihi and Norman, 1992).

48
Isard (2003) provided the theoretical basis of a new theory called regional science. He
attempted to develop a general theory of location by unifying the Thunen, Weber and
Launhardt theories. His theory was based on the theory of input substitution (Al-Nowaihi
and Norman, 1992).
Krugman (1991) renewed economists’ interest in location theory in 1991. He founded what
some term ‘new economic geography’. His theory on industrial location was based on the
interaction of three factors: increasing returns of scale, transportation costs and demand.
According to Krugman (1991) because of economies of scale, it was not profitable to
spread production throughout numerous factories instead production should be concentrated
in a few factories(Al-Nowaihi and Norman, 1992).
A synopsis of the main location theories is given in Figure 4.1.
4.2.1 Classical location theory
Von Thunen
It is probably fair to say that Von Thunen (1826) was the first to recognize the importance
of space and location in economic theory. Von Thunen’s work was aimed at describing the
influence of location factors on agricultural land use. The following are some assumptions
of the Von Thunen model of agricultural land:

49
Figure 4. 1: Review of theory on optimal location
Von Thunen’s (1826)
Investigated the impact of the distance from the market on the use of agricultural land
↓
Launhardt (1882)
Explained the location of industry as the decision resulting from two variables; differences in cost and
demand at alternative sites.
↓
Weber (1909)
Formulated a theory of industrial location in which an industry is located where the transportation
costs of raw materials and final product is at a minimum
↓
Hotelling (1929)
Hotelling reasoned that firms would concentrate on the mid-point of the entire market area; at this point
buyers at extremities can be supplied thus not allowing competitors to enjoy location advantages. His theory
became known as locational interdependence and market areas.
↓
Losch (1954)
Losch theory falls under the theory of maximum profit plant location. He states that the optimum factory
location depends upon the firms’ costs of production at different sites and the corresponding market area,
which it can control from each site.
↓
Isard (1969)
Attempted to develop principles for a general theory of location by combining the work previously
done by Thunen, Weber, Losch, and other theorists.
↓
Krugman (1991)
His model is based on the interaction of three factors: increasing returns of scale, transportation costs
and demand.
↓
Porters Cluster Theory (1998)
Geographic concentrations of interconnected companies, specialized suppliers, service providers, and
associated institutions in a particular field arise because they increase the productivity with which companies
can compete.
Source: Own diagram

50
The city was located centrally within an "Isolated State" which was self-sufficient
and had no external influences.
The Isolated State was surrounded by an unoccupied wilderness.
The land of the State was completely flat and had no rivers or mountains to
interrupt the terrain.
The soil quality and climate were consistent throughout the State.
Farmers in the Isolated State transported their own goods to market via oxcart,
across land, directly to the central city. Therefore, there were no roads.
Farmers acted to maximize profits (Samuelson, 1983).
According to Von Thunen (1826) in a uniformly fertile plain, with a single population
cluster in its centre, prices and demand functions are fixed and known for all agricultural
products. The production functions for all these agricultural products were identical at all
points in this plain, and all production factors (e.g. labour, fertilisers) were available at a
given location at prices that linearly increase with distance from the market. Transport cost
depended on the distance from the market and the different kind of products. The gain
from farming per unit area (location rent) decreases with increasing distance from the
market. The minimum price of a commodity is calculated by location rent, transport costs
and fixed production costs - the profit is then the difference between the costs and the fixed
market price. In an Isolated State Von Thunen (1826) hypothesized that a pattern of rings
around the city would develop. There are four rings of agricultural activity surrounding the
city. Dairying and intensive farming occur in the ring closest to the city, as they must get to
market quickly, they would be produced close to the city. Timber and firewood, which
was then used for fuel/cooking and building materials was produced in the second zone.
The third zone consists of extensive fields crops such as grains for bread. These products
have a longer shelf life than dairy products and are lighter than wood to transport.
Ranching is located in the final ring surrounding the central city. Animals can be raised far

51
from the city because they are self-transporting. Animals can be walked to the central city
for sale or butchering. Beyond the fourth ring land is a free good (Figure 4.2) (Samuelson,
1983).
Figure 4. 2: Von Thunen Model
Source: Rosenberg, 2011
A limitation of his theory is that it concentrates on the forces governing the use of land and
the locations of plant and industries. Most of the literature focuses on the input side of the
problem, taking as given various conditions, particularly with respect to prices and demand
in the target markets (Rosenberg, 2011).
Launhardt
Launhardt (1882) conceived much of that for which Alfred Weber received credit, prior to
Weber's work. Moreover, his contributions are surprisingly more modern in their analytical
content than Weber's. This suggests that Launhardt was ahead of his time and simply was
not readily understood by many of his contemporaries (Pinto, 1977).
Launhardt explained that the optimal location of an industrial site depends primarily on the
location of raw and other materials and the demand for the finished product. Therefore, the

52
two most important variables according to him were differences in cost and demand at
alternative sites. Other factors such as real estate prices, education of the workforce, or
landscape, should be considered only after a location is found that minimizes the
transportation costs. Launhardt (1832-1918) developed the location triangle and the weight
triangle. He developed the location triangle by combining a principle of nodes, the pole
principle and Varignon’s frame (Pinto, 1977). This model was used to demonstrate the
impact of the forces of attraction of three (in a polygon more) reference locations
(originally 2 raw material locations and one market) vis-a-vis the (dependent) optimal
(least-transport-cost) location of a processing plant.
Whether Weber was familiar with Launhardt's publications remains unclear. Regardless,
location theoretic thought blossomed only after Weber's book was published (Pinto, 1977).
Weber
In the Weber theory buyers are concentrated in an area, sales prices for all competitors’
commodities are equal, and therefore the only way a firm can increase profits is by
minimising costs (Melvin and Greenhut, 1957). Therefore firms substitute costs at different
locations with the aim of finding the site with lowest cost. Weber’s theory, called the
location triangle, sought the optimum location for the production of a good based on the
fixed locations of the market and two raw material sources, which geographically form a
triangle (Melvin and Greenhut, 1957) (Figure 4.3).

53
Figure 4. 3: Webers’s Triangle
Market
P
Input Input
Goal: Minimize transportation costs
Source: Melvin and Greenhut, 1957
Weber (1909) sought to determine the least-cost production location within the triangle by
estimating the total costs of transporting raw material from both sites to the production site
and product from the production site to the market. The weight of the raw materials and the
final commodity are important determinants of the transport costs and the location of
production. Commodities that lose mass during production can be transported less
expensively from the production site to the market than from the raw material site to the
production site. The production site, therefore, will be located near the raw material
sources. Where there is no great loss of mass during production, total transportation costs
will be lower when located near the market. Once a least-transport-cost location had been
established within the triangle, Weber (1909) attempted to determine a cheap-labour
alternate location. First he plotted the variation of transportation costs against the least-
transport-cost location. Next he identified sites around the triangle that had lower labour
costs than did the least-transport-cost location. If the transport costs were lower than the
labour costs, then a cheap-labour alternative location was determined (Britannica, 2011).
Assumptions of Weber’s theory:
There was a uniform transport system, culture, climate, economic & political
situation

54
• Not all materials were evenly distributed across the plain
o Ubiquitous – were evenly distributed
o Localised – not evenly distributed, may be gross or pure
Size and location of markets are fixed
Transport costs were a function of mass & distance moved
Labour found at fixed locations with the same rates and skills
There was perfect competition so no industry would influence prices and revenue
would be similar.
Some of the limitations of his theory include the following:
Neglect of market demand. Market demand is variable and is affected by the
location of competitors (Greenhut, 1952).
Neglect of competition
No scale effects in transport and production
Hotelling
Hotelling (1929) illustrated the impact of demand upon the location decision. Hotelling’s
price location model is expressed as a two-stage model; firstly firms choose location and
secondly they determine prices. Consumers are evenly distributed and each consumer
consumes exactly one unit of commodity irrespective of price. A consumer will purchase
from the seller whose product has lowest cost (D’Aspremont et al.1979). He used two ice
cream sellers on a beach as an example. Hotelling showed that in choosing their location
they would choose to agglomerate around the market centre and produce identical
products, (Al-Nowaihi and Norman, 1992). Hotelling believed that for a time each seller
would want to eliminate each other by cutting prices or changing position on the beach.
After failing to oust each other, (Since they are equally able to compete) they would agree

55
to compromise by agreeing to sell at the same price at different locations therefore each
would have a 50% share of the market. They would position themselves at the centre of
the two market areas. If another seller entered the market a similar process would take
place (Hotelling, 1929).
As with all models it made certain assumptions
Buyers of commodities are uniformly distributed throughout the market
Market served by two competing entrepreneurs, with equal production costs and
capable of supplying the entire market, producing two identical products.
Infinitely Elastic demand
Costs of production are the same everywhere
Transport costs are paid by the buyer to avoid discrimination by the seller
Transport costs are independent of quantity
Entrepreneurs capable of relocating without cost. The only factor affecting preference
of one seller over another is price plus transport cost (Hotelling, 1929).
One problem with this theory was that the initial assumptions were seen as unrealistic and
very rare in business.
Losch
According to this theory individual buyers and sellers are not atomistic. Individual sellers
have the right to set prices, these prices have an influence over other sellers, and other
sellers act and react with respect to prices and location. Losch (1954) states that the
optimum factory location depends upon the firms’ costs of production at different sites and
the corresponding market area, which it can control from each site (Greenhut, 1952). Each
producer maximises gains. All areas are served by at least one firm. All extraordinary
profits must disappear under the competitive free-entry assumption, new rivals will

56
eliminate them. The area served by each seller must be as small as possible. Consumers on
boundary lines are indifferent to suppliers at minimum cost. Losch (1954) portrays the
hexagonal as the best market area shape; this is determined by a system of equations
(Greenhut, 1952). Losch (1954) theory concludes that the optimum plant location is the
site at which profits are maximised.
Some attempts have been made to build on the Loschian framework to derive general rules
that characterise optimal location in a general equilibrium system. The main obstacles
facing this type of investigation are the non-convexities that enter when economies of scale
are introduced on the production side. Therefore one is left with a relatively abstract
framework that is of limited usefulness in the analysis of industrial location behaviour.
4.2.2 Economic Geography
Isard
Isard (1969 )theory was based on the theorists who went before him namely Weber (1909),
Von Thunen (1826) and Launhardt (1882). He attempted to develop a general theory.
According to Isard, attention should be paid to the geographic distribution of inputs and
outputs and the geographical variations in prices and costs. He went on to conclude that
firms substitute between inputs (e.g., labour for capital) based on the relative price of the
inputs. Isard treated transportation cost as an input. His theory examined the
interdependence of industries as suppliers and buyers of each other’s inputs and outputs
(Isard, 2003).
Outcomes of theory:
Same locational outcome as Weber
More general analysis
Based on accepted theory of input substitution (Isard, 2003)

57
4.2.3 New Economic Geography
Krugman
His model is based on the interaction of three factors: increasing returns of scale,
transportation costs and demand. Given sufficiently strong economies of scale, each
manufacturer wants to serve the national market from a single location. To minimise
transportation costs, he chooses a location with large local demand. However, demand will
usually be bigger in places where there are more industries. Therefore, there is a circular
relation between production and demand, implying that regions that are industrialised first
as a result of a historical accident will attract industries from other regions that have less
favourable initial attractions (Krugman, 1991).
Features of Krugman’s theory:
utility maximising consumers
profit maximizing producers
constant and increasing returns to scale
perfect competition and monopolistic competition
two sectors and two regions
4.2.4 Porter’s Cluster theory
Porter (1998) has proposed that today's economic map of the world is dominated by what
he refers to as clusters: a geographically proximate group of interconnected companies and
associated institutions in a particular field, linked by commonalties and complementarities.
Clusters are viewed as encompassing an array of linked industries and other entities
important to competition, that include, for example, suppliers of inputs such as
components, machinery, and services. Clusters also extend downstream to channels and
customers and laterally to manufacturers of complementary products, and to companies in
industries related by skills, technologies, or common inputs (Porter, 1998). According to

58
Porter an industry cluster helps companies to substantially improve their international
competitiveness compared to organizations working in isolation. Porter explained that
clusters affect competition in three broad ways by firstly, increasing the productivity of
companies based in the area; second, by driving the direction and pace of innovation; and
third, by stimulating the formation of new businesses within the cluster (Porter, 1998).
Productivity
Being part of a cluster allows companies to operate more productively by firstly increasing
the productivity of companies based in the area through efficient access to specialized
inputs, services, employees, information, institutions and training programs, secondly by
allowing rapid diffusion of best practices amongst companies in the cluster and thirdly by
facilitating on-going, visible performance comparisons and strong incentives to improve
vs. local rivals (Porter, 1998).
Innovation
In addition to enhancing productivity, clusters play a key role in a company’s continuing
ability to innovate. In clusters there is a greater likelihood of perceiving innovation (unmet
needs, sophisticated customers, combinations of services or technologies), the presence of
multiple suppliers and institutions also assists in knowledge creation (Porter, 1998).
New Business Formation
Many new companies grow up within an existing cluster, rather than in isolated locations.
This is not surprising because it is often easier to identify perceived gaps in the
marketplace, there are lower barriers to entry than those outside the cluster, and there is a
significant local market to which the new company can market their products (Porter
1998).

59
The vast majority of benefits proposed by Porter's cluster model are evident in the Irish
processing sector and explain the behaviour of the key industry players over the last few
years. Irish milk producers are world class; the industry has access to highly qualified
workforce from universities throughout Ireland, the high concentration of processors in
Ireland results in vigorous local competition. This competitive landscape has put pressure
on dairy processors to improve and innovate.
4.3 Operation research and application of operation research techniques
to location problems
Operation researchers have applied, adapted and improved theoretical location models to
fulfil the field’s specific needs. Location problems tend to be large scale and exhibit the
following characteristics: inconsistent from one problem to the next, involve multiple time
periods, have conflicting objectives. Operation researchers have used the following
operation research techniques to solve practical problems: network algorithms, benders’
decomposition, standard MIP packages, branch and bound, enumeration and heuristics
(Lucas and Chhajed, 2004).
The following presents various applications of operations research techniques to location
decision problems.
4.3.1 Olson model to determine the optimal size of milk-processing plants and optimal
distances between plants in a cooperative dairy
In the 1960’s in Minnesota the dairy industry was in a period of transition. Small
creameries were been replaced with fewer and larger milk processing plants. Management
of dairy firms were eager to develop a long run planning program that would help them
make decisions on the optimum number and location of future plants (Olson, 1959).

60
The problem: Minimise total assembly and processing costs of Minnesota dairy firms
Questions: What was the optimum size of the Minnesota dairy plants?
How far apart should they be from each other?
Assumptions:
• Raw material was evenly and adequately distributed over a wide plain
• Volume of milk supply was given
• Milk assembly costs were uniform throughout the area
• Milk was processed into cheese, butter and powder
• Milk powder, butter and cheese received the same price at all locations
• Perfectly competitive market
• Business in question had a co-operative structure (Olson, 1959)
To determine the lowest total cost, milk assembly and processing costs were analysed.
Assembly costs were broken into two, fixed and variable. Variable cost included transport
driving; according to Olson this was the only component of assembly costs that varied with
volume. This variable part of the milk collection cost varied linearly with the weight and
the volume of milk collected. Processing costs were calculated for several proposed plant
numbers and capacities. Processing cost was assumed to be a polynomial function of the
volume processed. The sizes and the interplant distances were calculated using both
circular and hexagonal market areas for each plant (Olson, 1959).
Olson modelled the impact of the density of milk production, transportation costs and the
ratio of fixed cost to volume on interplant distance (Lucas and Chhajed, 2004).Olson’s
analysis found that plants with capacity larger than 5,000,000 pounds per day may be
optimal (Olson, 1959).

61
4.3.2 Stollsteimer’s model to determine the number, size and location of plants that
minimise the combined transportation and processing
In California, a study was carried out on the marketing efficiency of a major pear-
producing region, Lake County. It was located in the secluded mountainous area of the
northwestern section of California. The specific objective of the work was to determine the
number, size and location of pear packing facilities, which would minimise the combined
cost of assembly and packing the pear crop produced in 1970 (Stollsteimer, 1963).
.
The problem: to determine the number, size and location of plants that minimised the
combined transportation and processing costs involved in assembly and processing any
given quantity of raw material produced in varying amounts at scattered production points.
Questions: How many plants should we have?
Where should our plants be located?
How large should each plant be?
Where should the raw material processed in each plant be obtained?
What customers should be serviced by each plant?
He formulated this problem mathematically as follows:
J I J
Minimise TC= ∑ PjXj│Lk + ∑ ∑ XijCij│ Lk5
j=1 i=1 j=1
With respect to plant numbers (J ¯ L) and location patterns Lk= 1… (LJ)
5
J
∑ Xij = Xi= quantity of raw material available at origin i per production period
j=1
I
∑ Xij = Xj= quantity of material processed at plant j per production period
i=1
I J
∑ ∑ Xij= X= total quantity of raw material produced and processed
i=1 j=1
In the above

62
TC= total processing and assembly costs
Pj= unit processing costs in plant j (j= 1…..J ¯ L) located at Lj
Xij= quantity of raw material shipped from origin i to plant j located at Lj
Cij=unit cost of shipping material from origin I to plant j located with respect to Lj
Lk= one location pattern for J plants anpng the (JL) possible combinations of locations for J
plants given L possible locations
Lj= a specific location for an individual plant (j= 1,2….J) (Stollsteimer, 1963).
However, before attempting to solve the equation, Stollsteimer noted that one must
determine if economies of scale are present or not. With respect to economies of scale he
identified four situations (Stollsteimer, 1963):
• Economies of scale present, plant costs independent of plant location. This is the
most applicable in many plant operations. In this situation unit
costs are a function of plant size. This was the case in the pear factory example.
• Economies of scale present, plant costs vary with location. In this situation unit
plant costs are assumed to be a function of plant location
• No economies of scale present, plant costs independent of plant location
• No economies of scale present, plant costs dependent on plant location
Four categories of data are required when using the above model:
• Estimated or actual amount of raw material to be assembled from each origin
• A transportation cost matrix which specifies the cost of transporting a unit of
material between each point of origin and each potential plant site
• A plant cost function, which permits the determination of the cost of processing any
fixed total quantity of material in a varying number of plants.
This was developed by means of economic-engineering procedures.

63
• Specification of potential plant locations
Not all potential plant sites can be considered as this number would be infinite; one must
narrow down the number of sites considered. In the pear example only sites located
adjacent to the road network were considered (Stollsteimer, 1963).
Total costs were achieved by the addition of assembly costs and processing costs with
respect to plant location and varying numbers of plants. The optimum number of plants
was at the point where assembly costs and production costs intersect i.e. total costs are at a
minimum. The procedures used are an extension of the basic linear programming
transportation model (Stollsteimer, 1963).
It was found in the pear example that one plant with sufficient capacity to handle the
entire forecasted production located at site named K would minimise total costs.
The unique factors here are the inclusion of plant numbers and locations as variables and
the acceptance of economies of scale in plant costs. By relaxing assumptions associated
with plant numbers and locations, changes in the entire system can be analysed
(Stollsteimer, 1963).
4.3.3 King and Logan’s model to determine the optimal location and size of California
cattle slaughtering plants
King and Logan looked at the problem of location and number of processing plants when
consideration was given to shipment patterns of raw materials and finished goods. Thirty-
two supply and demand regions in California plus two regions each for out of state animals
were considered. There were twelve slaughtering plants of varying scale available (King
and Logan, 1964).

64
The problem: The objective was to minimise the combined cost of assembly of live
animals and the shipment of meat to consuming regions
Questions:
Where should processing plants be located?
What is the optimum number and size of plants be to move the animals through plants and
to consumers at least aggregate cost?
The problem was presented mathematically as follows:
Minimise ∑∑ TijXij + ∑HiSi+∑∑tijLij
i j i i j
Xij = meatshipment from region i to region j
Lij =Live animal shipment from region i to region j
Si=slaughter of cattle in region i
Tij= meat transfer cost from region i to region j
tij= animal transfer cost from region i to region j
Hi = slaughter cost per head in region i
Si= supply of cattle into region i
Assumptions:
• Single product firm
• No need to consider present locations of plants
• Demand and supply functions are inelastic
• Transportation costs per unit for live animal and meat do not vary with volume
shipped (also the rate for shipping live animals was adjusted to a dressed weight
equivalent)
• Slaughtering cost; vary with size of the plant and with location (different wage
rates, property taxes and utility rates etc.)

65
• Benefits derived from economies of scale were based on quantities shipped
In this problem there were 34 points of origin and 32 demand centres. The problem was
formulated as a transhipment model. Each production and consumption area became a
possible shipment or transhipment point. King and Logan did four runs of the model as
they ran into difficulties with representing economies of scale. Twelve slaughtering plants
in the 32 regions were found as the optimum number of plants i.e. where costs were
minimised (King and Logan, 1964).
This procedure is useful in that it illustrates the impact of processing costs and transport
costs on plant numbers and locations. Processing costs alone favours centralised, large
scale slaughtering. However transportation costs of raw material and finished goods are of
such importance in remote areas that the establishment of small scale plants is more
economical in this situation (King and Logan, 1964).
4.3.4 Polopolus model for determining the optimum plant numbers and locations for
multiple product processing
Polopulus sought to develop a model for multiple product processing. Processing of sweet
potatoes, okra and tomatoes in Louisiana was examined. There were 25 production regions
and 10 processing locations. In Louisiana okra and tomatoes are produced simultaneously
and sweet potatoes are produced at a different time of the year when it is out of season to
process the other two products (Polopolus, 1965).
Information required:
- Raw material areas and volume produced in each area
- Quantity of raw materials
- Potential processing locations
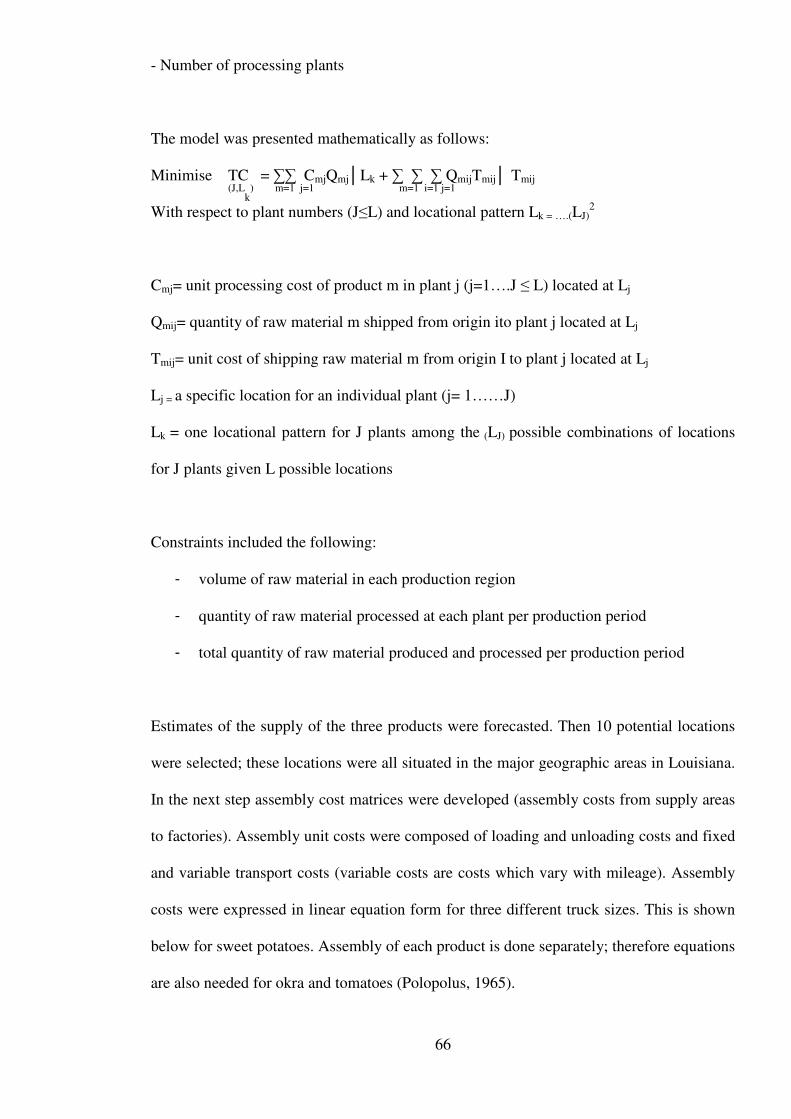
66
- Number of processing plants
The model was presented mathematically as follows:
Minimise TC = ∑∑ CmjQmj│Lk + ∑ ∑ ∑ QmijTmij│ Tmij
(J,Lk
) m=1 j=1 m=1 i=1 j=1
With respect to plant numbers (J≤L) and locational pattern Lk = ….(LJ)2
Cmj= unit processing cost of product m in plant j (j=1….J ≤ L) located at Lj
Qmij= quantity of raw material m shipped from origin ito plant j located at Lj
Tmij= unit cost of shipping raw material m from origin I to plant j located at Lj
Lj = a specific location for an individual plant (j= 1……J)
Lk = one locational pattern for J plants among the (LJ) possible combinations of locations
for J plants given L possible locations
Constraints included the following:
- volume of raw material in each production region
- quantity of raw material processed at each plant per production period
- total quantity of raw material produced and processed per production period
Estimates of the supply of the three products were forecasted. Then 10 potential locations
were selected; these locations were all situated in the major geographic areas in Louisiana.
In the next step assembly cost matrices were developed (assembly costs from supply areas
to factories). Assembly unit costs were composed of loading and unloading costs and fixed
and variable transport costs (variable costs are costs which vary with mileage). Assembly
costs were expressed in linear equation form for three different truck sizes. This is shown
below for sweet potatoes. Assembly of each product is done separately; therefore equations
are also needed for okra and tomatoes (Polopolus, 1965).

67
Small-sized truck <2 tonne load: TAC= 3.75+ .142M
Medium-sized truck between 2 and 7 tonne load: TAC=3.18+.825M
Large-sized truck > 7 tonne load: TAC= 2.385+0.334M
Processing cost equations were calculated for each product through economic engineering
methods.
Canned sweet potatoes: TPCsp= 108840+2.97Qsp
Canned okra: TPCo= 68078+2.38Qo
Canned tomatoes: TPCt= 40895+2.86Qt
Processing costs are made up of fixed and variable. The variable costs varied with the
number of cases produced. Total processing costs for the three products are equal to the
sum of the fixed costs for each (intercept values) which totalled $213,813 minus joint
processing costs which in this case were estimated at $43,618. (Polopolus, 1965).
This problem which minimised total costs with respect to plant numbers was solved with
the aid of a computer program written at Louisiana State University for IBM 7040. In this
example one plant was more economical than any other numbers of plants. Total costs of
processing each product in separate plants was $39,000 higher than processing them all at
1 plant (Polopolus, 1965).
4.3.5 O’ Dwyer’s model for determining of the optimum number, location, and size of
dairy manufacturing plants
In the early 1960’s the Minister for Agriculture in Ireland formed a “Dairy Products
Survey Team” to examine the industry. It was found that operating costs varied

68
considerably from co-operative to co-operative. Knapp was then asked to conduct an
appraisal of the industry; he recommended that greater consolidation was required in the
industry. Also at the same time creameries in competing regions such as Denmark, New
Zealand and Holland were merging. In Ireland the numbers of plants were increasing rather
than decreasing; there were 143 central creameries in Ireland in 1968. For his PhD
research, O’ Dwyer decided to determine the optimum number, location and size of
manufacturing plants operating in Munster that would minimise total transportation and
processing costs. This area comprised the traditional dairying region of Ireland. O’
Dwyer’s methodology was based on Stollsteimers’ model for optimum plant numbers and
locations. As discussed earlier there were two steps to this, firstly a transfer cost function
must be developed with respect to varying plant numbers and locations and secondly a
plant cost function was developed with respect to plant numbers (O’ Dwyer, 1968).
Plant Assumptions:
- Only butter and skim milk power were produced
- Capacity was based on the quantity of peak day milk that the technology in the
plant could handle in a specified time
- All branches required at least one manager and one man
- Mechanical intake did not take place at creameries
- Milk storage facilities were available on site for plants handling up to 8,000 gallons
on peak days, beyond that a truck visits the larger branch
- The following were included in branch creamery costs: investment costs of
buildings, equipment, land, labour and maintenance/repairs of equipment
- The costs of central management, branch management, cleaning, spares and milk
testing facilities are manager), electricity, fuel and oil and maintenance and repairs
of equipment (O’ Dwyer, 1968).

69
Milk assembly assumptions
- A truck operates 9 hours a day, 300 days a year
- Maximum distance from origin to plant is 60 miles one way
- Truck visits the branch once a day
- The truck driver is employed for 9 hours a day
- Two types of trucks are considered (seven tonne truck with capacity of 2,100
gallons or a fifteen tonne articulated truck with capacity of 3,150 gallons)
- The seven tonne truck can travel 25 miles per hour and the fifteen tonne truck can
travel 20 miles an hour (O’ Dwyer, 1968).
Information required:
- Volume of raw material available in each origin
In this example there were 143 origins, these were the branch creamery locations.
The branch creamery locations were the points to where the farmers brought their
milk; the milk was then assembled and transported in bulk to the factories.
- Transportation-cost matrix detailing the cost of transporting a unit of product
between each source and potential site
67 potential site locations were chosen as potential plant sites. Milk assembly costs
were comprised of handling costs at central creamery and transport costs from
central creamery to factories. A transfer cost function was then calculated from
these costs. It was calculated with the help of a computer program, which was
designed for the IBM 360-65.
- Plant cost function (specifying the cost of processing any fixed total quantity of
product in varying plants. Branch creameries of the following peak day capacities
were examined; 2,000, 4,000, 6,000, 8,000 and 10,000 gallons (these plants had
annual intake of 400,000, 800,000, 1,200,000, 1,600,000 and 2,000,000 gallons
respectively). O’ Dwyer decided to use the economic engineering approach and

70
present value analysis to estimate processing costs for hypothetical plants of
various sizes in Ireland. Dairy experts in Ireland e.g. technologists, plant managers
and dairy engineers were consulted in this task.
In this example only skim milk powder costs were relevant (O’ Dwyer, 1968).
In this study total costs were calculated by the addition of assembly costs and processing
costs. The optimum number, location and size of plants is the point where total costs are at
a minimum. In this case it was found to be 23 plants; this represented a 12% reduction
when compared with total costs for 67 plants (which was the number of potential sites
examined in this example) (O’ Dwyer, 1968).
4.3.6 Benseman production planning in the short/medium term in the New Zealand
dairy industry
In 1985 the New Zealand Dairy Board (NZDB) was acquiring product by law from New
Zealand processors. The NZDB was set up under special legislation to act as a commercial
company, owned and governed by the processing co-operatives in proportion to their
supply. The co-ops had no choice but to sell their produce to the New Zealand dairy board.
This enabled the NZ dairy industry as a whole to adopt a cost leadership strategy. Cost
leadership requires the construction of efficient scale facilities, the constant pursuit of cost
reductions, tight costs and overhead control, and a focus on all activities that add cost
(Sankaran 2003). The New Zealand industry’s cost-driven payment system acted as a
direct incentive for companies to achieve greater economies of scale by taking over other
co-ops and securing larger milk flows. The rationale for the statutory power of the NZDB
was that through a single desk seller, the dairy industry as a whole could compete more
effectively with large industry players such as Nestle in international markets. Also it
would ensure that New Zealand dairy processors would not undercut one another’s prices
in overseas markets and thus dilute return to New Zealand farmers. The role of the NZDB

71
was to match market demand with processing capabilities (Sankaran 2003). Co-operatives
had to submit proposals (containing information on prices, quality and technical
requirements) to the NZDB; co-operatives were chosen to produce certain products based
on these. The NZDB developed cost models for every product. These models included all
the costs associated with producing a particular product, collection of milk, administration
and capital costs. The models were updated regularly to reflect technological advances and
other changes to the industry with only one product produced at each site. By having to
participate in the industry cost surveys, the individual co-ops were forced to better measure
their own costs, which in turn facilitated better tracking and management (Sankaran 2003).
Production planning was planned manually, however due to the complexity of this task not
all factors could be accounted for. Benseman in 1985 developed a linear programming
model for the New Zealand Co-operative Dairy Company (NZCDC) that could include all
of these factors. The NZCDC processed 35% of New Zealand milk production at that time.
It owned a transport fleet consisting of 219 tankers and 97 trailers. The catchment areas for
this co-op were grouped into 45 regions. 16 base products were considered. Two dummy
factories were included (butter and milk powder factories) and their aim was to emphasize
areas where more capacity was needed. Seasonality in milk production was acknowledged;
peak months included June to October where production rises to 12 million litres a day.
As a result of seasonality production plans need to be changed regularly due to variations
in milk supply volumes and yields. To accommodate this the season was broken into 36
10-day periods. While 10 day periods were used for short term planning the model used
months when planning on a yearly basis. In the early stages of model development each
month was solved separately however the model was then able to simultaneously solve
several months at a time. The following data was required in the formulation of the model:
- Freight costs
- Factory capacities and costs

72
- Product prices and quotas
- Whole milk forecasting
- Product yields (Sankaran 2003)
The model was written mathematically as follows:
Maximise Profit = ∑∑∑ Tkpt*(Basepricept + Gradepremiumkp - Productioncostkp) - k p t
∑ ∑ Ppt*Penaltypt - ∑ ∑ Zkt*Fixedcosts - ∑ ∑ ∑ ∑ ∑ Xijkpt*Freightcostijt p t i j k p t i= input type (whole, cream, buttermilk)
j= origin collection region or factory
k= destination factory
p= product type
t= time interval representing 10 days or a month
Xijkpt= volumes of input I moved daily from j to k to make p in interval t
Tkpt = tonnes of product p made daily at factory k in interval t
Ppt = tonnes of product p sold at base prices in interval t
Zkt= tonnes of product p sold at penalty prices in interval t
Bpt =1 when factory k is operating in interval t, 0 otherwise
In 1985 the problem consisted of 680 constraints and 2050 variables. OMNI matrix
generator/report writer was used to generate mathematical models in MSPX data format.
MPSX/370 which is an IBM program then read the LP problem from OMNI matrix
generator/report writer and solved it in 7 minutes. The model was then passed back to
OMNI matrix generator/report writer where the solution was converted into suitable form
that managers could understand and read. The following reports were produced by the LP
analyst for managers after solutions for all periods were found (Benseman, 1986):
- Allocation report

73
This reports illustrates how inputs should be used in factories
- Spare capacity report
This report shows remaining capacity at plants.
For plants that are capable of making multiple products capacity is measured in
terms of whole milk.
- Production report
This reports shows the tonnage of each product produced in a factory every month
- Reallocating whole milk report
This report illustrates the difference in costs of optimal and second best supply
areas and product mixes
It was claimed that the LP system saved NZCDC over $1 million a year in their processing
operations. It coordinated production more successfully and it also highlighted the need for
factory closure in some areas in off peak periods, as running costs made it uneconomical to
keep all of the factories open (Benseman, 1986).
4.3.7 Mellalieu/Hall production planning in the long term in the New Zealand dairy
industry
NZCDC used a model called NETPLAN, which was a network formulation to help
managers with long term planning. This model was aimed at assisting managers with
management decisions such as how to spend an investment of $200m in new plant
operations/upgrading of present facilities, transportation policies and product risk
strategies. Various scenarios regarding growth in milk supply and industry organisation
was modelled over a 10-year time horizon (Sankaran, 2003). Network approach was used
as it could produce a solution quickly and also for ease of representation i.e. when
reformulation is required it was possible to extend the current formulation. The 4500 farms
were grouped into 176 areas based on geographic factors and densities of factories. This

74
allowed the user to work with a more solvable network size. The network consisted of 806
arcs and 214 nodes which were made up of 176 supply areas, 14 factories, up to 5
processes at each factory and eight different products been produced (yields are allowed to
vary from factory to factory). The following data was required for the model formulation:
- Transport costs
- Process net revenues
- Fixed production costs
NETPLAN with the exception of the out of kilter algorithm was written in I.B.M. PL/I,
the algorithm was written in FORTRAN. NETPLAN enabled the travelling salesman
problem to be solved simultaneously with product allocation decisions subject to
capacity and product demand constraints, Mellalieu and Hall, 1983. NETPLAN’s
interactiveness and ability to perform sensitive analyses quickly proved very beneficial
(Mellalieu and Hall, 1983).
However NETPLAN ran into the following complications:
- All butter factories were ignored
- All cream, whey and buttermilk by-products were ignored
- Multi-period quotas and two-tier prices were ignored
- Multi-input products e.g. baby food were ignored
- Back loading in milk assembly operations were ignored (Benseman, 1986).
4.3.8 Optimisation of Nutricia supply network in Hungary
Nutricia, a large international dairy company, purchased a number of dairy companies in
Hungary between 1995 and 1998. Milk was supplied to these companies from 400 farms;
the companies owned 9 processing plants in which they produced over 300 different
products. The final products were then distributed to 17 distribution centres, which served

75
17,000 retail stores. A proportion of products was also exported and sold to industry.
Inefficiencies were evident in the whole supply chain therefore Nutricia was eager to
minimise total production and transport costs. In order to achieve this they developed a
mixed integer linear program model. The problem was defined as follows; “What should
be the optimal number, location and size of the production plants and what product groups
should each plant produce, given the market demand and the milk supply, such that the
total costs (comprising the production and transportation costs) are minimised.” Therefore
their objective function was to minimise milk collection costs+ milk transportation costs
from region to plant+ milk reception costs + production costs + transportation costs of
inter-deliveries from plant to plant+ transportation costs of finished products from plant to
sales region (Wouda et al. 2003).
The following costs were required:
- Milk collection costs (from farm to farm)
- Transport costs (driving from last farm to plant and from plant to first farm)
- Production costs
Product costs were based on greenfield costs. A greenfield situation involves the
following: define the capacity needed for a certain product group, invest in the
newest and most advanced proven equipment available, arrange it into the most
efficient layout of the plant.
- Inter-transportation costs
- Distribution costs for finished products
- Warehousing costs
Aggregation of data to make the model more solvable:
- milk supply is constant throughout the year, no variation in daily supply

76
- 400 farms grouped into 9 regions with 1 gravity point in each region, each region
produced a certain milk volume
- 300 products grouped into 13 product groups based on preparation and packaging
equipment
- Distribution centres and shops grouped into 20 geographical regions, each region is
a county, and the gravity point is the capital of the county (Wouda et al. 2003).
.
The problem was written mathematically as follows:
Minimise smrc ∑ Y MILK j + ∑∑ (mcci + mrc + tcmij)*Xij+ ∑spcp*∑YPRODjp + j i j p j
∑pcp * ∑PRODjp +∑∑tcihj* (CREAMhj + WHEYhj + PERhj + BUThj) p j h i
+ ∑∑tcfjk*∑Zjkp
j k p
Where:
mcci = milk collection costs in region i
mrc = variable costs milk reception
tcmij= milk transportation costs from region I to region j
Xij = amount of milk transported from region I to location j
spcp = set up costs production line p
pcp = variable costs of production line p
tcihj =transportation costs of semi=finished goods from location h to j
creamhj = amount of cream transported from region h to j
tcfjk = transportation costs of finished product from from location j to depot k
Zjkp =amount of product p transported from location j to depot k
The model was solved using Xpress-MP optimisation system from Dash Optimisation Ltd.
The following scenarios were examined:
- Scenario 0:current situation using greenfield production costs

77
- Scenario 1:running the model without any additional restrictions to calculate the
optimal solution using the current 9 locations
- Scenario 2:running the model with an additional four locations, not all current
locations need to be used, supply could travel to new locations
- Scenario 3: running the model with one of the optimal destinations left out
- Scenario 4: running the model with production of a certain product group forced
into a certain location
- Scenario 5: Running the model with a fixed number of possible plants i.e. 1 or 2
- Scenario 6: Running the model after closing one plant in the current situation
The optimal solution was found to be 3 plant locations. Each product group was produced
only at 1 location. There was still inter-transport but considerably less than the current
situation. The model was found to be a very useful tool in the decision making process in
Nutricia (Wouda et al. 2003).
4.3.9Tursun model to optimise bio refinery locations and transportation network for
the future biofuels industry in Illinois
Corn ethanol is the most widely used additive in renewable energy production in the US.
U.S. ethanol production was 6.5 billion gallons in 2007, an increase of 4.9 billion gallons
from 2000 (production was approx. 1.6 billion gallons in 2000). There is a drive in the US
to increase the quantity of renewable fuels used in transportation fuels. The US
Environmental Protection Agency has mandated that by 2012, at least 7.5 billion gallons of
renewable fuel must be blended into motor-vehicle fuel and 36 billion gallons by 2022
(Tursun, 2008).

78
Problem: Determine the optimal transportation and processing of raw materials, delivery of
the end product, selection of the bio refinery types, and capacity and location decisions to
meet the mandated ethanol targets throughout the 2007-2022 in Illinois(Tursun, 2008).
Questions:
What type of processing facilities should be developed?
What should the capacities of these plants be?
Where and when should they be built?
What quantity of raw material should be transported from production areas to processing
facilities?
What quantity of ethanol should be transported to blending facilities?
What is the demand for end product?
The problem is formulated as a mixed integer linear program model. The objective of the
model is to minimize the total costs including transportation costs (of raw material to bio
fuel plants and of ethanol from plants to market), processing costs, and fixed investment
costs associated with building refineries, minus by product credits(Tursun, 2008).
Data required:
- Supply of raw material each year from 102 counties in Illinois
- Demand for ethanol for each year in each of the 102 counties in Illinois (it is
assumed to be 19% of the national ethanol target)
- Transportation costs between production regions and potential refinery locations
- Transportation costs between refineries and blenders
- Transportation costs between blenders’ locations and markets for end products (in
this situation end markets are counties, 1 point is picked in each county)

79
- Costs of bio refineries including fixed costs (cost of land, machinery and new
facilities) , processing costs (dependent on volume processed) and operational
expenses (labour and administration expenses)(Tursun, 2008).
According to the solution from the model the number of corn-based plants should grow
from 11 plants in 2007 to 15 plants in 2022. A number of existing plants should be
expanded by 50%, in particular in the northern and northeastern counties. In total 18
cellulosic ethanol refineries would be built by 2022 with an average size of 233 million
gallons per year. The cellulosic plants should be located throughout southern and
northeastern counties(Tursun, 2008).
4.3.10 Buschendorf, Boysen and Schroder models’ to optimise the German dairy
industry
The German dairy industry is the largest component of the German food industry. The
number of dairy plants has been decreasing in recent years however the reduction is slower
than its main competitors namely Denmark, Netherlands and New Zealand. Dairy
companies are opting towards fewer and larger plants as they wish to take advantage of
economies of scale in processing. However as the number of plants decrease, transport
costs increase. Therefore, one needs to find the number of plants where total costs are at a
minimum in order to optimise the structure.
Boysen and Schroder 2009 and Buschendorf 2008 both developed mixed integer models
with the endeavour to optimise the German dairy industry. Boysen used an algorithm,
which he wrote himself to solve the problem. Buschendorf (2008) used MOPS, an LP
solver to solve the problem. The following gives an overview of both of their models.
Boysen and Schroder’s model can be written mathematically as follows:

80
Minimise ∑(fd*∑ Ydl + k* ∑cpd*zpd + ∑ sl* qdl) dƐDlƐ L
dpƐP
fd= annual overhead costs of operating dairy plant d
Ydl = 1 dairy d operates on production level l, 0 otherwise
cpd= distance between region p and dairy d plus the radius rp and back
zpd= number of transports per collection cycle
sl = processing cost per tonne on production level l
qdl = output quantity of dairy d on production level l
d = 1,…,S dairies
From Boysen and Schroders’ objective function it can be seen that the objective was to
minimise assembly costs, production costs and overhead costs. In relation to milk assembly
costs he looked at the number of tankers required, capacity of tankers and frequency of
collection from farms. Boysen and Schroder (2009) did not include product distribution
costs in his model as they are of lesser importance than milk assembly costs and also if
included the model would expand exponentially. They looked at three scenarios a
benchmark, a short run scenario and a long run scenario. Supply in all scenarios was the
volume supplied in 2000/2001 which was 24,395,801 tonnes of milk, total capacity of all
the factories was 33,196,800 tonnes (2000/2001 figures). Boysen and Schroder (2009)
assumed a particular product mix which was the norm of the industry at the time the study
was conducted. In the short term scenario all 360 plants (actual number of plants in 2001)
stayed open; capacity utilisation was equal in all at 73.5%. In the short term scenario plants
were allowed to operate at different capacities, however capacities were fixed and plants
were also allowed to shut down. In the long term scenario capacity was not fixed and
wasalso allowed to vary from plant to plant. The results show that in the benchmark
scenario there were 360 plants open, in short run there were 156 and in the long term 65

81
plants (Table 4.1). When compared with the benchmark scenario costs decrease by 11%
per tonne in the short term and 16% per tonne in the long term (next ten years) or 1.7 cent
per kg of milk processed (Table 4.2) (Boysen and Schroder, 2009).
Table 4.1: Number of plants
Number of plants Benchmark Short-run Long-run
Small 182 20 0
Medium 108 74 12
Large 70 63 53
Total 360 156 65
Source: Boysen and Schroder, 2009
Table 4.2: Scenarios explored and corresponding costs
Scenario Cost per tonne (euro) In index
form
Benchmark 108.1 100
Short-run 96.1 89
Long-run 90.4 84
Source: Boysen and Schroder, 2009
Buschendorf’s model can be written mathematically as follows:
RBBBBP
Minimise ∑ ∑ XTRMrb * ZTKrb+ ∑ xsb*ZVKSep + ∑ Ysb*ZFKSep+ ∑∑ xhbp* ZVKp r=1 b=1b=1 b=1 b=1 p=1
BPBBBMBPV
+ ∑ ∑ zHBp * ZFKp +∑∑ (xTMMbb + xTRAbb) *ZTKbb+ ∑∑ X * ZTKbm + ∑∑∑ b=1 p=1 b=1 b+1=1 b=1 m=1b=1p=1v=1
xTMPbpv* ZTKbpv
Where:
R =raw materials centre with host locations r1 to r100

82
B = dairy locations with sites b1 to b271
P = dairy production with products p1 to p8 (fresh milk, H-Milch, butter, cheese, soft
cheese, yogurt, cheese and skimmed-milk powder)
M = whey processors with sites m1 to m11
V = consumption centre of dairy products with delivery locations v1 to v59
T = transport of raw milk (TRM) (TMM) of skimmed milk, cream (TRA), whey
concentrate (TMOK) or dairyproduction with products p1 to p8 (fresh milk, H-Milch,
butter, cheese, soft cheese, yogurt, cheese and skimmed-milk powder)
S = separation of raw milk fat and non fat (protein component)
H = production of dairy products
d = target function
x = continuous variable of activities T, S and H with size x
y = integer binary [0,1] variable of activity S scope y
z = integer [0,1,2,3,4,5,6,7] variable of activity H scope z
ZTKrb = costs for transportation of raw milkfrom raw material centres R in dairy
establishment premises B
ZTKbb = costs for the transport of whey concentrate of dairy locations B to whey
processors M
ZTKbm = costs for the transport of skimmed milk and cream between dairy locations B
ZTKbpv =costs for the transport of dairy products P from dairy location of B in V
ZVKSep = variable costs of separation or the general milk processing location and the
administrative costs
ZFKSep= fixed costs of separation or the general milk processing
ZVKp = variable cost production of product p
ZFKp = fixed costs of products p
83
From Buschendorf‘s objective function it can be seen that his intention was to minimise
milk transport costs, processing costs and product distribution costs as a means of
optimising the industry. He did not go into as much detail in milk transport costs as
Boysen. Another difference between the two was that Buschendorf (2008) included the
cost of distribution of dairy products to EU, non EU countries and throughout Germany.
Buschendorf estimated what milk supply volumes would be in Germany in 2013 using
OECD, FAPRI and FAO forecasts. Acccording to Buschendorf supply will become more
concentrated in fewer dairy farms. He also estimated demand for dairy products in 2013.
He used these demand and supply estimates in his model. Eight products groups were
considered, however niche products were not included in the model. Buschendorf used
MOPS software to solve the problem. MOPS is a linear program solver. Buschendorf
found that the optimum number of plants for the German dairy industry would be 90/100
plants (in 2007 there were 239 plants). 90/100 plants would lead to savings of 1.2 cent/kg
of milk processed (Buschendorf, 2008).
Overall their results are not very different when one considers that Boysen was working
with 2001 data and Buschendorf with 2007 data. They present two different ways of
optimising the industry using different approaches in the costs they included and the
software that they used.
4.4 Optimum location of the Irish dairy processing sector
The model that will be developed in subsequent chapters in this thesis is primarily
concerned with Weberian theory. As will be indicated in more detail it is a least cost model
and production costs are independent of location. The problem is formulated into a
mathematical programming problem similar to that of Stollsteimer, O’ Dwyer, Wouda et
al., Boysen and Buschendorf. The theory of the model is that the optimum organisation

84
structure of the Irish dairy processing sector involves a balancing of increasing transport
costs against decreasing processing costs.
Milk Transport Costs
In reality resources are not evenly distributed across space. Ex-farm milk transport may be
defined as the complete set of activities involved in transporting milk from farms to
factories. While the term milk assembly is sometimes used, this is more commonly defined
to include also the milk storage activity at the farm level, as well as milk transport. In
economic terms milk transport is subject to several principles of transport economics,
which primarily concern the relationship between cost and distance. The general
relationship between length of haul and cost of transport may be called the transfer cost
function. If one takes a central processing point (or market), surrounded by raw material
(or product supplies), scattered over a uniform, flat geographic area where travel in every
direction is equally feasible, the transfer cost function normally has a characteristic shape.
This involves cost increasing with distance but at a decreasing rate. This was illustrated in
both plain and cross sectional forms by Bressler (1976). Where cost increases with distance
at a decreasing rate, the resulting isocost contours are concentric circles with radii that
increase at an increasing rate, (Figure 4.4). The isocost contours are drawn to represent
equal increments to transfer cost from one contour to the next. Thus in the cross sectional
view the distance between D1 and D2, D2 and D3, etc. becomes greater and greater,
reflecting the increase in cost at a decreasing rate.

85
Figure 4. 4: Length of haul to market centre
Source: Bressler 1976
With regard to milk transport specifically, there are six separate activities normally
involved as follows:
a) Transport Driving; this involves the time spent in driving from plant to first farm
and from last farm to plant (see figure 4.5).
b) Assembly Driving; this involves time spent driving between farms on the route (see
figure 4.6).
c) On-Farm Routine Activities; this includes time spent attaching hose, agitating milk,
sampling, rinsing tank, paperwork etc. on farms.
d) On-Farm Pumping; this depends on pumping rates

86
e) Plant Non-Pumping; this includes tanker washing, waiting time, office, lunch, etc.
f) Plant Pumping; this depends on plant pumping rate
The effect of changes in supplier volume or distance from processing plant on these six
activities provides some valuable insights into the factors that affect milk transport costs
(Keane, 1986). The effect of volume can be dealt with by considering the effect of a
doubling of supply per supplier. Then transport driving costs would double approximately,
as twice as many trips between the plant and the collection area would be required.
Likewise farm pumping, plant pumping and plant non-pumping costs would double due to
the doubling of loads. Thus these four components are volume related and increase in
proportion with increases in volume (Keane, 1986). Assembly driving, however, will not
vary significantly even if volume doubles, as only one trip is required from farm to farm.
Likewise, on-farm routine costs will remain unchanged regardless of volume. These two
cost components arise due to the servicing of suppliers and are unrelated to volume or size
of supplier as such. This form of breakdown forms the theoretical basis underpinning the
division of transport charges on a stop or volume related basis (Keane, 1986).
The effect of distance from the plant may be similarly considered by assuming a doubling
of the distance between the catchment area and the processing plant. In this case the
transport driving component will double but the other five components will remain
unchanged. This approach has formed the basis for zonal charges for milk transport in
some countries (Lee et al., 1985).

87
Figure 4. 5: Assembly driving: 2 routes
Source: Own diagram
Figure 4. 6: Assembly driving: 1 route
Source: Own diagram
Plant
1st 3rd
5th
6th
7th 2nd 4th
8th
Transport Driving
Plant
1st
2nd
3rd
4th
5th
6th
7th
8th
Transport Driving

88
Processing Costs and Economic Principles
Production costs include labour, capital, and technical and managerial skills (De Souza,
1990). Economies of scale are features of a firm’s technology that lead to falling long-run
average cost as output increases (Parkin, 1999). Scale refers to the size of the firm as
measured by its output (Begg et al., 2000). Scale is important as producers are concerned
with the unit cost of production and adjustments in scale can produce considerable
variations in unit cost (De Souza, 1990) (Figure 4.7).
Figure 4. 7: Optimum scale of output
Source: De Souza, 1990
Many reasons may be cited for lower long term average costs are greater output, Hay and
Morris, (1991);
Technical economies made in the actual production of the good. For example, large
firms can use expensive machinery intensively.
Managerial economies made in the administration of a large firm by splitting up
management jobs and employing specialist accountants, salesmen, etc.
Financial economies made by borrowing money at lower rates of interest than
smaller firms.

89
Marketing economies made by spreading the high cost of advertising on television
and in national newspapers, across a large level of output.
Commercial economies made when buying supplies in bulk and therefore gaining a
larger discount.
Research and development economies made when developing new and better
products (Hay and Morris, 1991)
Additional economies of scale at the level of the firm involve such factors as research and
development, management, advertising, computer services, and centralised accounting,
Hay and Morris (1991). Further economies of scale are realised when costs are reduced by
producing two or more products jointly, rather than in separate specialised plants. Also,
large diversified firms can make there purchasing power felt in dealing with specialised
suppliers. Diseconomies of scale may also exist beyond a certain size, connected with such
factors as increasing problems of information and co-ordination, and problems of
budgetary control (De Jong, 1993).
4.5 Conclusion
Laundhart, Von Thunen, and Weber were among the first to contribute to the field of
location economics. Their work, along with Hotelling and Losch, work became known as
classical location theory. Their work was primarily concerned with forces governing the
use of land and the locations of plants and industries. One of the limitations of this theory
is that it focused on the input side of the problem and took demand as given. Isard
developed the theory grouped under regional science. Regional science refers to
developments in location theory and spatial economics that occurred from the 1950’s.
Regional science focused on explaining why one production centre is more attractive to
another in relation to production and demand for final products. This theory contributed to
the explanation of forces governing international trade. Location theory was then neglected

90
until Krugman’s work generated renewed interest. New economic geography aims to
explain processes of concentration and deconcentration of manufacturing in a two-sector
economy. Economists now acknowledge that location theory can provide powerful
analogies that can be applied to a wide variety of microeconomic problems. As a result
research in the area is ongoing.
Along with location economists, operational researchers have spent significant time and
effort in examining location problems (Figure 4.8). There has been an increasing focus on
supply chains in the last decade. Therefore this has increased interest in operation research
techniques and their application to real life business problems.
Chapter 5 examines the methodology techniques used in this thesis

91
Figure 4. 8: Review of applications of theory of optimal locations
Olson (1959)
Considered the problem of determining the optimal size of milk-processing plants and optimal distances between plants in a cooperative dairy in Minnesota, USA
↓
Stollsteimer (1963) Considered the problem of simultaneously determining the number, size and location of plants that minimise the combined transportation and processing costs involved in milk
assembly and processing in pear plants in California, USA ↓
King and Logan (1964) Determination of optimal location and size of California cattle slaughtering plants, when the location and quantity of slaughtered animals as well as the final product demand were
known ↓
Popolus (1965) Considered the problem of optimum plant numbers and locations for multiple product
processing in Louisiana, USA ↓
O’ Dwyer (1968) Determination of the optimum number, location, and size of dairy manufacturing plants in
Ireland ↓
Mellalieu/Hall (1983) and Benseman (1986) Production planning in the New Zealand dairy industry
↓
Wouda, Van Beek, Van Der Vorst and Tacke (2003) Optimisation of Nutricia supply network in Hungary
↓
Tursun (2008) Optimal Bio refinery Locations and Transportation Network for the
Future Biofuels Industry in Illinois, USA ↓
Buschendorf (2008) and Boysen and Schroder (2009) Optimisation of the German dairy industry
Source: Own diagram

92
References
Al-Nowaihi, A. and Norman, G. 1992. Spatial competition by quantity setting firms: a
comparison of simultaneous and two-stage quantity-location games. University of
Leicester Discussion Paper in Economics.
Begg, D., Fischler, S. and Dornbusch, R. 2000. Economics, Sixth edition. London:
McGraw-Hill.
Benseman, B.R. 1986. Production Planning in the New Zealand Dairy Industry. The
Journal of the Operational Research Society, Volume 37, No.8.
Boysen, O. and Schroder, C. 2009. Economies of Scale in Production versus Diseconomies
in Transportation: On Structural Change in the German Dairy Industry. Trinity Economics
Papers, Trinity College Dublin, Department of Economics.
Bressler, R.G. and King, R.A. 1976. Markets, Prices and Interregional Trade, Wiley, USA.
Britannica, 2011. Location theory. Accessed Nov. 10, 2010.
http://www.britannica.com/EBchecked/topic/345682/location-theory.
Buschendorf, H. 2008. Optimierung der Betriebsstättenstruktur als Ausgangspunkt
unternehmensstrategischer Optionen der Molkereiwirtschaft Deutschlands. PhD thesis
submitted to the Technical University Munich.
D’Aspremont, C., Gabszewicz, J. Jaskold and Thisse J. F. 1979. On Hotellings “Stability
in Competition”’, Econometrica, Volume 47, No.5.

93
De Jong, H.W. 1993. Market Structures in The European Economic Community. Studies
in Industrial Organization, 1993, Volume 18, 1-42.
De Souza, A. 1990. A Geography of World Economy. Merrill Publishing Company,
London.
Greenhut, M. L. 1952. The size and shape of the market area of a firm. Southern Economic
Journal, Volume 19, Pages 37-50.
Hay, D.A. and Morris, D.J. (1991). Industrial Economics and Organisation:
Theory and Evidence, Oxford Univ. Press.
Hotelling, H. 1929. Stability in competition. Economic Journal. 39 41-57.
Isard, W. 2003. History of regional Science and the Regional Science Association
International: The beginnings and early history. Springer, Berlin Heidelberg New York.
Keane, M. (1986). The Economics of Milk Transport, Agribusiness Discussion Paper No.
5. Department of Food Economics,University College Cork.
King, G.A. and Logan, S.H. 1964. Optimum location, number and size of processing plants
with raw product and final product shipment. Journal of Farm Economics, Volume 46, No.
1.
Krugman, P.R. 1991. Geography of Trade. Cambridge, MA, MIT Press.

94
Lee, D.R., W.C. Wasserman, W.H. Lesser, T.H. Stafford, and R.D. Boynton. 1985. A
Cost-Based Rate System for Bulk Milk Assembly. A.E. Res. 85-9, April 1985, page 27.
Lucas, M.T and Chhajed, D. 2004. Applications of location analysis in agriculture: a
survey. Journal of the Operational Research Society, Volume 55, Issue 6, Pages 561-578.
Mellalieu P.J. and Hall K.R. 1983. An Interactive Planning Model for the New Zealand
Dairy Industry. Operation Research Society Ltd, Volume 34, No 6.
Melvin L. and Greenhut. 1957. Games, Capitalism and General Location Theory. The
Manchester School, Volume 25, Issue 1, Pages 61-83, January 1957.
O’ Dwyer, T. 1968. Determination of the optimum number, location and size of dairy
manufacturing plants. PhD Thesis submitted to Cornell University.
Olson, F. L. 1959. Location theory as applied to milk processing plants. Journal of Farm
Economics, Volume 41. No.5.
Parkin M. 1999. Microeconomics, Fifth edition. Addison-Wesley publishing Company.
Reading, Massachusetts.
Pinto, J. V. 1977. Launhardt and location theory: Rediscovery of a Neglected Book.
Journal of Regional Science.Volume 17, Issue 1, Pages 17-29, April 1977.
Polopolus, L. 1965. Optimum Plant Numbers and Locations for Multiple
ProductProcessing. Journal of Farm Economics, Vol. 47, No. 3.

95
Porter, Michael E., Clusters and the New Economics of Competition, Harvard Business
Review, (November December 1998): 77-90
Rosenberg, M. 2011. The Von Thunen Model. Accessed April 10, 2011.
http://geography.about.com/od/urbaneconomicgeography/a/vonthunen.htm.
Samuelson, P.A. 1983. Thunen at Two Hundred, Journal of Economic Literature,
American Economic Association, vol. 21(4), pages 1468-88, December.
Sankaran, J.K. 2003. Logistics in relation to strategy in dairying, the case of New Zealand
Dairy. International Journal of Operations and Production Management, Volume 23 No.5.
Stollsteimer, J.F. 1963. A working model for plant numbers and locations. Journal of
Farm Economics, Volume 45, No.3.
Tursun, D.Ü., Kang, S., Önal, H., Ouyang, Y., and Scheffran, J.. 2008. Optimal Bio
refinery Locations and Transportation Network for the Future Biofuels Industry in Illinois.
Proceedings of Farm Foundation/USDA Conference, St. Louis, Missouri, October 15 and
16, 2008.
Wouda, F.H.E., Van Beek, P., Van der Vorst, J.G.A.J. and Heiko, T. 2002. An application
of mixed-integer programming models on the redesign of the supply network of Nutricia
Dairy and Drinks Group in Hungary’, OR Spectrum 2002, No. 24.

96
Chapter 5
Methodology 5.1 Introduction
This chapter presents the research design and methodologies employed in this study. The
objective of this chapter is to describe and discuss the research method and methodology
that has been applied for this research. The overall research question that guided this study
was: What is the least cost industry configuration for the Irish dairy industry post milk
quota abolition in 2020? The main research question was broken down into the following
research sub-questions:
Sub-question 1:What are the effects of various efficiency factors on milk transport costs in
Ireland? What are the effects of different milk production patterns on milk transport costs
in Ireland?
Sub-question 2: Will milk production increase post milk quota abolition, if so where will it
increase? How many processing plants should Ireland have post milk quota abolition?
Where should the plants be located? How large should each plant be? Where should the
milk to be processed at each plant should be sourced? How should milk be collected?
Sub-question 3:What will the total processing and transport costs be post milk quota
abolition? What is the capital requirement for the Irish milk processing sector post milk
quota abolition?

97
The objectives of this study were: (i) to develop, validate and describe a national milk
transport model for simulating milk transport activities in Ireland and (ii) to develop a
model to determine the least cost dairy processing sector configuration in 2020 taking
cognisance of regional milk supply, processing and milk transport costs.
In this chapter, firstly, the methods of data collection are discussed and the various
research techniques used in the study are investigated.
Research
The word research is composed of two syllables, re and search. The dictionary defines the
former as a prefix meaning again, anew or over again and the latter as a verb meaning to
examine closely and carefully, to test and try, or to probe. Together they form a noun
describing a careful, systematic, patient study and investigation in some field of
knowledge, undertaken to establish facts or principles (Grinnell 1993: 4).
Grinnell further adds: ‘research is a structured inquiry that utilises acceptable scientific
methodology to solve problems and creates new knowledge that is generally
applicable.’(1993:4)
Burns (1994:2) defines research as ‘a systematic investigation to find answers to a
problem.’
According to Kerlinger (1986: 10), ‘scientific research is a systematic, controlled
empirical and critical investigation of propositions about the presumed
relationships about various phenomena.’
From these definitions it is clear that research is a process for collecting, analysing and
interpreting information to answer questions. But to qualify as research, the process must
have certain characteristics: it must, as far as possible, be controlled, rigorous, systematic,
valid and verifiable, empirical, and critical. A general model of the marketing research

98
process is presented here, which can be applied to a wide range of real situations with
minor adaptations (Figure 5.1) (Kumar, 1999).

99
Figure 5. 1: Model of marketing research process
Problem definition
⇓
Research objectives
⇓
Planning the research
• Prepare the research brief
• Agree the research plan
⇓
Data Collection
⇓
Conduct the research
⇓
Analyse and interpret the information
⇓
Prepare and present the report
⇓
Research evaluation
Source: Brassington (1997)

100
5.2 Data Collection
The data required for the first objective in this study was collected through desk research
and consultation with industry experts1. The following basic data was required:
Capital costs
Labour costs
Running costs
Geographical location of milk producers and quantity of milk produced in each
location (milk supply)
Location of factories and the milk demand/capacity of each
The distances between each supplier location and destination.
The transport costs included in the model are representative of the 2005 values taken from
a survey conducted by Quinlan et al. (2005) on milk transport costs in Ireland. This survey
was carried out across the dairy industry in Ireland with representatives from all of the
major processors completing the survey. These costs were updated with 2010 values with
the aid of published literature, processors annual reports, the Central Statistics office of
Ireland or were assumed based on consultation with industry experts. The 2010 costs were
then verified using the Delphi method with industry experts. The Delphi method is a
forecasting method based on the results of questionnaires sent to a panel of experts.
Several rounds of questionnaires are sent out, and the anonymous responses are aggregated
and shared with the group after each round. The experts are allowed to adjust their answers
in subsequent rounds. Because multiple rounds of questions are asked and because each
member of the panel is told what the group thinks as a whole, the Delphi Method seeks to
reach the "correct" response through consensus.
1Industry experts represent processors in the Irish dairy industry, names cannot be disclosed for confidential reasons
101
Annual costs, which relate to capital expenditure including truck depreciation, tanker
depreciation, interest and capital costs per tanker. The lifespan of the truck is depreciated
based on the truck running; for 220,000 miles and the trailer or milk tanker was based on
the trailer running for 660,000 miles (consultation with industry experts2). In the analysis it
was assumed that all capital is borrowed over a 7-year period with an interest rate of5% per
annum. Capital costs include provisions for 10% spare tankers and trucks as extra tankers
are required to accommodate fluctuations in milk production, transportation schedules and
normal glitches that can occur in transportation systems.
Labour cost was assumed to be €20 per hour based on industry guidelines and includes
PRSI contributions (Quinlan et. al 2010), which is similar to costs of workers in the
transportable goods services for 2007 where the most up to date information is available
for Ireland (Central Statistics Office 2009).
Running costs include insurance, tax, tyre replacement, service/maintenance and fuel costs.
The Department of Agriculture, Food and Fisheries supplied information on dairy cow
numbers at district electoral division (D.E.D.) level. Typical seasonal milk supply patterns
were applied based on data from the Central Statistics Office (CSO, 2011). In this way an
estimate of milk availability throughout the year by rural district was derived. The DED’s
were then aggregated up into 156 rural districts. Information about the location of
destinations (Processors) was mainly obtained from a detailed map of the locations of dairy
factories, which had been published, Irish Dairy Board (2009). Based on information on
annual milk intake by factory, it was estimated that 19 Dairy Processing locations exist;
this captured the vast bulk of milk processing capacity in the country.
2Industry experts represent processors in the Irish dairy industry, names cannot be disclosed for confidential reasons

102
An estimate of road distance from a central or appropriate point from each source (rural
district) to each destination was obtained from a computerised road-mapping source.
The data required for the second objective in this study was also collected through desk
research and through consultation with industry experts3. For this part of the study the
following basic data was required:
Milk output in 2020
Milk transport costs
Milk Intake and other utility costs
Processing costs
The regional milk output in 2020 was projected using the FAPRI-Ireland farm level model
(Hennessy, 2007). The model utilized Irish National Farm Survey (NFS) data along with
projected changes in prices and costs from the FAPRI-Ireland aggregate level model to
simulate the response of farmers to policy changes. The country was divided into four
regions: the Border Midlands and western region (BMW), the south-west (SW), the south
(S) and the east region (E) and farms were categorized into three further groups based on
herd size i.e. small, medium and large. A projected percent expansion capacity was
forecasted for each group (Laepple and Hennessy 2010). The 2,627 DED’s were assigned
one of the four regions as stipulated by the FAPRI model (BMW, SW, S and E). The size
of the herd (small, medium, large) for each DED was then determined (predetermined by
the FAPRI model). The projected percentage expansion was then applied to each DED.
These data were then converted to milk equivalent terms using average milk yields
(stipulated by the FAPRI model). The DED’s were then aggregated up into 156 rural
3Industry experts represent processors in the Irish dairy industry, names cannot be disclosed for confidential reasons

103
districts. Typical seasonal milk supply patterns were applied based on data from the
Central Statistics Office (CSO, 2011). In this way an estimate of milk availability
throughout the year post milk quota abolition by rural district was derived, which could be
fed into the transportation model.
The model that was developed for the first objective of this study was used to estimate the
milk transport costs. The results from the milk transport model were then fed into the
GAMS model.
Milk intake and other utility were obtained using the economic engineering approach for
intake levels of 24,000 l/hr., 40,000 l/hr., 60,000 l/hr., 120,000 l/hr. and 240,000 l/hr.
(leading consultancy firm). These costs were provided by Global Engineering Alliance
(GEA) technology. Milk intake costs included in the model include costs for milk intake,
tanker emptying, tanker cleaning in place (CIP), milk storage, batch tracking, and milk
pasteurisation and milk separation. Other utility costs include costs for construction of all
building bases and plants, construction of all site development work (roads, weighbridge,
landscaping, drainage and yards), water treatment (surface, waste water, fire water),
utilities (refrigeration, labs, ventilation, electrical, steam boilers, compressed air) and
financial contributions and fees. These costs were obtained from a leading consultancy
firm and were depreciated over 15 years with a 5% interest rate applied. From these costs a
linear relationship is assumed and the following regression line was fitted to total annual
intake and other utility costs:
Total Intake and Other Utility Costs = €0.005x + €748,138
R2= 0.996,
where x= million litres of milk processed annually.
Fixed and variable processing costs were also obtained for butter plus SMP, WMP and
cheese using the economic engineering approach. For butter plus SMP plants, costs were

104
obtained for plants with capacity to produce 1.78 tonnes of butter and 3 tonnes of SMP per
hour, 2.68 tonnes of butter and 5 tonnes of SMP per hour, 5.35 tonnes of butter 7.5 tonnes
of SMP per hour and 10 tonnes of butter and 15 tonnes of SMP per hour. For cheese plants
costs were obtained for plants with capacity of 0.85t/hr., 1.92t/hr., 3.2t/hr., 5.12t/hr. and
10t/hr. For WMP plants costs were obtained for plants with capacity of 3t/hr., 5t/hr.,
7.5t/hr. and 15t/hr. Variable processing costs were obtained from a number of sources.
Irish costs were available from Geary et al. (2010). The effect of various scales of
operation of cheese and butter plants on variable costs was based on findings from Kieler
milchwirtschaftliche forschungsberichte studies (Hargens et al., 2003 and Krell, 1993) and
scaled to 2009 values using the industrial price index, wholesale price index, or services
producer price index as appropriate. Variable costs for different scales of WMP and SMP
plants were sourced from a leading consultancy company. Variable costs included labour
costs, energy, supplies, packaging costs, storage costs, effluent costs and provision for
working capital.
The fixed construction cost was based on consultation among the service providers within
the Irish dairy industry (leading consultancy firm; Tetra Pak, GEA Technology and
Westfalia). All equipment was depreciated over a 15 years and 5% interest rate was
applied to cost of equipment. The greenfield site costs were related to the most advanced
and proven equipment currently available, arranged into the most efficient layout with the
required utilities.
As processing cost and scale relationships seemed approximately linear, linear regression
estimates were fitted to litres of milk per annum and total costs per annum for each product
for each factory size. A good fit as measured by Pearsons correlation coefficient R2for all
products, was found.
Butter_SMP TPC = €0.034x + €3,116,300 R2=0.9979

105
WMP TPC= €0.045x + €1,983,526 R2=0.9993
Cheese TPC = €0.037x + €555,907 R2=0.9991
Where TPC = total processing cost, and x = million litres of milk processed annually.
5.3 Research Methodology
A simulation model was used to solve the first objective in this thesis. Simulations of
agricultural systems are developed to accurately describe the evolution of the systems
(Shalloo et al., 2004). Simulation models provide the opportunity to explore difficult
relationships that cannot be explained in any other way. They allow examination with a far
greater range of variables over a much wider range of conditions that is feasible in practice
(Shalloo et al. 2004). Simulation is a powerful and important tool because it provides a
way in which alternative designs, plans and/or policies can be evaluated without having to
experiment on a real system, which may be prohibitively costly, time-consuming, or
simply impractical to do. The strength of simulation is that it enables precisely this “what
if” analysis, i.e., it allows to “look into the future” under certain assumptions (Rozinat et
al. 2007).
The simulation model developed simulated the six components of milk transport namely;
transport driving, assembly driving, on farm activities, on farm pumping, plant non-
pumping and plant pumping.
Transport driving involves the time spent driving from the plant to the first farm and from
last farm to the plant. This was calculated using a sub model developed by Quinlan et al.,
2006, it was then linked to the simulation model. The average driving speed for transport
driving was estimated to be 35 miles per hour. Assembly driving involves time spent
driving between farms on the route. The model simulated the quantity of milk available

from each farm every 3
estimated to be 20 miles per hour (Twomey 2010). On
spent attaching the hose, agitating the milk, sampling, rinsing the tank, paperwork etc. on
farms. It was estimated that on average on
supplier. Pumping rate at the farm was estimat
tanker washing, waiting time, office, meals, etc., this activity takes 30 minutes per route.
Pumping rate at the plant was estimated to be 1136 litres per minute.
Limitations of Simulations models
It can be argued that simulation models lack the credibility of field experiments (McCall,
1999), also simulation is not an analytical method and its application does not lead
automatically to an optimal solution of the problems studied. It allows us to make a
statement like, “If X is increased, Y will require extra input. But
answers like, “Cost is minimised if you take action X” (Bratley
A mixed integer linear program model was used to solve the second objective in this thesis.
Mathematical modelling is a tool commonly used in the study of agricultural systems.
System models provide a simplified description of system components and their
interactions. Thornley (2001) provided four possible reasons for building a model; to
provide a convenient summary of a set of data, to reduce the requirement for ad hoc
experimentation, to make predictions and to provide an understanding of the system’s
operation. Optimisation models seek to optimise some criterion or set of criterion subject
to a set of constraints (King
The objective function of the problem in this study was written as follows:Minimise:
106
from each farm every 3rd day. The average driving speed for assembly driving was
estimated to be 20 miles per hour (Twomey 2010). On-farm routine activities includes time
spent attaching the hose, agitating the milk, sampling, rinsing the tank, paperwork etc. on
farms. It was estimated that on average on-farm routine activities took 5 minutes per
supplier. Pumping rate at the farm was estimated to be 386 litres per minute. This includes
tanker washing, waiting time, office, meals, etc., this activity takes 30 minutes per route.
Pumping rate at the plant was estimated to be 1136 litres per minute.
Limitations of Simulations models
argued that simulation models lack the credibility of field experiments (McCall,
1999), also simulation is not an analytical method and its application does not lead
automatically to an optimal solution of the problems studied. It allows us to make a
ement like, “If X is increased, Y will require extra input. But
answers like, “Cost is minimised if you take action X” (Bratley et al.,
A mixed integer linear program model was used to solve the second objective in this thesis.
Mathematical modelling is a tool commonly used in the study of agricultural systems.
System models provide a simplified description of system components and their
interactions. Thornley (2001) provided four possible reasons for building a model; to
e a convenient summary of a set of data, to reduce the requirement for ad hoc
experimentation, to make predictions and to provide an understanding of the system’s
operation. Optimisation models seek to optimise some criterion or set of criterion subject
a set of constraints (King et al., 1993).
The objective function of the problem in this study was written as follows:
day. The average driving speed for assembly driving was
outine activities includes time
spent attaching the hose, agitating the milk, sampling, rinsing the tank, paperwork etc. on
farm routine activities took 5 minutes per
ed to be 386 litres per minute. This includes
tanker washing, waiting time, office, meals, etc., this activity takes 30 minutes per route.
Pumping rate at the plant was estimated to be 1136 litres per minute.
argued that simulation models lack the credibility of field experiments (McCall,
1999), also simulation is not an analytical method and its application does not lead
automatically to an optimal solution of the problems studied. It allows us to make a
ement like, “If X is increased, Y will require extra input. But it does not provide
et al., 1987).
A mixed integer linear program model was used to solve the second objective in this thesis.
Mathematical modelling is a tool commonly used in the study of agricultural systems.
System models provide a simplified description of system components and their
interactions. Thornley (2001) provided four possible reasons for building a model; to
e a convenient summary of a set of data, to reduce the requirement for ad hoc
experimentation, to make predictions and to provide an understanding of the system’s
operation. Optimisation models seek to optimise some criterion or set of criterion subject
The objective function of the problem in this study was written as follows:

107
Where: r = rural districts (1-156)
s = sites (6-27)
t = Milk intake (6-27 )
p = plants (6-27)
d = dairy products (Butter, Cheese, WMP, SMP)
X = Quantity of milk transported
Y = Integer binary (0, 1) variable of activity t at site (s)
Z = Integer binary (0, 1) variable of activity d at plant (p)
Tf= Transport cost fixed element
Ttm= Transport mileage
Cm= Cost of transport per mile
FCts= Fixed costs of Milk Intake &Other Utilities (t) at site (s)
VCts=Variable Costs of Milk Intake &Other Utilities (t) at site (s)
VCdp= Variable processing costs of dairy products (d) at plant (p)
FCdp= Fixed processing costs of dairy products (d) at plant (p)
mavr = milk available at rural district (r)
Model constraints
(i) The quantity of milk transported from rural district (r) to the sites (s) must be
equal to the amount of milk available at rural district (r)
∑=
=
R
r
rmavX1
(ii) The quantity of milk at milk intake (t) must be less than or equal to Capacity of
Milk Intake (t) for each site
∑ ∑= =
≤
S
s
S
s
yt ICAP1 1
, with (ICAP) as fixed capacity of integer variable y

108
(iii) The quantity of products (Qd) produced at plant (p) must be less than or equal
to the capacity of plant (p) to produce the product (d)
∑∑ ∑= = =
≤
P
p
D
d
P
p
dzd PCCAPPQ1 1 1
, with (PCCAP) as fixed capacity of integer variable z
The General Algebraic Modeling System (GAMS) was used to solve the problem poised
by the second objective in this study. GAMS is specifically designed for modeling linear,
nonlinear and mixed integer optimization problems. The system is especially useful with
large, complex problems. GAMS is available for use on personal computers, workstations,
mainframes and supercomputers. Optimisation
Limitations of mixed integer linear program models
Optimisation models are generally developed for a specific situation and are, therefore, less
suited to study the consequences of a wide range of management strategies (Jalvingh et al.,
1992). Linear program models are based on the hypothesis of linear relations between
inputs and outputs. This means that inputs and outputs can be added, multiplied and
divided. But the relations between inputs and outputs are not always clear. In real life, most
of the relations are non-linear.

109
5.4 Summary of steps in the methodology process
2 Objectives
1. To develop, validate and describe 2. To determine the least cost dairy
a national milk transport model for processing sector configuration in
simulating milk transport activities in Ireland 2020 taking cognisance of regional
milk supply, processing and milk
costs
Data Collection
Quinlan et al., 2005 survey, published Quinlan et al., 2011, Laepple and
literature, processors annual reports, the Hennessy, 2011, leading consultancy firm,
Central Statistics office of Ireland , Global Engineering Alliance (GEA)
industry consultation technology, consultancy firm, Geary et
al., 2010, Hargens et al., 2003 and Krell,
1993).
Research Methodology
Quinlan et al., 2006 sub model Transport costs taken from simulation
Simulation model developed in model developed for first objective
Excel. of this study. GAMS used to solve
the mixed integer linear program
problem.
2nd objective 1st objective
1st objective 2nd objective

110
5.7 Conclusion
This chapter presented the methodology utilised in this research to determine the least cost
industry configuration for the Irish dairy industry post milk abolition in 2020. The research
centered around two central objectives firstly; to develop a transport model for simulating
milk transport activities in Ireland and secondly to determine the least cost dairy
configuration post milk quota abolition. For the first objective of this study a simulation
model was utilised. This technique was considered the most appropriate as it allowed for
the examination of a wide range of efficiency factors in milk transport that would not be
feasible in practice. The minimisation problem in the second objective was formulated as a
mixed integer linear programming problem. GAMS was considered an appropriate tool in
solving this problem as it involved large models; therefore the efficiency of computer
solution procedures became relevant.

111
References
Brassington, F. and Pettitt, S. (1997). Principles of Marketing. London: Pitman.
Bratley P., Fox B. L. and Schrage L.E. 1987, A Guide to Simulation. Springer-Verlag,
New York.
Central Statistics Office (2009) Mean and Median Hourly Earnings by NACE Economic
Sector, Year, Sex and Statistic.Accessed Feb 2, 2011.
http://www.cso.ie/px/pxeirestat/Dialog/Saveshow.asp.
CSO (2011). Intake of Cows Milk by Creameries and Pasteurisers by Month, Domestic or
Import Source and Statistic. Accessed Aug. 15, 2011.
http://www.cso.ie/px/pxeirestat/Dialog/varval.asp?ma=AKM01&ti=Intake+of+Cows+Mil
k+by+Creameries+and+Pasteurisers+by+Month,+Domestic+or+Import+Source+and+Stati
stic&path=./Database/Eirestat/Agriculture%20Milk%20Production/&lang=.
Central Statistics Office (2009) Mean and Median Hourly Earnings by NACE Economic
Sector, Year, Sex and Statistic.Accessed Feb 2, 2011.
http://www.cso.ie/px/pxeirestat/Dialog/Saveshow.asp.
Geary, U., Lopez-villalobos, N., Garrick , D.J., and Shalloo, L. 2010. Development
and application of a processing model for the Irish dairy industry. J. Dairy Sci. 93:5091–
5100.
Hargens,B. ,Groß,K -U.,Schmidt,K .2003. Die Kosten der Modellabteilung
Butterei am Beispeil der Herstellung von Markenbutter, mildgesauert. Kieler

112
Milchwirtshafthiche Forschungsberichte. 55: 37-60.
Hennessy, T. (2007). CAP Health Check Analysis: Farm Level Implications of EU Milk
Quota Expansion. Teagasc, Carlow, Ireland.
Irish Dairy Board, The Dairy Industry in Ireland, (2009) Dublin.
Jalvingh, A.W. Dijkhuizen, A.A., and Van Arendonk, J.A.M. 1992. Dynamic probabilistic
modelling of reproduction and replacement management in sow herds. General aspects and
model description. Agricultural Systems. 39: 133-152.
King, R.P., Lybecker, D.W., Regmi, A., and Swinton, S.M. 1993. Bioeconomic Models of
Crop Production Systems: Design, Development, And Use, Review. Agricultural
Economics. 15:393-405.
Kumar, R. (1999). Research methodology: a step-by-step guide for beginners. London;
Thousand Oaks, California: Sage.
Krell, E., and H. Wietbrauk. 1993. Die Kosten der Modellabeilung Schnittaserei and
Biespiel der Herstellung von Gouda-Kase. Teil Ergebruisseund Intretation der
Modellkalkulationen. Kieler Milchwirtshafthiche Forschungsberichte. 45:245
271.
Laepple, D., and Hennessy, T. (2010) The Capacity to Expand Milk Production: The
Evidence from the National Farm Survey, paper prepared for the Food Harvest 2020
Implementation Committee.

113
McCall D.G. 1993, Approaches to systems research in the development of dairy grazing
systems. In Technical Workshop: Parallels in Dairy Grazing in New Zealand and the
Midwest. 16. University of Wisconsin.
Quinlan C., Enright P., Keane M., O’Connor D 2005. The Cost and Efficiency of Milk
Transport from Farms in Ireland. Agribusiness Discussion Paper No 46. Dept. of Food
Business and Development. University College, Cork
Quinlan C., Enright P., Keane M., O’Connor D. (2006). The Milk Transport Cost
Implications of Alternative Dairy Factory Location. Agribusiness Discussion Paper No 47.
Dept. of Food Business and Development. University College, Cork.
Quinlan C, Keane M, O’Connor D and Shalloo L (2010) The Transport Implications for
Ireland of the Elimination of the Milk Quota Regime in 2015. Paper presented at ITRN
Conference September 2010, Dublin.
Rozinat, A., Mans, R.S., Song, Van der Aalst, W.M.P. 2007. Discovering Simulation
Models. BETA Working Paper Series, WP 223, Eindhoven University of Technology,
Eindhoven.
Shalloo L, Dillion P, Rath M and Wallace M. (2004) Description and Validation of the
Moorepark Dairy System Model. J. Dairy Science. 87 1945–1959.
Thorlney, J.H.M. 2001. Modelling grassland ecosystems, In Proceeding of the XIX
International Grassland Congress, p1029-1035

114
Twomey D (2010) Milk Transport in Irish Dairy Co-operatives. Unpublished Masters
Thesis. University College Cork, Cork.

115
Chapter 6: The Transport Implications for Ireland of the Elimination of the Milk Quota Regime in 2015
THE TRANSORT IMPLICATIONS FOR IRELAND OF THE ELIMINATION OF
THE MILK QUOTA REGIME IN 2015 Carrie Quinlan1, Michael Keane2, Declan O’ Connor3 and Laurence Shalloo4
1. Department of Food Business and Development, University College Cork,
Ireland; email: [email protected]
2. Department of Food Business and Development, University College Cork,
Ireland; email:[email protected]
3. Department of Mathematics, Cork Institute of Technology, Ireland; email:
4. Dairy Production Department, Teagasc, Moorepark Production Research
Centre, Fermoy, Co. Cork, Ireland; email: [email protected]
Proceedings of ITRN Conferences September 2010, Peer-reviewed.

116
ABSTRACT
Increasing competition and globalisation of markets is leading to on-going rationalisation
in the global dairy industry. In Ireland the number of milk producers is declining and dairy
companies are consolidating their operations in terms of the numbers and sizes of dairy
processing plants. EU dairy policy is also undergoing some changes. The milk quota
system which is currently implemented through the CAP (Common Agricultural Policy)
regime and which limits the milk production of individual farms in Ireland will be fully
dismantled by 2015. Reports have suggested that Ireland has the potential to substantially
increase its milk supply; predictions of increases in supply centre around 40-50% by 2020
(ICOS, 2010).
Transportation costs are especially important where perishable products from farms are
being transported and specialised handling is required. In 2005 milk transport costs were
estimated to be in excess of €57 million per annum in Ireland (Quinlan 2005). Therefore
milk transport (which involves the transportation of a bulky, perishable liquid
collected from many spatially separated farms to centralized processing plants) plays
a central role in planning for the future of the Irish dairy industry.
A simulation/optimization model of milk transport was developed to allow for the
examination of a wide range of efficiency factors in milk transport including pumping
rates, tanker sizes, size of suppliers, density of milk supply and frequency of collection.
The model also facilitated the investigation of the effect of alternative industry
development scenarios on milk transport costs. The model integrates capital costs, labour
utilisation and running costs. As transportation is a significant contributor to carbon
emissions and Ireland has committed itself to reducing its emissions by 20% by 2020, the
model also estimated carbon emissions.

117
A key output of the model is the estimated total milk transport costs and associated carbon
emission levels.
Key Words: milk quota regime, simulation model, transport costs, carbon emissions

118
6.1 Introduction
The dairy industry is important to the Irish economy (IBEC 2010). Currently the Irish dairy
sector is comprised of 22 Co-operatives/PLCs with about 7,000 direct employees (IBEC
2010) and approximately 19,000 dairy farmers (Prospectus 2009). The total milk output in
2009 amounted to 4,801 million litres from 1.107 million dairy cows (CSO 2009).
Ireland’s dairy industry is heavily export orientated with 80% of production destined for
international markets (Promar and Prospectus 2009). Total dairy exports are worth an
estimated €2.2bn per year, with the UK and other EU countries accounting for 32% and
48% of exports in 2008 respectively (Promar and Prospectus 2009).
Many recent reports on the Irish dairy industry (Promar and Prospectus 2009 and 2003,
Bord Bia 2010) have commented that the industry is in urgent need of consolidation. Less
fragmentation and greater consolidation can result in significant efficiency gains. In
attempting to streamline the dairy industry, all components of costs must be examined.
Milk transport is a component of these costs, which requires investigation with clear saving
highlighted in previous studies (Quinlan 2005).
Milk transport involves the collection of milk by tanker from farm, the transport of milk to
the factory and the unloading of the tanker at the factory. Major factors influencing milk
transport costs are the spatial relationship of the farms and the processing plants, truck and
tanker size, frequency of collection, seasonality of milk production, labour costs, route
management, fuel costs, interest rates etc.
Studies carried out on milk transport in Ireland include Quinlan 2006; this study divided
milk transport into six components; transport driving, assembly driving, on-farm routine

119
activities, plant non-pumping, farm pumping and plant pumping. It found that the only
component affected by fewer processing plants was transport driving, therefore this
component was investigated in detail. The study then looked at the implications of
reducing the current dairy industry structure of 23 plants firstly to 12 plants, then 9 plants
and finally 6 plants. In aggregate terms the results showed that milk transport costs would
increase by €3, €5, €7 and €13 million per annum if processing plants were reduced from
23 to 12 to 9 to 6 (good location) and 6 (poor location) respectively. Detailed results of
a comprehensive survey on milk transport costs in Ireland showed that the weighted
average milk transport cost in the Republic of Ireland was estimated to be 1.15 cent per
litre (Quinlan et al. 2005). The study concluded that milk transport costs vary due to many
factors, including milk supplier size and location, processing plant size and location, tanker
capacity and seasonality. A previous survey on milk transport was completed in 1996
(Shanahan, 1996). Comparing the two survey results it is estimated that weighted
average milk transport costs increased by just 7% over 8 years. Butler et al. examined the
milk routing in 2003. Their paper illustrates how a geographic information system (GIS)
based DSS allows a scheduler interact with optimisation algorithms to co-ordinate milk
collection routes. In their study the authors conclude that although operational research has
produced useful techniques, implementing them in the real world has not been successful.
In the milk collection sector a decision support system (DSS) that complements rather than
replaces the scheduler is more successful. The effect of efficiency factors including tanker
size, frequency of collection, transport mileage and supplier size on milk transport costs in
Ireland was also examined in past decades (Keane 1986).
Overall there is limited research on milk transport in Ireland; it is an area where
inefficiency is apparent at present due to the overlap of milk processors catchment areas

120
and where reorganisation could result in sizeable cost reductions (Quinlan 2005).
Therefore, it was clear that there was a need to develop an up-to-date comprehensive
model that could examine strategic questions in relation to milk transport.
Simulation models of agricultural systems are developed to accurately describe the
evolution of the systems (Shalloo et al., 2004). It can be argued that simulation models
lack the creditability of field experiments (McCall, 1993), but that they provide the
opportunity to explore difficult relationships that cannot be explored in any other way.
Simulation models provide the opportunity to explore difficult relationships that cannot be
explained in any other way. They allow examination with a far greater range of variables
over a much wider range of conditions that is feasible in practice (Shalloo et al 2004).
Simulation is a powerful and important tool because it provides a way in which alternative
designs, plans and/or policies can be evaluated without having to experiment on a real
system, which may be prohibitively costly, time-consuming, or simply impractical to do.
The strength of simulation is that it enables precisely this “what if” analysis, i.e., it allows
to “look into the future” under certain assumptions (Rozinat et al. 2007).
Successfully development of a simulation model primarily depends on obtaining
appropriate and sufficient supporting data (Rozinat et al. 2007). The information for the
simulation model developed in this paper was secured through consultation with dairy
industry experts.
The simulation model developed was constructed to allow the investigation of the effects
of a wide range of efficiency factors including pumping rates, tanker sizes, the size of

121
suppliers, density of milk supply and the frequency of collection on milk transport costs
and on carbon emissions.
The objectives of this paper are firstly, to describe the milk transport model and the unique
aspects of the model and secondly, to demonstrate an application of the model using
various scenarios. Scenarios explored include the examination of the effect on transport
costs of increases in milk supply post milk quota and also the impact of using different
milk tanker sizes on milk transport costs. The model can be used to inform the decision
making process and ultimately minimise total milk transport costs and associated
environmental impacts.
6.2 Materials and Methods
6.2.1 Dairy Industry
6.2.1.1. Dairy Farmers
Irish dairy farmers are considered to be both technically competent and commercially
focused (Promar and Prospectus 2003). Dairy farm numbers are consolidating faster than
any other system of farming in Ireland. There are less than 19,000 dairy farmers in Ireland
at present, which is approximately 50% of the total 15 years ago. Average dairy output has
increased from 115,000 litres to 250,000 litres in the last 15 years (Promar and Prospectus
2009).
As milk is a perishable product frequency of milk collection from farmers is a very
important factor; practical alternatives include twice a day, once a day, every 2nd day and
every 3rd day.

122
6.2.1.2 Milk Processors
At present the dairy processing industry in Ireland is dominated by six large processors
located adjacent to each other in a band running through mid-Munster and south Leinster
that is the heartland of dairy farming in Ireland. Many of the larger processors have more
than one processing site in this region, with liquid milk plants also located in the main
urban centres outside the region. The six largest companies process about 80% of the
4,801 million litres of milk produced, with this number rising to eight companies
processing about 90% (Promar and Prospectus 2003).
6.2.1.3. Seasonality of Milk Production
Milk production in Ireland is primarily grass based; therefore it varies widely on a seasonal
basis throughout the year. With the exception of liquid milk producers, Irish dairy farmers
have continually adjusted the date of calving so that, through compact calving, the total
herd calves around a time that facilitates lowest milk production cost. Supplies of milk
are highest during the months of mid-April to August and lowest during the months
of December and January; the peak to trough month ratio in Ireland is 6:1 Ireland
(Promar and Prospectus 2009) (Figure 6.1). The model incorporates this seasonal nature of
milk production.
The seasonal pattern of milk production has consequences for milk transport operations
because a sufficient number of milk tankers must be provided to accommodate peak
summer supplies, with consequent spare capacity during the periods of low milk volumes
(Quinlan 2005). Through consultation with industry experts it was found that
approximately 350 milk tankers of 22,500 litres capacity are required to collect the national
milk supply.

123
The survey conducted by Quinlan 2005 found that the most frequently used tanker size in
Ireland was 22,500 litres. Through consultation with the industry it became evident that
although the tankers have this capacity, they do not run at full capacity and at off-peak
times run at even less.
6.2.2 Milk Transport Model
6.2.3 Description of Milk Transport Model
A simulation model of milk transport for the Irish dairy industry was developed. The
simulation of milk transport was based on dairy factories collecting milk on a least cost
basis from dairy farms.
Transport conditions and costs vary from milk processors to milk processor due to factors
such as total volume of milk assembled, the density of supplies within the area, the average
size of producer and the efficiency of route structure.
The costs in the simulation model developed in this paper are based on estimates for a
model route, which is considered to be typical of Irish conditions (based on personal
communication with milk transport managers). There is a schematic diagram of the milk
transport model presented in Figure 6.2.
The model was simulated over a 12-month period. The model displays the following
information for each month; capital cost, labour cost, running cost, cost of spare capacity

124
and diesel emissions. Details of the simulation model will be described in detail
subsequently.
A key and important part of the development of the milk transport model was the inclusion
of the transportation model developed by Quinlan in 2006. This model used a
transportation algorithm to minimise the transportation mileage from rural districts to
processors.
This transportation model allocates milk supplies from rural districts to factories based on
a least cost basis (Figure 6.3) . In this model, transportation costs are treated as a direct
linear function of the number of units shipped. The result from this analysis was linked to
the simulation model .
6.2.3.1 Capital Costs
Approximately 350 tankers collect the total milk supply in Ireland. Capital costs incurred
by each tanker included truck replacement, tanker replacement, tax, insurance and interest.
Tanker replacement costs €120,000 per tanker which is typically written off over 15 years
which equates to a cost of €8,000 per annum. Truck replacement costs €85,000 per truck
which is typically written off over 5 years which equates to a cost of €17,000 per annum.
Insurance was estimated at €6,000 per year per tanker. Motor tax was estimated to be
€2,600 per annum per tanker. Interest on tanker and truck replacement is assumed to be 5%
per annum which is equal to €5,501 per annum. Cost of tankers and trucks were estimated
through consultation with industry experts.

125
The availability of spare tankers and trucks is vital in the dairy industry. Milk is a bulky,
perishable product so spare tankers and trucks must be available in the case of a
breakdown. It was found that in Ireland, processors have about 10% spare tankers and
trucks. Cost of spare capacity includes cost of tanker, cost of truck, insurance and tax
6.2.3.2 Labour Costs
Labour requirement per month was dependent on the number of loads per day, which is
influenced by the volume of milk production, tanker size and frequency of milk collection.
Labour requirement per month was calculated by breaking the transport activity down into
its components as follows:
Transport Driving; this involves the time spent driving from plant to first farm and
from last farm to plant (see Figure 6.4). This figure is derived by dividing the transport
mileage per month by the average driving speed for transport driving. The average
driving speed for transport driving was estimated to be 35 miles per hour.
Assembly Driving; this involves time spent driving between farms on the route (see
Figure 6.4). This figure is arrived by dividing the assembly driving mileage per month
by the average driving speed for assembly driving. The average driving speed for
assembly driving was estimated to be 20 miles per hour.
On-Farm Routine Activities; this includes time spent attaching hose, agitating milk,
sampling, rinsing tank, paperwork etc. on farms. On average on-farm routine activities
takes 5 minutes per supplier. The total time taken on on-farm routine activities each
month is calculated by multiplying the number of loads per month by the number of
suppliers on a typical route by 5 minutes.
On-Farm Pumping; the time spent on this activity is calculated by dividing the quantity
of milk collected by pumping rate on the farm.

126
Plant Non-Pumping; this includes tanker washing, waiting time, office, meals, etc., this
activity takes 30 minutes per route.
Plant Pumping; it is calculated by dividing the quantity of milk collected per month by
pumping rate at the plant.
Labour cost per hour was assumed to be €20, this includes PRSI and P.A.Y.E.
6.2.3.3 Running Costs
Running costs include tyre replacement, service/maintenance and fuel from assembly
mileage, transport mileage and milk pumping on the farm and at the plant. Tyre
replacement was estimated to be €2,950 per truck per annum and €2,700 per tanker per
annum. Service/maintenance costs were estimated to be €9,000 per truck/tanker per
annum. Insurance, tax and tyre replacement, service/maintenance costs were estimated
based on advice from industry experts. Assembly mileage as previously discussed is the
distance travelled from farm to farm on a typical milk collection route. It was assumed that
the distance between each farm within each route was 1.5 miles. Total fuel required for the
number of loads per month by the corresponding number of suppliers visited per load
multiplied by 1.5 miles. Transport mileage as previously discussed is the distance travelled
from the plant to the first farm and from last farm to plant. Transport mileage was
calculated using the model developed by Quinlan 2006. The total cost of fuel required for
transport mileage each month was derived by multiplying the number of loads per month
by transport driving mileage by the price of the fuel/mile. Each milk tanker load burns fuel
while pumping milk on the farm and at the plant as the engine remains running while the
milk is being collected. This is necessary as the milk suction pump is operated off the lorry
hydraulics. On average 2.73 litres of fuel is used per route to pump milk into milk tankers

127
on the farm and 0.91 litres of fuel is utilised to pump milk out of milk tankers at the plant.
Therefore, the fuel cost for pumping on the farm and at plant is calculated by multiplying
the average number of routes per month by the two factors discussed by the price of the
fuel.
6.2.3.4 Carbon Emissions
During milk transport carbon dioxide is emitted when milk is pumped into the tanker at the
farm, during assembly driving and transport driving and also at the plant when the milk is
pumped from the tanker into the silo. The assembly driving and transport driving
greenhouse gas emissions were calculated using emission factors from the Environmental
Protection Agency (EPA). The EPA provided a table detailing fuel consumption and CO2
emissions for different truck sizes/technologies (Table 6.1). Industry experts confirmed
that the truck size and technology most frequently used was the artic 42 tonneHD Euro IV
- 2005 Standards. This truck burns 0.576 litres of diesel per mile travelled and also emits
1521.32g/CO2 per mile travelled. Therefore, total emissions per month from transport
driving and assembly driving were calculated by multiplying total mileage each month by
this factor. CO2 is also emitted from pumping on the farm and at the plant. 2,640g of
carbon dioxide is emitted from every litre of diesel utilised while pumping on the farm and
at the plant. Therefore, total emissions from this activity are calculated by multiplying the
total diesel utilised while pumping by 2,640g/per litre.
6.2.3.5 Outputs
The outputs from the model include physical indicators (number of loads per day, number
of suppliers per route) financial indicators (total milk transport costs) and environmental
impacts (carbon emissions). Capital costs, costs of spares, labour costs and running cost are
summarised for each month of the year. Total milk transport costs, which include total

128
capital costs, total labour costs, and total running costs, are calculated in million euro, cents
and cents per litre transported. Carbon emissions emitted from driving mileage and
pumping of the milk on the farm and at the plant are calculated in tonnes of CO2.
6.2.3.6 Assumptions
Pumping rate at the farm was estimated to be 386 litres per minute (Quinlan 2005)
Pumping rate at the plant was estimated to be 1136 litres per minute (Quinlan 2005)
It was assumed that milk was collected every three days.
The distance between farms on each route was assumed to be 1.5 miles
(consultation with industry experts)
Milk supply from each farm was equal
The cost of fuel was assumed to be €1 per litre excluding VAT
6.2.4 Milk Transport Scenarios
In the 1984 reform of the CAP milk quotas were introduced as a means to restrict milk
production and overall EU expenditures on agriculture. Recently it was announced that the
EU milk quota system will be dismantled by 2015 following a number of small yearly
expansions of one percent every year between 2009/10 and 2013/14 (Europa 2008). This
will have a significant impact on the Irish dairy industry as milk production will no longer
be restricted.
Three milk transport scenarios were explored; they correspond to different milk production
and technology scenarios.
The benchmark scenario or S1 resembles the current milk production and milk transport
situation in Ireland (Table 6.2). In 2009 milk production was exceptionally low due to poor
market conditions and global recession; therefore, 2008 was used as the baseline year for

129
milk production volumes in the benchmark scenario. In 2008 total yearly milk production
was 4,958 million litres. In this scenario there were 19,000 dairy farmers as this is the
current number of dairy farmers in Ireland. The transport fleet consisted of 350 milk
tankers; the capacity of each milk tanker was 22,800 litres (5000 gallons).
As milk production will no longer be restricted in Ireland post 2015; in S2 and S3 an
alternative milk production scenario was explored. Through consultation with dairy
industry experts it was estimated that milk production will increase by 30% by 2020. In S2
and S3 milk production was estimated to be 6,446.61 million litres (this figure represents
the 30% increase on 2008 milk production volumes). In these scenarios it was estimated
that there will be 15,500 dairy farmers in Ireland in 2020 (Teagasc, 2010).
Two scenarios were investigated in relation to the expanded dairy industry and compared
to S1;
Milk tanker capacity remaining as they were 22,800 litres ( S2)
Milk tanker capacity increased to 27,360 litres (S3)
The financial and environmental impacts of the three scenarios are presented.
6.3 Results
6.3.1 Physical Outputs
Litres of milk supplied per month in S1, S2 and S3 are shown in Table 6.3. Also the
quantity of milk supplied every third day from each farm in S1, S2 and S3is shown in
Table 6.3.

130
The average working hours per day are shown in Table 6.4. During the peak month of May
in S1, S2 and S3 the average working hours were 12 hours a day. In order to accommodate
peak supplies, 435 tankers were required in S2 and 378 tankers were required in S3.
In S1 the average number of loads per day were 226, 402, 550, 860, 989, 957, 880, 788,
660, 663, 412 and 268 from January through to December respectively. In S2 the average
number of loads per day were 294, 522, 715, 1,119, 1,286, 1,244, 1,144, 1,024, 858, 861,
536 and 349 from January through to December respectively. In S3 the average numbers of
loads per day were 294, 522, 594, 929, 1068, 1033, 950, 850, 712, 861, 536 and 349 from
January through to December respectively.
6.3.1.1 Mileage from sub model
The model developed by Quinlan (2006) was used to allocate tanker loads from rural
districts to factories on a least cost basis. Transport driving mileage was 49.12 miles, 49.89
miles and 49.79 miles per return trip per route for S1, S2 and S3 respectively.
6.3.1.2 Total mileage
Total mileage for S1, S2 and S3 was 14.87 million, 18.09 million and 16.12 million
respectively.
6.3.2 Financial outputs
6.3.2.1 Capital costs
Annual capital costs were €15,124,380 €18,797,445 and €18,056,781 for S1, S2 and S3
respectively. Capital costs per litre were 0.035 cent, 0.029 cent and 0.028 cent for S1, S2
and S3 respectively.

131
6.3.2.2 Running costs
Annual running costs in S1, S2 and S3 were €13,484,966, €16,611,760 and €15,796,750.
Running cost per litre was 0.028 cent for S1 and 0.027 cent for S2 and 0.025 cent for S3.
6.3.2.3 Labour costs
Annual labour costs were €21,820,096 €25,389,620 and €23,827,500 for S1, S2 and S3
respectively. Labour costs per litre of milk were 0.044 cent, 0.039 cent and 0.037 cent for
S1, S2 and S3.
6.3.2.4 Total transport cost
Total milk transport costs in S1, S2 and S3 were €50.43 million, €60.80 million and €57.68
million respectively. Total milk transport costs per litre were 1.02 cent, 0.94 cent and 0.89
cent for S1, S2 and S3 (Table 6.5). 6.3.3 Carbon Dioxide Emissions
Carbon dioxide emissions from travelling in S1 were 22,624 tonnes and 2,246 tonnes from
pumping. Carbon dioxide emissions from travelling in S2 were 27,525 tonnes and 2,920
tonnes from pumping. Carbon dioxide emissions from travelling in S3 were 24,526 tonnes
and 2,568 tonnes from pumping Total emissions were 24,870 tonnes 30,446 tonnes and
27,094 tonnes for S1, S2 and S3 respectively (Table 6.5).These are equivalent to 5.02g,
4.72g and 4.20g per litre of milk for S1, S2 and S3 respectively.
6.4 Discussion
6.4.1 Transport Costs
The tanker fleet in S1 consisted of 350 tankers/trucks with an average tanker capacity of
22,800 litres. The tanker fleet in S2 consisted of 435tankers/trucks with an average tanker

132
capacity of 22,800 litres. Additional tankers were required in S2 to accommodate peak
summer milk supplies as milk production increased by 30%. The tanker fleet in S3
consisted of 378 tankers/trucks with an average tanker capacity of 27,360 litres. Again
additional tankers were required in S3 to accommodate additional milk production;
however fewer were required as the tankers utilised in S3 had a higher capacity than the
tankers in S1 and S2.
When compared with the benchmark S1 scenario, capital costs per litre were lower in S2
and in S3. This was attributable to the higher milk production volume in S2 and S3 as the
costs of the tankers and trucks were spread out over a larger volume of milk.
The trucks in S3 cost €95,000 each and the tankers cost €140,000 each compared with a
cost per truck in S2 of €85,000 and a cost per tanker of €120,000. However, as mentioned
previously, the trucks in S3 were higher capacity; therefore fewer were required; which
resulted in lower capital costs per litre in S3 when compared to S2.
When compared to the benchmark scenario running costs per litre were lower for S2 and
S3. This was attributable to the fact that as milk production increased on each farm by 30%
in S2 and S3 the number of suppliers required to fill a tanker reduced. This resulted in
lower assembly driving mileage in these scenarios. Running costs per litre were lower in
S3 compared with S2. This was a consequence of the higher capacity tankers in S3. This
resulted in fewer numbers of loads each day, particularly in the peak months of April to
September.
Labour hours in all scenarios were approximately the same each day per tanker. When
compared to the benchmark scenario S1 labour costs per litre were lower for S2 and S3.
This was a result of higher milk production volumes in these scenarios, which allowed
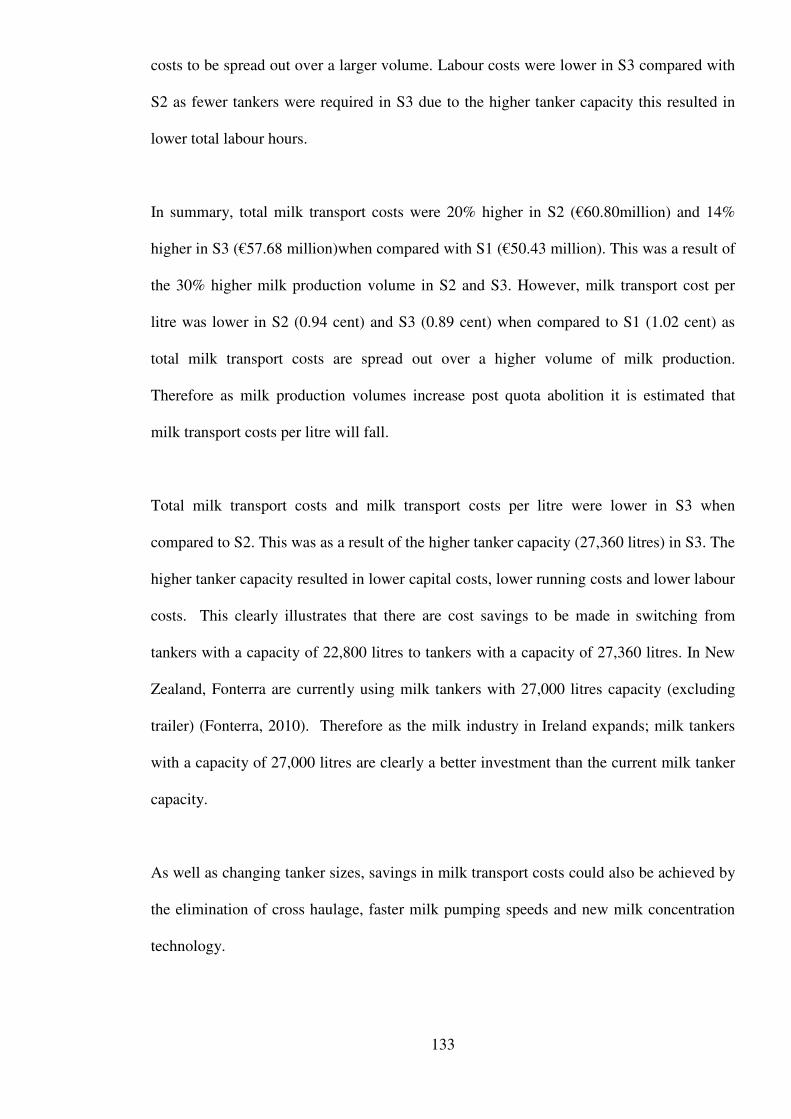
133
costs to be spread out over a larger volume. Labour costs were lower in S3 compared with
S2 as fewer tankers were required in S3 due to the higher tanker capacity this resulted in
lower total labour hours.
In summary, total milk transport costs were 20% higher in S2 (€60.80million) and 14%
higher in S3 (€57.68 million)when compared with S1 (€50.43 million). This was a result of
the 30% higher milk production volume in S2 and S3. However, milk transport cost per
litre was lower in S2 (0.94 cent) and S3 (0.89 cent) when compared to S1 (1.02 cent) as
total milk transport costs are spread out over a higher volume of milk production.
Therefore as milk production volumes increase post quota abolition it is estimated that
milk transport costs per litre will fall.
Total milk transport costs and milk transport costs per litre were lower in S3 when
compared to S2. This was as a result of the higher tanker capacity (27,360 litres) in S3. The
higher tanker capacity resulted in lower capital costs, lower running costs and lower labour
costs. This clearly illustrates that there are cost savings to be made in switching from
tankers with a capacity of 22,800 litres to tankers with a capacity of 27,360 litres. In New
Zealand, Fonterra are currently using milk tankers with 27,000 litres capacity (excluding
trailer) (Fonterra, 2010). Therefore as the milk industry in Ireland expands; milk tankers
with a capacity of 27,000 litres are clearly a better investment than the current milk tanker
capacity.
As well as changing tanker sizes, savings in milk transport costs could also be achieved by
the elimination of cross haulage, faster milk pumping speeds and new milk concentration
technology.

134
In practice the sourcing of milk for delivery to processing plants deviates from the
benchmark least cost pattern (Breathnach 2000).Presently in Ireland distances between
farms or rural districts and processing plants are sometimes unnecessarily long, due
for example to dairies assembling milk from areas closer to their neighbours’
processing plants. This has arisen for many reasons, including in particular the
pattern of merger and takeover activity within the industry over many years
(Breathnach 2000). Quinlan (2005) estimated actual transport mileage in Ireland using the
submodel used in this paper. It was estimated that there would be a 32% overall reduction
in transport mileage in moving from the current pattern of milk collection to the
benchmark ideal.
Increasing pumping rates at the farm and at the plant can also result in lower milk transport
costs. In Ireland average pumping rates at the plant are 1,136 litres a minute this is
compared to our major competitor countries Denmark and New Zealand where pumping
rates are 1,500 litres minute and 2,000 litres a minute respectively (Irish Farmers Journal,
2009).
Fonterra in New Zealand have introduced milk concentration technology that can
concentrate milk to approximately half its original volume before being transported to the
factory. They have implemented this technology in the South Island area of New Zealand
and it has resulted in 3,000 fewer tanker movements in that area (Fonterra 2010).
Therefore there is scope for further savings in milk transport costs in Ireland, which will
benefit milk suppliers and processors. The milk transport model developed in this paper
can be used to estimate the savings.

135
An often overlooked but very important issue in simulation is validation. Therefore, in the
present study, actual data for the year 2005 was compared with the results from the model
to determine the reliability of the key model outputs. In the milk transport model tanker
loads are allocated to factories based on least cost, therefore, the cross haulage currently
happening in Ireland is eliminated. Transport driving mileage based on optimum
allocation of tankers from rural districts to factories is approximately 49 miles per return
trip, however actual transport mileage in Ireland is approximately 75 miles4 per return trip.
If this figure is inputted, total transport costs are €56.93 million or 1.15 cent per litre. In
2005, Quinlan 2005 conducted a milk transport survey with all the dairies in Ireland; it was
found that milk transport costs were €57 million or 1.15 cent per litre. The figures from the
model are very close to the actual results in the survey; therefore, the simulated results
match actual data.
6.4.2 Carbon Emissions
Under the Kyoto protocol, Ireland cannot allow national emissions to be more than 13%
above 1990 levels between 2008 and 2012 (O’ Brien et al 2009). In 2008, total GHG
emissions in Ireland were 67.44 million tonnes carbon dioxide equivalent while the Kyoto
agreement limit over the 5 years (2008-2012) is 62.84 million tonnes per year (EPA,
2010). Transport is the third highest contributor to national GHG emissions; in 2008
emissions from transport were 14.255 million tonnes (EPA, 2010). The transport sector is
the fastest growing contributor to national GHG emission levels. Carbon emissions from
milk transport were found to represent 0.17% of total emissions from transport in Ireland.
Carbon emissions for milk transport in Ireland have not previously been calculated;
therefore that was a novel element of the milk transport model. In the milk transport model
total emissions were higher in S2 and S3 as the quantity of milk transported was higher in
S2 and S3, resulting in higher mileage and more pumping on the farm and at the plant.
4 This figure was calculated in previous research

136
However, carbon dioxide emissions per litre of milk are lower for S2 and S3 when
compared to S1. This is a result of the 30% increase in milk supply per supplier, which
reduces assembly mileage and thus carbon dioxide emissions.
6.5 Conclusion
Milk Transport is central to the strategic plans for the future of the Irish dairy industry. In
this analysis a simulation model was designed to support decision-makers to make
decisions about milk transport activities. The milk transport model was developed to allow
for the examination of a wide range of efficiency factors in milk transport including
pumping rates, tanker sizes, size of suppliers, density of milk supply and frequency of
collection. It integrates the capital costs, labour costs, and running costs incurred on a
typical milk route. The model developed by Quinlan 2006 to facilitate the allocation of
milk supplies from rural districts to factories on a least cost basis was included. When the
results of the model were compared to a milk survey on milk transport costs carried out in
2005 the results were favourable. This showed that the model can be used in confidence to
aid in decision making while analysing the milk transport activities. Ireland is committed
to the Kyoto protocol, therefore it is essential that plans for the future of the
industry take these commitments into consideration. The milk transport model
calculated the carbon emissions for milk transport in Ireland. It is anticipated that the milk
transport model will be used to investigate the influence of changes in future milk
production on transport costs and on the environment. It is also anticipated that the model
will be used in planning the optimum configuration of the Irish dairy industry post milk
quota elimination.

137
ACKNOWLEDGEMENTS
The support received through the Walsh Fellowship from Teagasc and the Department of
Agriculture, Fisheries and Food Stimulus fund for this research is gratefully
acknowledged.
References
Binfield J., Donnellan T., Hanrahan K. and Westhoff P. 2007. CAP Health Check
Analysis: Impact on EU Milk Quota Expansion Teagasc, Carlow, Ireland.
Bord Bia, 2010. Pathways for Growth. Accessed April. 10, 2010.
http://www.bordbia.ie/industryinfo/publications/bbreports/PathwaysForGrowth/Pathways
%20for%20Growth%20Report.pdf.
Breathnach P. 2000. The Evolution of the Spatial Structure of the Irish Dairy
Processing Industry, Irish Geography, Vol. 33.
Butler, M, Herlihy, P, and Keenan, PB. 2005. Integrating Information Technology and
Operational Research in the Management of Milk Collection, Journal of Food Engineering,
70(3):341-349.
Central Statistics Office. 2009. Agriculture Livestock and Farm Numbers. Accessed June.
5, 2010.
http://www.cso.ie/px/pxeirestat/database/eirestat/Agriculture%20Livestock%20and%20Far
m%20Numbers/Agriculture%20Livestock%20and%20Farm%20Numbers.asp.
Central Statistics Office. 2001. Census of Agriculture. Accessed May. 16, 2011.
www.cso.ie/releasespublications/documents/agriculture/current/milk.pdf.

138
Central Statistics Office. 2009. Mean and Median Hourly Earnings by NACE Economic
Sector, Year, Sex and Statistic. Accessed May. 19, 2010.
http://www.cso.ie/px/pxeirestat/Dialog/Saveshow.asp.
Department of Agriculture and Food 2010. The Common Agricultural Policy (CAP)
explained. Accessed Feb. 19, 2010.
http://www.agriculture.gov.ie/agrifoodindustry/euinternationalpolicy/commonagriculturalp
olicycap/capexplained.
Department of Transport 2008. 2020 Vision – Sustainable Travel and Transport: Public
Consultation Document. Accessed June 20, 2010.
http://www.transport.ie/upload/general/10378-0.pdf
EPA.2010. Ireland’s Greenhouse Gas Emissions in 2008.
Accessed June 23, 2010.
http://www.epa.ie/downloads/pubs/air/airemissions/name,27533,en.html
Europa 2008. Health Check" of the Common Agricultural Policy. Accessed June 23,
2010.
http://ec.europa.eu/agriculture/healthcheck/index_en.htm
Fonterra 2010. The story of milk. Accessed June 23, 2010.
http://fonterra.com/fonterra/storyOfMilk_config.xml.
Fonterra 2010. Milk Concentration Technology. Accessed June 238 2010.

139
http://www.fonterra.com/wps/wcm/connect/fonterracom/fonterra.com/our+business/innova
tion+and+technology/processes/milk+concentration+technology.
IBEC 2010. Trade and Markets. Accessed June 3, 2010.
http://www.ibec.ie/Sectors/FDII/FDII.nsf/vPages/Dairy~trade-and-
markets?OpenDocument.
Irish Dairy Board. 2008. The Dairy Industry in Ireland. Dublin
Irish Farmers Journal. 2009. Manufacturing Milk Supply Map of Ireland. Dublin
Irish Farmers Journal. 2009. Irish milk lorries are up to five times slower at uploading
milk. Accessed June 23, 2010.
http://www.farmersjournal.ie/2009/0725/agribusiness/companycoop/analysis.shtml
Keane M. 1986. The Economics of Milk Transport, Agribusiness Discussion Paper
No. 5. University College, Cork
Lips, M., Reider., P. 2005. Abolition of raw milk quota in the European Union: A CGE
analysis at the member country level. Journal of Agricultural Economics 56 (1), 1-17.
McCall, D.G. 1993. Approaches to systems research in the development of dairy grazing
systems. In Technical Workshop: Parallels in Dairy Grazing in New Zealand and the Midwest.
16. University of Wisconsin.
140
O Neill, L. 2009. ICOS launch Milk Ireland initiative. Accessed 26, May, 2010.
http://www.farmersjournal.ie/2009/0418/agribusiness/companycoop/feature.shtml
Power D. J., Ramesh Sharda, 2009. Decision Support Systems, Springer Handbook of
Automation, Springer Berlin Heidelberg, 2009, Part 1, 1539-1548.
Promar and Prospectus 2003. Strategic Development Plan for the Irish Dairy Processing
Sector, Dept. of Agriculture and Food. Dublin.
Promar and Prospectus 2009. The Irish Dairy Industry. Decision time is now. Accessed
April 10, 2010.
http://www.ifa.ie/LinkClick.aspx?fileticket=NJCDGlrKPX8%3d&tabid=606.
Quinlan C., Enright P., Keane M., O’Connor D 2005. The Cost and Efficiency of Milk
Transport from Farms in Ireland. Agribusiness Discussion Paper No 46. Dept. of Food
Business and Development. University College, Cork
Quinlan C., Enright P., Keane M., O’Connor D. 2006. The Milk Transport Cost
Implications of Alternative Dairy Factory Location. Agribusiness Discussion Paper No 47.
Dept. of Food Business and Development. University College, Cork
Rozinat, A., Mans, R.S., Song, Van der Aalst, W.M.P. 2007. Discovering Simulation
Models. BETA Working Paper Series, WP 223, Eindhoven University of Technology,
Eindhoven.
Shalloo, L., Dillion, P., Rath, M.,Wallace, M. 2004. Description and Validation of the
Moorepark Dairy System Model. J. Dairy Sci. 87:1945–1959

Shanahan, E. (1998).
Factors in the Irish Dairy Industry
Teagasc 2010. Sectoral Road
Figure 6. 1: Milk supply 2009
Source: Promar and Prospectus 2009
141
Shanahan, E. (1998). An Economic Analysis of Milk Transport Costs and Efficiency
Factors in the Irish Dairy Industry, MSc Thesis. UCC.
Teagasc 2010. Sectoral Road-Map: Dairying 2010 to 2018, Dublin
: Milk supply 2009
Source: Promar and Prospectus 2009
An Economic Analysis of Milk Transport Costs and Efficiency
Dublin

Figure 6. 2: Milk Transport Mode
Source: Own diagram
142
Milk Transport Mode
diagram

Figure 6. 3: Rural districts in Ireland
Source: Own diagram
Figure 6. 4: Illustration of Milk Transport
Source: Own diagram
143
: Rural districts in Ireland
: Illustration of Milk Transport

144
Table 6. 1: Fuel Consumption and CO2 Emissions from Different Truck Sizes/Technologies
Source: EPA 2010
Truck Size
Technology
Urban Rural Highway g diesel/km travelled
Urban Rural Highway
G CO2/km travelled
Urban Rural Highway Litres diesel/km travelled
Urban Rural Highway litres diesel/100 km travelled
Articulated 40 - 50 t Articulated 40 - 50 t Articulated 40 - 50 t Articulated 40 - 50 t Articulated 40 – 50t
Conventional HD Euro I - 91/542/EEC Stage I HD Euro II - 91/542/EEC Stage II
HD Euro III - 2000 StandardsHD Euro IV - 2005 Standards
482.589 423.236 413.33
424.936 395.229
362.764 321.104 316.669 322.428 299.511
288.18
254.732 249.261 252.62
233.676
1532.027 1343.605 1312.157 1349.002 1254.694
1151.631 1019.377 1005.297 1023.580 950.828
914.856 808.672 791.304 801.967 741.828
0.580 0.509 0.497 0.511 0.475
0.436 0.386 0.381 0.388 0.360
0.346 0.306 0.300 0.304 0.281
58.010 50.876 49.685 51.080 47.509
43.607 38.599 38.066 38.758 36.003
34.641 30.621 29.963 30.367 28.089

145
Table 6. 2: Key Attributes of Scenarios
Source: Own calculations

146
Table 6. 3: Industry Data
Source: Own calculations
Jan
Feb
March
April
May
June
July
Aug
Sept
Oct
Nov
Dec
Million Litres of
milk supplied per
month (CSO,
2008)
S1
S2
S3
127.3
165.49
165.49
204.6
265.98
265.98
379.8
493.74
493.74
574.9
747.37
747.37
683.2
888.16
888.16
639.3
831.09
831.09
607.8
790.14
790.14
543.8
706.94
706.94
440.8
573.04
573.04
373.5
485.55
485.55
232.4
302.12
302.12
151.3
196.69
196.69
Every third day
milk supply from
each farm (litres)
S1
S2
S3
650
974
974
1157
1733
1733
1940
2905
2905
3035
4544
4544
3490
5226
5226
3375
5053
5053
3105
4649
4649
2778
4160
4160
2327
3484
3484
1908
2857
2857
1187
1778
1778
773
1157
1157

147
Table 6. 4: Number of Loads per day and Number of Working Hours per day
Source: Own calculations
5 This figure represents the number of hours required per day per tanker; it does not correspond to the number of working hours per person per day.
Jan Feb Mar April May June July Aug Sept Oct Nov Dec
Number of loads per day S1 S2 S3
226 294 294
402 522 522
550 715 594
860 1119 929
989 1286 1068
957 1244 1033
880 1144 950
788 1024 850
660 858 712
663 861 861
412 536 536
268 349 349
Number of working hours per day per tanker5 S1 S2 S3
5 4 5
6 6 6
8 7 8
11 10 11
12 12 12
12 11 12
11 10 11
10 10 10
8 8 8
8 8 8
6 6 7
5 4 5

148
Table 6. 5: Milk Transport Costs and Tonnes CO2 Emitted for each Scenario
Source: Own calculations
Scenario
Milk Transport
Costs Million €
Milk Transport Costs
cents/litre Tonnes CO2
S1
50.43
1.02
24,870
S2
60.80
0.094
30,446
S3 57.68 0.089 27,094

149
Chapter 7: Milk Transport Costs under differing seasonality assumptions for the Irish Dairy Industry Milk Transport Costs under differing seasonality assumptions for the Irish Dairy
Industry
CARRIE QUINLAN1 *,MICHAEL KEANE2, DECLAN O’ CONNOR3 and LAURENCE SHALLOO4
1Department of Food Business and Development, University College Cork, Ireland, 2Department of Mathematics, Cork Institute of Technology, Ireland, 3Dairy Production Department, Teagasc, Moorepark Production Research Centre, Fermoy, Co. Cork, Ireland
Milk production in Ireland is seasonal in nature with the milk supply matching grass growth at farm level. The objective of this paper was to estimate the milk transport costs and carbon emissions from milk transport associated with alternative milk supply patterns and output levels in Ireland. A milk transport simulation model was used to simulate three alternative milk supply patterns with peak to trough month ratios of 5.37:1, 2.71:1 and 8:1. It was found that milk transport costs were not very sensitive to alternative milk supply patterns. Alternative milk supply pattern also had very little effect on carbon emissions from milk transport in Ireland. Key Words: Seasonality, Milk transport, Simulation model, Carbon emissions. Corresponding author: Carrie Quinlan
Department of Food Business and Development
University College Cork
Email: [email protected]
Phone: 00353877487399
International Journal of Dairy Technology (2012) 65:22-31

150
7.1 Introduction
The dairy sector is one of the most important sectors of Irish agriculture and
accounts for 28% of agricultural output (Bord Bia 2009). The dairy industry also
makes a significant contribution to sustaining rural communities, in 2010 there were
approximately 18,294 dairy farmers (Department of Agriculture, Fisheries and Food
2011) and the dairy processing industry employs 7,000 people (Irish Business and
Employers Confederation 2010). In 2009 total dairy exports were worth €2billion
(Department of Agriculture, Fisheries and Food 2010a). Since the introduction of the
EU milk quota regime in 1984, Ireland’s milk deliveries have remained very close to
milk quota at 5.1 billion litres per annum (Department of Agriculture, Fisheries and
Food 2010b), however as the European milk quota increases annually by 1%, with
its ultimate removals in 2015, the European dairy sector will soon face an
opportunity, for the first time in a generation, to expand.
Milk producers in Ireland enjoy a comparative advantage over their competitors
as the temperate climate favours grass growth and grazing conditions over a long
period (Dillon et al., 1995). Therefore milk production in Ireland is primarily grass-
based, resulting in a low cost system where the objective of the system is to produce
as much milk as possible from grazed grass (Dillon et al. 1995, Shalloo et al. 2004).
Irish dairy farmers target the start of calving with the objective of matching grass
supply with feed demand (Shalloo et al. 2004). Increased proportions of grass in the
diet result in grass based systems having a competitive advantage over grain based
systems, which are therefore less exposed to feed price volatility (Shalloo 2009). The
pasture-based feeding system also has the advantage of being perceived to be more
animal welfare and environmentally sustainable (Promar and Prospectus 2003).
However, compact calving in the spring with the objective of matching feed supply

151
and demand results in a seasonal milk supply. Seasonality can be measured using a
ratio of a peak month to a trough month in milk deliveries each year (Smyth et al.
2007). In Ireland the peak month is May and the trough month is January. The peak
to trough month ratio in Ireland in 2010 was 5.9:1, in 2009 the peak to trough month
ratio was 4.91:1 and in 2008 it was 5.4:1 (Central Statistics Office 2011).
Highly seasonal milk supplies have consequences for all aspects of the milk
supply chain including milk transport. For milk transport operations a sufficient
number of milk tankers must be provided to accommodate peak summer
supplies, with consequent spare capacity during the periods of low milk
supplies(Quinlan 2005). Seasonality also imposes additional costs at processor level
in the form of additional processing capacity, increased seasonal labour, as well as
increased financing and storage costs. Seasonal milk supply profiles may also restrict
the types of products that can be produced as the opportunity for product
diversification in the months where milk is at peak can be limited by the physical
amount of processing capacity available, while there may be insufficient milk
available in the low supply months to meet a required minimum market need.
Milk transport involves multi stop collection of a perishable food product ex farm
using bulk milk tankers to dairy factories. Keane (1986) broke milk transport into
six components; transport driving (driving from the plant to the first farm and from
the last farm back to the plant), assembly driving (driving from farm to farm),
pumping on the farm, pumping at the plant, non-pumping activities at plant and farm
(non-pumping activities). Transport conditions and costs vary between processors
due to factors such as total volume of milk assembled, the density of supplies within
the area, the average size of producer and the efficiency of route structure.

152
Milk transport is a challenging logistical problem that has long been of interest to
operational researchers for many years(Butler et al. 2004). Various milk transport
planning models using simulation techniques have been developed around the world.
Simulation allows examination with a far greater range of variables over a much
wider range of conditions than is feasible in practice (Shalloo et al. 2004).
Simulation is a powerful and important tool because it provides a way in which
alternative designs, plans and/or policies can be evaluated without having to
experiment on a real system, which may be prohibitively costly, time-consuming, or
simply impractical (Rozinat et al. 2009). Simulation models are useful for
communicating the results of alternative research strategies to stakeholders and
decision makers (Gijsbers 2001).
Mellalieu and Hall (1983) developed a long-term planning model ‘NETPLAN’
which incorporated milk transport activities. The model was used for long term
planning in relation to milk transport activities in the New Zealand Co-operative
Dairy Company. The U.S. Dairy Sector Simulator Model (Cornell 1998) was
developed to simulate milk transport costs in the US associated with different milk
tanker sizes and different milk transport wage rates. The US Dairy Sector Simulator
was seen as an important tool, which was able to provide useful policy guidance
(Cornell 1998). Dooley et al. (2005) developed a milk transport simulation model to
estimate transport costs in New Zealand associated with the introduction of milk
segregation, which was subsequently used to evaluate alternative transport
management strategies for the New Zealand dairy industry.
The objective of this paper was to estimate the milk transport costs and carbon
emissions from milk transport associated with alternative milk supply patterns and
output levels in Ireland.

153
7.2 Materials and Methods
Model description
The model used in this paper is a simulation model developed by Quinlan et al.
(2010). The model simulated the six components of milk transport namely;
transport driving, assembly driving, on farm activities, on farm pumping, plant non-
pumping and plant pumping, each milk transport component is described
subsequently. Key variables include monthly labour requirement, mileage travelled
(as a result of assembly driving and transport driving) and the quantity of tankers
required to transport peak milk supply. The model was simulated over a 12 month
period. Key outputs include monthly capital costs, monthly running costs and
monthly labour cost. Carbon emissions from milk transport activities are also
simulated (Quinlan et al. 2010). Other outputs from the model include physical
indicators (number of loads per day, number of suppliers per route).
The model permitted the examination of a wide range of efficiency factors in milk
transport including pumping rates, tanker sizes, size of suppliers, and density of milk
supply and frequency of collection and also facilitated the investigation of the effect
of alternative industry development scenarios on milk transport costs (Quinlan et al.
2010). This approach was considered superior to the complex modelling approach as
it provided immediate answers (Bjarnadóttir 2004). A unique feature of the model
was that within the simulation model a transportation algorithm was used to allocate
milk supplies from rural districts to factories based on a least cost basis and thus
minimise the transportation mileage from rural districts to processors i.e. transport
driving mileage (Quinlan et al. 2010). Quinlan et al. (2010) found that the model
could be used in confidence to aid in decision making while analysing milk transport
activities in Ireland.
154
7.2.1 Components of Milk Transport
Transport driving
Transport driving involves the time spent driving from the plant to the first farm and
from last farm to the plant (Quinlan et al. 2010). This was calculated using a sub
model, which was linked to the simulation model. In 2010 there were approximately
18,294 dairy farmers in the Irish Republic (Department of Agriculture, Fisheries and
Food 2011). In order to calculate the transport mileage these farms were aggregated
into one of 156 rural districts based on their location from data from the Central
Statistics Office. Such an approach is similar to the U.S. Dairy Sector Simulator
Model discussed earlier. A single town at the milk production centroid was then
chosen to represent the entire supply of the aggregated area. Based on information
on annual milk intake by factory, the 19 largest dairy factories were used as
potential destinations, as this captured 95% of the milk processing capacity in the
country. Using transportation algorithms, the model selects where to process milk
such that the transportation costs are minimized(Quinlan et al. 2010).
Assembly driving
This involves time spent driving between farms on the route (Quinlan et al. 2010).
The model simulated the quantity of milk available from each farm every 3rd day.
The quantity of suppliers per load was calculated by dividing the capacity of the
tanker by the quantity milk available from each supplier, which varied, based on the
milk supply profile. The average driving speed for assembly driving was estimated
to be 20 miles per hour (Twomey 2010). The number of farms visited in order to fill
the tanker will change for each month of year as milk supplies change on farm.

155
On-Farm Routine Activities
This includes time spent attaching the hose, agitating the milk, sampling, rinsing the
tank, paperwork etc. on farms. It was estimated that on average on-farm routine
activities took 5 minutes per supplier (Quinlan et al. 2010).
On-Farm Pumping
Pumping rate at the farm was estimated to be 386 litres per minute (Quinlan et al.
2010)
Plant Non-Pumping
This includes tanker washing, waiting time, office, meals, etc., this activity takes 30
minutes per route (Quinlan et al. 2010).
Plant Pumping
Pumping rate at the plant was estimated to be 1136 litres per minute (Quinlan et al.
2010).
7.2.2 Cost data
The costs in the simulation model developed in this paper are based on estimates for
a model route, which is considered to be typical of Irish conditions. Model route
assumptions included the following; milk tankers had a capacity of 27,000 litres,
milk collection was every 3rd day (Quinlan et al. 2010), all factories remained open
all year round, pumping rate at the farm was estimated to be 386 litres per minute
(Quinlan et al. 2005), pumping rate at the plant was estimated to be 1136 litres per
minute (Quinlan et al. 2005), the distance between farms on each route was assumed

156
to be 1.5 miles (consultation with industry experts) and all tankers were assumed to
work 12 hours each day during the peak month of May (Twomey 2010). In 2018 it is
projected that there will be 15,500 dairy farmers (Teagasc, 2011).
The transport costs included in the model are representative of the 2005 values
taken from a survey conducted by Quinlan (2005) on milk transport costs in Ireland.
This survey was carried out across the dairy industry in Ireland with representatives
from all of the major processors completing the survey. These costs were updated
with 2010 values with the aid of published literature, processors annual reports, the
Central Statistics office of Ireland or were assumed based on consultation with
industry experts. The costs were then verified using the Delphi method with industry
experts. Costs were found to be representative of 2010 industry cost values. Cost
information was broken into capital costs, labour costs and running costs, detailed
information on costs are described subsequently.
Capital costs
The number of tankers required within the dairy industry depends on the milk supply
pattern and volume of milk supplied and the number of hours each tanker is in
operation at peak. Annual costs, which relate to capital expenditure including truck
depreciation, tanker depreciation, interest and capital costs per tanker are shown in
Table 7.1 (Quinlan et al. 2010). The lifespan of the truck is depreciated based on the
truck running; for 220,000 miles and the trailer or milk tanker was based on the
trailer running for 660,000 miles (consultation with industry experts). In the analysis
it was assumed that all capital is borrowed over a 7 year period with an interest rate
of5% per annum. Capital costs include provisions for 10% spare tankers and trucks
as extra tankers are required to accommodate fluctuations in milk production,

157
transportation schedules and normal glitches that can occur in transportation
systems.
Labour costs
Labour requirement was based on the number of hours that tanker operative’s were
working per month. It was dependent on the daily volume of milk production, tanker
size and frequency of milk collection. Labour cost was assumed to be €20 per hour
based on industry guidelines and includes PRSI contributions (Quinlan et. al 2010),
which is similar to costs of workers in the transportable goods services for 2007
where the most up to date information is available for Ireland (Central Statistics
Office 2009).
Running costs
Running costs include insurance, tax, tyre replacement, service/maintenance and
fuel, which are shown in Table 7. 2. Fuel was utilised in milk transport from
assembly mileage, transport mileage and from milk pumping on the farm and at the
plant (as the engine remains running while the milk is being collected to allow the
milk suction pump to operate). Fuel costs which are the largest proportion of running
costs were included at €1/L plus VAT (average value in 2010) (Pumps 2011).
7.2.3 Carbon emission
During milk transport carbon dioxide is emitted when milk is pumped into the tanker
at the farm, during assembly driving and transport driving and also at the plant when
the milk is pumped from the tanker into the silo. Details were included in the model
based on CO2 emissions (Environmental Protection Agency 2010) from differing

158
truck sizes/technologies (Table 7.3). Therefore projections associated with emissions
and milk transport was included in the model outputs.
7.2.4 Scenarios explored
Three milk supply patterns were investigated (Figure 7.1); Scenario 1 (S1) was the
milk supply pattern realised in Ireland in 2008. In 2009 milk production was
exceptionally low due to poor market conditions and extremely poor weather
conditions, therefore 2008 was used as the baseline year for milk production
volumes with a peak to trough month ratio of 5.37 :1 (denoted as current) (May:
January) (Central Statistics Office 2009).
Scenario 2 (S2) involved a moderate reduction in seasonality (denoted as
moderate). Reports have concluded that the Irish dairy industry will need to alter
their product mix and produce more high value products (Department of Agriculture,
Fisheries and Food 2010c, Bord Bia 2010, Promar and Prospectus 2009), this would
demand a reduction in seasonality. Taking this into consideration this scenario
simulates a slight reduction in seasonality with a peak to trough month ratio of
2.71:1 (May: January).
It has been suggested that Irish farmers should aspire to a more compact calving
pattern, thus reducing feed costs and improving competitiveness (Teagasc 2009),
which would ultimately result in a more synchronised relation between grass growth
and feed demand. Prior to milk quota introduction the peak to trough month ratio in
Ireland was on average 8:1 (Central Statistics Office 2011). Therefore, scenario 3
(denoted as seasonal) simulated an increase in seasonality post milk quota abolition.
The peak to trough month ratio was 8:1.

159
The abolition of EU milk quotas in 2015 presents a real opportunity for the Irish
dairy sector with significant potential for increased milk production. The Food
Harvest report 2020 forecasted a 50% increase in milk production by 2020
(Department of Agriculture, Fisheries and Food 2010c). Laepple and Hennessy
(2010) forecasted an increase of 45% in milk output post milk quota abolition. Lips
and Reider (2005) found that the potential for increased milk production post milk
quotas was comparatively greater in Ireland, with a projected (38.6%) relative to the
average of all EU member states. Donnellan and Hennessy (2007) also revealed that
Ireland had capacity to increase milk supply by 20% using existing resources on
dairy farms.
Therefore, four levels of milk output were examined; firstly the national milk
output in 2008 denoted as (a) was explored (4,958 million litres). Secondly a 20%
increase in milk output by 2020 denoted as (b) was examined (5,950 million litres)
(Donnellan and Hennessy 2007, Teagasc 2010). Thirdly, a 38% increase in milk
output by 2020 denoted as (c) was investigated (6,843 million litres) (Lips and
Reider 2005). Finally a 45% increase in milk production by 2020 denoted as (d) was
explored (7,190 million litres) (Laepple and Hennessy 2010, Department of
Agriculture, Fisheries and Food 2010c). The scenarios explored are summarised in
Table 7.4.
7.3 Results and Discussion
7.3.1 Physical outputs
The number of loads of milk per day for each month is shown in Table 7.5. In every
scenario, the number of loads required to transport the milk is at its highest in May

160
(peak month) and at its lowest in January (trough month). The number of suppliers
visited each day and the amount of working hours per day per tanker are also shown
in table 7.6. In all scenarios the number of suppliers per load is lowest in May as
milk producers are producing their peak milk supply; therefore, fewer suppliers are
required to fill a load. The number of suppliers is highest in January as milk
producers are producing low volumes of milk and therefore more suppliers are
required to fill a load.
For current milk production volumes 310 tankers, 290 tankers and 325 tankers
were required to collect the milk supply in Ireland in S1a, S2a and S3a respectively
(Table 7.6).
When milk volumes increased by 20%, 345 tankers, 320 tankers and 360 tankers
were required to collect the milk in S1b, S2b and S3b respectively (Table 7.6).
When milk volumes increased by 38%, 385 tankers, 360 tankers and 405 tankers
were required to collect the milk for S1c, S2c and S3c respectively (Table 7.6).
When milk volumes increased by 45%, 400 tankers, 370 tankers and 420 tankers
were required to collect the milk in S1d, S2d and S3d respectively (Table 7.6).
In all scenarios as the milk production pattern becomes more even fewer tankers
are required to transport the milk and as it become more seasonal more tankers are
required to transport the milk at peak. As milk production increases the quantity of
tankers required to transport the milk increases.
7.3.2 Seasonal pattern of milk transport costs
In scenario 1 for current and all increased milk production volumes the peak month
accounts for approximately 10% of annual costs (annual costs consists of total
capital costs, total running costs and total capital costs) and the trough month 6%,

161
however the peak month accounts for approximately 14% of milk supply compared
with the trough month accounting for 3% of milk supply (Figure 7.2). This illustrates
that the seasonal pattern of milk transport costs has less variation than the milk
supply pattern. This is primarily due to capital cost been spread evenly throughout
the year
In scenario 2 for the current and all increased milk production volumes the peak
month accounts for approximately 10% of annual costs and the trough month 7%,
however the peak month accounts for approximately 13% of milk supply compared
with the trough month accounting for 5% of milk supply (Figure 7.3). Again milk
transport costs have less variation than the milk supply pattern due to capital costs.
In scenario 3 for the current milk production volume and all increased milk
production volumes the peak month accounts for approximately 10% of annual costs
and the trough month 6%, however the peak month accounts for approximately 15%
of milk supply compared with the trough month accounting for 2% of milk supply
(Figure 7.4).
7.3.3 Impact of different milk supply patterns on milk transport costs
Capital costs, running costs, labour costs and total transport costs for each scenario
are shown in Table 7.7. A reduction in seasonality for the scenarios denoted S2a
(current total milk production) S2b (current output plus 20%), S2c (current output
plus 38%) and S2d (current output plus 45%) resulted in a decrease in milk transport
costs per litre of 3.06%, 3.41%, 3.53% and 3.57% when compared to S1. This
represented a saving in transport costs at all output levels of 0.03 cent/l which
equates to industry savings per annum of €1.49 million(current total milk
production), €1.79 million (current output plus 20%), €2.05 million (current output
162
plus 38%) and €2.16 million(current output plus 45%). Capital costs decreased by 6-
7% and running costs decreased by 3-4%. Little or no savings were achievable in
labour costs as it was assumed that the labour was used on an hourly basis. However,
when one combines the number of tankers and the labour requirement for each
scenario total labour costs for each scenario are very similar.
When a more extreme milk supply curve was adopted (S3) milk supply costs in
cent per litre increased by 1.02%, 1.14%, 2.35% and 2.38% for S3a (current milk
output), S3b (current milk output plus 20%), S3c (current milk output plus 38%) and
S3d (current milk output plus 45%) respectively when compared to S1. This equates
to industry increases in milk transport costs of €0.5 million(current milk output),
€0.6 millionS3b (current milk output plus 20%), €1.37 million (current milk output
plus 38%) and €1.44 million (current milk output plus 45%) per annum. Capital
costs increased by 4.5-5.5% and running increased by 2-2.5%. There was little or no
increase in costs attributable to labour. This illustrates that when a more extreme
milk supply curve was adopted and compared to S1, the change in milk transport
costs in cent per litre were minimal.
Overall this study has shown that total milk transport costs are not very sensitive
to seasonality. Nonetheless, there are a number of other components that need to be
assessed before a final conclusion can be drawn on milk supply patterns. According
to Keane (1980) consideration of alternative milk supply patterns involves a detailed
cost benefit analysis including milk production cost differences associated with
alternative calving dates, and cost differences due to differing supply patterns in milk
transport, milk processing, and product storage and stock finance. Downey (2005)
stated that analysis on milk supply patterns should embrace issues such as market
requirements, product portfolio choice, milk transport costs, and manufacturing costs

163
and farm production costs. It is only when all of the components are answered can a
clear conclusion be drawn about seasonality within the Irish dairy industry.
7.3.4 Effect of different milk supply output on transport costs
When milk output increased by 20% milk transport costs per litre decreased by
approximately 10% across milk supply patterns. When milk output increased by
38% there was a saving of 12%-13% in milk transport costs per litre for all milk
supply profiles and when milk output increased by 45% there was savings of
between 13% and 15% in milk transport costs per litre for all milk supply profiles.
As milk output increased total milk transport costs increased but unit costs decreased
as there are changes in work practices. It can therefore be expected in the dairy
industry that even though milk output will increase post quota that the unit costs of
milk transport will decline once the potential efficiencies are adopted.
7.3.5 Environmental impacts
Under the Kyoto protocol, Ireland cannot allow national emissions to be more than
13% above 1990 levels between 2008 and 2012 (O’ Brien et al. 2010).
Furthermore, Ireland within the EU has also agreed to a 20% reduction in
emissions by 2020 when compared to 2005.The future direction and plans for
the dairy industry will to a large degree be shaped by these requirements.
Total tonnes of carbon dioxide for each scenario investigated were calculated and
shown in table 7.8. In all scenarios the frequency of milk collection was the same;
consequently assembly mileage (driving from farm to farm) did not change.
Transport driving mileage (driving from factory to the first farm and driving from
last farm back to the factory) for each month of the year was different for each milk

164
supply pattern however total transport driving mileage for each scenario were
similar. Therefore, there was very little difference in total tonnes of carbon dioxide
emitted from each of the three alternative milk supply patterns investigated from a
transport perspective.
The analysis reported here for the transport of the Irish milk supply suggests that
carbon emissions from milk transport are unlikely to be reduced if milk supply
profiles become more even. Likewise, carbon emissions did not increase as milk
supply profile became more seasonal.
When milk output levels increased total carbon emissions from milk transport
increased, this could result in issues for current and future legislation within the dairy
industry. Some countries have attempted to reduce carbon emissions attributable to
milk transport. In New Zealand they have endeavoured to reduce carbon emissions
from milk transport by the introduction of milk concentration plants (reverse osmosis
plants). In one region where it is practiced it is estimated there are 3000 fewer tanker
trips and carbon emissions are reduced by 1350 tonnes (International Dairy
Federation 2010) In Australia, Murray Goulburn has converted one third of its fleet
to Liquefied Natural Gas (LNG); progressively, the whole fleet will be converted to
LNG with an anticipated saving of 1,730 tonnes of CO2-e/year (International Dairy
Federation 2010). Arla, a leading European dairy company, is also working to reduce
fuel consumption and carbon emissions from milk transport. They are using bio-
diesel blend to operate their milk transport fleet in the UK, they also use this fuel in
Sweden and are testing it in Denmark (International Dairy Federation 2010).

165
7.4 Conclusions
This study revealed that total milk transport costs are not very sensitive to
seasonality. Savings in total transport costs of 3-4% were obtained when switching
to less seasonal milk supply pattern and increases in transport costs of 1%-2.5% were
incurred when a more seasonal approach was followed. As milk output increased
total milk transport cost savings increased from €1.5 to €2.2 million per annum when
a more even milk supply was adopted and total milk transport costs increased from
€0.5 million to €1.5 million per annum when a more seasonal milk supply pattern
was simulated (volume effect). Carbon dioxide emissions from milk transport did
not vary when milk supply profiles changed. Therefore, there were no environmental
benefits/consequences of operating more even/seasonal milk supply patterns. This
paper only examined the impact of even milk supply patterns on milk transport costs,
supplementary studies on the impact of an even milk supply on production costs and
processing costs are essential before any definitive decisions are made on the
optimum milk supply for the Irish dairy industry.
ACKNOWLEDGEMENT
The support received through the Walsh Fellowship from Teagasc and the
Department of Agriculture, Fisheries and Food Stimulus fund for this research
is gratefully acknowledged.
References
Bjarnadóttir A S (2004) Solving the Vehicle Routing Problem with Genetic
Algorithms .Unpublished MSc Thesis, Technical University of Denmark, Denmark..

166
Bord Bia (2009) Factsheet on the Irish Agriculture and Food & Drink Sector.
Accessed Feb. 5, 2011.
http://www.bordbia.ie/industryinfo/agri/pages/default.aspx.
.
Bord Bia (2010) Pathways for Growth. Accessed Feb. 25, 2011.
http://www.bordbia.ie/industryinfo/publications/bbreports/PathwaysForGrowth/Path
ways%20for%20Growth%20Report.pdf.
Butler M, Herlihy P and Kennan PB (2004) Integrating information technology and
operational research in the management of milk collection. Journal of Food
Engineering, 70 341-349.
Cornell (1998) A Description of the Methods and Data Employed in the U.S. Dairy
Sector Simulator, Version 97.3. Accessed Jan. 10, 2011.
http://www.cpdmp.cornell.edu/CPDMP/Pages/Publications/Pubs/rb9709.pdf.
Central Statistics Office (2009) Mean and Median Hourly Earnings by NACE
Economic Sector, Year, Sex and Statistic.Accessed Feb 2, 2011.
http://www.cso.ie/px/pxeirestat/Dialog/Saveshow.asp.
Central Statistics Office (2011) Intake of Cows Milk by Creameries and Pasteurisers
by Month, Domestic or Import Source and Statistic.Accessed May 28, 2011.
http://www.cso.ie/px/pxeirestat/Dialog/varval.asp?ma=AKM01&ti=Intake+of+Cows
+Milk+by+Creameries+and+Pasteurisers+by+Month,+Domestic+or+Import+Source

167
+and+Statistic&path=./Database/Eirestat/Agriculture%20Milk%20Production/&lang
=1.
Department of Agriculture, Fisheries and Food (2010a) Annual Review & Outlook
for Agriculture, Fisheries & Food2009/2010. Accessed June 28, 2011.
http://www.agriculture.gov.ie/media/migration/publications/2010/AROEnglish.pdf..
Department of Agriculture, Fisheries and Food (2010b) Implementation of Food
Harvest 2020 in the Dairy Sector. Accessed May25, 2011.
http://www.agriculture.ie/media/migration/farmingsectors/dairy/RoadmapRevised08
0211.pdf.
Department of Agriculture, Fisheries and Food (2010c) 2020 Food Harvest Vision.
[Internet document] URL http://www.merrionstreet.ie/wp-
content/uploads/2010/07/Food-Harvest-2020-full-document-6.27.pdf. Accessed
10/02/2011.
Department of Agriculture, Fisheries and Food (2011) Annual Review and Outlook
for Agriculture, Fisheries and Food 2010/2011. Accessed Jan. 10, 2011.
http://www.agriculture.gov.ie/media/migration/publications/2011/AR02011.pdf.
Dillon, P, Crosse S, Stakelum G and Flynn F (1995) The effect of calving date and
stocking rate on the performance of spring-calving dairy cows. Grass and Forage
Science50: 286 - 299.

168
Donnellan T and Hennessy T (2007) The effect of milk quota ‘expansion’ on
EU/Ireland production. In exploiting the freedom of milk: Proceedings of the
Teagasc National Dairy Conference, 2007, pp. 1-19, Kilkenny, Ireland. Accessed
Niv. 23, 2011. http://www.teagasc.ie/publications 2007/53/53
NationalDairyConf2007.pdf.
Dooley A E, Parker W J and Blair H T (2005) Modelling of transport costs and
logistics for on-farm milk segregation in New Zealand dairying. Computers and
Electronics in Agriculture, 48 75-91.
Downey L (2005) Cow nutrition and the manufacture of competitive dairy products
Seasonality costs. Accessed Oct. 10, 2011.
http://www.keenansystem.co.uk/downloads/kaII/uk/cownut.pdf.
Environmental Protection Agency (2010) Ireland’s Greenhouse Gas Emissions in
2008.Accessed Jan. 5, 2011.
http://www.epa.ie/downloads/pubs/air/airemissions/name,27533,en.html.
Gijsbers G, Janssen W and Odame H (2001) Planning Agricultural Research A
Sourcebook. CABI Publishing, London.

169
Irish Business and Employers Confederation (2010) Trade and Markets. Accessed
Feb. 2, 2011. http://www.ibec.ie/Sectors/FDII/FDII.nsf/vPages/Dairy~trade-and
markets?OpenDocument.
International Dairy Federation (2010) Transport Efficiency. Accessed Feb 2, 2011.
http://www.dairy-sustainability-initiative.org/Public/ListPage.php?ID=113.
Keane M J and Killen L (1980) Seasonality and the Irish dairy industry, Irish
Journal of Agricultural Economics and Rural Sociology, 8 1-26.
Keane M. (1986). The Economics of Milk Transport, Agribusiness Discussion
Paper 5 University College, Cork
Laepple, D and Hennessy T (2010) The Capacity to Expand Milk Production: The
Evidence from the National Farm Survey, paper prepared for the Food Harvest 2020
Implementation Committee.
Lips M and ReiderP (2005) Abolition of raw milk quota in the European Union: A
CGE analysis at the member country level. Journal of Agricultural Economics 56
(1), 1-17.
Mellalieu PJ and Hall KR (1983) An Interactive Planning Model for the New
Zealand Dairy Industry. The Journal of Operational Research,34 521-532.

170
O'Brien D, Shalloo L, Grainger C, Buckley F, Horan B and Wallace M(2010)The
influence of strain of Holstein-Friesian cow and feeding system on greenhouse gas
emissions from pastoral dairy farms. Journal of Dairy Science 93:3390-3402
ISSN0022-0302.
Promar and Prospectus (2003) Strategic Development Plan for the Irish Dairy
Processing Sector, Dept. of Agriculture and Food. Dublin.
Promar and Prospectus (2009)The Irish Dairy Industry. Decision time is now.
Accessed Oct, 10, 2010.
http://www.ifa.ie/LinkClick.aspx?fileticket=NJCDGlrKPX8%3d&tabid=606.
Pumps (2010) Average fuel prices.. Accessed Jan. 20, 2011.
http//www.pumps.ie/findHistoricAveragePrice.php?date=2011-08-11.
Quinlan C, Enright P, Keane M and O’Connor D (2005) The Cost and Efficiency
of Milk Transport from Farms in Ireland. Agribusiness Discussion 46. Dept. of
Food Business and Development. University College, Cork
Quinlan C, Keane M, O’Connor D and Shalloo L (2010) The Transport Implications
for Ireland of the Elimination of the Milk Quota Regime in 2015. Paper presented at
ITRN Conference September 2010, Dublin.
Rozinat A, Mans R S, Song M and Van der Aalst W M P (2009) Discovering
Simulation Models. Information Systems Vol.34, No.3, pp. 305-327.

171
Shalloo L, Dillion P, Rath M and Wallace M. (2004) Description and Validation of
the Moorepark Dairy System Model. J. Dairy Science. 87 1945–1959.
Shalloo L(2009) Pushing the barriers on milk costs/outputs. Paper presented at the
National Dairy Conference, Mullingar & Killarney, 18-Nov-2009.
Smyth P, Harte L and Hennessy H (2007) Seasonality and Costs of Production on
Irish dairy farms from 2000-2007. Paper presented at the 83rd Annual Conference
of the Agricultural Economics Society, Dublin.
Teagasc (2011) Sectoral Road Map Dairy. Roadmap for 2010. [Internet document]
URL
Http://www.teagasc.ie/publications/2011/840/index.asp. Accessed 03/05/2011.
Teagasc (2009) Dairy markets Review: An Assessment of the Short to Medium
Term Outlook for Global Dairy Markets.Accessed Nov. 11, 2011.
http://www.teagasc.ie/publications/2009/Dairy_Markets_Review_Group_Report_fin
alV9standard.pdf.
Twomey D (2010) Milk Transport in Irish Dairy Co-operatives. Unpublished
Masters Thesis. University College Cork, Cork.
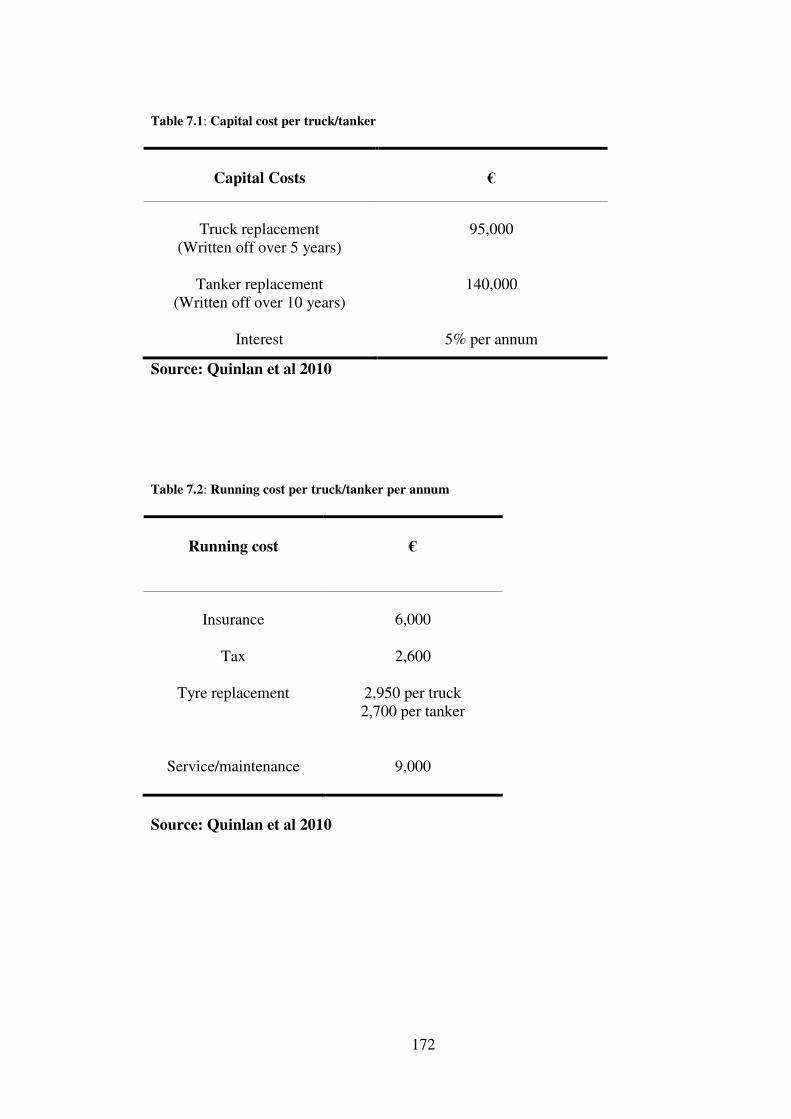
172
Table 7.1: Capital cost per truck/tanker
Capital Costs
€
Truck replacement
(Written off over 5 years)
Tanker replacement (Written off over 10 years)
Interest
95,000
140,000
5% per annum
Source: Quinlan et al 2010 Table 7.2: Running cost per truck/tanker per annum
Running cost
€
Insurance
Tax
Tyre replacement
Service/maintenance
6,000
2,600
2,950 per truck 2,700 per tanker
9,000
Source: Quinlan et al 2010

173
7.3: Fuel Consumption and CO2 Emissions from Different Truck Sizes
Source: EPA 2010
Truck Size
Technology
Urban Rural Highway g diesel/km travelled
Urban Rural Highway
G CO2/km travelled
Urban Rural Highway Litres diesel/km travelled
Urban Rural Highway litres diesel/100 km travelled
Articulated 40 - 50 t Articulated 40 - 50 t Articulated 40 - 50 t Articulated 40 - 50 t Articulated 40 – 50t
Conventional HD Euro I - 91/542/EEC Stage I HD Euro II - 91/542/EEC Stage II
HD Euro III - 2000 StandardsHD Euro IV - 2005 Standards
482.589 423.236 413.33
424.936 395.229
362.764 321.104 316.669 322.428 299.511
288.18
254.732 249.261 252.62
233.676
1532.027 1343.605 1312.157 1349.002 1254.694
1151.631 1019.377 1005.297 1023.580 950.828
914.856 808.672 791.304 801.967 741.828
0.580 0.509 0.497 0.511 0.475
0.436 0.386 0.381 0.388 0.360
0.346 0.306 0.300 0.304 0.281
58.010 50.876 49.685 51.080 47.509
43.607 38.599 38.066 38.758 36.003
34.641 30.621 29.963 30.367 28.089

174
Table 7.4: Summary of scenarios explored
Source: Own calculations
Seasonality Ratio
Current milk production Output
Current milk production output plus 20%
Current milk production output plus 38%
Current milk production output plus 45%
5.37:1
S1a
S1b
S1c
S1d
2.71:1
S2a
S2b
S2c
S2d
8:1
S3a
S3b
S3c
S3d

175
Table 7.5: Physical Outputs
Jan Feb Mar April May June July Aug Sept Oct
Nov Dec
Number of loads per day
S1a S2a S3a S1b S2b S3b S1c S2c S3c S1d S2d S3d
226 408 161 184 332 131 211 382 151 222 401 159
402 420 319 327 503 259 376 579 298 395 608 313
457 460 399 548 552 479 630 635 551 662 667 579
715 616 729 857 739 875 986 850
1006 1036 893
1057
822 751 871 986 901
1045 1134 1036 1202 1192 1088 1263
795 721 796 954 865 956
1097 995
1099 1152 1046 1155
731 612 746 877 734 895
1009 844
1029 1060
887 1082
654 549 675 785 658 810 903 757 932 948 796 979
548 515 596 657 618 715
756 711 822 794 747 864
449 458 481 539 550 577 620 632 664 651 664 697
412 406 401 335 487 327 386 560 376 405 588 395
268 415 240 218 338 195 251 388 224 264 408 236
Number of
suppliers per load
S1a S2a S3a S1b S2b S3b S1c S2c S3c S1d S2d S3d
28 16 39 30 17 39 26 14
36 23 13 33
16 15 20 17 11 20 15
9 18 13 8
16
14 14 16 10 10 11
9 9 10
8 8 9
9 10 9 6 7 6 6 6 5 5 6 5
8 8 7 6 6 5 5 5 5 4 5 4
8 9 8 6 6 5 5 6 5 4 5 4
9 10 8 6 7 6 5 7 5 5 6 5
10 12 9 7 8 6 6 7 6 5 6 5
12 12 11 8 9 7 7 8 7 7 7 6
14 14 13 10 10 9 9 9 8 8 8 7
15 16 16 16 11 16 14 10 15 13 9
13
24 15 26 25 16 26 22 14 25 20 13 22
Number working hours per day per tanker
S1a S2a S3a S1b S2b S3b S1c S2c S3c S1d S2d S3d
5 8 5 4 6 4 4 6 3 4 6 3
7 8 6 6 8 5 6 8 5 5 8 5
8 9 7 8 9 7 8 9 7 8 8 7
11 11 11 11 11 11 11 11 11 11 11 11
12 12 12 12 12 12 12 12 12 12 12 12
12 12 12 12 12 12 12 12 12 12 12 12
11 11 11 11 11 11 11 11 11 11 11 11
11 10 10 10 10 10 10 10 10 10 10 10
9 10 10 9 9 9 9 9 9 9 9 9
8 9 8 8 9 8 8 9 8 8 8 8
7 8 7 6 8 5 6 8 5 6 8 5
6 8 5 5 6 4 5 6 4 4 6 4
Source: Own calculations

176
Table 7.6:Number of Tankers
Source: Own calculations
Scenario
Number of Milk Tankers
S1a
S2a
S3a
S1b
S2b
S3b
S1c
S2c
S3c
S1d
S2d
S3d
310
290
325
345
320
360
385
360
405
400
370
420

177
Table 7.7: Milk Transport Costs
Source: Own calculations
S1a S1b S1c
S1d S2a S2b S2c
S2d
S3a
S3b
S3c
S3d
Capital costs Million €
11.81
13.15
14.67
15.24 11.05
12.19
13.72
14.10
12.39
13.72
15.43
16.01
Running costs Million €
16.03
17.45
19.37
20.36 15.42
16.83
18.76
19.58
16.34
18.06
19.86
20.85
Labour costs Million €
20.63
21.75
24.06
24.63
20.46
21.74
24.05
24.58
20.56
21.42
24.07
24.63
Total Milk Transport
Costs Million €
48.47
52.35
58.11
60.24
46.93
50.77
56.53
58.27
49.29
53.19
59.36
61.49
Milk Transport Costs cents/litre
0.98
0.88
0.85
0.84
0.95
0.85
0.83
0.81
0.99
0.89
0.87
0.86

178
Table 7.8: Carbon dioxide emissions for alternative milk supply patterns
Source: Own calculations

179
Figure 7. 1: Alternative milk supply pattern examined
Source: Own diagram Figure 7. 2: Current Milk Supply Pattern
Source: Own diagram
0.00
100.00
200.00
300.00
400.00
500.00
600.00
700.00
800.00
jan
feb
ma
r
ap
r
ma
y
jun jul
au
g
se
p
oc
t
no
v
de
c
month
mil
lio
n l
itre
s
(S1) currrent supply (S2) 2.71:1 (S3) seasonal supply
0
200
400
600
800
jan feb mar apr may jun jul aug sep oct nov dec
month
0.00
1.00
2.00
3.00
4.00
5.00
6.00
milk supply volume (million litres) million euro

180
Figure 7. 3: Moderate Reduction in Current Milk Supply
Source: Own diagram Figure 7. 4: Seasonal Milk Supply Pattern
Source: Own diagram
0
200
400
600
800
jan feb mar apr may jun jul aug sep oct nov dec
month
0.00
1.00
2.00
3.00
4.00
5.00
6.00
milk supply volume (million litres) million euro
0
200
400
600
800
jan feb mar apr may jun jul aug sep oct nov dec
month
0.00
1.00
2.00
3.00
4.00
5.00
milk supply volume (million litres) million euro

181
Chapter 8: Expansion Strategies for the Irish Dairy Industry
Expansion Strategies for the Irish Dairy Industry C. Quinlan Department of Food Business and Development, University College Cork, Ireland. E-mail: [email protected] L. Shalloo Dairy Production Department, Teagasc, Moorepark Production Research Centre, Fermoy, Co. Cork, Ireland. Email:[email protected] M. Keane Department of Food Business and Development, University College Cork, Ireland. E-mail: [email protected] D. O’ Connor
Department of Mathematics, Cork Institute of Technology, Ireland. E-mail:[email protected] D. Laepple Rural Economy Research Centre, Teagasc, Athenry, Co. Galway. E-mail: [email protected] T.Hennessy Rural Economy Research Centre, Teagasc, Athenry, Co. Galway. E-mail:[email protected]
International Journal of Agribusiness (Accepted Jan 2012)
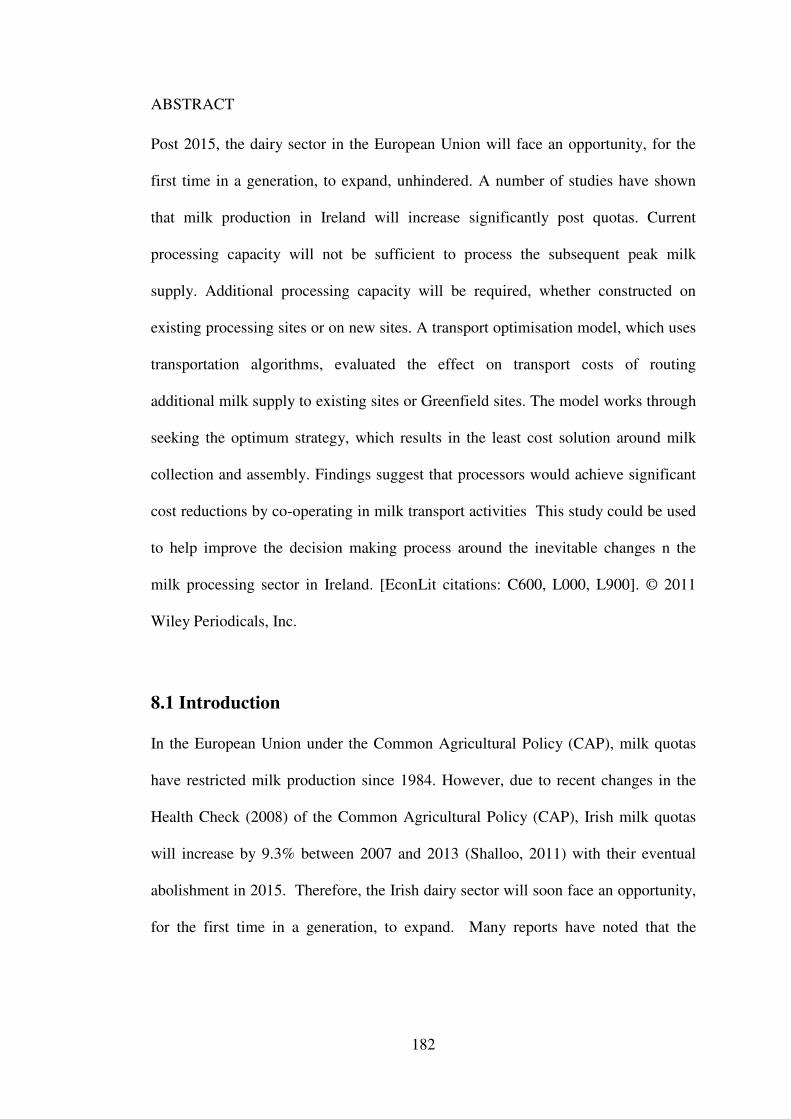
182
ABSTRACT Post 2015, the dairy sector in the European Union will face an opportunity, for the
first time in a generation, to expand, unhindered. A number of studies have shown
that milk production in Ireland will increase significantly post quotas. Current
processing capacity will not be sufficient to process the subsequent peak milk
supply. Additional processing capacity will be required, whether constructed on
existing processing sites or on new sites. A transport optimisation model, which uses
transportation algorithms, evaluated the effect on transport costs of routing
additional milk supply to existing sites or Greenfield sites. The model works through
seeking the optimum strategy, which results in the least cost solution around milk
collection and assembly. Findings suggest that processors would achieve significant
cost reductions by co-operating in milk transport activities This study could be used
to help improve the decision making process around the inevitable changes n the
milk processing sector in Ireland. [EconLit citations: C600, L000, L900]. © 2011
Wiley Periodicals, Inc.
8.1 Introduction
In the European Union under the Common Agricultural Policy (CAP), milk quotas
have restricted milk production since 1984. However, due to recent changes in the
Health Check (2008) of the Common Agricultural Policy (CAP), Irish milk quotas
will increase by 9.3% between 2007 and 2013 (Shalloo, 2011) with their eventual
abolishment in 2015. Therefore, the Irish dairy sector will soon face an opportunity,
for the first time in a generation, to expand. Many reports have noted that the

183
abolition of EU milk quotas in 2015 presents a real opportunity for the Irish dairy
sector with significant potential for increased milk production (Lips and Reider
2005; Donnellan and Hennessey 2007). Lips and Reider (2005) showed that the
potential for increased milk production post milk quotas was comparatively greater
in Ireland (38.6%) relative to the average of all EU member states. Donnellan and
Hennessy (2007) also revealed that Ireland had capacity to increase milk supply by
20% using existing resources on dairy farms. A recently published Irish Department
of Agriculture report (Department of Agriculture and Food) (DAFF). The DAFF
“Food Harvest 2020 report” forecasted a 50% increase in milk production by 2020
(DAFF, 2010 (a)).
In Ireland the dairy industry is one of the most important indigenous industries and
comprises a vital part of the agri-food sector accounting for 29% of agricultural
output in 2010 (Bord Bia 2010). The dairy industry also makes a significant
contribution to sustaining rural communities, currently there are approximately
18,294 dairy farmers (DAFF, 2010 (b)) and the dairy processing industry employs
7,000 people (IBEC 2010). In 2010, total dairy exports were worth €2.3 billion
(Bord Bia 2010). The milk processing sector is divided between three key players,
which are located adjacent to each other in a band running through mid-Munster and
south Leinster that is the heartland of dairy farming in Ireland. The second tier of
processing companies is divided between the north east, the west and the south
(O’Connell, 1997). For many reasons, including in particular the pattern of
merger and takeover activity within the industry over many years (Breathnach
2000) there tends to be an overlap of milk processors catchment areas (Figure 8.1).

184
The Irish dairy processing industry is also considered to be fragmented, as individual
processors are of a considerably smaller scale than processors in competing countries
such as Denmark, Holland and New Zealand. In these countries one processor
processes 80% of the milk pool compared with six processors in Ireland (Promar and
Prospectus, 2003).
Expansion in national milk output will present major new challenges for the Irish
dairy sector. The potential for growth at farm level has implications for the
processing sector. At present current processing facilities nationally are nearly at full
capacity at peak supply. An increase in output with the current grass based system of
production will increase the requirement for additional processing facilities. A model
capable of identifying optimal locations for additional milk processing capacity
would be instrumental in helping to improve the decision making process around
changes in the milk processing sector in Ireland. Similar models have been
developed around the world. The objective of these models was to identify the
optimum location of processing facilities taking into consideration transport costs
and other location factors. Examples include Wouda et al. (2002) who developed a
mixed-integer linear program model to find the optimal number of plants and their
locations when minimizing the sum of production and transportation costs in order to
optimise the supply network of Nutricia (a leading international food processor) in
Hungary. Hellmann and Verburg (2008) used an allocation algorithm to identify
optimum locations in Europe for future bio fuel processing plants and to allocate bio
fuel crops to plants based on transportation costs. Leduc et al. (2009) developed an
optimisation model to identify the optimum location of a biomass based methanol

185
production plant from a transport and environmental perspective in Northern
Sweden. The model was considered as a very useful tool for decision makers.
The objectives of this paper were to use regional and national milk supply change
projections post milk quota abolition and current milk processing capacities to
determine milk transport costs in the Irish Dairy Industry in 2020 if (a) Existing sites
were expanded and processed the additional milk supply and (b) new Greenfield
sites were constructed to process the additional milk supply. Finally the model was
used to identify the effect on transport costs from using one site or a number of sites
to process the additional milk.
8.2 Methodological Framework
A milk transport model (Quinlan et al., 2010) incorporating milk processor location
was developed and adapted to reflect the current structure of the dairy sector in
Ireland (processor configuration and farm layout and distribution).
The milk transport model was configured with 2008 data based on the configuration
of the dairy industry and projections for 2020 dairy industry outputs based on the
FAPRI Ireland farm level model(Laepple and Hennessy 2010). The transport model
was used to assess the impact of the changes in the projected farm level production
on milk transport costs under numerous different scenarios. The model compared
current capacity of processors with expected potential expansion therefore
determining the potential to absorb increased milk production within region. The

186
model then calculated the least cost (transport costs) options for expansion in 2020.
There is a schematic diagram of the model presented in Figure 8.2.
8.2.1. Model Description
The aim of the transport simulation model was to calculate total transport costs by
simulating the six components of milk transport i.e. transport driving, assembly
driving, farm pumping, plant pumping, plant non-pumping activities and on-farm
routine activities (Quinlan et al, 2010). Transport driving involves the time spent
driving from the processing plant to 1st farm and return to plant from final farm.
Assembly driving involves driving from farm to farm within the route. On-farm
routine activities include time spent attaching hose, agitating milk, sampling, rinsing
tank and recording information on farms. Farm pumping is the time spent pumping
the milk into the tanker at the farm. Plant non-pumping activities include the tanker
washing, waiting time and lunch. Plant pumping involves the time spent pumping
milk from the tanker into the silo at the plant.
Transport driving is the only component directly affected by processor location;
therefore this study focuses mainly around this component using a milk processor
location model. Assumptions for the other 5 components of milk transport are listed
in Table 8.1.
The milk processor location model that was developed in 2006 was also used in this
study (Quinlan et al. 2006). A transportation algorithm was applied to a data set that
included: (1) the geographic location and monthly milk production of each rural

187
district; (2) the geographic location and monthly physical capacity of each dairy
processing site; (3) a transportation matrix containing the distance in miles from each
source to each location. The transportation algorithm minimizes the total
transportation mileage incurred in transporting goods from a number of origins to a
number of destinations. The model works in two phases; The Phase I algorithm
allocates supplies to demands using a minimal unit mileage approach to generate a
feasible solution, which however is not necessarily optimal (taking the best
immediate, or local, solution while finding an answer). Then an optimizing Phase II
procedure follows which checks for optimality conditions, and makes mileage
reducing improvements to the solution in case optimality conditions are violated.
The Phase II iterations stop when the optimality conditions are finally met, at which
time no further mileage reductions are possible. The advantages of this transportation
algorithm are that the shortest path was quickly identified and it could be
recalculated repeatedly (Fu et al. 2005).
In 2009 there were about 18,294 dairy farmers in the Irish Republic (DAFF, 2010).
Identifying the location and size of each individual dairy farm as sources for the
processor location model was beyond available resources. An alternative approach
based on District Electoral Divisions (DED’s) was adopted. In the Republic of
Ireland, DEDs are the smallest legally defined administrative areas in the State for
which Small Area Population Statistics (SAPS) and are published from the Census.
There were 2,627 DED’s in Ireland in 2008 and data for dairy cow numbers and
number of herds by DED was supplied by DAFF. Typical seasonal milk supply
patterns were applied based on data from the Central Statistics Office (CSO, 2011).

188
In this way an estimate of milk availability throughout the year by rural district was
derived, which could be fed into the transportation model.
The regional supply of milk in 2020 was projected using the FAPRI-Ireland farm
level model (Hennessy, 2007). The model utilized Irish National Farm Survey
(NFS) data along with projected changes in prices and costs from the FAPRI-Ireland
aggregate level model to simulate the response of farmers to policy changes. The
country was divided into four regions: the Border Midlands and western region
(BMW), the south-west (SW), the south (S) and the east region (E) and farms were
categorized into three further groups based on herd size i.e. small, medium and large.
A projected percent expansion capacity was forecasted for each group. Table 8.2,
shows the expansion capacity in the BMW, SW, E and the S regions. (Laepple and
Hennessy 2010).
The 2,627 DED’s were assigned one of the four regions as stipulated by the FAPRI
model (BMW, SW, S and E). The size of the herd (small, medium, large) for each
DED was then determined (predetermined by the FAPRI model). The projected
percentage expansion was then applied to each DED. These data were then
converted to milk equivalent terms using average milk yields (stipulated by the
FAPRI model). The DED’s were then aggregated up into 156 rural districts. Typical
seasonal milk supply patterns were applied based on data from the Central Statistics
Office (CSO, 2011). In this way an estimate of milk availability throughout the year
by rural district was derived, which could be fed into the transportation model.

189
Information about the location of destinations (Processors) was mainly obtained
from a detailed map of the locations of dairy factories, which had been published,
Irish Dairy Board (2009). Based on information on annual milk intake by
factory, it was estimated that 19 Dairy Processing locations exist, this captured the
vast bulk of milk processing capacity in the country. An estimate of road distance
from a central or appropriate point from each source (rural district) to each
destination was obtained from a computerised road mapping source. The program
Quantitative Systems for Business was then used to solve the problem within the
model. The model determined the national average transport driving mileage per
route (i.e. the distance from the plant to the fist farm and the distance from the last
farm back to the plant. This result (depending on processor location) was then
inserted into the transport simulation model and total transport costs for each
scenario were determined.
8.2.2: Scenarios
In Ireland due to the overlap of milk processors catchment areas milk tankers from
the different processors regularly cut across the territories of the other processors on
their way to their parent processing plants, this has led to inefficiencies in milk
transport activities. This needs to be taken into consideration when identifying
expansion strategies for increased milk output in 2020. Therefore, the optimal
locations for expansion of existing facilities and development of Greenfield sites
were found by the minimization of transport costs with respect to the mode in which
milk is located (i.e. actual catchment areas and optimal catchment areas) and the
location of milk supply and dairy factories. In all scenarios the milk transport costs

190
were compared to simulated milk transport costs based on the 2008 milk supplies
and profiles. The following three scenarios were examined:
In Scenario 1: the milk transport model was used to estimate milk transport costs if
milk was collected based on 2008 milk supply catchment areas and ;
(a) One existing site processes all the additional milk supply
(b) Two existing sites each process 50% of the additional milk supply
(c) Three existing sites each process 33.33% of the additional milk supply.
Scenario 2: in comparison to collecting milk by actual catchment areas in 2020 (as
simulated in scenario 1) milk was assembled by optimum regional catchment areas
in scenario 2. Optimum catchment areas refer to the milk being transported to the
nearest plant for processing thus eliminating cross haulage. In these scenarios
existing sites were examined to find the least cost location (from a transport cost
perspective)if;
(a) One site processed all the additional milk supply
(b) Two sites each process 50% of the additional milk supply
(c) Three sites each process 33.33% of the additional milk supply.
Scenario 3: Taking cognisance of milk transport costs and changing circumstances at
both farm and processor level 10 Greenfield site locations were chosen (locations
chosen had access to the primary road network, clean water supply, seasonal labour
force etc.) and analysed to find the least cost location (from a transport cost
perspective) in 2020 if ;

191
(a) One site processed all the additional milk supply
(b) Two sites each process 50% of the additional milk supply
(c) Three sites each process 33.33% of the additional milk supply.
Existing milk output volumes were collected 2008 milk supply catchment areas and
additional milk supply was collected based on optimum milk catchment areas.
8.3 Results
8.3.1 Regional Expansion Capacity
Figure 8.3 summarises the expansion capacity of farms by rural district to 2020.
Expansion capacity ranged from 0% to76.92%. Nationally the average increase in
milk supply was 45% in 2020. The South and the South East in particular Cork,
Limerick, Waterford, Tipperary, Wexford, Kilkenny, Carlow and Wicklow had the
highest expansion capacity (Laepple and Hennessy 2010).
8.3.2 Capacity of processors to absorb changes in milk production
With a 45% increase in national milk supply by 2020, current milk processing
capacity in Ireland will need to be expanded. Based on the current processing
capacities and the expected milk supply this study has estimated that that milk
processing capacity would have to increase by 37% in order to be capable of
processing an additional 45% of milk by 2020 without a change in the milk supply
profile nationally.

192
8.3.3 Expansion of existing milk processing sites and collection by (2008 milk
supply) catchment area – Scenario 1
Table 8.3 lists the total transport costs and transport costs in cent per litre in 2020 for
seven different existing sites. From a milk transport perspective the seven least cost
sites were ranked based on one, two, or three existing sites processing the additional
milk that is produced. In this scenario (scenario 1) 2008 milk supply is assembled by
actual catchment areas with the additional milk supplied to one, two or three sites in
a least costs fashion based on milk expansion locations and location of processing
sites. When 1 site processes the additional milk supply transport cost range from
1.02 cent per litre to 1.05 cent per litre, depending on the site locations. When two
sites process the milk supply cost range from 0.97 cent per litre to 1.00 cent per litre
(depending on location). When three sites process the additional milk supply costs
range from 0.94 cent per litre to 0.97 cent per litre (depending on location). Table 8.4
summarises the total transport costs and transport cost in cent per litre for the least
cost sites in this scenario.
When milk supply was assembled by actual catchment areas and existing sites were
expanded in 2020 total transport costs were 7.58% higher and 3.46% higher when
the additional milk supply was diverted to one or two sites respectively when
compared with three sites when the sites were optimally located (Figure 8.5).

193
8.3.4 Expansion of existing milk processing sites and collection by optimum
catchment area – Scenario 2
In contrast to scenario 1 where milk is assembled by 2008 milk supply catchment
areas in scenario 2, milk is assembled by optimum catchment areas in 2020. Table
8.5 summarises the total transport costs and transport costs in cent per litre for the
least cost existing sites (from a milk transport perspective). When 1 site processes
the additional milk supply, transport cost range from 0.92 cent per litre to 0.97 cent
per litre depending on location. When two sites process the milk supply cost range
from 0.88 cent per litre to 0.91 cent per litre (depending on location). When three
sites process the additional milk supply costs range from 0.85 cent per litre to 0.88
cent per litre (depending on location). Table 8.6 summarises the total transport costs
and transport cost in cent per litre for the least cost sites in this scenario.
When milk supply was assembled by optimum catchment areas and existing sites
were expanded in 2020 total transport costs were 3.76% higher and 7.86% higher
when all the additional milk supply travelled to two sites and one site respectively
compared with 3 sites (Figure 8.6).
When compared with scenario 1 it is clear that there are potential transport savings in
milk transport costs from milk being assembled in an optimum fashion i.e. send milk
to nearest processing site and avoid unnecessary transport mileage. Savings
obtainable per annum were 9.65%, 9.65% and 9.92% or €6.6 million, €6.32 million
and €6.28 for 1 site, 2 sites and 3 sites respectively in 2020 (Figure 8.4).

194
8.3.5 Greenfield sites process the additional milk supply – Scenario 3
In comparison to scenario 1 and 2 where existing sites process the additional milk
supply, in scenario 3 new Greenfield sites process the additional milk supply in
2020. Milk was assembled based on 2008 milk supply catchment areas for 2008 milk
supply volumes and based on optimum catchment areas for additional milk supply in
2020. Table 8.7 details the total transport costs and transport costs in cent per litre
for ten Greenfield sites in 2020. When 1 site processes the additional milk supply
transport cost range from 1.01 cent per litre to 1.19 cent per litre (depending on
location). When two sites process the milk supply cost range from 0.98 cent per litre
to 1.01 cent per litre (depending on location). When three sites process the additional
milk supply costs range from 0.94 cent per litre to 0.99 cent per litre (depending on
location). Table 8.8 summarises the total transport costs and transport cost in cent
per litre for the least cost sites in this scenario
When milk supply was assembled by actual catchment areas and diverted to
Greenfield sites in 2020 total milk transport costs were 3.90% higher and 8.1%
higher when all the additional milk supply travelled to two sites and one site
respectively compared with 3 sites (Figure 8.7).
8.3.6 Optimum number and location of additional processing facilities
It was found that the optimum expansion strategy for 2020 from a milk transport
perspective was if milk was assembled by optimum catchment area and the
additional milk supply was routed to three existing sites (Figure 8.8). In this situation
transport costs were 0.85 cent per litre when the expansion was located correctly in

195
relation to the anticipated expansion at farm level. Transport cost rise to 0.92 cent
per litre and 0.88 cent per litre if milk if the additional milk is diverted to one or two
sites respectively, however these costs are still considerably lower than if milk was
collected by actual catchment areas and diverted to existing or Greenfield sites.
Overall, annual savings amount to €6.6 million, €6.32 million and €6.28 million for
1, 2 or 3 sites respectively when compared to existing sites and savings per annum of
€6.4 million, €6.4 million and €6.1 million for 1 site, 2 sites and 3 sites when
compared to Greenfield sites.
However, if milk is assembled by actual catchment areas, transport costs were
similar when routing the additional milk supply in 2020 to Greenfield sites or routing
it to existing expanded sites (Figure 8.9) (Figure 8.10). Transport costs per litre were
1.01 cent (€68.22 million), 0.98 cent (€65.57 million) and 0.94 cent (€63.11 million)
for one to three Greenfield sites compared with 1.02 cent (€68.45 million) 0.97 cent
(€65.53 million) and 0.94 (€63.26 million) cent for one to three existing sites,
respectively.
In this study we did not examine green field sites and optimum catchment areas as it
was felt that this was not likely to occur. If milk was collected by optimum
catchment areas and sent to Greenfield sites there would be variation in transport
costs when comparing existing sites and Greenfield sites.
8.3.7 Sensitivity analysis
Table 8.9, 8.10 and 8.11 contain the results of sensitivity analysis for fuel and labour
costs as well as interest rates. Total milk transport costs increased and decreased by

196
4% in all scenarios when fuel costs increased or decreased by 20%. Total transport
costs increased and decreased by 9% in all scenarios when labour increased or
decreased by 20%. Total transport costs decreased by 0.5%-0. 7% in all scenarios
when a 4% interest rate was applied, while total transport costs increased by 1%-
1.2% in all scenarios when 7% interest rate was applied.
8.4 Discussion
The objective of this paper was to identify the effect of various expansion strategies
at processor level in the Irish dairy industry based on an expected increased milk
output by 2020. Projected milk output increases of 45% (Laepple and Hennessey,
2011) were included in the analysis with the highest expansion rates expected in the
south of the country and the least in the northern half of the country. When the
projections around milk supply increase by region were merged with existing
processing capacities, it was found that milk processing capacity would have to
increase by on average 37% nationally. However, there was not an even spread of
the requirement for increased processing capacities across region, based on projected
expansion and current processing capacities.
The transport model was then used to determine the effect on milk transport costs for
different policies around building the additional capacities for processing the
additional milk based on 2020 milk output projections. The transport model can
determine the optimal location of the increased processing capacities by minimising
transport costs using a transportation algorithm with respect to mode of collection

197
and distances between supplier regions and processing plants (Quinlan et al 2010).
The advantage of using this approach is that the transportation algorithm can quickly
identify the shortest path was quickly identified and it could be recalculated
repeatedly (Fu et al. 2005) based any changes in particular components.
Transportation costs play a major role in locational choices in the dairy sector
because milk is a large bulky perishable product with its movement often resulting in
high transport costs.
It was found in this study that the optimum expansion strategy from a milk transport
perspective was if milk was collected by optimal catchment areas and milk was
routed to three existing plants in 2020. In order for this to occur milk processors
would need to route milk to the closest plants rather than the current situation where
milk is routed by catchment region.
If milk was collected by optimal catchment areas there were only small overall
differences in transport costs whether the milk was collected existing sites or
Greenfield sites. However having three sites rather than one site to process the
additional milk did reduce the total transport costs by 7-8% when compared to one
site. In a situation where milk transport costs are identical, other cost factors such as
economies of scale at processing level, distribution costs, existing site recourses, etc.
would have to be taken into account in the final decision making process.
As well as finding the least cost site from a transport perspective, other factors also
need to be considered when examining future locations of processing plants. Lopez

198
and Henderson (1989) found proximity to the raw material; infrastructure,
availability and quality of water, availability of waste disposal and labour factors
were all important factors in choosing where to locate a plant. Dobis et al. (2010)
carried out a study on locational determinants of food processing in the United States
and concluded that the attributes of a site that food manufacturers should use to make
their location decision are access to input and product markets, agglomeration
factors, labour attributes, infrastructure, fiscal characteristics and social capital.
Manufacturing productivity is influenced by labour quality (McNamaraet al, 1988).
Higher-quality workers are generally more productive, and increased productivity
leads to lower costs and/or higher output. Therefore, access to high quality labour is
important for the dairy processing industry. As the dairy industry in Ireland is
seasonal in nature (the majority of processing occurs between April and September)
access to seasonal workers would also be a key requirement.
Rainey and McNamara (1999) considered the effect of infrastructure on
manufacturing location decisions and all found that infrastructure was a significant
and positive determinant of plant location choice. Dairy processors require a reliable
transport network to assembly milk from spatially separated farms to processing
plants. Roads in Ireland are classified as national primary, national secondary,
regional roads and local roads. The road structure and size will have a significant
effect on tanker productivity.

199
Availability of a clean source of water is also an important factor to consider when
deciding where to locate a milk processing plant. Water is required for general plant
use, human use, for milk cooling and also during processing of the milk, therefore
access is essential. The presence of a river also facilitates a situation where treated
water may be discharges back into the water body and is part of the consideration
process.
The efficient organisation of the industry must consider the volume-cost relationship
of future plants as well as the location of milk supplies and other location factors.
The presence of existing facilities at existing sites may also add to the computations
around the optimal location of new processing facilities. The authors intend to carry
out further studies on volume cost relationships of plants to add to the transport cost
information, which ultimately lead to strong directions been provided for the Irish
dairy industry.
ACKNOWLEDGEMENTS
The support received through the Walsh Fellowship from Teagasc and the
Department of Agriculture, Fisheries and Food Stimulus fund for this research is
gratefully acknowledged.

200
References
Bord Bia (2010). Factsheet on the Irish Agriculture and Food & Drink Sector.
Accessed June, 20, 2011.
http://www.bordbia.ie/industryinfo/agri/pages/default.aspx.
Breathnach P (2000). The Evolution of the Spatial Structure of the Irish Dairy
Processing Industry, Irish Geography, Vol. 33.2.
CSO (2011). Intake of Cows Milk by Creameries and Pasteurisers by Month,
Domestic or Import Source and Statistic. Accessed Aug. 15, 2011.
http://www.cso.ie/px/pxeirestat/Dialog/varval.asp?ma=AKM01&ti=Intake+of+Cows
+Milk+by+Creameries+and+Pasteurisers+by+Month,+Domestic+or+Import+Source
+and+Statistic&path=./Database/Eirestat/Agriculture%20Milk%20Production/&lang
=.
DAFF (2010) (a). Implementation of Food Harvest 2020 in the Dairy Sector.
Accessed Feb. 10, 2011.
http://www.agriculture.ie/media/migration/farmingsectors/dairy/RoadmapRevised08
0211.
DAFF (2010) (b). 2020 Food Harvest Vision. Accessed April 2, 2011.
http://www.agriculture.gov.ie/media/migration/publications/2010/AROEnglish.pdf.
Dobis, E, Lambert, D. and McNamara, K. (2010). Locational Determinants of Food
Manufacturing in the United States. Purdue Agricultural Economics Report.

201
Accessed June 2, 2011.
http://www.agecon.purdue.edu/extension/pubs/paer/2010/may/mcnamara2.asp.
Donnellan, T. and Hennessy. T. (2007). The effect of milk quota ‘expansion’ on
EU/Ireland production. In Exploiting the freedom of milk: Proceedings of the
Teagasc National Dairy Conference, 2007, pp. 1-19, Kilkenny, Ireland. Accessed
June 6, 2011.
http: www.teagasc.ie/publications 2007/53/53 NationalDairyConf2007.pdf].
Fu, L., Sun, D. and Rilett, L.R. (2005). Heuristic shortest path algorithms for
transportation applications: State of the art. Computers and Operational Research,
Volume 11, Issue 33.
Hellmann, F. and Verburg P.H. (2008). Spatially explicit modelling of biofuel crops
in Europe. Biomass and Bioenergy 1-14.
Hennessy, T. (2007). CAP Health Check Analysis: Farm Level Implications of EU
Milk Quota Expansion. Teagasc, Carlow, Ireland.
IBEC (2010) Trade and Markets. Accessed July 6, 2011.
http://www.ibec.ie/Sectors/FDII/FDII.nsf/vPages/Dairy~trade-and
markets?OpenDocument] accessed 06/07/2011.
Irish Dairy Board, The Dairy Industry in Ireland, (2009) Dublin.

202
Laepple, D., and Hennessy, T. (2010) The Capacity to Expand Milk Production: The
Evidence from the National Farm Survey, paper prepared for the Food Harvest 2020
Implementation Committee.
Leduc, S., Lundgren, J., Franklin, O. and Dotzauer. E. (2009). Location of a biomass
based methanol production plant: A dynamic problem in Northern Sweden. Applied
Energy 87 (2010) 68–75.
Lips, M., Reider., P. (2005). Abolition of raw milk quota in the European Union: A
CGE analysis at the member country level. Journal of Agricultural Economics 56
(1), 1-17.
Lopez, R.A. and Henderson, N.R. (1989). The Determinants of Location Choices for
Food Processing Plants. Agribusiness (1986-1998); Nov 1989; 5, 6; ABI/INFORM
Global pg. 619.
McNamara, K.T., W.P. Kriesel, and B.J. Deaton. (1988). Manufacturing Location:
The Impact of Human Capital Stocks and Flows. Review of Regional Studies 18,
1:42–48.
O’ Connell, L, Van Egeraat, Enright, P. 1997. Clusters in Ireland: The Irish Dairy
Processing Industry: An Application of Porters Cluster Analysis. NESC Research
Series, Paper 1.

203
Promar and Prospectus (2003) Strategic Development Plan for the Irish Dairy
Processing Sector, Dept. of Agriculture and Food, Dublin.
Quinlan C., Enright P., Keane M., O’Connor D. (2006). The Milk Transport Cost
Implications of Alternative Dairy Factory Location. Agribusiness Discussion Paper
No 47. Dept. of Food Business and Development. University College, Cork.
Quinlan C, Keane M, O’Connor D and Shalloo L (2010) The Transport Implications
for Ireland of the Elimination of the Milk Quota Regime in 2015. Presented at ITRN
Conference September 2010, Dublin..
Rainey, D.V., and K.T. McNamara. . (1999) .Taxes and Location Decision of
Manufacturing Establishments. Review of Agricultural Economics 21, 1:86–98.
Shalloo L. 2011. Milk quota management 2011 to 2015. In Proceedings of Planning
for Post Quotas. Irish Grassland association annual dairy conference. Tuesday 11th
&Wednesday 12th of January, Ardboyne hotel, Navan, Co. Meath & Morans Siver
Springs Hotel, Cork. Page56-73
Wouda, F.H.E., Beek, P.V., Van Der Vorst, J.G.A.J., Tacke, H., (2002). An
application of mixed-integer linear programming models on the redesign of the
supply network of Nutricia Dairy & Drinks Group in Hungary. OR Spectrum, 24:
449–465

204
Carrie Quinlan is a PhD student in the Department of Food Business and Development at University College, Cork. She has been awarded a Teagasc Walsh fellowship to complete her PhD. She earned her Masters of Food Science and Technology in 2005 at University College Cork, Ireland. Her current research interests are milk transport modelling, dairy industry supply chain economics and dairy Marketing strategies Laurence Shalloo is a senior researcher at the Dairy Production Department, Teagasc, Moorepark, Cork. He earned a PhD in 2004 in Animal science and Agribusiness and Rural Development at Teagasc Moorepark and in conjunction with the Faculty of Agricultural in UCD. His current research interests include milk pricing strategies, seasonality of milk production, Green House Gas emissions, Water quality, Economic dairy cow select ion indices and grass selection indices Michael Keane is a senior lecturer in the Department of Food Business and Development at University College Cork since 1981. He received BAgSc, MSc Econ and PhD from Trinity College Dublin. His research interests include agricultural and food economics and marketing, dairy quotas and seasonality, dairy marketing strategies and dairy and meat market opportunities analysis. He has been involved in a number of international research projects, consultancy, teaching and training projects. Declan O’ Connor is a lecturer at the Department of Mathematics at Cork Institute of Technology in Cork since 1992. He received BComm, and PhD from University College Cork. His current research interest includes agri food policy analysis, dairy industry supply chain economics and risk management in the dairy industry. Doris Laepple is a researcher at the Rural Economy Research Centre, Teagasc, Athenry, Galway. Doris received a Dipl.-Ing.agr. from the Technical University of Munich-Weihenstephan, Germany. She received PhD from NUIG in conjunction with Teagasc. Her research interests include farm level modelling, organic farming and dairy policy. Thia Hennessy is Principal Research Officer at the Rural Economy Research Centre, Teagasc, Athenry, Galway. She received a B.A. in Economics and Finance from National University of Ireland, Maynooth,

205
a Master of Business Studies in Agriculture and Food Business from Smurfit Graduate School of Business, University College Dublin and a Ph.D. in Agricultural Economic from the University of Reading, UK. She joined the FAPRI-Ireland team in 1998 and since then she has been responsible for modelling the farm level impact of policy change. Her research interests include farm level modelling, impact of policy on farm sustainability, dairy policy modelling, the impact of climate change and labour market modelling.

206
Table 8.1: Assumptions for components of milk transport
Source: Own calculations
Assumptions for other components of milk transport
Tanker capacity : 6000 gallons Average daily operating hours at peak: 20 hours Assembly mileage: 1.76 miles Costs increase between 9-11% in 2020 (depending on variable) (Binfield et al., 2007) Frequency of milk collection: Every third day at peak Trucks value written off over 220,000 miles Trailer value written off over 660,000 miles Diesel cost: €1.1 per litre exclusive of VAT Interest rate: 5% Full list of costs available in Quinlan et al. 2011

207
Table 8.2: Regional Expansion capacity
BMW region Region Overall Small Medium Large
Milk Sales 2020 (in Mio
litres)
BMW
South-West
East
South
1,297.315
1,554.88
1,050.93
1,890.14
157.107
449.97
134.32
280.99
419.47
631.04
390.64
694.96
720.738
473.86
525.97
914.18
% Change in Milk Sales BMW
South-West
East
South
25.5
30.6
29.9
45.6
10.6
19.9
18.4
48.9
53.9
56.2
54.8
62.4
16.4
15.1
18.7
34.2
Farm numbers remaining BMW
South-West
East
South
3,769
4,897
2,274
4,097
1,117
1,663
604
1,119
1,399
1,694
947
1,548
1,252
1,539
723
1,431
Source: Laepple and Hennessy, 2010

208
Table 8.3: Transport Costs: Expansion of existing sites using actual catchment areas
Site Million Euro
Cent/litre
Return transport mileage for average
route 1 site
Mitchelstown Mallow
Charleville Macroom
Newmarket Tipperary West Cork
2 sites Mitchelstown and Macroom Mitchelstown and West Cork Mitchelstown and Ballyragget
Mitchelstown and Mallow Mitchelstown and Newmarket Mitchelstown and Tipperary
3sites Mitchelstown, Macroom and Ballyragget
Mitchelstown, Macroom and Nenagh Mitchelstown, Macroom and Wexford Mitchelstown, Macroom and Tipperary Mitchelstown, Macroom and Charleville
68.45 68.48 69.47 69.61 70.26 70.59 70.68
65.53 65.75 66.44 66.48 67.17 67.17
63.26 63.99 64.38 64.55 65.45
1.02 1.02 1.03 1.04 1.05 1.05 1.05
0.97 0.98 0.99 0.99 1.00 1.00
0.94 0.95 0.96 0.96 0.97
64.38 64.47 67.44 67.85 68.36 69.36 69.63
58.76 59.39 61.38 61.48 62.09 62.10
54.66 55.39 56.58 57.09 58.35
Source: Own calculations
Table 8.4: Summary milk transport costs for actual catchment areas (best sites)
million
Cent/litre
transport mileage
2020 1 site Mitchelstown
68.45
1.02
64.38
2020 2 site Mitchelstown Macroom
65.53
0.97
58.76
2020 3 sites Mitchelstown Macroom Ballyragget
63.26
0.94
54.66
Source: Own calculations

209
Table 8.5: Transport Costs: Expansion of existing site using Ideal Catchment Areas
Site Million
Euro Cent/litre Return
transport mileage for
average route
1 site Mitchelstown
Mallow Macroom Tipperary West Cork Newmarket Charleville
2 sites
Mitchelstown and Macroom Mitchelstown and West Cork
Mitchelstown and Mallow Mitchelstown and Newmarket Mitchelstown and Tipperary Mitchelstown and Wexford
3 sites
Mitchelstown, Macroom, Wexford Mitchelstown, Macroom, Nenagh
Mitchelstown, Macroom, Tipperary Mitchelstown, Macroom, Ballyragget
Mitchelstown, Macroom, Mallow
61.85 62.55 63.38 64.45 64.48 64.71 65.01
59.21 59.41 60.64 60.82 61.02 61.04
56.98 58.08 58.49 58.57 59.19
0.92 0.93 0.94 0.96 0.96 0.96 0.97
0.88 0.88 0.90 0.90 0.91 0.91
0.85 0.86 0.87 0.87 0.88
53.39 54.04 55.59 57.57 57.64 58.06 58.61
48.49 48.86 51.15 51.48 51.85 51.90
45.01 46.71 47.47 47.62 48.77
Source: Own calculations

210
Table 8.6: Summary table: Transport costs for ideal catchments areas (best sites)
million
cent/litre
transport mileage
2020 1 site Mitchelstown
61.85
0.92
53.39
2020 2 site Mitchelstown,
Macroom
59.21
0.88
48.49
2020 3 sites Mitchelstown,
Macroom, Wexford
56.98
0.85
45.01
Source: Own calculations

211
Table 8.7: Transport Costs: Selection of Greenfield sites to process additional milk supply
Site Million Euro
Cent/Litre
Return transport
mileage for average
route 1 site
Glenmore Mogeely
Dungarvan Croom
Kilmallock Millstreet
Ashhill Horse and jockey Nenagh
Belview Port Rosslare
2 sites
Glanmire and Dungarvan Glanmire and Nenagh Glanmire and Croom
Glanmire and Ashhill Horse and jockey Glanmire and Belview Port Glanmire and Kilmallock Glanmire and Millstreet Glanmire and Mogeely Glanmire and Rosslare
3 sites
Glanmire, Dungarvan and Nenagh Glanmire, Dungarvan and Croom
Glanmire, Dungarvan and Kilmallock Glanmire, Dungarvan and Millstreet
Glanmire, Dungarvan and Ashhill Horse and jockey
Glanmire, Dungarvan and Belview Port
68.22 69.10 69.23 70.20 70.21 70.35 72.05 73.77 73.87 80.08
65.57 65.67 65.83 65.91 66.31 66.59 67.08 67.32 67.62
63.11 63.35 63.94 63.95 64.05
65.58
1.01 1.03 1.03 1.04 1.04 1.05 1.07 1.10 1.10 1.19
0.98 0.98 0.98 0.98 0.99 0.99 1.00 1.00 1.01
0.94 0.94 0.95 0.95 0.95
0.98
63.70 66.33 66.72 68.19 68.21 68.65 72.31 76.03 76.33 89.19
57.53 57.80 58.27 58.48 59.62 60.44 61.83 62.50 63.37
52.77 53.47 55.24 55.28 55.59
58.73
Source: Own calculations

212
Table 8.8: Summary milk transport costs for least cost Greenfield sites
million
Cent/litre
transport mileage
2020 1 site Glanmire
68.22
1.01
63.70
2020 2 site Glanmire Dungarvan
65.57
0.98
57.80
2020 3 sites Glanmire Dungarvan Nenagh
63.11
0.94
52.77
Source: Own calculations

213
Table 8.9: Transport costs (€ million) for 20% increase and 20% decrease in fuel costs
Source: Own calculations
Scenaro 1
Scenario 2
Scenario 3
current 20% -20% current 20% -20% current 20% -20% 1 site €68.45 €71.23 €65.67 €61.85 €64.26 €59.44 €68.22 €70.98 €65.47 2 sites €65.53 €68.12 €62.94 €59.21 €61.46 €56.96 €65.57 €68.12 €63.02 3 sites €63.26 €65.72 €60.81 €56.98 €59.11 €54.85 €63.11 €65.51 €60.73

214
Table 8.10: Transport costs (€ million) for 20% increase and 20% decrease in labour costs
Source: Own calculations Table 8.11: Transport costs (€ million) for 4% interest rate and 7% interest rate
Source: Own calculations
Scenario 1 Scenario 2
Scenario 3
current 20% -20% current 20% -20% current 20% -20%
1 site €68.45 €74.36 €62.54 €61.85 €67.39 €56.30 €68.22 €74.11 €62.34 2 sites €65.53 €71.25 €59.80 €59.21 €64.59 €53.83 €65.57 €71.25 €59.89 3 sites €63.26 €68.85 €57.68 €56.98 €62.25 €51.72 €63.11 €68.64 €57.59
Scenario 1 Scenario 2 Scenario 3
current
4% interest
rate
7% interest
rate current
4% interest
rate
7% interest
rate current
4% interest
rate
7% interest
rate
1 site €68.45 €69.16 €68.02 €61.85 €62.50 €61.45 €68.22 €68.93 €67.79 2 sites €65.53 €66.30 €65.20 €59.21 €59.86 €58.81 €65.57 €66.39 €65.26 3 sites €63.26 €63.92 €62.86 €56.98 €57.61 €56.60 €63.11 €63.78 €62.71

215
Figure 8.1: Actual catchment areas of milk processors in Ireland
Source: Irish Farmers Journal, 2009
216
Figure 8.2: Schematic diagram of the model
Source: Own diagram

217
Figure 8.3: Expansion Capacity for Dairy Farms in Ireland in 2020
Source: Own diagram

218
Figure 8.4: Optimum versus actual catchment areas % saving in transport costs
Source: Own diagram
9.65% 9.65% 9.92%
0.00%
2.00%
4.00%
6.00%
8.00%
10.00%
12.00%
2020 1 site 2020 2 sites 2020 3 sites

219
Figure 8.5: Additional milk supply: 3 sites versus 2 sites and 1 site (Actual catchment areas)
Source: Own diagram
7.58%
3.46%
0% 1% 2% 3% 4% 5% 6% 7% 8%
1 site compared with 3
sites
2 sites compared with 3
sites
% Savings in total transport costs

220
Figure 8.6: Additional milk supply: 3 sites versus 2 sites and 1 site (Optimum catchment areas)
Source: Own diagram
7.86%
3.76%
0% 1% 2% 3% 4% 5% 6% 7% 8% 9%
1 site compared with 3
sites
2 sites compared with 3
sites
% Savings in total transport costs

221
Figure 8.7: Additional milk supply: 3 sites versus 2 sites and 1 site (Greenfield sites)
Source: Own diagram
8.10%
3.90%
0% 1% 2% 3% 4% 5% 6% 7% 8% 9%
1 site compared with 3
sites
2 sites compared with 3
sites
% Savings in total transport costs

222
Figure 8.8: Current processing sites/actual catchment areas: 3 best sites highlighted
Source: Own diagram

223
Figure 8.9: Current processing sites/optimum catchment areas: 3 best sites highlighted
Source: Own diagram

224
Figure 8.10: Greenfield site locations
Source: Own diagram
Quinlan, C. B. 2013. Optimisation of the food dairy coop supply chain. PhD Thesis, University College Cork. Please note that Chapter 9 (pp.225-261) is currently unavailable due to a restriction requested by the author.
CORA Cork Open Research Archive http://cora.ucc.ie

262
Chapter 10: Conclusions
10.1 Introduction
This chapter presents the conclusions and recommendations of the research. The key
conclusions derived are discussed together under a number of important headings.
These include: national milk transport model which allows for the examination of a
wide range of efficiency factors in milk transport, milk processing capacity and the
location of milk processing capacity in 2020 and optimum dairy processing sector
configuration in 2020 taking cognisance of regional milk supply, processing and
milk transport costs. Finally in this chapter, recommendations to stakeholders in the
Irish processing dairy sector are presented, and suggestions for further research are
proposed based upon topics of interest that require further investigation.
10.2 Research Conclusions and Discussion
In Ireland the dairy industry is one of the most important indigenous industries and
comprises a vital part of the agri-food sector accounting for 29% of agricultural
output in 2010 (Bord Bia 2010). The dairy industry also makes a significant
contribution to sustaining rural communities, currently there are approximately
18,294 dairy farmers (DAFF, 2010) and the dairy processing industry employs 7,000
people (IBEC 2010). In 2010 total dairy exports were worth €2.3 billion (Bord Bia
2010). Prospects for the dairy sector in the medium to long term are positive. Given
projections for significantly increased demand, the abolition of EU milk quotas in
2015 presents a real opportunity for the Irish dairy sector, with a significant potential

263
for increased milk production. The sector also possesses a significant cost advantage
in the form of an environmentally sustainable rain fed grass-based production
system, which allows milk to be produced efficiently for much of the year. However,
for the sector to flourish at optimum level, efficiency gains will be crucial at primary
and processing level. Overall plant utilisation, product mix and market optimisation
will need to be explored. In the following sub-sections, the research sub-questions
are initially dealt with, and finally, the main research question guiding this study,
which is an amalgam of the individual sub- questions, is addressed in Section 10.3.
Sub-question 1:What are the effects of various efficiency factors on milk transport
costs in Ireland? What are the effects of different milk production patterns on milk
transport costs in Ireland?
10.2.1. National milk transport model which allows for the examination of a
wide range of efficiency factors in milk transport
There is limited literature on milk transport activities in Ireland; therefore it was
decided to address this paucity in the literature by developing a national milk
transport model detailed in Chapter 6. The purpose of this unique national milk
transport model was to support decision-makers in relation to milk transport
activities. The milk transport model was developed to allow for the examination of a
wide range of efficiency factors in milk transport including pumping rates, tanker
sizes, size of suppliers, density of milk supply and frequency of collection. It
integrates capital costs, running cost and labour incurred on a typical route. The
model simulates the six components of milk transport namely transport driving,

264
assembly driving, farm pumping, plant pumping, on farm routine activities, and plant
non-pumping. The model developed is a simulation model, which includes the
transportation model developed by Quinlan in 2006 (this model used a transportation
algorithm to minimise the transportation mileage from rural districts to processors).
The outputs of the model include environmental factors, physical factors and
financial factors. Three scenarios were examined, firstly current milk transport costs
were estimated, and secondly milk transport costs were estimated if milk production
increased nationally by 30% in 2020. In the third scenario milk transport costs were
estimated if milk production increased nationally by 30% in 2020 and larger tankers
with capacity of 27,360 litres were used in milk transport activities. In summary total
milk transport costs were 20% higher in the second scenario (€60.80million) and
14% higher in the third scenario (€57.68 million) when compared with the first
scenario (€50.43 million). It was concluded that as milk output increases milk
transport costs per litre decrease as transport costs can be spread out over a larger
volume of milk. The higher capacity tankers were also found to be more
economically efficient than what is currently being used in the industry
As the transport sector is the fastest growing contributor to national GHG emission
levels, it was decided to calculate carbon emissions from milk transport activities in
Ireland. Carbon emissions for milk transport in Ireland have not previously been
calculated; therefore this is a novel element of the milk transport model. Total
emissions from transporting the current milk output were found to be 24,870 tonnes
or 5.02g per litre.

265
Comparing the results of a 2005 milk transport survey with the results from the
model validated the model. The results were favourable indicating that the model can
be used with confidence to aid in decision making when analysing milk transport
activities.
The unique transport model was found to have a number of strengths and was the
most suitable method of analysis for this study:
It can produce a unique solution to a complex problem or situation. It is
better equipped than other approaches to handle complex interrelationships
that exist in the dairy sector.
It is capable of handling the complex situations that may exist in the transport
sector in an easy and effective manner.
It allows one to examine scenarios that are outside the range of past
experiences, for example milk quota abolition
It is a relatively user-friendly approach and changes in model parameters
could be easily incorporated into the model, which could then be resolved.
The novel milk transport model developed was then used to examine the effect of
alternative milk production patterns on milk transport costs. Therefore, in Chapter 7
the model was used to examine the effect of a moderate reduction in seasonality
(2.71:1, peak to trough month) on milk transport costs and an increase in seasonality
(8:1, peak to trough month) on milk transport costs. Four different output levels were
also examined; the current milk output level, a 20% increase, 38% increase and 45%
increase in milk output levels in 2020. Savings in total transport costs of 3-4% were

266
attained when changing to a less seasonal milk supply pattern and increases in
transport costs of 1%-2.5% were estimated when a more seasonal approach was
pursued. As milk output increased total milk transport cost savings increased from
€1.5 to €2.2 million per annum when a more even milk supply was followed and
total milk transport costs increased from €0.5 million to €1.5 million per annum
when a more seasonal milk supply pattern was adopted. Carbon dioxide emissions
from milk transport did not fluctuate significantly when milk supply profiles altered.
Therefore there were no environmental benefits/detriments of following more
even/seasonal milk supply patterns. Other factors would need to be taken into
consideration before any definitive decisions regarding milk supply patterns are
made.
The effect of alternative milk supply patterns on milk transport costs had not
previously been examined in Ireland. Therefore, the results of this study contribute to
current literature on alternative milk supply patterns.
However, in order to draw conclusions on seasonality within the Irish dairy industry
other issues such as market requirements, product portfolio choice, and
manufacturing costs and farm production costs also need to be considered. It is only
when all of the components are answered can a clear conclusion be drawn about
seasonality within the Irish dairy industry.
Sub-question 2: Will milk production increase post milk quota abolition, if so where
will it increase? How many processing plants should Ireland have post milk quota

267
abolition? Where should the plants be located? How large should each plant be?
Where should the milk to be processed at each plant be sourced? How should milk
be collected?
10.2.2 Milk processing capacity and the location of milk processing capacity in
2020
There is a debate around the future of the Irish dairy industry. Questions been asked
include the following (i) is there a need for additional capacity to process milk
supply post milk quota abolition and (ii) if so, where should it be located. In Chapter
8 of this thesis these questions were examined in detail and expansion strategies for
the Irish dairy industry were explored. This novel study therefore informs the debate
and contributes to existing literature. The FAPRI (Food and Agricultural Policy
Research Institute) Ireland farm level model was used to estimate the regional
increases in milk production post quota abolition (in association with Teagasc,
Athenry). Current milk processing capacity was compared to future milk supply
output. A milk transport model incorporating processor location was used to identify
the optimum location for expansion of (a) existing sites and (b) greenfield sites. The
model was also used to estimate the effect of different numbers of sites (to process
the additional milk) and modes of milk transport (i.e. actual catchment areas and
optimal catchment areas) on milk transport costs. Three scenarios were examined, in
the first scenario the model was used to calculate transport costs if milk is collected
from actual catchment areas and additional milk supply is transported to 1, 2 and 3
existing sites. In the second scenario the model was used to calculate transport costs
if milk is collected from optimal catchment areas and additional milk supply is

268
transported to 1, 2 and 3 existing sites. In scenario 3 milk is collected by optimal
catchment areas and additional milk supply is transported to 1, 2 and 3 greenfield
sites.
It was found that expansion capacity in terms of milk output in Ireland in 2020
ranged from 0% to 76.92% by region, with a national average increase of 45%
estimated for 2020. The South and the South East, in particular counties Cork,
Limerick, Waterford, Tipperary, Wexford, Kilkenny, Carlow and Wicklow, had the
highest milk expansion capacity. There was some spare processing plant capacity to
process additional milk supply, however it was found that current milk processing
capacity in Ireland would need to be expanded by 37% in 2020.
It is evident that there are potential transport savings in milk transport costs from
milk being assembled in an optimum fashion i.e. sending milk to nearest processing
site and avoiding unnecessary transport mileage. Savings obtainable if milk was
collected from optimal catchment areas as opposed to actual catchment areas in 2020
were 9.65%, 9.65% and 9.92% for 1 site, 2 sites and 3 sites; however this would
require co-operation among milk processors in milk transport activities.
If milk was collected by optimal catchment areas there were only small overall
differences in transport costs in terms of whether the milk was transported to existing
processing sites or new greenfield sites.

269
Having three additional sites rather than one site to process the additional milk
reduced the total transport costs by 7-8% when compared to one site in all scenarios.
The optimum expansion strategy from a milk transport perspective was if milk was
collected by optimal catchment areas and additional milk was routed to three existing
processing plants (Mitchelstown, Macroom and Wexford) in 2020.
Potential economies of scale may outweigh savings in milk transport costs, the
volume-cost relationship of future plants as well as the location of milk supplies and
other location factors must also be considered before any decisions are made.
In this study the expansion capacity is based on a milk price of 28 cent per litre in
2020. Post milk quota elimination Ireland will be more susceptible to price volatility
due to changes in world market prices. Expansion potential will be dependant on
milk price.
Sub-question 3: What will the total processing and transport costs be post milk
quota abolition? What is the capital requirement for the Irish milk processing sector
post milk quota abolition?
10.2.3 Optimum dairy processing sector configuration in 2020 taking
cognisance of regional milk supply, processing and milk transport costs
The determination of the optimum or least cost structure involves a balancing of
decreasing average processing costs with increasing scale against increasing milk

270
transport costs. The objective of this component of the study examined in Chapter 9
was to establish the least cost configuration for the Irish dairy-processing sector
taking into account the expected expansion in milk output by 2020. An optimisation
model was developed with an objective function to minimise both transport and
processing sector costs. Small processing sites were excluded from this study. This
study concentrated solely on commodity products therefore liquid milk and niche
products were not included in the study.
The model was solved using GAMS software. Inputs for the model included variable
and fixed processing costs for bulk cheese, WMP, SMP and butter for a number of
differing plant sizes, milk intake and other utilities costs for a number of differing
plant sizes and transport costs for varying plant numbers. Five scenarios were
examined, the first four scenarios assumed all 16 current plants in Ireland were
working at full capacity and the 45% increase in milk supply was allowed to travel to
the optimum location. In the first scenario the additional milk supply produced the
2007-2009 average product mix, in the second scenario the additional milk was used
to produce cheese, in the third scenario it was used to produce WMP and in the
fourth scenario all the additional milk was used for SMP plus butter. In the fifth
scenario total milk supply (current and additional) was allowed to travel to the
optimum location (27 possible site locations: 16 existing processing locations, 11
new greenfield processing locations).
Annual total costs overall were €404, €399, €420, €398 and €367 million for
scenarios 1 to 5, respectively. Capital costs for additional plants and intake and

271
utilities in scenario 1, 2, 3, 4 and 5 were €291 million, €226 million, €341 million,
€271 million and €830 million respectively. The product mix produced from the
additional milk supply had a significant impact on the total costs and the capital
required to fund expansion post milk quota abolition.
At a broader level, social, political, environmental and quality factors would also
need to be examined before any decisions on the structure of the future of the
industry are made.
The model could be used to help improve the decision making process with regard to
changes in the milk processing sector in Ireland. The model is quite flexible and
additional scenarios can be evaluated as required.
The model developed in this study is an extension of Stollsteimers model developed
in 1963 and Dwyer’s model in 1968. The model includes the seasonality problem
associated with milk production in Ireland. It also caters for alternative product and
additional milk supply post milk quota abolition. Boysen in 2008 and Buschendorf in
2009 developed similar models to that developed in this study for the German dairy
industry. However, the model is unique in that prior to this research there was no
literature available on combined milk transport and dairy processing models
specifically designed for the Irish dairy processing industry.
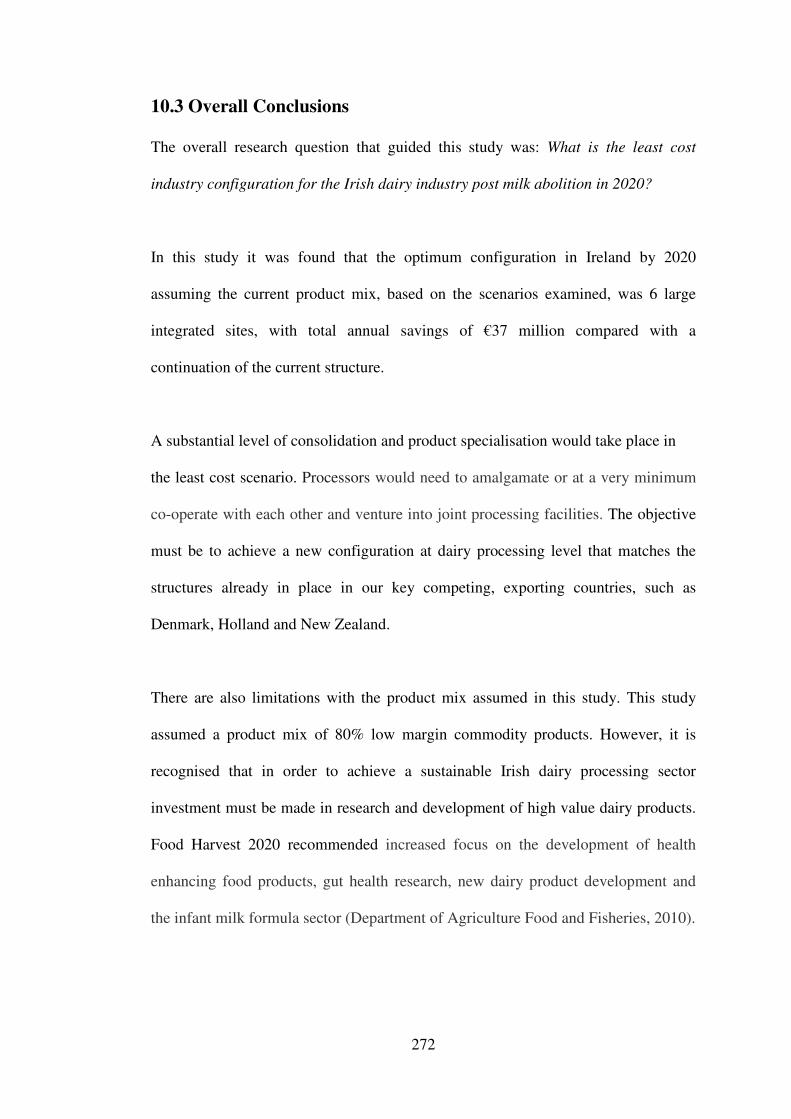
272
10.3 Overall Conclusions
The overall research question that guided this study was: What is the least cost
industry configuration for the Irish dairy industry post milk abolition in 2020?
In this study it was found that the optimum configuration in Ireland by 2020
assuming the current product mix, based on the scenarios examined, was 6 large
integrated sites, with total annual savings of €37 million compared with a
continuation of the current structure.
A substantial level of consolidation and product specialisation would take place in
the least cost scenario. Processors would need to amalgamate or at a very minimum
co-operate with each other and venture into joint processing facilities. The objective
must be to achieve a new configuration at dairy processing level that matches the
structures already in place in our key competing, exporting countries, such as
Denmark, Holland and New Zealand.
There are also limitations with the product mix assumed in this study. This study
assumed a product mix of 80% low margin commodity products. However, it is
recognised that in order to achieve a sustainable Irish dairy processing sector
investment must be made in research and development of high value dairy products.
Food Harvest 2020 recommended increased focus on the development of health
enhancing food products, gut health research, new dairy product development and
the infant milk formula sector (Department of Agriculture Food and Fisheries, 2010).

273
10.4 Recommendations to Stakeholders in the Dairy Processing
Sector
The results of this study have important implications for the Irish dairy-processing
sector. As there is limited research on milk transport and processing costs in Ireland,
this thesis fills this gap in the literature. Findings in this thesis could be used to help
improve the decision making process around changes in the milk processing.
Findings could also be used to encourage debate within the industry.
In relation to milk transport operations in Ireland, currently there are a lot of
inefficiencies and considerable cost savings could be made if these inefficiencies
were eliminated. For example it was found in this study that tankers with capacity of
27,360 litres were economically and environmentally more efficient than tankers
with capacity of 22,800 litres. It was also more efficient to operate tankers 20 hours
per day rather than 12 hours per day at peak. Savings were also available if
processors co-operated with each other in milk transport operations and avoid the
current overlap of milk transport activities that is currently taking place in the
industry. From a milk transport point of view it was found that there were very little
savings to be made in milk transport (3%-4%) if farmers adopt a more even milk
supply throughout the year.
Milk quota abolition will provide significant opportunities for the Irish processing
sector to expand. It was found in this study that current processing capacity will not
be sufficient to process additional milk supply in 2020, therefore additional

274
processing facilities will be required. It is vital that this development is properly
planned and scarce investment resources (especially in the context of the global
financial crisis) are not wasted. Based on expansion estimates in 2020 (Teagasc,
Athenry, 2011), it was found that the optimal solution from a milk transport
perspective in 2020 was if 3 sites Mitchelstown, Macroom and Wexford were
expanded and milk was collected by optimal catchment areas. However, Irish dairy
processors are advised that processing costs must be taken into consideration as well
as other location factors before any final decisions are made.
Processing costs and in particular economies of scale associated with processing
costs were examined in this study and it was found that internationally competitors
are operating at higher capacities and obtaining considerable economies of scale as a
result. There was limited research available on processing costs in Ireland, this study
therefore contributed to the literature available. It is highly recommended that dairy
processors increase the scale of their processing operations as they can achieve
substantial savings in costs if they do so. The industry must be particularly careful in
deciding what products to produce as product mix has a considerable impact on the
total costs and capital required to fund expansion post milk quota abolition.
10.5 Suggestions for Further Research
There are a number of potential research avenues that could be developed from this
study. In relation to milk transport other efficiency factors that could be examined
include increasing pump capacity at the processing plant and on the farm as well as

275
the frequency of milk collection. These factors may also result in additional savings
in milk transport costs.
In relation to alternative milk supply patterns it would be useful to undertake a cost
benefit analysis and to examine the effect of alternative milk supply patterns on milk
production costs at farm level and on processing costs at processing sector level.
The Republic of Ireland was only included in this study as it was not possible to
obtain data in relation to milk production quantities (at rural district level) and
processing capacities at dairy processing sites for Northern Ireland. It is vital from a
least cost perspective that processors in the North and South co-operate, therefore it
would be very beneficial for Northern Ireland processors to supply this information
and be included in subsequent studies.
This study concentrated solely on commodity products as the processing costs for
niche, high value products are not publicly available. It is recognised that there is a
need also for specialised, niche, high value products in the product mix. It would
also be relevant to include these products in future studies. The liquid milk industry
was also excluded and it would be very interesting to include this also.
It would be beneficial to examine carbon emissions for different plant sizes. This
would also assist the dairy-processing sector in making informed decision regarding
the future configuration of the Irish dairy-processing sector.

276
10.6 Summary
The dairy industry in Ireland is currently facing a period of change, with the
impending removal of milk quotas in 2015. In this thesis milk transport and
processing costs were examined in detail. Areas where substantial savings could be
made were highlighted. Expansion strategies for the Irish processing sector post milk
quota abolition were outlined. The novel models developed in this study are very
flexible and can be used to model any scenario. The empirical studies presented in
this thesis are timely and fill a gap in the literature of milk transport costs and dairy
processing costs in Ireland. It is intended that the results from this thesis will
contribute to the debate surrounding the future structure of the Irish dairy processing
sector and aid in the subsequent decision making process. The Irish dairy industry
has had a very successful past. It now must take action to secure a successful future.

277
References
Bord Bia. 2010. Pathways for Growth. Accessed Feb. 25, 2011.
http://www.bordbia.ie/industryinfo/publications/bbreports/PathwaysForGrowth/P
athways%20for%20Growth%20Report.pdf. Accessed Feb. 25, 2011.
Department of Agriculture, Food and Fisheries (2010). Implementation of Food
Harvest 2020 in the Dairy Sector
[http://www.agriculture.ie/media/migration/farmingsectors/dairy/RoadmapRevised0
80211.pdf]. Accessed Oct. 2, 2011.
IBEC 2010. Trade and Markets.
[Online]. Available from:
http://www.ibec.ie/Sectors/FDII/FDII.nsf/vPages/Dairy~trade-and-
markets?OpenDocument. Accessed Oct. 10, 2011.