Embed Size (px)
Citation preview
GEOLOGY | August 2014 | www.gsapubs.org 655
Anatomy of an active submarine volcanoA.F. Arnulf1, A.J. Harding1, G.M. Kent2, S.M. Carbotte3, J.P. Canales4, and M.R. Nedimović3,5
1Cecil H. and Ida M. Green Institute of Geophysics and Planetary Physics, Scripps Institution of Oceanography, University of California–San Diego, La Jolla, California 92093, USA2Nevada Seismological Laboratory, 0174, University of Nevada–Reno, Reno, Nevada 89557, USA3Lamont-Doherty Earth Observatory, Columbia University, Palisades, New York 10964, USA4Department of Geology and Geophysics, Woods Hole Oceanographic Institution, Woods Hole, Massachusetts 02540, USA5Department of Earth Sciences, Dalhousie University, Halifax, Nova Scotia B3H4J1, Canada
ABSTRACTMost of the magma erupted at mid-ocean ridges is stored in a mid-crustal melt lens that lies
at the boundary between sheeted dikes and gabbros. Nevertheless, images of the magma path-ways linking this melt lens to the overlying eruption site have remained elusive. Here, we have used seismic methods to image the thickest magma reservoir observed beneath any spreading center to date, which is principally attributed to the juxtaposition of the Juan de Fuca Ridge with the Cobb hotspot (northwestern USA). Our results reveal a complex melt body, which is ~14 km long, 3 km wide, and up to 1 km thick, beneath the summit caldera. The estimated volume of the reservoir is 18–30 km3, more than two orders of magnitude greater than the erupted magma volumes of either the A.D. 1998 or 2011 eruption. Our images show a network of sub-horizontal to shallow-dipping (<30°) features that we interpret as pathways facilitating melt transport from the magma reservoir to the eruption sites.
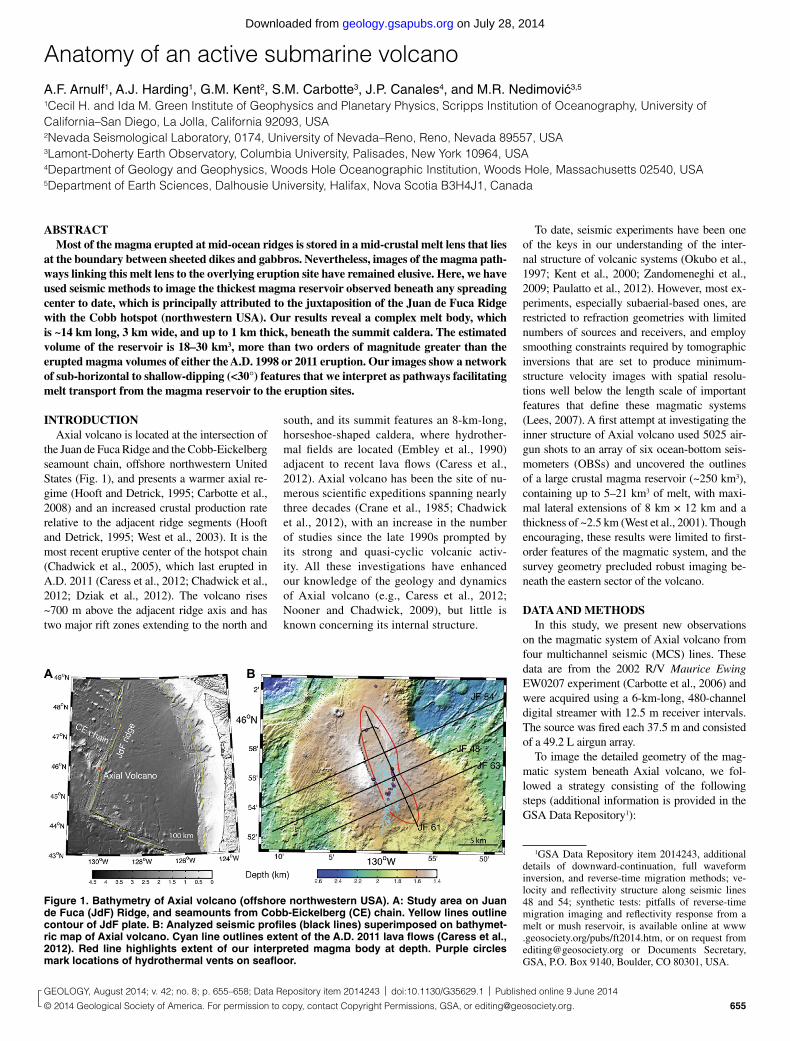
INTRODUCTIONAxial volcano is located at the intersection of
the Juan de Fuca Ridge and the Cobb-Eickelberg seamount chain, offshore northwestern United States (Fig. 1), and presents a warmer axial re-gime (Hooft and Detrick, 1995; Carbotte et al., 2008) and an increased crustal production rate relative to the adjacent ridge segments (Hooft and Detrick, 1995; West et al., 2003). It is the most recent eruptive center of the hotspot chain (Chadwick et al., 2005), which last erupted in A.D. 2011 (Caress et al., 2012; Chadwick et al., 2012; Dziak et al., 2012). The volcano rises ~700 m above the adjacent ridge axis and has two major rift zones extending to the north and
south, and its summit features an 8-km-long, horseshoe-shaped caldera, where hydrother-mal fields are located (Embley et al., 1990) adjacent to recent lava flows (Caress et al., 2012). Axial volcano has been the site of nu-merous scientific expeditions spanning nearly three decades (Crane et al., 1985; Chadwick et al., 2012), with an increase in the number of studies since the late 1990s prompted by its strong and quasi-cyclic volcanic activ-ity. All these investigations have enhanced our knowledge of the geology and dynamics of Axial volcano (e.g., Caress et al., 2012; Nooner and Chadwick, 2009), but little is known concerning its internal structure.
To date, seismic experiments have been one of the keys in our understanding of the inter-nal structure of volcanic systems (Okubo et al., 1997; Kent et al., 2000; Zandomeneghi et al., 2009; Paulatto et al., 2012). However, most ex-periments, especially subaerial-based ones, are restricted to refraction geometries with limited numbers of sources and receivers, and employ smoothing constraints required by tomographic inversions that are set to produce minimum-structure velocity images with spatial resolu-tions well below the length scale of important features that define these magmatic systems (Lees, 2007). A first attempt at investigating the inner structure of Axial volcano used 5025 air-gun shots to an array of six ocean-bottom seis-mometers (OBSs) and uncovered the outlines of a large crustal magma reservoir (~250 km3), containing up to 5–21 km3 of melt, with maxi-mal lateral extensions of 8 km × 12 km and a thickness of ~2.5 km (West et al., 2001). Though encouraging, these results were limited to first-order features of the magmatic system, and the survey geometry precluded robust imaging be-neath the eastern sector of the volcano.
DATA AND METHODSIn this study, we present new observations
on the magmatic system of Axial volcano from four multichannel seismic (MCS) lines. These data are from the 2002 R/V Maurice Ewing EW0207 experiment (Carbotte et al., 2006) and were acquired using a 6-km-long, 480-channel digital streamer with 12.5 m receiver intervals. The source was fired each 37.5 m and consisted of a 49.2 L airgun array.
To image the detailed geometry of the mag-matic system beneath Axial volcano, we fol-lowed a strategy consisting of the following steps (additional information is provided in the GSA Data Repository1):
1GSA Data Repository item 2014243, additional details of downward-continuation, full waveform inversion, and reverse-time migration methods; ve-locity and reflectivity structure along seismic lines 48 and 54; synthetic tests: pitfalls of reverse-time migration imaging and reflectivity response from a melt or mush reservoir, is available online at www .geosociety .org /pubs /ft2014 .htm, or on request from editing@ geosociety .org or Documents Secretary, GSA, P.O. Box 9140, Boulder, CO 80301, USA.
GEOLOGY, August 2014; v. 42; no. 8; p. 655–658; Data Repository item 2014243 | doi:10.1130/G35629.1 | Published online 9 June 2014
© 2014 Geological Society of America. For permission to copy, contact Copyright Permissions, GSA, or [email protected].
A B
Figure 1. Bathymetry of Axial volcano (offshore northwestern USA). A: Study area on Juan de Fuca (JdF) Ridge, and seamounts from Cobb-Eickelberg (CE) chain. Yellow lines outline contour of JdF plate. B: Analyzed seismic profiles (black lines) superimposed on bathymet-ric map of Axial volcano. Cyan line outlines extent of the A.D. 2011 lava flows (Caress et al., 2012). Red line highlights extent of our interpreted magma body at depth. Purple circles mark locations of hydrothermal vents on seafloor.
on July 28, 2014geology.gsapubs.orgDownloaded from
656 www.gsapubs.org | August 2014 | GEOLOGY
(1) The MCS data were first downward-continued to the seafloor (Arnulf et al., 2014a). This process unwraps the layer 2A/2B triplica-tion, moving the refracted energy in front of the seafloor reflection, providing information about near-surface velocities.
(2) A high-resolution velocity model was then obtained by performing elastic full waveform inversion (FWI) (Arnulf et al., 2012, 2014b) fo-cused on energy arriving ahead of the seafloor reflection. The strength of FWI is that it can use the full seismic wavefield to create a high-reso-lution velocity image of the crust, which can be used for geological interpretation.
(3) The FWI velocity models were then used to create reflection images using the sur-face MCS data and a pre-stack depth reverse time migration (RTM) algorithm (Baysal et al., 1983). The advantage of RTM imaging com-pared to standard migration techniques is that it has no dip limitation and handles extreme lateral velocity variations using all possible arrivals.
(4) Finally, the reflectivity and seismic en-ergy attributes of the RTM images were used to delineate the geometry (lateral extent and thick-ness) of the melt body, as well as other upper crustal structural features (Fig. 2; Fig. DR1 in the Data Repository).
Beneath Axial volcano, our velocity models (Figs. 2A and 2B; Figs. DR1A and DR1B) con-strain the fine-scale architecture of the shallow volcanic complex down to the top of the magma reservoir. Within this reservoir, the velocity structure is not fully constrained (and its pre-sumed low velocity is overestimated) because the FWI, as implemented, is restricted to seis-mic events that have been isolated ahead of the seafloor reflection in data downward-continued to a level ~1.5 km below the sea surface. In this volcanic setting, the maximum penetration of layer 2A/2B refraction event recorded on a 6-km-long streamer is ~1.25 km. Any changes in velocities below this level are manifested primarily in amplitude variation with offset (AVO) patterns of the magma chamber reflec-tions, but these patterns are mainly sensitive to the impedance contrast at the reflection point (Gauthier et al., 1986) and do not fully constrain the large-scale background velocity. Nonethe-less, the high resolution and fidelity of the FWI models of the upper ~1.5 km, which capture the largest velocity variations, allow the creation of geometrically accurate RTM images of the deeper magmatic system (Figs. 2 and 3; Figs. DR1 and DR2).
RESULTS AND DISCUSSION
Geometry of the Magma Reservoir Beneath Axial Volcano
Our RTM images (Figs. 2 and 3; Figs. DR1C and DR1D) reveal a geometrically complex magma reservoir underlying the caldera and ex-
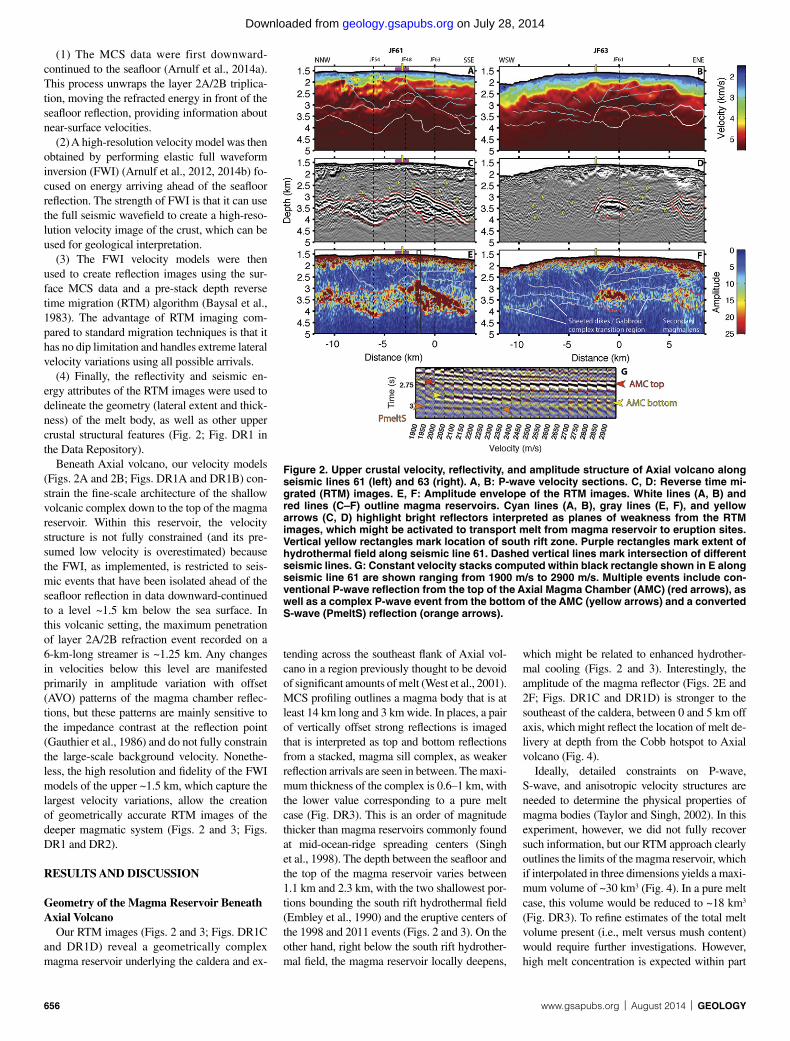
tending across the southeast flank of Axial vol-cano in a region previously thought to be devoid of significant amounts of melt (West et al., 2001). MCS profiling outlines a magma body that is at least 14 km long and 3 km wide. In places, a pair of vertically offset strong reflections is imaged that is interpreted as top and bottom reflections from a stacked, magma sill complex, as weaker reflection arrivals are seen in between. The maxi-mum thickness of the complex is 0.6–1 km, with the lower value corresponding to a pure melt case (Fig. DR3). This is an order of magnitude thicker than magma reservoirs commonly found at mid-ocean-ridge spreading centers (Singh et al., 1998). The depth between the seafloor and the top of the magma reservoir varies between 1.1 km and 2.3 km, with the two shallowest por-tions bounding the south rift hydrothermal field (Embley et al., 1990) and the eruptive centers of the 1998 and 2011 events (Figs. 2 and 3). On the other hand, right below the south rift hydrother-mal field, the magma reservoir locally deepens,
which might be related to enhanced hydrother-mal cooling (Figs. 2 and 3). Interestingly, the amplitude of the magma reflector (Figs. 2E and 2F; Figs. DR1C and DR1D) is stronger to the southeast of the caldera, between 0 and 5 km off axis, which might reflect the location of melt de-livery at depth from the Cobb hotspot to Axial volcano (Fig. 4).
Ideally, detailed constraints on P-wave, S-wave, and anisotropic velocity structures are needed to determine the physical properties of magma bodies (Taylor and Singh, 2002). In this experiment, however, we did not fully recover such information, but our RTM approach clearly outlines the limits of the magma reservoir, which if interpolated in three dimensions yields a maxi-mum volume of ~30 km3 (Fig. 4). In a pure melt case, this volume would be reduced to ~18 km3 (Fig. DR3). To refine estimates of the total melt volume present (i.e., melt versus mush content) would require further investigations. However, high melt concentration is expected within part
Figure 2. Upper crustal velocity, reflectivity, and amplitude structure of Axial volcano along seismic lines 61 (left) and 63 (right). A, B: P-wave velocity sections. C, D: Reverse time mi-grated (RTM) images. E, F: Amplitude envelope of the RTM images. White lines (A, B) and red lines (C–F) outline magma reservoirs. Cyan lines (A, B), gray lines (E, F), and yellow arrows (C, D) highlight bright reflectors interpreted as planes of weakness from the RTM images, which might be activated to transport melt from magma reservoir to eruption sites. Vertical yellow rectangles mark location of south rift zone. Purple rectangles mark extent of hydrothermal field along seismic line 61. Dashed vertical lines mark intersection of different seismic lines. G: Constant velocity stacks computed within black rectangle shown in E along seismic line 61 are shown ranging from 1900 m/s to 2900 m/s. Multiple events include con-ventional P-wave reflection from the top of the Axial Magma Chamber (AMC) (red arrows), as well as a complex P-wave event from the bottom of the AMC (yellow arrows) and a converted S-wave (PmeltS) reflection (orange arrows).
on July 28, 2014geology.gsapubs.orgDownloaded from
GEOLOGY | August 2014 | www.gsapubs.org 657
of this reservoir, especially the southeastern sec-tor where the strength of the magma chamber reflection, along with its AVO characteristics and the presence of a coherent P- to S-wave con-version (PmeltS reflection), suggest both high im pedance contrasts at, and negligible S-wave velocity (i.e., melt with disconnected crystals) within, the top of the magma chamber (Figs. 2E–2G; Figs. DR1 and DR4). The significant travel-time delays (~0.5 s) of first-arrival Pg phases refracting through and below the magma reser-voir in the previous OBS experiment (West et al., 2001) also suggest high melt concentration. Most of this traveltime delay now accumulates within the smaller 18–30 km3 reservoir imaged here, as opposed to the much larger reservoir (250 km3) estimated from the OBS study. In fact, simple estimations of a one-way vertical delay through a 0.6–1-km-thick magma body could account for 0.16–0.33 s; similarly, 0.06–0.1 s might be explained by the low-velocity lavas
present in the subsiding caldera, while the rest of this traveltime delay is likely explained by three-dimensional bathymetry effects, as well as a probable low-velocity region lying beneath the magma reservoir. During the 1998 and 2011 vol-canic eruptions of Axial volcano, ~0.1–0.2 km3 of magma was removed from the summit reser-voir, while an even smaller portion (~0.02–0.1 km3) was erupted at the surface (Fox et al., 2001; Caress et al., 2012; Chadwick et al., 2012). These volumes are more than two orders of magnitude smaller than the Axial volcano magma reservoir, suggesting that only a small fraction of melt is extracted during each eruptive sequence. Finally, our RTM images reveal several superimposed reflectors within the summit reservoir (Figs. 2 and 3; Fig. DR2), suggesting multiple imbricat-ed melt sills. Therefore, the presence of melt in the upper crust beneath Axial volcano is likely to be distributed in a complex system of dikes, sills, and conduits.
A Complex Magma Delivery System Revealed Beneath Axial Volcano
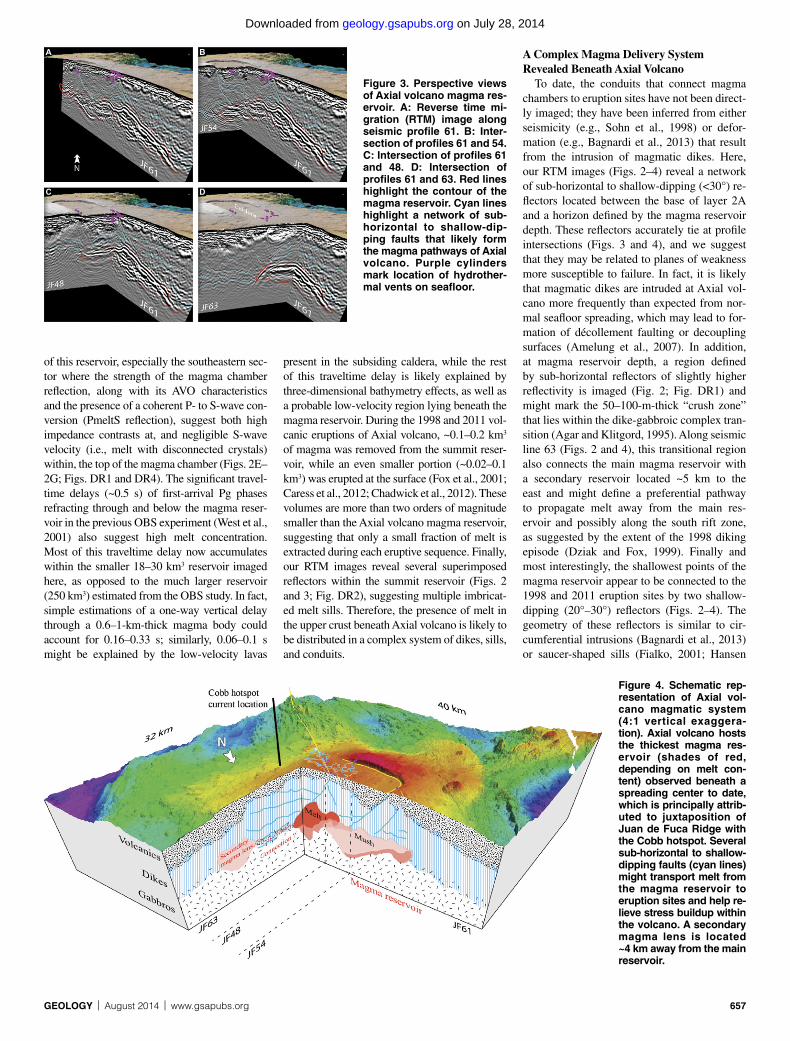
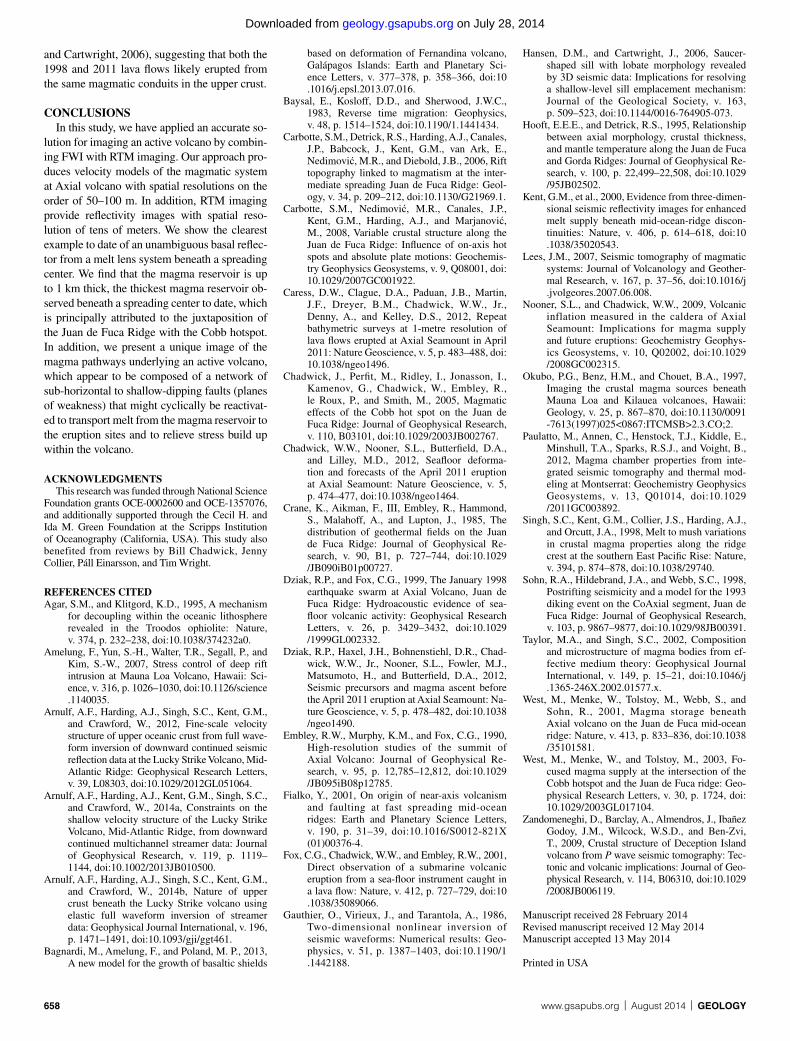
To date, the conduits that connect magma chambers to eruption sites have not been direct-ly imaged; they have been inferred from either seismicity (e.g., Sohn et al., 1998) or defor-ma tion (e.g., Bagnardi et al., 2013) that result from the intrusion of magmatic dikes. Here, our RTM images (Figs. 2–4) reveal a network of sub-horizontal to shallow-dipping (<30°) re-flectors located between the base of layer 2A and a horizon defined by the magma reservoir depth. These reflectors accurately tie at profile intersections (Figs. 3 and 4), and we suggest that they may be related to planes of weakness more susceptible to failure. In fact, it is likely that magmatic dikes are intruded at Axial vol-cano more frequently than expected from nor-mal seafloor spreading, which may lead to for-mation of décollement faulting or decoupling surfaces (Amelung et al., 2007). In addition, at magma reservoir depth, a region defined by sub-horizontal reflectors of slightly higher reflectivity is imaged (Fig. 2; Fig. DR1) and might mark the 50–100-m-thick “crush zone” that lies within the dike-gabbroic complex tran-sition (Agar and Klitgord, 1995). Along seismic line 63 (Figs. 2 and 4), this transitional region also connects the main magma reservoir with a secondary reservoir located ~5 km to the east and might define a preferential pathway to propagate melt away from the main res-ervoir and possibly along the south rift zone, as suggested by the extent of the 1998 diking episode (Dziak and Fox, 1999). Finally and most interestingly, the shallowest points of the magma reservoir appear to be connected to the 1998 and 2011 eruption sites by two shallow-dipping (20°–30°) reflectors (Figs. 2–4). The geometry of these reflectors is similar to cir-cumferential intrusions (Bagnardi et al., 2013) or saucer-shaped sills (Fialko, 2001; Hansen
A
C D
B
Figure 3. Perspective views of Axial volcano magma res-ervoir. A: Reverse time mi-gration (RTM) image along seismic profile 61. B: Inter-section of profiles 61 and 54. C: Intersection of profiles 61 and 48. D: Intersection of profiles 61 and 63. Red lines highlight the contour of the magma reservoir. Cyan lines highlight a network of sub-horizontal to shallow-dip-ping faults that likely form the magma pathways of Axial volcano. Purple cylinders mark location of hydrother-mal vents on seafloor.
Figure 4. Schematic rep-resentation of Axial vol-cano magmatic system (4:1 vertical exaggera-tion). Axial volcano hosts the thickest magma res-ervoir (shades of red, depending on melt con-tent) observed beneath a spreading center to date, which is principally attrib-uted to juxtaposition of Juan de Fuca Ridge with the Cobb hotspot. Several sub-horizontal to shallow-dipping faults (cyan lines) might transport melt from the magma reservoir to eruption sites and help re-lieve stress buildup within the volcano. A secondary magma lens is located ~4 km away from the main reservoir.
on July 28, 2014geology.gsapubs.orgDownloaded from
658 www.gsapubs.org | August 2014 | GEOLOGY
and Cartwright, 2006), suggesting that both the 1998 and 2011 lava flows likely erupted from the same magmatic conduits in the upper crust.
CONCLUSIONSIn this study, we have applied an accurate so-
lution for imaging an active volcano by combin-ing FWI with RTM imaging. Our approach pro-duces velocity models of the magmatic system at Axial volcano with spatial resolutions on the order of 50–100 m. In addition, RTM imaging provide reflectivity images with spatial reso-lution of tens of meters. We show the clearest example to date of an unambiguous basal reflec-tor from a melt lens system beneath a spreading center. We find that the magma reservoir is up to 1 km thick, the thickest magma reservoir ob-served beneath a spreading center to date, which is principally attributed to the juxtaposition of the Juan de Fuca Ridge with the Cobb hotspot. In addition, we present a unique image of the magma pathways underlying an active volcano, which appear to be composed of a network of sub-horizontal to shallow-dipping faults (planes of weakness) that might cyclically be reactivat-ed to transport melt from the magma reservoir to the eruption sites and to relieve stress build up within the volcano.
ACKNOWLEDGMENTSThis research was funded through National Science
Foundation grants OCE-0002600 and OCE-1357076, and additionally supported through the Cecil H. and Ida M. Green Foundation at the Scripps Institution of Oceanography (California, USA). This study also benefited from reviews by Bill Chadwick, Jenny Collier , Páll Einarsson, and Tim Wright.
REFERENCES CITEDAgar, S.M., and Klitgord, K.D., 1995, A mechanism
for decoupling within the oceanic lithosphere revealed in the Troodos ophiolite: Nature, v. 374, p. 232–238, doi: 10 .1038 /374232a0 .
Amelung, F., Yun, S.-H., Walter, T.R., Segall, P., and Kim, S.-W., 2007, Stress control of deep rift intrusion at Mauna Loa Volcano, Hawaii: Sci-ence, v. 316, p. 1026–1030, doi: 10 .1126 /science .1140035 .
Arnulf, A.F., Harding, A.J., Singh, S.C., Kent, G.M., and Crawford, W., 2012, Fine-scale velocity structure of upper oceanic crust from full wave-form inversion of downward continued seismic reflection data at the Lucky Strike Volcano, Mid-Atlantic Ridge: Geophysical Research Letters, v. 39, L08303, doi: 10 .1029 /2012GL051064 .
Arnulf, A.F., Harding, A.J., Kent, G.M., Singh, S.C., and Crawford, W., 2014a, Constraints on the shallow velocity structure of the Lucky Strike Volcano, Mid-Atlantic Ridge, from downward continued multichannel streamer data: Journal of Geophysical Research, v. 119, p. 1119–1144, doi: 10 .1002 /2013JB010500 .
Arnulf, A.F., Harding, A.J., Singh, S.C., Kent, G.M., and Crawford, W., 2014b, Nature of upper crust beneath the Lucky Strike volcano using elastic full waveform inversion of streamer data: Geophysical Journal International, v. 196, p. 1471–1491, doi: 10 .1093 /gji /ggt461 .
Bagnardi, M., Amelung, F., and Poland, M. P., 2013, A new model for the growth of basaltic shields
based on deformation of Fernandina volcano, Galápagos Islands: Earth and Planetary Sci-ence Letters, v. 377–378, p. 358–366, doi: 10 .1016 /j .epsl .2013 .07 .016 .
Baysal, E., Kosloff, D.D., and Sherwood, J.W.C., 1983, Reverse time migration: Geophysics, v. 48, p. 1514–1524, doi: 10 .1190 /1 .1441434 .
Carbotte, S.M., Detrick, R.S., Harding, A.J., Canales , J.P., Babcock, J., Kent, G.M., van Ark, E., Nedimović, M.R., and Diebold, J.B., 2006, Rift topography linked to magmatism at the inter-mediate spreading Juan de Fuca Ridge: Geol-ogy, v. 34, p. 209–212, doi: 10 .1130 /G21969 .1 .
Carbotte, S.M., Nedimović, M.R., Canales, J.P., Kent, G.M., Harding, A.J., and Marjanović, M., 2008, Variable crustal structure along the Juan de Fuca Ridge: Influence of on-axis hot spots and absolute plate motions: Geochemis-try Geophysics Geosystems, v. 9, Q08001, doi: 10 .1029 /2007GC001922 .
Caress, D.W., Clague, D.A., Paduan, J.B., Martin , J.F., Dreyer, B.M., Chadwick, W.W., Jr., Denny, A., and Kelley, D.S., 2012, Repeat bathymetric surveys at 1-metre resolution of lava flows erupted at Axial Seamount in April 2011: Nature Geoscience, v. 5, p. 483–488, doi: 10 .1038 /ngeo1496 .
Chadwick, J., Perfit, M., Ridley, I., Jonasson, I., Kamenov , G., Chadwick, W., Embley, R., le Roux, P., and Smith, M., 2005, Magmatic effects of the Cobb hot spot on the Juan de Fuca Ridge: Journal of Geophysical Research, v. 110, B03101, doi: 10 .1029 /2003JB002767 .
Chadwick, W.W., Nooner, S.L., Butterfield, D.A., and Lilley, M.D., 2012, Seafloor deforma-tion and forecasts of the April 2011 eruption at Axial Seamount: Nature Geoscience, v. 5, p. 474–477, doi: 10 .1038 /ngeo1464 .
Crane, K., Aikman, F., III, Embley, R., Hammond, S., Malahoff, A., and Lupton, J., 1985, The distribution of geothermal fields on the Juan de Fuca Ridge: Journal of Geophysical Re-search, v. 90, B1, p. 727–744, doi: 10 .1029 /JB090iB01p00727 .
Dziak, R.P., and Fox, C.G., 1999, The January 1998 earthquake swarm at Axial Volcano, Juan de Fuca Ridge: Hydroacoustic evidence of sea-floor volcanic activity: Geophysical Research Letters, v. 26, p. 3429–3432, doi: 10 .1029 /1999GL002332 .
Dziak, R.P., Haxel, J.H., Bohnenstiehl, D.R., Chad-wick, W.W., Jr., Nooner, S.L., Fowler, M.J., Matsumoto, H., and Butterfield, D.A., 2012, Seismic precursors and magma ascent before the April 2011 eruption at Axial Seamount: Na-ture Geoscience, v. 5, p. 478–482, doi: 10 .1038 /ngeo1490 .
Embley, R.W., Murphy, K.M., and Fox, C.G., 1990, High-resolution studies of the summit of Axial Volcano: Journal of Geophysical Re-search, v. 95, p. 12,785–12,812, doi: 10 .1029 /JB095iB08p12785 .
Fialko, Y., 2001, On origin of near-axis volcanism and faulting at fast spreading mid-ocean ridges: Earth and Planetary Science Letters, v. 190, p. 31–39, doi: 10 .1016 /S0012 -821X (01)00376 -4 .
Fox, C.G., Chadwick, W.W., and Embley, R.W., 2001, Direct observation of a submarine vol canic eruption from a sea-floor instrument caught in a lava flow: Nature, v. 412, p. 727–729, doi: 10 .1038 /35089066 .
Gauthier, O., Virieux, J., and Tarantola, A., 1986, Two-dimensional nonlinear inversion of seismic waveforms: Numerical results: Geo-physics, v. 51, p. 1387–1403, doi: 10 .1190 /1 .1442188 .
Hansen, D.M., and Cartwright, J., 2006, Saucer-shaped sill with lobate morphology revealed by 3D seismic data: Implications for resolving a shallow-level sill emplacement mechanism: Journal of the Geological Society, v. 163, p. 509–523, doi: 10 .1144 /0016 -764905 -073 .
Hooft, E.E.E., and Detrick, R.S., 1995, Relationship between axial morphology, crustal thickness, and mantle temperature along the Juan de Fuca and Gorda Ridges: Journal of Geophysical Re-search, v. 100, p. 22,499–22,508, doi: 10 .1029 /95JB02502 .
Kent, G.M., et al., 2000, Evidence from three-dimen-sional seismic reflectivity images for enhanced melt supply beneath mid-ocean-ridge discon-tinuities: Nature, v. 406, p. 614–618, doi: 10 .1038 /35020543 .
Lees, J.M., 2007, Seismic tomography of magmatic systems: Journal of Volcanology and Geother-mal Research, v. 167, p. 37–56, doi: 10 .1016 /j .jvolgeores .2007 .06 .008 .
Nooner, S.L., and Chadwick, W.W., 2009, Vol canic inflation measured in the caldera of Axial Seamount: Implications for magma supply and future eruptions: Geochemistry Geophys-ics Geosystems, v. 10, Q02002, doi: 10 .1029 /2008GC002315 .
Okubo, P.G., Benz, H.M., and Chouet, B.A., 1997, Imaging the crustal magma sources beneath Mauna Loa and Kilauea volcanoes, Hawaii: Geology, v. 25, p. 867–870, doi: 10 .1130 /0091 -7613 (1997)025 <0867: ITCMSB>2 .3 .CO;2 .
Paulatto, M., Annen, C., Henstock, T.J., Kiddle, E., Minshull, T.A., Sparks, R.S.J., and Voight, B., 2012, Magma chamber properties from inte-grated seismic tomography and thermal mod-eling at Montserrat: Geochemistry Geo physics Geosystems, v. 13, Q01014, doi: 10 .1029 /2011GC003892 .
Singh, S.C., Kent, G.M., Collier, J.S., Harding, A.J., and Orcutt, J.A., 1998, Melt to mush variations in crustal magma properties along the ridge crest at the southern East Pacific Rise: Nature, v. 394, p. 874–878, doi: 10 .1038 /29740 .
Sohn, R.A., Hildebrand, J.A., and Webb, S.C., 1998, Postrifting seismicity and a model for the 1993 diking event on the CoAxial segment, Juan de Fuca Ridge: Journal of Geophysical Research, v. 103, p. 9867–9877, doi: 10 .1029 /98JB00391 .
Taylor, M.A., and Singh, S.C., 2002, Composition and microstructure of magma bodies from ef-fective medium theory: Geophysical Journal International, v. 149, p. 15–21, doi: 10 .1046 /j .1365 -246X .2002 .01577 .x .
West, M., Menke, W., Tolstoy, M., Webb, S., and Sohn, R., 2001, Magma storage beneath Axial volcano on the Juan de Fuca mid-ocean ridge: Nature, v. 413, p. 833–836, doi: 10 .1038 /35101581 .
West, M., Menke, W., and Tolstoy, M., 2003, Fo-cused magma supply at the intersection of the Cobb hotspot and the Juan de Fuca ridge: Geo-physical Research Letters, v. 30, p. 1724, doi: 10 .1029 /2003GL017104 .
Zandomeneghi, D., Barclay, A., Almendros, J., Ibañez Godoy, J.M., Wilcock, W.S.D., and Ben-Zvi, T., 2009, Crustal structure of Deception Island volcano from P wave seismic tomography: Tec-tonic and volcanic implications: Journal of Geo-physical Research, v. 114, B06310, doi: 10 .1029 /2008JB006119 .
Manuscript received 28 February 2014 Revised manuscript received 12 May 2014 Manuscript accepted 13 May 2014
Printed in USA
on July 28, 2014geology.gsapubs.orgDownloaded from
GSA DATA REPOSITORY 2014243 Arnulf et al.
SUPPLEMENTARY MATERIAL
Data Analysis
Downward continuation (Berryhill, 1984; Arnulf et al., 2014) can be used to transform the MCS data to simulate a different acquisition geometry, for example, to move seismic source and receiver positions from the sea surface to a new datum at or near the seafloor, simulating an on-bottom refraction experiment. This process essentially unwraps the layer 2A/2B triplication, moving the refracted energy in front of the seafloor reflection. In this study, the downward continuation of both shots and receivers using the Kirchhoff integral formulation (Berryhill, 1984) created a simulated experiment 75 m above the seafloor.
Full Waveform Inversion (FWI) is used in iterative attempts to match synthetically calculated seismograms with observed waveforms. It is a data-driven form of analysis that leads to high-resolution imaging by extracting quantitative information from the seismograms. The inversion algorithm used in this study was originally developed by Tarantola (1986) and implements the 2D elastic wave equation using a staggered-grid finite difference scheme with second-order accuracy in time and fourth-order accuracy in space (Levander, 1988). Waveform inversion in this study was designed to principally targeted the energy related to P-wave refraction events and some wide-angle reflections present in the downward continued MCS data. We followed a multi-stage FWI strategy alternating between model updates, where we inverted simultaneously for Vp and Vs, and source updates. No attenuation was included in the modeling. Preprocessing of the field data was accomplished during the downward continuation stage. A seventh-order Butterworth band-pass filter with corner frequencies of 3 and 15 Hz was first applied to constrain the frequencies of the downward continued data to ones that satisfy the stability criterion of a 12.5 m finite-difference grid. Second, the observed signal was convolved by
(H being the Heaviside step function and t being the time) to better simulate a 2-D experiment and boost low frequencies with respect to high frequencies. Finally a predictive deconvolution filter was also designed to minimize the bubble pulse effect.
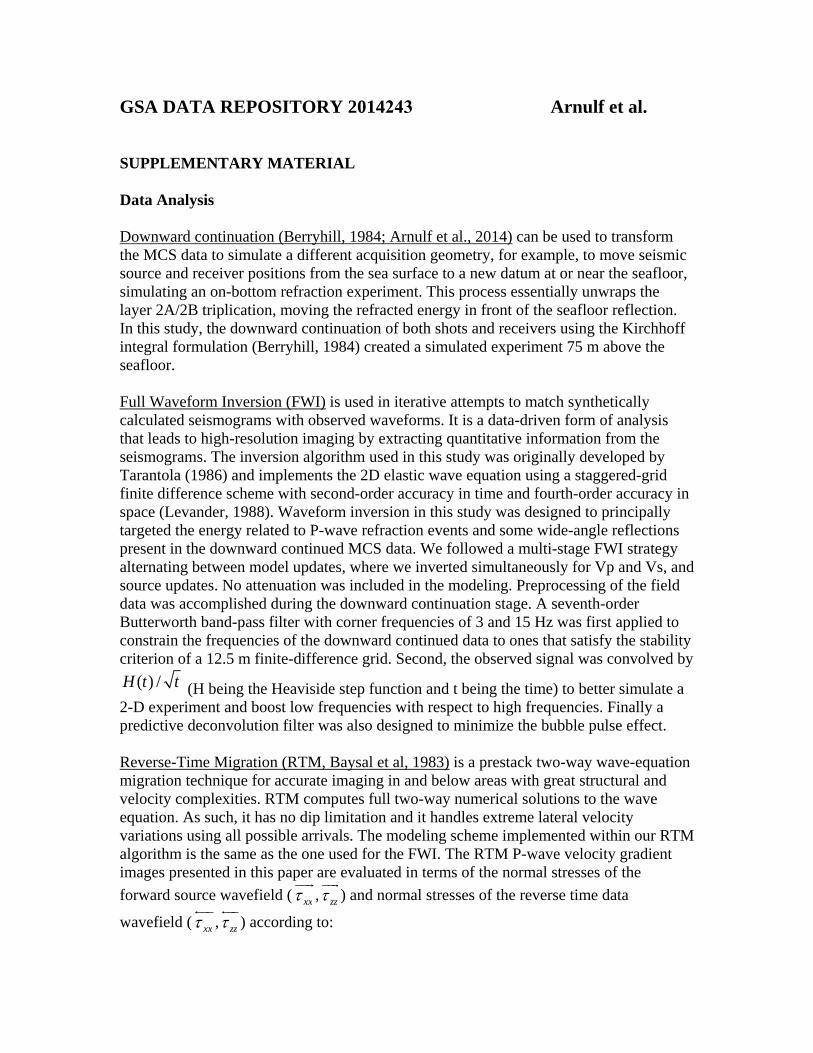
Reverse-Time Migration (RTM, Baysal et al, 1983) is a prestack two-way wave-equation migration technique for accurate imaging in and below areas with great structural and velocity complexities. RTM computes full two-way numerical solutions to the wave equation. As such, it has no dip limitation and it handles extreme lateral velocity variations using all possible arrivals. The modeling scheme implemented within our RTM algorithm is the same as the one used for the FWI. The RTM P-wave velocity gradient images presented in this paper are evaluated in terms of the normal stresses of the
forward source wavefield ( xx
, zz
) and normal stresses of the reverse time data
wavefield ( xx
, zz
) according to:
H (t) / t
RTM
2( )2 dt
0
T
shots ( xx
zz
)( xx
zz
), (see: Shipp and Singh, 2002),
where is the density, is the P-wave velocity, and are the Lamé parameters and the equation is integrated over time. Preprocessing of the sea surface field data included a
seventh-order Butterworth band-pass filter with corner frequencies of 3 and 30 Hz to constrain the frequencies of the sea surface data to ones that satisfy the stability criterion
of a 6.25 m finite-difference grid. Convolution using the function as well as a predictive deconvolution filter were also applied.
References Cited Arnulf, A.F., Harding, A.J., Kent, G.M., Singh, S.C., and Crawford, W., 2014,
Constraints on the shallow velocity structure of the Lucky Strike Volcano, Mid-Atlantic Ridge, from downward continued multichannel streamer data: J. Geophys. Res., in press.
Baysal, E., Kosloff, D.D., 1983, and Sherwood, J.W.C. Reverse time migration:
Geophysics, v. 48, p. 1514-1524. Berryhill, J.R., 1984, Wave�equation datuming before stack: Geophysics, v. 49, p.
2064–2066, doi:10.1190/1.1441620. Levander, A.R., 1988, Fourth-order finite-difference P-SV seismograms: Geophysics, v.
53, p. 1425–1436. Shipp, R.M., and Singh, S.C., 2002, Two-dimensional full wavefield inversion of wide-
aperture marine seismic streamer data, v. 151, p. 325-344. Tarantola, A., 1986, A strategy for nonlinear elastic inversion of seismic reflection data:
Geophysics, v. 51, p. 1893-1903.
H (t) / t
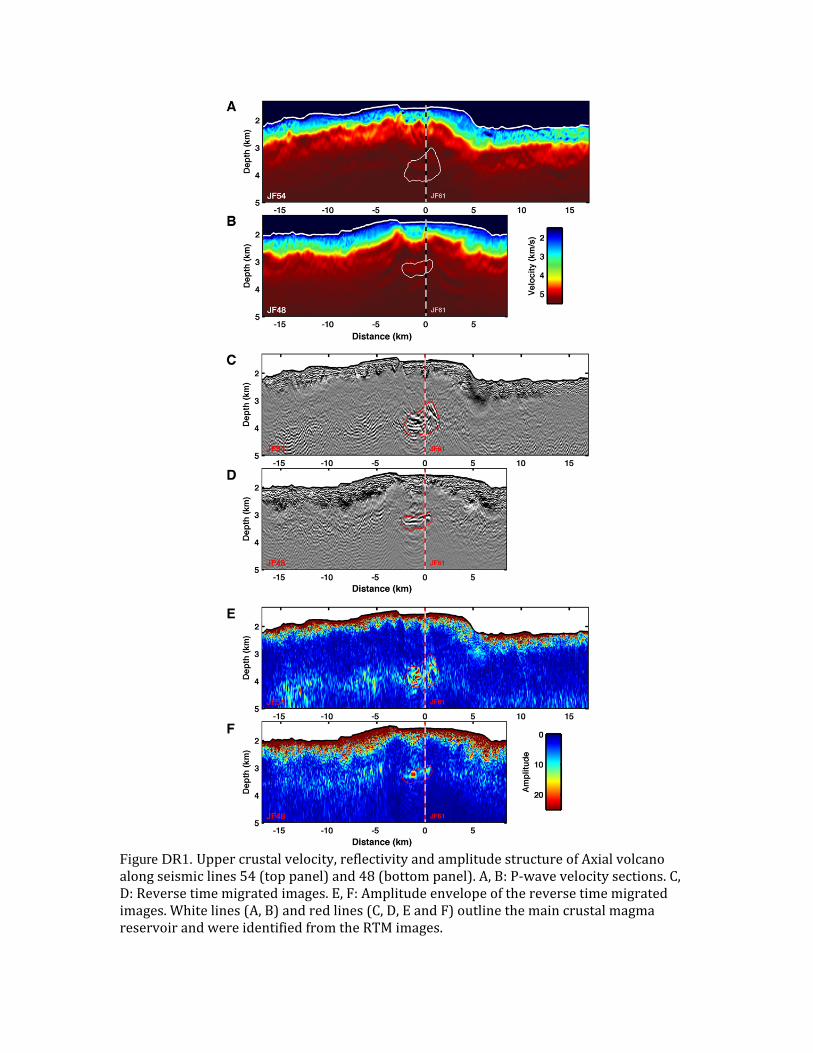
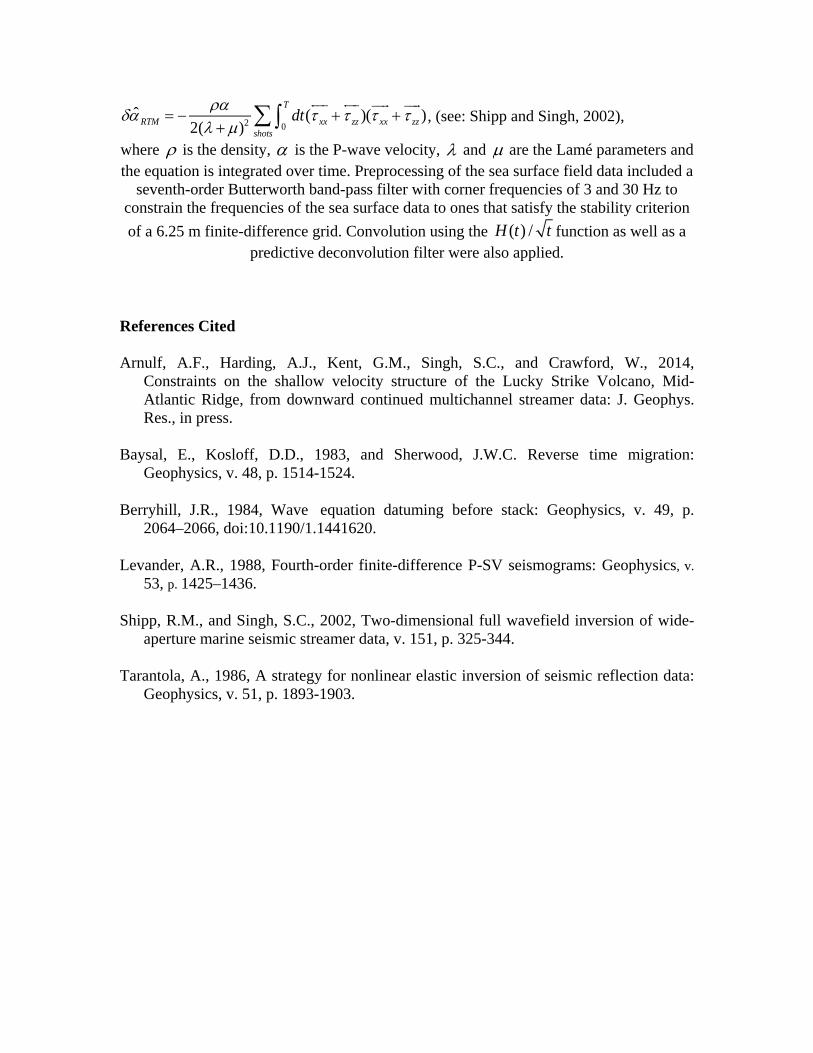
Figure DR1. Uppercrustalvelocity,reflectivityandamplitudestructureofAxialvolcanoalongseismiclines54(toppanel)and48(bottompanel).A,B:P‐wavevelocitysections.C,D:Reversetimemigratedimages.E,F:Amplitudeenvelopeofthereversetimemigratedimages.Whitelines(A,B)andredlines(C,D,EandF)outlinethemaincrustalmagmareservoirandwereidentifiedfromtheRTMimages.
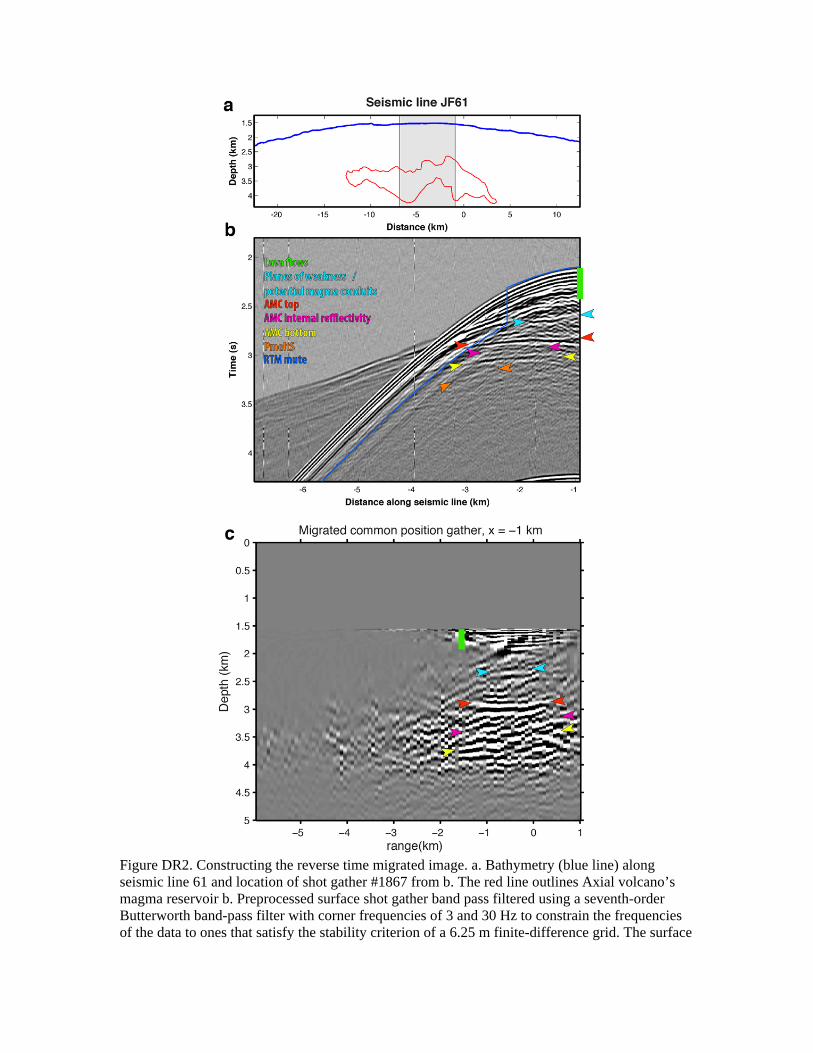
Figure DR2. Constructing the reverse time migrated image. a. Bathymetry (blue line) along seismic line 61 and location of shot gather #1867 from b. The red line outlines Axial volcano’s magma reservoir b. Preprocessed surface shot gather band pass filtered using a seventh-order Butterworth band-pass filter with corner frequencies of 3 and 30 Hz to constrain the frequencies of the data to ones that satisfy the stability criterion of a 6.25 m finite-difference grid. The surface
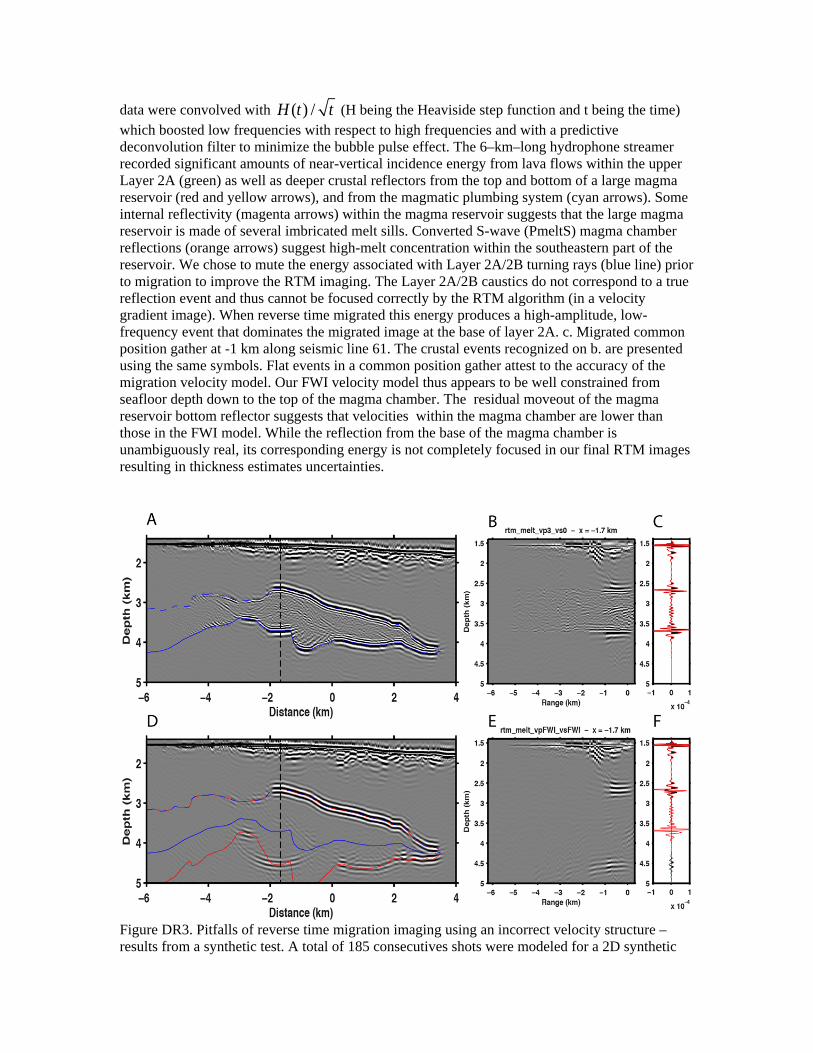
data were convolved with H (t) / t (H being the Heaviside step function and t being the time) which boosted low frequencies with respect to high frequencies and with a predictive deconvolution filter to minimize the bubble pulse effect. The 6–km–long hydrophone streamer recorded significant amounts of near-vertical incidence energy from lava flows within the upper Layer 2A (green) as well as deeper crustal reflectors from the top and bottom of a large magma reservoir (red and yellow arrows), and from the magmatic plumbing system (cyan arrows). Some internal reflectivity (magenta arrows) within the magma reservoir suggests that the large magma reservoir is made of several imbricated melt sills. Converted S-wave (PmeltS) magma chamber reflections (orange arrows) suggest high-melt concentration within the southeastern part of the reservoir. We chose to mute the energy associated with Layer 2A/2B turning rays (blue line) prior to migration to improve the RTM imaging. The Layer 2A/2B caustics do not correspond to a true reflection event and thus cannot be focused correctly by the RTM algorithm (in a velocity gradient image). When reverse time migrated this energy produces a high-amplitude, low-frequency event that dominates the migrated image at the base of layer 2A. c. Migrated common position gather at -1 km along seismic line 61. The crustal events recognized on b. are presented using the same symbols. Flat events in a common position gather attest to the accuracy of the migration velocity model. Our FWI velocity model thus appears to be well constrained from seafloor depth down to the top of the magma chamber. The residual moveout of the magma reservoir bottom reflector suggests that velocities within the magma chamber are lower than those in the FWI model. While the reflection from the base of the magma chamber is unambiguously real, its corresponding energy is not completely focused in our final RTM images resulting in thickness estimates uncertainties.
Figure DR3. Pitfalls of reverse time migration imaging using an incorrect velocity structure –results from a synthetic test. A total of 185 consecutives shots were modeled for a 2D synthetic
model created from the final FWI velocity structure along seismic line 61. A pure melt magma chamber (Vp = 3 km/s, Vs = 0 km/s) was incorporated in the model creating strong top and bottom reflection arrivals from the magma reservoir. A. RTM section created using correct (“known”) background velocity structures. The blue line outlines the magma chamber. The dashed black vertical line shows the location of the common position gather shown in B. B. Migrated common position gather at -1.7 km along the seismic line. Most of the energy contributing to the magma chamber top and bottom reflectors is from near vertical incident angle (range between -1.5 km and 0 km). Both these reflectors are flat, because the migration velocity model is correct. C. The output created by summing data from the full offset range of the common position gather in B shown as a variable area plot and as a red line. D. RTM section created using the FWI model with incorrect velocities within the magma chamber. The top reflector is well imaged but the bottom reflector is not due to the higher velocities and the thickness of the magma reservoir. The red line is the predicted bottom reflector from traveltime delays of normal incident raypaths. E. Same as B. except for the FWI velocity model. While the upper magma chamber reflector is still well migrated, the residual moveout of the bottom reflection suggests incorrect magma chamber velocities. F. The variable area plot was created by summing the full offset range of the common position gather in E. while the red wiggle line is the response from B using the correct velocity structures.
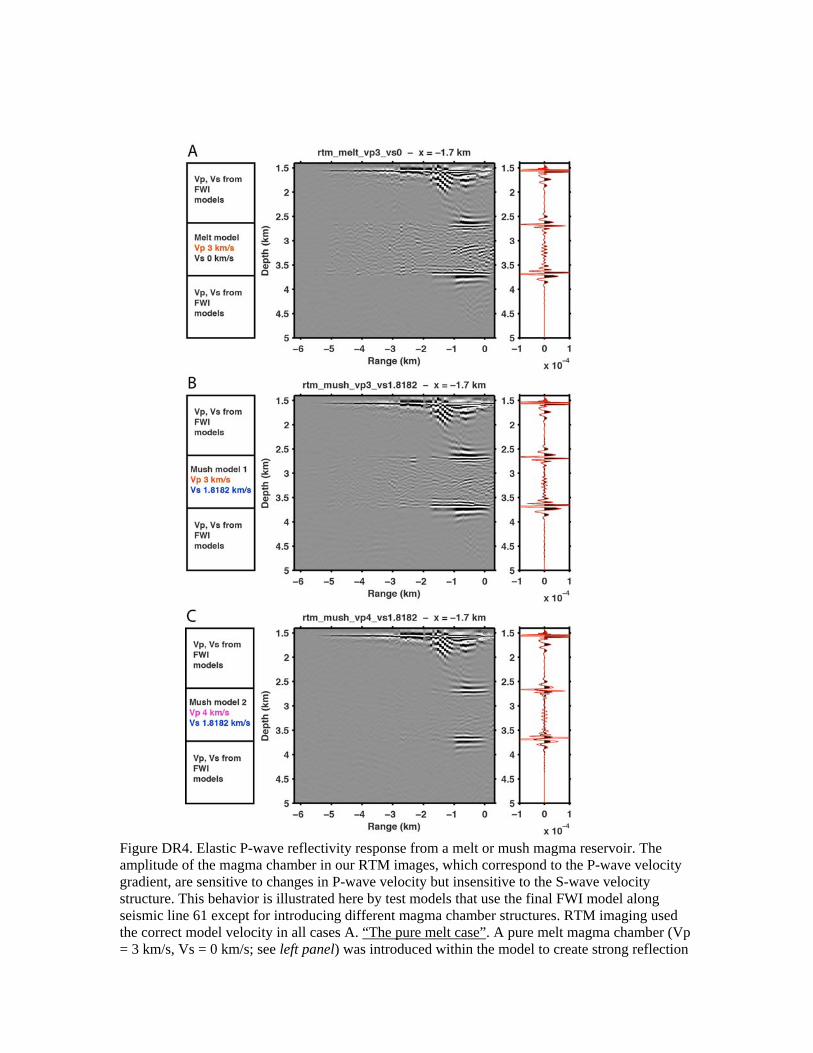
Figure DR4. Elastic P-wave reflectivity response from a melt or mush magma reservoir. The amplitude of the magma chamber in our RTM images, which correspond to the P-wave velocity gradient, are sensitive to changes in P-wave velocity but insensitive to the S-wave velocity structure. This behavior is illustrated here by test models that use the final FWI model along seismic line 61 except for introducing different magma chamber structures. RTM imaging used the correct model velocity in all cases A. “The pure melt case”. A pure melt magma chamber (Vp = 3 km/s, Vs = 0 km/s; see left panel) was introduced within the model to create strong reflection
arrivals from the top and bottom limits of the magma reservoir. Middle panel: Migrated common position gather at -1.7 km. Right panel: The elastic P-wave reflectivity response of the “pure melt”created by summing the all offsets of the common position gather, black wiggle-variable area plot and red line. B. “Mush case #1”. Similar to A except for a mush magma reservoir (Vp = 3 km/s, Vs = 1.8182 km/s; see left panel). Right panel: The black wiggle-variable area plot is the elastic P-wave reflectivity response of the “mush #1”magma reservoir, while red line is the response of the “melt”magma reservoir from A. C. “Mush case #2”. Similar to A & B except for a mush magma reservoir (Vp = 4 km/s, Vs = 1.8182 km/s; see left panel). Right panel: The black wiggle-variable area plot is the elastic P-wave reflectivity response of the “mush #2”magma reservoir while the red line is again the “melt”magma reservoir from A for comparison. The P-wave reflectivity response of the “pure melt case” and “mush case #1”, which differ only in their S-wave velocity structures, are almost identical, but the response for “mush case #2” has lower amplitude than “mush case #2” because of the smaller P-wave velocity jump.