Embed Size (px)
Citation preview

1
Fungal endophytic communities in grapevines (Vitis vinifera L.) respond to crop management 1
2
Michael Pancher, Marco Ceol, Paola Elisa Corneo, Claudia Maria Oliveira Longa, Sohail Yousaf, Ilaria 3
Pertot, Andrea Campisano∗. Sustainable Agro-ecosystems and Bioresources Department, IASMA 4
Research and Innovation Centre, Fondazione Edmund Mach, Via E. Mach 1, 38010 San Michele 5
all'Adige, (TN), Italy. 6
Running title: fungal endophytes diversity in grapevine 7
8
∗ Corresponding author. Andrea Campisano, Fondazione Edmund Mach, via E.Mach, 38010, S. Michele all’Adige, (TN), Italy. Phone +39 0461615511, Fax +39 0461615500. [email protected]
Copyright © 2012, American Society for Microbiology. All Rights Reserved.Appl. Environ. Microbiol. doi:10.1128/AEM.07655-11 AEM Accepts, published online ahead of print on 6 April 2012
on August 13, 2020 by guest
http://aem.asm
.org/D
ownloaded from

2
Abstract 9
We studied the distribution of fungal endophytes of grapevine (V. vinifera L.) plants in a subalpine area 10
of Northern Italy where viticulture is of high economic relevance. We adopted both cultivation-based 11
and cultivation-independent approaches, to address how various anthropic and non-anthropic factors 12
shape microbial communities. Grapevine stems were harvested from several locations considering 13
organic and integrated pest management (IPM) and from cultivars Merlot and Chardonnay. Cultivable 14
fungi were isolated and identified by ITS sequence analysis, using a novel colony-PCR method, to 15
amplify DNA from fungal specimens. The composition of fungal communities was assessed through a 16
cultivation-independent approach: Automated Ribosomal Intergenic Spacer Analysis (ARISA). 17
Multivariate statistical analysis of both culture-dependent and culture-independent datasets was 18
convergent and indicated that fungal endophytic communities in grapevines from organically managed 19
farms were different from those from IPM farms. Fungal communities in plants of cv. Merlot and cv. 20
Chardonnay overlapped when analysed using culture-dependent approaches, but could be partially 21
resolved using ARISA fingerprinting. 22
23
Introduction 24
Microorganisms dwelling asymptomatically within plant tissues (endophytes) have been found in all 25
studied plants. Endophytes can have either a mutualistic or a parasitic lifestyle; under some conditions, 26
mutualists may switch to pathogens upon perception of plant-borne or environmental conditions (50). 27
Known endophytes include viruses, phytoplasmas, bacteria and fungi. 28
The study of plant-fungi interaction has long focused on pathogenic interaction. DNA-based 29
approaches have been extensively employed for fingerprinting, tracking and identifying plant 30
pathogenic fungi (46, 61, 63), but fewer studies address non-pathogenic fungal communities. Fungal 31
endophytes have been investigated for their role as plant growth promoters, biocontrol agents (43), 32
on August 13, 2020 by guest
http://aem.asm
.org/D
ownloaded from

3
enhancers of the plant’s bioremediation potential (55) and producers of novel secondary metabolites 33
(75) or enzymes (51). However, the relation between communities of endophytic fungi and host plants 34
is still poorly studied, and as of yet far from being fully understood. In grapevines, recent studies have 35
shed some light upon the bacterial endophytic communities (13, 14, 20, 47, 72), while investigations on 36
fungal communities have been rare and often limited to culture-dependent methods (20, 30, 43, 71). 37
Furthermore, research has mainly focused on subsoil plant-microbe associations (36, 65). 38
Several factors may affect plant-associated microbial communities, e.g. anthropic factors (52, 53), plant 39
physiology (34), the environment (57, 74) and pathogen infections (4, 14, 15). A shift in the 40
composition of microbial communities associated with plants can be driven by genetic and 41
physiological diversities, e.g. between different cultivated varieties (1, 42, 47). In contrast to grasses 42
and annual plants, fewer attempts have been made in woody plants to correlate fungal endophytic 43
communities with cultivar (17, 30). To our knowledge, only a handful of studies attempt to link organic 44
management or the use of antifungal treatments with modifications in the microbiota in woody plants 45
(31, 54, 60). 46
When attempting to identify a high number of isolated fungi, as in environmental studies, isolation and 47
purification of DNA is both time-consuming and expensive, but required for PCR amplification of 48
taxonomically relevant DNA regions. Direct colony-PCR of fungal isolates is usually avoided since 49
DNA availability and purity in heat-lysed fungi is frequently insufficient for the reaction (7). 50
Furthermore, growth media often contain contaminants inhibiting PCR. Fungal metabolites inhibiting 51
DNA polymerase and resilience of fungal spores or conidia to lysis are among the causes of unreliable 52
or poor amplification when PCR is performed directly on fungal colonies (28, 35). Previous studies 53
attempting to improve speed and quality of PCR amplification directly from fungi have several 54
methodological limitations. Examples include dependence on DNA extraction (28, 41, 49, 56, 68), 55
on August 13, 2020 by guest
http://aem.asm
.org/D
ownloaded from
4
validation over a limited range of taxa (2, 39, 70) and the use of expensive, proprietary chemicals (2, 56
18). 57
Changes in the composition of plant-associated microbial communities have often been associated with 58
plant physiology (9), health (14) and environmental perturbances (11). In this work we present a study 59
of fungal endophytic communities in grapevines using both a cultivation-based and a cultivation-60
independent approach. For the first time we applied ARISA to the study of fungal endophytic 61
communities in grapevines comparing organic and integrated pest management and investigating the 62
cultivar effect. Fungal ARISA is a community fingerprinting method based on the analysis of length 63
polymorphism of the nuclear ribosomal DNA (rDNA) region containing the two internal transcribed 64
spacers (ITS) and the 5.8S rRNA gene. It was chosen over T-RFLP for the higher accuracy in 65
describing the microbial community’s diversity (22), as well as for the ease of use and the precision 66
that capillary electrophoresis offers (21). Furthermore, we report a novel colony-PCR method for the 67
rapid identification of fungal isolates, which is both inexpensive and DNA isolation-independent. This 68
method was used to PCR amplify the ITS regions and identify all isolates obtained in this study. 69
70
Materials and Methods 71
Study sites 72
To minimise environmental variability between samples from different areas, we followed strict criteria 73
for selection. Communities were sampled only from lateral vine stocks of field grapevines in a 74
restricted geographic region (Trentino, Northern Italy), with medium sandy, calcareous soils (48) 75
characterized by humid, temperate, oceanic climate particularly in pre-alpine areas, with rainfalls 76
maxima in spring and autumn (16). Seven locations and a total of 28 vineyards were selected. In each 77
location four vineyards were sampled, representing each of the four treatments: organic and integrated 78
on August 13, 2020 by guest
http://aem.asm
.org/D
ownloaded from

5
pest management (IPM) and cultivars Chardonnay and Merlot. Coordinates for sampling sites are listed 79
in table 1. 80
81
Sample collection and plant material 82
A total of 28 vineyards were sampled (table 1). Samples were taken during the fall of 2010, from 83
October 27th to November 11th. In each vineyard, four plants for each treatment were randomly 84
selected. One lateral vine shoot was cut from each plant using pruning scissors. After removing the 85
leaves, stems were transferred in a refrigerated basket for transportation for up to 6 h and stored at 4°C 86
for up to one day. 87
88
Isolation of endophytic fungi 89
Lateral stems (1 to 2 m long) were cut to 20 cm-long fragments in the lab. These cuttings were surface 90
disinfected by a succession of 2 min immersions, conducted under sterile laminar air flow, in 90% 91
ethanol, 2.5% sodium hypochlorite solution, 70% ethanol and sterile distilled water. To test the efficacy 92
of this method, random surface-disinfected stems were repeatedly rolled on nutrient broth (NB, Oxoid, 93
UK) or malt extract agar vegitone (MEA-V, Fluka, Sigma-Aldrich Switzerland) petri dishes and 94
incubated for two weeks at 20-25°C to confirm the absence of any microbial growth. After disinfection, 95
stems were cut into 0.5 cm sections and placed on MEA-V with the vascular vessels facing the 96
medium. The plates were incubated for 7-15 days and all morphologically different colonies were 97
isolated. Mycelium from isolated colonies was freeze-dried and stored at room temperature. 98
99
Extraction-independent PCR amplification of DNA from cultivable isolates 100
Only a minor fraction of all the morphologically different fungal isolates was identified, based on 101
microscopic analysis of hyphae and conidia morphology, using available morphological keys (8). 102
on August 13, 2020 by guest
http://aem.asm
.org/D
ownloaded from

6
Therefore we developed a new method for identification. The method was validated on a wide range of 103
fungal taxa chosen from the culture collection at our institute (Fondazione Edmund Mach, S. Michele 104
all’Adige, TN, Italy), from other collections, or from the isolates of this study that were already 105
identified based on morphological traits (table 2). ITS sequences of all isolates were PCR amplified 106
using either or both ITS1 (TCCGTAGGTGAACCTGCGG) -ITS4 (TCCTCCGCTTATTGATATGC) 107
(73) and nu nu-SSU-0817-59 (TTAGCATGGAATAATRRAATAGGA)-nu-SSU-1196-39 108
(TCTGGACCTGGTGAGTTTCC) (10) primer pairs (Sigma-Aldrich) and the two protocols described 109
below. Henceforth we will refer to these two protocols as Freeze-Dried Mycelium (FDM) and Actively 110
Growing Mycelium (AGM). In FDM freeze-dried fungal material was lysed mechanically using two 111
sterile stainless steel 5/32” ball bearings and shaken using a tissue lyser (Retsch, type MM200, 112
Germany) for 2 min at maximum frequency (25 Hertz) to obtain a fine powder. We stored the 113
pulverised mycelium without loss of PCR efficacy for at least 2 months (data not shown). For PCR, 114
approximately 1 mg of this powder was suspended in 1 ml of sterile distilled water and mixed by 115
vortexing for 20 s. In AGM, a 0.5 cm2 plug including fresh mycelium and the agar medium underneath 116
was frozen at -80°C. For method validation purposes, samples were harvested from either small fungal 117
colonies (0.5 – 1 cm2 diameter) or from the actively growing edge of larger colonies (3 – 6 cm2 118
diameter). Henceforth these two stages will be referred to as early and late, respectively. Lysis of the 119
frozen samples was achieved using the same procedure described for FDM, after which 1 ml of sterile 120
distilled water was added to the lysate and mixed by vortexing. The diluted AGM and FDM lysates 121
were centrifuged 5 min at full speed (16,000 rcf) on a tabletop centrifuge (5415R Eppendorf, Germany) 122
to sediment insoluble debris, including non-lysed cells, agar and cell wall fragments. One microlitre of 123
the supernatant was used as template in a 25 μl PCR reaction, including 1×Dream Taq Green PCR 124
Master Mix (Fermentas, Lithuania), and 0.2 μM of each primer. PCR was performed for 35 cycles 125
using the appropriate protocols to each primer pair (10, 73). PCR amplified DNA was purified using 126
on August 13, 2020 by guest
http://aem.asm
.org/D
ownloaded from

7
Exo-SAP (Euroclone S.p.A., Italy) following the manufacturer’s instructions and sequenced using Big 127
Dye terminator v3.1. Sequence analysis of the amplicons was performed by BLASTN comparison 128
using the NCBI database’s best hit (58) to confirm the identity of selected strains. Whenever possible, 129
sequences were identified to the species level. All fungal sequences were at least 98% identical to the 130
best hit in the NCBI database. This value was considered sufficiently robust for species identification 131
(66). For some isolates, when ITS sequence was not discriminant at the species level, the isolates were 132
assigned to the corresponding genus. 133
Once validated, the method was used to identify the unidentified isolates of this study. Presence or 134
absence of OTUs was scored for each plant sample. 135
136
DNA extraction, PCR and ARISA of total fungi 137
For cultivation-independent analysis of fungal communities, total DNA extraction was performed. 138
Plant stems were surface disinfected as described above. Bark was carefully removed to avoid 139
contamination with DNA from nonviable cells, which may persist on the surface after disinfection. 140
Disc sections of lateral shoots used for microorganism isolation were frozen in liquid nitrogen and 141
pulverised in sterile steel jars using a tissue lyser. DNA was isolated from 200 mg of ground specimens 142
using the CTAB method as previously reported (24). Briefly, pulverised material was incubated 30 min 143
at 65°C in pre-warmed lysis buffer and extracted using chloroform-isoamylalcohol (24:1). The gDNA 144
was precipitated using isopropanol and the pellet washed with 70% ethanol. 145
The 18S-28S ITS of the fungal rDNA was amplified using the primer set FAM (carboxy-fluorescein) 146
labelled 1406f (TGYACACACCGCCCGT) (27) and ITS2 (GCTGCGTTCTTCATCGATGC) (73). 147
The 25 μl PCR reaction mix contained 1×Dream Taq Green PCR Master Mix, 1 μl dimethyl sulfoxide 148
(DMSO), 25 μg bovine serum albumin (BSA) and 0.2 μM of each primer. PCR was performed using 149
an initial denaturation step at 95°C for 5 min, 31 cycles as follows: denaturation 95°C for 40 s, 150
on August 13, 2020 by guest
http://aem.asm
.org/D
ownloaded from

8
annealing 54°C for 40 s, elongation 72°C for 1 min, followed by a final elongation at 72°C for 10 min. 151
PCR reactions were performed in a PTC-200 thermal cycler (MJ Research Inc, USA). The PCR 152
product was checked on 1% agarose gel and 1 μl of the product was mixed with 8.8 μl of Hi-DiTM 153
formamide (Applied Biosystem, CA, USA) and 0.2 μl of GeneScanTM 1200 LIZ® size standard 154
(Applied Biosystems), denatured for 5 minutes at 95°C and then cooled in ice before loading. 155
Denatured amplicons were loaded on an ABI Prism 3130xl Genetic analyzer (Applied Biosystems) 156
equipped with sixteen 50 cm capillaries filled with POP 7TM polymer (Applied Biosystems). Run 157
conditions were set to 8.5 kV and 60°C, and total run time was 6700 s. 158
Electropherograms were analysed using the Gene Mapper 4.0 software, using the normalization inside 159
the experiment, fluorescence threshold was set at 50 relative fluorescence units (RFU). We found and 160
scored for analysis fragments in the size range of 100-800 bp in length. Peak binning was set to 1.5 bp 161
and manual correction was applied where peak shifts occurred. The tables of presence/absence and 162
fluorescence associated to each peak were exported in spreadsheets for subsequent analysis. 163
164
Multivariate data analysis 165
ARISA electropherograms of individual plant-associated communities were transformed in a binary 166
presence matrix (scoring 1 for presence or 0 for absence), and each peak scored. Matrices generated 167
both through identification of cultivable isolates and through ARISA peak scoring, were then 168
transformed by adding presence scores together for each of the four biological replicates. The 169
frequency score obtained thus ranged from 0 to 4. Data matrices were analysed by PCA (principal 170
component analysis) and CCA (canonical correspondence analysis, 40) using the PAST software (32). 171
PCA and CCA are similar procedures for finding variables (called components) which are linear 172
combinations of all the variation contained by the dataset. The reduction of several variables to two 173
provides the advantage of making complex dataset plottable, while preserving much of the variance in 174
on August 13, 2020 by guest
http://aem.asm
.org/D
ownloaded from

9
the data. In addition, it allows the generation of hypotheses regarding components and the controlled 175
variables in the dataset. As a correspondence analysis method, CCA is designed for counted data 176
(integers). In CCA, the axes are linear combinations of the environmental variables. CCA is 177
specifically suited to data where the gradient in environmental variables is known a priori and 178
abundance (or presence/absences) is considered to be a response to this gradient (32). 179
A dataset was obtained using linear combinations of the cultivated fungi and ARISA fingerprints 180
matrices (henceforth referred to as the combined dataset). Samples grouping according to treatments 181
(organic/integrated management, cv. Merlot/Chardonnay) and across the seven areas of sampling was 182
also studied by one-way ANOSIM (19) and one-way NPMANOVA (3). One-way ANOSIM (ANalysis 183
Of Similarities) and NPMANOVA (Non-Parametric MANOVA) are non-parametric tests that analyse 184
the significance of distance measures among multivariate groups (32). 185
186
Results 187
Identification of fungi by colony PCR 188
In the method validation, PCR amplification using FDM as template was successful for 36 out of 40 189
samples (90%), using either the ITS1/ITS4 or the nu-SSU-0817-59/nu-SSU-1196-39 primer pair. The 190
four fungi recalcitrant to PCR amplification using both primer pairs were Trichoderma atroviride, T. 191
aggressivum, Penicillium chrysogenum and Alternaria sp. (table 2). All yeasts lysates were 192
successfully PCR amplified. Using AGM 38 out of 40 samples were also successfully PCR amplified 193
(exceptions were P. spinulosum and Aspergillus niger) using the ITS1/ITS4 primer pair, while all 194
fungal isolates were successfully PCR amplified with the nu-SSU-0817-59/nu-SSU-1196-39 primers. 195
However PCR amplification of some isolates was partial or absent when these were harvested during 196
either early or late growth stage (table 2). Strains more efficiently amplified when sampled during early 197
growth include P. spinulosum, T. atroviride, Epicoccum nigrum, T. virens and Phaeosphaeria 198
on August 13, 2020 by guest
http://aem.asm
.org/D
ownloaded from

10
nodorum. A larger number of strains were more efficiently amplified during late growth, including 199
Absidia glauca, P. restrictum, Alternaria sp., Botrytis cinerea, Fusarium sp., T. reesei, Fusarium 200
oxysporum, Neurospora crassa, P. chrysogenum and Podospora anserina. After validation, either or 201
both approaches were used to amplify the ITS region of the 377 fungi isolated in this study. Using the 202
method described above, the vast majority (93%) of ITS regions were immediately amplified and 203
sequenced. Sequence analysis was successfully used to assign the isolate to a taxonomic group. For the 204
identification of a minority (7%) of isolates, a second PCR and subsequent sequencing reaction was 205
required. 206
207
Isolation and identification of cultivable endophytic fungi 208
A total of 377 fungi were isolated from the 112 field samples analysed. After identification, fungal 209
isolates from the same sample that were assigned to the same OTU (by ITS sequence) were considered 210
to be a unique isolate. From the 377 fungi, we identified 254 isolates. The total number of fungi did not 211
significantly differ (p≤0.05) when considering the isolates from organic and IPM vineyards, as well as 212
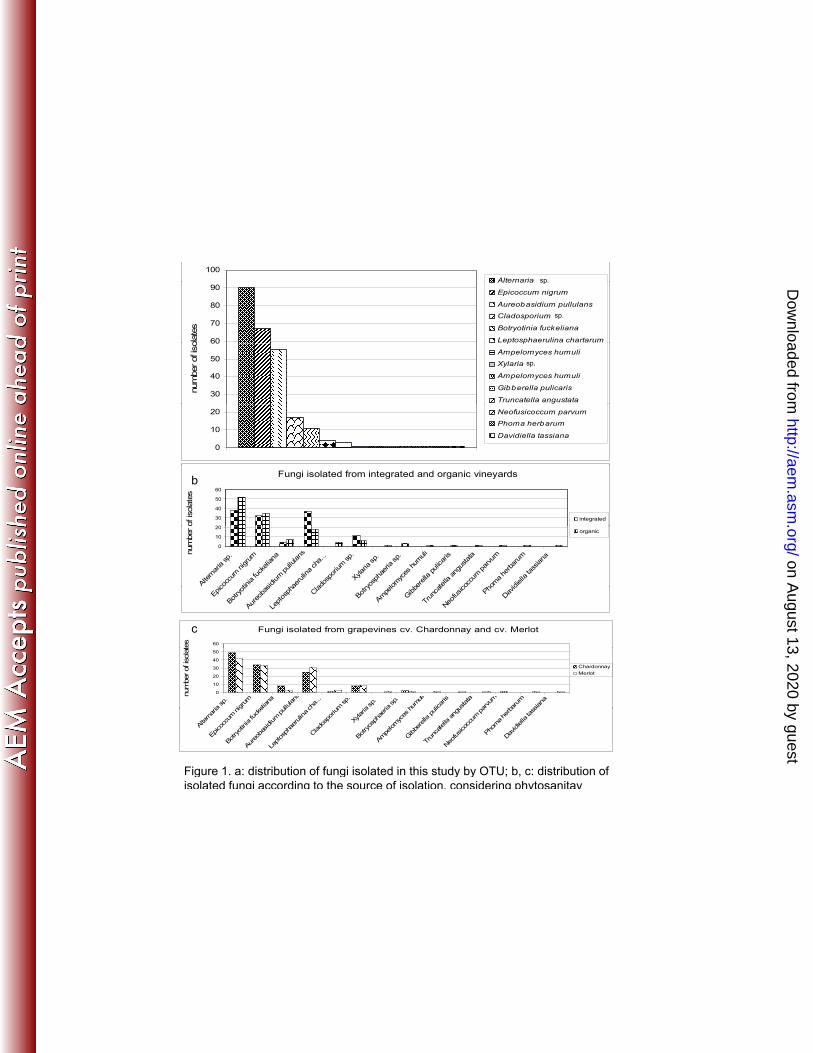
from cultivars Merlot and Chardonnay. All isolates were placed in one of 14 OTUs, according to the 213
ITS DNA sequence (Figure 1); of these, two OTUs (Alternaria sp. and Epicoccum nigrum) were 214
detected in all fields. Seven OTUs (Xylaria sp., Ampelomyces humuli, Gibberella pulicaris, Truncatella 215
angustata, Neofusicoccum parvum, Phoma herbarum and Davidiella tassiana) were only isolated from 216
a single vineyard, whereas the remaining seven OTUs were present in at least three vineyards. Among 217
the OTUs found in multiple fields, Leptosphaerulina chartarum was only found in plants from organic 218
farms and Botryosphaeria sp. was only found in plants from IPM farms (figure 1b). Thirteen out of 219
fourteen OTUs could be isolated from vines of cv. Merlot (with the only exception of N. parvum), 220
while only eight OTUs were found in cv. Chardonnay vines (figure 1c). 221
222
on August 13, 2020 by guest
http://aem.asm
.org/D
ownloaded from

11
ARISA fingerprinting of total fungal endophytic communities 223
Using ARISA fingerprinting, 66 distinct markers (electrophoretic peaks) were observed. A total of 943 224
peaks were scored, with individual samples showing from 4 to 18 (on average 8.6) peaks. Grapevine-225
associated fungi did not show a significant difference in number of ARISA markers between organic 226
and IPM farms, or between cv. Chardonnay and cv. Merlot (chi-square, P ≤ 0.05). 227
228
Multivariate data analysis 229
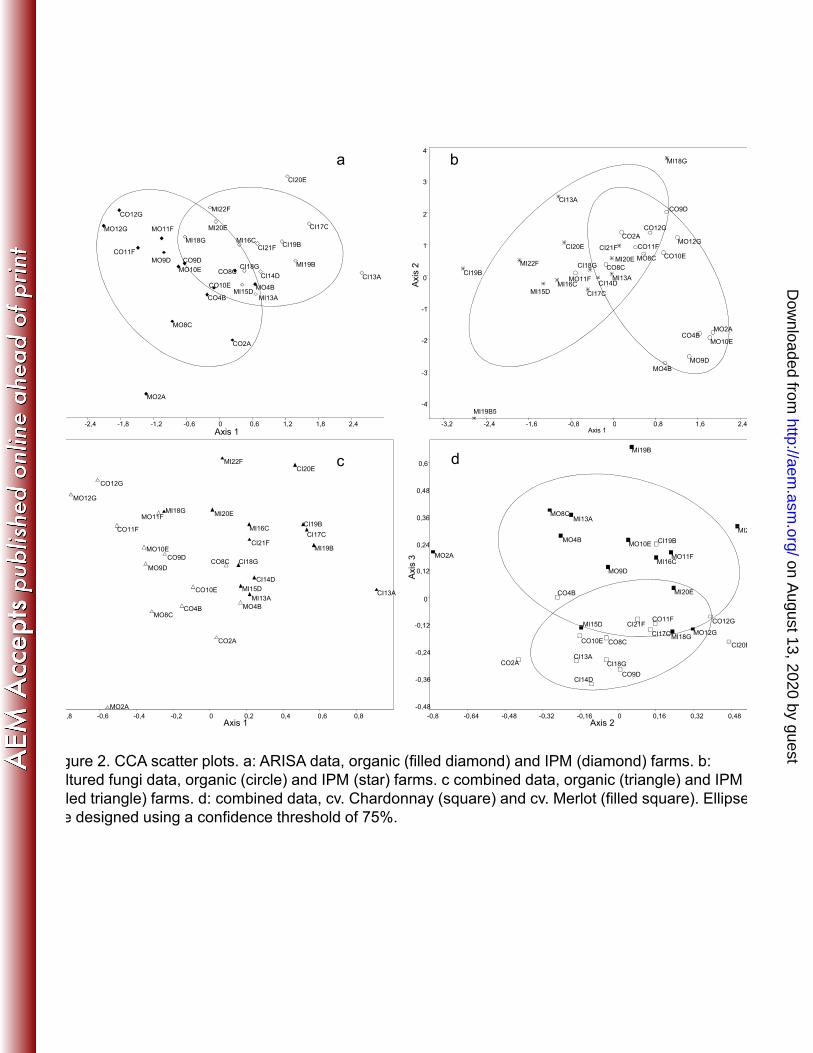
The scatter plots obtained by multivariate analysis showed samples from organic and IPM to be 230
partially or completely separated according to the two main components, using either canonical 231
correspondence analysis (figure 2) and principal component analysis (figure 3). The separation can be 232
observed using the data from both isolated fungi and ARISA fingerprinting. Similarly, the scatter plot 233
based on the combination of ARISA fingerprints and culturable fungi showed partial separation of 234
microbial communities in grapevines of cv. Merlot and cv. Chardonnay (figure 2d). The same does not 235
apply for the cultivable fungal community. CCA analysis of this matrix produced results similar to 236
those obtained using the ARISA-derived data matrix. 237
Multivariate analysis (either one-way ANOSIM or one-way NPMANOVA) of either ARISA and 238
combined data grouped according to treatments also indicated that fungal communities from organic 239
agriculture were quantitatively different from those obtained from IPM vineyards (table 3). No 240
statistically significant difference was found between communities from grapevines of cv. Merlot and 241
cv. Chardonnay (data not shown). The same datasets were used for comparison of fungal communities 242
grouped according to the sampling area indicated that there is no significant difference among most 243
areas (table 4). Significant pairwise differences (using a value of p<0.05) were observed between the 244
areas G (Navicello) and C (Noarna), G and E (Pietramurata), and E and F (Pressano-Sorni). 245
246
on August 13, 2020 by guest
http://aem.asm
.org/D
ownloaded from

12
Discussion 247
In our study, we have accomplished a wide comparison of the endophytic fungal communities of 248
grapevines in vineyards under IPM or organic management, and between cv Merlot and 249
cv.Chardonnay. We approached the study of grapevine endophytic fungal community composition and 250
its biomarkers across seven locations in Trentino (Italy) with similar characteristics regarding soil and 251
climate. Our results indicate that mycota in grapevines from organic farms form communities which 252
are significantly different from those in grapevines from IPM farms. We also found the DNA-253
dependent approach to be more powerful as compared to the analysis of culturable fungi. 254
To accomplish this, we established novel experimental protocols, which, after initial validation, 255
enabled us to efficiently identify fungal isolates from the communities analysed, without the need for 256
DNA extraction. 257
The need to analyse a large collection of fungal isolates has led to the development of a method for 258
colony-PCR using non purified fungal mycelia lysates. The method developed here requires little 259
hands-on labour, does not require separation of fungal mycelium from the agar medium and is 260
validated for a diverse array of fungal taxa. To the best of our knowledge , no previously known 261
protocol combines all three of these highly desirable features, and our protocol is thus a significant 262
improvement. We achieved PCR amplification of ITS regions for all 377 fungi in collection by either 263
or both the methods described here, and the sequence of PCR products placed each isolate in one of the 264
14 OTUs identified in the study. ITS PCR was highly effective both against the test panel and the 265
collection of isolates (with success rates ranging from 67.5% to 95%, table 2). Overall, taxonomically 266
relevant sequences could be PCR amplified from all tested fungi prepared using either FDM or AGM, 267
and using at least one of the two primer pairs tested in this study. The colony PCR described here 268
enables rapid screening of numerous fungal isolates and can be easily applicable to further studies of 269
fungal communities that use a culture-dependent approach. Furthermore, AGM can be applied directly 270
on August 13, 2020 by guest
http://aem.asm
.org/D
ownloaded from

13
to early-stage fungal colonies from any kind of environmental monitoring (be it air, plant-associated 271
microflora, or food processing surfaces), even prior to isolation of their pure cultures. 272
Most fungi isolated in the course of this study are previously known grapevine endophytes (30, 43), 273
but, to our knowledge, this is the first report of the isolation of Ampelomyces humuli and Gibberella 274
pulicaris (Fusarium sambucinum) from the grapevine endosphere. Isolates identified as Alternaria sp., 275
Epicoccum nigrum and Aureobasidium pullulans were found frequently in plants from both organic 276
and IPM farms. Fungi belonging to the genus Alternaria are among the most common fungal 277
endophytes in grapevines, and some strains may play a role in biocontrol of Plasmopara viticola (44). 278
E. nigrum is commonly considered either a saprophyte or a biocontrol agent of important grapevine 279
pathogens (26, 37). A. pullulans is often found both as epiphyte and as endophyte and is considered an 280
antagonist of grapevine disease agents (59). 281
Interestingly, we also consistently isolated Botrytis cinerea. Although the common occurrence of this 282
species as grapevine endophyte was previously reported (17, 30), it must be noted that it is considered 283
an important grapevine pathogen. B. cinerea could be latent (25), therefore behaving as an 284
asymptomatic plant endophyte and turn pathogenic only under specific physiological or environmental 285
conditions. 286
The species Botryosphaeria obtusa and Botryosphaeria dothidea, Truncatella angustata, 287
Neofusicoccum parvum, Phoma herbarum and Davidiella tassiana were isolated from apparently 288
healthy vines, but are also sometimes regarded as grapevine pathogens (23, 38, 45, 64, 67, 69). 289
However, the majority of these fungi (with the exception of D. tassiana) were isolated from IPM 290
vineyards (figure 1b), and may thus represent potential pathogens not detected in grapevines from 291
organic farms. Fungicides used in IPM may be a driving force in shaping the composition of the fungal 292
communities observed, but the level of tolerance to these fungicides among the fungi we isolated is 293
on August 13, 2020 by guest
http://aem.asm
.org/D
ownloaded from

14
unknown. Differences between fungi isolated from organic or IPM plants in the response to the applied 294
fungicides will be tested in future experiments. 295
Several studies have investigated microbial communities in soil and their shifts under different land 296
management practices (12, 29). Comparatively fewer attempts have been made to assess the effect of 297
agricultural management on the endophytic microbial communities present in crops (60, 62). In this 298
study, multivariate analysis of both cultivable fungi as well as a DNA-based approach concur to 299
indicate that integrated pest management (IPM) has an impact on the composition of endophytic fungal 300
communities. A likely factor behind this could be the long term use of synthetic fungicides in IPM or 301
the use of organic fertilisers in organic farming. 302
Multivariate analysis indicated that fungal community composition differed between the organic and 303
IPM vineyards, with partially distinct areas in CCA scatter plots (canonical correspondence analysis) 304
when considering datasets from cultivable fungi, total fungal DNA analysis, or both (figure 2a and 2b). 305
A combination of the two datasets under the same analysis showed a more marked separation of the 306
samples from organic and IPM farms (figure 2c). Interestingly, when the same combined data were 307
projected across the 2nd and 3rd axis, communities from Merlot and Chardonnay grapevines were 308
partially distinct (figure 2d). This suggests that differences between grapevine cultivars may drive a 309
minor shift in endophyte composition, as seen for other plant species (42), but that the extent of this 310
diversity is secondary, compared to the effect of crop management. Previous literature has shown that 311
the composition of the culturable fungal endophytic community may be influenced by the cultivar. 312
Casieri et al. (17) investigated the fungi in the endosphere of five grapevine cultivars in Switzerland, 313
finding that the community composition across cultivars differed both when considering the phyla and 314
the species of isolated fungi. Others analysed the endophytic mycota associated with grapevine in 315
Spain, finding the composition across cultivars differed when the order of isolated fungal taxa was 316
considered (30). Finally some information is available on the cultivar influence on microbial 317
on August 13, 2020 by guest
http://aem.asm
.org/D
ownloaded from

15
communities associated with the roots (47). Unfortunately none of these previous reports present a 318
statistical analysis of their interesting findings, making it difficult to compare the studies regarding the 319
extent of these differences in microbial communities. 320
PCA analysis of the ARISA fingerprinting dataset (i.e. cultivation-independent communities) allows 321
identification of the loadings of the principal components. The two main components’ contributors are 322
the 371 bp (peak 43) and 354 bp (peak 29) fragments for the main axis and 358 bp (peak 34) and 360 323
bp (peak 35) fragments for the secondary axis (figure 3a). Linking ARISA peaks to fungal species or 324
OTUs is a ticklish operation. As pointed out previously (5), different species may have ITS regions of 325
identical size (33), while some species may display multiple and different (i.e. polymorphic) ITS copies 326
(6). For this reason the taxonomically ambiguous entities (sometimes referred to as ribotypes) produced 327
by ARISA fingerprinting are not reliable indicators of species richness. We thus refrained from 328
formulating any hypotheses on the correspondence of relevant ARISA peaks to taxonomical units. 329
The PCA analysis of the cultured fungi dataset (figure 3c) indicated that the variance of the main axis, 330
roughly dividing samples from organic and integrated management, is mainly due to the OTUs A. 331
pullulans, Alternaria sp. and to a lesser extent by Epicoccum nigrum. In contrast with previous findings 332
(60) we found A. pullulans more frequently in vineyards employing IPM than in organic vineyards. 333
Schmid et al. in 2011 (60) have found A pullulans to be more abundant in plants from organic 334
vineyards, whereas they observed the opposite for the yeast Sporidiobolus pararoseus, which was 335
never isolated from grapevines in our study. Possible factors, related to these differences, are the 336
different cultivars, the terroir differences, the environmental dissimilarities and the methodology used. 337
In the former study, the abundance of A. pullulans in the samples was measured by quantitative 338
amplification of ITS sequences. while we estimate the distribution of each OTU making no 339
assumptions regarding the quantitative assessment of each microorganism. Remarkably both studies 340
indicate that A. pullulans is significantly affected by plant protection strategies. 341
on August 13, 2020 by guest
http://aem.asm
.org/D
ownloaded from

16
Noticeably, when PCA analysis is applied to the combined dataset, data points representing microbial 342
communities from IPM vineyards (both with cv. Merlot and cv. Chardonnay) span a smaller range on 343
the principal component than those from organic vineyards (figure 3b). This observation suggests that 344
the variability across fungal endophytic communities from IPM farms may be smaller than that from 345
organic farms. 346
With respect to marker counts (ARISA peaks or isolated fungi) across the seven sampled areas we 347
noted that in most cases data points relative to fungal communities from cv. Merlot and cv. Chardonnay 348
grapevines in the same area were grouped together (figure 3d). The same could not be observed when 349
comparing organic and integrated vineyards. This suggests that the difference between fungi from 350
organic and integrated management is larger than the difference between the plant cultivars. 351
The quantitative analysis by one-way ANOSIM and one-way NPMANOVA supported the conclusions 352
deduced by visual analysis of PCA and CCA scatter plots, pointing out that crop management (IPM 353
and organic) modifies the structure of fungal endophytic communities (table 3). One can hypothesise 354
that the use of synthetic systemic fungicides may have a role in these differences. Organic fertilizers 355
may also be a source of microorganisms, which may establish as endophytes. Further research on the 356
role of systemic fungicide or introduction by the application of organic fertilizers will be crucial to 357
prove these two hypotheses. The analysis tools employed in this study suggest that grapevine cultivar, 358
and cultivar-dependent plant physiology, may also play a role in shaping endophytic communities, but 359
to a lesser extent, as compared to crop management or sampling sites. 360
361
Acknowledgements: This research was funded by Provincia Autonoma di Trento, progetto PAT - Call 362
2 Team 2009 - Incoming – Mecagrafic. 363
on August 13, 2020 by guest
http://aem.asm
.org/D
ownloaded from

17
The authors acknowledge the help of Enzo Mescalchin, Matteo Secchi and Roberto Zanzotti for the 364
identification of the sampling areas ,Valerio Mazzoni and Ron Wehrens for the useful insights on 365
statistical analysis and Jonas Bengtsson for the help with critically reviewing the manuscript. 366
on August 13, 2020 by guest
http://aem.asm
.org/D
ownloaded from

18
References 367
1. Adams, P. D., and J. W. Kloepper. 2002. Effect of host genotype on indigenous bacterial 368 endophytes of cotton (Gossypium hirsutum L.). Plant Soil 240:181-189. 369
2. AlShahni, M. M., K. Makimura, T. Yamada, K. Satoh, Y. Ishihara, K. Takatori, and T. 370 Sawada. 2009. Direct Colony PCR of Several Medically Important Fungi Using Ampdirect ® 371 Plus. Jpn. J. Infect. Dis. 62:164-167. 372
3. Anderson, M. J. 2001. A new method for non-parametric multivariate analysis of variance. 373 Austral Ecol. 26:32-46. 374
4. Araujo, W. L., J. Marcon, W. Maccheroni, J. D. van Elsas, J. W. L. van Vuurde, and J. L. 375 Azevedo. 2002. Diversity of endophytic bacterial populations and their interaction with Xylella 376 fastidiosa in citrus plants. Appl. Environ. Microbiol. 68:4906-4914. 377
5. Avis, P. G., S. Branco, Y. Tang, and G. M. Mueller. 2010. Pooled samples bias fungal 378 community descriptions. Mol Ecol Resour 10:135-141. 379
6. Avis, P. G., I. A. Dickie, and G. M. Mueller. 2006. A 'dirty' business: testing the limitations of 380 terminal restriction fragment length polymorphism (TRFLP) analysis of soil fungi. Mol. Ecol. 381 15:873-882. 382
7. Bainbridge, B. W., C. L. Spreadbury, F. G. Scalise, and J. Cohen. 1990. Improved Methods 383 for the Preparation of High Molecular-Weight DNA from Large and Small-Scale Cultures of 384 Filamentous Fungi. FEMS Microbiol. Lett. 66:113-117. 385
8. Barnett, H. L., and B. B. Hunter. 1998. Illustrated genera of imperfect fungi. 4th Ed. APS 386 Press, St. Paul, MN. 387
9. Bittleston, L. S., F. Brockmann, W. Wcislo, and S. A. Van Bael. 2011. Endophytic fungi 388 reduce leaf-cutting ant damage to seedlings. Biol. Lett. 7:30-32. 389
10. Borneman, J., and R. J. Hartin. 2000. PCR primers that amplify fungal rRNA genes from 390 environmental samples. Appl. Environ. Microbiol. 66:4356-4360. 391
11. Brosi, G. B., R. L. McCulley, L. P. Bush, J. A. Nelson, A. T. Classen, and R. J. Norby. 392 2011. Effects of multiple climate change factors on the tall fescue-fungal endophyte symbiosis: 393 infection frequency and tissue chemistry. New Phytol. 189:797-805. 394
12. Bucher, A. E., and L. E. Lanyon. 2005. Evaluating soil management with community-level 395 physiological microbial profiles. Appl. Soil Ecol. 29:59-71. 396
13. Bulgari, D., P. Casati, L. Brusetti, F. Quaglino, M. Brasca, D. Daffonchio, and P. A. 397 Bianco. 2009. Endophytic Bacterial Diversity in Grapevine (Vitis vinifera L.) Leaves Described 398 by 16S rRNA Gene Sequence Analysis and Length Heterogeneity-PCR. J. Microbiol. 47:393-399 401. 400
14. Bulgari, D., P. Casati, P. Crepaldi, D. Daffonchio, F. Quaglino, L. Brusetti, and P. A. 401 Bianco. 2011. Restructuring of Endophytic Bacterial Communities in Grapevine Yellows-402 Diseased and Recovered Vitis vinifera L. Plants. Appl. Environ. Microbiol. 77:5018-5022. 403
15. Buyer, J. S., D. A. Zuberer, K. A. Nichols, and A. J. Franzluebbers. 2011. Soil microbial 404 community function, structure, and glomalin in response to tall fescue endophyte infection. 405 Plant Soil 339:401-412. 406
16. Caffarra, A., and E. Eccel. 2011. Projecting the impacts of climate change on the phenology 407 of grapevine in a mountain area. Aust. J. Grape Wine Res. 17:52-61. 408
17. Casieri, L., V. Hofstetter, O. Viret, and K. Gindro. 2009. Fungal communities living in the 409 wood of different cultivars of young Vitis vinifera plants. Phytopathol. Mediterr. 48:73-83. 410
18. Chen, H. R., M. T. Hsu, and S. C. Cheng. 1995. Spheroplast Preparation Facilitates Pcr 411 Screening of Yeast Sequence. BioTechniques 19:744-748. 412
on August 13, 2020 by guest
http://aem.asm
.org/D
ownloaded from
19
19. Clarke, K. R. 1993. Nonparametric Multivariate Analyses of Changes in Community Structure. 413 Aust. J. Ecol. 18:117-143. 414
20. Compant, S., B. Mitter, J. G. Colli-Mull, H. Gangl, and A. Sessitsch. 2011. Endophytes of 415 Grapevine Flowers, Berries, and Seeds: Identification of Cultivable Bacteria, Comparison with 416 Other Plant Parts, and Visualization of Niches of Colonization. Microb. Ecol. 62:188-197. 417
21. Crosby, L. D., and C. S. Criddle. 2003. Understanding bias in microbial community analysis 418 techniques due to rrn operon copy number heterogeneity. BioTechniques 34:790-794. 419
22. Danovaro, R., G. M. Luna, A. Dell'Anno, and B. Pietrangeli. 2006. Comparison of Two 420 Fingerprinting Techniques, Terminal Restriction Fragment Length Polymorphism and 421 Automated Ribosomal Intergenic Spacer Analysis, for Determination of Bacterial Diversity in 422 Aquatic Environments. Appl. Environ. Microbiol. 72:5982-5989. 423
23. Diaz, G. A., D. Prehn, X. Besoain, E. R. Chavez, and B. A. Latorre. 2011. Neofusicoccum 424 parvum Associated with Grapevine Trunk Diseases in Chile. Plant Dis. 95:1032-1032. 425
24. Doyle, J. J., and J. L. Doyle. 1990. Isolation of plant DNA from fresh tissue. Focus 12:13-15. 426 25. Elmer, P. A. G., T. J. Michailides, Y. Elad, B. Williamson, P. Tudzynski, and N. Delen. 427
2007. Epidemiology of Botrytis cinerea in Orchard and Vine Crops. Botrytis: Biology, 428 Pathology and Control, p. 243-272. Springer Netherlands. 429
26. Elmer, P. A. G., and T. Reglinski. 2006. Biosuppression of Botrytis cinerea in grapes. Plant 430 Pathol. 55:155-177. 431
27. Fisher, M. M., and E. W. Triplett. 1999. Automated approach for ribosomal intergenic spacer 432 analysis of microbial diversity and its application to freshwater bacterial communities. Appl. 433 Environ. Microbiol. 65:4630-4636. 434
28. Fredricks, D. N., C. Smith, and A. Meier. 2005. Comparison of six DNA extraction methods 435 for recovery of fungal DNA as assessed by quantitative PCR. J. Clin. Microbiol. 43:5122-5128. 436
29. Gomez, E., L. Ferreras, and S. Toresani. 2006. Soil bacterial functional diversity as 437 influenced by organic amendment application. Bioresour. Technol. 97:1484-1489. 438
30. Gonzalez, V., and M. L. Tello. 2011. The endophytic mycota associated with Vitis vinifera in 439 central Spain. Fungal Divers. 47:29-42. 440
31. Granado, J., B. Thurig, E. Kieffer, L. Petrini, A. Fliessbach, L. Tamm, F. P. Weibel, and 441 G. S. Wyss. 2008. Culturable Fungi of Stored 'Golden Delicious' Apple Fruits: A One-Season 442 Comparison Study of Organic and Integrated Production Systems in Switzerland. Microb. Ecol. 443 56:720-732. 444
32. Hammer, Ø., D. A. T. Harper, and P. D. Ryan. 2001. PAST: paleontological statistics 445 software for education and data analysis. Palaeontol Electronica 4:1-9. 446
33. Horton, T. R. 2002. Molecular approaches to ectomycorrhizal diversity studies: variation in 447 ITS at a local scale. Plant Soil 244:29-39. 448
34. Islam, S. M. A., R. K. Math, J. M. Kim, M. G. Yun, J. J. Cho, E. J. Kim, Y. H. Lee, and H. 449 D. Yun. 2010. Effect of Plant Age on Endophytic Bacterial Diversity of Balloon Flower 450 (Platycodon grandiflorum) Root and Their Antimicrobial Activities. Curr. Microbiol. 61:346-451 356. 452
35. Khot, P. D., and D. N. Fredricks. 2009. PCR-based diagnosis of human fungal infections. 453 Expert Rev Anti Infect Ther 7:1201-1221. 454
36. Koranda, M., J. Schnecker, C. Kaiser, L. Fuchslueger, B. Kitzler, C. F. Stange, A. 455 Sessitsch, S. Zechmeister-Boltenstern, and A. Richter. 2011. Microbial processes and 456 community composition in the rhizosphere of European beech - The influence of plant C 457 exudates. Soil Biol. Biochem. 43:551-558. 458
37. Kortekamp, A. 1997. Epicoccum nigrum Link: A biological control agent of Plasmopara 459 viticola (Berk. et Curt.) Berl. et De Toni? Vitis 36:215-216. 460
on August 13, 2020 by guest
http://aem.asm
.org/D
ownloaded from

20
38. Krol, E. 2006. Fungi inhibiting decaying grapevine (Vitis spp.) cuttings. J. Plant Protection 461 Res. 46:353-358.. 462
39. Lau, A., T. C. Sorrell, O. Lee, K. Stanley, and C. Halliday. 2008. Colony Multiplex-Tandem 463 PCR for Rapid, Accurate Identification of Fungal Cultures. J. Clin. Microbiol. 46:4058-4060. 464
40. Legendre, P., and L. Legendre. 1998.Numerical ecology, 2nd English p. 594-604 ed. Elsevier 465 Science BV, Amsterdam, The Netherlands. 466
41. Liu, D., S. Coloe, R. Baird, and J. Pedersen. 2000. Rapid mini-preparation of fungal DNA for 467 PCR. J. Clin. Microbiol. 38:471-471. 468
42. Manter, D. K., J. A. Delgado, D. G. Holm, and R. A. Stong. 2010. Pyrosequencing Reveals a 469 Highly Diverse and Cultivar-Specific Bacterial Endophyte Community in Potato Roots. Microb. 470 Ecol. 60:157-166. 471
43. Martini, M., R. Musetti, S. Grisan, R. Polizzotto, S. Borselli, F. Pavan, and R. Osler. 2009. 472 DNA-Dependent Detection of the Grapevine Fungal Endophytes Aureobasidium pullulans and 473 Epicoccum nigrum. Plant Dis. 93:993-998. 474
44. Musetti, R., A. Vecchione, L. Stringher, S. Borselli, L. Zulini, C. Marzani, M. 475 D'Ambrosio, L. S. di Toppi, and I. Pertot. 2006. Inhibition of sporulation and ultrastructural 476 alterations of grapevine downy mildew by the endophytic fungus Alternaria alternata. 477 Phytopathology 96:689-698. 478
45. Niekerk, J. M., P. H. Fourie, F. Hallenn, and P. Crous. 2006. Botryosphaeria spp. as 479 Grapevine Trunk Disease Pathogens. Phytopathol. Mediterr. 46: S43-S54 480
46. Oliveri, C., A. Campisano, A. Catara, and G. Cirvilleri. 2007. Characterization and fAFLP 481 genotyping of Penicillium strains from postharvest samples and packinghouse environments. J. 482 Plant Pathol. 89:29-40. 483
47. Parker, S. R., and D. A. Kluepfel. 2009. Effect of rootstock genotype on functional and 484 taxonomic diversity of rhizosphere communities and endophyte communities of grapevine in 485 California. Phytopathology 99:S100-S100. 486
48. Pinamonti, F., G. Stringari, F. Gasperi, and G. Zorzi. 1997. The use of compost: its effects 487 on heavy metal levels in soil and plants. Resour. Conserv. Recy. 21:129-143. 488
49. Plaza, G. A., R. Upchurch, R. L. Brigmon, W. B. Whitman, and K. Ulfig. 2004. Rapid DNA 489 extraction for screening soil filamentous fungi using PCR amplification. Pol. J. Environ. Stud. 490 13:315-318. 491
50. Porras-Alfaro, A., and P. Bayman. Hidden Fungi, Emergent Properties: Endophytes and 492 Microbiomes. Annu Rev Phytopathol 49:291-315. 493
51. Rajulu, M. B. G., N. Thirunavukkarasu, T. S. Suryanarayanan, J. P. Ravishankar, N. E. 494 El Gueddari, and B. M. Moerschbacher. 2011. Chitinolytic enzymes from endophytic fungi. 495 Fungal Divers. 47:43-53. 496
52. Rasche, F., V. Hodl, C. Poll, E. Kandeler, M. H. Gerzabek, J. D. van Elsas, and A. 497 Sessitsch. 2006. Rhizosphere bacteria affected by transgenic potatoes with antibacterial 498 activities compared with the effects of soil, wild-type potatoes, vegetation stage and pathogen 499 exposure. FEMS Microbiol. Ecol. 56:219-235. 500
53. Rasche, F., H. Velvis, C. Zachow, G. Berg, J. D. Van Elsas, and A. Sessitsch. 2006. Impact 501 of transgenic potatoes expressing anti-bacterial agents on bacterial endophytes is comparable 502 with the effects of plant genotype, soil type and pathogen infection. J Appl Ecol 43:555-566. 503
54. Ruimy, R., A. Brisabois, C. Bernede, D. Skurnik, S. Barnat, G. Arlet, S. Momcilovic, S. 504 Elbaz, F. Moury, M. A. Vibet, P. Courvalin, D. Guillemot, and A. Andremont. 2010. 505 Organic and conventional fruits and vegetables contain equivalent counts of Gram-negative 506 bacteria expressing resistance to antibacterial agents. Environ. Microbiol. 12:608-615. 507
on August 13, 2020 by guest
http://aem.asm
.org/D
ownloaded from
21
55. Russell, J. R., J. Huang, P. Anand, K. Kucera, A. G. Sandoval, K. W. Dantzler, D. 508 Hickman, J. Jee, F. M. Kimovec, D. Koppstein, D. H. Marks, P. A. Mittermiller, S. J. 509 Nunez, M. Santiago, M. A. Townes, M. Vishnevetsky, N. E. Williams, M. P. N. Vargas, L. 510 A. Boulanger, C. Bascom-Slack, and S. A. Strobel. 2011. Biodegradation of Polyester 511 Polyurethane by Endophytic Fungi. Appl. Environ. Microbiol. 77:6076-6084. 512
56. Saitoh, K.-i., K. Togashi, T. Arie, and T. Teraoka. 2006. A simple method for a mini-513 preparation of fungal DNA. J. Gen. Plant Pathol.. 72:348-350. 514
57. Saona, N. M., B. R. Albrectsen, L. Ericson, and D. R. Bazely. 2010. Environmental stresses 515 mediate endophyte-grass interactions in a boreal archipelago. J. Ecol. 98:470-479. 516
58. Sayers, E. W., T. Barrett, D. A. Benson, E. Bolton, S. H. Bryant, K. Canese, V. 517 Chetvernin, D. M. Church, M. DiCuccio, S. Federhen, M. Feolo, L. Y. Geer, W. 518 Helmberg, Y. Kapustin, D. Landsman, D. J. Lipman, Z. Y. Lu, T. L. Madden, T. Madej, 519 D. R. Maglott, A. Marchler-Bauer, V. Miller, I. Mizrachi, J. Ostell, A. Panchenko, K. D. 520 Pruitt, G. D. Schuler, E. Sequeira, S. T. Sherry, M. Shumway, K. Sirotkin, D. Slotta, A. 521 Souvorov, G. Starchenko, T. A. Tatusova, L. Wagner, Y. L. Wang, W. J. Wilbur, E. 522 Yaschenko, and J. Ye. 2010. Database resources of the National Center for Biotechnology 523 Information. Nucleic Acids Res. 38:D5-D16. 524
59. Schena, L., A. Ippolito, T. Zahavi, L. Cohen, F. Nigro, and S. Droby. 1999. Genetic 525 diversity and biocontrol activity of Aureobasidium pullulans isolates against postharvest rots. 526 Postharvest Biol. Technol. 17:189-199. 527
60. Schmid, F., G. Moser, H. Muller, and G. Berg. 2011. Functional and Structural Microbial 528 Diversity in Organic and Conventional Viticulture: Organic Farming Benefits Natural 529 Biocontrol Agents. Appl. Environ. Microbiol. 77:2188-2191. 530
61. Schmidt, H., M. Ehrmann, R. E. Vogel, M. H. Taniwaki, and L. Niessen. 2003. Molecular 531 typing of Aspergillus ochraceus and construction of species specific SCAR-primers based on 532 AFLP. Syst. Appl. Microbiol. 26:138-146. 533
62. Seghers, D., L. Wittebolle, E. M. Top, W. Verstraete, and S. D. Siciliano. 2004. Impact of 534 agricultural practices on the Zea mays L. endophytic community. Appl. Environ. Microbiol. 535 70:1475-1482. 536
63. Singh, P. K., and G. R. Hughes. 2006. Genetic Similarity among Isolates of Pyrenophora 537 tritici-repentis, Causal Agent of Tan Spot of Wheat. J. Phytopathol. 154:178-184. 538
64. Slippers, B., and M. J. Wingfield. 2007. Botryosphaeriaceae as endophytes and latent 539 pathogens of woody plants: diversity, ecology and impact. Fungal Biol Rev 21:90-106. 540
65. Sundram, S., S. Meon, I. Abu Seman, and R. Othman. 2011. Symbiotic Interaction of 541 Endophytic Bacteria with Arbuscular Mycorrhizal Fungi and Its Antagonistic Effect on 542 Ganoderma boninense. J. Microbiol. 49:551-557. 543
66. Taylor, D. L., and S. Houston. 2011. A Bioinformatics Pipeline for Sequence-Based Analyses 544 of Fungal Biodiversity. Methods Mol. Biol. 722:141-155. 545
67. Urbez-Torres, J. R., P. Adams, J. Kamas, and W. D. Gubler. 2009. Identification, 546 Incidence, and Pathogenicity of Fungal Species Associated with Grapevine Dieback in Texas. 547 Am. J. Enol. Vitic. 60:497-507. 548
68. Van Burik, J. A. H., R. W. Schreckhise, T. C. White, R. A. Bowden, and D. Myerson. 549 1998. Comparison of six extraction techniques for isolation of DNA from filamentous fungi. 550 Med. Mycol. 36:299-303. 551
69. van Niekerk, J. M., P. W. Crous, J. Z. Groenewald, P. H. Fourie, and F. Halleen. 2004. 552 DNA phylogeny, morphology and pathogenicity of Botryosphaeria species on grapevines. 553 Mycologia 96:781-798. 554
on August 13, 2020 by guest
http://aem.asm
.org/D
ownloaded from

22
70. van Zeijl, C. M. J., E. H. M. van de Kamp, P. J. Punt, G. C. M. Selten, B. Hauer, R. F. M. 555 van Gorcom, and C. A. M. J. J. van den Hondel. 1998. An improved colony-PCR method for 556 filamentous fungi for amplification of PCR-fragments of several kilobases. J. Biotechnol. 557 59:221-224. 558
71. Vontiedemann, S., G. Brendel, and H. Fehrmann. 1988. Investigations on Endophytic Fungi 559 of Grapevine with Special Emphasis on the Vascular System of Rootstocks. J. Phytopathol. 560 122:147-165. 561
72. West, E. R., E. J. Cother, C. C. Steel, and G. J. Ash. 2010. The characterization and diversity 562 of bacterial endophytes of grapevine. Can. J. Microbiol.. 56:209-216. 563
73. White, T. J., T. Bruns, S. W. Lee, and J. W. Taylor. 1990. Amplification and direct 564 sequencing of fungal ribosomal RNA genes for phylogenetics, p. 315-322. In M. A. Innis, D. H. 565 Gelfand, J. J. Sninsky, and T. J. White (ed.), PCR Protocols: A Guide to Methods and 566 Applications. New York: Academic Press Inc. 567
74. Yousaf, S., V. Andria, T. G. Reichenauer, K. Smalla, and A. Sessitsch. 2010. Phylogenetic 568 and functional diversity of alkane degrading bacteria associated with Italian ryegrass (Lolium 569 multiflorum) and Birdsfoot trefoil (Lotus corniculatus) in a petroleum oil-contaminated 570 environment. J. Hazard. Mater. 184:523-532. 571
75. Zhao, J., T. Shan, Y. Mou, and L. Zhou. 2011. Plant-Derived Bioactive Compounds 572 Produced by Endophytic Fungi. Mini Rev Med Chem 11:159-168. 573
574 575
on August 13, 2020 by guest
http://aem.asm
.org/D
ownloaded from
23
Picture legends 576
Figure 1. a: distribution of fungi isolated in this study by OTU; b, c: distribution of isolated fungi 577 according to the source of isolation, considering phytosanitay regime (b) and cultivar (c). 578
579 Figure 2. CCA scatter plots. a: ARISA data, organic (filled diamond) and IPM (diamond) farms. b: 580
cultured fungi data, organic (circle) and IPM (star) farms. c combined data, organic (triangle) 581 and IPM (filled triangle) farms. d: combined data, cv. Chardonnay (square) and cv. Merlot 582 (filled square). Ellipses are designed using a confidence threshold of 75%. 583
584 Figure 3. PCA scatter plots. a: combined data, organic (filled circle) and IPM (circle) farms. b: 585
combined data, organic Merlot (filled square), IPM Merlot (square), organic Chardonnay (filled 586 circle), IPM Chardonnay (circle). c: cultured fungi data, organic (circle) and IPM (star) farms. 587 d: combined data by area, A (X), B (cross), C (square), D (triangle), E (ellipse), F (star), G 588 (diamond). Ellipses are designed using a confidence threshold of 75%. 589
on August 13, 2020 by guest
http://aem.asm
.org/D
ownloaded from
100Alternaria sp.
60
70
80
90
olat
es
Alternaria
Epicoccum nigrum
Aureobasidium pullulans
Cladosporium
Botryotinia fuckeliana
Leptosphaerulina chartarum
sp.
sp.
30
40
50
60
num
ber o
f iso
p p
Ampelomyces humuli
Xylaria
Ampelomyces humuli
Gibberella pulicaris
Truncatella angustata
sp.
0
10
20 Neofusicoccum parvum
Phoma herbarum
Davidiella tassiana
Fungi isolated from integrated and organic vineyards
20
30
40
50
60
of is
olat
es
integrated
b
0
10
20
Altern
aria
sp.
icocc
um ni
grum
otinia
fuck
elian
a
asidi
um pu
llulan
s
haer
ulina
cha..
.
lados
poriu
m sp.
Xylaria
sp.
ryosp
haer
ia sp
.
elomyc
es hu
muli
bere
lla pu
licar
is
atella
angu
stata
cocc
um pa
rvum
homa h
erba
rum
vidiel
la tas
siana
num
ber organic
Epic
Botryo
ti
Aureo
bas
Lepto
spha Cla
Botry
Ampelo
Gibbe
Trun
cat
Neofus
ico PhoDav
id
Fungi isolated from grapevines cv. Chardonnay and cv. Merlot
60tes
c
0
10
20
30
40
50
ria sp
.
nigrum
kelia
na
ullula
ns
cha...
um sp
.
ia sp
.ria
sp.
humuli
ulica
ris
gusta
ta
parvu
m
baru
m
ssian
a
num
ber o
f iso
lat
ChardonnayMerlot
Alter
naria
Epico
ccum
nig
Botry
otini
a fuc
ke
Aureob
asidi
um pul
Leptos
phae
rulin
a c
Clados
poriu
m
Xylar
ia
Botry
osph
aeria
Ampe
lomyc
es h
Gibberell
a pu
l
Trun
catella
angu
Neofus
icocc
um pa
Phom
a her
ba
Davidi
ella t
ass
Figure 1 a: distribution of fungi isolated in this study by OTU; b c: distribution ofFigure 1. a: distribution of fungi isolated in this study by OTU; b, c: distribution of isolated fungi according to the source of isolation, considering phytosanitay
on August 13, 2020 by guest
http://aem.asm
.org/D
ownloaded from
a
CO12GMI22F
CI17CMI20E
CI20E
MO12G
CO9D
MO4B
MO8C
CO10E
MO9D
CO4B
MO11F
CO11F
CO8CMO10ECI14D
MI18G CI19B
CI18G
MI16C
CI13A
CI21F
CI17CMI20E
MI15D
MI19B
MI13A
MO2A
MO8C
CO2A
-2,4 -1,8 -1,2 -0,6 0 0,6 1,2 1,8 2,4
c
2,4 1,8 1,2 0,6 0 0,6 1,2 1,8 2,4Axis 1
MO12G
CO12G
MO11FMI18G
CI19B
MI22F
MI16C
MI20E
CI20E
CO9D
MO4BMO8C
CO10E
MO9D
CO4B
CO11F
CO8C
MO10E
CI14D
CI19B
CI18G
MI16C
CI13A
CI21FCI17C
MI15D
MI19B
MI13A
MO2A
CO2A
,8 -0,6 -0,4 -0,2 0 0,2 0,4 0,6 0,8Axis 1
gure 2. CCA scatter plots. a: ARISA data, organic (ltured fungi data, organic (circle) and IPM (star) faled triangle) farms. d: combined data, cv. Chardone designed using a confidence threshold of 75%.
b
CO9D
CO12G
MI18G
CI13A
2
3
4
MO12G
MO8C CO10E
CO2ACO12G
MO11F
CO11F
CO8C
CI14DCI19B
CI18GMI22F
MI16C
CI21F
CI17C
MI20E
CI20E
MI15D
MI13A
-1
0
1
Axi
s 2
MO2A
MO4BMO9D
CO4BMO10E
MI19B5
-3,2 -2,4 -1,6 -0,8 0 0,8 1,6 2,4
-4
-3
-2
3,2 2,4 1,6 0,8 0 0,8 1,6 2,4Axis 1
d
MI13A
MI19B
MO8C0,36
0,48
0,6
CI21F
CO4B
CI19B
CO11F CO12G
MO10E
MI15D
MI20E
MO11FMI16C
MI2
MO9D
MO4B
MO2A
-0 12
0
0,12
0,24
Axi
s 3
CI13ACO2A
CI20E
CI21F
CO9D
CO8CCI17C
CO10E
CI18G
CI14D
MI15D
MI18G MO12G
-0,8 -0,64 -0,48 -0,32 -0,16 0 0,16 0,32 0,48Axis 2
-0,48
-0,36
-0,24
0,12
(filled diamond) and IPM (diamond) farms. b: rms. c combined data, organic (triangle) and IPM
nnay (square) and cv. Merlot (filled square). Ellipse
on August 13, 2020 by guest
http://aem.asm
.org/D
ownloaded from

aCO10E
CI19B
MO2A
CO9D
MO4B MO8C
CO2A
MO9D
CO4B
CO11F
CO8C
MO10E
CI14D
MI18G
CI18G
MI22F
CI13ACI21F
CI17C
MI20ECI20E
MI15DMI19B
MI13A
MO12G
CO12G
MO11FMI16C
-3,6 -2,4 -1,2 0 1,2 2,4 3,6 4,8 6
c
3,6 2,4 1,2 0 1,2 2,4 3,6 4,8 6
Component 1
MO9D
CI17CMI20E
1,8
2,4
MO2A
MO4B
CO10ECO2A
CO4B
CO8CCI14D
CI19B
CI18G
MI22F MI16C
CI21F
CI20E
MI19BMI13A
-2,4 -1,6 -0,8 0,8 1,6 2,4 3,2
0 6
0,6
1,2
MO12GCO9D
MO8CCO12G
MO11F
CO11F
MO10E
MI18G
MI15D
-2,4
-1,8
-1,2
-0,6
CI13AComponent 1
ure 3. PCA scatter plots. a: combined data, organia, organic Merlot (filled square), IPM Merlot (squar
d ( i l ) lt d f i d t i (ardonnay (circle). c: cultured fungi data, organic (ca, A (X), B (cross), C (square), D (triangle), E (ellipng a confidence threshold of 75%.
b
CO8C
CO10ECI19B
3,2
4,8
CO4B
CO9D
CO2A
CO8C
CO11FMI15D
MI19B
MI20E
MI16C
MI22F
MI18G
MI13ACI14D
CI20E
CI17CCI21F
CI13A
CI18G
MO10E
MO11F
MO8C
MO9D
MO4B
MO2A
-4,8 -3,6 -2,4 -1,2 1,2 2,4 3,6 4,8
-1,6
1,6
Com
pone
nt 2
CO12G
MO12G
-6,4
-4,8
-3,2
d
Component 1
CO12
MO12G
2
2,5
MI13ACI13A
CO4B
MO4B
MI16CMI15DMO10E
CI20E
CO11F
CI21FMO11FMI22F
CI18G
MI18G
0
0,5
1
1,5
ompo
nent
2
CO2AMI19B
CI19B
CO4BMI16C
CI17C
CO8C
CI14D
MI15D
M
MI20E
CO10E
-2
-1,5
-1
-0,5
Co
-2 -1,6 -1,2 -0,8 -0,4 0 0,4 0,8 1,2Component 1
2
c (filled circle) and IPM (circle) farms. b: combinedre), organic Chardonnay (filled circle), IPM i l ) d IPM ( t ) f d bi d d t bcircle) and IPM (star) farms. d: combined data by
pse), F (star), G (diamond). Ellipses are designed
on August 13, 2020 by guest
http://aem.asm
.org/D
ownloaded from

Area Vineyard # Cultivar Pest Management Sample name
2
Chardonnay Organic CO2A
A Merlot Organic MO2A
Avio-Ala 13
Chardonnay Integrated CI13A
Merlot Integrated MI13A
4
Chardonnay Organic CO4B
B Merlot Organic MO4B
Pergolese 19
Chardonnay Integrated CI19B
Merlot Integrated MI19B
8
Chardonnay Organic CO8C
C Merlot Organic MO8C
Noarna 17 Chardonnay Integrated CI17C
16 Merlot Integrated MI16C
9
Chardonnay Organic CO9D
D Merlot Organic MO9D
Isera 14 Chardonnay Integrated CI14D
15 Merlot Integrated MI15D
10
Chardonnay Organic CO10E
E Merlot Organic MO10E
Pietramurata 20
Chardonnay Integrated CI20E
Merlot Integrated MI20E
11
Chardonnay Organic CO11F
F Merlot Organic MO11F
Pressano- 21 Chardonnay Integrated CI21F
Sorni 22 Merlot Integrated MI22F
12
Chardonnay Organic CO12G
G Merlot Organic MO12G
Navicello 18
Chardonnay Integrated CI18G
Merlot Integrated MI18G
Table 1: Sample names and their characteristics.
on August 13, 2020 by guest
http://aem.asm
.org/D
ownloaded from

Fungal isolate FDM AGM
Source ITS1/ITS4 nu-SSU-0817-59/nu-SSU-1196-39 ITS1/ITS4 nu-SSU-0817-59/nu-SSU-1196-39
Early Late Early Late
Absidia glauca 1B3C Our collection
Alternaria sp. 2.1.Ca Our collection
Alternaria sp. AL2 Our collection
Aspergillus niger Our collection
Aspergillus niger CBS 513.88
Botrytis cinerea Our collection
Botrytis cinerea 9.4.Md Our collection
Cladosporium oxysporum CBS 125.88
Cladosporium sp. 10.4.Mb Our collection
Cladosporium sp. 4.2.Mb Our collection
Epicoccum nigrum 2.1.Cb Our collection
Fusarium graminearum PH1 ATCC MYA4620
Fusarium oxysporum NRRL34936
Fusarium sp. 53F Our collection
Mortierella vertici lata F2(VR) Our collection
Mucor hiemalis 1B2C Our collection
Neurospora crassa OR74A FGSC9013
on August 13, 2020 by guest
http://aem.asm
.org/D
ownloaded from

Penicillium chrysogenum Our collection
Penicillium chrysogenum 54-1255 NRRL1951
Penicillium restrictum VR31 Our collection
Penicillium spinulosum VR14 Our collection
Phaeosphaeria nodorum SN15 FGSC10173
Pithomyces chartarum 9.2.Mb Our collection
Podospora anserina FGSC10383
Rhizopus stolonifer 2948 Our collection
Sclerotinia sclerotiorum 1980 ATCC18683
Trichoderma aggressivum CBS 115901
Trichoderma atroviride MT8 Our collection
Trichoderma reesei QMA DSM 768
Trichoderma virens PGSC 10516
Umbelopsis ramanniana F13 Our collection
Zygorhyncus moelleri F11(VR) Our collection
Aureobasidium pullulans 4.3.Cc Our collection
Debaryomyces hansenii CBS 767
Hansenula polymorpha CBS 4732
Pichia stipitis CBS6054
Saccharomyces cerevisiae S288C ATCC204508
on August 13, 2020 by guest
http://aem.asm
.org/D
ownloaded from

Schizosaccaromyces pombe 972h ATCC24843
Yarrowia lipolytica CBS 7504
Zygosaccaromyces rouxii CBS 732
Table 2: Strains used for validation of the colony PCR method and PCR results. PCR was performed using the primer pairs ITS1/ITS4 and nu-SSU-0817-59/nu-SSU-1196-3. Both FDM and AGM results are shown. AGM results are reported both for early and late stages. The signs and indicate successful and unsuccessful PCR amplification,
respectively. Yeast strains were tested in one stage only.
on August 13, 2020 by guest
http://aem.asm
.org/D
ownloaded from

ANOSIM
O I
O 0,0012
I 0,0012
NPMANOVA
O I
O 0,0005
I 0,0005
Table 3: p values of ANOSIM and NPMANOVA comparison of populations from organic (O) and IPM (I) farms using the combined dataset. Highlighted cells values are <0.05
on August 13, 2020 by guest
http://aem.asm
.org/D
ownloaded from

ANOSIM
A B C D E F G
A 0,7974 0,3788 0,9156 0,6802 0,4903 0,3717
B 0,7974 0,1979 0,2844 0,3158 0,0555 0,2903
C 0,3788 0,1979 0,4277 0,107 0,3432 0,0246
D 0,9156 0,2844 0,4277 0,1977 0,6229 0,2516
E 0,6802 0,3158 0,107 0,1977 0,0273 0,0281
F 0,4903 0,0555 0,3432 0,6229 0,0273 0,1775
G 0,3717 0,2903 0,0246 0,2516 0,0281 0,1775
NPMANOVA
A B C D E F G
A 0,652 0,2854 0,9454 0,3057 0,6313 0,4561
B 0,652 0,2016 0,2055 0,2013 0,0842 0,1987
C 0,2854 0,2016 0,4046 0,057 0,1988 0,0283
D 0,9454 0,2055 0,4046 0,2965 0,6341 0,2846
E 0,3057 0,2013 0,057 0,2965 0,0284 0,0304
F 0,6313 0,0842 0,1988 0,6341 0,0284 0,1711
G 0,4561 0,1987 0,0283 0,2846 0,0304 0,1711
Table 4: p values of ANOSIM and NPMANOVA comparison of populations from seven locations in this study (A-G) using the combined dataset. Highlighted cells values are <0.05
on A
ugust 13, 2020 by guesthttp://aem
.asm.org/
Dow
nloaded from


![From Joyce Armstrong Carroll, Dr. JAC's Guide to Writing with … · 2018. 12. 6. · ..He [Papa] swept his hand toward the signaling Esperanza. (Circle grapevines, grapevines.) When](https://img.pdfslide.us/doc/110x75/60357f62ea017562fc05cf79/from-joyce-armstrong-carroll-dr-jacs-guide-to-writing-with-2018-12-6-he.jpg)


![Vascular Occlusions in Grapevines with Pierce … · Vascular Occlusions in Grapevines with Pierce’sDisease Make Disease Symptom Development Worse1[OA] Qiang Sun*, Yuliang Sun,](https://img.pdfslide.us/doc/110x75/5b917ca909d3f2c05d8ba555/vascular-occlusions-in-grapevines-with-pierce-vascular-occlusions-in-grapevines.jpg)