Embed Size (px)
Citation preview

Tardito, S, Oudin, A, Ahmed, Shafiq, Fack, F, Keunen, O, Zheng, L, Miletic, H,
Sakariassen, P, Weinstock, A, Wagner, A, Lindsay, S, Hock, A, Barnett, S, Ruppin,
E, Morkve, S, Lund-Johansen, M, Chalmers, A, Bjerkvig, R, Niclou, S and
Gottlieb, E (2015) Glutamine synthetase activity fuels nucleotide biosynthesis and
supports growth of glutamine-restriced glioblastoma. Nature Cell Biology, 17
(12). pp. 1556-1568.
Downloaded from: http://sure.sunderland.ac.uk/6005/
Usage guidelines
Please refer to the usage guidelines at http://sure.sunderland.ac.uk/policies.html or alternatively
contact [email protected].

Glutamine Synthetase activity fuels nucleotide biosynthesis and supports growth of glutamine-restricted glioblastoma
Saverio Tardito 1, Anaïs Oudin 2, Shafiq U. Ahmed 3, Fred Fack 2, Olivier Keunen 2, Liang Zheng 1, Hrvoje Miletic 4, Per Øystein Sakariassen 4, Adam Weinstock 5, Allon Wagner 5, Susan L. Lindsay 6, Andreas K. Hock 1, Susan C. Barnett 6, Eytan Ruppin 5,7, Svein Harald Mørkve 8, Morten Lund-Johansen 8,9, Anthony J. Chalmers 3, Rolf Bjerkvig 2,4, Simone P. Niclou 2,4, and Eyal Gottlieb 1,10
1Cancer Metabolism Research Unit, Cancer Research UK, Beatson Institute, Switchback Road, Glasgow, G61 1BD, Scotland, UK
2NorLux Neuro-Oncology Laboratory, Department of Oncology, Luxembourg Institute of Health, L-1526, Luxembourg
3Institute of Cancer Sciences, University of Glasgow, Glasgow, G12 8QQ, UK
4Kristian Gerhard Jebsen Brain Tumour Research Center, Department of Biomedicine, University of Bergen, Bergen, N-5009, Norway
5The Blavatnik School of Computer Science, Tel Aviv University, Tel Aviv, 69978, Israel
6Institute of Infection, Immunity and inflammation, College of Medical, Veterinary and Life Sciences, University of Glasgow, Glasgow, G12 8TA, Scotland, UK
7The Sackler School of Medicine, Tel Aviv University, Tel Aviv, 69978, Israel
8Department of Neurosurgery, Haukeland University Hospital, N-5021, Norway
9Department of Clinical Medicine, University of Bergen, N-5020, Norway
Abstract
L-Glutamine (Gln) functions physiologically to balance tissue requirements of carbon and
nitrogen. It has been proposed that in cancer cells undergoing aerobic glycolysis, accelerated
anabolism is sustained by Gln-derived carbons, which replenish the tricarboxylic acid (TCA) cycle
Users may view, print, copy, and download text and data-mine the content in such documents, for the purposes of academic research, subject always to the full Conditions of use:http://www.nature.com/authors/editorial_policies/license.html#terms10Correspondence should be addressed to E.G. ([email protected]).AUTHOR CONTRIBUTIONSS.T. conceived the study, designed and performed most experiments, interpreted the data, and wrote the manuscript, A.O. performed the experiments in orthotopic xenograft models, S.U.A and A.J.C. provided the differentiated and stem-like primary glioblastoma cells, L.Z. supervised the analysis of LC-MS samples, O.K. performed the MRI analysis, F.F. processed the orthotopic and clinical GBM samples, H.M. provided the tissue microarray, A.H. designed and provided the iRFP and iRFP-GS constructs, A.W., A.W., E.R. generated and employed the metabolic modeling, S.C.B. and S.L.L. provided the primary astrocytes, M.L.J., S.H.M., and P.Ø.S. provided the surgical specimens from the patients, S.P.N. and R.B. conceived and supervised the experiments in orthotopic models and human patients, E.G. conceived and supervised the study, interpreted the data, and revised the manuscript.
COMPETING FINANCIAL INTERESTSThe authors declare no competing financial interests.
Supplementary information is available
Europe PMC Funders GroupAuthor ManuscriptNat Cell Biol. Author manuscript; available in PMC 2016 June 01.
Published in final edited form as:Nat Cell Biol. 2015 December ; 17(12): 1556–1568. doi:10.1038/ncb3272.
Europe P
MC
Funders A
uthor Manuscripts
Europe P
MC
Funders A
uthor Manuscripts
(anaplerosis). However, it is shown here that in glioblastoma (GBM) cells, almost half of the Gln-
derived glutamate (Glu) is secreted and does not enter the TCA cycle and, that inhibiting
glutaminolysis does not affect proliferation. Moreover, Gln-starved cells are not rescued by TCA
cycle replenishment. Instead, the conversion of Glu to Gln by Glutamine Synthetase (GS)
(cataplerosis) confers Gln prototrophy, and fuels de novo purine biosynthesis. In both orthotopic
GBM models and in patients, 13C-glucose tracing showed that GS produces Gln from TCA cycle-
derived carbons. Finally, while it is contributed only marginally by the circulation, the Gln
required for the growth of GBM tumours is either autonomously synthesized by GS-positive
glioma cells, or supplied by astrocytes.
INTRODUCTION
Gln and Glu constitute a metabolic hub in cellular physiology. An increased demand for Gln
by transformed cells has been recognized by biochemists for almost a century and, it has
been linked to its role as an abundant circulating respiratory fuel1. Notably, Gln carbons can
support anabolism through entering the TCA cycle via glutaminolysis. Only specific tumour
types display Gln-dependency2-9 whereby its genetic and metabolic basis remains debatable.
In certain cancer models, the inhibition of glutaminase (GLS), which deaminates Gln to Glu,
reduces proliferation and tumorigenicity10. Conversely, GLS2 can be induced by the tumour
suppressor p5311, and in human hepatocellular carcinoma, エ-catenin increases the
expression of GS, which catalyses the reversed GLS reaction12. Originally, tuning of the
Gln-Glu cycle was observed in the central nervous system13 where Glu is the most abundant
neurotransmitter14. Unlike astrocytes, glioma cells can release neuro-exitotoxic amounts of
Glu, potentially promoting tumorigenesis15. Gln-addiction has been proposed as a mark of
GBM, the most aggressive glioma4. Here, we dissected the differential metabolic roles of
Gln-derived carbon and nitrogen atoms in sustaining anabolism and growth in six human
established GBM cell lines, in primary GBM stem-like cells, and in normal astrocytes.
Additionally, Gln-related metabolism was investigated in both primary orthotopic murine
xenografts and in GBM patients, leading to the identification of a GBM-astrocyte metabolic
crosstalk.
RESULTS
Gln starvation reduces GBM cell proliferation unsystematically
To explore their growth response to different nutrient supplies, GBM cells were incubated
either in DMEM containing supra-physiological concentrations of glucose and lacking some
of the non-essential amino acids, or in a newly-formulated SMEM, containing nutrient
concentrations comparable to human serum (Supplementary Table 1). Both media were
supplemented with various concentrations of Gln (Fig. 1a). In serum-like medium, all cell
lines grew comparably to or faster than cells cultured in DMEM. In both media, the minimal
Gln concentration required for maximal growth was below 0.65 mM, hereafter used as the
control concentration. In the absence of Gln, cells grew faster in SMEM, demonstrating that
medium formulation affects the response to Gln deprivation. Gln starvation hindered
proliferation to different extents (Fig. 1b and Supplementary Fig. 1a) without inducing cell
death, contrary to previous reports3,4, and to their response to glucose withdrawal (Fig. 1c).
Tardito et al. Page 2
Nat Cell Biol. Author manuscript; available in PMC 2016 June 01.
Europe P
MC
Funders A
uthor Manuscripts
Europe P
MC
Funders A
uthor Manuscripts

DNA flow-cytometry analysis showed that Gln starvation did not cause cell cycle arrest at
any particular phase (Fig. 1d and Supplementary Fig. 1b). Overall, Gln withdrawal resulted
in cell line-specific growth inhibition, ranging from 20% for U251 and SF188, to 80% for
LN18 cells (Fig. 1e), independently of the initial proliferation rate (Fig. 1f).
Gln-based anaplerosis is not essential for the proliferation of GBM cell lines
To investigate cellular metabolic alterations upon Gln starvation, the exchange rate of
metabolites between cells and medium was analysed by HPLC-MS. Gln was the second
most consumed nutrient by all cell lines (Supplementary Fig. 2 and Supplementary Table 2).
However, no clear relationship emerged between Gln consumption and Gln dependency
(Fig. 2a and Supplementary Fig.3a). In contrast, all cell lines showed a net secretion of Glu
despite its presence in the medium (Fig. 2b). Tracing 13C5-labeled Gln revealed that 38 ±
8% to 60 ± 19% (GUVW and U87 cells, respectively) of the Gln consumed was deamidated
and secreted as 13C5-Glu (Fig. 2a-b). Unexpectedly, even Gln-starved cells discharged Glu
(Fig. 2b, empty bars). Here, intracellular Gln was almost exhausted (Fig. 2c) and Glu
concentration fell by more than 50% (Fig. 2d) yet, neither acetyl-CoA (Fig. 2e) nor oleate
(Fig. 2f) levels were reduced, re-affirming that Gln does not sustain fatty acids biosynthesis
under normoxic condition16-20. Consistently, in all cell lines, less than 15% of the citrate
was derived from reductive carboxylation (13C5-Citrate; Supplementary Fig. 3b), and
labelled acetyl-CoA and oleate were barely detectable (Fig. 2e-f).
To identify the carbon source for Glu synthesis under Gln starvation, Gln-deprived LN18
and SF188 cells were incubated with 13C6-glucose. In both cases the contribution of glucose
carbons to Glu was markedly increased (Fig. 2g). Accordingly, alanine consumption was
increased (Supplementary Fig. 2, inset), providing the nitrogen required for Glu production
(Fig. 2h). Moreover, a strong direct correlation between Glu efflux and growth inhibition
was observed (Fig. 2i), suggesting that upon Gln withdrawal, Glu efflux limits the
intracellular Glu available for reactions essential for growth.
To test whether Glu efflux indeed limited both its availability and the proliferation of Gln-
starved cells, LN18 cells were incubated with sulfasalazine, an inhibitor of , a Glu/
Cystine antiporter (Fig. 2j) which is active in glioma cells15, or with 4 mM Glu, largely
exceeding the Ki for 21. In both conditions Glu release was largely inhibited (Fig. 2k).
Consistently, the activation of by increasing the extracellular concentrations of cystine,
boosted Glu efflux (Fig. 2k), firmly associating with the escape of Glu from GBM cells.
Inhibiting prevented the drop in intracellular Glu, aspartate, and citrate, caused by Gln
withdrawal (Fig. 2l-n). The level of glutathione, an alternative metabolic fate for Glu, was
also substantially decreased upon Gln starvation, and significantly replenished by Glu and
sulfasalazine (Fig. 2o). However, the drop in glutathione upon Gln starvation was not
accompanied by its increased oxidation (Supplementary Fig. 3c), indicating that Gln
delimits Glu availability for glutathione biosynthesis without causing oxidative stress.
Furthermore, adding the membrane permeable dimethylester of ウ-ketoglutarate (dm-ウKG)
to Gln-starved cells doubled the Glu efflux (Fig. 2k) and replenished Glu, aspartate, citrate
and glutathione intracellular pools (Fig. 2l-o). Overall, in the absence of Gln, inhibition
or dm-ウKG supplementation restored the cellular Glu, aspartate, citrate and glutathione
Tardito et al. Page 3
Nat Cell Biol. Author manuscript; available in PMC 2016 June 01.
Europe P
MC
Funders A
uthor Manuscripts
Europe P
MC
Funders A
uthor Manuscripts

levels to that of non-starved cells. However, maintaining the levels of these metabolites only
moderately rescued the proliferation of Gln starved cells (Fig. 2p). Together with the
observations that, under Gln starvation, intracellular oleate was unaffected (Fig. 2f), and
glucose-dependent Glu production increased (Fig. 2g-h), these results imply that the
contribution of Gln to growth is largely independent on anaplerosis.
To evaluate this directly, BPTES, a GLS inhibitor, was employed. The kinetics of Gln-
derived Glu secretion from LN18 and SF188 cells showed that BPTES inhibited GLS
activity (Fig. 2q). Accordingly, the rate of Gln consumption was reduced (Fig. 2r).
Nevertheless, at the minimum effective concentration, BPTES did not affect the growth of
the GBM lines (Fig. 2s and Supplementary Fig. 3d-i) confirming that here, GLS and Gln-
based anaplerosis are dispensable for maximal growth.
Glutamine Synthetase sustains purine availability and cell growth under Gln starvation
Next, a genome-scale constraint-based metabolic modelling approach was employed22,
searching for reactions that become essential when Gln is removed from the SMEM
medium. According to the model, GS was the only enzyme essential for sustaining biomass
production after Gln starvation (Supplementary Note).
Together, GS and GLS control Gln homeostasis by catalysing opposite reactions (Fig. 2j and
3a). The mRNA levels of GS and GLS in all cell lines revealed no pattern of Gln
dependency (Supplementary Fig. 4a). While it has been proposed that c-Myc determines Gln
addiction by increasing GLS expression3,23,24, MYC-induced lung tumours were shown to
increase GS expression2. In line with this, SF188 cells, harboring MYC amplification25, and
expressing high levels of c-Myc (Fig. 3b and supplementary Fig. 4a), showed the highest
levels of GS mRNA and protein (Fig. 3b and Supplementary Fig. 4a). In most cell lines, GS
protein levels rose upon Gln deprivation (Fig. 3b). Furthermore, GS protein levels tend to
increase in cells with decreased sensitivity to Gln withdrawal (Fig. 3c). Nevertheless, GS did
not match the residual low amount of Gln found in Gln-starved cells (Fig. 2c). To
investigate this apparent discrepancy, the metabolic flux via GS was assessed by the
incorporation of 15N-labeled ammonia ( ) into Gln in LN18 and SF188 cells, which
display low and high levels of GS, respectively. Significant levels of 15N-labeled Gln were
indeed detected in SF188 but not in LN18 cells (Fig. 3d). Next, SF188 and U251 cells,
displaying high levels of GS and low sensitivity to Gln withdrawal, were incubated with L-
methionine sulfoximine (MSO), a selective irreversible inhibitor of GS. MSO sensitized
cells to Gln starvation and, further, abolished the protective effect of Glu supplementation
(Fig. 3e). To complement this approach, GS expression was stably silenced in these cells by
two shRNA sequences (Fig. 3f). Upon Gln starvation cell proliferation (Fig. 3g) as well as
colony formation (Fig. 3h and Supplementary Fig. 4b) was lowered by GS silencing.
Supplementation with the GS substrates Glu and ammonia, rescued Gln-deprived control
cells more effectively than GS-silenced cells.
To corroborate the causal link between Gln biosynthesis and Gln-dependency, GS was
overexpressed in LN18 cells, which display low GS levels and high sensitivity to Gln
deprivation. To this end, LN18-derived clones stably expressing infra-Red Fluorescent
Tardito et al. Page 4
Nat Cell Biol. Author manuscript; available in PMC 2016 June 01.
Europe P
MC
Funders A
uthor Manuscripts
Europe P
MC
Funders A
uthor Manuscripts
Protein only (iRFP)26,27 or iRFP and GS were established. To eliminate intrinsic clonal
variability, GS expression and its effect on growth under Gln starvation were evaluated in
multiple clones (6 iRFP and 9 iRFP-GS). After five days of starvation, growth of iRFP
control cells reached, on average, 16% ± 5 % of control Gln-fed cells, while iRFP-GS clones
reached on average, 54% ± 12 % (Fig. 4a). Under Gln-supplementation, the iRFP-GS5 clone
proliferated slower than iRFP controls. This was not rectified by GS inhibition with MSO
(Fig. 5b), consistent with a reported non-metabolic, anti-proliferative role of GS28.
Nevertheless, iRFP-GS5, but not control iRFP4 cells, proliferated and formed colonies in
Gln-free medium and this growth advantage was blocked by MSO (Fig. 4b-c). These results
imply that under Gln starvation the amidation of Glu via GS sustains cell growth. In line
with this, when supplemented with 15N1-ammonia, GS-expressing cells displayed 15N
incorporation into ~50% of the total Gln pool, even when Gln fed (Fig 4d). When incubated
with 15N1-ammonia without Gln, residual intracellular Gln was higher in iRFP-GS5 cells
compared to control iRFP4 cells, and produced entirely by GS as judged by 15N
incorporation (Fig. 4d).
To explore the essentiality and metabolic fate of de novo synthesized Gln under Gln
starvation, we employed Flux Imbalance Analysis29. In silico, nucleotide biosynthesis
delimited cell growth, with a higher weighted cost for purine biosynthesis (Supplementary
Note). Indeed, regardless of GS status, Gln removal only marginally affected the levels of
the pyrimidine nucleotides uridine monophosphate (UMP) (Fig. 4e). Moreover, the
contribution of GS-derived 15N1-Gln to 15N1-UMP showed that the low GS-activity in
iRFP4 cells could maintain UMP production. Similarly, the biosynthesis of UDP-N-
acetylglucosamine, an intermediate of hexosamine biosynthesis, which requires Gln-derived
nitrogen, was also sustained in iRFP4 cells during Gln starvation (Supplementary Fig. 4c).
By contrast, 5-Aminoimidazole-4-carboxamide ribotide (AICAR), a purine precursor for
inosine monophosphate (IMP), dropped to undetectable levels in Gln-starved iRFP4 cells
(Fig. 4f). The ammonia-derived AICAR (15N2-isotopologue) in Gln-starved iRFP-GS5 cells
demonstrates that GS contributes the two Gln nitrogen atoms required for its biosynthesis
(Fig. 4f). Thus, 15N2-IMP accumulated in Gln-deprived iRFP-GS5 cells, but not in iRFP4
cells (Fig. 4g). The IMP found in iRFP-GS5 starved cells corroborates the reported
inhibitory effect of Gln deprivation on IMP dehydrogenase30, and suggests that under these
conditions over-activity of GS exceeds the rate of IMP conversion to AMP and GMP.
Indeed, AMP levels were not significantly affected by either Gln presence or GS
overexpression (Fig. 4h). Moreover, ATP and GTP levels, indices of the cell’ s bioenergetics
state, were comparable between iRFP-GS5 and iRFP4 starved cells (Fig. 4i-j). Conversely
the fractions of 15N labelled AMP, ATP, and GTP found in iRFP-GS5 cells exceeded those
of iRFP4 cells, demonstrating that, under Gln starvation, GS sustains de novo biosynthesis of
purine nucleotides.
Notably, the reduction in IMP caused by Gln starvation in the six GBM cell lines correlated
with Gln-dependency (Fig. 4k-l). Accordingly, adenosine, but not guanosine or pyrimidine
nucleosides, partially restored Gln-independent growth of iRFP4 cells (Fig. 4m).
Furthermore, the combined addition of adenosine and Glu compensated for the lack of
exogenous Gln in iRFP4 cells (Fig. 4m), and Glu alone completely restored proliferation of
Tardito et al. Page 5
Nat Cell Biol. Author manuscript; available in PMC 2016 June 01.
Europe P
MC
Funders A
uthor Manuscripts
Europe P
MC
Funders A
uthor Manuscripts
iRFP-GS5 starved cells (Fig. 4n). In both lines, MSO prevented the Glu rescue, confirming
that under Gln starvation Glu availability determines Gln production rather than anaplerosis.
The effect of adenosine on Gln-starved cells was MSO-independent (Fig. 4m-n), since it
supported proliferation downstream of GS.
Primary human GBM stem-like cells are self-sufficient for Gln requirements
The clinical relevance of studying established glioma cell lines has been questioned due to
their inability to form tumours that recapitulate human pathology. Therefore, we utilized
three primary patient-derived GBM cell lines (E2, R10, R24), generating paired populations
of differentiated cells (DIFF) and glioma stem-like cells (GSC)31. Stem cell markers such as
CD133, Olig2 and Sox2, were predominantly expressed in GSC but not DIFF, however the
astrocytic marker glial fibrillary acidic protein (GFAP), was not consistently associated with
the DIFF population (Fig. 5a). The expression of GS was markedly higher in all GSC
compared to DIFF (Fig. 5a) and while DIFF proliferation was attenuated in the absence of
Gln, GSC grew independently of Gln supplementation (Fig. 5b). Once more, the growth of
Gln-starved DIFF and GSC was abolished by MSO (Fig. 5b).
Next, the exchange rates (Fig. 5c-d) and intracellular composition of metabolites (Fig. 5e-h)
were analysed in these primary Gln-starved or control cells, in the presence of 15N1-
ammonia. The net Gln consumption was consistently higher in DIFF compared to GSC,
whereby R24-GSC demonstrated no net Gln consumption (Fig. 5c). As the
intracellular 15N1-Gln fraction shows, GSC have higher GS activity compared to DIFF and
sustain higher residual Gln levels upon starvation (Fig. 5e). The differences in Glu exchange
rates were also striking: GSC exhibited a net uptake of Glu, while the reverse occurred in
DIFF (Fig 5d). Also, upon Gln withdrawal, intracellular levels of citrate (Fig. 5g) decreased
in DIFF, but remained unaltered in GSC, showing that Gln-derived anaplerosis was
redundant to the stem-like population. Finally ammonia-derived 15N incorporation into
purine nucleotides (15N2-AMP) under Gln starvation was greater in GSC compared to the
paired DIFF.
Human GBM tumours rely on in situ de novo Gln synthesis
As shown above, GS activity, largely determining Gln dependency, varies between
established and primary human GBM cells. Similarly, tissue microarray (TMA) analysis
showed that GS expression varies between human GBM patients (n=209), resembling a
Gaussian distribution ranging from tumours with low GS levels, comparable to neurons
(25% of patients), to high-expression tumours comparable to astrocytes (15%) (Fig 6a-b).
However, GS expression did not predict patient median survival (Fig. 6c). Of 20 biopsies,
from which core TMA were sampled, 5 showed substantial intra-tumoral GS
immunostaining heterogeneity (3 examples are reported in Supplementary Fig. 5). Most
GBMs either showed GS uniformity, or a mosaic infiltration of GS-positive cells, suggesting
autonomous intra-tumoral Gln biosynthetic capacity. To assess this hypothesis in human
tumours, seven GBM patients were injected with 13C6-glucose prior to surgery, and
metabolites were extracted from the resected tumours and their edematous margins. The
metabolic analysis reliably discriminated between tumour and adjacent tissues by using the
choline to creatine ratio, a parameter for classifying brain tumours by MR spectroscopy32
Tardito et al. Page 6
Nat Cell Biol. Author manuscript; available in PMC 2016 June 01.
Europe P
MC
Funders A
uthor Manuscripts
Europe P
MC
Funders A
uthor Manuscripts

(Fig. 6d). No significant difference in Gln content was observed between tumour and
adjacent tissues (Fig. 6e). At the time of resection, 13C6-glucose enrichment in serums
ranged between 16% and 50% (Fig. 6f, and Supplementary Fig. 6a). Glucose-derived 13C-
Gln was detected in 6/7 tumours and in 7/7 adjacent edematous tissues with an enrichment
ranging between 1% and 12% (Fig. 6g). In 3/5 patients the fraction of glucose-derived Gln
in the tumour was higher than in the serum sample, and so not in equilibrium with the
circulating Gln, suggesting that the tumour Gln pool is synthesized in situ and/or provided
by adjacent normal brain.
To complement the analysis in patients, mice were orthotopically transplanted with a GS
positive human GBM (P3, Fig. 6h) and injected with 13C-labelled glucose or Gln ~20
minutes prior to tissue extraction. An enrichment of 44 ± 3% of 13C6-glucose was found in
the blood at the time of tissue sampling. The intracellular hexoses phosphate pool derived
from 13C6-glucose was ~10% and 5% in tumour and contralateral brain tissue, respectively
(Fig. 6i). Concomitantly, ~10% and 15% of the total Gln was labelled (13C2) from 13C6-
glucose in tumours and contralateral brain, respectively (Fig. 6i), consistent with GS activity
in those tissues. After 13C5-Gln injection, the enrichment in circulating 13C5-Gln at the time
of tissue sampling was 17 ± 1%. Isotopologue distribution analysis showed an enrichment
in 13C5-Gln of <5% in both tumour and contralateral brain tissues (Fig. 6j), while in the
liver, 13C5-Gln presented 12% of the total (Supplementary Fig. 6e). Products of
glutaminolysis, such as Glu and ウ-ketoglutarate, were labelled below 1% in both tumour and
brain tissues but ~5% in liver (Fig. 6j and Supplementary Fig. 6e). These results suggest
slow kinetics both for Gln uptake from the blood, and for glutaminolysis in GBM and brain
tissues, compared to liver. Similar results were obtained upon constant carotid artery 13C5-
Gln infusion: within two hours, circulating 13C5-Gln levels plateaued at ~20% enrichment,
with an overall ~70% increase in steady-state levels of Gln (Supplementary Fig. 6f). Here
too, 13C5-Gln and glutaminolysis products were scarce in tumour and contralateral brain
(Supplementary Fig. 6h-i) indicating that physiologically, circulating Gln does not
significantly supply Gln to the brain or the tumour within it.
Next, Erwinase, an enzyme that temporarily depletes circulating asparagine (Asn) and
significantly reduces Gln9,33 (Fig 7a), was injected daily (five times per week) into mice
bearing GS-negative orthotopic GBM xenografts (T101, Fig. 7b). Erwinase reduced intra-
tumoral and intracerebral Asn but not Gln (Fig. 7c). The diffuse morphology of GS-negative
tumours impaired Ex vivo MRI analysis volumetric quantification (Fig. 7d). Histological
reconstruction to assess tumour burden (Fig. 7e) revealed no significant differences between
control and Erwinase treated groups (Fig. 7f). Altogether, these results indicate that Gln is
not provided to GBM by the blood and so, the proximity of GS-positive astrocytes and GS-
negative glioma cells (Fig. 7b and 7g as representatives) suggest that astrocytes may be a
source of Gln. Indeed, when mice bearing GS-negative GBM xenografts (T407, Fig 7g)
were infused with 15N1-ammonia into the carotid artery for 4 hours, the fraction of 15N-Gln
was ~5% in both tumour and contralateral brain tissues (Fig 7h) indicating that they are a
secluded, autonomous compartment for Gln biosynthesis and utilization, where GS
expressing cells supply Gln to GS-negative ones.
Tardito et al. Page 7
Nat Cell Biol. Author manuscript; available in PMC 2016 June 01.
Europe P
MC
Funders A
uthor Manuscripts
Europe P
MC
Funders A
uthor Manuscripts

Gln-starved GBM cells feed on astrocyte-derived Gln
To assess this potential interaction, rat primary cortical astrocytes were cultured and their
Gln requirement and metabolism investigated. Similar to GBM cells, the minimal Gln
concentration required for maximal astrocyte growth was ~0.65 mM (Fig. 8a). Nonetheless,
astrocyte proliferation was barely affected by Gln deprivation (Fig. 8b). As observed in the
human TMA (Fig. 6a), GS protein levels in astrocytes and in the highest expressing GBM
cells were comparable (Fig. 8c). However, only astrocytes demonstrated no net Gln
consumption but rather, rapid Glu uptake (Fig. 8d-e), in line with the expression of
Excitatory Amino Acids Transporters (EAAT) in this cell type34. Under Gln starvation, Glu
consumption was unaffected and paralleled by an equimolar net Gln efflux (Fig. 8d-e). The
absence of Gln in the medium reduced intracellular Gln, but not Glu (Fig. 8f-g).
Moreover, 13C6-glucose tracing showed that only 30-40% of both intracellular Glu and Gln
(Fig. 8f-g) were glucose-derived. Astrocytes maintained ~30% of the control level of
intracellular Gln under Gln starvation (Fig. 8f and 8h), fitting with high GS expression. Gln
maintenance depended on GS activity, as seen from both 15N1-ammonia tracing and GS
inhibition by MSO (Fig. 8h). Moreover, GS inhibition dramatically elevated the intracellular
amounts of its substrate, Glu (Fig. 8i), without changing the steady state levels of the Gln-
product, AMP (Fig. 8j). However, combined Gln withdrawal and GS inhibition significantly
reduced the labelled fraction of AMP derived from de novo synthesis (15N2 and 15N3; Fig.
8j), and hindered proliferation (Fig. 8k).
Finally, in co-culture, astrocytes enabled the proliferation of GS-negative LN18 iRFP4 cells
without Gln supplementation (Fig. 8l). Moreover, transwell co-culturing of these cells
showed that the factor conveying growth was diffusible (Fig. 8m-n). The addition of
Erwinase, which depletes both Asn and Gln, prevented the rescue of Gln-deprived cells by
astrocytes (Fig. 8m-n). Since Asn was present in the media during all Gln-starvation
experiments, and since astrocytes consume Asn but produce and secrete Gln (Fig. 8d and
Supplementary Fig. 6k), these results designate astrocyte-derived Gln as the growth-
supporting factor for Gln-starved GBM cells.
DISCUSSION
Gln plays multiple metabolic and non-metabolic roles. Consequently, the dependency of
cancer cells on Gln is difficult to discern. Nevertheless, it was demonstrated here that the
Gln requirement in GBM goes beyond anaplerosis (Fig 2q-s). We identified two alternative
metabolic determinants for Gln sensitivity: 1) Glu release via the antiporter and 2) GS-
dependent conversion of Glu to Gln. GS and seemingly compete for cytoplasmic Glu
which, during Gln starvation, becomes limiting (Fig. 2d,l). Nevertheless, the rescuing effect
achieved by maintaining intracellular Glu through inhibition depends on GS activity
(Fig. 3e, h, g and Fig. 4m-n). These results demonstrate that upon Gln starvation, Glu
conversion to Gln constitutes a critically limiting reaction required for growth. This
metabolic trait applies to established GBM lines, and to naïve primary cells. Indeed, when
primary GBM cells were maintained in a stem-like state, GS expression was dramatically
increased (Fig. 5a) and Glu was taken-up rather than released (Fig. 5d). Both responses
enable growth of glioma stem-like cells independent of extracellular Gln (Fig. 5b). The fate
Tardito et al. Page 8
Nat Cell Biol. Author manuscript; available in PMC 2016 June 01.
Europe P
MC
Funders A
uthor Manuscripts
Europe P
MC
Funders A
uthor Manuscripts

of newly-synthesized Gln in both established and primary GBM cells was followed by 15N1-
ammonia tracing, identifying AMP biosynthesis pathway as a significant player in Gln
dependency (Fig. 4 d-j and Fig. 5h).
GS is found in the majority of human GBM (Fig. 6a-b), its expression associated with poor
prognosis35 though this is not supported by our TMA study. However, we show that GS
expression varies greatly between tumours, ranging from negative, comparable to GS
expression in neurons, to high, as in normal astrocytes. This variation accords with a Gln-
rich tumour microenvironment, which alleviates the need to synthesize Gln. Nevertheless, in
agreement with previous reports36,37, it is shown here that most human GBM, as well as
GS-proficient orthotopic GBM xenografts, withdraw carbons from the TCA cycle
(cataplerosis) to synthesize Gln via GS. When compared to the liver, GBM are inclined
towards net Gln synthesis, rather than glutaminolysis (Fig. 6i and Supplementary Fig. 6d).
Accordingly, the circulation provides minimal amounts of Gln to normal brain38 and GBM
(Fig 6l and Supplementary Fig. 6f, h, i). Moreover, a marked decrease in circulating Gln
levels did not affect tumour growth (Fig 7a-h) and, GBM expressing low GS had levels of
ammonia-derived Gln comparable to contralateral brain (Fig. 7j). The stability of Gln levels
may explain the heterogeneity in GS expression between patients (Fig 6b) and within some
tumours (Supplementary Fig. 5): GS-positive astrocytes and/or GBM cells (potentially GSC)
excrete Gln that supports the growth of GS-negative GBM cells. Indeed, primary astrocytes
in culture retain the metabolic traits of Glu uptake, GS-dependent Gln synthesis and Gln
secretion, and support the proliferation of GS-negative, Gln-auxotrophic GBM cells (Fig 8l-
n). Thus, this brain-to-tumour metabolic communication portrays a scenario in which Gln,
provided by astrocytes, feeds GS-negative cancer cells (Fig. 3g). Indeed, GS-positive
cellular protrusions of astrocytes surround GS-negative GBM cells in orthotopic xenografts
and human tumours (Fig 7b, g and Supplementary Fig. 5p). This ‘ parasitic’ behaviour of
cancer cells could divert the physiological Gln-Glu cycle in the brain and, indeed, an
increase in epileptic seizures has been reported for patients with GBM expressing low GS39.
METHODS
Cell cultures
The human glioblastoma cell lines MOG-G-UVW, LN-18, LN-229, SF-188, U-251 MG,
U-87 MG (hereafter referred to as GUVW, LN18, LN229, SF188, U251, U87, respectively)
were obtained from the following sources: GUVW: frozen stock originally isolated by Dr
Ian Freshney at the University of Glasgow; LN18 and LN229: ATCC; SF188: Brain Tumour
Tissue Bank University of California San Francisco; U251 and U87 were kindly given by
Prof Kevin Ryan and Prof Anthony Chalmers, respectively. The cell lines were
authenticated using Promega GenePrint 10 system (STR multiplex assay that amplifies 9
tetranucleotide repeat loci and the Amelogenin gender determining marker). No cell line
used in the manuscript has been found in the ICLAC database of commonly misidentified
cell lines. Cortical Astrocytes were generated from the cortex of P7 Sprague-Dawley rat
pups (unclassified gender). Briefly both cortices were removed from each pup cleared of
meninges and enzymatically dissociated and purified as previously described. Tissue from 2
pups was added to each 75cm2 tissue culture poly-L-Lysine coated flask (13μg/ml, Sigma).
Tardito et al. Page 9
Nat Cell Biol. Author manuscript; available in PMC 2016 June 01.
Europe P
MC
Funders A
uthor Manuscripts
Europe P
MC
Funders A
uthor Manuscripts
Astrocytes prepared in this way were over 95% pure as assessed by immunoreactivity to
glial fibrillary acidic protein41.
All the cell lines tested negative for mycoplasma with MycoAlert™ when tested with
Mycoplasma Detection Kit (Lonza). Cells were maintained in DMEM (Invitrogen
21969-035) supplemented with 2 mM Glutamine and 10% FBS. All the experiments were
performed on cells seeded and incubated for at least 24h in a serum-like medium, SMEM,
formulated as reported in Supplementary Table 1, and supplemented with 10% FBS,
dialyzed against a semi-permeable cellulose membrane (3.5kDa MW cutoff).
For co-culture experiments 30,000 astrocytes /well were plated in a 24 well plate and
allowed to grow to confluence, then LN18-derived clone stably expressing infrared
fluorescent protein, iRFP4, was plated 25,000 cells/well or 5000 iRFP4 cells/transwell
(Costar, CLS3413) were seeded in complete medium for direct or transwell co-culture
experiments, respectively. The day after iRFP4 cell cultures were extensively washed with
PBS, a transwell was inserted in wells containing astrocytes, and medium was replaced with
the conditions indicated in Figure 8l, n. Half of the medium volume was renewed daily for
the whole duration of the experiments. Growth was assessed by measuring fluorescence with
a Licor Odyssey scanner and quantified Image Studio 2.0 software.
E2, R10 and R24 human glioblastoma cells were obtained and cultured as previously
reported with minor modifications31. In brief differentiated (DIFF) cells were maintained in
advanced DMEM/ F-12 (Gibco) supplemented with 10% FBS and 2mM L-Gln, while
glioma stem-like cells (GSC) were maintained in advanced DMEM/F-12 supplemented with
B27 (1%, Invitrogen), N2 (0.5%, Invitrogen), 4 μg/ml heparin, 20 ng/ml fibroblast growth
factor 2 (bFGF, Sigma), 20 ng/ml epidermal growth factor (EGF, Sigma), 1mM pyruvate,
and 2mM L-Glutamine. For all the experiments stem cells were seeded and incubated in
SMEM supplemented as described above, while DIFF cells were seeded and incubated in
advanced DMEM/F-12 supplemented with 10% dialyzed FBS. 0.65mM Glutamine was
added as indicated in figures.
Cell number assessment
Cells were plated at a density of 20000 cells/well in 24 well plates. Cell number was
assessed at the specified experimental time as follows: each well was washed twice with
PBS, trypsinized, cells were re-suspended in a Casyton solution and counted with a Casy
cell counter. The Doubling Time (DT) was obtained using the Exponential Growth equation
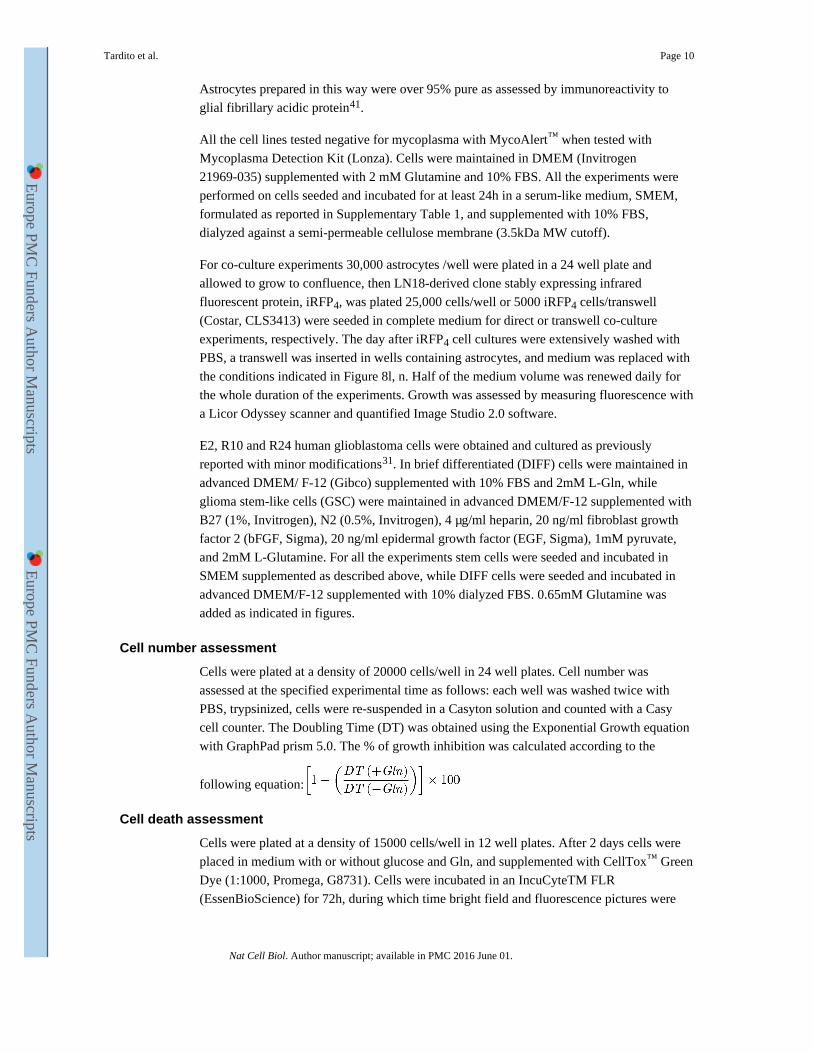
with GraphPad prism 5.0. The % of growth inhibition was calculated according to the
following equation:
Cell death assessment
Cells were plated at a density of 15000 cells/well in 12 well plates. After 2 days cells were
placed in medium with or without glucose and Gln, and supplemented with CellTox™ Green
Dye (1:1000, Promega, G8731). Cells were incubated in an IncuCyteTM FLR
(EssenBioScience) for 72h, during which time bright field and fluorescence pictures were
Tardito et al. Page 10
Nat Cell Biol. Author manuscript; available in PMC 2016 June 01.
Europe P
MC
Funders A
uthor Manuscripts
Europe P
MC
Funders A
uthor Manuscripts

taken every 15 minutes. For each time point a cell death index was calculated by dividing
the number of dead cells on the confluency index.
Cell cycle analysis
Culture media and cells were collected, centrifuged and washed with PBS. Cells were then
fixed with cold methanol and stained with a PBS solution containing propidium idodide
(100μg/ml) and RNAase A (250 μg/ml). DNA nuclear content was measured by using a
Beckton Dickinson FACScan flow cytometer and data analyzed with the FlowJo software.
Tissue Microarray (TMA) and immunohistochemistry (IHC)
The collection of human biopsy tissue was approved by the regional ethical committee at
Haukeland University Hospital, Bergen, Norway (REK 013.09). All patients gave a written
informed consent for tumour biopsy collection and signed a declaration permitting the use of
their biopsy specimens for research. Core tissue of glioblastoma cancer tissue (n=209) were
identified by a pathologist, and collected from representative areas of tumours derived from
patients’ surgical resection. Tissue cores were collected in triplicate for each patient.
Follow-up details including date and cause of death were collected. For IHC analysis of the
TMA, and mouse brain slices, the following procedure was followed. Epitope retrieval was
performed at 98°C for 15’ in citrate buffer, pH 6. The immunostaining was performed using
an EnVision System-HRP DAB (Dako, K4006). The cores were incubated over night with
primary antibody. Cores were counterstained with haematoxylin, dehydrated and
coverslipped. The staining was quantified using a weighted histoscore method with a final
value range 0–300. The intensity of the immunostaining observed for normal astrocytes was
classified as 300 and used as reference. Low- medium- and high-Glutamine Synthetase (GS)
expressing groups were defined as reported in Figure 6b. For TMA and IHC the following
antibodies were diluted in a solution of 5% BSA in TBS-tween and employed at the
specified dilutions: purified mouse anti-human monoclonal GS antibody (BD transduction
laboratories, Cat. 610518, clone 6 at a final concentration of 250ng/ml); mouse monoclonal
anti-human nestin antibody (Abcam ab6320, clone 3k1, 1:500); mouse monoclonal anti-
human EGFR antibody (Dako 7239 clone E30, 1:200, 1h at room temperature). For tumour
volume quantification by IHC the mouse brain was paraffin embedded and entirely sliced
into sections of 8μm. Two sections were loaded on each slide, and one slide in every 10 was
stained for EGFR. Digital images were acquired with a Leica SCN400 Slide scanner, loaded
into Matlab, calibrated and pixels positive for the staining were identified and used to
quantify tumour volume. All IHC staining shown are representative of three or more
sections.
Metabolic study in GBM patients
Before undergoing surgical tumour resection, seven GBM patients were infused for 15
minutes with 20 gr of 13C6-Glucose. During the operation tissue fragments from the core
and peripheral region of the tumour were stereotactically sampled (~200 mg for each
region). On average the specimens were snap-frozen 47 minutes after the end of the glucose
injection (range 30-80 minutes). Peripheral blood samples were also collected at the same
time of tissue sampling. Sub-fragments of frozen tissues (15-25 mg) were further dissected
from peripheral and core regions of the tumour, and from edematous adjacent tissue. The
Tardito et al. Page 11
Nat Cell Biol. Author manuscript; available in PMC 2016 June 01.
Europe P
MC
Funders A
uthor Manuscripts
Europe P
MC
Funders A
uthor Manuscripts

samples were extracted on dry ice and processed as described below for human orthotopic
GBM xenografts.
Informed consent was obtained from all human subjects involved in the study, the heavy
isotope administration and the collection of tissue from surgical resections was approved by
the regional ethical committee at Haukeland University Hospital, Bergen, Norway (REK
2010/130-2).
Primary orthotopic human GBM xenografts
Patient derived GBM xenografts were generated as previously reported42,43. Briefly, GBM
patient-derived spheroids were stereotactically implanted into the right frontal cortex of 8-12
weeks old, male and female, NOD-SCID mice (Charles River, Lyon) using a Hamilton
syringe (Hamilton, Reno, USA). After 4-6 weeks P3 GBM tumour was fully established in
the brain, and U-13C6-glucose or U-13C5-glutamine (Cambridge Isotope Laboratories,
Tewksbury, MA) were injected as a bolus in the tail vein at a dose of 1mg/gr and 0.15mg/gr
of body weight respectively. 22 minutes after injection the animals were euthanized, organs
were dissected, and tumour and contralateral brain fragments were snap frozen. For
intracarotid infusion the mice were kept under anesthesia with ketamine medetomidine
isoflurane and underwent surgical procedure to expose the right carotid artery.
4.7μmoles/Kg/min of 15N1 ammonia was infused 0.833μl/min for 4h in NOD SCID mice
(Charles River, Lyon) xenografted orthotopically with T407 GBM. 13μmoles/kg/min
of 13C5-glutamine were infused 0.125μl/min for 4h in 8-weeks old, female, Swiss Nu/Nu
mice (Charles River, Lyon) xenografted orthotopically with the GS-positive T16 GBM. To
assess the effects of Erwinase, 8-weeks old, female, Swiss Nu/Nu mice (Charles River,
Lyon) were implanted with T101 tumour spheroids (six/mouse). 42 days after implantation
mice were randomly assigned to Erwinase treatment or control group. Erwinase was injected
intraperitoneal 5U/gr of body weight, five times / week. The treatment continued for 6
weeks. Mice of the control group were intraperitoneally injected with saline solution. Mice
were euthanized six hours after the last injection and tumour and contralateral brain
fragments were snap frozen for metabolic analysis. Whole brains were immediately fixed in
4% paraformaldehyde for ex vivo MRI. For metabolic analysis, 10-20mg of tissue were
extracted with a beads mill (Qiagen, Tissuelyzer) in a solution containing 20% water, 50%
Methanol, 30% Acetonitrile (25μl of extraction solution/mg tissue). The extracts were spun
down at 16000g for 10 min and supernatants stored −80°C for LC-MS analysis. Human
glioblastoma biopsies were obtained from the Neurosurgery Department of the Centre
Hospitalier in Luxembourg (CHL). All patients had provided written informed consent, with
procedures that were approved for the project (project number: REC-LRNO-20110708) by
the National Research Ethics Committee for Luxembourg (CNER). The handling of the
animals and the surgical procedures were performed in accordance with the European
Directive on animal experimentation (2010/63/EU) and the national regulations of
Luxembourg and the local ethical committee (the Animal Welfare Structure (AWS) LIH)
approved the protocol (protocol number: LRNO-2014-06).
MRI analysis— At the end of Erwinase treatment the brains of the 20-weeks old Swiss
Nu/Nu mice with T101 tumours (7 female mice/group) were harvested and fixed in 4%
Tardito et al. Page 12
Nat Cell Biol. Author manuscript; available in PMC 2016 June 01.
Europe P
MC
Funders A
uthor Manuscripts
Europe P
MC
Funders A
uthor Manuscripts

paraformaldehyde. Ex vivo scans were acquired on a 7T micro-MRI system (Bruker
PharmaScan) using a mouse brain volume coil. The T2-weighted MRI protocol used a Fast
Spin Echo sequence with TE = 36 ms, TR = 4300 ms, and 63 μm in plane resolution. The
Diffusion Weighted Imaging (DWI) sequence used EPI readout with TE=28.5ms,
TR=7000ms and b-values ranging from 500 to 6000 s/mm2 in 3 directions. The tumours
were independently delineated by two users (A.O. and O.K.) using Paravision 5.0 (Bruker;
Ettlingen, Germany).
Immunoblotting
Cells were washed twice with cold PBS and lysed in RIPA buffer (20 mM Tris-HCl, pH 7.5,
150 mM NaCl, 1 mM EDTA, 1mM EGTA, 1% Triton, 2,5mM sodium pyrophosphate, 1mM
glycerophosphate) supplemented with 1mM Na3VO4, 1mM NaF and protein inhibitor
cocktail. Protein concentration was determined with the bicinchoninic acid assay (Thermo
scientific) using BSA as a standard. Equal amounts of protein were mixed with Laemmli
buffer 4× (250 mM Tris-HCl, pH 6.8, 8% SDS, 40% glycerol, 0.4 M DTT), warmed at 95°C
for 5 min, and loaded on 10% gels for SDS-PAGE. After electrophoretic separation, proteins
were blotted onto 0.22 mm nitrocellulose membrane (Millipore), blocked with 5% non-fat
milk in TBS-Tween, and incubated at 4°C overnight with the following antibodies:
Glutamine Synthetase (BD Transduction Labs, 610517, clone 6, 1:1000), エ-tubulin (Sigma
Aldrich, T5201, clone AA2, 1:5000), GLS (Abcam, ab60709, 1:1000), c-Myc (Cell
Signalling Technology, 5605, clone D84C12, 1:1000) Glial Fibrillary Acidic Protein (Dako,
Z0334, 1:10000), SOX2 (Abcam, ab75485, clone 57CT23.3.4, 1:1000), CD133 (Miltenyl
Biotec, W6B3C1, clone W6B3C1, 1:1000), Olig2 (R&D system, AF2418, 1:500), Actin
(Santa Cruz Biotechnology, sc-1616-R, 1:1000). Membranes were then washed and
incubated with secondary donkey anti-rabbit (Licor 926 32213, 1:10000) or donkey anti-
mouse (Licor 926 32212, 1:10000). The IR scanning was performed using a Licor Odyssey
scanner and acquired using Image Studio 2.0. All western blots shown are representative of
two experiments unless otherwise indicated.
qPCR analysis
For qPCR analysis 1 μg of total RNA was isolated from cells with RNeasy Mini Kit
(Qiagen) and retro-transcribed into cDNA using M-Mulv Reverse Transcriptase and random
hexamers. qPCR reactions were performed using a Fast Sybr Green Master Mix (Applied
Biosystems), 0.5 mM primers, ROX dye, and a 25ng of cDNA in a final volume of 20 μl
according to the manufacturer’ s instructions. The following primers were used MYC_F
CACCAGCAGCGACTCTGA, MYC_R GATCCAGACTCTGACCTTTTGC; GS_F
TCATCTTGCATCGTGTGTGTG, GS_R CTTCAGACCATTCTCCTCCCG; GLS_F
GAAATTCGGAACAAGACTGTG, GLS_R AACTTCGATGTGTCCTTCAC エ-actin_F
TCCATCATGAAGTGTGACGT, エ-actin_R TACTCCTGCTTGCTGATCCAC. The
following PCR steps were performed on the 7500 Fast Real-Time PCR System (Life
Technologies Corporation), 15 min at 95°C followed by 40 cycles of 10 s at 94°C, 30 s at
55°C, 30 s at 72°C. A 10 min final step at 72°C was performed to visualize the PCR
products by means of the melting curves. The expression levels of the indicated genes were
calculated using the ΔΔCT method using actin for normalization.
Tardito et al. Page 13
Nat Cell Biol. Author manuscript; available in PMC 2016 June 01.
Europe P
MC
Funders A
uthor Manuscripts
Europe P
MC
Funders A
uthor Manuscripts
Metabolites Extraction and HPLC-MS
The established cell lines were plated in 6 well plates in complete DMEM from 125000 to
250000 cells / well. After 24h the medium was replaced with SMEM supplemented with
10% dialyzed FBS. Stem-like and differentiated primary glioma stem cells were plated at
150000 cells / well in 6 well plates in SMEM supplemented as described in the cell culture
section. When optimal confluence was reached (1-3 days) 3 wells were extracted as
described below, and the protein determined (μg prott0). The media in the remaining wells
was changed with 2 or 7 ml/well of complete SMEM for the analysis of metabolites present
in the medium or in the cells, respectively. U-13C5-Gln (0.65 mM, Cambridge Isotopes),
U-13C6-Glucose (5.56mM, Cambridge Isotopes), or 15N1-Ammonia (0.8mM Sigma) were
supplemented as indicated in figures. Cells, as well as parallel cell-free wells, were
incubated for 24h at 37°C. At the end of the incubation, an aliquot of the media was diluted
in a solution containing 20% water, 50% Methanol, and 30% Acetonitrile. The medium
derived from wells devoid of cells, was used to estimate the exchange rates of metabolites.
For the profiling of intracellular metabolites, monolayers were rapidly washed 3 times with
ice-cold PBS and extracted with an aqueous solution of 50% Methanol, and 30%
Acetonitrile. Both media and cell extracts were centrifuged 16000g for 10min at 4°C and the
supernatants were analyzed by means of HPLC-MS. The extracted cell monolayer was used
for protein determination (μg prott24) with a Lowry assay. Aliquots of freshly prepared
SMEM, without FBS, and spiked with known concentrations of lactate were processed in
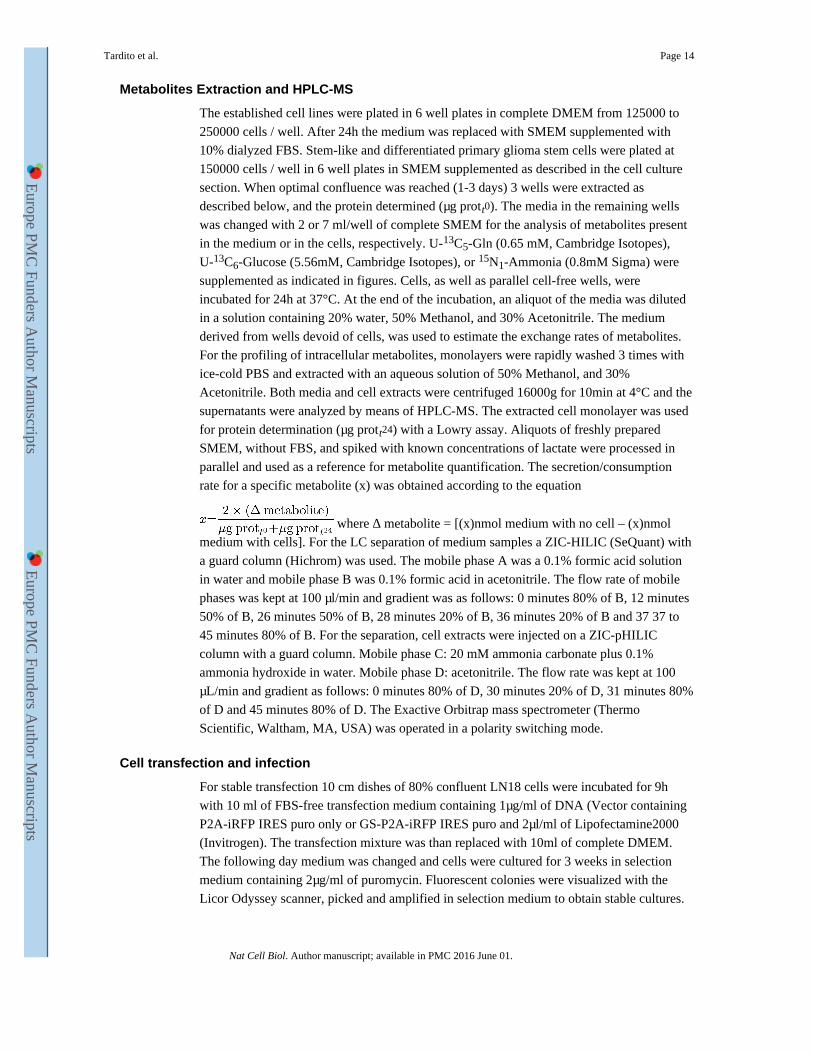
parallel and used as a reference for metabolite quantification. The secretion/consumption
rate for a specific metabolite (x) was obtained according to the equation
where Δ metabolite = [(x)nmol medium with no cell – (x)nmol
medium with cells]. For the LC separation of medium samples a ZIC-HILIC (SeQuant) with
a guard column (Hichrom) was used. The mobile phase A was a 0.1% formic acid solution
in water and mobile phase B was 0.1% formic acid in acetonitrile. The flow rate of mobile
phases was kept at 100 μl/min and gradient was as follows: 0 minutes 80% of B, 12 minutes
50% of B, 26 minutes 50% of B, 28 minutes 20% of B, 36 minutes 20% of B and 37 37 to
45 minutes 80% of B. For the separation, cell extracts were injected on a ZIC-pHILIC
column with a guard column. Mobile phase C: 20 mM ammonia carbonate plus 0.1%
ammonia hydroxide in water. Mobile phase D: acetonitrile. The flow rate was kept at 100
μL/min and gradient as follows: 0 minutes 80% of D, 30 minutes 20% of D, 31 minutes 80%
of D and 45 minutes 80% of D. The Exactive Orbitrap mass spectrometer (Thermo
Scientific, Waltham, MA, USA) was operated in a polarity switching mode.
Cell transfection and infection
For stable transfection 10 cm dishes of 80% confluent LN18 cells were incubated for 9h
with 10 ml of FBS-free transfection medium containing 1μg/ml of DNA (Vector containing
P2A-iRFP IRES puro only or GS-P2A-iRFP IRES puro and 2μl/ml of Lipofectamine2000
(Invitrogen). The transfection mixture was than replaced with 10ml of complete DMEM.
The following day medium was changed and cells were cultured for 3 weeks in selection
medium containing 2μg/ml of puromycin. Fluorescent colonies were visualized with the
Licor Odyssey scanner, picked and amplified in selection medium to obtain stable cultures.
Tardito et al. Page 14
Nat Cell Biol. Author manuscript; available in PMC 2016 June 01.
Europe P
MC
Funders A
uthor Manuscripts
Europe P
MC
Funders A
uthor Manuscripts

For the establishment of cell lines expressing shRNA against Glutamine Synthetase (GS)
four human unique 29mer shRNA constructs and scrambled negative control non effective
shRNA cassette (NTC) in lentiviral GFP vector were employed according to the
manufacturer’ s instructions (TL312740a: GGTGAGAAAGTCCAGGCCATGTATATCTG;
TL312740b: GAATGGTGCAGGCTGCCATACCAACTTCA; TL312740c:
TGGTACTGGAGAAGGACTGCGCTGCAAGA; TL312740d:
GGCACACCTGTAAACGGATAATGGACATG; TR30021ntc:
GCACTACCAGAGCTAACTCAGATAGTACT, Origene). TL312740b TL312740d and
TR30021ntc are reported in the manuscript as shGS-1 shGS-2 and shNTC respectively.
Briefly, lentiviruses were produced by co-transfecting HEK293T cells with each shRNA
plasmid, lentiviral plasmid psPAX2-1, and packaging plasmid pVSV-G-1, according to a
standard calcium phosphate procedure. Supernatants containing virus were collected, filtered
and frozen in stocks at −80°C. For infection of recipient cells the supernatant was thawed,
mixed with Hexadimethrine bromide (Sigma, H9268, 8μg/ml) and incubated for 24 hours
with the cells. Infected cells were selected for 2 weeks in medium containing 1-3μg/ml
puromycin.
Colony forming assay
iRFP and iRFP-GS expressing cells were plated at 300cells/well in 6 wells plates in
complete SMEM, in the absence or presence of 0.65mM Gln and 1mM MSO as indicated.
After 3 weeks, colonies were fixed with trichloroacetic acid, stained with SRB and plates
were scanned using a Licor Odyssey scanner. Images were acquired using Image Studio 2.0.
SF188 and U251 cells expressing shNTC and shGS sequences were plated at 500 and 350
cells/well in 6 wells, respectively. Cells were incubated in complete SMEM and
supplemented as indicated in Figure 3 legend. 12-17 days after seeding colonies were fixed,
stained, and representative images obtained as described above. For the quantification of
colonies surface area an ImageJ macro was designed and run. The values obtained from the
macro were normalized for the exact number of days cells were incubated, and presented as
% of relative control.
Reagents
U-13C5-L-Glutamine and U-13C6-D-Glucose (Cambridge Isotopes Laboratories, Inc
CLM-1822, CLM-1396 respectively), 15N1 Ammonium Cloride (Sigma Aldrich 299251),
sulfasalazine (Sigma Aldrich S0883), MSO (Sigma Aldrich M5379), compound 968
(Calbiochem 352010, dissolved 10mM in DMSO), BPTES (Sigma Aldrich SML0601,
dissolved 10mM in DMSO) Erwinase (Eusa Pharma, an international division of Jazz
Phamaceuticals), all L-amino acids, nucleosides, and nitrogenous bases utilized in the study
were obtained from Sigma Aldrich.
Genome-scale constraint-based metabolic modeling
A Detailed description of metabolic modelling methods and results is provided in the
Supplementary note.
Tardito et al. Page 15
Nat Cell Biol. Author manuscript; available in PMC 2016 June 01.
Europe P
MC
Funders A
uthor Manuscripts
Europe P
MC
Funders A
uthor Manuscripts

Statistical Methods
No statistical method was used to predetermine sample size. For the animal studies, the
experiments were not randomized, and the investigators were not blinded to allocation
during experiments. The number of independent experiments performed is reported in figure
legend. For experiments performed once or twice the raw data of independent repeats are
provided in the statistics source data. Error bars represent standard error of the mean
(S.E.M.). Two-tailed Student’ s t, Pearson correlation test, and Log-rank (Mantel-Cox) test
were performed with Graph Pad Prism 5.0.
Supplementary Material
Refer to Web version on PubMed Central for supplementary material.
ACKNOWLEDGMENTS
This study has been supported by Cancer Research UK. S.T. is recipient of an AIRC/Marie Curie International Fellowship for Cancer Research. The human and animal metabolomic studies were supported by The Norwegian Cancer Society, The Norwegian Research Council, Helse Vest, Haukeland University Hospital and the K.G-Jebsen Foundation. We acknowledge Anna Golebiewska, Virginie Baus-Talko, Niels Van Den Broek, Gillian MacKay, Colin Nixon, Elaine MacKenzie, for excellent technical assistance and Ayala King for excellent editorial work.
REFERENCES
1. Moreadith RW, Lehninger AL. The pathways of glutamate and glutamine oxidation by tumor cell mitochondria. Role of mitochondrial NAD(P)+-dependent malic enzyme. The Journal of biological chemistry. 1984; 259:6215–6221. [PubMed: 6144677]
2. Yuneva MO, et al. The metabolic profile of tumors depends on both the responsible genetic lesion and tissue type. Cell metabolism. 2012; 15:157–170. doi:10.1016/j.cmet.2011.12.015. [PubMed: 22326218]
3. Wise DR, et al. Myc regulates a transcriptional program that stimulates mitochondrial glutaminolysis and leads to glutamine addiction. Proc Natl Acad Sci U S A. 2008; 105:18782–18787. doi:10.1073/pnas.0810199105. [PubMed: 19033189]
4. DeBerardinis RJ, et al. Beyond aerobic glycolysis: transformed cells can engage in glutamine metabolism that exceeds the requirement for protein and nucleotide synthesis. Proc Natl Acad Sci U S A. 2007; 104:19345–19350. doi:10.1073/pnas.0709747104. [PubMed: 18032601]
5. Tardito S, et al. L-Asparaginase and inhibitors of glutamine synthetase disclose glutamine addiction of beta-catenin-mutated human hepatocellular carcinoma cells. Current cancer drug targets. 2011; 11:929–943. [PubMed: 21834755]
6. Son J, et al. Glutamine supports pancreatic cancer growth through a KRAS-regulated metabolic pathway. Nature. 2013; 496:101–105. doi:10.1038/nature12040. [PubMed: 23535601]
7. Gameiro PA, et al. In vivo HIF-mediated reductive carboxylation is regulated by citrate levels and sensitizes VHL-deficient cells to glutamine deprivation. Cell metabolism. 2013; 17:372–385. doi:10.1016/j.cmet.2013.02.002. [PubMed: 23473032]
8. Willems L, et al. Inhibiting glutamine uptake represents an attractive new strategy for treating acute myeloid leukemia. Blood. 2013 doi:10.1182/blood-2013-03-493163.
9. Chiu M, et al. Glutamine depletion by crisantaspase hinders the growth of human hepatocellular carcinoma xenografts. British journal of cancer. 2014; 111:1159–1167. doi:10.1038/bjc.2014.425. [PubMed: 25072259]
10. Wang JB, et al. Targeting mitochondrial glutaminase activity inhibits oncogenic transformation. Cancer cell. 2010; 18:207–219. doi:10.1016/j.ccr.2010.08.009. [PubMed: 20832749]
Tardito et al. Page 16
Nat Cell Biol. Author manuscript; available in PMC 2016 June 01.
Europe P
MC
Funders A
uthor Manuscripts
Europe P
MC
Funders A
uthor Manuscripts

11. Suzuki S, et al. Phosphate-activated glutaminase (GLS2), a p53-inducible regulator of glutamine metabolism and reactive oxygen species. Proc Natl Acad Sci U S A. 2010; 107:7461–7466. doi:10.1073/pnas.1002459107. [PubMed: 20351271]
12. Dal Bello B, et al. Glutamine synthetase immunostaining correlates with pathologic features of hepatocellular carcinoma and better survival after radiofrequency thermal ablation. Clinical cancer research: an official journal of the American Association for Cancer Research. 2010; 16:2157–2166. doi:10.1158/1078-0432.CCR-09-1978. [PubMed: 20233882]
13. Krebs HA. Metabolism of amino-acids: The synthesis of glutamine from glutamic acid and ammonia, and the enzymic hydrolysis of glutamine in animal tissues. The Biochemical journal. 1935; 29:1951–1969. [PubMed: 16745865]
14. van den Berg CJ, Garfinkel D. A stimulation study of brain compartments. Metabolism of glutamate and related substances in mouse brain. The Biochemical journal. 1971; 123:211–218. [PubMed: 5164952]
15. Takano T, et al. Glutamate release promotes growth of malignant gliomas. Nature medicine. 2001; 7:1010–1015. doi:10.1038/nm0901-1010.
16. Scott DA, et al. Comparative metabolic flux profiling of melanoma cell lines: beyond the Warburg effect. The Journal of biological chemistry. 2011; 286:42626–42634. doi:10.1074/jbc.M111.282046. [PubMed: 21998308]
17. Metallo CM, et al. Reductive glutamine metabolism by IDH1 mediates lipogenesis under hypoxia. Nature. 2012; 481:380–384. doi:10.1038/nature10602. [PubMed: 22101433]
18. Kamphorst JJ, et al. Hypoxic and Ras-transformed cells support growth by scavenging unsaturated fatty acids from lysophospholipids. Proc Natl Acad Sci U S A. 2013; 110:8882–8887. doi:10.1073/pnas.1307237110. [PubMed: 23671091]
19. Fan J, Kamphorst JJ, Rabinowitz JD, Shlomi T. Fatty acid labeling from glutamine in hypoxia can be explained by isotope exchange without net reductive isocitrate dehydrogenase (IDH) flux. The Journal of biological chemistry. 2013; 288:31363–31369. doi:10.1074/jbc.M113.502740. [PubMed: 24030823]
20. Mullen AR, et al. Reductive carboxylation supports growth in tumour cells with defective mitochondria. Nature. 2012; 481:385–388. doi:10.1038/nature10642. [PubMed: 22101431]
21. Lewerenz J, et al. The Cystine/Glutamate Antiporter System x(c)(−) in Health and Disease: From Molecular Mechanisms to Novel Therapeutic Opportunities. Antioxidants & Redox Signaling. 2013; 18:522–555. doi:DOI 10.1089/ars.2011.4391. [PubMed: 22667998]
22. Duarte NC, et al. Global reconstruction of the human metabolic network based on genomic and bibliomic data. Proc Natl Acad Sci U S A. 2007; 104:1777–1782. doi:10.1073/pnas.0610772104. [PubMed: 17267599]
23. Gao P, et al. c-Myc suppression of miR-23a/b enhances mitochondrial glutaminase expression and glutamine metabolism. Nature. 2009; 458:762–U100. doi:Doi 10.1038/Nature07823. [PubMed: 19219026]
24. Yuneva M, Zamboni N, Oefner P, Sachidanandam R, Lazebnik Y. Deficiency in glutamine but not glucose induces MYC-dependent apoptosis in human cells. Journal of Cell Biology. 2007; 178:93–105. doi:DOI 10.1083/jcb.200703099. [PubMed: 17606868]
25. Bax DA, et al. Molecular and phenotypic characterisation of paediatric glioma cell lines as models for preclinical drug development. PloS one. 2009; 4:e5209. doi:10.1371/journal.pone.0005209. [PubMed: 19365568]
26. Filonov GS, et al. Bright and stable near-infrared fluorescent protein for in vivo imaging. Nature biotechnology. 2011; 29:757–761. doi:10.1038/nbt.1918.
27. Hock AK, et al. iRFP is a sensitive marker for cell number and tumor growth in high-throughput systems. Cell cycle. 2013; 13
28. Yin Y, et al. Glutamine synthetase functions as a negative growth regulator in glioma. Journal of Neuro-Oncology. 2013; 114:59–69. doi:DOI 10.1007/s11060-013-1168-5. [PubMed: 23780646]
29. Reznik E, Mehta P, Segre D. Flux imbalance analysis and the sensitivity of cellular growth to changes in metabolite pools. PLoS computational biology. 2013; 9:e1003195. doi:10.1371/journal.pcbi.1003195. [PubMed: 24009492]
Tardito et al. Page 17
Nat Cell Biol. Author manuscript; available in PMC 2016 June 01.
Europe P
MC
Funders A
uthor Manuscripts
Europe P
MC
Funders A
uthor Manuscripts
30. Calise SJ, et al. Glutamine deprivation initiates reversible assembly of mammalian rods and rings. Cellular and molecular life sciences: CMLS. 2014; 71:2963–2973. doi:10.1007/s00018-014-1567-6. [PubMed: 24477477]
31. Carruthers R, et al. Abrogation of radioresistance in glioblastoma stem-like cells by inhibition of ATM kinase. Molecular oncology. 2015; 9:192–203. doi:10.1016/j.molonc.2014.08.003. [PubMed: 25205037]
32. Meyerand ME, Pipas JM, Mamourian A, Tosteson TD, Dunn JF. Classification of biopsy-confirmed brain tumors using single-voxel MR spectroscopy. AJNR. American journal of neuroradiology. 1999; 20:117–123. [PubMed: 9974066]
33. Parmentier JH, et al. Glutaminase activity determines cytotoxicity of L-asparaginases on most leukemia cell lines. Leukemia Research. 2015; 39:757–762. doi:DOI 10.1016/j.leukres.2015.04.008. [PubMed: 25941002]
34. Had-Aissouni L. Toward a new role for plasma membrane sodium-dependent glutamate transporters of astrocytes: maintenance of antioxidant defenses beyond extracellular glutamate clearance. Amino acids. 2012; 42:181–197. doi:10.1007/s00726-011-0863-9. [PubMed: 21399919]
35. Rosati A, et al. Glutamine synthetase expression as a valuable marker of epilepsy and longer survival in newly diagnosed glioblastoma multiforme. Neurooncology. 2013; 15:618–625. doi:10.1093/neuonc/nos338.
36. Marin-Valencia I, et al. Analysis of tumor metabolism reveals mitochondrial glucose oxidation in genetically diverse human glioblastomas in the mouse brain in vivo. Cell metabolism. 2012; 15:827–837. doi:10.1016/j.cmet.2012.05.001. [PubMed: 22682223]
37. Maher EA, et al. Metabolism of [U-13 C]glucose in human brain tumors in vivo. NMR in biomedicine. 2012; 25:1234–1244. doi:10.1002/nbm.2794. [PubMed: 22419606]
38. Bagga P, et al. Characterization of cerebral glutamine uptake from blood in the mouse brain: implications for metabolic modeling of 13C NMR data. Journal of cerebral blood flow and metabolism: official journal of the International Society of Cerebral Blood Flow and Metabolism. 2014; 34:1666–1672. doi:10.1038/jcbfm.2014.129.
39. Rosati A, et al. Epilepsy in glioblastoma multiforme: correlation with glutamine synthetase levels. Journal of Neuro-Oncology. 2009; 93:319–324. doi:10.1007/s11060-008-9794-z. [PubMed: 19183851]
40. Bannai S, Ishii T. A novel function of glutamine in cell culture: utilization of glutamine for the uptake of cystine in human fibroblasts. Journal of cellular physiology. 1988; 137:360–366. doi:10.1002/jcp.1041370221. [PubMed: 2903864]
41. Noble M, Murray K. Purified astrocytes promote the in vitro division of a bipotential glial progenitor cell. Embo J. 1984; 3:2243–2247. [PubMed: 6542000]
42. Keunen O, et al. Anti-VEGF treatment reduces blood supply and increases tumor cell invasion in glioblastoma. Proc Natl Acad Sci U S A. 2011; 108:3749–3754. doi:10.1073/pnas.1014480108. [PubMed: 21321221]
43. Sanzey M, et al. Comprehensive analysis of glycolytic enzymes as therapeutic targets in the treatment of glioblastoma. PloS one. 2015; 10:e0123544. doi:10.1371/journal.pone.0123544. [PubMed: 25932951]
Tardito et al. Page 18
Nat Cell Biol. Author manuscript; available in PMC 2016 June 01.
Europe P
MC
Funders A
uthor Manuscripts
Europe P
MC
Funders A
uthor Manuscripts

Figure 1. Gln starvation reduces GBM cell proliferation. (a) Dose-response curves for cell lines
incubated for 3 days in DMEM or SMEM with the indicated concentrations of Gln. (b) Cells
were incubated for the indicated times in SMEM +/− Gln. (c) Cells were incubated for 72
hours in SMEM +/− Gln or Glucose as indicated. Each dot represents the number of dead
cells (with plasma membrane integrity loss) normalized over a confluence index. The
resulting cell death index was assessed every hour. (d) Cell cycle distribution of cell lines
incubated for 3 days +/− Gln. Mean of 3 independent experiments is shown in
Tardito et al. Page 19
Nat Cell Biol. Author manuscript; available in PMC 2016 June 01.
Europe P
MC
Funders A
uthor Manuscripts
Europe P
MC
Funders A
uthor Manuscripts

Supplementary Figure 1b. (e) Growth inhibition caused by Gln starvation. Mean ± S.E.M.
n=3 independent experiments. (f) Scatter plot of the doubling time obtained for the cell lines
in Gln-fed conditions, in relation to growth inhibition caused by Gln starvation. Mean ±
S.E.M. n=3 independent experiments. (a-d) Data derive from one experiment performed
twice (a, b, c), or three times (d). Raw data of independent repeats are provided in the
statistics source data Supplementary Table 5.
Tardito et al. Page 20
Nat Cell Biol. Author manuscript; available in PMC 2016 June 01.
Europe P
MC
Funders A
uthor Manuscripts
Europe P
MC
Funders A
uthor Manuscripts

Figure 2. The effects of Glu secretion, and GLS inhibition on GBM cells growth and metabolism. (a-b) Cells were incubated for 24h +/− 13C5-Gln. Secretion (positive bars) and consumption
(negative bars) rates of Gln and Glu isotopologues are shown. Mean ± S.E.M. n=3
independent experiments. (c-f) Cells were incubated as in (a-b) and the levels of intracellular
Gln, Glu, Acetyl CoA, and oleate isotopologues are shown. Mean ± S.E.M. n=3 independent
experiments. (g-h) LN18 and SF188 cells were incubated for 24h +/− Gln in media where
glucose (g) or alanine (h) where fully replaced by 13C6-glucose or 15N1-alanine respectively.
Tardito et al. Page 21
Nat Cell Biol. Author manuscript; available in PMC 2016 June 01.
Europe P
MC
Funders A
uthor Manuscripts
Europe P
MC
Funders A
uthor Manuscripts

The isotopologues distributions of Glu released in the medium are shown. Mean ± S.E.M.
n=3 independent experiments. (i) Scatter plot of Glu secretion observed in the absence of
Gln, in relation to the growth inhibition caused by Gln starvation. Mean ± S.E.M. n=3
independent experiments. (j) A schematic representation of the activity in the context of
Glu metabolism. Adapted from Bannai et al.40 (k) LN18 cells were incubated for 24h +/−
Gln in media supplemented or not with Glu, ウ-ketoglutarate dimethylester (dm-ウKG),
sulfasalazine (SSZ), or cystine, at the indicated concentrations, and the secretion/
consumption rates of Glu are shown. (l-o) LN18 cells were incubated as in (k) and the
intracellular levels of Glu (l), aspartate (m), citrate (n), and reduced form of glutathione (o)
are shown as % of untreated control. (p) LN18 cells were incubated for 72h as described for
(k). Cell number is shown as % of untreated control. Mean ± S.E.M. n=4 independent
experiments. p values refer to a two-tailed t test for unpaired samples. (q-r) Cells were pre-
incubated in medium with 0, 2.5, 5, 10, 15, 30μM BPTES for 3h. At t=0 medium was
replaced with one containing 13C5-Gln. The abundance of 13C5-Glu (q) or 13C5-Gln (r) in
the medium was monitored over time. In all conditions cells were exposed to 0.3% DMSO.
(s) Cells were incubated in medium +/− 2.5μM BPTES for 72h, and counted. DMSO was
0.3% in all conditions. Mean ± S.E.M. n=3 independent experiments. (k, l, m, n, o, q, r)
Data derive from one experiment performed once (k, l, m, n, o), or twice (q, r). Raw data of
independent repeats are provided in the statistics source data Supplementary Table 5.
Tardito et al. Page 22
Nat Cell Biol. Author manuscript; available in PMC 2016 June 01.
Europe P
MC
Funders A
uthor Manuscripts
Europe P
MC
Funders A
uthor Manuscripts

Figure 3. GS sustains cell growth during Gln starvation. (a) GS and GLS catalysed reactions. (b) Cells
were incubated for 24h +/− Gln and protein expression was assessed. Unprocessed scans of
western blots are shown in Supplementary Figure 8. (c) Scatter plot of GS protein
expression observed in Gln-fed condition (Arbitrary Units, AU) in relation to the growth
inhibition caused by Gln starvation. Mean ± S.E.M. n=3 independent experiments. (d) LN18
and SF188 cells were incubated for 24h +/− Gln in the presence of 0.8 mM . The
intracellular levels of Gln isotopologues are shown as % of 15N0-Gln in LN18 cells. Data
Tardito et al. Page 23
Nat Cell Biol. Author manuscript; available in PMC 2016 June 01.
Europe P
MC
Funders A
uthor Manuscripts
Europe P
MC
Funders A
uthor Manuscripts

derive from one experiment performed twice. Raw data of independent repeats are provided
in the statistics source data Supplementary Table 5. (e) SF188 and U251 cells were
incubated for 72h +/− Gln in medium supplemented with 4mM Glu and 1mM MSO as
indicated. Cells numbers are shown as % of untreated control. Mean ± S.E.M. n=3
independent experiments. (f) SF188 and U251 cells stably expressing a non-targeting
control shRNA (shNTC) or two sequences targeting GS (shGS-1 and shGS-2) were
incubated for 24h +/− Gln. (g) Cells were incubated for 72h +/− Gln in medium
supplemented with 4mM Glu, and 0.8mM , as indicated. Cell number is shown as % of
the respective Gln-fed control. Mean ± S.E.M. n=3 independent experiments. (h) Cells were
incubated for 12-17 days +/− Gln in medium supplemented with 4mM Glu, and 0.8mM
as indicated. Colonies obtained in representative wells are shown. n=4 independent
experiments, quantified as shown in Supplementary Figure 4b.
Tardito et al. Page 24
Nat Cell Biol. Author manuscript; available in PMC 2016 June 01.
Europe P
MC
Funders A
uthor Manuscripts
Europe P
MC
Funders A
uthor Manuscripts

Figure 4. GS activity regulates cell growth and purine availability under Gln starvation. (a) Top:
LN18 clones stably expressing iRFP or iRFP-GS were incubated +/− Gln for 5 days and
protein expression assessed. Unprocessed scans of western blots are shown in
Supplementary Figure 8. Bottom: For each clone growth was determined from the protein
amount and referred as % of respective control. Dashed lines show the mean % values
obtained - Gln. (b) iRFP4 and iRFP-GS5 cells were incubated for the indicated times in
medium +/− Gln and MSO (1mM), and counted. (c) iRFP4 and iRFP-GS5 cells were
Tardito et al. Page 25
Nat Cell Biol. Author manuscript; available in PMC 2016 June 01.
Europe P
MC
Funders A
uthor Manuscripts
Europe P
MC
Funders A
uthor Manuscripts

incubated +/− Gln and MSO (1mM) for 21 days, and colonies in representative wells are
shown. Data derive from one experiment performed twice. (d-j) iRFP4 and iRFP-GS5 cells
were incubated +/− Gln for 24h in medium supplemented with 0.8 mM . The
intracellular isotopologues of Gln, UMP, AICAR, IMP, AMP, ATP, and GTP are shown as
% of values obtained for the 15N0 metabolites in iRFP4 cells in the presence of Gln. (k) Cell
lines were incubated +/− Gln for 24h and the relative amount of intracellular IMP is shown.
Mean ± S.E.M. n=3 independent experiments. (l) Scatter plot of the changes in intracellular
IMP levels in relation to the growth inhibition caused by Gln starvation. Mean ± S.E.M. n=3
independent experiments. (m-n) iRFP4 (m) and iRFP-GS5 (n) cells were incubated for 72h
+/− Gln in medium containing adenosine (A) guanosine (G) cytidine (C) thymidine (T)
uridine (U), each at 0.2mM, or in combination (AGCTU) at 0.2 mM each, Glu (4mM), MSO
(1mM), as indicated. Cells numbers are shown as % of untreated control. Dashed lines show
percentage values obtained in the absence of Gln without any further supplementation. Mean
± S.E.M. n=3 independent experiments. (a, b, d, e, f, g, h, i, j) Data derive from one
experiment performed once (a, b) or twice (d-j). Raw data of independent repeats are
provided in the statistics source data Supplementary Table 5.
Tardito et al. Page 26
Nat Cell Biol. Author manuscript; available in PMC 2016 June 01.
Europe P
MC
Funders A
uthor Manuscripts
Europe P
MC
Funders A
uthor Manuscripts

Figure 5. Gln metabolism in differentiated (DIFF) and GBM Stem-like (GSC) primary human GBM
cells. (a) Protein expression was assessed in E2, R10 and R24 cells maintained in DMEM/
F-12 and supplemented as described in the Methods section. Arrow points to SOX2 specific
band. A representative experiment repeated twice is shown. Unprocessed scans of western
blots are shown in Supplementary Figure 8. (b) Cells were incubated in SMEM
supplemented as described in the Methods section, +/− 0.65mM Gln and 1mM MSO as
indicated. Mean ± S.E.M. n=3 independent experiments. (c-d) The exchange rates of Gln (c)
Tardito et al. Page 27
Nat Cell Biol. Author manuscript; available in PMC 2016 June 01.
Europe P
MC
Funders A
uthor Manuscripts
Europe P
MC
Funders A
uthor Manuscripts

and Glu (d) isotopologues in cells incubated for 24h in SMEM +/− 0.65mM Gln
supplemented with of 0.8mM . Mean ± S.E.M. n=3 independent experiments. (e-h)
The Intracellular content of Gln (e), Glu (f), citrate (g), and AMP (h) isotopologues in cells
incubated as in (c-d). Mean ± S.E.M. n=3 independent experiments.
Tardito et al. Page 28
Nat Cell Biol. Author manuscript; available in PMC 2016 June 01.
Europe P
MC
Funders A
uthor Manuscripts
Europe P
MC
Funders A
uthor Manuscripts

Figure 6. Gln metabolism in GBM patients and primary orthotopic xenografts. (a) GBM tissue
microarray. GS immuno-staining of representative tissue cores at low and high
magnification (top and bottom respectively). A: Astrocyte, N: Neuron. (b) Frequency
distribution of GBM patients (n=209) divided according to their histoscore for GS, and
categorized as low, medium, and high. Normal astrocytes were used as a reference for
defining maximal immunoreactivity. (c) Kaplan Meier curves for GBM patients divided into
low, medium, and high GS expression. p value refers to a log-rank (Mantel-Cox) test. (d-e)
Tardito et al. Page 29
Nat Cell Biol. Author manuscript; available in PMC 2016 June 01.
Europe P
MC
Funders A
uthor Manuscripts
Europe P
MC
Funders A
uthor Manuscripts

creatine, choline, choline to creatine ratio (d), and Gln (e) levels in tumor tissue and adjacent
edematous brain of GBM patients injected with 13C6-glucose before surgical intervention.
n= 7 patients, p values refer to a two-tailed t test for paired samples. (f-g) 13C6-glucose (f),
and 13C Gln (g) enrichment in serum at time of tumour resection, in tumor tissue, and in
adjacent edematous tissue. Gln isotopologues incorporating one or more 13C-atoms, over the
total amount of Gln detected (% of total) are shown. na: not available, nd: not detectable.
Values were corrected for the natural abundance of 13C. (h) Coronal section of human P3
GBM xenograft grown in brain of immunocompromised mice, and stained for human nestin
and GS. Lower panels are magnification of the respective framed regions. A: astrocytes, AF:
astrocytic end-feet, N: neuron, V: blood vessel. (i, j) Isotopologue distribution of
metabolites (Hexose phosphates, citrate, ウ-KG, Glu, Gln) obtained in mice orthotopically
xenografted with human P3 GBM, and injected in the tail vain with a bolus of 13C6-Glucose
(i) or 13C5-Gln (j). Tissues were sampled 22min after injection. The values are mean ±
S.E.M. n=3 mice for all conditions, except for contralateral brain of mice injected with
glucose, where 2 mice were used. (i, j) Raw data of independent repeats are provided in the
statistics source data Supplementary Table 5.
Tardito et al. Page 30
Nat Cell Biol. Author manuscript; available in PMC 2016 June 01.
Europe P
MC
Funders A
uthor Manuscripts
Europe P
MC
Funders A
uthor Manuscripts

Figure 7. Glutamine supply for GBM tumours with low GS expression. (a) Gln and Asn levels were
measured by HPLC-MS in peripheral blood samples obtained at indicated time points from
immunocompromised mice intraperitoneally injected with Erwinase (5U/gr of body weight).
Mean ± S.E.M. n=5 mice. p values refer to a two-tailed t test for paired samples. (b) Coronal
section of human T101 GBM xenograft grown in brain of immunocompromised mice, and
stained for human nestin and GS. Left panels are magnification of the respective framed
regions. A: astrocytes, N: neuron. (c) Immunocompromised mice were orthotopically
Tardito et al. Page 31
Nat Cell Biol. Author manuscript; available in PMC 2016 June 01.
Europe P
MC
Funders A
uthor Manuscripts
Europe P
MC
Funders A
uthor Manuscripts

implanted with T101 GBM tumours and treated with Erwinase for 6 weeks as described in
the Methods section. Asn and Gln were assessed in the tumour and contralateral brain 6h
after the last Erwinase injection. Mean ± S.E.M. n=3 mice. (d) MRI-based Apparent
Diffusion Coefficient (ADC) maps of T101 GBM tumours treated with Erwinase as
described in (c). The tumour mask has been manually delineated to highlight the tumour
region. IHC staining of brain sections corresponding to the MRI scans are shown. T101
tumours were stained with an anti-human EGFR antibody. (e) Two representative series of
coronal sections of T101 brain xenografts, were stained for human EGFR. Mice were treated
with Erwinase as in (c). (f) Volumes of T101 orthotopic tumours obtained thorough
quantitative imaging of EGFR-stained serial sections of brains. Mice were treated with
Erwinase as in (c). Mean ± S.E.M. n=7 mice. p value refer to a two-tailed t test for unpaired
samples. (g) Coronal section of human T407 GBM xenograft grown in brain of
immunocompromised mice, and stained for human nestin and GS. Left panels are
magnification of the respective framed regions. A: astrocytes, V: blood vessel. (h) 15N1-Gln
enrichment in T407 GBM tumours and in contralateral brains, after a 4h intracarotid
infusion with . The dashed lines correspond to the natural abundance of 15N1-Gln.
Mean ± S.E.M. n=4 mice. p value refer to a two-tailed t test for paired samples.
Tardito et al. Page 32
Nat Cell Biol. Author manuscript; available in PMC 2016 June 01.
Europe P
MC
Funders A
uthor Manuscripts
Europe P
MC
Funders A
uthor Manuscripts

Figure 8. Astrocytes feed with Gln GBM cells. (a, b) Astrocytes were incubated in SMEM for 6 days
with 0, 0.1, 0.3, 0.65, 1, 2, 4mM Gln (a) or for the indicated times with 0 and 0.65mM Gln
(b). (c) Astrocytes derived from two independent extractions, and cell lines, were incubated
for 3 days +/− Gln and protein expression assessed. Unprocessed scans of western blots are
shown in Supplementary Figure 8. (d-j) Astrocytes were incubated in SMEM for 24h in the
presence of 5.56mM Glucose (13C6 or 13C0), 0.65mM Gln (13C5 or 13C0), 0.8mM 15NH4+,
and 1mM MSO as indicated. Secretion/consumption rates (positive/negative bars
Tardito et al. Page 33
Nat Cell Biol. Author manuscript; available in PMC 2016 June 01.
Europe P
MC
Funders A
uthor Manuscripts
Europe P
MC
Funders A
uthor Manuscripts

respectively) are shown for Gln (d) and Glu (e). Intracellular levels of Gln (f) and Glu (g)
isotopologues are reported as % of control (total of isotopologues in Gln fed conditions).
The intracellular isotopologues of Gln (h), Glu (i), AMP (j) are shown as % of control (total
isotopologues in the presence of Gln and 15NH4. (k) Astrocytes were incubated for 6 days +/
− 0.65mM Gln, and 1mM MSO and counted. (l) Astrocytes were grown to confluence in
multi-well plates. iRFP4 cells were seeded in wells +/− astrocytes, and +/− Gln. The
fluorescence of iRFP4 cells in representative wells is shown. The experiment was performed
twice with comparable results. (m) Astrocytes were grown to confluence in multi-well
plates. iRFP4 cells seeded in transwell inserts were co-cultured +/− astrocytes, +/−Gln, and
+/− Erwinase (Erw) as indicated. Fluorescence of iRFP4 cells in representative inserts is
shown. At day 5 astrocytes were stained with sulphorodamine-B and the fluorescence of
representative wells is shown. (n) Quantification of the iRFP4 fluorescence as described for
(m). (a, b, d, e, f, g, h, i, j, k, n) Data derive from one experiment performed twice. Raw
data of independent repeats are provided in the statistics source data Supplementary Table 5.
Tardito et al. Page 34
Nat Cell Biol. Author manuscript; available in PMC 2016 June 01.
Europe P
MC
Funders A
uthor Manuscripts
Europe P
MC
Funders A
uthor Manuscripts


![The Roles of Glutamine in the Intestine and Its ...€¦ · utilize large amounts of glutamine, exceeding the endogenous glutamine production [12,13], and that plasma and muscle glutamine](https://img.pdfslide.us/doc/110x75/5fd64d48c22ac35b4b7b6b55/the-roles-of-glutamine-in-the-intestine-and-its-utilize-large-amounts-of-glutamine.jpg)