Embed Size (px)
Citation preview

NATIONAL RESEARCH COUNCIL CANADA
ARCHIVED – Annual Report 2012-2013
This PDF file has been archived on the Web.
Archived content
Information identified as archived on the Web is for reference, research or recordkeeping purposes. It has not
been altered or updated after the date of archiving. Web pages that are archived on the Web are not subject to
the Government of Canada Web Standards. As per the Communications Policy of the Government of Canada,
you can request alternate formats by contacting us at [email protected].

Annual Report
2012-2013
National Research Council Canada


Table of ContentsFinancial Statement Discussion and Analysis.............................................................................. 1
Consolidated Financial Statements ............................................................................................ 17Independent Auditor’s Report ................................................................................................. 18Statement of Management Responsibility ............................................................................... 20Consolidated Statement of Financial Position ......................................................................... 22Consolidated Statement of Operations and Departmental Net Financial Position .................. 23Consolidated Statement of Change in Departmental Net (Surplus) Debt ............................... 24Consolidated Statement of Cash Flow .................................................................................... 25Notes to Consolidated Financial Statements ........................................................................... 26
Annex to the Statement of Management Responsibility .......................................................... 45


1
National Research Council Canada Annual Report 2012-2013
1
FINANCIAL STATEMENT DISCUSSION AND ANALYSIS

2
National Research Council Canada Annual Report 2012-2013
2
INTRODUCTION The following Financial Statement Discussion and Analysis (FSD&A) should be read in conjunction with the audited consolidated financial statements and accompanying notes for the National Research Council of Canada (NRC) for the fiscal year ended March 31, 2013. The responsibility for the preparation of the FSD&A rests with the management of NRC. It has been prepared in accordance with the Public Sector Statement of Recommended Practice SORP-1. The purpose of the FSD&A is to highlight information and provide explanations which enhance the users’ understanding of NRC’s financial position and results of operations, while demonstrating NRC’s accountability for its resources. Additional information on NRC’s performance is available in the NRC Departmental Performance Report (DPR), and information on its plans and priorities is available in the NRC Report on Plans and Priorities (RPP). All financial information presented herein is denominated in Canadian dollars, unless otherwise indicated. Special note regarding forward-looking statements The words “estimate”, “will”, “intend”, “should”, “anticipate”, and similar expressions are intended to identify forward-looking statements. These statements reflect assumptions and expectations of NRC, based on its experience and perceptions of trends and current conditions. Although NRC believes the expectations reflected in such forward-looking statements are reasonable, they may prove to be inaccurate, and consequently NRC’s actual results could differ materially from expectations. In particular, the risk factors described in the “Risks and Uncertainties” section of this report could cause actual results or events to differ materially from those contemplated in forward-looking statements. Overview The National Research Council (NRC) was established by the National Research Council Act. The mission of NRC is to work with clients and partners to provide strategic research, scientific and technical services to develop and deploy solutions to meet Canada's current and future industrial and societal needs. NRC’s budget is allocated through authorities approved by Parliament, and some of NRC’s operations are funded through revenue generated from external parties. NRC has separate voted authorities for operating expenditures, capital expenditures and grants and contributions. In addition, NRC has statutory authority for spending of revenues (pursuant to paragraph 5(1)(e) of the National Research Council Act), contributions to employee benefit plans, proceeds from the disposal of surplus Crown assets, collection agency fees and loss on foreign exchange. Authorities provided to NRC do not parallel financial reporting according to Canadian public sector accounting standards, since authorities are primarily based on cash accounting principles. Consequently, items recognized in the Consolidated Statement of Operations and Departmental Net Financial Position and the Consolidated Statement of Financial Position are not necessarily the same as those provided through authorities from Parliament. Note 3 of the Consolidated Financial Statements provides a reconciliation between the two bases of reporting. Reporting Entity These consolidated financial statements include a portion of the accounts of the Canada-France-Hawaii Telescope Corporation (CFHT). In 2011-12, NRC determined that its relationship with CFHT constituted a government partnership for accounting purposes and should be proportionately consolidated in NRC ’s financial statements. Further details are described in Note 2b of NRC’s consolidated financial statements.

3
National Research Council Canada Annual Report 2012-2013
3
HIGHLIGHTS Consolidated Statement of Financial Position NRC’s financial position, as shown by the Departmental net financial position line in the Consolidated Statement of Financial Position, was strengthened to $565.8 million as at March 31, 2013, from $525.2 million in 2012. NRC’s total net liabilities as of March 31, 2013 were $321 million, an increase of $53.9 million from 2012. Net financial assets totalled $326.9 million, an increase of $110.5 million from 2012. NRC had a departmental net surplus of $5.9 million, an improvement of $56.6 million from the previous year’s debt position of $50.8 million. Departmental net surplus represents NRC’s total net liabilities, less its total net financial assets. It is a measure of future income required to pay for past transactions and events. Detailed explanation and analysis of liability and asset balances can be found in the Variance and Trend Analysis section. Consolidated Statement of Operations and Departmental Net Financial Position NRC’s 2012-13 net cost from continuing operations was $759.8 million compared to $676.7 million in 2011-12. Total revenue of $155.3 million represents a $15.6 million decrease from the prior year while expenses increased by $67.4 million to $915 million. Additional parliamentary funding provided a $104.1 million increase in Grants and Contributions expenses. Most other expense categories saw a decrease. NRC’s $40.5 million net surplus from operations after government funding and transfers ($10.4 million in 2011-12) caused the Departmental net financial position to grow from $525.2 million to $565.8 million. The following illustrates NRC’s total expenses by major category over the past two fiscal years:
For further detail and analysis of revenues and expenses, refer to the section Variance and Trend Analysis below. Consolidated Statement of Cash Flow The net cash provided by the Government of Canada in 2012-13 was $647.4 million ($657.9 million in 2011-12). Cash used in operating activities declined by $12.3 million and cash used in investing activities declined by $0.4 million. These reductions were offset by a $2.2 million increase in cash used in capital investing activities.
455 428
249 239
144 248
2011-122012-13
Expenses (in $ millions)
Personnel
Operations
Grants and Contributions
848915

4
National Research Council Canada Annual Report 2012-2013
4
Parliamentary Authorities Parliamentary authorities are primarily based on cash accounting principles. They are shown in Note 3 of the NRC consolidated financial statements. The following illustrates NRC’s voted parliamentary authorities over the past three fiscal years, including the Main Estimates, the Supplementary Estimates, Transfers, Adjustments and Warrants. The “Use of Funds by Source” figures also include the statutory expenditures.
a) Total Voted Parliamentary Authorities: NRC is provided with Parliamentary Authorities in three Votes: Vote 60 – Operating expenditures,
Vote 65 – Capital expenditures, and Vote 70 – Grants and contributions. b) Total Authorities Used: The total authorities used during the year (and shown in Note 3 of NRC’s consolidated financial statements).
These include voted authorities and statutory authorities. c) Total Funds Spent: All authorities, as well as NRC spending of funds from Other Government Departments and Specified Purpose
Accounts. In 2012-13, available parliamentary authorities increased by $101.4 million, including an additional $90 million in grants and contributions funding received to expand NRC’s Industrial Research Assistance Program (IRAP), as announced in Canada’s Economic Action Plan 2012. NRC’s actual use of funds applied to Voted parliamentary authorities totalled $701.9 million. In addition, NRC had $96.6 million of revenue funded expenditures and spent $56.8 million under other statutory authorities (mainly contributions to employee benefit plans).
411.9 406.5 405.7 404.2 427.9 423.5
42.3 42.2 42.3 35.353.2 49.7
260.5 253.2165.3 148.0
294.9 290.9
45.5
50.2
74.957.4
60.8
64.351.1
62.6
56.9
22.5
20.9
(a) 714.7(a) 701.9
(a) 613.3(a) 587.5
(a) 776.0 (a) 764.1(b) 804.8
(b) 698.5
(b) 903.3
(c) 855.9(c) 783.6
(c) 981.1
0.0
500.0
1000.0
1500.0
2000.0
2500.0
3000.0
0
200
400
600
800
1000
1200
Voted Parliamentary Authorities
Use of Fundsby Source
Voted Parliamentary Authorities
Use of Fundsby Source
Voted Parliamentary Authorities
Use of Fundsby Source
2012-13 2011-12 2010-11
Parliamentary Authorities and Source of Funds (in $ millions)
Operating Expenditure Authorities Capital Expenditure Authorities Grants and Contributions Authorities Statutory Revenue
Other Statutory Amounts OGD Revenue Specified Purpose Account

5
National Research Council Canada Annual Report 2012-2013
5
DISCUSSION AND ANALYSIS Uncertainties NRC funds the majority of its salary, operating and capital expenditures from parliamentary authorities. NRC owns and manages 180 specialized buildings and facilities across Canada that comprise approximately 555,000 square meters of space. It also has an equipment and informatics base (excluding CFHT assets) of $624.2 million in cost, with $159.4 million in net book value ($607.7 million in cost, with $173.8 million in net book value in 2011-12). Through its 5 year investment plan, NRC is investing appropriate funds to maintain its buildings and laboratories. Sunsetting Funding: For certain new initiatives, it is the practice of the government to provide funding on a sunsetting basis. Rather than providing a permanent increase to parliamentary authorities, the government may allocate funding for specified purposes for a limited period of time with a renewal option. Renewal is conditional on various factors including performance, achieving desired objectives, linkages to priorities, and availability of funds. New government-approved initiatives often entail ongoing commitments from NRC such as maintenance of new facilities and new staff salaries. There may be stakeholders that support these new initiatives, and in some cases invest in them, with expectations that the initiative will exist beyond the original funding window. These challenges add complexity to planning, budgeting and operations. Currently, NRC has numerous initiatives and projects funded on a sunsetting basis, examples of which include the following: Transforming the National Research Council: Economic Action Plan 2013 provides $120.8 million over
two years (expiring at the end of 2014-2015) to invest in NRC’s strategic focus to help the growth of innovative businesses in Canada. NRC will receive $61.2 million in 2013-14 and $59.6 million in 2014-15.
Digital Technologies Adoption Pilot Program (DTAPP): Administered by NRC-IRAP, DTAPP represents a significant investment into the Canadian economy in an effort to increase the productivity growth of SMEs in Canada through the adoption of digital technologies across all sectors. NRC-IRAP will receive funding of $37.5 million in 2013-14 for this initiative.
TRIUMF: NRC receives $19.3 million in annual funding for TRIUMF, Canada’s National Laboratory for Particle and Nuclear Physics. NRC will also receive an additional $89 million funding over the next two years that is sunsetting at the end of 2014-15. Since 1976, NRC has provided over $1.1 billion in funding to TRIUMF of which a total of $44 million was provided during 2012-13.
Genomics R&D Initiatives: The Genomics R&D Initiatives (GRDI) is a federal program that coordinates genomics R&D in 6 federal departments and agencies. GRDI supports policy objectives in human health, agriculture and food safety, environment and natural resources management. NRC received funding of $8.8 million in 2012-13 for these initiatives, and will receive an additional $8.8 million in 2013-14.

6
National Research Council Canada Annual Report 2012-2013
6
Foreign Currency: In its normal course of operation, NRC makes some of its purchases in foreign currencies which exposes it to foreign exchange risk. NRC purchased C$40.6 million worth of goods and services in foreign currencies in 2012-13 (C$48 million in 2011-12); $37.1 million (91%) of the foreign currency purchases were in US dollars ($45.1 million or 94% in 2011-12). During 2012-13, it cost NRC an average of $1.006 Canadian dollars to purchase $1 US ($0.998 in 2011-12). In addition, NRC had C$23.8 million worth of foreign currency receipts in 2012-13, of which $23 million (97%) was received in US currency compared to $29.3 million received in foreign currency in 2011-12 of which $28.7 million (98%) was in US currency. Revenue: NRC activities generate revenues which can be reinvested in its operations. In 2012-13, 16% of NRC’s salary, operating and capital expenditures were funded by revenue from external sources (21% in 2011-12). NRC is focused on increasing its external revenue generating activities to strengthen its future financial sustainability. However, significant unexpected downturns affecting industries or government partners of NRC could impact its ability to fund operations.

7
National Research Council Canada Annual Report 2012-2013
7
Variance and Trend Analysis The following analysis describes the main items appearing on the consolidated financial statements and provides analysis of significant variances and financial trends. Liabilities NRC’s total net liabilities were $321 million as at March 31, 2013, an increase of $53.9 million from the prior year balance of $267.1 million. NRC’s liabilities consist of the following: Accounts Payable and Accrued Liabilities: NRC’s accounts payable and accrued liabilities as at March 31, 2013 were $167.6 million ($104.9 million as at March 31, 2012). The following shows the three largest categories:
The $53.3 million increase in accounts payable to external parties is primarily the result of higher accounts payable for NRC-IRAP at year-end. The contributions budget for NRC-IRAP doubled in 2012-13, and explains $44.6 million of the total increase in the amount of accounts payable to external parties as of March 31, 2013. There was also a $4.4 million increase in accounts payable to other government departments and agencies, and a $4.9 million increase in accrued wages and employee benefits. Also included within Accounts Payable and Accrued Liabilities are contractor holdbacks, liabilities for contaminated sites, sales tax payable and CFHT accounts payable (totalling $1.7 million in 2012-13 and $1.6 million in 2011-12), as detailed in note 4 of the consolidated financial statements. Vacation Pay and Compensatory Leave: Vacation pay and compensatory leave liabilities have decreased in each of the past four fiscal years to represent $31.7 million at March 31, 2013 - a $3.4 million decrease from 2011-12. The decrease is a result of changes to collective bargaining and management oversight activities taken to manage outstanding vacation liabilities.
Lease Inducements: Lease inducements totalled $42.9 million as at March 31, 2013. This balance relates to tangible capital assets provided to NRC under three lease agreements with monetary consideration
127.6
16.8 21.5
74.3
12.4 16.6
External Parties Other government departments and agencies Accrued wages and employee benefits
Main Classes of Accounts Payable and Accrued Liabilities (in $ millions)
2012-13 2011-12
31.735.1
38.7
43.2
49.1
20
30
40
50
60
2012-132011-122010-112009-102008-09
Vacation Pay and Compensatory Leave (in $ millions)

8
National Research Council Canada Annual Report 2012-2013
8
Lease Inducements: Lease inducements totalled $42.9 million as at March 31, 2013. This balance relates to tangible capital assets provided to NRC under three lease agreements with monetary consideration below fair market value. These leases of facilities were established at nominal cost with the University of Western Ontario, the University of Alberta, and the University of Prince Edward Island, to accommodate NRC research facilities. These lease inducement liabilities have corresponding non-financial tangible capital assets and were originally recorded at the fair market value of the capital lease. Over the lease period, NRC recognizes equal amounts of amortization and lease inducement revenue. As a result, there is no impact to NRC’s net cost of operations or its net financial position. The balance decrease of $2.5 million in the current year is accounted for as revenue recognized during the period. Deferred Revenue: Deferred revenue represents funds received for which NRC has an obligation to other parties for the provision of goods, services or the use of assets in the future. The March 31, 2013 balance of $11.5 million ($15.2 million in 2012) is explained in Note 5 of the consolidated financial statements. The significant components include:
$9 million of deferred revenue from research services and technical services projects. These are the
two largest categories of revenue at NRC. When funds are received prior to work commencing or when the amount of funds received exceeds the value of the work performed as of March 31, 2013, deferred revenue is recorded. Revenue is then recognized as services are provided.
$1.7 million received to construct a facility for the Hitachi Electron Microscopy Product Centre (HEMIC) as part of a collaboration agreement. This amount was deferred and the revenue will be recognized over the life of the collaboration beginning when the facility is put into use in 2013-14.
Employee Future Benefits: Employee future benefits represent the liability for severance benefits payable to employees upon termination of employment with the public service. This allowance is established at year end by applying an actuarial rate to total annual salary cost of NRC’s indeterminate employees. This rate is determined by Treasury Board based on the liability for the government as a whole. The March 31, 2013 balance of $67.2 million represents a slight decrease from the prior year balance of $68.3 million. Note 7b of the consolidated financial statements provides additional detail. Financial Assets Due from the Consolidated Revenue Fund (CRF): This account represents the amount of cash that NRC is entitled to withdraw from the federal government treasury. This includes cash to discharge liabilities for which NRC has already received parliamentary authorities as well as revenue received but not spent. NRC’s due from the CRF was $290.7 million as at March 31, 2013, a significant increase from the $183.8 million recorded at March 31, 2012. The $106.9 million total increase includes a $60 million increase in accounts payable and accrued liabilities that are eligible for payment from the CRF and a $46 million increase in revenue available for use in subsequent years.
Accounts Receivable: Accounts receivable and advances, as detailed in note 8 of the financial statements, totalled $30.6 million as at March 31, 2013, a $1.8 million increase from March 31, 2012. This includes accounts receivable with external parties worth $26.4 million ($21.9 million as at March 31, 2012). The corresponding allowance for doubtful accounts was $327 thousand ($497 thousand as at March 31, 2012), a favourable amount considering the total value of NRC’s external revenues. Another $4.5 million ($5.2 million as at March 31, 2012) of the accounts receivable balance relates to other government departments and agencies. The March 31, 2012 accounts receivable balance also included a net $2.1 million of repayable contributions relating to the NRC-IRAP Technology Partnerships Canada (TPC) program. As NRC no longer administered this program in 2012-13, a nil balance is reflected as at March 31, 2013.

9
National Research Council Canada Annual Report 2012-2013
9
Aged Accounts Receivable: The graph below presents the aged accounts receivable from external parties, other government departments, and employee advances. The prior year amounts exclude repayable contributions under the NRC-IRAP TPC program, which is no longer administered by NRC. In 2012-13, 95% (94% in 2011-12) of accounts receivable were aged 90 days or below indicating that receivables are collected in a timely manner.
Cash and Investments: In addition to the Equity Investments held by NRC, this line item includes the consolidated balance of cash and investments held by CFHT as detailed in Note 9 of the consolidated financial statements. CFHT Investments include time certificates of deposit and U.S. government securities. As part of its mandate to promote industrial innovation in Canada, NRC provides financial assistance to firms through access to equipment, intellectual property and incubation space in its laboratories and Industrial Partnership Facilities. NRC has on occasion taken an equity position in a company in return for assistance provided or in exchange for outstanding debts to NRC. NRC divests of equity investments by taking into account the interests and market liquidity of the company involved.
The full value of equity investments recorded in the Consolidated Statement of Financial Position reflects NRC’s investment in publicly traded companies as its shares in privately held corporations are deemed to have no market value. NRC’s equity investments decreased from $344 thousand to $215 thousand in 2012-13 as a result of write-down in the book value of one of the public companies in which NRC holds shares.
The following table provides an overview of NRC’s 2012-13 equity holdings:
NRC does not intend to hold publicly held securities for the long term.
23.2
3.4 2.70.7 0.9
21.3
2.7 1.5 0.9 0.7
19.7
1.5 1.3 0.5 1.4
0
5
10
15
20
25
Current 1-30 31-90 91-180 Over 180Days Overdue
Aged Receivables (in $ millions)
2012-13 2011-12 2010-11
CompanyOpening
balance ($)
Book value of equity investments acquired, sold or written off during the year ($)
Closing balance ($)
Market value of publicly traded equity
investments ($)
Avivagen Inc. 189,046 - 189,046 100,825PharmaGap Inc. 155,215 (129,346) 25,869 6,467Cequence Energy Ltd. 1 - 1 393Privately held corporation 1 - 1 n/a
Total 344,263 (129,346) 214,917 107,685

10
National Research Council Canada Annual Report 2012-2013
10
Non-Financial Assets Prepaid Expenses: NRC’s prepaid expenses as at March 31, 2013 were $12.9 million ($11.7 million as at March 31, 2012), the components of which are shown in the chart below. Subscriptions make up the largest component of NRC’s prepaid expenses. Canada’s Science Library subscribes to many of the world’s major scientific and technical journals and databases.
Endowment Fund Investments: The Holmes Endowment Fund is an investment bequeathed to NRC in July 1994. Up to two-thirds of the endowment fund’s annual net income is used to finance the H.L. Holmes award. The award covers a one or two-year period and provides an opportunity for Canadian post-doctoral students to study at world famous graduate schools or research institutes. In 2012-13, NRC provided one grant totalling $108 thousand to a recipient of the 2011 NRC H.L. Holmes Award. The recipient is using a total award of $200 thousand to fund two years of collaborative research at the Wellcome Trust Sanger Institute in Cambridge in the UK. The research combines genetic sequencing with computer informatics to better understand breast cancer. The endowment fund had a fair market value of $5.1 million on March 31, 2013 ($5 million on March 31, 2012). The investments within the portfolio had an average effective return of 3.99% in 2012-13 (4.41% in 2011-12). The endowment fund is presented at an amortized cost of $4.8 million ($4.7 million as at March 31, 2012) on the Consolidated Statement of Financial Position and not at fair value. Note 10 of the consolidated financial statements provides additional detail. Tangible Capital Assets: The net book value of NRC’s tangible capital assets decreased from $555.5 million in 2011-12 to $537.8 million in 2012-13. Total tangible capital asset acquisitions amounted to $46.8 million with amortization of $64.6 million and net adjustments, disposals and write-offs of $0.1 million. Note 11 of the consolidated financial statements provides additional detail. Acquisitions The additions to Tangible Capital Assets of $46.8 million in 2012-13 represented a slight increase from the $45.1 million spent in 2011-12. The most significant acquisition categories were assets under construction ($22.6 million or 48%), building and facilities ($10.7 million or 23%) and investments in machinery, equipment and furniture ($10.3 million or 22%).
5.6
2.8
2.6
1.9 Prepaid Expenses as at March 31, 2013
(in $ millions)
Subscriptions (5.6)
Maintenance and licences (2.8)
Other (2.6)
Payment in lieu of taxes (1.9)

11
National Research Council Canada Annual Report 2012-2013
11
The following represents significant tangible capital assets expenditures over $1 million in 2012-13:
$13.6 million of building recapitalization work was completed in 2012-13 including: electrical system upgrades ($2.4 million), roofing ($1.6 million), mechanical system upgrades ($4.1 million), site work ($1.1 million), interior architectural work ($1.1 million), elevator upgrades ($375 thousand), and exterior building upgrades ($3.0 million)
$5.3 million was invested in an energy and mechanical system retrofit at the 100 Sussex Drive Building (in addition to $1.8 million invested in 2011-12). This investment will be completed in 2014-2015 and is expected to provide $1.0 million annually in energy cost savings. Planned total project costs are $9.5 million.
NRC’s Aerospace Portfolio invested $2.0 million to repaint the shell of the U70 low-speed wind tunnel located at its Uplands facility in Ottawa. The high revenue generating wind tunnel required repainting to prevent potential damage to the structure from corrosion.
NRC’s Aerospace Portfolio invested $1.6 million (in addition to $1.8 million in previous years) towards the construction of a Synthetic Fuels Facility to support a large high pressure and high temperature combustion project. This is a key asset required to test and develop low emission gas turbines, and generate revenue for NRC through the use of the test facility.
NRC’s Aerospace Portfolio invested $1.2 million to refurbish one of NRC’s helicopters to replace the actuators with a modern fly-by-wire system. The system will enable the helicopter to serve as an airborne simulator. The experimental fly-by-wire capacity meets the high demand from Canadian Industry and the Department of National Defence.
NRC’s Human Health Therapeutics Portfolio invested $1.2 million in Genomics Technologies and Plant Growth facilities required for the NRC Canadian Wheat Improvement Flagship Program. This program will make a significant contribution to improving the yield, sustainability, and profitability of Canadian wheat.
NRC’s Human Health Therapeutics Portfolio invested $1.1 million to acquire equipment and instrumentation to establish state-of-the art capacity in physiochemical characterization of protein biologics. It will allow the NRC to successfully deploy vaccine and biologics programs that will foster industrial innovation and growth through technology support, and deliver results in line with the objectives of the federal government’s Science and Technology Strategy, particularly with respect to regenerative medicine and health in an aging population.
48.4%
22.9%
22.0%
6.7%
36.1%
23.7%
28.2%
12.0%
Assets under construction
Buildings and facilities
Machinery, equipment and furniture
Informatics equipment / Informatics software / Other
Tangible Capital Asset Acquisitions
2012-132011-12

12
National Research Council Canada Annual Report 2012-2013
12
Expenses Expenses are shown in the Consolidated Statement of Operations and Departmental Net Financial Position by Program Alignment Architecture (PAA) categories. They are also detailed by type of expense in Note 16 of the consolidated financial statements. NRC’s expenses increased from $847.6 million in 2011-12 to $915.0 million in 2012-13. The two largest categories of expenses are salaries and employee benefits (46.8% of total expenses in 2012-13 and 53.7% in 2011-12) and grants & contributions (27.1% of total expenses in 2012-13, 16.9% in 2011-12). The following illustrates expenses by type:
Total expenses of $915.0 million were $108.0 million higher than the amount forecast in NRC’s Future Oriented Financial Statements reported in the 2012-13 Report on Plans and Priorities (RPP), and shown as Planned Results on the Consolidated Statement of Operations and Departmental Net Financial Position. The variance is primarily due to Grants and Contribution expense ($78.2 million (46%) higher than forecast), as the government had not yet announced the budget increase for NRC-IRAP at the time the forecast was established. Salary and employee benefits were $27.5 million (6.9%) higher than forecast. Salaries and Employee Benefits: Salaries and employee benefits include such costs as gross salaries and wages, overtime pay, retroactive salary adjustments, employee entitlements and allowances, severance pay, pension, and health and dental plan costs. Total NRC salaries and employee benefits have decreased by $27.0 million, from $455.5 million in 2011-12 to $428.5 million in 2012-13. The decrease is primarily the result of fewer full-time equivalent employees (FTEs) compared to 2011-12, offset in part by higher workforce adjustment payments in 2011-12. Additionally, new government-wide employment contract agreements resulted in certain NRC employees classifications no longer eligible for severance benefits reducing annual severance liability expenses. Grants and Contributions: Grants and contributions increased by $104.1 million, from $143.6 million in 2011-12 to $247.7 million in 2012-13, as shown in the chart below. The increase is the result of an additional $110.0 million per year in funding to double the Industrial Research Assistance Program as announced in Canada’s Economic Action Plan 2012.
428.5
247.7
71.9
64.6
51.0
12.9
14.9
14.5
9.0
455.5
143.6
78.1
66.0
41.7
18.6
17.4
15.1
11.6
Salaries and employee benefits
Grants and contributions
Utilities, materials and supplies
Amortization
Professional and special services
Transportation and communication
Repairs and maintenance
Payment in lieu of taxes
Other
Expenses (in $ millions)
2012-132011-12

13
National Research Council Canada Annual Report 2012-2013
13
Utilities, Materials and Supplies: Utilities, materials and supplies include expenditures such as electricity, natural gas, serial renewals, electronic data processing (EDP) equipment with cost under $5,000, fuel, software, laboratory equipment and laboratory products. Utilities, material and supply costs decreased by $6.2 million from $78.1 million in 2011-12 to $71.9 million in 2012-13. The 8% reduced spending included areas such as laboratory equipment and parts, and electronics and electronic supplies. Spending in these areas depends on the varying nature of projects from year to year which can have different material and supply requirements. Amortization: Tangible capital assets yield benefits over many accounting periods. As such, NRC’s use of tangible capital assets to provide services is recognized as an expense on a straight-line basis over the estimated useful life of each asset class. Amortization expense amounted to $64.6 million in 2012-13 ($66 million in 2011-12). Professional and Special Services: Professional and special services increased by $9.3 million in 2012-13 to $51 million, from $41.7 million in 2011-12. This 22% increase is primarily due to NRC having transferred responsibility for its email, data centre and network services and support to Shared Services Canada (SSC) following the Government of Canada initiative to centralize these services. The services now received from SSC are recognized as services received without charge in professional services expenses. A total of $16.1 million was recognized in expenses, as shown in note 14a of the financial statements. Transportation and Communication: Transportation and communication expenses decreased by $5.7 million in 2012-13, from $18.6 million in 2011-12 to $12.9 million in 2012-13. The 31% decrease is mainly attributable to NRC having transferred responsibility for its email, data centre and network services and support to SSC. Repairs and Maintenance: NRC has a significant amount of infrastructure investments such as buildings, facilities, and research equipment. The repair and maintenance costs related to the maintenance of these assets totalled $14.9 million in 2012-13, a decrease from the $17.4 million incurred in 2011-12. Expenditures in this area can vary from year to year based on many factors including requirements for services. Payment in lieu of taxes (PILT): NRC owns property and is exempt from paying property tax as an agency of the Government of Canada. The Government of Canada, as a property owner, supports the principle that it should share the cost of local government equitably with other property owners in the community since federal properties benefit from municipal services. As such, federal departments and agencies, including NRC, transfer amounts to municipalities in lieu of taxes. Public Works and Government Services Canada (PWGSC) assesses the amount to be transferred by NRC under the PILT program each year. In 2012-13, NRC paid PILT of $14.5 million ($15.1 million in 2011-12). Other: Other expenses of $9.0 million ($11.6 million in 2011-12) include, but are not limited to, rental charges of $4.4 million ($4.6 million in 2011-12), information costs of $1.8 million ($2 million in 2011-12) award costs of $1.6 million ($2.3 million in 2011-12), and cost of goods sold of $0.7 million ($2.5 million in 2011-12).
195.1
44.0
8.6
Net Grants and Contributions, 2012-13 (in $ millions)
Industrial Research Assistance Programs (195.1)
TRIUMF contributions (44.0)
International Telescopes and Affiliations (8.6)

14
National Research Council Canada Annual Report 2012-2013
14
Expenses incurred on behalf of government: Treasury Board Accounting Standards require expenses incurred on behalf of government be backed out of the Consolidated Statement of Operations and Departmental Net Financial Position. In 2011-12, $1.1 million of such expenses (primarily salary) were incurred under the NRC-IRAP TPC program which NRC administered on behalf of Industry Canada. The administration of this program was transferred to Industry Canada in April 2012. Revenues NRC’s total revenues decreased from $170.9 million in 2011-12 to $155.3 million in 2012-13. The following chart provides a breakdown of the revenue components:
Revenues of $155.3 million were $25.4 million lower than the amount forecast in NRC’s Future Oriented Financial Statements reported in the 2012-13 RPP. The refocusing of NRC research activities began during 2012-13, and revenue growth over this period of transition was slower than expected. Technical Services: In 2012-13, $79.5 million or 51% ($104.4 million or 61% in 2011-12) of NRC revenues were generated from technical services. These are standard services delivered using existing NRC technology and expertise with projects that have a low level of technical risks and do not generate new intellectual property. The decrease is attributable to the transition of NRC research activities and transformation of business processes, which caused delays in program approval and required additional time spent on program planning. NRC also had several large projects in 2011-12 that were completed during that period. Research Services: In 2012-13, $50.5 million or 33% ($42.3 million or 25% in 2011-12) of NRC revenues were generated from research services, which are non-standard services delivered with incremental intellectual contribution and some level of technical/scientific risks. This includes Collaborative Research Services, where clients can provide intellectual contribution to the project and share the total cost of the project. The $8.2 million increase is the result of a greater emphasis on programs directed toward Research Service type projects versus Technical Services projects.
50.5
79.5
8.5
6.2
4.4
6.2
42.3
104.4
8.6
5.0
5.2
5.4
Research Services
Technical Services
Intellectual Property, Royalties and Fees
Rentals
Sales of goods and information products
Other
Revenues (in $ millions)
2012-132011-12

15
National Research Council Canada Annual Report 2012-2013
15
Intellectual Property Royalties and Fees: Royalty revenue is earned from companies that license the rights to use NRC technologies. Royalties are typically based on a percentage of the licensee’s sales. In 2012-13, NRC generated $8.5 million in royalties similar to the $8.6 million realized in 2011-12. Rentals: Facilitating access to NRC researchers and facilities is an important part of technology transfer at NRC. To this end, NRC provides laboratory space to companies on a commercial basis often as part of a collaboration or technology transfer agreement. Revenue from lease and use of property amounted to $6.2 million in 2012-13, compared to $5 million in 2011-12. Sales of Goods and Information Products: As part of its goal to disseminate scientific and technical information of importance to industry, NRC has publications and certified reference materials that it sells to clients. Total sales of goods and information products totalled $4.4 million in 2012-13, as compared to $5.2 million in 2011-12. The largest component of revenue derived from the sale of goods and information products are sales of codes most significantly National Model Building Codes by NRC’s Construction Portfolio. Other: Other revenue of $6.2 million ($5.4 million in 2011-12) include, but are not limited to, lease inducement revenue of $2.5 million ($2.5 million in 2011-12) and grants and contributions revenue of $2.9 million ($2.1 million in 2011-12). Revenue earned on behalf of government: Treasury Board Accounting Standards require revenues earned on behalf of government be backed out of the Consolidated Statement of Operations and Departmental Net Financial Position. In 2011-12, this included $1.2 million of financial arrangement revenue provided by Industry Canada for the NRC-IRAP TPC program, which NRC administered on their behalf (NRC no longer administered the program during 2012-13), and $255 thousand of interest revenues which NRC cannot use for its operations. The 2012-13 balance of $128 thousand results from a reversal of IRAP-TPC interest revenue from 2011-12.

16
National Research Council Canada Annual Report 2012-2013

17
National Research Council Canada Annual Report 2012-2013
Consolidated Financial Statements
National Research Council Canada
March 31, 2013

18
National Research Council Canada Annual Report 2012-2013

19
National Research Council Canada Annual Report 2012-2013

20
National Research Council Canada Annual Report 2012-2013
National Research Council Canada
Statement of Management Responsibility Including InternalControl Over Financial Reporting
Responsibility for the integrity and objectivity of the accompanying consolidated financialstatements for the year ended March 31, 2013, and all information contained in these statementsrests with the management of the National Research Council Canada (NRC). Theseconsolidated financial statements have been prepared by management using the Government'saccounting policies, which are based on Canadian public sector accounting standards.
Management is responsible for the integrity and objectivity of the information in theseconsolidated financial statements. Some of the information in the consolidated financialstatements is based on management's best estimates and judgment, and gives dueconsideration to materiality. To fulfil its accounting and reporting responsibilities, managementmaintains a set of accounts that provides a centralized record of NRC’s financial transactions.Financial information submitted in the preparation of the Public Accounts of Canada, andincluded in NRC’s Departmental Performance Report, is consistent with these consolidatedfinancial statements.
Management is also responsible for maintaining an effective system of internal control overfinancial reporting (ICFR) designed to provide reasonable assurance that financial information isreliable, that assets are safeguarded and that transactions are properly authorized and recordedin accordance with the Financial Administration Act and other applicable legislation, regulations,authorities and policies.
Management seeks to ensure the objectivity and integrity of data in its consolidated financialstatements through careful selection, training, and development of qualified staff; throughorganizational arrangements that provide appropriate divisions of responsibility; throughcommunication programs aimed at ensuring that regulations, policies, standards, and managerialauthorities are understood throughout NRC; and through conducting an annual assessment ofthe effectiveness of the system of ICFR.
The system of ICFR is designed to mitigate risks to a reasonable level based on an ongoingprocess to identify key risks, to assess the effectiveness of associated key controls, and to makeany necessary adjustments.
A risk based assessment of the system of ICFR for the year ended March 31, 2013 wascompleted in accordance with the Treasury Board Policy on Internal Control and the results andaction plans are summarized in the annex.
The effectiveness and adequacy of NRC’s system of internal control is reviewed by the work ofinternal audit staff, who conduct periodic audits of different areas of NRC's operations, and by theNRC Departmental Audit Committee, which oversees management's responsibilities formaintaining adequate control systems and the quality of financial reporting, and whichrecommends the consolidated financial statements to the President.

21
National Research Council Canada Annual Report 2012-2013
PricewaterhouseCoopers LLP has expressed an opinion on the fair presentation of theconsolidated financial statements of NRC for the year ended March 31, 2013 which does notinclude an audit opinion on the annual assessment of the effectiveness of NRC's internal controlsover financial reporting. The consolidated financial statements of NRC for the year ended March31, 2012 were audited by the Office of the Auditor General of Canada.
John R. McDougall, P.Eng. Michel Piché, M.P.A., CMA, CIAPresident Vice-President, Corporate Management
and Chief Financial Officer
Ottawa, Canada June 27, 2013

22
National Research Council Canada Annual Report 2012-2013
National Research Council CanadaConsolidated Statement of Financial Position
As at March 31
(in thousands of dollars) 2013 2012
LiabilitiesAccounts payable and accrued liabilities (Note 4) 167,560 104,920Vacation pay and compensatory leave 31,699 35,112Lease inducements 42,946 45,494Deferred revenue (Note 5) 11,498 15,207Lease obligation for tangible capital assets (Note 6) 75 146Employee future benefits (Note 7) 67,241 68,332
Total gross liabilities 321,019 269,211
Liabilities held on behalf of GovernmentAccounts payable and accrued liabilities (Note 4) - (2,115)
Total liabilities held on behalf of Government - (2,115)
Total net liabilities 321,019 267,096
Financial AssetsDue from the Consolidated Revenue Fund 290,720 183,826Accounts receivable and advances (Note 8) 30,641 28,873Inventory for resale 2,843 3,261Cash and investments (Note 9) 2,744 2,784
Total gross financial assets 326,948 218,744
Financial assets held on behalf of GovernmentAccounts receivable and advances (Note 8) (76) (2,418)
Total financial assets held on behalf of Government (76) (2,418)
Total net financial assets 326,872 216,326
Departmental net (surplus) debt (5,853) 50,770
Non-Financial AssetsPrepaid expenses 12,883 11,670Endowment fund investments (Note 10) 4,812 4,724Inventory for consumption 4,375 4,103Tangible capital assets (Note 11) 537,827 555,478
Total non-financial assets 559,897 575,975
Departmental net financial position 565,750 525,205
Contractual obligations (Note 12)Contingent liabilities (Note 13)
The accompanying notes form an integral part of these consolidated financial statements.
John R. McDougall, P.Eng. Michel Piché, M.P.A., CMA, CIAPresident Vice-President, Corporate Management
and Chief Financial Officer
Ottawa, Canada June 27, 2013

23
National Research Council Canada Annual Report 2012-2013
National Research Council CanadaConsolidated Statement of Operations and Departmental Net Financial Position
For the Year Ended March 31
(in thousands of dollars) 2013 2013 2012PlannedResults
ExpensesManufacturing Technologies 144,385 135,889 151,779Information and Communication Technologies (ICT) and Emerging
Technologies 75,051 66,123 76,800Industrial Research Assistance 166,568 248,288 148,671Health and Life Sciences Technologies 122,107 87,827 116,480Energy and Environmental Technologies 45,493 41,025 39,704National Science and Technology Infrastructure 98,491 101,849 99,989Scientific, Technical and Medical Information 20,806 21,113 23,221Internal Services 134,306 212,911 192,091Expenses incurred on behalf of Government (625) - (1,092)
Total expenses 806,582 915,025 847,643
RevenuesResearch services 40,557 50,441 42,284Technical services 116,835 79,530 104,429Intellectual property, royalties and fees 10,708 8,455 8,572Sales of goods and information products 5,000 4,422 5,171Rentals 4,500 6,215 4,987Grants and contributions - 2,884 2,134Lease inducement revenue 2,548 2,548 2,548Other 1,133 649 2,243Revenues earned on behalf of Government (625) 128 (1,455)
Total revenues 180,656 155,272 170,913
Net cost of operations before government funding and transfers 625,926 759,753 676,730
Government funding and transfersNet cash provided by Government 599,412 647,434 657,872Change in due from the Consolidated Revenue Fund 10,750 106,894 (13,474)Services provided without charge by other government departments
and agencies (Note 14) 28,444 46,498 40,710Transfers from/to other government departments (Note 15) - (528) 2,064
Net cost of operations after government funding and transfers (12,680) (40,545) (10,442)
Departmental net financial position - Beginning of year 525,205 525,205 514,763
Departmental net financial position - End of year 537,885 565,750 525,205
Segmented Information (Note 16)
The accompanying notes form an integral part of these consolidated financial statements.

24
National Research Council Canada Annual Report 2012-2013
National Research Council CanadaConsolidated Statement of Change in Departmental Net (Surplus) Debt
For the Year Ended March 31
(in thousands of dollars) 2013 2013 2012PlannedResults
Net cost of operations after government funding and transfers (12,680) (40,545) (10,442)
Change due to tangible capital assetsAcquisition of tangible capital assets 45,017 46,812 45,089Amortization of tangible capital assets (64,496) (64,637) (66,012)Proceeds from disposal of tangible capital assets - (173) (695)Net loss on disposal capital assets including adjustments (1,437) (126) (1,435)Transfers from/to other government departments (Note 15) - 525 (1,518)Other adjustments - (52) 540
Total change due to tangible capital assets (20,916) (17,651) (24,031)
Change due to inventories for consumption - 272 (654)
Change due to endowment fund investments 113 88 93
Change due to prepaid expenses - 1,213 172
Net decrease in departmental net debt (33,483) (56,623) (34,862)
Departmental net debt - Beginning of year 50,770 50,770 85,632
Departmental net (surplus) debt - End of year 17,287 (5,853) 50,770
The accompanying notes form an integral part of these consolidated financial statements.

25
National Research Council Canada Annual Report 2012-2013
National Research Council CanadaConsolidated Statement of Cash Flow
For the Year Ended March 31
(in thousands of dollars) 2013 2012
Operating ActivitiesNet cost of operations before government funding and transfers 759,753 676,730Non-cash items
Amortization of tangible capital assets (64,637) (66,012)Transfers from/to other government departments (Note 15) 1,053 (3,582)Net loss on disposal of tangible capital assets (126) (1,435)Services provided without charge by other government
departments and agencies (Note 14) (46,498) (40,710)Impairment in value of equity investments (129) (128)Other adjustments to tangible capital assets (52) 540
Variations in Statement of Financial PositionIncrease in accounts receivable and advances 4,110 2,915(Decrease) increase in inventory for resale (418) 1,069Increase in prepaid expenses 1,213 172Increase (decrease) in inventory for consumption 272 (654)(Increase) decrease in accounts payable and accrued liabilities (64,755) 34,506Decrease in vacation pay and compensatory leave 3,413 3,583Decrease in lease inducements 2,548 2,548Decrease in deferred revenue 3,709 575Decrease in employee future benefits 1,091 2,767
Cash used in operating activities 600,547 612,884
Capital Investing ActivitiesAcquisitions of tangible capital assets 46,812 45,089Proceeds from disposal of tangible capital assets (173) (695)
Cash used in capital investing activities 46,639 44,394
Investing ActivitiesIncome from endowment fund investments 196 208Awards granted from endowment fund (108) (115)Increase in CFHT cash and investments 89 434
Cash used in investing activities 177 527
Financing ActivitiesLease payments for tangible capital assets 71 67
Cash used in financing activities 71 67
Net cash provided by Government of Canada 647,434 657,872
The accompanying notes form an integral part of these consolidated financial statements.

26
National Research Council Canada Annual Report 2012-2013
National Research Council CanadaNotes to Consolidated Financial StatementsFor the Year Ended March 31, 2013
1. Authority and ObjectivesThe National Research Council Canada (NRC) exists under the National Research CouncilAct (NRC Act) and is a departmental corporation named in Schedule II of the FinancialAdministration Act. The mission of NRC is to work with clients and partners to provide strategicresearch, scientific and technical services to develop and deploy solutions to meet Canada'scurrent and future industrial and societal needs.
In delivering its mandate, NRC reports under the following program activities:
Manufacturing Technologies: Multidisciplinary research and development inconsultation with industry, universities, government departments and other keyinnovation players to improve the global competitiveness of Canadian industry bytransforming knowledge and innovation into real economic value and bytransferring technologies into industrial solutions for the marketplace.
Information and Communication Technologies (ICT) and Emerging Technologies:Mobilizes, collaborates and partners with key university, government and privatesector players and forms major research collaborations to develop integratedresearch solutions in the areas of information and communication technologies andemerging technologies.
Industrial Research Assistance (IRAP): Provides a range of technical and business-oriented advisory services, as well as financial support for small and medium-sizedCanadian businesses engaged in research and development of technologicalinnovations to augment their capacity and capability to innovate, commercialise andgenerate significant economic activity for Canadian industry.
Health and Life Science Technologies: Mobilizes and partners with key university,government and private sector players and forms major research collaborations todevelop integrated research solutions for complex health and related life scienceissues.
Energy and Environmental Technologies: In partnership with other governmentdepartments, universities and industry, brings together the knowledge andexpertise needed to make an impact on areas of critical importance to Canada inenvironmental and sustainable energy.
National Science and Technology Infrastructure: Manages national science andengineering facilities and infrastructure critical to research, development andinnovation by Canadian scientific and technological communities.
Scientific, Technical and Medical Information: Operates and maintains the nationalscience library, specifically holding the national collection of scientific, technical andmedical information, to facilitate knowledge discovery, cross discipline research,innovation and commercialization.
Internal Services: Groups of activities and resources administered to support theneeds of programs and other corporate obligations of the organization. Includesonly those activities and resources that apply across the organization and not thoseprovided specifically to a program.
27
National Research Council Canada Annual Report 2012-2013
2. Summary of Significant Accounting PoliciesThese consolidated financial statements have been prepared using the Government's accounting policiesstated below, which are based on Canadian public sector accounting standards. The presentation andresults using the stated accounting policies do not result in any significant differences from Canadianpublic sector accounting standards.
Significant accounting policies are as follows:
a) Parliamentary authorities
NRC is financed mainly by the Government of Canada through Parliamentary authorities.Financial reporting of authorities provided to NRC do not parallel financial reporting according togenerally accepted accounting principles since authorities are primarily based on cash flowrequirements. Consequently, items recognized in the Consolidated Statement of Operations andDepartmental Net Financial Position and in the Consolidated Statement of Financial Position arenot necessarily the same as those provided through authorities from Parliament. Note 3 providesa reconciliation between the bases of reporting. The planned results amounts in the ConsolidatedStatement of Operations and Departmental Net Financial Position are the amounts reported inthe future-oriented financial statements included in the 2012-13 Report on Plans and Priorities,which have been reclassified to conform to the current year's presentation.
b) Consolidation
These consolidated financial statements include both NRC and its portion of the accounts of theCanada-France-Hawaii Telescope Corporation (CFHT). The NRC relationship with CFHT meetsthe definition of a government partnership under Canadian public sector accounting standards,which requires that its results be proportionally consolidated within those of NRC. All inter-organizational balances and transactions are eliminated as part of the consolidation process.CFHT has audited financial statements as at December 31, 2012 which have been proportionallyconsolidated with NRC's March 31, 2013 financial statements.
c) Net cash provided by Government
NRC operates within the Consolidated Revenue Fund (CRF), which is administered by theReceiver General for Canada. All cash received by NRC is deposited to the CRF and all cashdisbursements made by NRC are paid from the CRF. The net cash provided by Government isthe difference between all cash receipts and all cash disbursements including transactionsbetween departments (including agencies) of the Government.
d) Amounts due from or to the CRF
Amounts due from or to the CRF are the result of timing differences at year-end between when atransaction affects authorities and when it is processed through the CRF. Amounts due from theCRF represent the net amount of cash that NRC is entitled to draw from the CRF without furtherauthorities to discharge its liabilities.

28
National Research Council Canada Annual Report 2012-2013
e) Revenues
Revenues are recognized in the year in which the underlying transaction or event occurred thatgave rise to revenue as follows:
Research and Technical services: revenues are recognized as services are provided basedon percentage-of-completion.
Intellectual property, royalties and fees: revenues are recognized over the licence period. Sales of goods and information products: revenue is recognized when goods or information
products are delivered to the client. Rentals: revenue is recognized in the period in which the lease or use of property relates to. Grants and contributions: revenue is recognized when the transfer payment is authorized and
any eligibility criteria are met, except to the extent that transfer stipulations give rise to anobligation that meets the definition of a liability.
Funds received for which NRC has an obligation to other parties for the provision of goods,services or the use of assets in the future are recorded as deferred revenue.
Receipts are deposited to the CRF. Under the NRC Act, money received by NRC through theconduct of its operations is respendable in the current or in subsequent years.
Revenues that are non-respendable are not available to discharge NRC's liabilities. While thePresident is expected to maintain accounting control, he has no authority regarding thedisposition of non-respendable revenues. As a result, non-respendable revenues are consideredto be earned on behalf of the Government of Canada and are therefore presented in reduction ofthe NRC's gross revenues.
f) Expenses
Expenses are recorded on the accrual basis. Contributions are recognized in the year in which the recipient has met the eligibility criteria
or fulfilled the terms of a contractual transfer agreement, provided that the transfer isauthorized and a reasonable estimate can be made.
Grants are recognized in the year in which the conditions for payment are met. In the case ofgrants which do not form part of an existing program, the expense is recognized when theGovernment announces a decision to make a non-recurring transfer, provided the enablinglegislation or authorization for payment receives parliamentary approval prior to thecompletion of the consolidated financial statements.
Vacation pay and compensatory leave are accrued as the benefits are earned by employeesunder their respective terms of employment.
Services provided without charge by other government departments and agencies foraccommodation, employer contributions to the health and dental insurance plans, legalservices, workers' compensation and the services related to the email, data centre andnetwork services and the email, data centre and network support unit are recorded asoperating expenses at their estimated cost.

29
National Research Council Canada Annual Report 2012-2013
g) Employee future benefits
i) Pension Benefits
Eligible employees participate in the Public Service Pension Plan, a multiemployer pension planadministered by the Government of Canada. NRC’s contributions to the Plan are charged toexpenses in the year incurred and represent NRC’s total obligation to the Plan. NRC'sresponsibility with regard to the Plan is limited to its contributions. Actuarial surpluses ordeficiencies are recognized in the financial statements of the Government of Canada, as thePlan's sponsor.
ii) Severance Benefits
Employees entitled to severance benefits under labour contracts or conditions of employmentearn these benefits as services necessary to earn them are rendered. The obligation relating tothe benefits earned by employees is calculated using information derived from the results of theactuarially determined liability for employee severance benefits for the Government as a whole.
h) Lease inducements
Lease inducements represent incentives received by NRC to enter into lease agreements forproperty at a nominal cost of one dollar. Lease inducements are deferred and amortized on thesame basis as the related depreciable tangible capital assets.
i) Accounts receivable
Accounts receivable are stated at the lower of cost and net recoverable value. A valuationallowance is recorded for receivables where recovery is considered uncertain.
j) Contingent liabilities
Contingent liabilities are potential liabilities, which may become actual liabilities when one ormore future events occur or fail to occur. To the extent that the future event is likely to occur orfail to occur, and a reasonable estimate of the loss can be made, an estimated liability is accruedand an expense recorded. If the likelihood is not determinable or an amount cannot bereasonably estimated, the contingency is disclosed in the notes to the consolidated financialstatements.
k) Environmental liabilities
Environmental liabilities reflect the estimated costs related to the management and remediationof environmentally contaminated sites. Based on management's best estimates, a liability isaccrued and an expense recorded when the contamination occurs or when NRC becomes awareof the contamination and is obligated, or is likely to be obligated to incur such costs. If thelikelihood of NRC's obligation to incur these costs is not determinable, or if an amount cannot bereasonably estimated, the costs are disclosed as contingent liabilities in the notes to theconsolidated financial statements.
l) Inventories
Inventory consists of parts, materials and supplies held for future program delivery as well asinventory for resale. Inventory for resale is recorded at the lower of cost, using the average costmethod, or net realizable value. Inventory for consumption is recorded at cost using the averagecost method.

30
National Research Council Canada Annual Report 2012-2013
m) Equity investments
Equity investments include shares in public and privately-held companies. Equity investments aretypically obtained as a result of debt settlement negotiations or as a result of non-monetarytransactions (where financial assistance at better-than-market conditions was provided to firmsthrough access to intellectual property, equipment and incubation space in laboratories). If theestimates of the non-monetary transactions cannot be determined, the equity investments areinitially recorded at a nominal value. Otherwise they are initially recorded at fair value based onmarket prices. If the fair value of equity investments becomes lower than the book value and thisdecline in value is considered to be other than temporary, the equity investments are writtendown to fair value.
n) Endowment fund investments
Endowments consist of donations subject to externally imposed restrictions stipulating that theresources be maintained permanently by NRC. Income from the endowment fund investmentsmay only be used for the purposes established by the donors.
Funds received for endowments are invested in bonds and other low risk instruments and arecarried at amortized cost. Discounts and premiums arising on the purchase of these investmentsare amortized over the term of the investments.
o) Foreign currency transactions
Transactions involving foreign currencies are translated into Canadian dollar equivalents usingrates of exchange in effect at the time of those transactions. Monetary assets and liabilitiesdenominated in a foreign currency, and CFHT assets and liabilities, are translated into Canadiandollars using the rate of exchange in effect at year end. Gains and losses resulting from foreigncurrency transactions are included in the applicable line on the Consolidated Statement ofOperations and Departmental Net Financial Position according to the activities to which theyrelate. Net gains and losses relating to the sale of goods or services denominated in a foreigncurrency are included in revenues. Net gains and losses relating to the purchase of goods orservices denominated in a foreign currency are included in expenses. Contractual obligationsmay contain foreign currencies that are translated into Canadian dollar equivalents using the rateof exchange in effect at March 31, 2013. CFHT revenues and expenses are translated intoCanadian dollar equivalents using the average rate during the fiscal year.

31
National Research Council Canada Annual Report 2012-2013
p) Tangible capital assets
All tangible capital assets and leasehold improvements having an initial cost of $5,000 or moreare recorded at their acquisition cost. Contributed tangible capital assets are recorded at fairvalue at the date of contribution. NRC does not capitalize intangibles, works of art and historicaltreasures that have cultural, aesthetic or historical value. Assets acquired under tangible capitalleases are initially recorded at the lower of the present value of the minimum lease payments atthe inception of the lease or fair value. Tangible capital assets held for sale are recorded at thelower of their carrying value or fair value less cost to sell and no amortization is recorded oncethe tangible capital asset is deemed held for sale.
Amortization of tangible capital assets is calculated on a straight-line basis over the estimateduseful life of the asset as follows:
Asset Class Amortization PeriodLand Not applicableBuildings and facilities 25 yearsWorks and infrastructure 25 - 40 yearsMachinery, equipment and furniture 10 yearsInformatics equipment 5 yearsInformatics software 5 yearsVehicles 7 yearsAircraft 15 - 30 yearsLeasehold improvements Lesser of the remaining term of the lease or
useful life of the improvementLeased tangible capital assets In accordance with asset class
Assets under construction are recorded in the applicable capital asset class in the year that theybecome available for use and are not amortized until they become available for use.
Where NRC enters into land leases at a nominal value, the transaction is considered as a non-monetary transaction and is recorded at fair value. If the fair value cannot be reasonablydetermined, the amount of the transaction is recorded at a nominal value.
The tangible capital assets consolidated from the CFHT Corporation are stated at cost.Amortization is calculated on the straight-line method over the estimated useful lives of thetangible capital assets ranging from 4 to 50 years.

32
National Research Council Canada Annual Report 2012-2013
q) Asset retirement obligations
Liabilities are recognized for statutory, contractual or legal obligations, when incurred, associatedwith the retirement of tangible capital assets when those obligations result from the acquisition,construction, development or normal operation of the assets. The obligations are measuredinitially at fair value, determined using present value methodology, and the resulting costscapitalized into the carrying amount of the related asset. In subsequent periods, the liability isadjusted for the accretion of discount and any changes in the amount or timing of the underlyingfuture cash flows. The capitalized asset retirement cost is depreciated on the same basis as therelated asset and the discount accretion is included in determining the results of operations.
r) Measurement uncertainty
The preparation of these consolidated financial statements requires management to makeestimates and assumptions that affect the reported amounts of assets, liabilities, revenues andexpenses reported in the consolidated financial statements. At the time of preparation of thesestatements, management believes the estimates and assumptions to be reasonable. The mostsignificant items where estimates are used are percentage-of-completion on revenue from theprovision of services, contingent liabilities, contaminated site liabilities, asset retirementobligations, the liability for employee severance benefits, the allowance for doubtful accounts, thefair value of non-monetary transactions related to leased tangible capital assets and the usefullife of tangible capital assets. Actual results could significantly differ from those estimated.Management's estimates are reviewed periodically and, as adjustments become necessary, theyare recorded in the consolidated financial statements in the year they become known.
33
National Research Council Canada Annual Report 2012-2013
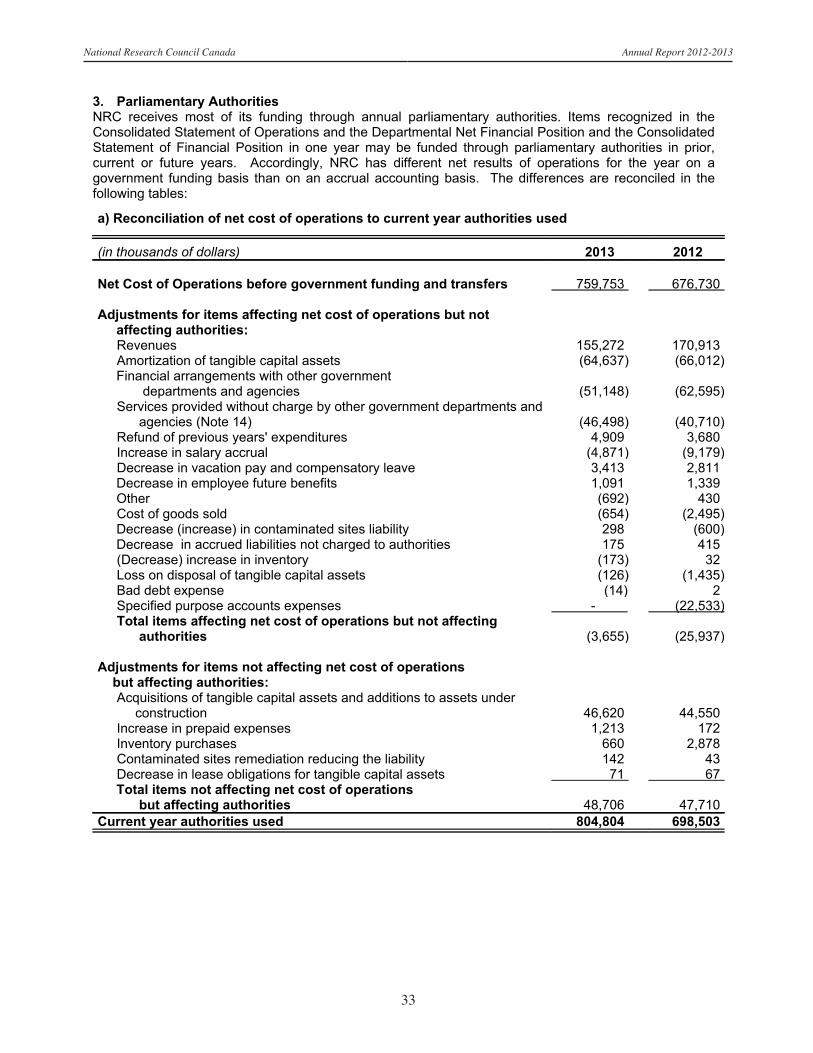
3. Parliamentary AuthoritiesNRC receives most of its funding through annual parliamentary authorities. Items recognized in theConsolidated Statement of Operations and the Departmental Net Financial Position and the ConsolidatedStatement of Financial Position in one year may be funded through parliamentary authorities in prior,current or future years. Accordingly, NRC has different net results of operations for the year on agovernment funding basis than on an accrual accounting basis. The differences are reconciled in thefollowing tables:
a) Reconciliation of net cost of operations to current year authorities used
(in thousands of dollars) 2013 2012
Net Cost of Operations before government funding and transfers 759,753 676,730
Adjustments for items affecting net cost of operations but notaffecting authorities:Revenues 155,272 170,913Amortization of tangible capital assets (64,637) (66,012)Financial arrangements with other government
departments and agencies (51,148) (62,595)Services provided without charge by other government departments and
agencies (Note 14) (46,498) (40,710)Refund of previous years' expenditures 4,909 3,680Increase in salary accrual (4,871) (9,179)Decrease in vacation pay and compensatory leave 3,413 2,811Decrease in employee future benefits 1,091 1,339Other (692) 430Cost of goods sold (654) (2,495)Decrease (increase) in contaminated sites liability 298 (600)Decrease in accrued liabilities not charged to authorities 175 415(Decrease) increase in inventory (173) 32Loss on disposal of tangible capital assets (126) (1,435)Bad debt expense (14) 2Specified purpose accounts expenses - (22,533)Total items affecting net cost of operations but not affecting
authorities (3,655) (25,937)
Adjustments for items not affecting net cost of operations but affecting authorities:Acquisitions of tangible capital assets and additions to assets under
construction 46,620 44,550Increase in prepaid expenses 1,213 172Inventory purchases 660 2,878Contaminated sites remediation reducing the liability 142 43Decrease in lease obligations for tangible capital assets 71 67Total items not affecting net cost of operations
but affecting authorities 48,706 47,710Current year authorities used 804,804 698,503
34
National Research Council Canada Annual Report 2012-2013
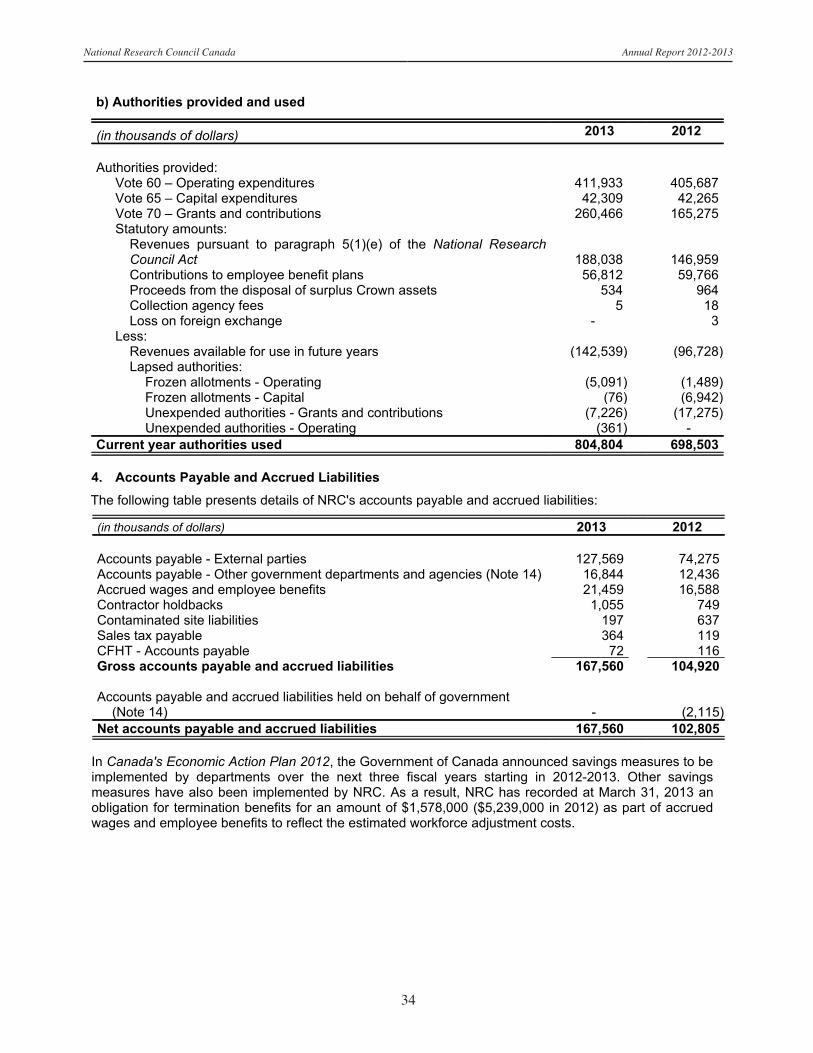
b) Authorities provided and used
(in thousands of dollars) 2013 2012
Authorities provided:Vote 60 – Operating expenditures 411,933 405,687Vote 65 – Capital expenditures 42,309 42,265Vote 70 – Grants and contributions 260,466 165,275Statutory amounts:
Revenues pursuant to paragraph 5(1)(e) of the National ResearchCouncil Act 188,038 146,959Contributions to employee benefit plans 56,812 59,766Proceeds from the disposal of surplus Crown assets 534 964Collection agency fees 5 18Loss on foreign exchange - 3
Less:Revenues available for use in future years (142,539) (96,728)Lapsed authorities:
Frozen allotments - Operating (5,091) (1,489)Frozen allotments - Capital (76) (6,942)Unexpended authorities - Grants and contributions (7,226) (17,275)Unexpended authorities - Operating (361) -
Current year authorities used 804,804 698,503
4. Accounts Payable and Accrued LiabilitiesThe following table presents details of NRC's accounts payable and accrued liabilities:
(in thousands of dollars) 2013 2012
Accounts payable - External parties 127,569 74,275Accounts payable - Other government departments and agencies (Note 14) 16,844 12,436Accrued wages and employee benefits 21,459 16,588Contractor holdbacks 1,055 749Contaminated site liabilities 197 637Sales tax payable 364 119CFHT - Accounts payable 72 116Gross accounts payable and accrued liabilities 167,560 104,920
Accounts payable and accrued liabilities held on behalf of government(Note 14) - (2,115)
Net accounts payable and accrued liabilities 167,560 102,805
In Canada's Economic Action Plan 2012, the Government of Canada announced savings measures to beimplemented by departments over the next three fiscal years starting in 2012-2013. Other savingsmeasures have also been implemented by NRC. As a result, NRC has recorded at March 31, 2013 anobligation for termination benefits for an amount of $1,578,000 ($5,239,000 in 2012) as part of accruedwages and employee benefits to reflect the estimated workforce adjustment costs.

35
National Research Council Canada Annual Report 2012-2013
5. Deferred RevenueDeferred revenue represents the balances at year-end of unearned revenues stemming from amountsreceived from external parties that are restricted in order to fund the expenditures related to specificresearch projects and stemming from amounts received for fees prior to services being performed.Revenue is recognized in the period in which these expenditures are incurred or in which the service isperformed. Details of the transactions related to this account are as follows:
(in thousands of dollars) 2013 2012
Opening balance 15,151 15,689Funds received 31,213 31,095Revenue recognized (34,957) (31,633)Closing balance 11,407 15,151
CFHT – Deferred revenue 91 56Total deferred revenue 11,498 15,207
6. Lease Obligation for Tangible Capital Assets NRC has entered into an agreement to lease mechanical test equipment under capital lease with a costof $336,000 and accumulated amortization of $89,600 as at March 31, 2013 ($336,000 and $56,000respectively as at March 31, 2012). The obligations related to the upcoming years include the following:
(in thousands of dollars) 2013 20122013 - 802014 80 80Total future minimum lease payments 80 160Less: imputed interest (6.11%) (5) (14)Balance of obligations under leased tangible capital assets 75 146

36
National Research Council Canada Annual Report 2012-2013
7. Employee Future Benefitsa) Pension benefits
Eligible NRC employees participate in the Public Service Pension Plan, which is sponsored andadministered by the Government. Pension benefits accrue up to a maximum of 35 years at a rate of 2%per year of pensionable service, times the average of the best five consecutive years of earnings. Thebenefits are integrated with Canada/Québec Pension Plans benefits and they are indexed to inflation.
Both the employees and NRC contribute to the cost of the Plan. The expense amounted to $40,563,757as at March 31, 2013 ($42,958,202 in 2012), which represented approximately 1.7 times (1.8 times in2012) the contributions by employees.
NRC’s responsibility with regard to the Plan is limited to its contributions. Actuarial surpluses ordeficiencies are recognized in the financial statements of the Government of Canada, as the Plan’ssponsor.
b) Severance benefits
NRC provides severance benefits to its employees based on eligibility, years of service and salary attermination of employment. These severance benefits are not pre-funded. Benefits will be paid fromfuture authorities.
As part of changes to conditions of employment for executives and certain non-represented employees,the accumulation of severance benefits under the employee severance pay program ceased for theseemployees commencing in 2012. Employees subject to these changes have been given the option to beimmediately paid the full or partial value of benefits earned to date or collect the full or remaining value ofbenefits on termination from the public service. These changes have been reflected in the calculation ofthe outstanding severance benefit obligation.
Information about the severance benefits, measured as at March 31, is as follows:
(in thousands of dollars) 2013 2012Accrued benefit obligation, beginning of year 68,332 71,099Transferred to other government department, effective
November 15, 2011 - (1,428)Subtotal 68,332 69,671Expense for the year 7,138 7,660Benefits paid during the year (8,229) (8,999)Accrued benefit obligation, end of year 67,241 68,332

37
National Research Council Canada Annual Report 2012-2013
8. Accounts Receivable and AdvancesThe following table presents details of NRC's accounts receivable and advances balances:
(in thousands of dollars) 2013 2012
Receivables from external parties 26,377 21,877Receivables from other government departments and agencies (Note 14) 4,516 5,172CFHT – Accounts receivable 75 174Employee advances - 32
30,968 27,255Less: allowance for doubtful accounts on receivables from external parties (327) (497)
30,641 26,758
Repayable contributions - 6,902Less: allowance for uncollectibility - (4,787)Net repayable contributions - 2,115
Gross accounts receivable 30,641 28,873
Accounts receivable held on behalf of Government (76) (2,418)Net accounts receivable 30,565 26,455
9. Cash and Investments
(in thousands of dollars) 2013 2012
Cash and investments held by CFHT 2,529 2,440Equity investments 215 344Cash and investments 2,744 2,784
Equity investments include shares in three public companies (three in 2012) and one privately heldcompany (one in 2012). These shares were obtained through debt settlement or non-monetarytransactions. NRC will consider timely opportunities for divestiture of equity investments by taking intoaccount the interests, market liquidity and expected future growth of the applicable company.
NRC recorded an impairment reducing the value of its shares in two publically held companies by anamount of $129,346 ($127,688 in 2012).
As at March 31, 2013, the book value of the equity investments was $214,917 ($344,263 in 2012). Themarket value of NRC’s equity investments in public companies was $107,685 ($169,685 in 2012). Themarket value of the privately held companies is not determinable.

38
National Research Council Canada Annual Report 2012-2013
10. Endowment Fund InvestmentsThis account was established pursuant to paragraph 5(1)(f) of the National Research Council Act torecord the residue of the estate of the late H.L. Holmes. Up to two thirds of the endowment fund's annualnet income is used to finance the H.L. Holmes award on an annual basis. The award provides theopportunity to post-doctoral students to study at world famous graduate schools or research institutesunder outstanding researchers.
(in thousands of dollars) 2013 2012Restricted cash and investments, beginning of year 4,724 4,631Net income from endowment 196 208Awards granted (108) (115)Restricted cash and investments, end of year 4,812 4,724
The portfolio for endowment fund investments had an average effective return of 3.99% (4.41% in 2012)and an average term to maturity of 3.92 years as at March 31, 2013 (4.48 years as at March 31, 2012).The fair value of the endowment investments as at March 31, 2013 was $5,141,690 ($5,036,346 in 2012).
11. Tangible Capital Assets
(in thousands ofdollars)
Cost Accumulated Amortization Net Book Value
Tangiblecapital asset
classOpeningbalance Acquisitions
Adjustments(1)
Disposalsand write-
offsClosingbalance
Openingbalance Amortization Adjustments
Disposalsand write-
offsClosingbalance
2013 2012
Land 9,879 - - - 9,879 - - - - - 9,879 9,879Buildings and
facilities 704,928 10,742 (423) - 715,247 (428,489) (22,359) 94 - (450,754) 264,493 276,439Works and
infrastructure 24,926 965 726 - 26,617 (15,835) (1,011) - - (16,846) 9,771 9,091Machinery,
equipment andfurniture 525,771 10,319 15,724 (10,965) 540,849 (368,990) (31,201) (4,937) 10,286 (394,842) 146,007 156,781
Informaticsequipment 51,479 830 563 (1,361) 51,511 (41,300) (3,709) (512) 1,373 (44,148) 7,363 10,179
Informaticssoftware 18,398 654 626 17 19,695 (13,098) (2,141) (27) 9 (15,257) 4,438 5,300
Vehicles 3,051 316 - (239) 3,128 (2,247) (195) - 233 (2,209) 919 804Aircraft 12,003 112 21 - 12,136 (10,487) (37) - - (10,524) 1,612 1,516Leasehold
improvements 17,416 36 - (100) 17,352 (4,337) (771) - 99 (5,009) 12,343 13,079Assets under
construction 21,334 22,647 (10,925) (45) 33,011 - - - - - 33,011 21,334Leased tangible
capital assets 64,036 - - - 64,036 (18,263) (2,581) - - (20,844) 43,192 45,773CFHT - Tangible
capital assets 21,038 191 (62) (106) 21,061 (15,735) (632) - 105 (16,262) 4,799 5,303Total 1,474,259 46,812 6,250 (12,799) 1,514,522 (918,781) (64,637) (5,382) 12,105 (976,695) 537,827 555,478
(1) Adjustments include assets under construction of $10,925,000 that were transferred to the other categories upon completion of the assets.
During the year, NRC received machinery, equipment and furniture and informatics equipment with a cost of $6,298,207 and accumulatedamortization of $5,360,057 (net book value of $938,150) from various government departments. NRC also transferred machinery, equipment andfurniture with a cost of $597,858 and accumulated amortization of $184,339 (net book value of $413,519) to a government department.

39
National Research Council Canada Annual Report 2012-2013
Amortization expense for the year ended March 31, 2013 is $64,637,390 ($66,012,243 in 2012).
At March 31, 2013, NRC held nine land lease agreements (nine in 2012) for a nominal annual cost withuniversities. In these instances, NRC owns the building on the leased land. The fair value of the landleases for these non-monetary transactions could not be determined at the inception of the leasetherefore they are recorded at a nominal value.
On March 21, 1996, NRC entered into a non-monetary transaction consisting of a lease agreement withthe University of Western Ontario, whereby leased property was provided to NRC for twenty-five years ata nominal cost of one dollar. The property was recorded as a leased tangible capital asset at its fair valueof $10,000,000. The annual amortization of $400,000 for the leased tangible capital asset is exactly offsetby the amortization of the deferred contribution related to the leased property.
On May 23, 2006, NRC took possession of a new facility and entered into a non-monetary transactionwith the University of Alberta at a nominal cost of one dollar per year. The lease provides a one year termwith options to renew on ten sequential occasions, each of the first nine renewals to be for a period of fiveyears and the tenth renewal for a period of four years. The building was recorded as a leased tangiblecapital asset at its fair value of $44,400,000. The annual amortization of $1,776,000 for the leasedtangible capital asset is exactly offset by the amortization of the deferred contribution related to theleased building.
On September 1, 2006, NRC took possession of a new facility and entered into a non-monetarytransaction with the University of Prince Edward Island at a nominal cost of one dollar per year. Thelease provides a nineteen month term with renewal options for seven additional periods of five years, andone additional period of three years and five months (to August 31, 2046). The building was recorded asa leased tangible capital asset at its fair value of $9,300,000. The annual amortization of $372,000 for theleased tangible capital asset is exactly offset by the amortization of the deferred contribution related tothe leased building.
12. Contractual ObligationsThe nature of NRC’s activities can result in some large multi-year contracts and obligations whereby NRCwill be obligated to make future payments in order to carry out its transfer payment programs or when theservices/goods are received. Transfer payments and significant operating contractual obligations that canbe reasonably estimated are summarized as follows:
(in thousands of dollars) 2014 2015 2016 20172018 andthereafter Total
Transfer payments 170,933 62,145 5,729 - - 238,807Operating contracts 23,137 7,183 670 266 52 31,308Total 194,070 69,328 6,399 266 52 270,115
Transfer payments contractual obligations to CFHT as shown in Note 14c have been excluded from thefuture contractual obligations.
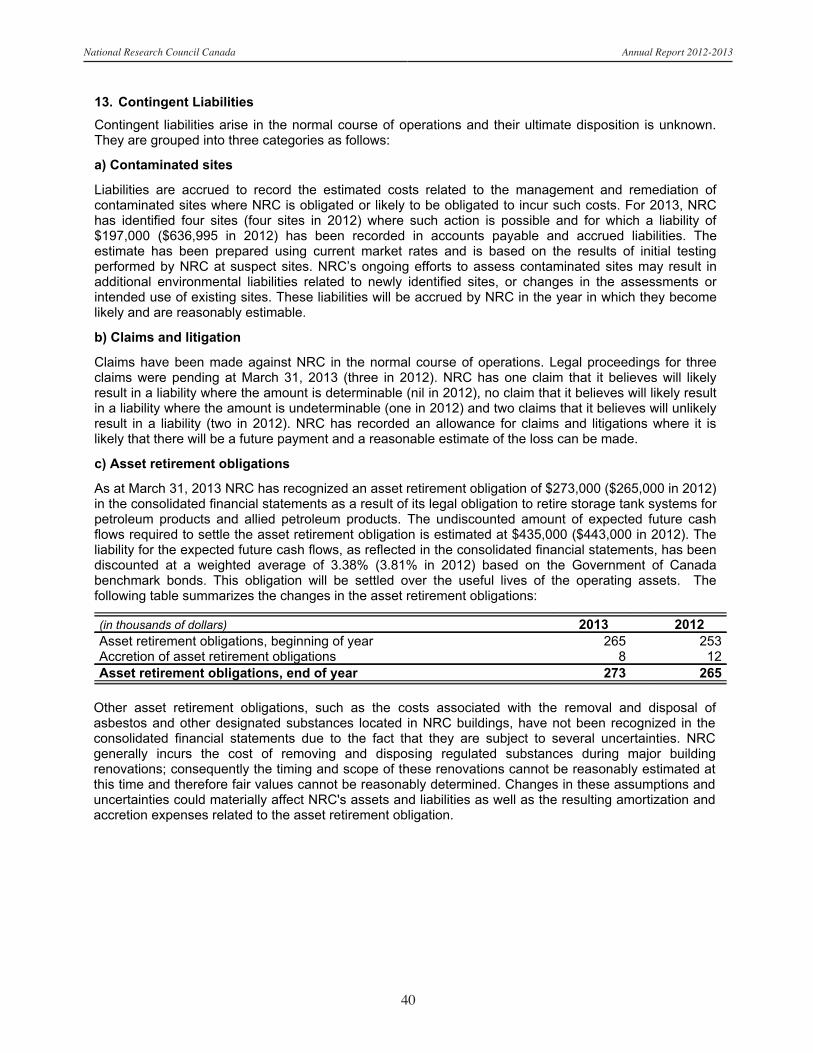
40
National Research Council Canada Annual Report 2012-2013
13. Contingent LiabilitiesContingent liabilities arise in the normal course of operations and their ultimate disposition is unknown.They are grouped into three categories as follows:
a) Contaminated sites
Liabilities are accrued to record the estimated costs related to the management and remediation ofcontaminated sites where NRC is obligated or likely to be obligated to incur such costs. For 2013, NRChas identified four sites (four sites in 2012) where such action is possible and for which a liability of$197,000 ($636,995 in 2012) has been recorded in accounts payable and accrued liabilities. Theestimate has been prepared using current market rates and is based on the results of initial testingperformed by NRC at suspect sites. NRC’s ongoing efforts to assess contaminated sites may result inadditional environmental liabilities related to newly identified sites, or changes in the assessments orintended use of existing sites. These liabilities will be accrued by NRC in the year in which they becomelikely and are reasonably estimable.
b) Claims and litigation
Claims have been made against NRC in the normal course of operations. Legal proceedings for threeclaims were pending at March 31, 2013 (three in 2012). NRC has one claim that it believes will likelyresult in a liability where the amount is determinable (nil in 2012), no claim that it believes will likely resultin a liability where the amount is undeterminable (one in 2012) and two claims that it believes will unlikelyresult in a liability (two in 2012). NRC has recorded an allowance for claims and litigations where it islikely that there will be a future payment and a reasonable estimate of the loss can be made.
c) Asset retirement obligations
As at March 31, 2013 NRC has recognized an asset retirement obligation of $273,000 ($265,000 in 2012)in the consolidated financial statements as a result of its legal obligation to retire storage tank systems forpetroleum products and allied petroleum products. The undiscounted amount of expected future cashflows required to settle the asset retirement obligation is estimated at $435,000 ($443,000 in 2012). Theliability for the expected future cash flows, as reflected in the consolidated financial statements, has beendiscounted at a weighted average of 3.38% (3.81% in 2012) based on the Government of Canadabenchmark bonds. This obligation will be settled over the useful lives of the operating assets. Thefollowing table summarizes the changes in the asset retirement obligations:
(in thousands of dollars) 2013 2012Asset retirement obligations, beginning of year 265 253Accretion of asset retirement obligations 8 12Asset retirement obligations, end of year 273 265
Other asset retirement obligations, such as the costs associated with the removal and disposal ofasbestos and other designated substances located in NRC buildings, have not been recognized in theconsolidated financial statements due to the fact that they are subject to several uncertainties. NRCgenerally incurs the cost of removing and disposing regulated substances during major buildingrenovations; consequently the timing and scope of these renovations cannot be reasonably estimated atthis time and therefore fair values cannot be reasonably determined. Changes in these assumptions anduncertainties could materially affect NRC's assets and liabilities as well as the resulting amortization andaccretion expenses related to the asset retirement obligation.

41
National Research Council Canada Annual Report 2012-2013
14. Related Party TransactionsNRC is related as a result of common ownership to all Government departments, agencies, and Crowncorporations. NRC enters into transactions with these entities in the normal course of business and onnormal trade terms. During the year, NRC received common services which were obtained withoutcharge from other government departments as disclosed below.
a) Common services provided without charge by other government departments and agencies
During the year, NRC received services without charge from other government departments andagencies. These services have been recognized in NRC’s Consolidated Statement of Operations andDepartmental Net Financial Position as follows:
(in thousands of dollars) 2013 2012Employer’s contributions to the health and dental insurance plans provided
by Treasury Board 29,317 30,267Email, data centre and network services and the email, data centre and
network support unit provided by Shared Services Canada 16,146 8,667Audit of NRC's consolidated financial statements provided by the Office of
the Auditor General of Canada - 850Legal services provided by Justice Canada 600 483Workers’ compensation benefits provided by Human Resources and Skills
Development Canada 259 273Accommodation provided by Public Works and Government Services
Canada 176 170Total 46,498 40,710
The Government has centralized some of its administrative activities for efficiency, cost-effectivenesspurposes and economic delivery of programs to the public. As a result, the Government uses centralagencies, and common service organizations so that one department performs services for all otherdepartments and agencies without charge. The costs of these services, such as the payroll and chequeissuance services provided by Public Works and Government Services Canada are not included in NRC'sConsolidated Statement of Operations and Departmental Net Financial Position.
The activities related to the email, data centre and network services unit and the email, data centre andnetwork support unit were transferred to Shared Services Canada on November 15, 2011. The servicesprovided after the transfer date are recognized without charge.
b) Other transactions with related parties
(in thousands of dollars) 2013 2012
Accounts receivable from other government departments and agencies 4,516 5,172Accounts payable to other government departments and agencies 16,844 10,321Expenses – Other government departments and agencies 67,352 75,995Revenues – Other government departments and agencies 54,297 64,537
Expenses and revenues disclosed in (b) exclude common services provided without charge, which arealready disclosed in (a).

42
National Research Council Canada Annual Report 2012-2013
c) Canada-France-Hawaii Telescope Corporation
NRC has a related party relationship with the following non-federal government entity:
NRC was a founding member of the Canada-France-Hawaii Telescope Corporation (CFHT), a tax-exempt, not-for-profit organization established under Hawaii State law to design, construct, and operate alarge optical telescope near the summit of Mauna Kea, Hawaii, USA, along with laboratories, equipment,and associated installations. The Corporation was established in 1974 by a Tripartite Agreement amongthe NRC, the Centre National de la Recherche Scientifique of France, and the University of Hawaii. NRCmakes annual contributions to fund its 42.5% share of the cost of operations of the telescope andreceives no direct benefit in return. However, as a result of NRC's contributions, Canada receives accessto telescope observation hours for Canadian astronomers. As a founding member, NRC can appoint fourof the ten members of the board of directors. The NRC relationship with CFHT is considered agovernment partnership for accounting purposes and CFHT results are proportionally consolidated inthese statements. In 2012-13, NRC contributed $3.1 million to CFHT ($3.5 million in 2011-12). Thesecontributions are eliminated upon consolidation. CFHT's condensed financial information for the periodending December 31 is as follows:
(in thousands of dollars) December31, 2012
December31, 2011
Total assets 17,980 19,047Total liabilities 1,598 1,566Total unrestricted net assets 16,382 17,481Total revenues 8,569 8,576Total expenses 9,495 9,619Net operating results (926) (1,043)
NRC's future contractual obligations to CFHT are not included in the transfer payment contractualobligations (Note 12) and are as follows:
(in thousands of dollars) 2014 2015 2016 20172018 andthereafter Total
CFHT 3,261 3,342 3,426 2,503 - 12,532

43
National Research Council Canada Annual Report 2012-2013
15. Transfers from/to other government departmentsIn 2012-13, NRC paid accounts payable on behalf of Shared Services Canada for a total amount of$1,053,000. In addition, NRC received machinery, equipment and furniture and informatics equipmentfrom various government departments. NRC also transferred machinery, equipment and furniture to agovernment department. The transactions can be summarized as follows:
(in thousands of dollars) 2013 2012
Net tangible capital assets transfers (525) 1,518Payment of accounts payable on behalf of Shared Services Canada 1,053 -Transfer of accounts payable and accrued liabilities - (3,582)Total 528 (2,064)
16. Segmented Information Presentation by segment is based on NRC's program alignment architecture (PAA). NRC allocatestransactions over the PAA in accordance with stewardship principles, based on the Portfolios, Branch orIRAP (P/B/I) that is responsible for managing the resource.
The presentation by segment is based on the same accounting policies as described in the Summary ofsignificant accounting policies in Note 2. The following table presents the expenses incurred and revenuesgenerated for the main program activities, by major object of expenses and by major type of revenues.The segment results for the period are as follows:
(in thousands of dollars)
ManufacturingTechnologies
ICT and Emerging
Technologies
IndustrialResearchAssistance
Health and Life Sciences Technologies
Energy and EnvironmentalTechnologies
NationalScience and Technology
Infrastructure
Scientific,Technical
and Medical Information
InternalServices
2013Total
2012Total
Transfer paymentsGrants and contributions - - 195,120 - - 52,144 - 398 247,662 143,607
Total transfer payments - - 195,120 - - 52,144 - 398 247,662 143,607
Operating expensesSalaries and employee benefits 101,066 42,089 44,907 65,425 30,859 34,475 10,033 99,693 428,547 455,491 Utilities, material and supplies 10,018 6,851 323 8,335 2,284 4,172 9,275 30,604 71,862 78,081 Amortization of tangible capital assets 11,657 7,576 49 8,532 4,215 3,753 390 28,465 64,637 66,013 Professional services 6,365 6,893 3,777 2,410 2,188 3,837 1,130 24,448 51,048 41,680 Repair and maintenance 2,544 1,189 242 1,792 441 451 79 8,127 14,865 17,426 Payment in lieu of taxes - - - - - - - 14,485 14,485 15,062 Transportation and communication 3,329 1,007 2,332 1,043 924 2,292 215 1,768 12,910 18,628 Rentals 351 435 1,462 52 81 27 - 2,005 4,413 4,574 Information 185 21 88 72 11 44 3 1,332 1,756 1,976 Awards 14 77 1 12 4 12 2 1,496 1,618 2,295 Costs of goods sold 237 - - - - 411 - 6 654 2,495 Other (24) (55) (13) 161 18 222 (14) 133 428 155 Loss on disposal of tangible capital assets 147 40 - (7) - 9 - (63) 126 1,435 Bad debts - - - - - - - 14 14 (183)Expenses incurred on behalf of Government - - - - - - - - - (1,092)
Total operating expenses 135,889 66,123 53,168 87,827 41,025 49,705 21,113 212,513 667,363 704,036
Total expenses 135,889 66,123 248,288 87,827 41,025 101,849 21,113 212,911 915,025 847,643
RevenuesResearch services 19,486 5,980 528 15,766 6,026 2,495 - 160 50,441 42,284 Technical services 45,283 4,806 - 2,602 13,163 4,615 4,487 4,574 79,530 104,429 Intellectual property, royalties and fees 22 (320) - (543) (65) (27) - 9,388 8,455 8,572 Sales of goods and information products 3,169 - - - (4) 1,223 - 34 4,422 5,171 Rentals 422 (40) - 12 - - - 5,821 6,215 4,987 Grants and contributions - 38 - - - - - 2,846 2,884 2,134 Lease inducement revenue - - - - - - - 2,548 2,548 2,548 Other (2) (33) (9) 59 - 387 (46) 293 649 2,243 Revenues earned on behalf of Government - - - - - - - 128 128 (1,455)
Total revenues 68,380 10,431 519 17,896 19,120 8,693 4,441 25,792 155,272 170,913 Net cost of operations before government funding and transfers 67,509 55,692 247,769 69,931 21,905 93,156 16,672 187,119 759,753 676,730

44
National Research Council Canada Annual Report 2012-2013
17. Financial InstrumentsNRC’s financial instruments consist of accounts receivable and advances, investments and accountspayable and accrued liabilities. Unless otherwise noted, it is management’s opinion that NRC is notexposed to significant interest, currency or credit risk arising from these financial instruments. Unlessotherwise disclosed in these consolidated financial statements, management estimates that the carryingvalues of the financial instruments approximate their fair value due to their impending maturity.
18. Comparative InformationComparative figures have been reclassified to conform to the current year's presentation.

45
National Research Council Canada Annual Report 2012-2013
National Research Council Canada
Annex to the Statement of Management Responsibility including Internal Control over
Financial Reporting (Unaudited)
For the year ended March 31, 2013

46
National Research Council Canada Annual Report 2012-2013
Unaudited 1
1. Introduction
This document provides summary information on the measures taken by NRC to maintain an effective system of internal control over financial reporting (ICFR) including information on internal control management and assessment results and related action plans.
Detailed information on NRC’s authority, mandate and program activities can be found in the Departmental Performance Report and Report on Plans and Priorities.
2. Departmental system of internal control over financial reporting
2.1 Internal Control Management
NRC has a well established governance and accountability structure to support departmental assessment efforts and oversight of its system of internal control. A departmental internal control management framework, approved by the Deputy Head, is in place which includes:
Organizational accountability structures as they relate to internal control management to support sound financial management including roles and responsibilities for senior managers in their areas of responsibility for control management;
Values and ethics;
Ongoing communication and training on statutory requirements, policies, and procedures for sound financial management and control; and
Monitoring and regular updates at least semi-annually on internal control management plus assessment results and action plan to the Deputy Head and departmental senior management, and the Departmental Audit Committee (DAC).
The DAC provides advice to the Deputy Head on the adequacy and functioning of NRC’s risk management, control and governance frameworks and processes.
2.2 Service Arrangements relevant to financial statements
NRC relies on other organizations to process certain transactions that are recorded in its financial statements as follows:
Common Arrangements Public Works and Government Services Canada (PWGSC) centrally administers the
payment of salaries and the procurement of goods and services as per NRC’s Delegation of Authority and, provides some accommodations on behalf of NRC;
Treasury Board Secretariat (TBS) provides NRC with information used to calculate accruals and allowances, such as the accrued severance liability;
The Department of Justice provides legal services to NRC; and
Shared Services Canada (SSC) provides IT infrastructure services to NRC in the areas of data centre and network services. The scope and responsibilities are addressed in the interdepartmental arrangement between SSC and NRC.

47
National Research Council Canada Annual Report 2012-2013
Unaudited 2
Shared Services Canada (SSC) provides IT infrastructure services to NRC in the areas of data centre and network services. The scope and responsibilities are addressed in the interdepartmental arrangement between SSC and NRC.
3. Departmental assessment results during fiscal year 2012-2013
The key findings and significant adjustments required from the current year’s assessment activities are summarized below.
3.1 New or significantly amended key controls
In the current year, NRC conducted design and operating effectiveness testing on the key controls of its new Delegated Authority Application (DAA). No significant adjustments were required for the new key controls of the DAA.
NRC’s adoption of an industry-focused program-based approach, effective April 1, 2012, has represented a major shift for the organization. This shift brought, amongst other things, significant changes to the revenue business processes. NRC therefore limited its assessment to design effectiveness in 2012-2013 for some revenue business processes.
3.2 Ongoing monitoring program
As part of its rotational ongoing monitoring (OGM) plan, NRC completed its assessment of Entity Level Controls (ELC), Information Technology General Controls (ITGC) and the financial controls within the procurement to payment, transfer payment, capital asset, inventory and payroll business processes.
For the most part, the key controls tested performed as intended, with remediation required as follows:
Consistent with last fiscal year’s assessment, the application of established Section 34 account verification procedures was not applied consistently for transfer payments. Standard operational procedures were further clarified for contribution agreements and procedures were communicated to stakeholders during the year;
Consistent with last fiscal year’s assessment, improvement opportunities with regard to some key financial controls for capital asset processes were identified. A management action plan was developed by the process owner addressing all of the recommendations;
Certain control issues were found in the inventory for internal consumption area related to segregation of duties, expenditure initiation and approval of adjustments/write-offs. A management action plan was developed by the process owner addressing the recommendations; and
Significant control issues were found in the payroll area related to segregation of duties. A management action plan was developed by the process owner addressing the recommendations.

48
National Research Council Canada Annual Report 2012-2013
Unaudited 3
Previous year’s issues remediation progress
NRC has conducted or is planning the following work to address the adjustments identified during the previous years’ assessments:
Petty cash: All petty cash advances were eliminated at NRC in 2012-2013 (completed);
Capital assets: A review of roles and responsibilities for the monitoring requirements of capital assets was performed. NRC centralized most processes to ensure proper controls are in place (in progress);
Payroll: Implementation of remediation actions to address gaps between the NRC and the government of Canada payroll administration framework (deferred to future years due to low risk level);
Revenue: The revenue control framework was streamlined, strengthened and standardized. A continuous review of revenue files was implemented (completed);
ITGCs: Control of access to IT programs and data, IT program changes, backup and recovery of data, and improved audit trail relative to various IT controls (completed);
Master data: Strengthening and standardization of the processes and procedures to maintain master vendor and customer records (in progress); and
New DAA eliminated most of the unidentified conflicting roles in the financial system (in progress).
4. Departmental action plan
4.1 Progress during fiscal year 2012-2013
NRC continued to conduct its ongoing monitoring according to the previous fiscal year’s rotation plan as follows:
Previous year’s rotational ongoing monitoring plan for current year
Status
ELCs, ITGCs, procurement to payment
Completed as planned and no remedial actions required
Transfer payments, capital assets, inventory, payroll
Completed as planned and remedial actions communicated to process owners with some remedial actions complete and some underway
Revenues, receivables and receipts
Completed design effectiveness re-assessment of some processes with some operating effectiveness testing delayed due to the redesign of processes

49
National Research Council Canada Annual Report 2012-2013
Unaudited 4
In 2012-2013, NRC conducted the following work in addition to the progress made in ongoing monitoring:
Tested design and operating effectiveness of a new DAA.
4.2 Action plan for the next fiscal year and subsequent years
NRC’s rotational ongoing monitoring plan over the next three years, based on an annual validation of the high risk processes and controls and related adjustments to the ongoing monitoring plan as required, is shown in the following table:
Rotational Ongoing Monitoring Plan for Internal Control over Financial Reporting
Key control areas Frequency
Operating Effectiveness Testing Rotation
2013-2014 2014-2015 2015-2016
ELCs Every 2 years √
ITGCs under departmental management Every 2 years √
Procurement to payment Annually √ √ √
Transfer Payments Annually √ √ √
Capital assets Annually √ √ √
Inventory Every 3 years √
Payroll administration Every 2 years √ √
Revenues, receivables and receipts Annually √ √ √
Financial closing and reporting Every 3 years √
Master data – customers / vendors Every 3 years √
In addition to the ongoing monitoring rotational plan, NRC also plans to review remediation actions completed in 2013-2014 in all areas in which issues were noted in section 3. NRC also plans to continue remediation of adjustments identified during its assessments. When

50
National Research Council Canada Annual Report 2012-2013
Unaudited 5
new business processes are introduced, or significant internal control process changes occur, NRC will proactively identify, document and test key controls based on associated risks. The results will be incorporated into the assessment plan and the ongoing monitoring program.


![DP83848x PHYTER Mini / LS Single Port 10/100 MB/s Ethernet … · 2021. 2. 16. · MHz for 100 Mb/s mode, 2.5 MHz for 10 Mb/s mode). RXD[3:0] signals contain valid data when RX_DV](https://img.pdfslide.us/doc/110x75/61061ffcba91955d9f790680/dp83848x-phyter-mini-ls-single-port-10100-mbs-ethernet-2021-2-16-mhz-for.jpg)


![Neuromonitoring [PDF, 2.5 MB]](https://img.pdfslide.us/doc/110x75/586f5f371a28abf0508bd912/neuromonitoring-pdf-25-mb.jpg)