Embed Size (px)
Citation preview
City of Oakland Special City Council Meeting
April 30, 2013

Table of Contents
I. Mayor’s Priorities and Vision
II. Proposed FY 2013-15 Policy Budget Summary
III. Expenditure Reduction Restoration and Policy Tradeoffs
IV. Long-term Outlook
V. Budget Process and Timeline
Information presented is to the best of our knowledge as of April 2013 and subject to change.
City of Oakland - Special City Council Meeting - April 30, 2013 2
Proposed a “Fair Share” budget
Oakland is on the Rise
Significant Hard Work is Still Ahead
3
Proposed FY 2013-2015 Policy Budget
City of Oakland - Special City Council Meeting - April 30, 2013

Mayor’s Priorities and Vision
Invest in public safety;
Create jobs and promote economic development;
Focus on job-training services so that Oaklanders are a competitive and thriving workforce;
Build and restore our infrastructure and the physical environment of Oakland;
Achieve long-term fiscal stability for the City; and,
Foster Oakland youth and care for our most vulnerable populations.
4 City of Oakland - Special City Council Meeting - April 30, 2013
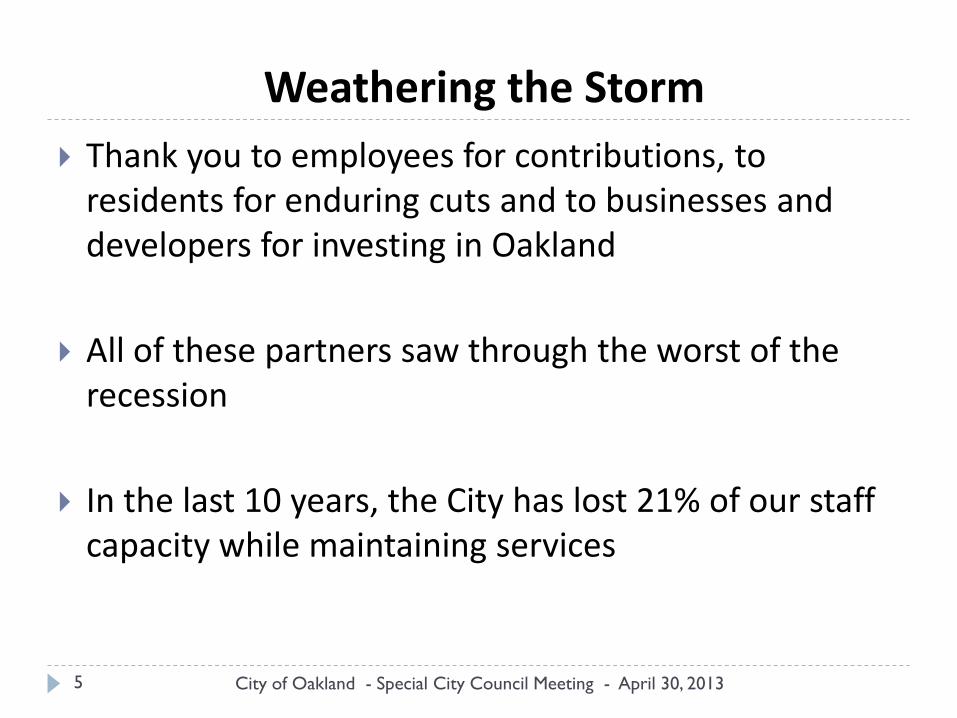
Weathering the Storm
Thank you to employees for contributions, to residents for enduring cuts and to businesses and developers for investing in Oakland
All of these partners saw through the worst of the recession
In the last 10 years, the City has lost 21% of our staff capacity while maintaining services
5 City of Oakland - Special City Council Meeting - April 30, 2013

______ (1) Projections
(2) Covered Payroll is based on FY 2014-2015.
(3) Net of Port’s payment (approximately 0.489%)
(4) Fire rate changed from 29.064% to 26.479% on 8/31/12
(5) Police rate change from 29.064% to 30.479% on 8/31/12
(6) Computed on baseline payroll, projected as of February 1, 2013
45.6% Increase
12.6% Increase
$0
$20,000,000
$40,000,000
$60,000,000
$80,000,000
$100,000,000
$120,000,000
Total Annual Cal-PERS Cost
Total AnnualCal-PERS Cost
$67,294,160
$97,949,881
$390,000,000$400,000,000$410,000,000$420,000,000$430,000,000$440,000,000$450,000,000$460,000,000$470,000,000$480,000,000
Revenue
Revenue$422,060,109
$475,368,949

Proposed FY 2013-15 Policy Budget Summary
7 City of Oakland - Special City Council Meeting - April 30, 2013
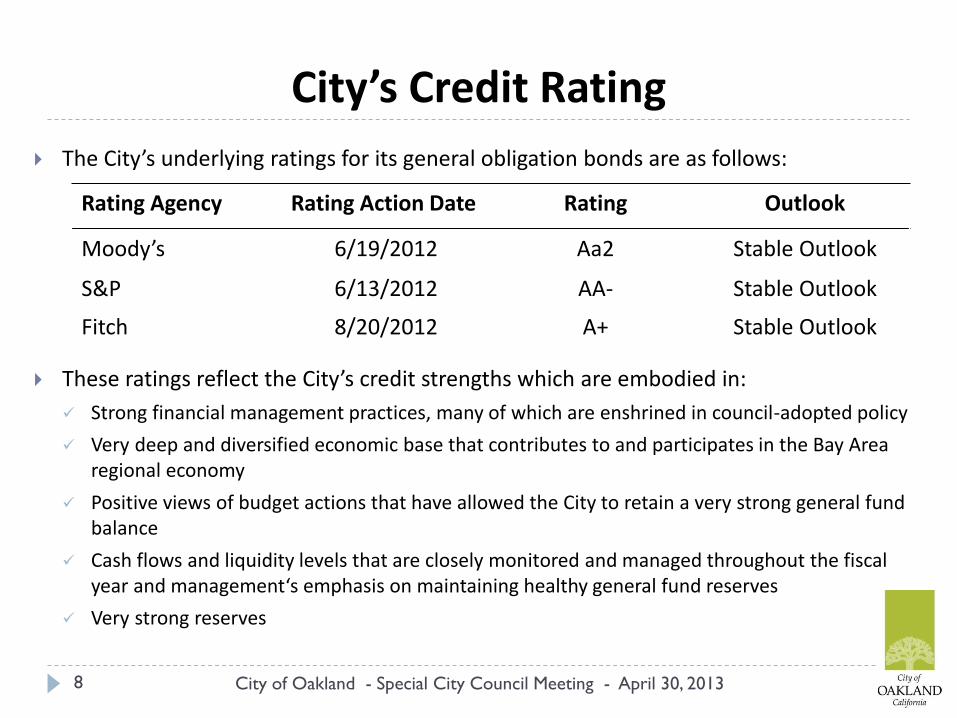
City’s Credit Rating
The City’s underlying ratings for its general obligation bonds are as follows:
These ratings reflect the City’s credit strengths which are embodied in:
Strong financial management practices, many of which are enshrined in council-adopted policy
Very deep and diversified economic base that contributes to and participates in the Bay Area regional economy
Positive views of budget actions that have allowed the City to retain a very strong general fund balance
Cash flows and liquidity levels that are closely monitored and managed throughout the fiscal year and management‘s emphasis on maintaining healthy general fund reserves
Very strong reserves
8
Rating Agency Rating Action Date Rating Outlook
Moody’s 6/19/2012 Aa2 Stable Outlook
S&P 6/13/2012 AA- Stable Outlook
Fitch 8/20/2012 A+ Stable Outlook
City of Oakland - Special City Council Meeting - April 30, 2013

9
Audited FY 2011-12 General Fund Balance FY 2012-13 Undesignated Fund Balance Update
June 30, 2012 April 29, 2013
Un-Audited Audited & Budgeted
Gross ending Fund Balance $ 82,900,000 $ 84,600,000
FY 2012-2013 Balancing Measures: Early Recog. RPTT & Property Sales Used $ (14,282,521) $ (12,882,521)
FY 2012-2013 Carry Forward & Encumbrance $ (5,100,000) $ (5,100,000)
Net Available Ending Fund Balance: $ 63,517,479 $ 66,617,479
7.5% mandated reserved level (designated fund balance) $ (30,200,000) $ (30,200,000)
July 1, 2012 Beginning Fund Balance: $ 33,317,479 $ 36,417,479
Council approved action since July 2012-April 2013 & Recognized Revenue ($2.48M) $ - $ (3,627,987)
General Fund Balance w/Known Council Action: $ 33,317,479 $ 32,789,492
REQUIRED & PROPOSED MEASURES:
Reverse $12.88 M transfer from the fund balance in FY 2012-13 $ 12,882,521
Projected revenue growth by June 30, 2013 (Q2 report) $ 14,120,000
Reverse land sale subject to state review $ (32,500,000)
Litigation settlement $ (4,300,000)
Police Overtime in FY 2012-13 (per 2nd Q report) $ (7,700,000)
Increase Reserved Amount due to higher FY 2013-14 GPF Proposed Budget (7.5% of $430M) $ (2,084,743)
Used for FY 2013-15 Budget Balance Measures (updated 4/14/2013) $ (10,810,930)
Subsidize Head Start Partial Cuts (34 families, Eastmont Center) $ (300,000)
Compliance Director's Staff and Expenses (Court Order 4/17/13) (thru Dec. 2014) $ (900,000)
Compliance Director’s Remedial Plan & Budget (Court Order Doc #885, 12/12/12, p.7) TBD
Projected balance as of June 30, 2013 $ 1,196,340
Notes:
1 Some fund balance will be required for NSA/Compliance Director-Court Order ($TBD)
2 Fiscal impact of additional State actions regarding DOF/Controller's Office review ($TBD), additional ROPS review may have an additional fiscal impact ($TBD). There will be revenue associated with RPTT (est $7.5M).
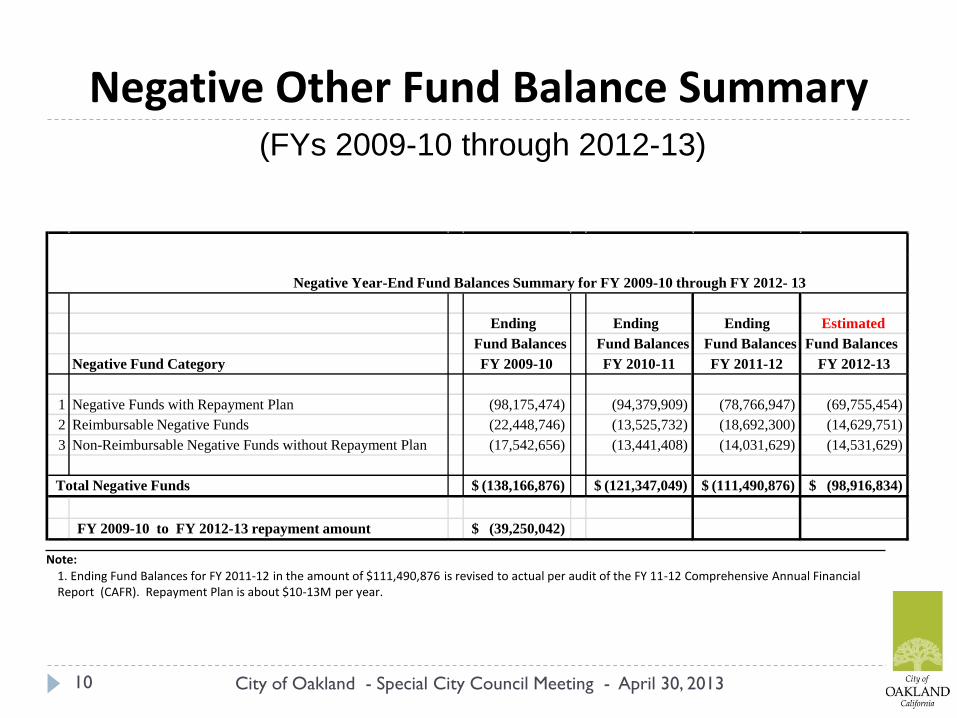
Negative Other Fund Balance Summary
10
(FYs 2009-10 through 2012-13)
Ending Ending Ending Estimated
Fund Balances Fund Balances Fund Balances Fund Balances
Negative Fund Category FY 2009-10 FY 2010-11 FY 2011-12 FY 2012-13
1 Negative Funds with Repayment Plan (98,175,474) (94,379,909) (78,766,947) (69,755,454)
2 Reimbursable Negative Funds (22,448,746) (13,525,732) (18,692,300) (14,629,751)
3 Non-Reimbursable Negative Funds without Repayment Plan (17,542,656) (13,441,408) (14,031,629) (14,531,629)
(138,166,876) $ (121,347,049) $ (111,490,876) $ (98,916,834) $
FY 2009-10 to FY 2012-13 repayment amount (39,250,042) $
Total Negative Funds
Negative Year-End Fund Balances Summary for FY 2009-10 through FY 2012- 13
Note: 1. Ending Fund Balances for FY 2011-12 in the amount of $111,490,876 is revised to actual per audit of the FY 11-12 Comprehensive Annual Financial Report (CAFR). Repayment Plan is about $10-13M per year.
City of Oakland - Special City Council Meeting - April 30, 2013

Unfunded & Long-Term Liabilities Unfunded
Amount
Descriptions
$743K Oakland Municipal Employees Retirement System (OMERS), closed retirement system,
unfunded balance as of June 30, 2011
$743M California Public Employees Retirement System (Cal PERS), 75% funded. Unfunded
balance as of June 30, 2011
$216M Police and Fire Retirement System (PFRS), closed retirement system, unfunded balance
as of June 30, 2012 was $426M; issued a bond in July 2012, the current unfunded
balance is $216M, will start the payment in FY 2017-18, $24.24M
$520M Other Post-Employment Benefits (OPEB) has the unfunded actuarial accrued liability
(UAAL) of $520M as of June 30, 2011
$29.5M Accrued leaves are funded at 28.7% level, which leaves approximately $29.5M unfunded
as of June 30, 2012 (audited)
$111M Of the 173 funds, 54 has negative fund balance as of June 30, 2012 (audited). Of which,
$85M is in the repayment schedule, $26M is not.
11
GASB Statement 45 requires government employers to measure and report other post-employment benefits (other than pension)
City of Oakland - Special City Council Meeting - April 30, 2013

Proposed FY 2013-15 Policy Budget (in millions)
FY 2013-14 FY 2014-15
Revenues Expenditures Revenues Expenditures
General Fund $ 430.16M $ 430.16M $ $457.40M $ 457.40M
All Funds $ 1,052.69M $ 1,039.01M $ 1,071.70M $ 1,060.58 M
FTEs 3,833 FTEs 3,875.76 FTEs
Note: The revenue in all-funds exceed the all-funds expenditures due to Council’s
policy to amortize the repayment to negative funds.
12 City of Oakland - Special City Council Meeting - April 30, 2013

13 City of Oakland - Special City Council Meeting - April 30, 2013
Historical & Proposed Equivalent Staff Level 4,633 FTEs in FY 02-03 an all time low of 3,681 FTEs
3952 3993 4002
4227 4225
4564 4633
4248 4266 4325 4325
4401
4288
4124
3950
3755
3681
3834 3876
3000
3200
3400
3600
3800
4000
4200
4400
4600
4800
FY 1996-97FY 1997-98FY 1998-99FY 1999-00FY 2001-02FY 2002-03
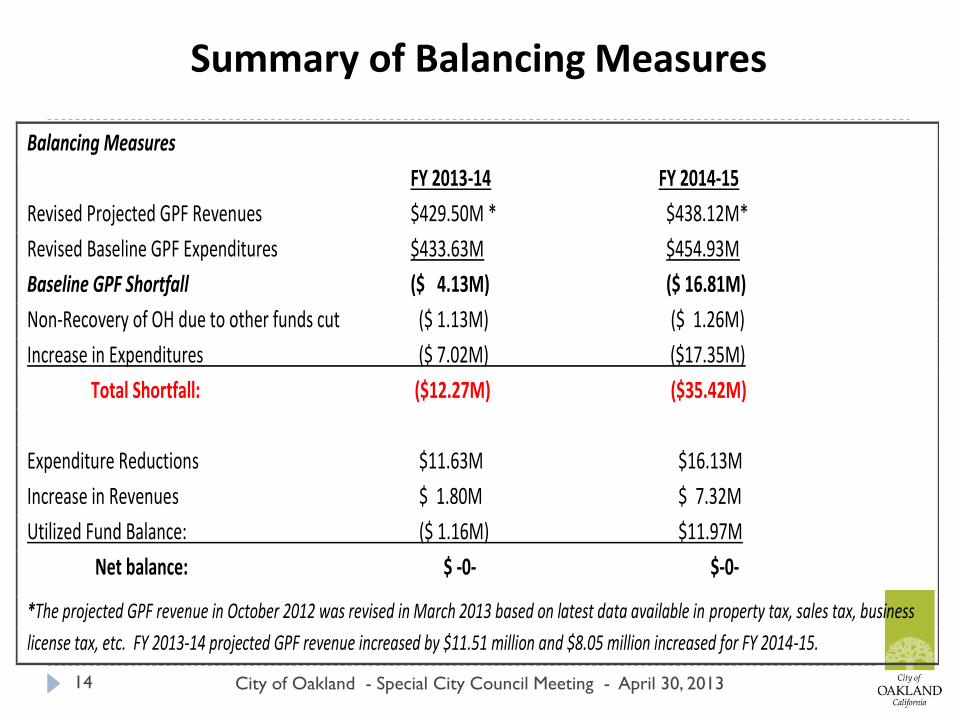
Summary of Balancing Measures
14 City of Oakland - Special City Council Meeting - April 30, 2013
Balancing Measures
FY 2013-14 FY 2014-15
Revised Projected GPF Revenues $429.50M * $438.12M*
Revised Baseline GPF Expenditures $433.63M $454.93M
Baseline GPF Shortfall ($ 4.13M) ($ 16.81M)
Non-Recovery of OH due to other funds cut ($ 1.13M) ($ 1.26M)
Increase in Expenditures ($ 7.02M) ($17.35M)
Total Shortfall: ($12.27M) ($35.42M)
Expenditure Reductions $11.63M $16.13M
Increase in Revenues $ 1.80M $ 7.32M
Utilized Fund Balance: ($ 1.16M) $11.97M
Net balance: $ -0- $-0-
*The projected GPF revenue in October 2012 was revised in March 2013 based on latest data available in property tax, sales tax, business
license tax, etc. FY 2013-14 projected GPF revenue increased by $11.51 million and $8.05 million increased for FY 2014-15.
15
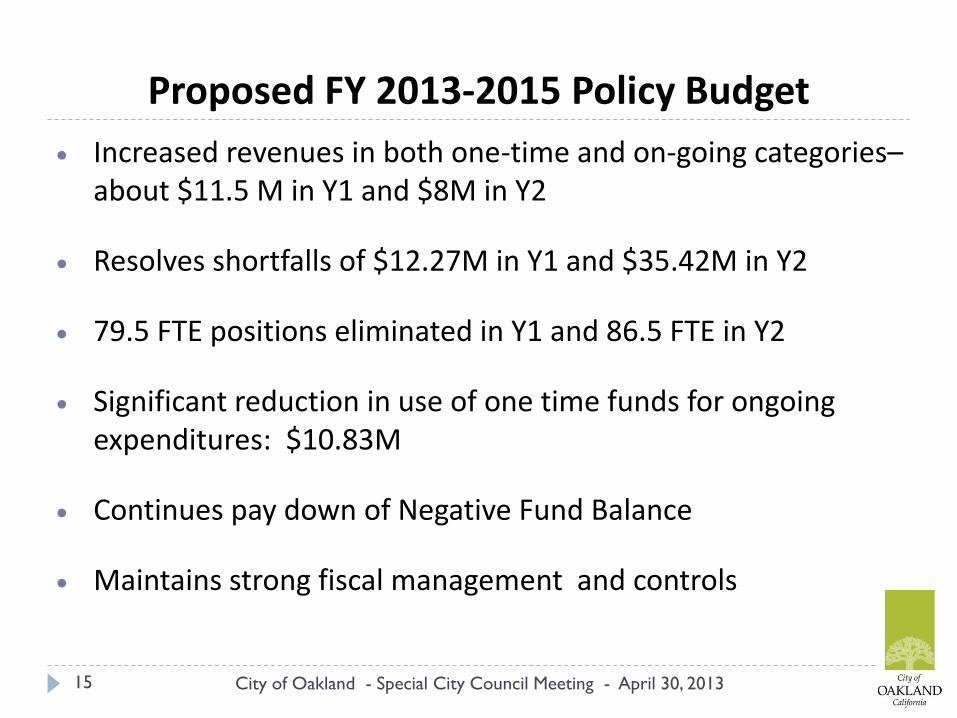
Increased revenues in both one-time and on-going categories– about $11.5 M in Y1 and $8M in Y2
Resolves shortfalls of $12.27M in Y1 and $35.42M in Y2
79.5 FTE positions eliminated in Y1 and 86.5 FTE in Y2
Significant reduction in use of one time funds for ongoing expenditures: $10.83M
Continues pay down of Negative Fund Balance
Maintains strong fiscal management and controls
Proposed FY 2013-2015 Policy Budget
City of Oakland - Special City Council Meeting - April 30, 2013
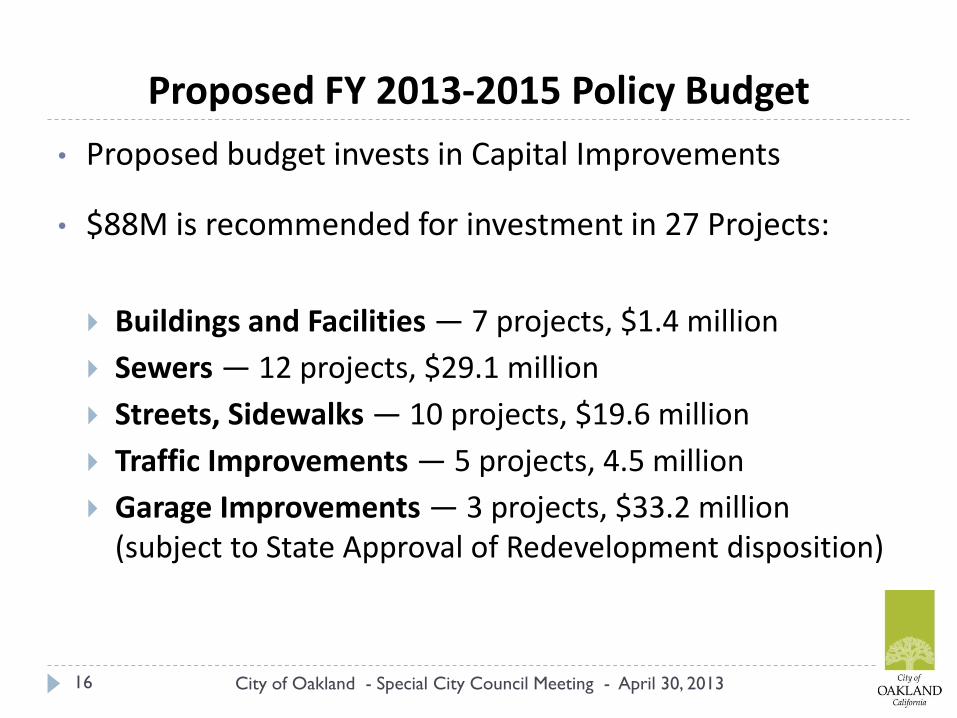
• Proposed budget invests in Capital Improvements
• $88M is recommended for investment in 27 Projects:
Buildings and Facilities — 7 projects, $1.4 million
Sewers — 12 projects, $29.1 million
Streets, Sidewalks — 10 projects, $19.6 million
Traffic Improvements — 5 projects, 4.5 million
Garage Improvements — 3 projects, $33.2 million (subject to State Approval of Redevelopment disposition)
16
Proposed FY 2013-2015 Policy Budget
City of Oakland - Special City Council Meeting - April 30, 2013

17
• Fiscal impact for State’s Review of RDA Dissolution and Reversal of Some Transactions (e.g., land sales, contracts, projects, etc.)
• ROPS denial of $3M+ staff/program expenditures & more reviews underway ($800K disputed with Department of Finance unresolved and unfunded)
• Cost of NSA mandates (May 1, Remedial Action Plan & Budget)
• CalPERS Rate Increase—50% increase over the next 6 years (FY 2015-2016)
• Medical Cost Increases @ 6% per year (conservative estimate)
• Modest economic recovery in the global, national and regional climate
• Sequestration • Head Start • Housing • Senior Programs
Budget Challenges Fiscal Uncertainties –Outside of Local Control
18
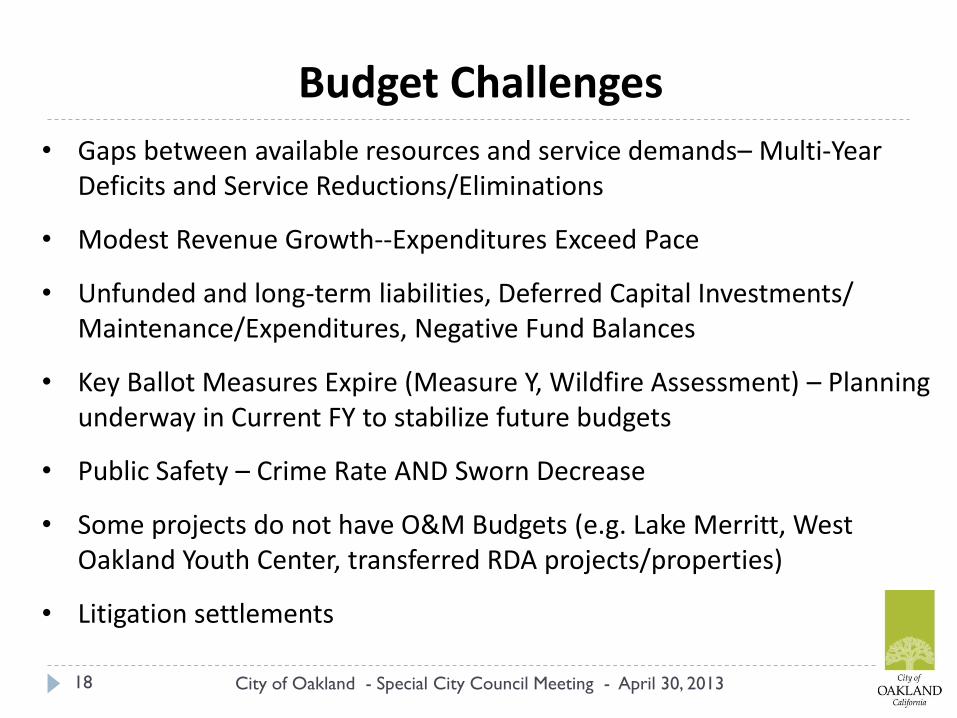
• Gaps between available resources and service demands– Multi-Year Deficits and Service Reductions/Eliminations
• Modest Revenue Growth--Expenditures Exceed Pace
• Unfunded and long-term liabilities, Deferred Capital Investments/ Maintenance/Expenditures, Negative Fund Balances
• Key Ballot Measures Expire (Measure Y, Wildfire Assessment) – Planning underway in Current FY to stabilize future budgets
• Public Safety – Crime Rate AND Sworn Decrease
• Some projects do not have O&M Budgets (e.g. Lake Merritt, West Oakland Youth Center, transferred RDA projects/properties)
• Litigation settlements
Budget Challenges
City of Oakland - Special City Council Meeting - April 30, 2013
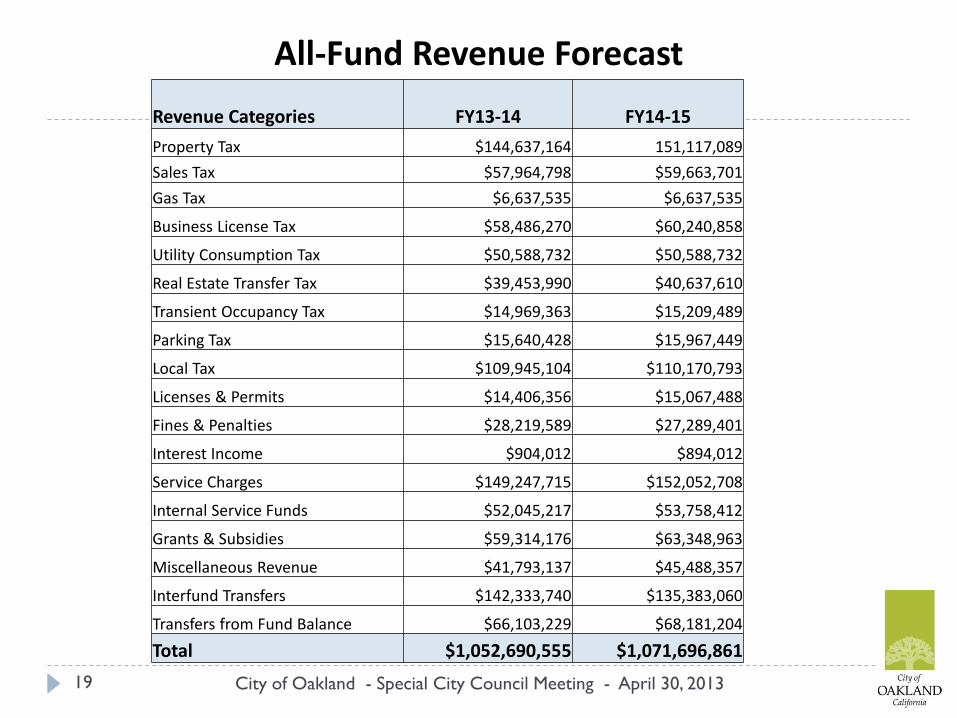
All-Fund Revenue Forecast
19 City of Oakland - Special City Council Meeting - April 30, 2013
Revenue Categories FY13-14 FY14-15
Property Tax $144,637,164 151,117,089
Sales Tax $57,964,798 $59,663,701
Gas Tax $6,637,535 $6,637,535
Business License Tax $58,486,270 $60,240,858
Utility Consumption Tax $50,588,732 $50,588,732
Real Estate Transfer Tax $39,453,990 $40,637,610
Transient Occupancy Tax $14,969,363 $15,209,489
Parking Tax $15,640,428 $15,967,449
Local Tax $109,945,104 $110,170,793
Licenses & Permits $14,406,356 $15,067,488
Fines & Penalties $28,219,589 $27,289,401
Interest Income $904,012 $894,012
Service Charges $149,247,715 $152,052,708
Internal Service Funds $52,045,217 $53,758,412
Grants & Subsidies $59,314,176 $63,348,963
Miscellaneous Revenue $41,793,137 $45,488,357
Interfund Transfers $142,333,740 $135,383,060
Transfers from Fund Balance $66,103,229 $68,181,204
Total $1,052,690,555 $1,071,696,861
20
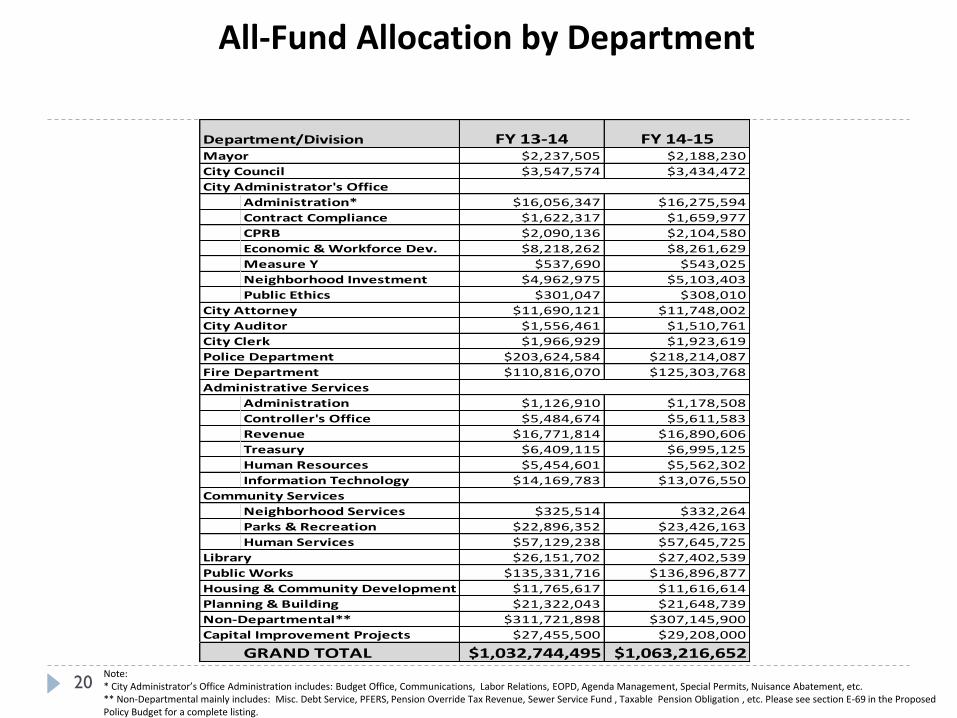
All-Fund Allocation by Department
Department/Division FY 13-14 FY 14-15$2,237,505 $2,188,230
$3,547,574 $3,434,472
Administration* $16,056,347 $16,275,594
Contract Compliance $1,622,317 $1,659,977
CPRB $2,090,136 $2,104,580
Economic & Workforce Dev. $8,218,262 $8,261,629
Measure Y $537,690 $543,025
Neighborhood Investment $4,962,975 $5,103,403
Public Ethics $301,047 $308,010
$11,690,121 $11,748,002
$1,556,461 $1,510,761
$1,966,929 $1,923,619
$203,624,584 $218,214,087
$110,816,070 $125,303,768
Administration $1,126,910 $1,178,508
Controller's Office $5,484,674 $5,611,583
Revenue $16,771,814 $16,890,606
Treasury $6,409,115 $6,995,125
Human Resources $5,454,601 $5,562,302
Information Technology $14,169,783 $13,076,550
Community Services
Neighborhood Services $325,514 $332,264
Parks & Recreation $22,896,352 $23,426,163
Human Services $57,129,238 $57,645,725
Library $26,151,702 $27,402,539
Public Works $135,331,716 $136,896,877
Housing & Community Development $11,765,617 $11,616,614
Planning & Building $21,322,043 $21,648,739
Non-Departmental** $311,721,898 $307,145,900
Capital Improvement Projects $27,455,500 $29,208,000
GRAND TOTAL $1,032,744,495 $1,063,216,652
Mayor
City Council
City Administrator's Office
City Attorney
City Auditor
City Clerk
Police Department
Fire Department
Administrative Services
Note: * City Administrator’s Office Administration includes: Budget Office, Communications, Labor Relations, EOPD, Agenda Management, Special Permits, Nuisance Abatement, etc. ** Non-Departmental mainly includes: Misc. Debt Service, PFERS, Pension Override Tax Revenue, Sewer Service Fund , Taxable Pension Obligation , etc. Please see section E-69 in the Proposed Policy Budget for a complete listing.

21
Fire $104.36 10.04%
Police $190.63 18.35%
Infrastructure $122.76 11.81%
Community Services $60.84 6.01%
Econ Devel, Housing
& Planning $45.00 4.45%
General Govt $239.37 23.04%
Debt Service $149.83 14.42%
Internal Service Funds $51.50 4.96%
Admin Services $4.13 0.40%
Kid's First $11.65 1.12%
Library $23.17 2.23%
CIP $27.46 2.64%
CAO Admin $8.33 0.80%
Other $74.73 7.19%
FY 2013-14 TOTAL ALL-FUNDS Allocation by Service Areas
($1,039.01 millions)
City of Oakland - Special City Council Meeting - April 30, 2013

All Funds Budgeted Expenditures by Category in FY 2013-14
22
Civilian Salaries
16%
Sworn Salaries
14%
Civilian Fringe
5%
Sworn Fringe
9%
Civilian Retirement
4%
Sworn Retirement
4%
Debt Service
9%
O&M 25%
Transfers & Overhead
10%
City of Oakland - Special City Council Meeting - April 30, 2013

General Purpose Fund Revenue Forecast
23 City of Oakland - Special City Council Meeting - April 30, 2013
Revenue Categories FY13-14 FY14-15
Property Tax $144,448,852 $150,928,777
Sales Tax $47,208,326 $48,624,575
Business License Tax $58,486,270 $60,240,858
Utility Consumption Tax $50,588,732 $50,588,732
Real Estate Transfer Tax $39,453,990 $40,637,610
Transient Occupancy Tax $12,006,316 $12,246,442
Parking Tax $8,531,028 $8,701,649
Licenses & Permits $1,386,726 $1,413,858
Fines & Penalties $23,498,995 $22,568,807
Interest Income $740,482 $740,482
Service Charges $43,662,137 $43,919,082
Miscellaneous Revenue $1,299,320 $4,824,320
Transfers from Fund Balance ($1,155,562) $11,966,492
Total $430,155,612 $457,401,684

General Purpose Fund by Department
24 City of Oakland - Special City Council Meeting - April 30, 2013
Department FY13-14 FY14-15
Administrative Services $28,132,845 $27,111,004
Capital Improvement Projects $252,000 $252,000
City Administrator Admin $5,695,142 $5,837,471
City Administrator Other $7,842,586 $7,952,907
City Attorney $4,406,790 $4,289,481
City Auditor $1,556,461 $1,510,761
City Clerk $1,917,527 $1,873,031
City Council $3,547,574 $3,434,472
Community Services $18,189,843 $18,540,187
Fire Department $95,480,831 $109,836,720
Library $9,060,667 $9,060,466
Mayor $2,055,907 $2,002,220
Non-Departmental $72,070,114 $71,742,445
Police Department $178,790,549 $192,780,324
Public Works $1,156,776 $1,178,195
Grand Total: $430,155,612 $457,401,684

25
Fire $95.48 22.20%
Police $178.79 41.56%
Library $9.06 2.11%
Admin Services $3.07 0.71%
General Govt $62.02 14.42%
Community Services $18.19 4.23%
Debt Service $35.95 8.36%
Kid's First $11.76 2.73%
Measure Y $2.18 0.51%
CAO Admin $6.00 1.39%
Economic Development $3.0
0.68%
Internal Service Funds $5.8
1.34%
Other $15.83 3.68%
FY 2013-14 TOTAL GENERAL FUND EXPENDITURES by Service Areas (in millions)
$430.15 million
City of Oakland - Special City Council Meeting - April 30, 2013

General Purpose Fund Expenditure by Category in FY 2013-14
26
Civilian Salaries
15%
Sworn Salaries
30%
Civilian Fringe
5%
Sworn Fringe
9%
Civilian Retirement
4%
Sworn Retirement
8%
Debt Service, Transfers & Overhead O&M
16%
City of Oakland - Special City Council Meeting - April 30, 2013
Service Impacts by Departments
27 City of Oakland - Special City Council Meeting - April 30, 2013

Fire Department
Position Changes • Add 1 FTE – Fire Protection Engineer • Freeze 1 FTE – Fire Prevention Inspector
Service Impacts Positive
• By adding additional staff, OFD seeks to streamline the permitting process by decreasing the fire plan review turnaround time.
• Complete two fire academies in FY 2013 – 2014 to fill 30 vacant firefighters positions and 10 fire paramedics positions. Twenty-four (24) of these positions funded through SAFER grant
Negative • Without restoration of Fire Prevention Inspector we will not be able to augment
services provided from the current level
FY 2013-14 FTEs FY 2014-15 FTEs
GPF $95,480,831 549.80 $109,836,720 550.80
Non-GPF $15,210,238 45.15 $15,339,100 45.15
Total: $110,691,069 594.95 $125,175,820 595.95
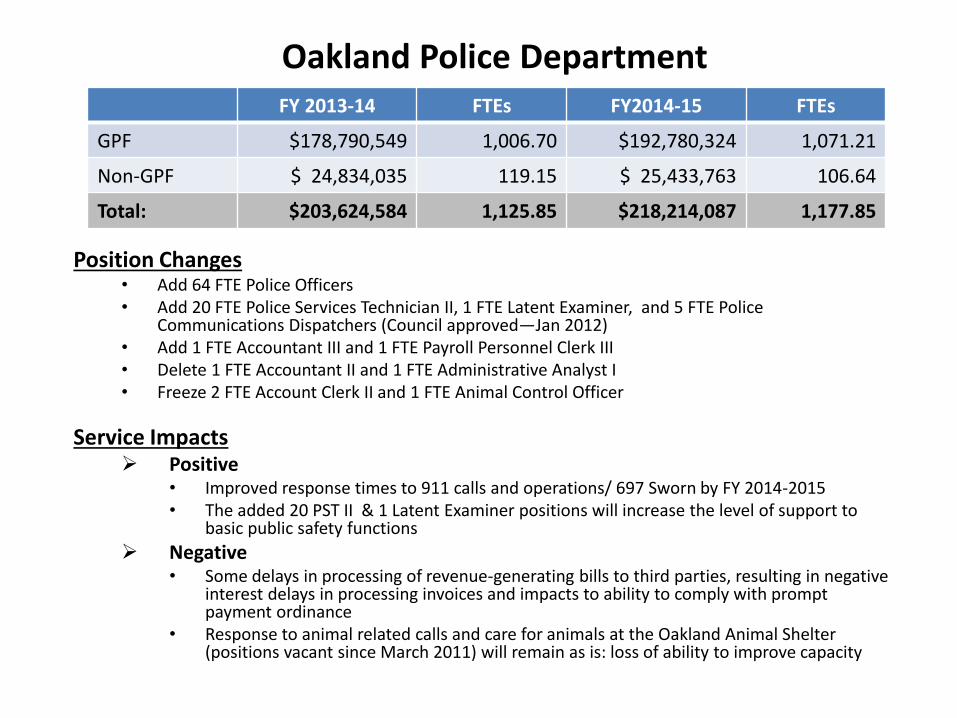
Oakland Police Department
Position Changes • Add 64 FTE Police Officers • Add 20 FTE Police Services Technician II, 1 FTE Latent Examiner, and 5 FTE Police
Communications Dispatchers (Council approved—Jan 2012) • Add 1 FTE Accountant III and 1 FTE Payroll Personnel Clerk III • Delete 1 FTE Accountant II and 1 FTE Administrative Analyst I • Freeze 2 FTE Account Clerk II and 1 FTE Animal Control Officer
Service Impacts Positive
• Improved response times to 911 calls and operations/ 697 Sworn by FY 2014-2015 • The added 20 PST II & 1 Latent Examiner positions will increase the level of support to
basic public safety functions
Negative • Some delays in processing of revenue-generating bills to third parties, resulting in negative
interest delays in processing invoices and impacts to ability to comply with prompt payment ordinance
• Response to animal related calls and care for animals at the Oakland Animal Shelter (positions vacant since March 2011) will remain as is: loss of ability to improve capacity
FY 2013-14 FTEs FY2014-15 FTEs
GPF $178,790,549 1,006.70 $192,780,324 1,071.21
Non-GPF $ 24,834,035 119.15 $ 25,433,763 106.64
Total: $203,624,584 1,125.85 $218,214,087 1,177.85

Department of Economic & Workforce Development
Position Changes • Add 1 FTE City Administrator Analyst for in Economic Development support • Delete 1.50 FTE administrative support/analyst positions in the Workforce unit (2195) • Delete 1 FTE Graphic Design Specialist position in Marketing unit
Service Impacts Positive
• Continues to invest in youth, adult and dislocated worker employment training • Allows additional support for business attraction and retention • Start construction at the Army Base (December 2013) • Start the Brooklyn Basin project (Spring 2014) • Many other potential projects in the pipeline/Projects exceed Staff capacity
Negative • Lack of administrative support for WIA system implementation undermines ability to
effectively administer Oakland Workforce Development System • Without Graphic Designer, City will need to assign additional resources for this service
or experience major challenges producing any citywide marketing materials • Alternative funding for walking tours needed for FY 2014-15
FY 2013-14 FTEs FY2014-15 FTEs
GPF $1,614,336 8.50 $1,646,798 8.50
Non-GPF $6,723,505 13.00 $6,737,314 13.00
Total: $8,337,841 21.50 $8,384,112 21.50
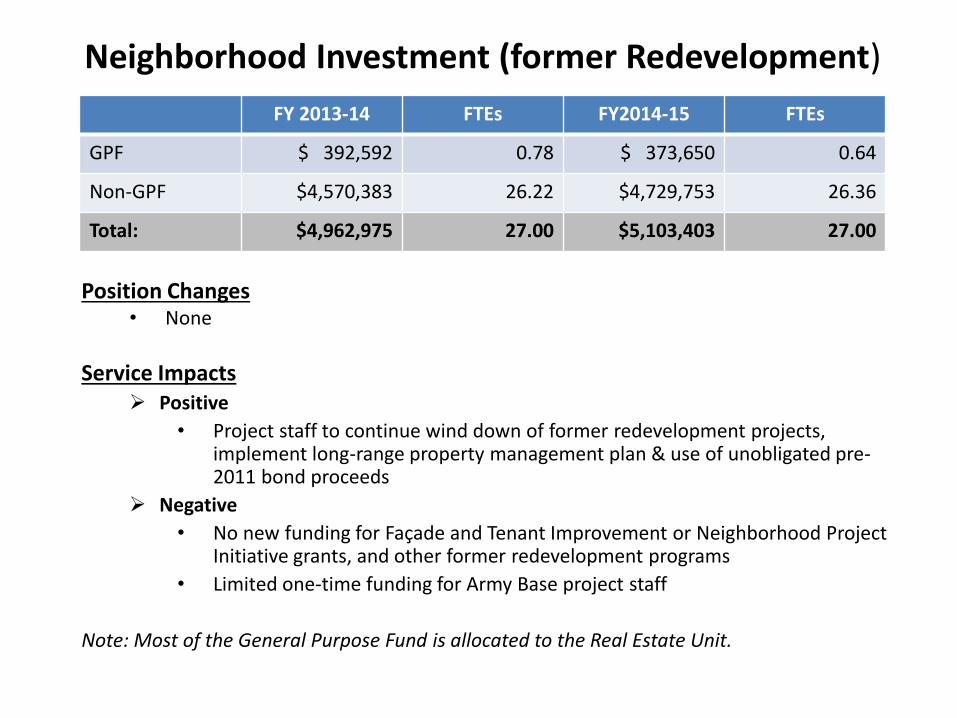
Neighborhood Investment (former Redevelopment)
Position Changes • None
Service Impacts Positive
• Project staff to continue wind down of former redevelopment projects, implement long-range property management plan & use of unobligated pre-2011 bond proceeds
Negative
• No new funding for Façade and Tenant Improvement or Neighborhood Project Initiative grants, and other former redevelopment programs
• Limited one-time funding for Army Base project staff
Note: Most of the General Purpose Fund is allocated to the Real Estate Unit.
FY 2013-14 FTEs FY2014-15 FTEs
GPF $ 392,592 0.78 $ 373,650 0.64
Non-GPF $4,570,383 26.22 $4,729,753 26.36
Total: $4,962,975 27.00 $5,103,403 27.00

Planning and Building
Position Changes • Freeze 1 FTE Engineer, Assistant II; 1 FTE Engineer, Civil Supervisor; 1 FTE Engineer, Civil; 1
FTE Process Coordinator II; 1 FTE Specialty Combination Inspector Senior; 4 FTE Specialty Combination Inspector; 1 FTE Public Service Representative; 1 FTE Administrative Analyst II; 1 FTE Planner I; and 1 FTE Planner II
• Administration can utilize the Ordinance that allows for hiring when fees cover costs
Service Impacts • Implementation of the new Accela system will be compromised given the high time-
demand – required of all inspectors and plan checkers – to test the new system and to provide the proper training
• Longer waiting time for permits issued “over the counter” or within the “1-2 day” period for minor permits (30% reduction)
• Plan check reviews and permit issuance, for major projects, delayed by two or more weeks (25% reduction)
• Less inspections conducted within a 24-hour period – for new construction activity (20% reduction)
• Less inspections conducted within 1-week period for Code Enforcement complaints (70% reduction)
FY 2013-14 FTEs FY2014-15 FTEs
GPF 0 0 0 0
Non-GPF $21,322,043 114.75 $21,648,739 111.75
Total: $21,322,043 114.75 $21,648,739 111.75
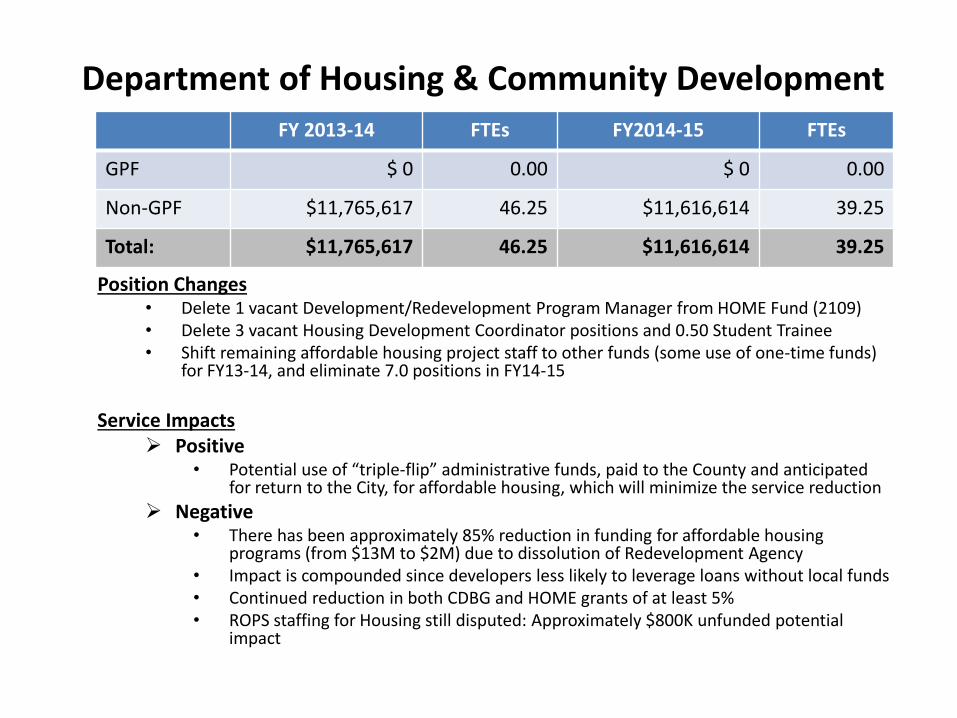
Department of Housing & Community Development
Position Changes
• Delete 1 vacant Development/Redevelopment Program Manager from HOME Fund (2109) • Delete 3 vacant Housing Development Coordinator positions and 0.50 Student Trainee • Shift remaining affordable housing project staff to other funds (some use of one-time funds)
for FY13-14, and eliminate 7.0 positions in FY14-15
Service Impacts
Positive • Potential use of “triple-flip” administrative funds, paid to the County and anticipated
for return to the City, for affordable housing, which will minimize the service reduction
Negative • There has been approximately 85% reduction in funding for affordable housing
programs (from $13M to $2M) due to dissolution of Redevelopment Agency • Impact is compounded since developers less likely to leverage loans without local funds • Continued reduction in both CDBG and HOME grants of at least 5% • ROPS staffing for Housing still disputed: Approximately $800K unfunded potential
impact
FY 2013-14 FTEs FY2014-15 FTEs
GPF $ 0 0.00 $ 0 0.00
Non-GPF $11,765,617 46.25 $11,616,614 39.25
Total: $11,765,617 46.25 $11,616,614 39.25
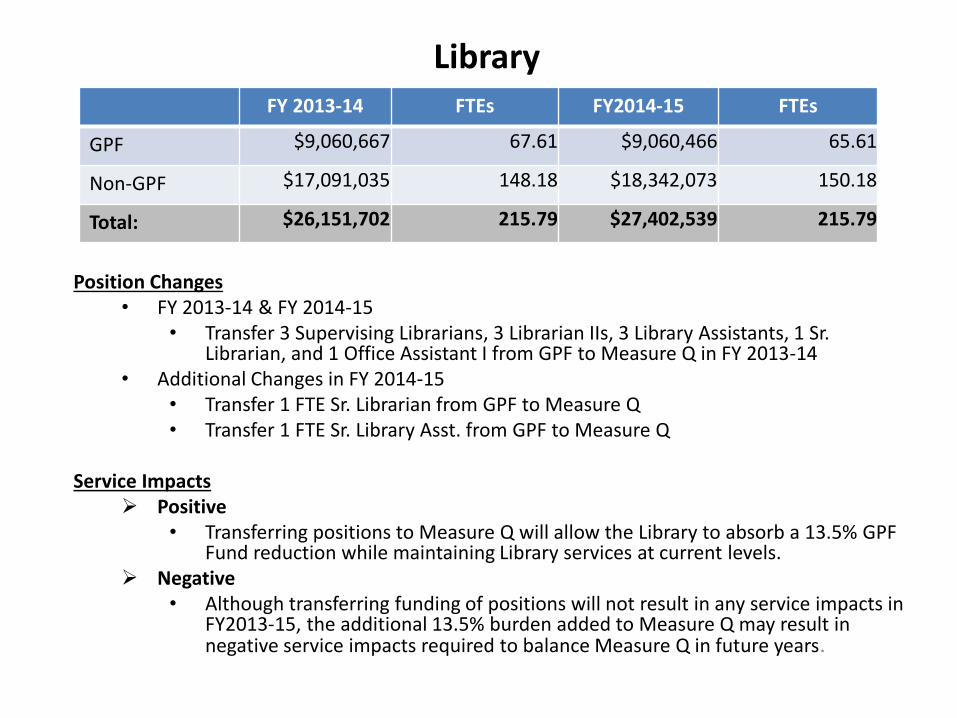
Library
Position Changes
• FY 2013-14 & FY 2014-15 • Transfer 3 Supervising Librarians, 3 Librarian IIs, 3 Library Assistants, 1 Sr.
Librarian, and 1 Office Assistant I from GPF to Measure Q in FY 2013-14 • Additional Changes in FY 2014-15
• Transfer 1 FTE Sr. Librarian from GPF to Measure Q • Transfer 1 FTE Sr. Library Asst. from GPF to Measure Q
Service Impacts Positive
• Transferring positions to Measure Q will allow the Library to absorb a 13.5% GPF Fund reduction while maintaining Library services at current levels.
Negative • Although transferring funding of positions will not result in any service impacts in
FY2013-15, the additional 13.5% burden added to Measure Q may result in negative service impacts required to balance Measure Q in future years.
FY 2013-14 FTEs FY2014-15 FTEs
GPF $9,060,667 67.61 $9,060,466 65.61
Non-GPF $17,091,035 148.18 $18,342,073 150.18
Total: $26,151,702 215.79 $27,402,539 215.79
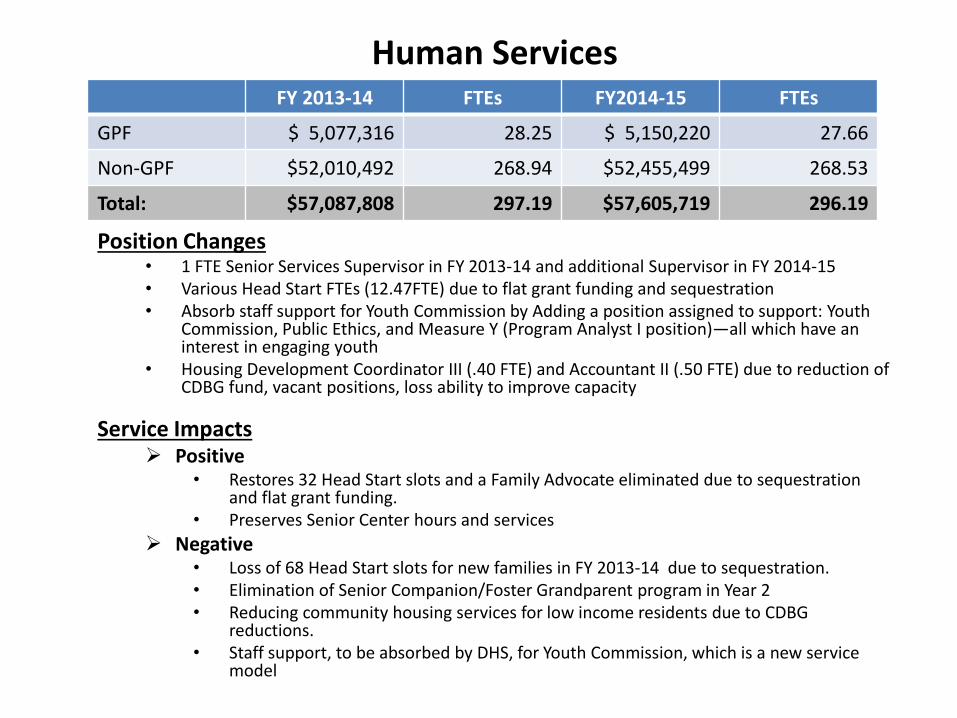
Human Services
Position Changes • 1 FTE Senior Services Supervisor in FY 2013-14 and additional Supervisor in FY 2014-15 • Various Head Start FTEs (12.47FTE) due to flat grant funding and sequestration • Absorb staff support for Youth Commission by Adding a position assigned to support: Youth
Commission, Public Ethics, and Measure Y (Program Analyst I position)—all which have an interest in engaging youth
• Housing Development Coordinator III (.40 FTE) and Accountant II (.50 FTE) due to reduction of CDBG fund, vacant positions, loss ability to improve capacity
Service Impacts Positive
• Restores 32 Head Start slots and a Family Advocate eliminated due to sequestration and flat grant funding.
• Preserves Senior Center hours and services
Negative • Loss of 68 Head Start slots for new families in FY 2013-14 due to sequestration. • Elimination of Senior Companion/Foster Grandparent program in Year 2 • Reducing community housing services for low income residents due to CDBG
reductions. • Staff support, to be absorbed by DHS, for Youth Commission, which is a new service
model
FY 2013-14 FTEs FY2014-15 FTEs
GPF $ 5,077,316 28.25 $ 5,150,220 27.66
Non-GPF $52,010,492 268.94 $52,455,499 268.53
Total: $57,087,808 297.19 $57,605,719 296.19

Parks and Recreation
Position Changes • 5.54 FTEs ($390K) transferred from the GPF to OPR’s Self-Sustaining Fund • Add 1.00 FTE Student Trainee, PT • 10% reduction in the subsidy for Oakland Zoo, Chabot Space & Science Center, Hacienda Peralta
and the Asian Cultural Center • 3.24 FTEs reduction ($110K) will allow for flexibility in recreation center closures
Service Impacts Positive
• Recreation Centers that generate revenue will opt not to reduce hours during high rental days
• Transfer of 5.54FTE positions to enterprise fund will allow continued critical programming (e.g., OPR marketing, continuance of outdoor educational programs and the oversight of fee based programs)
• “One size does not fit all” fiscal reduction target specific service need patterns and preferences
Negative • Recreation Centers will reduce hours of operations; the hours will be reduced to limit
impacts on children and youth • Fee Increases for self-sustaining programs
FY 2013-14 FTEs FY2014-15 FTEs
GPF $12.79M 120.55 $13.06M 120.55
Non-GPF $10.40M 109.59 $10.66M 109.59
Total: $23.19M 230.14 $23.72M 230.14

Public Works Agency
Position Changes • Add: 2.00 FTE Painters for Graffiti Abatement Team • Add: $1.0M in Year 1 and $1.25M in Year 2 for Minor CIP in the Facilities Fund • Eliminate 2.75 FTE Various Positions (technical clean up on vacant positions, Clean
Community Supervisor, Recycling Specialist, Main. Mechanic, and Stationary Engineer)
Service Impacts Positive
• Faster response for graffiti abatement • Funding for minor capital funding & equipment
Negative • No additional funds provided for street paving, parks, trees, illegal dumping, litter
and maintenance of former redevelopment parcels. • The 140.00 FTE eliminated in the last 5 years (18.5% of workforce) have not been
restored (e.g. Plumbers, Park Maintenance, Tree, Illegal Dumping, and Litter staff)
FY 2013-14 FTEs FY2014-15 FTEs
GPF $ 1,156,776 8.25 $ 1,178,195 8.25
Non-GPF $134,723,708 723.58 $136,010,178 723.58
Total: $135,880,484 731.83 $137,188,373 731.83
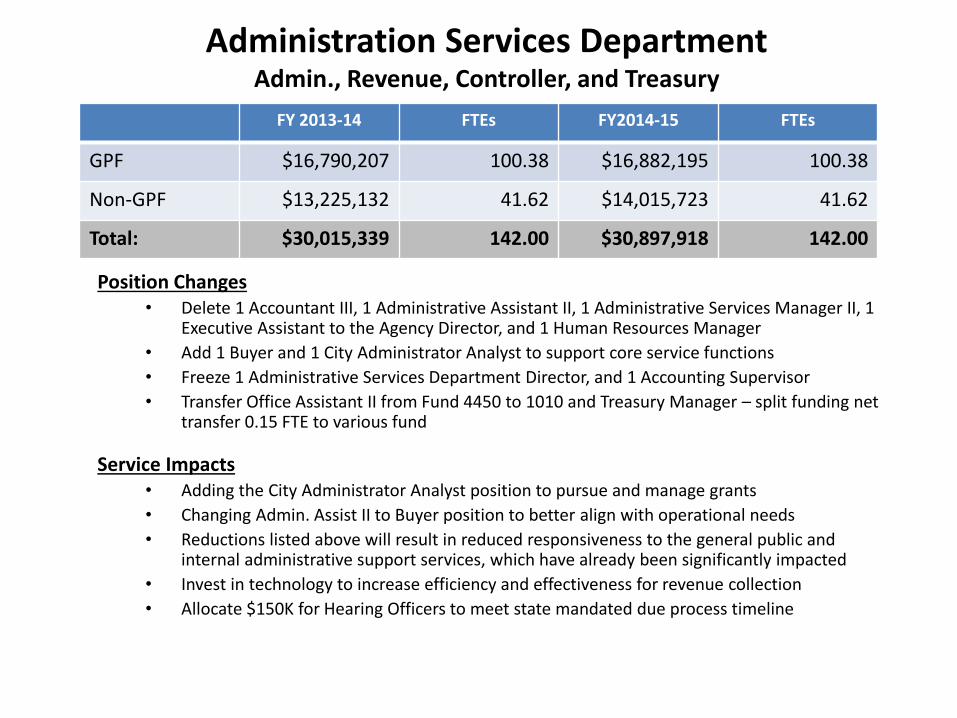
Administration Services Department Admin., Revenue, Controller, and Treasury
Position Changes
• Delete 1 Accountant III, 1 Administrative Assistant II, 1 Administrative Services Manager II, 1 Executive Assistant to the Agency Director, and 1 Human Resources Manager
• Add 1 Buyer and 1 City Administrator Analyst to support core service functions
• Freeze 1 Administrative Services Department Director, and 1 Accounting Supervisor
• Transfer Office Assistant II from Fund 4450 to 1010 and Treasury Manager – split funding net transfer 0.15 FTE to various fund
Service Impacts • Adding the City Administrator Analyst position to pursue and manage grants
• Changing Admin. Assist II to Buyer position to better align with operational needs
• Reductions listed above will result in reduced responsiveness to the general public and internal administrative support services, which have already been significantly impacted
• Invest in technology to increase efficiency and effectiveness for revenue collection
• Allocate $150K for Hearing Officers to meet state mandated due process timeline
FY 2013-14 FTEs FY2014-15 FTEs
GPF $16,790,207 100.38 $16,882,195 100.38
Non-GPF $13,225,132 41.62 $14,015,723 41.62
Total: $30,015,339 142.00 $30,897,918 142.00
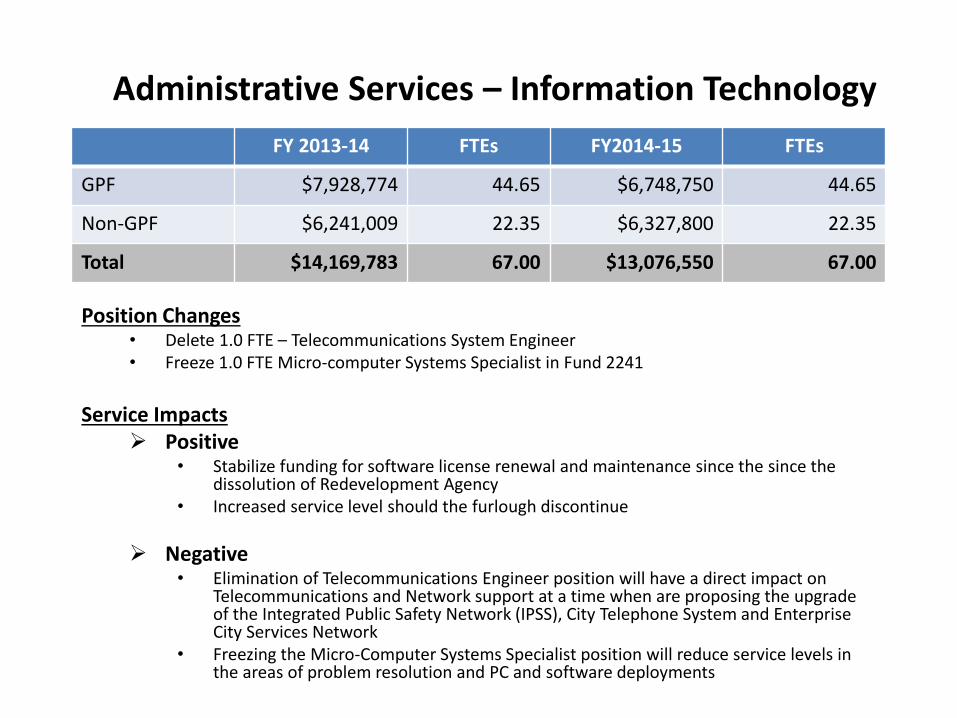
Administrative Services – Information Technology
Position Changes • Delete 1.0 FTE – Telecommunications System Engineer • Freeze 1.0 FTE Micro-computer Systems Specialist in Fund 2241
Service Impacts
Positive • Stabilize funding for software license renewal and maintenance since the since the
dissolution of Redevelopment Agency • Increased service level should the furlough discontinue
Negative • Elimination of Telecommunications Engineer position will have a direct impact on
Telecommunications and Network support at a time when are proposing the upgrade of the Integrated Public Safety Network (IPSS), City Telephone System and Enterprise City Services Network
• Freezing the Micro-Computer Systems Specialist position will reduce service levels in the areas of problem resolution and PC and software deployments
FY 2013-14 FTEs FY2014-15 FTEs
GPF $7,928,774 44.65 $6,748,750 44.65
Non-GPF $6,241,009 22.35 $6,327,800 22.35
Total $14,169,783 67.00 $13,076,550 67.00

Administrative Services– Human Resources
Position Changes
• None
Service Impacts • Funded the 168th police academy.
• Proposed 169thand 170th police academies
• 2 fire academies
• On-going recruitment for civilian positions and an OPD Civilian Staffing Plan.
• For HR, the workload for recruitments will increase and delays will take place in less priority recruiting areas
FY 2013-14 FTEs FY2014-15 FTEs
GPF $3,711,524 28.10 $3,790,743 28.10
Non-GPF $1,743,077 8.60 $1,771,559 8.60
Total: $5,454,601 36.70 $5,562,302 36.70

Expenditure Reduction Restoration & Policy Tradeoffs
41 City of Oakland - Special City Council Meeting - April 30, 2013
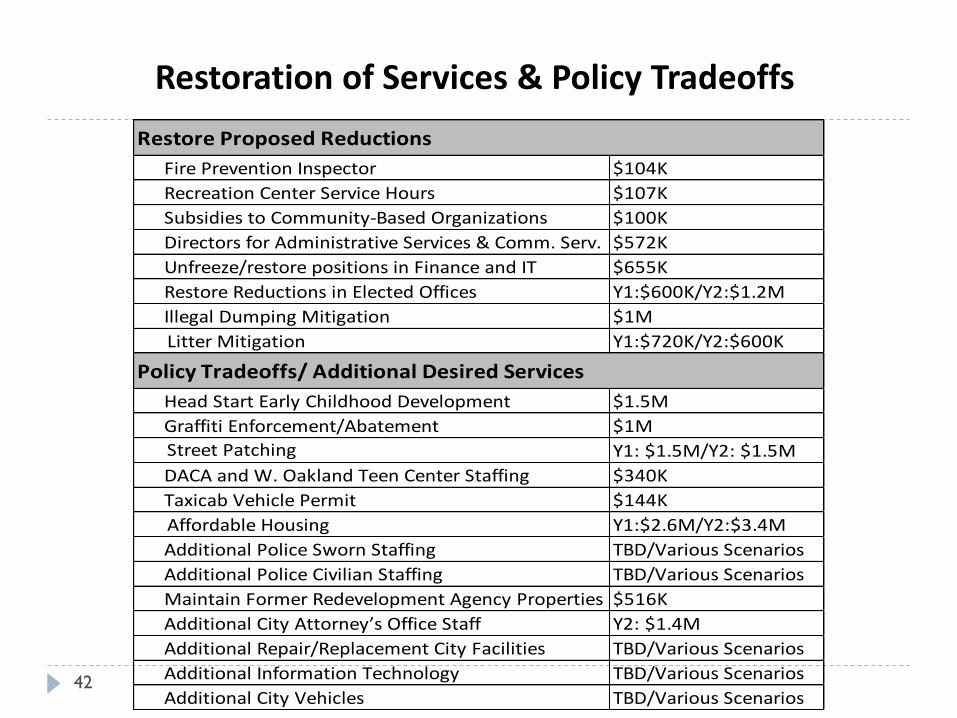
Restoration of Services & Policy Tradeoffs
42
Fire Prevention Inspector $104K
Recreation Center Service Hours $107K
Subsidies to Community-Based Organizations $100K
Directors for Administrative Services & Comm. Serv. $572K
Unfreeze/restore positions in Finance and IT $655K
Restore Reductions in Elected Offices Y1:$600K/Y2:$1.2M
Illegal Dumping Mitigation $1M
Y1:$720K/Y2:$600K
Head Start Early Childhood Development $1.5M
Graffiti Enforcement/Abatement $1M
Y1: $1.5M/Y2: $1.5M
DACA and W. Oakland Teen Center Staffing $340K
Taxicab Vehicle Permit $144K
Y1:$2.6M/Y2:$3.4M
Additional Police Sworn Staffing TBD/Various Scenarios
Additional Police Civilian Staffing TBD/Various Scenarios
Maintain Former Redevelopment Agency Properties $516K
Additional City Attorney’s Office Staff Y2: $1.4M
Additional Repair/Replacement City Facilities TBD/Various Scenarios
Additional Information Technology TBD/Various Scenarios
Additional City Vehicles TBD/Various Scenarios
Policy Tradeoffs/ Additional Desired Services
Restore Proposed Reductions
Affordable Housing
Street Patching
Litter Mitigation

Five-Year GPF & All-Fund Revenue & Expenditure Projection (as of March 2013)
43
Note: (a) Assumes one police academy per year in FY 2015-16, FY 2016-17, and FY 2017-18; (b) The police and fire services supported by Measure Y do not have to be backfilled by the General Purpose Fund; and (c) Salaries are assumed to grow at 1% due to step increases (d) FY 2013-2014 surplus is for Negative Fund Balance Repayment
City of Oakland - Special City Council Meeting - April 30, 2013
General Purpose
Fund
FY 2013-14
Proposed
FY 2014-15
Proposed
FY 2015-16
Forecast
FY 2016-17
Forecast
FY 2017-18
Forecast
Revenue $ 430,155,612 $ 457,401,684 $ 449,405,499 $ 460,300,547 $ 475,368,929
Expenditures $ 430,155,612 $ 457,401,684 $ 461,600,000 $ 474,300,000 $ 502,100,000
Surplus/(Shortfall) $ - $ - $ (12,194,501) $ (13,999,453) $ (26,731,071)
Expenditures -
Deferred
$ 99,000,000 $ 100,400,000 $ 101,700,000
Surplus/(Shortfall) $ - $ - $ (111,194,501) $ (114,399,453) $ (128,431,071)
All Funds FY 2013-14
Proposed
FY 2014-15
Proposed
FY 2015-16
Forecast
FY 2016-17
Forecast
FY 2017-18
Forecast
Revenue $ 1,052,690,555 $ 1,071,696,861 $ 1,013,617,005 $ 1,030,810,812 $ 1,052,534,461
Expenditures $ 1,039,006,929 $ 1,060,583,969 $ 1,059,300,000 $ 1,079,300,000 $ 1,115,300,000
Surplus/(Shortfall) $ 13,683,626 $ 11,112,892 $ (45,682,995) $ (48,489,188) $ (62,765,539)
Expenditures -
Deferred
$ 135,000,000 $ 136,300,000 $ 137,600,000
Surplus/(Shortfall) $ 13,683,626
(dO
$ 11,112,892 $ (180,682,995) $ (184,789,188) $ (200,365,539)
(d) (d)

Conclusion
• This is a fare-share, balanced budget allocating limited resources in line with those services that a full-service City provides
• Oakland is on the rise, yet significant challenges lie ahead
• Long-term strategies and shared-solutions are needed from all stakeholders
• Many of the areas are policy matters and, ultimately tradeoffs between competing priorities
• We look forward to working with all stakeholders from here to adopt the policy budget
City of Oakland - Special City Council Meeting - April 30, 2013 44

FY 2013-15 Budget Process & Timeline
• May: Budget Town Hall Meetings Citywide
• May 9: District 7, Thursday, 6:30-8:30 pm, Oakland Zoo, Zimmer Auditorium
• May 13: District 5 & At Large, 6-8 pm, Patten College (location is tentative)
• May 18: District 1 & 3, Saturday, 12 – 2 pm, Beebe Memorial
• May 19: District 2 & 4, Sunday, 3:30-5:30 pm, Edna Brewer Middle School, 3748 13th Ave.
• May 20: District 6, Monday, 6:30-8 pm, Frick Middle School, 2845-64th Ave.
• May 23: City Council Budget Hearing, 6:30 p.m. City Council Chambers
• June 13: City Council Budget Hearing, 6:30 p.m. City Council Chambers
• June 27: Final City Council Budget Hearing/Adoption, 6:30 p.m. City Council Chambers
• July 1: Implementation of FY 13-15 Adopted Budget
45 City of Oakland - Special City Council Meeting - April 30, 2013

Questions & Answers
46 City of Oakland - Special City Council Meeting - April 30, 2013