Embed Size (px)
Citation preview

2 Justice Research Center
Justice Research Center 3
Final Report
July 2004
Produced by
The Justice Research Center, Inc. 2898 Mahan Drive, Suite 4 Tallahassee, Florida 32308
(850) 521-9900 www.thejrc.com
Kristin Parsons Winokur, Ph.D. Julia L. Blankenship, MSW
Gregory A. Hand, B.S. Elizabeth S. Cass, Ph.D.
4 Justice Research Center
Table of Contents
Introduction.............................................................................................................................. 5
Data and Methodology............................................................................................................. 6
Data Sources ........................................................................................................................ 6
Identifying Youth at High Risk for Chronic Delinquency....................................................... 7
Geo-Mapping Community “Hot Spots” ................................................................................ 10
Types of Crime Maps......................................................................................................... 11
Geo-Mapping Delinquency Prevention Programming in Florida.......................................... 13
Identification and Application Procedures......................................................................... 18
Targeting High-Risk Youth ............................................................................................... 19
Raw Numbers Versus Rates........................................................................................... 19
Referrals Versus Adjudications ..................................................................................... 20
Delinquency Referrals Versus High-Risk Youth........................................................... 21
Targeting High-Risk Neighborhoods................................................................................. 22
Zip Codes Versus Other Geographic Markers............................................................... 24
Graphical Representation of Delinquency Hot Spots .................................................... 24
Data Issues ......................................................................................................................... 25
Discussion and Conclusion .................................................................................................... 26
Policy Recommendations................................................................................................... 26
Justice Research Center 5
Introduction
The American Youth Policy Forum recently noted, "To be effective in reducing youth crime, prevention and intervention efforts must target those young people at highest risk to become chronic offenders."1 They base their contention on more than 40 years of empirical research. Commencing with the groundbreaking study, Delinquency in a Birth Cohort,2 Marvin Wolfgang, Robert Figlio, and Thorsten Sellin determined that among a cohort of boys born in Philadelphia in 1945, a small percentage (6%) were chronic career offenders (youths with five or more arrests). Commonly referred to as the "chronic six percent" this group was responsible for 52% of all crimes committed by the cohort, 71% of the homicides, 82% of the robberies, and 64% of the aggravated assaults. Wolfgang and his colleagues, as well as numerous researchers nationally and internationally,3 have replicated the study, consistently finding that a small percentage of cohorts, between 6% and 14%, ultimately become chronic career criminals. While this small group is responsible for the majority of delinquent acts committed, researchers also discovered that most youths discontinue their involvement with delinquency after the first offense.4 Given these empirical findings, it is evident that fiscally constrained juvenile prevention and intervention strategies should target those youth most likely to become chronic delinquent offenders.
2003 Florida Statutes, Section 985.02: (3) JUVENILE JUSTICE AND DELINQUENCY PREVENTION. It is the policy of the state with respect to juvenile justice and delinquency prevention to first protect the public from acts of delinquency. In addition, it is the policy of the state to: (a) Develop and implement effective methods of preventing and reducing acts of delinquency, with a focus on maintaining and strengthening the family as a whole so that children may remain in their homes or communities. (b) Develop and implement effective programs to prevent delinquency, to divert children from the traditional juvenile justice system, to intervene at an early stage of delinquency, and to provide critically needed alternatives to institutionalization and deep-end commitment. (c) Provide well-trained personnel, high-quality services, and cost-effective programs within the juvenile justice system. (d) Increase the capacity of local governments and public and private agencies to conduct rehabilitative treatment programs and to provide research, evaluation, and training services in the field of juvenile delinquency prevention.
1 American Youth Policy Forum (2001). "Challenge #4: Identify and Intervene Intensively with Youth at Extreme Risk for Chronic Delinquency" in Less Cost, More Safety: Guiding Lights for Reform in Juvenile Justice. http://www.aypf.org/lesscost/pages/06.pdf. 2 Wolfgang, M., Figlio, R., and Sellin, T. (1972). Delinquency in a Birth Cohort. Chicago, IL: University of Chicago. 3 Wolfgang, M., Thornberry, T., and Figlio, R., eds. (1987). From Boy to Man, From Delinquency to Crime. Chicago, IL: University of Chicago Press. Tracy, P. and Kempf-Leonard, Kimberly (1996). Continuity and Discontinuity in Criminal Careers. New York: Plenum Press. Snyder, H. (1988). Court Careers of Juvenile Offenders. Washington, DC: Office of Juvenile Justice and Delinquency Prevention. West, D. and Farrington, D. (1977). The Delinquent Way of Life. London: Heinemann. Tracy, P., Wolfgang, M.E., & Figlio, R.M. (1995). "Delinquency in Two Birth Cohorts." Cited in Howell, J.C. (Ed.), Guide for Implementing the Comprehensive Strategy for Serious, Violent, and Chronic Juvenile Offenders. Washington, DC: Office of Juvenile Justice and Delinquency Prevention. Schumacher, M. and Kurz, G. (2000). The 8% Solution: Preventing Serious, Repeat Juvenile Crime. Thousand Oaks, CA: Sage Publications. 4 Gwen Kurz found that among youth referred to the Orange County, California juvenile justice system, 70% never returned and another 22% were only referred once or twice during a three-year follow-up period (American Youth Policy Forum, 2001).
6 Justice Research Center
The Florida Department of Juvenile Justice (DJJ) is required by statute to administer prevention and intervention services to at-risk youths and their families (see insert). At approximately $62 million in fiscal year 2001-02, funding for prevention programs accounts for less than ten percent of the more than $619 million allocated to DJJ annually.5 In order to make efficient use of limited resources in the face of increasing needs for service, the DJJ Prevention and Victim Services branch (hereafter referred to generally as DJJ) developed a prevention strategy to:
Target youth who are at highest risk for engaging in criminal behavior.
Locate resources in communities with the greatest risk factors.
Employ research-based prevention methods.
Prevention program allocation in Florida is therefore a two-pronged approach to identify (a) youth and (b) communities with the greatest risk factors and needs for service. The DJJ relies upon the research literature to inform the process of identifying at-risk youth. Prevention and Victim Services, with the assistance of DJJ research staff, then utilize geo-mapping technology to identify and map neighborhoods where large concentrations of high-risk delinquents reside. These "high-risk" communities are mapped by zip code boundaries. Prevention program providers can then identify the areas that are most in need of services. This targeting approach has been in place for the last three years and the Department has asked that an outside evaluator, The Justice Research Center (JRC), assess its validity. This report presents the findings of the evaluation and covers only contracted general revenue and state grant funded prevention programs.6
Data and Methodology
This assessment examines DJJ prevention service allocation in fiscal years 2002, 2003 and 2004. All contracted general revenue and state grant funded prevention programs are contractually required to target services to high-risk youth and communities. The DJJ methodology and implementation process for targeting these youth and communities is evaluated here.
Data Sources
The current assessment is based upon both qualitative and quantitative data. To evaluate the Department's targeting of prevention resources, DJJ prevention and research staff were interviewed to determine the specific elements of the approach, chronological steps in the process, implementation procedures, and rationale. Additionally, standard prevention program contract forms were reviewed to further document the required targeting
5 Winokur, K.P., Blankenship, J., Cass, E., Hand, G., Tollett, T., Chapman, S., Jackson, S., Epps, N., Greenwald, M., and Wang, K. (2004). 2004 Florida Outcome Evaluation Report. Tallahassee, FL: Florida Department of Juvenile Justice. 6 Office of Juvenile Justice and Delinquency Prevention (OJJDP) programs are not included in this evaluation as the targeting approach is not currently in use with federally-funded prevention services administered within the DJJ.
Justice Research Center 7
criteria to which each provider must adhere. Compliance and outcome data were compiled from the DJJ’s Juvenile Justice Information System (JJIS) and where necessary, automated information systems from the Florida Network of Youth and Family Services, Inc. (Network). The JJIS system was used to identify the youth who successfully completed general revenue and state grant funded prevention programs between July 1, 2001 and June 30, 2003. Demographic data for these youth including their residential zip codes, as well as their offense histories, were obtained from JJIS.
A brief overview of the research literature on delinquency risk factors and identifying high-risk neighborhoods is presented as a baseline against which to review and measure the DJJ targeting approach. The methodological validity of the approach is then examined relative to implementation, targeting criteria, and high-risk zone selection. Policy recommendations are then offered for furthering the Department’s efforts to efficiently and effectively target prevention services in Florida.
Identifying Youth at High Risk for Chronic Delinquency
Over the last forty years, researchers have consistently documented the following when studying the dynamics and predictors of delinquency:
The majority of first-time youthful offenders do not return to the juvenile justice system after their initial arrest encounter.
There will never be enough money, people, or programs to solve all the problems faced by each youth in our society. In the fight against juvenile crime, we must focus our efforts on the group with the greatest potential to burden and victimize society and the ones most likely to fail in life. This group cries out for our attention.
(American Youth Policy Forum, 2001).
Males are significantly more likely to be involved in delinquency than are females.
Youths who were 13 years of age or younger at the time of their first juvenile offense are significantly more likely than older youths to engage in chronic, serious juvenile delinquency.
A small percentage of all delinquent youth is responsible for the majority of crimes committed by the cohort of youth.
Certain factors may predispose or increase the risk that youth will become involved in delinquent activities (e.g., delinquent peers, substance abuse, attitudes favorable toward delinquency, prior sexual/physical abuse, low parental control, and poor school performance).7
7 Hoge, Andrews, and Leschied. (1996). “An Investigation of Risk and Protective Factors in a Sample of Youthful Offenders.” Journal of Child Psychology and Psychiatry.37: 419-424. Hoge, Andrews, and Leschied. (1999). “Recidivism is Predictable and Can be Influenced: Using Risk Assessments to Reduce Recidivism.” Forum on Corrections Research. Special Edition, 5-11. Dowden, Craig and Andrews. (1999). “What Works for Female Offenders: A Meta-Analytic Review.” Crime and Delinquency. 45(4): 438-452.

8 Justice Research Center
Understanding these consistent patterns can facilitate effective targeting of scarce delinquency prevention resources. Beginning in fiscal year 2000-01, the DJJ Prevention and Victim Services branch requested that prevention providers target the youths most at-risk for involvement in serious and/or chronic delinquency. To assist providers in identifying these youth, the DJJ relied on the evidence-based targeting criteria set forth in:
The 8% Solution: Preventing Serious, Repeat Juvenile Crime by Michael Schumacher and Gwen A. Kurz;
Communities That Care: A Comprehensive Prevention Program by Richard Catalano, David Hawkins, and Patricia Chappell;
Preventing Crime: What Works, What Doesn’t, What’s Promising by the University of Maryland Department of Criminology and Criminal Justice and as sponsored by the U.S. Department of Justice, Office of Justice Programs;
Guide for Implementing Comprehensive Strategy for Serious, Violent, and Chronic Juvenile Offenders by the U.S. Department of Justice, Office of Juvenile Justice and Delinquency Prevention;
The Florida Drug Control Strategy by the Executive Office of the Governor;
The DJJ Leadership Agenda and the DJJ FY 2000-01 Agency Strategic Plan (Program Focus); and
The research and program evaluation projects completed by the DJJ Bureau of Data and Research.
Using rigorous empirical methods including experimental designs, Schumacher and Kurz set out to identify predictors of serious chronic juvenile offending among samples of youth on juvenile probation in California. Similar to the research of Marvin Wolfgang and his colleagues, Schumacher and Kurz discovered that approximately 8% of the juvenile probation cohorts ultimately went on to become serious chronic offenders (four or more referrals). They identified the following as risk factors associated with serious delinquency:
• Age: Early entrance into delinquency
o 15 years or younger at the time of first referral
• School behavior/performance factor
o Attendance problems (truancy or pattern of skipping)
o Behavior programs (recent suspension or expulsion)
o Poor grades (failing one or more classes)
Justice Research Center 9
• Family problem factor
o Poor parental supervision and control
o Significant family problems (illness, substance abuse, recent trauma, major financial problems, marital/family discord, or other significant stressors)
o Criminal family members exerting negative influence
o Documented child abuse or neglect (dependency status)
• Substance abuse factor
o Use of alcohol or drugs
• Delinquency factor
o Stealing pattern of behavior
o Runaway pattern of behavior
o Gang member or associate
In FY 2000-01, the DJJ amended its prevention grant applications to include requirements that applicants:
• Identify Risk Factor Domains: Select two general areas the program intends to address based on community assessment(s).
• Identify Risk Factors to be Addressed: For each domain selected above, list the domain and the priority risk factor(s) selected that will be the focus of this program.
Providers awarded prevention program grant monies were held accountable for serving the at-risk populations they indicated would be served in their applications. DJJ required that 50% of youth served by prevention program providers be identified as youth highly likely to become delinquent. This was defined as youth 15 years of age or younger exhibiting at least three of the four risk factors set forth in the 8% Solution criteria noted above. This percentage would incrementally increase to 60% in year two and 70% of the youth served in year three. By year three however, the age criteria was expanded by DJJ to include all youth 17 years of age and younger at the time of referral.
The DJJ Prevention and Victim Services’ adoption of the above-referenced criteria was a significant step toward targeting those juvenile populations most in need of services. Establishing evidence-based guidelines for prevention program implementation is an innovative and efficient use of resources. It is recommended that prevention program implementation and contract requirements continue to rely upon research-based strategies in targeting individual-level risk factors. In so doing, it is important to consider the following:
10 Justice Research Center
The 8% Solution was based on probation youth. While the same basic principles will emerge in most research on delinquency or at-risk populations, it is possible that the sample upon which Schumacher and Kurz based their analyses, i.e., probation youth, is qualitatively different from Florida’s delinquency prevention population in terms of demographics and offender/offense characteristics and seriousness. Following methodological techniques set forth by researchers such as Rolf Loeber and Edward Latessa, it is recommended that a cohort of prevention youth (e.g., all youth placed in prevention programs during fiscal year 2002-03) be examined to determine the specific risk and protective factors which are significant predictors of recidivism one year following the completion of prevention services. A control group of non-prevention youth (e.g., youth placed on community control and/or those informally processed and released) should likewise be followed to adequately evaluate the impact of current prevention programming services. A key component to the DJJ targeting methodology is the contention that the current approach will facilitate more effective service delivery and ultimately result in a reduction in recidivism. While the research literature certainly confirms this contention in other study sites, it is important to validate the model with prevention youth in Florida using an experimental or quasi-experimental design outcome evaluation.
The 50-70% requirement is not one that can be either validated or invalidated. It is a subjective criterion within the purview of the Department to set. However, to facilitate the equitable evaluation of prevention programming in Florida, it is recommended that all providers be held to the same standards.
Geo-Mapping Community “Hot Spots”
One of the biggest changes in recent crime control and prevention strategies has been the introduction and use of geo-mapping techniques. Research suggests that criminal activity does not occur evenly across neighborhoods and communities, but is concentrated in relatively small places that generate more than half of all criminal events.8 Crime control and prevention should therefore focus on the places, times, and people who pose the highest risk.9
The majority of the research in this area examines targeted policing efforts and the use of computerized geo-mapping of call and incident data to identify areas in communities, often referred to as “hot spots,” with high concentrations of criminal activity. The law enforcement community has long recognized that particular environments, so-called crime generators, attract greater levels of crime than other locales. The research literature suggests
8 Braga, A. (2001). “Part II: Research Findings from Prevention and Intervention Studies: The Effects of Hot Spots Policing on Crime.” The Annals of the American Academy of Political and Social Science 578:104; Pierce, G.L., Spaar, S., and Briggs, L. (1988). The Character of Police Work: Strategic and Tactical Implications. Boston, MA: Northeastern University, Center for Applied Research; Sherman, L, Gartin, P, and Buerger, M. (1989). “Hot Spots of Predatory Crime: Routine Activities and the Criminology Place.” Criminology 27:27-56. 9 Braga, A. (2001). “Part II: Research Findings from Prevention and Intervention Studies: The Effects of Hot Spots Policing on Crime.” The Annals of the American Academy of Political and Social Science 578:104.
Justice Research Center 11
that criminal activity clusters in particular places due to a variety of situational factors.10 Hot spots may be defined relative to particular activities (e.g., drug trading, prostitution),11 specific concentrations of land uses (e.g., skid row areas, bars, adult bookshops), or interactions between activities and land uses, such as muggings in skid row areas or thefts at subway stations.12 Braga (2001) conducted a qualitative meta-analysis of major studies of geo-mapping in crime prevention and found that focusing law enforcement efforts at high-activity crime places can result in reductions in crime and disorder and does not inevitably lead to crime displacement problems. However, he cautioned that it is important to strike a balance between crime control/prevention tactics and unwarranted intrusiveness or even police harassment in certain neighborhoods. While this is not as much an issue with prevention program targeting, it is important to allocate services in a fair, rational way when undertaking “place-oriented” crime prevention strategies.
The rationale for targeting hot spots is grounded in social disorganization, social ecological, rationale choice, and routine activities theories.13 What is gleaned from these perspectives is the empirically-based assertion that situational factors (e.g., poverty, community disorganization, resident mobility and minimal community cohesiveness) contribute to the coalescing of criminal opportunities with motivated actors and victim targets. Addressing situational factors and reducing criminal opportunities through crime control and prevention activities, it is theorized, will ultimately result in decreased crime and delinquency. Police officers patrolling a precinct can focus attention on selected environments because they know that crime incidents will continually reappear in these places. Crime prevention units can target efforts in hot spots knowing that they will achieve a positive effect in reducing crime with limited.14
Types of Crime Maps
Geographic information systems (GIS) allow criminal and juvenile justice practitioners to use crime statistics to identify the hot spots and target problem areas and scarce resources. Early law enforcement techniques, including creating crime maps with push pins, were rudimentary and often ineffective over time as the maps were static representations of crime rates at a given point in time, and therefore failed to reflect hot spot 10 Braga, A. (2001). “Part II: Research Findings from Prevention and Intervention Studies: The Effects of Hot Spots Policing on Crime.” The Annals of the American Academy of Political and Social Science 578:104; Eck, J.E. and Weisburd, D.L. (1995). “Crime Places in Crime Theory.” In Crime and Place. Eds. John E. Eck and David L. Weisburd. Monsey, NY: Criminal Justice Press. 11 Weisburd and Green, 1995; Sherman, Gartin and Buerger, 1989; Maltz, Gordon, and Friedman, 1989. 12 Block and Block, 1995; Levine, Wachs and Shirazi, 1986; Stoe, Watkins, Kerr, Rost, and Craig, 2003. 13 Sutherland, E.H. (1966). Principles of Criminology. Philadelphia, PA: Lippincott. Sutherland, E.H. (1961). White Collar Crime. New York, NY: Rinehart and Winston. Cornish D.B. and Clarke, R.V. (1986). The Reasoning Criminal: Rational Choice Perspectives on Offending. New York: Springer-Verlag. Cohen, L.E. and Felson, M. (1979). “Social Change and Crime Rate Trends: A Routine Activity Approach.” American Sociological Review 44(4): 588-608. Braga, A. (2001). “Part II: Research Findings from Prevention and Intervention Studies: The Effects of Hot Spots Policing on Crime.” The Annals of the American Academy of Political and Social Science 578:104. 14 Braga, A. (2001). “Part II: Research Findings from Prevention and Intervention Studies: The Effects of Hot Spots Policing on Crime.” The Annals of the American Academy of Political and Social Science 578:104; Sherman, L. and Weisburd, D. (1995). “General Deterrent Effects of Police Patrol in Crime ‘Hot Spots:’ A Randomized, Controlled Trial.” Justice Quarterly 12:625-48.
12 Justice Research Center
changes.15 GIS is now used to create a variety of crime maps which can generally be grouped into three types:
Pin maps: Identify important locations with one pin point – i.e., plot out delinquency prevention providers and identify gaps in or duplication of service. The points only show location and illustrate spatial significance.
Thematic maps: Identify the density value of a particular attribute, such as number of homicides, in a geographically defined boundary. Typically, researchers and practitioners use shading to distinguish values between boundaries. Shading ranges from dark to light, with light representing lower values and dark representing higher values.
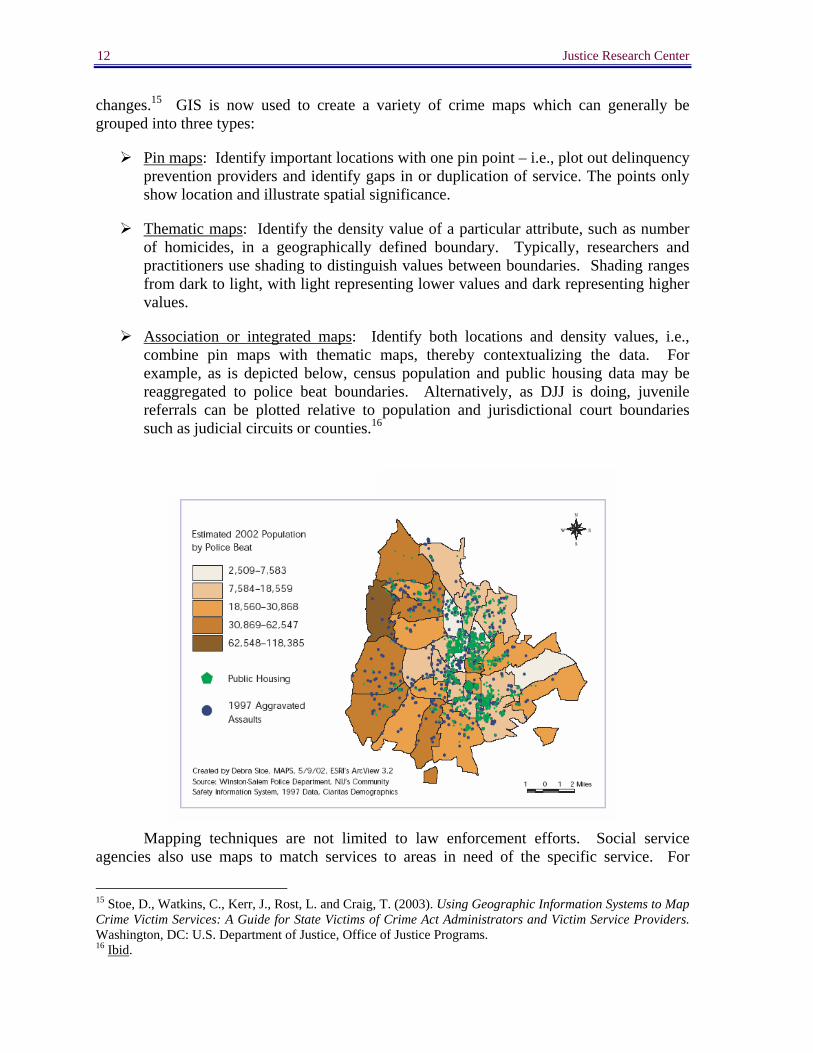
Association or integrated maps: Identify both locations and density values, i.e., combine pin maps with thematic maps, thereby contextualizing the data. For example, as is depicted below, census population and public housing data may be reaggregated to police beat boundaries. Alternatively, as DJJ is doing, juvenile referrals can be plotted relative to population and jurisdictional court boundaries such as judicial circuits or counties.16
Mapping techniques are not limited to law enforcement efforts. Social service agencies also use maps to match services to areas in need of the specific service. For
15 Stoe, D., Watkins, C., Kerr, J., Rost, L. and Craig, T. (2003). Using Geographic Information Systems to Map Crime Victim Services: A Guide for State Victims of Crime Act Administrators and Victim Service Providers. Washington, DC: U.S. Department of Justice, Office of Justice Programs. 16 Ibid.
Justice Research Center 13
example, community drug rehabilitation and prevention efforts may be targeted in those areas of the community with the highest concentrations of juvenile and adult drug possession and distribution arrests. Target cohorts change according to the services offered. Where delinquency prevention programming would focus on offenders and the neighborhoods with the highest proportions of juvenile referrals and large concentrations of high risk youths, a neighborhood crime watch program would instead target areas where victims are located and where crimes actually occur.
Geo-Mapping Delinquency Prevention Programming in Florida
In fiscal year 2000-01, the DJJ Prevention and Victim Services branch prepared a long-term Delinquency Prevention Plan. The primary tenets of the Plan center on targeting services, collaborating with system and community partners in prevention, and accountability in service delivery. Specifically, the Plan sets forth the following:
1. Targeting, including targeting the youth most at-risk of becoming delinquent, targeting resources to communities with the most at-risk youth, and targeting funding toward research-based programs.
a. Targeting the right youth - Delinquency prevention programs should focus their efforts on those youth most likely to become chronic juvenile offenders. Research results from both California and Florida indicate that chronic juvenile offenders share several common elements. They are younger than 15 and have three or more specific risk factors present in their life at the same time.
b. Targeting the right communities - Delinquency prevention programs focus their efforts toward those communities where most youth live who are referred for delinquency charges. A delinquent peer culture is a significant indication of multiple societal risk factors.
c. Targeting funding to research-based programs - The Department will fund programs that have been proven to significantly help prevent and reduce juvenile crime and the risk factors that contribute to delinquency. The Department of Juvenile Justice has joined with the Departments of Education, Health and Children and Families to promote research-based/science-based/evidence-based programs identified through published studies.
2. Cooperation, including developing and implementing a coordinated statewide juvenile crime prevention strategy among multiple state agencies and encouraging community-based programs to work together toward a comprehensive approach to troubled youth and families.
3. Accountability, including collecting data on youth served by delinquency prevention programs and measuring how successful prevention programs are in keeping youth in school and crime-free.
14 Justice Research Center
The Plan was disseminated to prevention providers and practitioners in part to outline the Department’s methods for targeting appropriate youths for prevention services. The DJJ used the 8% Solution criteria set forth earlier to assist providers in determining youth most “at-risk.” Subsequently, DJJ prevention requests for proposals and prevention program contracts included the use of geo-mapping techniques for identifying high-risk neighborhoods. The language stated:
“Targeted neighborhoods are those neighborhoods in which a disproportionately high percentage of delinquent youth reside and are identified by zip code number. The targeted zip codes are updated annually in a mutually agreed upon manner so that there is consistency and equity across rural and urban areas…The target population is defined as those youth most likely to become chronic juvenile delinquents who reside in targeted neighborhoods of identified zip codes with the highest number of delinquency referrals and who have identified risk factors in at least three of the four domains as identified by the 8% Solution research.”
The DJJ uses association/integration maps in targeting prevention services. Juvenile referrals for delinquency charges are grouped into geographic clusters by U.S. postal zip codes and county jurisdictional boundaries. As specified, the methods for identifying the “targeted zip codes” would be updated annually and in a mutually agreed upon manner. Initially, within each county the top five (5) zip codes with the greatest proportion of delinquency referrals were identified as the target neighborhoods to be used by prevention providers in administering services. The DJJ later modified the approach to target the top 10 to12 zip codes17 and additionally, those zip codes representing up to 50% of the cumulative percentage of delinquency referrals in the county. At the same time, RFP and contract language was amended to require that between 50% and 70% of youth served by prevention providers in their service area, be youth most likely to become chronic offenders and who reside in the DJJ identified targeted zip code neighborhoods. The current standard requires that at least 70% of youth served by prevention providers reside in a targeted zip code area. This targeted percentage has varied in the past for different prevention providers given that program target populations and treatment approaches have varied.
In order to produce the “hot spots” of delinquent referrals, DJJ Bureau of Data and Research staff use software called CrimeStat. CrimeStat is a spatial statistics program for the analysis of crime incident locations, developed by Ned Levine & Associates under grants from the National Institute of Justice (grants 1997-IJ-CX-0040 and 1999-IJ-CX-0044). The program is Windows-based and interfaces with most desktop GIS programs. The purpose of the software is to provide law enforcement and criminal justice agencies with user-friendly statistical tools for mapping their data and service allocation.18
17 Note, not all counties have 10 to 12 zip codes and this requirement was applied where applicable. 18 The National Institute of Justice estimates that a little over one-third of law enforcement agencies with 100 or more sworn officers are using some form of computerized crime mapping; three percent of smaller police departments are estimated to use these tracking techniques. CrimeStat is currently used by many police departments around the country as well as by researchers and other criminal/juvenile justice agencies.
Justice Research Center 15
Incident locations (in DJJ’s case, delinquency referrals) are input into CrimeStat in “*.dbf” or ASCII formats using either spherical or projected coordinates. Various spatial statistics are calculated and graphical objects can be produced in ArcView, MapInfo, Atlas*GISTM, Surfer for Windows and ArcView Spatial Analyst.19
CrimeStat is organized into four sections and corresponding subsections:
1. Data Setup
a. Primary file - This is a file of incident or point locations with X and Y coordinates. The coordinate system can be either spherical (latitude/longitude) or projected. Intensity and weight values are allowed. Each incident can have an associated time value.
b. Secondary file - This is an associated file of incident or point locations with X and Y coordinates. The coordinate system has to be the same as the primary file. Intensity and weight values are allowed. The secondary file is used for comparison with the primary file in the risk-adjusted nearest neighbor clustering routine and the duel kernel interpolation.
c. Reference file - This is a grid file that overlays the study area. Normally, it is a regular grid, though irregular ones can be imported. CrimeStat can generate the grid if given the X and Y coordinates for the lower-left and upper-right corners.
d. Measurement parameters - This page identifies the type of distance measurement (direct or indirect) to be used and specifies parameters for the area of the study region and the length of the street network.
2. Spatial Description
a. Spatial distribution - Statistics for describing the spatial distribution of incidents, such as the mean center, center of minimum distance, standard deviational ellipse, Moran's I spatial autocorrelation index, or directional mean.
b. Distance analysis - Statistics for describing properties of distances between incidents including nearest neighbor analysis, linear nearest neighbor analysis, and Ripley's K statistic.
c. 'Hot spot' analysis I - Routines for conducting 'hot spot' analysis including the mode, the fuzzy mode, hierarchical nearest neighbor clustering, and risk-adjusted nearest neighbor hierarchical clustering.
19 Levine, N. (2002). CrimeStat II: A Spatial Statistics Program for the Analysis of Crime Incident Locations (version 2.0). Houston, TX: Ned Levine & Assoc. and Washington, DC: National Institute of Justice. Levine, N. (1996). "Spatial Statistics and GIS: Software Tools to Quantify Spatial Patterns." Journal of the American Planning Association. 62(3): 381-392. Levine, N., Kim, K.E., and Nitz, L.H. (1995). "Spatial Analysis of Honolulu Motor Vehicle Crashes: Spatial Patterns." Accident Analysis & Prevention. 27(5): 663-674.

16 Justice Research Center
d. 'Hot spot' analysis II - More routines for conducting hot spot analysis including the Spatial and Temporal Analysis of Crime (STAC), K-means clustering, and Anselin's local Moran statistics.
3. Spatial Modeling
a. Interpolation - A single-variable kernel density estimation routine for producing a surface or contour estimate of the density of incidents (e.g., burglaries) and a dual-variable kernel density estimation routine for comparing the density of incidents to the density of an underlying baseline (e.g., burglaries relative to the number of households).
b. Journey to crime analysis - A criminal justice method for estimating the likely location of a serial offender given the distribution of incidents and a model for travel distance. The routine allows the user to estimate a travel model with a calibration file and apply it to the serial events. It can be used to identify an optimal central location given the distribution of 'points' and assumptions about travel behavior.
c. Space-time analysis - A set of tools for analyzing clustering in time and in space. These include the Knox and Mantel indices, which look for the relationship between time and space, and the Correlated Walk Analysis module, which analyzes and predicts the behavior of a serial offender.
4. Options
a. Parameters can be saved and re-loaded.
b. Tab colors can be changed.20
Targeting high-risk neighborhoods and populations is a complicated endeavor. There are a multitude of statistical techniques designed to identify 'hot spots.'21 Most programs/techniques use cluster analysis, which uses statistics analyses to group cases together into relatively coherent collections. All of the techniques depend on optimizing various statistical criteria, but differ in their methodology as well as in the criteria used for identification.22
In order to identify the “hot spots” of Florida’s delinquency referrals, the DJJ uses the Nearest Neighbor Hierarchical Clustering (Nnh) technique. Nnh identifies groups of
20 Levine, N. (2002). CrimeStat II: A Spatial Statistics Program for the Analysis of Crime Incident Locations (version 2.0). Houston, TX: Ned Levine & Associates and Washington, DC: National Institute of Justice. Levine, N. (1996). "Spatial Statistics and GIS: Software Tools to Quantify Spatial Patterns." Journal of the American Planning Association. 62(3): 381-392. Levine, N., Kim, K.E., and Nitz, L.H. (1995). "Spatial Analysis of Honolulu Motor Vehicle Crashes: Spatial Patterns." Accident Analysis & Prevention. 27(5): 663-674. 21 Ibid. Everitt, 1974. 22 Levine, N. (2002). CrimeStat II: A Spatial Statistics Program for the Analysis of Crime Incident Locations (version 2.0). Houston, TX: Ned Levine & Associates and Washington, DC: National Institute of Justice.
Justice Research Center 17
incidents that are in close proximity spatially. It is a hierarchical clustering routine that groups points together on the basis of a criterion (delinquency referrals) and proceeds to then cluster these groups together. The CrimeStat Nnh routine uses a nearest neighbor method that defines a threshold distance (the mean distance between all clusters) and compares the threshold to the distances for all pairs of points. Only points that are closer to one or more other points than the threshold distance are selected for clustering. In addition, the user can specify a minimum number of points to be included in a cluster. Only points that fit both criteria, closer than the threshold and belonging to a group having the minimum number of points, are clustered at the first level (first-order clusters).
The routine then conducts subsequent clustering to produce a hierarchy of clusters. The first-order clusters are themselves clustered into second-order clusters. Again, only clusters that are spatially closer than a threshold distance (calculated anew for the second level) are included. The second-order clusters, in turn, are clustered into third-order clusters, and this re-clustering process is continued until no more clustering is possible, either all clusters converge into a single cluster or, more likely, the clustering criteria fail.
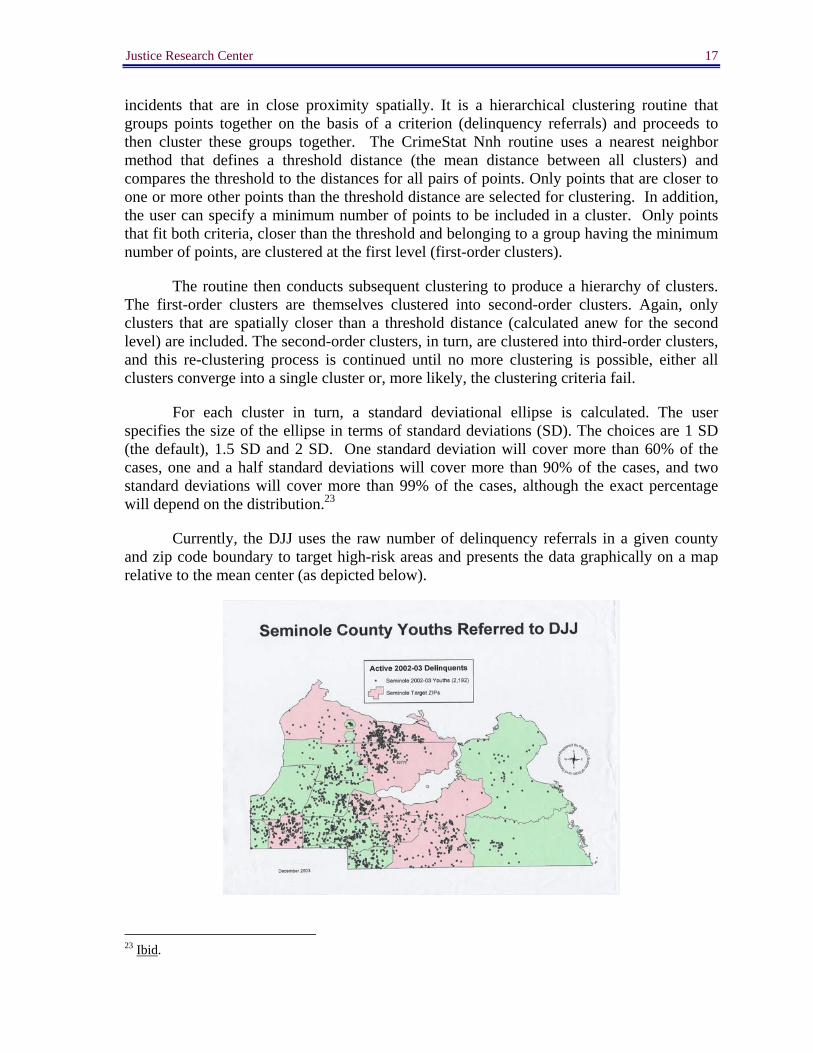
For each cluster in turn, a standard deviational ellipse is calculated. The user specifies the size of the ellipse in terms of standard deviations (SD). The choices are 1 SD (the default), 1.5 SD and 2 SD. One standard deviation will cover more than 60% of the cases, one and a half standard deviations will cover more than 90% of the cases, and two standard deviations will cover more than 99% of the cases, although the exact percentage will depend on the distribution.23
Currently, the DJJ uses the raw number of delinquency referrals in a given county and zip code boundary to target high-risk areas and presents the data graphically on a map relative to the mean center (as depicted below).
23 Ibid.
18 Justice Research Center
Identification and Application Procedures
The current DJJ prevention geo-mapping design involves two primary steps, identification and application. The identification methodology entails:
1. Geographic boundaries defined by Florida’s official zip codes;
2. Geographic boundaries defined by Florida’s 67 counties; and
3. Incident points representing delinquency referral frequencies.
The application methodology entails:
1. Targeting zip codes with at least 50% of the cumulative total of delinquency referrals in a given county; and
2. Service allocation such that 70% of the youth served by prevention providers should exhibit at least three of five characteristics: the four 8% Solution risk domains and residence within one of the “high-risk” zip codes; and
3. Graphical clustering of incident points on the basis of the mean center.
The use of geo-mapping techniques in administering delinquency prevention services in Florida is innovative, and its efficacy is firmly grounded in empirically-based research. The key remaining question is whether the identification and application procedures used by the DJJ are sound. For the targeting procedures to be sound, they should fulfill their intended purpose and goals. As was stated from the outset, the primary objective of the DJJ prevention geo-mapping is to target high-risk communities and the delinquent peer cultures within these communities that predispose residents to involvement in delinquent and criminal activity; the notion being that by targeting the areas most in need of services, scarce resources are efficiently and effectively used to reduce recidivism.
Justice Research Center 19
Targeting High-Risk Youth
The high-risk target population is defined by DJJ as youth 15 years of age or younger at the time of referral24 who exhibit three of the four 8% Solution characteristics: significant family troubles, significant school troubles, drug/alcohol use, and pre-delinquent behavior. The current geo-mapping process used by the DJJ, plots the raw number of delinquency referrals in a given county and clusters the data to identify those zip codes in each county with the greatest frequency of referrals. One of the problems with this procedure is the assumption that the so-called “high-risk” zip codes or neighborhoods, in fact contain “high-risk” youth. It is possible that while zip code 32641 in Gainesville may have the greatest number of delinquency referrals in Alachua county, that the youths who reside in this zip code do not in fact exhibit three of the four 8% Solution criteria. Making an inference about individual-level risk factors based on aggregate group data can result in what is referred to as the ecological fallacy.25 Until recently, the DJJ did not have automated risk factor data on prevention youth. This information is now available via JJIS Web. It is therefore possible to examine whether true high-risk youth (youth with three of the four risk factors) are located in the DJJ officially-targeted zip codes.
Given the methodological possibility of violating the ecological fallacy in targeting high-risk neighborhoods, it is recommended that the criteria used to geo-map delinquency events be amended. Currently, all delinquency referrals are plotted by zip code for each county in mapping the high-risk zones. This raises a number of issues that should be examined.
Raw Numbers Versus Rates
Is it a valid procedure to use raw numbers of delinquency referrals, as opposed to rates which inherently account for population differences between counties? While raw frequencies are typically inferior to proportions, percentages and rates, in this instance, the way DJJ identifies hot spots takes into account population differences by virtue of ranking within zip codes, which are in large part created by the U.S. Postal Service on the basis of geographic population. Using raw numbers over rates in this case is more an issue of 24 The age criterion is different for various prevention providers. Some providers are required contractually to target youth 15 years of age and younger, while other providers target youth 17 years of age and younger. This criterion is based upon the research literature which has consistently found that the youth who begin their delinquent careers at an earlier age are at increased risk for becoming chronic offenders. Typically researchers set the cut-off year at 13 years of age, following Marvin Wolfgang’s cohort studies. The DJJ has generally used the cut-off year of 15 years of age and younger. Ideally, the DJJ should uniformly apply this criterion to all prevention providers and likewise, as suggested earlier, an analysis of Florida’s prevention youth should be conducted to identify the cut-off age that is the most significant predictor of chronic and serious offending (i.e., assess whether the 8% Solution age criterion identified in California’s probation cohort is the same in Florida). However, in practice, situational factors associated with variations in prevention program objectives and services impact program allocation. For example, more than half of the referrals to the Florida Network prevention program are from law enforcement and as a result approximately a third of youth served are 16 or 17 years of age. The PACE School for Girls provides educational services including GED preparation, which requires participants to meet certain age requirements (16 years or older). Given programmatic differences such as these, the DJJ targeting approach must necessarily accommodate these programmatic differences while adhering to the tenets of research-based, risk-driven service allocation. 25 Babbie, E.R. (2004). The Practice of Social Practice. Belmont, CA: Wadsworth Thomson Learning.
20 Justice Research Center
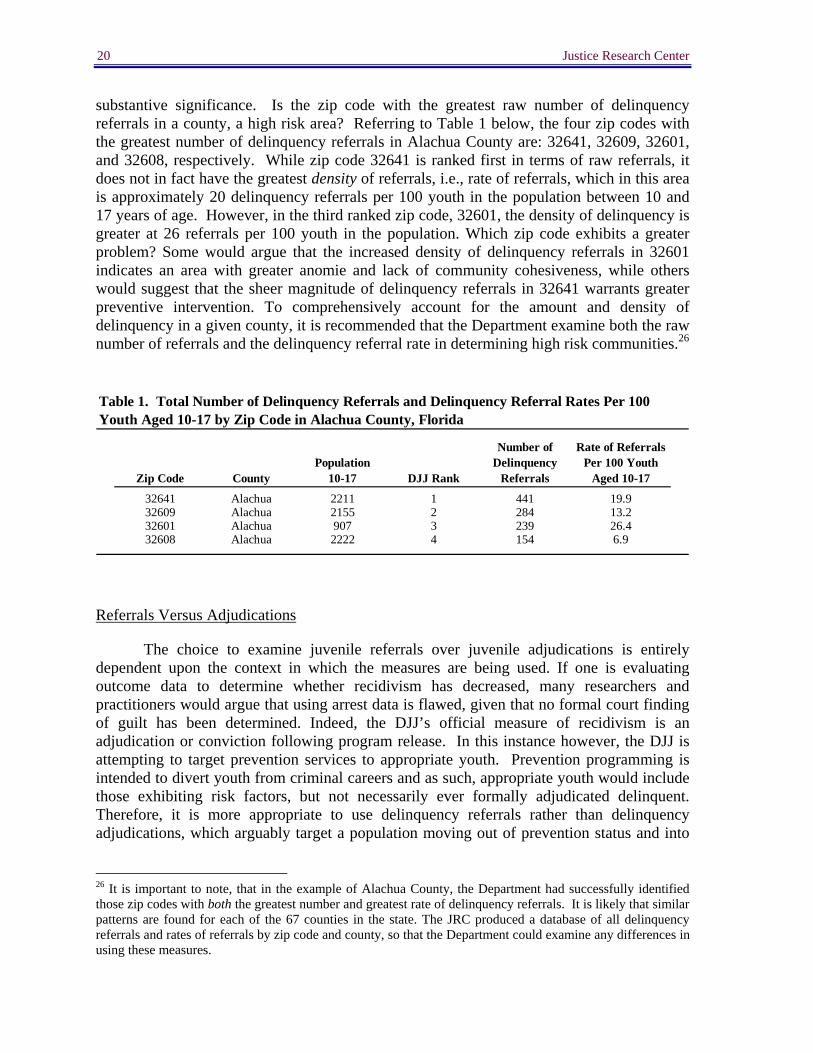
substantive significance. Is the zip code with the greatest raw number of delinquency referrals in a county, a high risk area? Referring to Table 1 below, the four zip codes with the greatest number of delinquency referrals in Alachua County are: 32641, 32609, 32601, and 32608, respectively. While zip code 32641 is ranked first in terms of raw referrals, it does not in fact have the greatest density of referrals, i.e., rate of referrals, which in this area is approximately 20 delinquency referrals per 100 youth in the population between 10 and 17 years of age. However, in the third ranked zip code, 32601, the density of delinquency is greater at 26 referrals per 100 youth in the population. Which zip code exhibits a greater problem? Some would argue that the increased density of delinquency referrals in 32601 indicates an area with greater anomie and lack of community cohesiveness, while others would suggest that the sheer magnitude of delinquency referrals in 32641 warrants greater preventive intervention. To comprehensively account for the amount and density of delinquency in a given county, it is recommended that the Department examine both the raw number of referrals and the delinquency referral rate in determining high risk communities.26
Zip Code CountyPopulation
10-17 DJJ Rank
Number of Delinquency
Referrals
Rate of Referrals Per 100 Youth
Aged 10-17
32641 Alachua 2211 1 441 19.932609 Alachua 2155 2 284 13.232601 Alachua 907 3 239 26.432608 Alachua 2222 4 154 6.9
Table 1. Total Number of Delinquency Referrals and Delinquency Referral Rates Per 100 Youth Aged 10-17 by Zip Code in Alachua County, Florida
Referrals Versus Adjudications
The choice to examine juvenile referrals over juvenile adjudications is entirely dependent upon the context in which the measures are being used. If one is evaluating outcome data to determine whether recidivism has decreased, many researchers and practitioners would argue that using arrest data is flawed, given that no formal court finding of guilt has been determined. Indeed, the DJJ’s official measure of recidivism is an adjudication or conviction following program release. In this instance however, the DJJ is attempting to target prevention services to appropriate youth. Prevention programming is intended to divert youth from criminal careers and as such, appropriate youth would include those exhibiting risk factors, but not necessarily ever formally adjudicated delinquent. Therefore, it is more appropriate to use delinquency referrals rather than delinquency adjudications, which arguably target a population moving out of prevention status and into
26 It is important to note, that in the example of Alachua County, the Department had successfully identified those zip codes with both the greatest number and greatest rate of delinquency referrals. It is likely that similar patterns are found for each of the 67 counties in the state. The JRC produced a database of all delinquency referrals and rates of referrals by zip code and county, so that the Department could examine any differences in using these measures.
Justice Research Center 21
corrective status. (See the Graphical Representation of Delinquency Hot Spots section below for a discussion on the use of referrals versus youths).
Delinquency Referrals Versus High-Risk Youth
Is it valid to plot only delinquency referrals? As noted above, it is recommended that the DJJ geo-mapping process be amended to incorporate risk data that are available for prevention youth. While record-keeping differs from provider to provider, all prevention programs are required to enter risk factor data into JJIS for youth entering the program.27 Unfortunately, these risk factors are not uniformly available for all youth processed through delinquency intake. It is recommended that the Department integrate similar risk factors into the JJIS intake process for all youth referred, not just prevention youth. Greater specificity increases the likelihood that the right youth are being targeted and correspondingly reduces the complexity of tracking appropriate youth for prevention providers. Instead of having to document that they have both served a given percentage of the high risk youth (with at least three of the four 8% Solution criteria) and provided those services within a given proportion of “high-risk” zip codes, DJJ should incorporate all available risk factor data that significantly predicts recidivism among Florida’s prevention youth into its geo-mapping procedure. For example, high-risk youth become the incidence points while density values representing total delinquency referrals could be depicted using high/low shading within each county and by zip code. The coalescing of the incident and density values then provides an effective mechanism for targeting those areas of the state genuinely in need of prevention programming.28
Amending the geo-mapping process in this way would also deal with another potential problem posed by the current approach. The way high-risk zones are currently targeted, prevention providers are requested to serve youth in the zip codes with the greatest number of delinquency referrals in each county. As such, it is possible that a provider serving the 2nd judicial circuit catchment area, would be asked to target Leon county youth residing in the 32310 zip code and to target Franklin county youth residing in the 32320 zip code, as essentially equal cohorts. It is possible, however, that these cohorts are very different and while one may be comprised predominately of youth with numerous risk factors, the other may not. If the catchment areas served by prevention providers typically extend to judicial circuits, it might benefit the DJJ to produce maps reflecting high-risk zones within each of Florida’s 20 judicial circuits. This too would minimize the likelihood of overextending service allocation in counties containing predominately low-risk youth.
27 The JRC interviewed a number of prevention providers in conducting this evaluation and determined that many are maintaining additional data on all youth referred to their program, not just those formally admitted to the program. This data source provides DJJ with additional risk-factor information that can be utilized in determining high-risk youth and neighborhoods. 28 It is important to note that while risk factor data are not uniformly available on all delinquency referrals, the DJJ still adheres to a risk-driven targeting methodology in allocating prevention funding to the counties in Florida. In particular, six criterion are considered: 1) county child abuse hotline calls, 2) out-of-school suspensions and expulsions by county using Department of Education data, 3) Florida Youth Initiative Survey community-level indicators of substance abuse, 4) urban density of county, 5) delinquent peer cultures as measures in total delinquency referrals by county, and 6) county population of youth 10-17 years of age.
22 Justice Research Center
Another approach that may more effectively achieve the goals of the geo-mapping process, would be to examine specific types of delinquency referrals, as opposed to mapping all referrals in a given geographic boundary. The research literature has consistently indicated that property offenders are more likely to become chronic delinquents than are other offenders, including those committing crimes against persons.29 As such, DJJ should examine the dispersion of property delinquency referrals by geographic locale to determine whether mapping specified offense types provides a more effective method of allocating prevention services.
In addition to targeting high-risk youth, it is also important to serve youth who are amenable and suitable for prevention programming. Mapping all delinquency referrals necessarily includes those youth who are well beyond the prevention stage and firmly entrenched in the juvenile justice system. It may be more effective to map only first time offenders exhibiting three of the four risk factors, to further delineate the appropriate prevention program population. A detailed Excel pivot table containing the percentage of all first-time offenders by zip code and county was prepared for this report and given to DJJ for use in targeting youth for services.
Targeting High-Risk Neighborhoods
DJJ defines high-risk neighborhoods as: “…those neighborhoods in which a disproportionately high percentage of delinquent youth reside and are identified by zip code number.”30 While issues of individual-level risk factors were discussed above, it is also important to consider methodological issues related to identification of delinquency hot spots. Are the DJJ defined high-risk areas really capturing communities that are crime prone and exhibit macro-level indicators of social disorganization? Currently, a national multi-site longitudinal study is being undertaken as part of the OJJDP Program of Research on the Causes and Correlates of Delinquency, consisting of the Denver Youth Survey, the Rochester Youth Development Study, and the Pittsburgh Youth Study.31 The sample selection processes employed in these studies have included incorporation of community hot spots through social ecological and social disorganization assessments. The DJJ should consider a similar path in comprehensively targeting appropriate youth and communities for service. Such assessments would consider macro-level indicators such as median level of income, percentage of female-headed households, average household size, community mobility trends, number of liquor and adult establishments, and unemployment rates. It is
29 Wolfgang, M., Thornberry, T., and Figlio, R., eds. (1987). From Boy to Man, From Delinquency to Crime. Chicago, IL: University of Chicago Press. Tracy, P. and Kempf-Leonard, Kimberly (1996). Continuity and Discontinuity in Criminal Careers. New York: Plenum Press. Snyder, H. (1988). Court Careers of Juvenile Offenders. Washington, DC: Office of Juvenile Justice and Delinquency Prevention. West, D. and Farrington, D. (1977). The Delinquent Way of Life. London: Heinemann. Tracy, P., Wolfgang, M.E., & Figlio, R.M. (1995). "Delinquency in Two Birth Cohorts." Cited in Howell, J.C. (Ed.), Guide for Implementing the Comprehensive Strategy for Serious, Violent, and Chronic Juvenile Offenders. Washington, DC: Office of Juvenile Justice and Delinquency Prevention. 30 This language is set forth in prevention program contracts and requests for proposals. 31 See the OJJDP-funded Pittsburgh Youth Study web site detailing the three research analyses at: http://www.wpic.pitt.edu/research/famhist/PYS.htm. Browning, K. and Loeber, R. (1999). “Highlights of findings from the Pittsburgh Youth Study.” OJJDP Fact Sheet; Browning, K., Huizinga, D., Loeber, R. and Thornberry, T.P. (1999). “Causes and Correlates of Delinquency Program.” OJJDP Fact Sheet.
Justice Research Center 23
possible to obtain such data for zip codes in Florida by county via the United States Census web site using the American FactFinder tool. The following directions detail how to access Florida’s zip code data by county.
Maps: To obtain lists and maps of all zip code tabulation areas within a county and state, follow these steps (maps are also accessible from the Economic Census Zip Code Statistics, http://www.census.gov/epcd/ec97zip/us/US00000.htm):
1. At www.census.gov, select "American FactFinder" in the left column.
2. In the lefthand column, select the "Data Sets" button.
3. On the Decennial Census page,
a. In the righthand column select "Detailed Tables."
4. On the Select Geography page,
a. Select the "geo within geo" tab.
b. In the "Show me all" box, pick "5-digit Zip Code Tabulation Areas" (ZCTA).
c. Under "That are", either leave at "fully or partially contained" or change to "fully contained" and specify "county" after "within."
d. Select the state.
e. Select the county.
f. Select "All 5-digit ZIP Code Tabulation Areas" and click the "Add" button, but make a list of the specific Zip Codes shown in red with an asterisk in the selection boxes.
5. On the Select Tables page
a. Select table P1 for the total population, or any other desired datasets, and click "Add"
b. Click "Show Result"
6. Only 10 ZCTAs are shown on the screen. To work with them all at once, download the data directly from the U.S. Census Bureau.32
In addition to broadening the community-level indicators in geo-mapping high-risk zones, it is also important to consider a number of methodological issues potentially impacting the efficacy of the DJJ zip code targeting process. 32 These instructions were created by the U.S. Census Bureau. See www.census.gov for further detail.
24 Justice Research Center
Zip Codes Versus Other Geographic Markers
The DJJ currently identifies high-risk areas through zip code boundaries.33 The U.S. Census defines zip codes as: a Zone Improvement Plan (ZIP) Code which is the numerical code assigned by the U.S. Postal Service to designate a local area or entity for the delivery of mail. Zip codes may consist of 5, 7, 9, or 11 digits, and refer to a street section, a collection of streets, an establishment, a structure, or a group of post office boxes.34 As U.S. Census researchers note, however, zip codes are designated at the convenience of the Postal Service and may change from time to time. This can result in difficulties for prevention providers over time if target areas change appreciably. More importantly, additional community-level indicators of crime and delinquency are not as readily available as are data delineated by U.S. Census tract.35 The Census Bureau has now successfully defined 100% of the United States into census tracts and census blocks. Given the continuity in this measure over time, the DJJ may consider targeting high-risk zones through census tracts rather than U.S. postal zip codes. The use of census tracts, however, presents issues with boundary identification. It is easier to clearly define targeted neighborhoods through zip codes than it is for providers to target census tracts. However, the U.S. Census Bureau has developed a software package, LandView5, that contains maps based on the Census 2000 for all states. These maps show both streets and Census 2000 legal and statistical areas (including Census 2000 Urban/Rural delineations). The LandView5 software can facilitate the use of census tracts in targeting high-risk communities.36
Graphical Representation of Delinquency Hot Spots
A final issue surrounds the efficacy of the use of various graphical mapping representations to identify high-risk neighborhoods (i.e., the mean center, center of minimum distance, or standard deviational ellipse). The current use of the mean center may not result in the most effective identification or presentation of delinquency hot spots. The statistical mean is a measure very much impacted by extreme values or outliers. It is possible that in some judicial circuits, prosecutors and law enforcement officers may be more inclined than officials in other jurisdictions to file multiple referrals for a single delinquency event involving one youth.37 If referrals are not unduplicated by offense incident prior to geo-mapping their location, it might appear that particular areas have a high frequency of delinquent events, when in fact, the map points represent only a few distinct incidents and youths. These clusters or outliers will positively or negatively skew the mean center in a way that does not represent the majority of the plotted data. High-risk zones mapped on the basis of the mean center may be more a representation of local legal practices than true delinquency hot spots. 33 Refer to the earlier discussion of judicial circuits for other geographic markers that may be used to define high-risk zones. 34 See help.econ.census.gov/econhelp/glossary/. 35 Census tracts are defined as small geographical areas established by local committees and approved by the U.S. Census Bureau, containing a population segment with relatively uniform economic and social characteristics and clearly identifiable boundaries averaging approximately 1,200 households (www.nmoa.org/Library/glossae.htm). 36 See http://www.census.gov/geo/landview/lv5/lv5.html. 37 A recent example of this occurred when a youth was charged in one day with 48 referrals involving the same offense incident.
Justice Research Center 25
An alternative measure of dispersion, the standard deviational ellipse, while a superior measure to the mean, presents interpretation and application problems for prevention providers trying to target services. While the center of minimum distance will not be as susceptible to the effects of extreme values, it does not improve the Department’s current targeting procedures appreciably. It is therefore recommended that the DJJ refrain from plotting the standard deviational ellipse and continue to enumerate boundaries on the basis of zip codes or census tracts relative to counties or judicial circuits, as reviewed above.
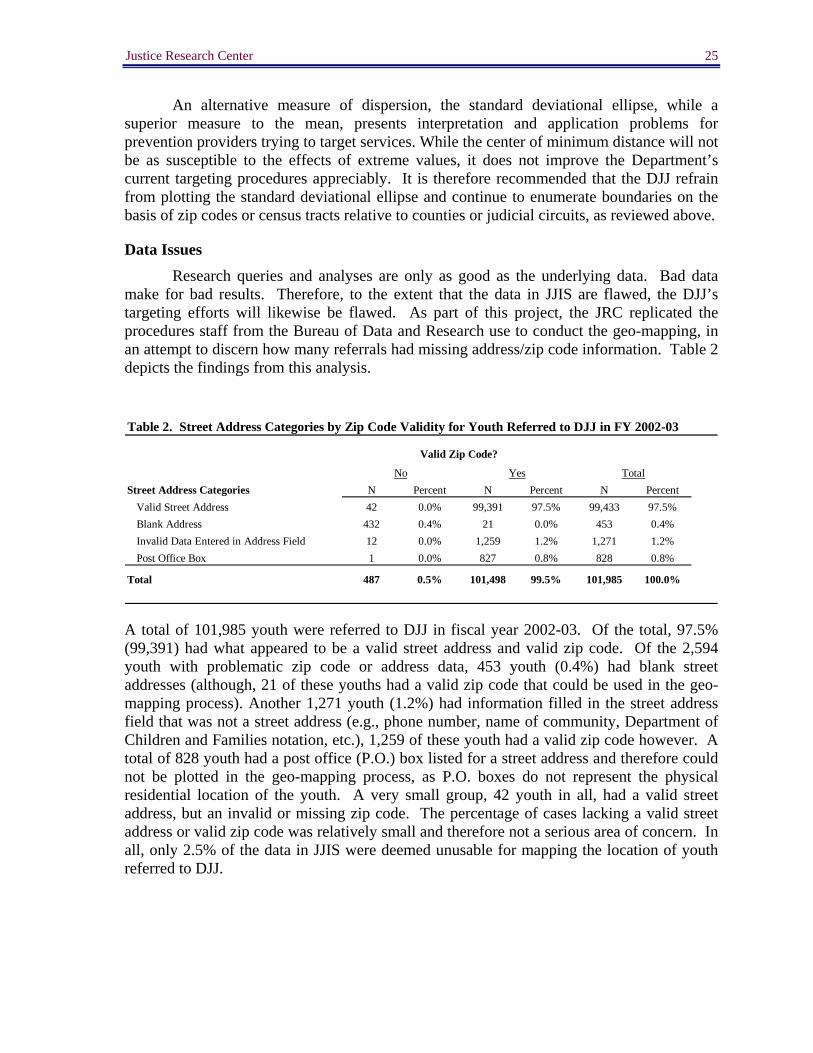
Data Issues Research queries and analyses are only as good as the underlying data. Bad data make for bad results. Therefore, to the extent that the data in JJIS are flawed, the DJJ’s targeting efforts will likewise be flawed. As part of this project, the JRC replicated the procedures staff from the Bureau of Data and Research use to conduct the geo-mapping, in an attempt to discern how many referrals had missing address/zip code information. Table 2 depicts the findings from this analysis.
Table 2. Street Address Categories by Zip Code Validity for Youth Referred to DJJ in FY 2002-03
Street Address Categories N Percent N Percent N PercentValid Street Address 42 0.0% 99,391 97.5% 99,433 97.5%Blank Address 432 0.4% 21 0.0% 453 0.4%Invalid Data Entered in Address Field 12 0.0% 1,259 1.2% 1,271 1.2%Post Office Box 1 0.0% 827 0.8% 828 0.8%
Total 487 0.5% 101,498 99.5% 101,985 100.0%
Valid Zip Code?
No Yes Total
A total of 101,985 youth were referred to DJJ in fiscal year 2002-03. Of the total, 97.5% (99,391) had what appeared to be a valid street address and valid zip code. Of the 2,594 youth with problematic zip code or address data, 453 youth (0.4%) had blank street addresses (although, 21 of these youths had a valid zip code that could be used in the geo-mapping process). Another 1,271 youth (1.2%) had information filled in the street address field that was not a street address (e.g., phone number, name of community, Department of Children and Families notation, etc.), 1,259 of these youth had a valid zip code however. A total of 828 youth had a post office (P.O.) box listed for a street address and therefore could not be plotted in the geo-mapping process, as P.O. boxes do not represent the physical residential location of the youth. A very small group, 42 youth in all, had a valid street address, but an invalid or missing zip code. The percentage of cases lacking a valid street address or valid zip code was relatively small and therefore not a serious area of concern. In all, only 2.5% of the data in JJIS were deemed unusable for mapping the location of youth referred to DJJ.
26 Justice Research Center
Discussion and Conclusion
The geo-mapping approach to targeting prevention services described in this report has been in place in the Department of Juvenile Justice for the last three years. The JRC was contracted to assess its validity. This report presents the evaluation results and applies only to contracted general revenue and state grant-funded prevention program allocation. The DJJ Prevention and Victim Services’ geo-mapping methods and application are sound and firmly based upon the research literature on delinquency, risk and protective factors, and geo-mapping hot spots. This statewide approach to targeting delinquency prevention services is extremely innovative, as the JRC knows of no other state employing such system-wide evidence-based methods. Not only does the DJJ conduct geo-mapping, an innovative step in itself, but it uses this technique to then inform contractual and RFP language with prevention providers. Therefore, DJJ Prevention and Victim Services’ branch diligently strives to serve appropriate populations and follows through with compliance procedures to ensure fidelity to the process, an outstanding example of true evidence-based delinquency services.
Targeting the youth and communities most in need of prevention services has a number of potential beneficial outcomes. First, it can result in cost savings by utilizing limited resources where they are needed most. Second, it potentially averts ‘net widening’ which occurs when low risk youth are targeted for delinquency programs when they could have been more effectively served in an informal manner. Third, juvenile justice efforts often focus only on the offender and fail to consider underlying community problems and risk factors. The DJJ geo-mapping approach has the capacity to take these factors into account by allocating services in neighborhoods with social conditions predisposing its residents to involvement with crime and delinquency. In noting DJJ’s commitment to crime control and prevention, citizens may be inspired to become involved in these efforts themselves, ultimately promoting community cohesiveness, a known correlate of reducing crime rates.
Policy Recommendations
In conducting this evaluation of the DJJ’s approach to geo-mapping and targeting high-risk youth and communities, a number of general and specific policy recommendations are offered:
1. Mapping systems should incorporate as much data as possible to help in determining resource allocations. While the number of youth referred is a good start, poverty levels, low educational performance, lack of parental supervision, median age of youths, have all been shown in the research literature to be associated with high delinquency rates and therefore inclusion of these additional data would improve the ability to target the youth most in need of services.
2. The mapping system should be dynamic. Although, major changes in communities are usually slow to occur, it does happen. What may be a high delinquent area at one point in time could change, as could the social ecological conditions of the area which in turn impact crime and delinquency rates. It is recommended that the
Justice Research Center 27
Department annually examine changes in community and youth risk factors as well as zip code boundary changes. This review should also consider substantive differences between and changes to prevention programs and services that necessarily impact the determination of targeting percentages and targeting methodology in general.
3. It is important to share mapping data with other organizations involved in improving communities. Geo-mapping is only effective if it conveys the incidence and contextual data in a straightforward, easily interpretable format, and to those audiences who can most benefit from the information.
4. Mapping software is often complicated and harder to learn than most computer applications. Communities and agencies typically rely on a small number of employees or volunteers interacting with the software. However, when these employees leave, the organizations loose the expertise and mapping ability. Currently, DJJ has only one employee with the knowledge and experience to conduct the Department’s geo-mapping analyses. It is recommended that DJJ expand its capacity in this area and hire and/or train more employees in the use of geo-mapping software. Another suggestion is to develop and implement a customized and automated application module that would easily enable those unfamiliar with mapping software to create high-risk zone maps.38
5. Ensuring data quality is essential to effective geo-mapping procedures. If data are not accurate or timely, the analysis will be less valuable. DJJ has a number of methods in place to ensure data accuracy including regionally assigned Data Integrity Officers, monthly data exception reports, and a monthly score card which is followed by juvenile probation officers. It is critical that these safeguards remain in place and be monitored by those conducting the Department’s geo-mapping to ensure that the demographic and delinquency data underlying the maps are accurate.
6. A prevention program accountability measures model should be developed to identify the unique risk and protective factors which significantly predict recidivism among Florida’s population of at-risk youth. In so doing, rigorous empirical methods should be employed (e.g., experimental or quasi-experimental design).
7. The DJJ should conduct a comprehensive outcome evaluation of the efficacy of its geo-mapping of prevention services to determine whether recidivism has been reduced in the targeted hot spots and to assess the degree to which crime displacement has occurred, if at all.
38 Levine, N. (2002). CrimeStat II: A Spatial Statistics Program for the Analysis of Crime Incident Locations (version 2.0). Houston, TX: Ned Levine & Associates and Washington, DC: National Institute of Justice. Levine, N. (1996). "Spatial Statistics and GIS: Software Tools to Quantify Spatial Patterns." Journal of the American Planning Association. 62(3): 381-392. Levine, N., Kim, K.E., and Nitz, L.H. (1995). "Spatial Analysis of Honolulu Motor Vehicle Crashes: Spatial Patterns." Accident Analysis & Prevention. 27(5): 663-674.
28 Justice Research Center
8. The DJJ should maintain uniformity in its application of the geo-mapping process such that all prevention providers are held to the same standards. For example, if the Department is going to require that at least 70% of the youth served reside in a high-risk community, then it should establish this requirement uniformly for all prevention providers. It is further suggested that the DJJ maintain fidelity to the evidence-based research on the correlation between age and recidivism. Specifically, given the research literature documenting that early onset of delinquency (e.g., 13 years or younger) is associated with chronic offending, the requirement to target younger youth should be applied uniformly to all providers.
9. The DJJ should utilize integrated maps in its approach to targeting high-risk youth and communities. This mapping technique plots location incident points as well as density values on specific variables (e.g., community unemployment rates) and therefore provides greater context to the mapped delinquency data.
10. The DJJ should continue using delinquency referrals, as opposed to delinquency adjudications in mapping crime incident points. However, referrals should be unduplicated by case/incident to avoid plotting misleading indicators that reflect local prosecutorial and law enforcement practices more so than actual delinquency patterns.
11. It is recommended that the FDJJ examine both the raw number of delinquency referrals and the rate of delinquency referrals (per 100 youth aged 10-17) in the population for each county by zip code, to adequately control for differences in geographical population and density of delinquency referrals.
12. The DJJ should consider expanding its mapping process by plotting delinquency referral rates by judicial circuit and/or prevention provider catchment area to facilitate the effective targeting of high-risk youth and communities.
13. It is suggested that the Department examine the efficacy of using census tracts in mapping delinquency referral rates. A criticism of using zip codes is the fact that the U.S. Postal Service regularly changes the geographical boundaries of zip codes, while census tracts boundaries are more static. The U.S. Census Bureau notes: “The geographic entities the Census Bureau uses to tabulate data by are relatively stable over time…. Census tracts are only defined every ten years. In contrast, U.S. Postal Service ZIP Codes are designed to meet the day-to-day operational needs of the U.S. Postal Service and tend to change more frequently than every ten years.”39 Given the ill-defined nature of zip code boundaries and the fact that electronic community-level indicators of crime and delinquency are more readily available by census tract than by zip code, it is recommended that the DJJ use census tracts to geo-map referral rates.
14. It is recommended that the DJJ consider a more targeted approach to its geo-mapping such that specific types of offending (first-time offenders and property offenders) be
39 http://www.census.gov/geo/www/tiger/tigermap.html. (2004).
Justice Research Center 29
mapped to better identify the youth most in need of (i.e., at high-risk) and amenable to prevention programming.
15. Perhaps the most significant recommendation is that the DJJ integrate the prevention risk factor data together with the zip code mapping of high-risk areas. Plotting all delinquency referrals for a given time period does not adequately identify high-risk youth and incorporates no macro-level indicators of crime. It is suggested that the DJJ geo-mapping methods be amended to incorporate both individual and community risk factor data in plotting delinquency hot spots. In so doing, the Department may avoid potentially committing the ecological fallacy by presuming that areas with a high concentration of delinquency referrals necessarily correspond to the effective targeting of individuals with at least three of four risk factors identified by Schumacher and Kurz in The 8% Solution.
______________________________________________