Embed Size (px)
Citation preview
ePubWU Institutional Repository
Nikolaus Franke and Eric von Hippel
Satisfying Heterogeneous User Needs via Innovation Toolkits: The Case ofApache Security Software
Article (Accepted for Publication)(Refereed)
Original Citation:
Franke, Nikolaus and von Hippel, Eric
(2003)
Satisfying Heterogeneous User Needs via Innovation Toolkits: The Case of Apache SecuritySoftware.
Research Policy, 32 (7).
pp. 1199-1215. ISSN 0048-7333
This version is available at: https://epub.wu.ac.at/3094/Available in ePubWU: May 2011
ePubWU, the institutional repository of the WU Vienna University of Economics and Business, isprovided by the University Library and the IT-Services. The aim is to enable open access to thescholarly output of the WU.
This document is the version accepted for publication and — in case of peer review — incorporatesreferee comments. It is a verbatim copy of the publisher version.
http://epub.wu.ac.at/
Satisfying Heterogeneous User Needs via Innovation Toolkits:
The Case of Apache Security Software
Nikolaus Franke* and Eric von Hippel**
March, 2002
Working Paper
A later version of this paper is published in:
Research Policy, 2003, 32, 1199-1215.
* Professor, Vienna University of Economics and Business Administration, Austria
**Professor, MIT Sloan School of Management, Cambridge, MA, USA
1
Satisfying Heterogeneous User Needs via Innovation Toolkits:
The Case of Apache Security Software
Nikolaus Franke and Eric von Hippel
January, 2002
ABSTRACT
User needs for a given product type can be quite heterogeneous. Segmenting the market
and providing solutions for average user needs in each segment is a partial answer that will
typically leave many dissatisfied – some seriously so. We hypothesize that providing users
with “toolkits for user innovation” to enable them to more easily design customized
products for themselves will increase user satisfaction under these conditions.
We test this hypothesis via an empirical study of Apache security software – “open
source” software that is designed to be modifiable by skilled users. We find that
heterogeneity of need is high, and that many Apache users are dissatisfied with standard
security functionality on offer. We also find that users creating their own software
modifications are significantly more satisfied than are non-innovating users. We conclude
by suggesting that the “toolkits for user innovation” approach to enhancing user
satisfaction might be generally applicable to markets characterized by heterogeneous user
needs.

2
Satisfying Heterogeneous User Needs via Innovation Toolkits:
The Case of Apache Security Software
1. Introduction
Customers for a given type of product or service can have needs that are quite
heterogeneous. Market researchers are of course aware of this and, when heterogeneity of need is
high, they may decide to divide a target market into several segments, each containing customers
with somewhat different needs. Then, they often create somewhat different products for each
segment, each intended to address the average customer need in that segment.
This approach to the problem of heterogeneity of need is helpful, but it typically falls well
short of offering each customer a product that is a precise fit to that firm or individual’s needs. This
is clearly illustrated by the outcomes of market segmentation studies using cluster analysis. After
segmentation, fully 50% of the total variation in customer or user need is typically left as
(unaddressed) within-segment variation (table 1). The importance to a customer of the difference
between a product designed for an average user and what a given firm or individual really wants will
of course vary. An “almost-right” basketball shoe may be reasonably acceptable to a weekend athlete
but at the same time totally unacceptable to a professional player.
The partial response to the true heterogeneity of customer need just described has historically
made good economic sense. From the manufacturer’s point of view, when it is costly to design,
produce and advertise products, it may only be profitable to identify and serve a few market
segments with products responsive to average within-segment needs. However, recent technological
advances have reduced the cost of designing and producing products for “markets of one.” As a
result it is now feasible to better satisfy customers with needs that deviate from the market segment
average.
In this study we propose that it will be more cost-effective to better serve heterogeneous
customer need by transferring the development of custom products to customers than it will be to

3
follow a more conventional approach and attempt to (greatly) increase the number of market
segments addressed by manufacturer-based innovators. We explore the possible effectiveness of this
strategy empirically via a study of user satisfactions with the security functions of Apache web server
software. Apache is a very successful “open source” server software product that is today used to
run 60% of all Internet websites. Open source software is designed to be freely modifiable by its
users.
In brief, the major findings of our empirical study begin with the determination that user
needs for Apache security functionality are in fact highly heterogeneous. Next, we find that many
Apache users are not fully satisfied by existing standard Apache security offerings. When we apply a
very conservative measure of willingness to pay (80% deflation of expressed willingness to pay), we
find that the average Apache user is willing to pay a considerable amount (over $5,000 per user and
over $160 mm in aggregate) to have their individual needs for the security functions of Apache met
to their total satisfaction.
An approach to better satisfying heterogeneous user need that is now being applied in a
number of markets involves providing users with “toolkits for user innovation” that allow users to
customize products for themselves. Apache software employs such a toolkits approach in that it is
“open source” software, designed to be modifiable by appropriately skilled users. Our sample of
respondents contains users that both do and do not modify standard Apache software to create a
better fit to their needs. When we compare responses from innovating and non-innovating users, we
find that users that modify the standard product report significantly higher satisfaction levels than
those that do not. We also find indications that innovations developed by users may benefit non-
innovators as well. In other words, the “toolkits” approach used by Apache does appear to be
effective in helping Apache users to improve the fit between a product and the heterogeneous needs
of individual users. Because the heterogeneity of needs in the Apache case is high but not
remarkably so when compared to other markets (table 1) we infer that there may be many more
markets where it makes sense to consider the toolkit approach.

4
In section 2 of this paper we provide a review of the literature on heterogeneity of user
needs, on the widespread user practice of modifying standard products to better suit individual
needs, and on the “toolkits for user innovation” approach that can make such modifications easier.
Next, in section 3 we describe our research sample and methods. We then present our findings in
section 4 and conclude with a discussion and suggestions for further research in section 5.
2. Review of the literature
2.1: Market segmentation and heterogeneity of user need
Market segmentation studies involve dividing markets into a relatively few segments, each
consisting of customers with relatively similar needs (Punj and Stewart 1983; Wind 1978; Wedel and
Kamakura 1999). Segmentation of markets via cluster analysis was pioneered in the early 1970’s by
Green and others (Green 1971, Green and Schaffer 1998), and quickly became very popular: over
400 articles on clustering techniques and their applications to market segmentation were published by
1990 (Dickson 1990).
Probably the most commonly used clustering technique is hierarchical clustering. Here cases
are grouped together stepwise, beginning from the two most similar (or even identical cases) until the
last fusion step in which the most different cases (or clusters) are merged. Determining an
appropriate number of clusters within a sample is done in different ways. The most common is to
examine the increase of squared error sums of each step, and generally view the optimal number of
clusters as having been reached when the plot shows a sudden “elbow” (Myers 1996).
Since this technique does not incorporate information on remaining within-cluster
heterogeneity, it can lead to solutions with a large amount of within-cluster variance. The so called
“cubic clustering criterion” (CCC) partially addresses this concern by measuring the within-cluster
homogeneity relative to the between cluster heterogeneity. It suggests choosing the number of
clusters where this value peaks (Milligan and Cooper 1985). However, this method appears to be
rarely used: Ketchen and Shook (1996) found it used in only 5 of 45 segmentation studies they
examined.
5
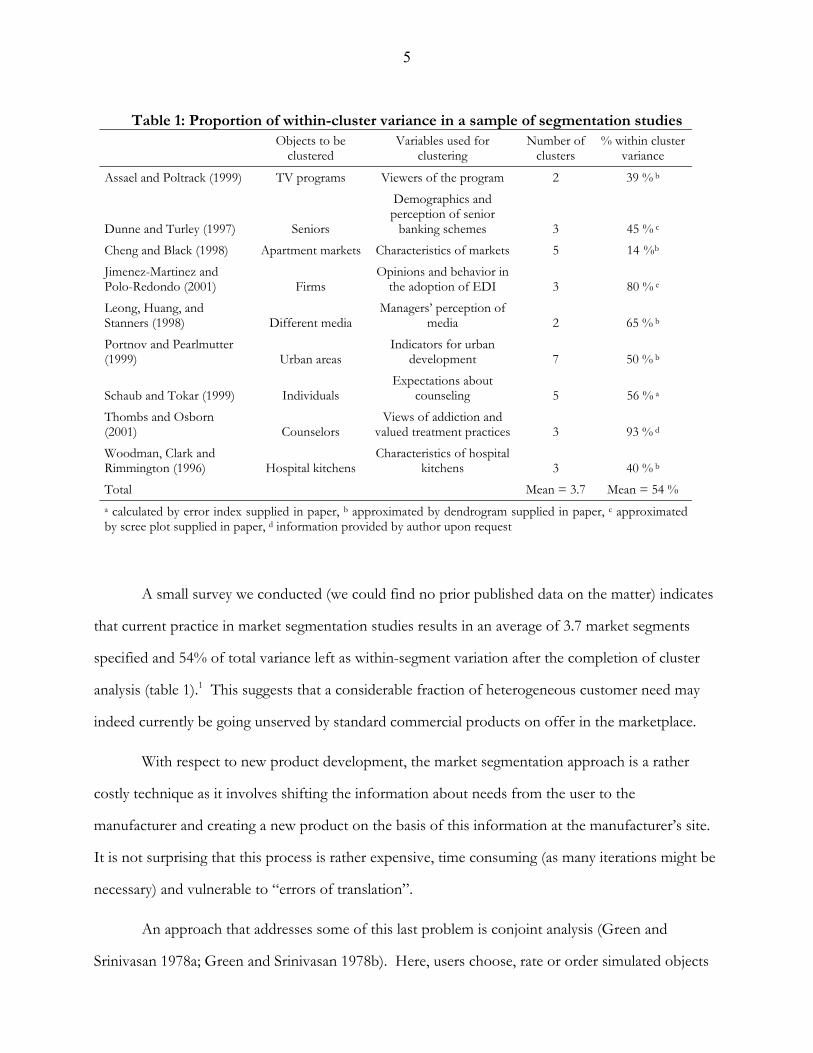
Table 1: Proportion of within-cluster variance in a sample of segmentation studies
Objects to be clustered
Variables used for clustering
Number of clusters
% within cluster variance
Assael and Poltrack (1999) TV programs Viewers of the program 2 39 % b
Dunne and Turley (1997)
Seniors
Demographics and perception of senior
banking schemes 3 45 % c Cheng and Black (1998) Apartment markets Characteristics of markets 5 14 %b Jimenez-Martinez and Polo-Redondo (2001)
Firms
Opinions and behavior in the adoption of EDI 3 80 % e
Leong, Huang, and Stanners (1998)
Different media
Managers’ perception of media 2 65 % b
Portnov and Pearlmutter (1999) Urban areas
Indicators for urban development 7 50 % b
Schaub and Tokar (1999)
Individuals Expectations about
counseling 5 56 % a Thombs and Osborn (2001)
Counselors
Views of addiction and valued treatment practices 3 93 % d
Woodman, Clark and Rimmington (1996)
Hospital kitchens
Characteristics of hospital kitchens 3 40 % b
Total Mean = 3.7 Mean = 54 % a calculated by error index supplied in paper, b approximated by dendrogram supplied in paper, c approximated by scree plot supplied in paper, d information provided by author upon request
A small survey we conducted (we could find no prior published data on the matter) indicates
that current practice in market segmentation studies results in an average of 3.7 market segments
specified and 54% of total variance left as within-segment variation after the completion of cluster
analysis (table 1).1 This suggests that a considerable fraction of heterogeneous customer need may
indeed currently be going unserved by standard commercial products on offer in the marketplace.
With respect to new product development, the market segmentation approach is a rather
costly technique as it involves shifting the information about needs from the user to the
manufacturer and creating a new product on the basis of this information at the manufacturer’s site.
It is not surprising that this process is rather expensive, time consuming (as many iterations might be
necessary) and vulnerable to “errors of translation”.
An approach that addresses some of this last problem is conjoint analysis (Green and
Srinivasan 1978a; Green and Srinivasan 1978b). Here, users choose, rate or order simulated objects

6
that are described by different factors (e.g. price, color, and size), each with different levels (e.g. color
red, blue, and green). From the answers of the respondent the specific utility of the factors and
levels are calculated and can be used as an improved input for market segmentation (Green and
Krieger 1991).
The key advantage of this approach (as compared to the traditional method of using ratings
of preference, attitudes, motives etc. as input for segmentation) is its proximity to the “real” decision
situation. Thus, the central merit of this approach is that the “error of translation” is reduced. The
high validity resulted in an increasing number of applications in new product development since its
beginnings in the 1970s. On the other hand, the major task of designing is still is on the
manufacturer’s side: the user only (passively) chooses from options the manufacturer provides. He is
not able to add a new element to the solution space preselected by the manufacturer. Unfortunately,
also a lot of real-world heterogeneity of preference is lost as the conjoint procedure and the strain for
the respondents allows only a small number of factors and levels (Gibson 2001). A number of
admirable efforts has been made to allow larger number of factors and levels (self-explicated conjoint
and adaptive conjoint models, Green 1984) and reduce the number of questions necessary (fast
polyhedral adaptive conjoint estimation, Toubia, Simester and Hauser 2002).
The role users play (deciding on permutations of preselected factors and levels) in conjoint
analysis is conceptually related to another approach that is admittedly methodologically totally
different: the product configurators of typical mass customization applications in which the users can
design their own product by selecting a permutation of a given set of factors and level (Liechty,
Tamaswamy and Cohen 2001). In this approach the shifting of the design process towards the users
goes two steps beyond segmentation and conjoint analysis: first, no longer only a sample of users
(which is assumed to represent the mass) is employed but each potential customer with his specific
needs is investigated. Second, the information (factors and levels preferred) obtained is no longer
employed as an information input for the design process of the manufacturer but taken as an actual
work order.
7
In the mass customization approach a large portion of heterogeneity of user preferences is
retained. However, although these permutations can easily reach an incredible number of products
possible – e.g. the firm www.customatix.com offers an impressive quantity of
3,420,833,472,000,000,300,000 different shoes. This impressive number deludes the fact that
innovative features cannot be incorporated and it can easily be that among these seemingly endless
number the individual user cannot find a product that meets his preferences. At the end of the day, a
mass customization website is nothing more than an extreme extension of the line extension idea:
instead of a very limited number of prefab products a lot more possibilities are offered that are
manufactured on request. Non-average needs, however, are naturally not always covered by this
approach.
2.2: How are heterogeneous user needs currently served?
How are non-average user needs currently served? Some are probably not served at all, with
users simply remaining dissatisfied. In other cases, users may find a custom supplier to create
precisely what they want to order. In still other cases, users – firms or individuals - may “serve
themselves” by designing their own products from scratch or by modifying commercially-available
products to better serve their needs.
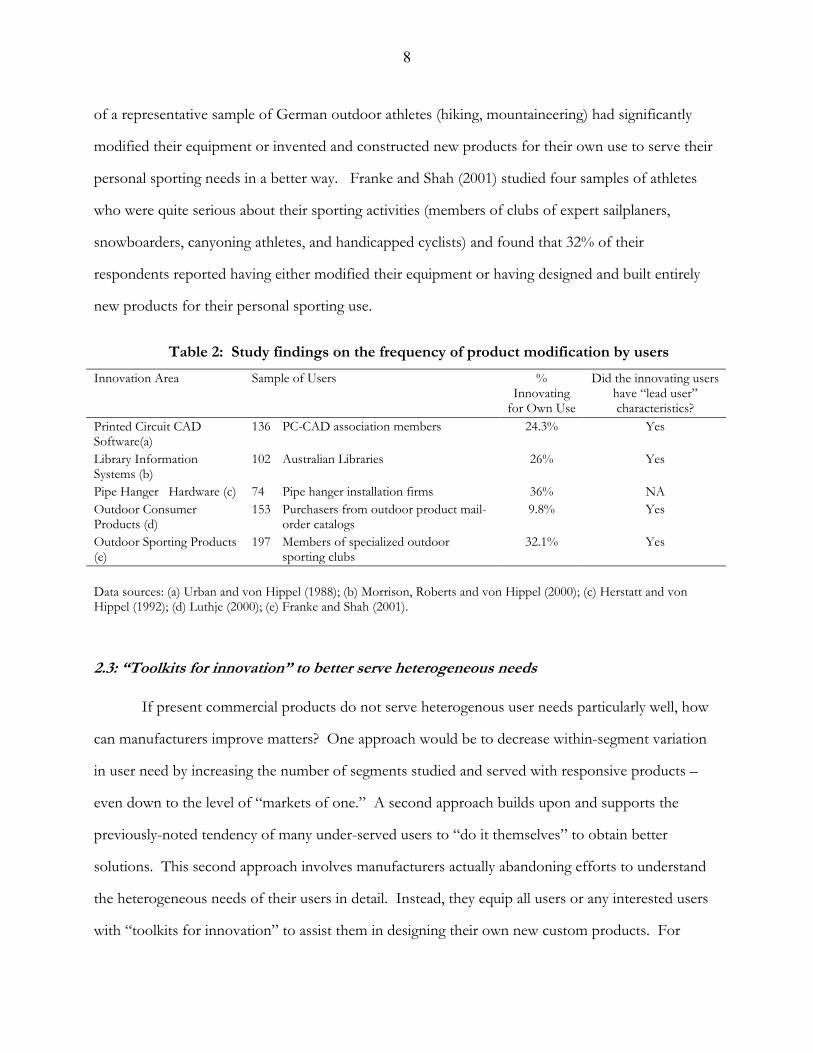
A few empirical studies have examined the frequency with which users innovate. All find
that quite a large fraction of both industrial and consumer users reporting that they have taken the
option of “making their own” (table 2). Thus, Urban and von Hippel studied firms that were using
“PC-CAD” software to design printed circuit boards and found that 24% reported that they had
built their own PC-CAD systems. Morrison et al (2000), studied Australian libraries that had
installed computerized library information systems. Twenty six percent of these libraries reported
having modified their systems one or more times after initial installation in novel ways not intended
by the system manufacturers. (This despite the fact that suppliers of library information systems
both customize the systems upon initial installation and incorporate many user-adjustable parameters
into the systems they sell.) In the field of consumer sports equipment Luthje (2000) found that 9.8%
8
of a representative sample of German outdoor athletes (hiking, mountaineering) had significantly
modified their equipment or invented and constructed new products for their own use to serve their
personal sporting needs in a better way. Franke and Shah (2001) studied four samples of athletes
who were quite serious about their sporting activities (members of clubs of expert sailplaners,
snowboarders, canyoning athletes, and handicapped cyclists) and found that 32% of their
respondents reported having either modified their equipment or having designed and built entirely
new products for their personal sporting use.
Table 2: Study findings on the frequency of product modification by users
Innovation Area Sample of Users % Innovating
for Own Use
Did the innovating users have “lead user” characteristics?
Printed Circuit CAD Software(a)
136 PC-CAD association members 24.3% Yes
Library Information Systems (b)
102 Australian Libraries 26% Yes
Pipe Hanger Hardware (c) 74 Pipe hanger installation firms 36% NA Outdoor Consumer Products (d)
153 Purchasers from outdoor product mail-order catalogs
9.8% Yes
Outdoor Sporting Products (e)
197 Members of specialized outdoor sporting clubs
32.1% Yes
Data sources: (a) Urban and von Hippel (1988); (b) Morrison, Roberts and von Hippel (2000); (c) Herstatt and von Hippel (1992); (d) Luthje (2000); (e) Franke and Shah (2001).
2.3: “Toolkits for innovation” to better serve heterogeneous needs
If present commercial products do not serve heterogenous user needs particularly well, how
can manufacturers improve matters? One approach would be to decrease within-segment variation
in user need by increasing the number of segments studied and served with responsive products –
even down to the level of “markets of one.” A second approach builds upon and supports the
previously-noted tendency of many under-served users to “do it themselves” to obtain better
solutions. This second approach involves manufacturers actually abandoning efforts to understand
the heterogeneous needs of their users in detail. Instead, they equip all users or any interested users
with “toolkits for innovation” to assist them in designing their own new custom products. For

9
reasons to be described next, we think that this second approach is likely to be the more promising
one, and it is the one explored empirically in this paper.
Why should one be able to serve heterogeneous user need more effectively by transferring
product design work from manufacturer to user? After all, the same work is being done in both
cases. The advantage lies in lowering the cost of access to “sticky” information required to develop a
product.
To understand this matter, consider first that innovation involves applying problem-solving
to information. The information that problem-solvers must draw upon in the case of product
development resides at both manufacturer and user locations. Manufacturers tend to know more
than users about solution possibilities and how a product can be most effectively manufactured;
users tend to know more than manufacturers about their particular needs and their particular use
environments. Traditional product design processes involve collecting information about needs
from users and shifting it to the site of manufacturer-based product developers for problem-solving
work. This information transfer process is often costly, because information is often “sticky” –
costly to move from place to place. (The stickiness of a given unit of information is defined as the
incremental expenditure required to transfer that unit from one place to another in a form usable by
a given information seeker. When this cost is low, information stickiness is low; when it is high,
stickiness is high [von Hippel 1994]).
Next, note that the stickiness of a given body of information is not immutable: with
investment, firms or individuals can "unstick" or reduce the stickiness of some needed information.
For example, firms may reduce the stickiness of a critical form of technical expertise by investing in
converting some of that expertise from tacit knowledge to the more explicit and easily transferable
form of a software "expert system" (Davis 1986). Or they may invest in reducing the stickiness of
information of interest to users by converting it into a remotely accessible and user-friendly
computer data base. This is what the travel industry did, for example, when it invested substantial
10
sums to put its various data bases for airline schedules, hotel reservations and car rentals "on-line" in
a user-accessible form.
Finally, consider that incentives to unstick information can vary. For example, suppose that
to solve a particular problem two units of equally sticky information are required - one from a user
and one from a manufacturer. In that case, there will be an equal incentive operating to unstick either
of these units of information in order to reduce the cost of transfer, other things (such as the cost of
unsticking) being equal. But now suppose that there is reason to expect that one of the units of
information, say the manufacturer's, will be a candidate for transfer n times in the future, while the
user's unit of information will be of interest to problem solvers only once. For example, suppose that
a manufacturer expects to have the same solution-related information called on repeatedly to solve n
user product design problems while, in contrast, solving each problem involves unique need
information from a user. In that case the total incentive to unstick the manufacturer's information
across the entire series of user problems is n times higher than the incentive for an individual user to
unstick its problem-related information (von Hippel 1998).
The particular pattern just described often holds in real-world problem solving, because
manufacturers tend to specialize in particular types of solutions – for example, software or plastics or
integrated circuits – that they want to apply to as wide a range of user needs as possible. An
important consequence of this incentive structure is that there will be an incentive to shift
problem-solving activity to the locus of the less frequently called-upon sticky information - in the case of our
example, to the user. When this is so, it is reasonable (but not proven) that approaches to satisfying
heterogeneous user needs that involve user-based problem-solving will be more cost-effective than
approaches involving manufacturer-based problem solving - such as attempting to serve many
market segments via manufacturer-developed products.
Solution-related information that is unstuck and shifted to users is most effectively supplied
in the form of “toolkits for user innovation” (von Hippel 2001). Toolkits for user innovation in the
software field include four important capabilities. First, and most important, they incorporate enable

11
users to carry out complete cycles of experimentation and learning during the process of designing
their custom product or service. This capability is essential because problem-solving in general, and
problem-solving in product design in particular, is fundamentally based upon trial-and-error learning
(Baron 1988). Second, toolkits must be “user friendly.” This means that users should be able to
operate them using their existing skills and customary design languages. Third, they must contain
libraries of designs for useful components and modules for custom products that have been tested
and debugged. These allow users to adopt what they can, and focus their design efforts on the truly
novel elements of the custom design being developed. Fourth and finally, toolkits must contain
information about the capabilities and limitations of the production process that will be used to
manufacture the product. This ensures that a user’s design will in fact be producible.
3. Research Samples and Methods
Our empirical study of the heterogeneity of user needs, user innovation and user satisfaction
is focused upon the security needs of users of Apache web server software. Web server software is
used on computer servers connected to the Internet. A server’s function is to “service” requests
from Internet browsers for particular documents or content. Initial versions of web server software
were developed in the early to mid 1990’s and offered relatively simple functionality. Over time,
however, Apache and other web server software programs have evolved into the complicated front
end for many of the technically demanding applications that now run on the Internet. For example,
web server software is now used to handle security and authentication of users, provide e-commerce
shopping carts and gateways to databases. Apache software now consists of hundreds of specialized
programs and program modules that collectively address the range of functions that make up a
modern web server.
Apache, the software product that is the subject of the empirical study in this paper, offers
the functional equivalent of a toolkit for user innovation that appropriately skilled users can employ
to create customized and improved versions of the software. Apache offers this opportunity to users
because it is “open source” software that is explicitly designed to enable modification by users.

12
When software is “free” or “open source,” users are allowed to download the software from the
Internet and use it without charge. Users are also explicitly granted the legal right to study the
software’s source code, to modify the software, and to distribute modified or unmodified versions to
others.2 Tools for software design and test ranging from software languages such as C to compilers
and debuggers are also available in open source form on the web. Taken together with the possibility
of testing newly-written server functionality on one’s own website, and the ability to “produce” and
distribute user-developed code on the Internet, these elements comprise a complete toolkit for user
innovation for Apache users.
In the case of Apache, the offered freedom to modify the standard software has been and is
exercised by many users and also by programmers working for companies such as Apple, Covalent,
Redhat, IBM and C2Net, that ‘package’ and sell Apache software for particular applications. The
ability of users to modify standard Apache offerings for themselves is a valuable element in our
study.
Apache, along with other open source software, is not designed in response to information
about general market or user needs. Instead, it consists of a collage of contributions from individual
users, each motivated by an individual need that may or may not represent a need that is widespread
among users. Users that do have sufficient incentive to innovate may freely modify their own copy
of Apache. If they think that others might benefit from what they have done, they may then submit
their code to a central group of volunteers – the 22 members of the Apache Software Foundation.
These volunteers have the right to change to standard, “authorized” version of the code that is
distributed to all interested users free of charge. They review changes that are submitted, and will
tend to accept those that conform to the technical and quality standards of Apache. Despite
(because of?) this lack of explicit or planful attention to general market need, Apache software has
been very well received by users. Apache 1.0 was released on December 1, 1995. In the space of
five years and in the face of strong competition from commercial competitors like Microsoft and
Netscape, Apache has become the most popular web server software on the Internet. In 2000, it was
13
used by more than 60% of the 8 million World Wide Web sites extant. It has also received many
industry awards for excellence.
We have elected to focus our study only on the security-related needs of Apache users for
two very practical reasons. First, adopting this focus we reduce our study space from hundreds of
software functions to the more tractable number of 45 such functions. Second, the individuals or
groups with direct needs for the security-related features of Apache are the “webmasters”
responsible for the secure and reliable operation of corporate and organizational websites.
Webmasters are clearly identifiable within organizations and are relatively easy for us to access via the
Internet.
3.1 Samples of Apache webmasters and data collection methods
For our empirical study we elected to draw from two samples of Apache users (webmasters):
(1) a sample of Apache users who posted a question or an answer on a question at the Apache
Usenet Forum (http:// www.deja.com/ group/comp.infosystems.www.servers. unix), and (2) a
sample of Apache users who subscribed a specialized online Apache newsgroup (apache-
modules.org). Our reason for selecting this stratified sampling approach was that we wanted to have
an adequate representation of users that both did and did not have the technical skills needed to
modify Apache security software to better fit their needs. Subscribers to apache-modules.org tend to
have a higher level of technical skills on average than those posting to the Apache Usenet Forum,
because the former is directed primarily to the interests of highly-skilled users.
Sample 1: Apache Usenet Posters
A total of 1371 postings were made to the Apache Usenet Forum between December 2000
and April 2001 by a total of 563 different individuals. Analysis showed that a relatively few posters
were responsible for most of the postings in our sample, with the most prolific 1% of the users
originating 20% of the postings, and the top 20% originating 61% of the messages (Gini coefficient
14
= 0.509). (This type of highly-skewed pattern is often seen in studies of open source project
activities and contributions.)
We sent e-mails to all 563 individuals responsible for one or more postings, and asked them
to fill out an electronic questionnaire. To raise the likelihood of a response, our cover letter included
a note from Ben Hyde, Apache Software Foundation member, explaining that the results of the
survey would benefit Apache. We also offered a free MIT T-shirt to all who returned a completed
questionnaire.
We eventually received 75 completed questionnaires, from our sample of 563. Since one
hundred and twenty two of our e-mails were returned by the mail server as undeliverable, our
response rate was 17% for messages actually delivered to a functioning email address. The response
rate for messages actually delivered into recipients hands is probably significantly higher, as it is likely
that many messages were delivered to email addresses that were no longer being monitored. (Many
relatively sophisticated computer users change email accounts frequently to avoid ads and other
undesirable email collectively known as “spam.”)
The 75 individuals who did respond collectively accounted for 37.1% of the 1371 messages
posted to the Apache Usenet Forum during our sampled period. Thus, frequent posters are
overrepresented in our sample of respondents.
Sample 2: Apache-Modules.org Subscribers
The apache-modules.org mailing list consists of approximately 600 users of Apache who
have a general interest in the programming and application of Apache modules. The posting activity
between November 2000 and May 2001 displayed an extremely skewed distribution (Gini coefficient
= 0.914). Only 95 of the 600 subscribers to the list posted a message within this period (16%).
We sent requests to all 600 to fill out electronic questionnaires. These requests contained the
same inducements to respond as were described for sample 1. Forty emails bounced back as non-
deliverable and we received 63 completed questionnaires. Our response rate for messages that
15
reached the intended address (but that may not have reached the intended addressees for reasons
explained earlier) was thus 11.3%.
Active subscribers are overrepresented in this sample. Among the active sub-population we
have a response rate of 30.5% while the response rate among inactive subscribers is only 7.3%. (The
number of postings i.e. the “degree of activity” does not make a difference: if we weight the answers
with the number of postings we obtain almost the same response rate of 30.6%.)
For the analysis both samples were combined, resulting in a total of 138 cases. Due to some
cases where not all questions were answered the sample size used in the analyses varies from 128 to
138. The webmasters responding to our questionnaire displayed a good distribution across website
type and size. Approximately 76% of the sites were run by for-profit organizations, and 24% by
non-profit groups or individuals. The number of persons managing and maintaining each website
ranged from 1 to 50 with a median of 3. The number of hits per day per site ranged from 1 to 100
million, with a median of 2,000. Respondent webmasters were also quite up-to-date in their use of
Apache. Apache has been progressively improved, and new versions are periodically released
incorporating the latest improvements. All of our respondents reported using the latest major release
(1.3), and the great majority (83.3%) reported using a relatively recent update of that major release
(version 1.3.12 or higher.)
3.2. Development of list of security functions and questionnaire
We wanted to present our questionnaire respondents with as complete a list as possible of
potential Apache security needs for their evaluation. Discussions with Apache users and members of
the Apache Software Foundation quickly revealed that, while there were lists of security-related code
modules, there was no list of security-related functions available. We therefore generated our own
such list. We began by generating a preliminary list from published and web-based sources. Next,
we presented this preliminary list to 10 experts in web server security and Apache web server
software. These experts were asked to make any corrections or additions they thought appropriate.
The corrected list was then presented to a sample of 11 Apache webmasters who were asked to make
16
any further corrections needed, including any corrections to language needed to make the questions
clear and unambiguous to the intended webmaster respondents. A internet-based questionnaire was
then developed and pilot tested with 10 webmasters who suggested a few additional changes but in
general commented very favorably upon its content and clarity.
The major part of the questionnaire consisted of a list of potentially-desirable security
functions for Apache that users could evaluate with respect to their own need for them and their
importance (7-point rating scales). In sum, there were 45 security related functions of a web server
included (table 1). Some of them are incorporated in the Apache standard, some are available in
additional modules, and a few are not yet addressed by any security module generally available to the
Apache community. (Security threats can emerge quickly and become matters of great concern
before a successful response is developed and offered to the general Apache community. A recent
example is “site flooding;” a form of attack in which vandals attempt to cause a website to fail by
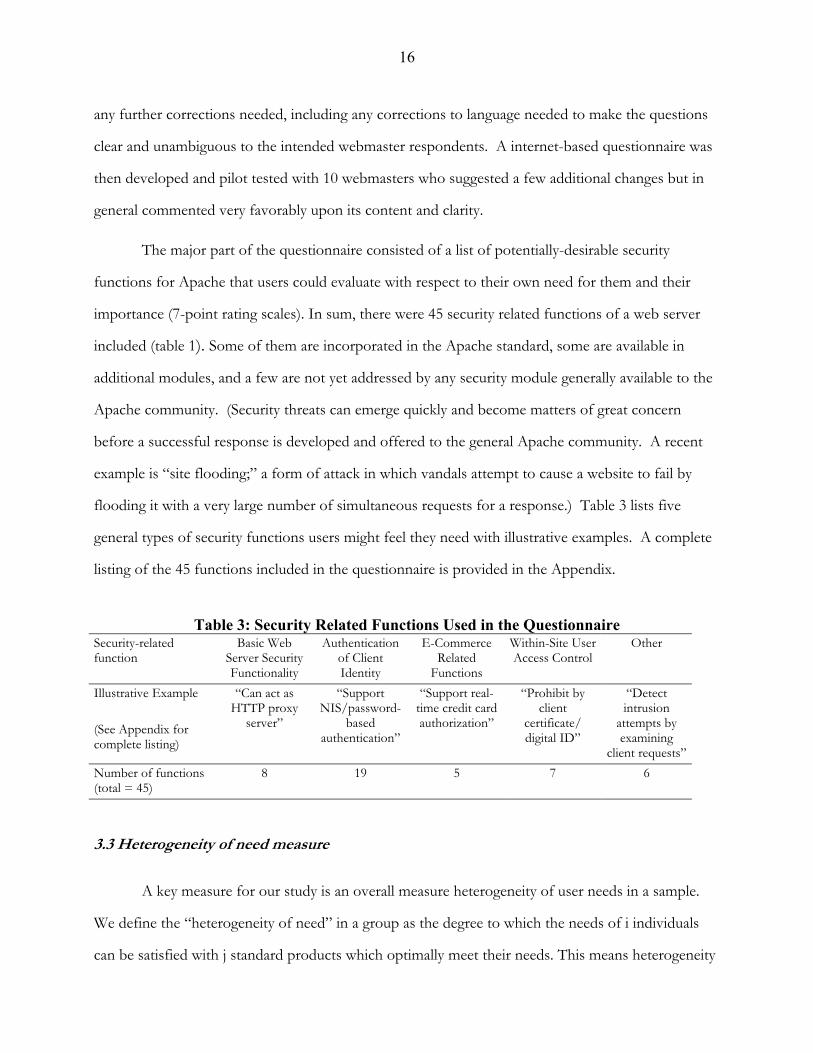
flooding it with a very large number of simultaneous requests for a response.) Table 3 lists five
general types of security functions users might feel they need with illustrative examples. A complete
listing of the 45 functions included in the questionnaire is provided in the Appendix.
Table 3: Security Related Functions Used in the Questionnaire Security-related function
Basic Web Server Security Functionality
Authentication of Client Identity
E-Commerce Related
Functions
Within-Site User Access Control
Other
Illustrative Example (See Appendix for complete listing)
“Can act as HTTP proxy
server”
“Support NIS/password-
based authentication”
“Support real-time credit card authorization”
“Prohibit by client
certificate/ digital ID”
“Detect intrusion
attempts by examining
client requests”Number of functions (total = 45)
8 19 5 7 6
3.3 Heterogeneity of need measure
A key measure for our study is an overall measure heterogeneity of user needs in a sample.
We define the “heterogeneity of need” in a group as the degree to which the needs of i individuals
can be satisfied with j standard products which optimally meet their needs. This means heterogeneity

17
of need is high when many standard products are necessary to satisfy the needs of i individuals (j ≈ i)
and low when the needs can be satisfied by a few standard products (j << i).
To measure heterogeneity, we analyze the extent to which j standards, varying from [1; i] meet
the needs of the i individuals. Conceptually, we first locate a product in multidimensional need space
(dimensions = 45 in the case of our present study) that minimizes the distances to each individual’s
needs. (This step is analogous to the Ward’s method in cluster analysis that also minimizes within
cluster variation, see Punj and Stewart 1983). The “error” is then measured as the sum of squared
Euclidean distances. We then repeat these steps and determine the error for two optimally positioned
products, 3 products, etc up to a number equaling i-1, 1 minus the total number of individuals in the
sample (obviously, the error when the number of products is identical to the total number of
individuals is zero.) The sum of squared errors for all cases is then a simple coefficient that measures
how much the needs of i individuals can be satisfied with j standard products, where j = 1, 2, 3…, i-1.
The “coefficient of heterogeneity” just specified is sensitive both to the (average) distance
between the needs and for the configuration of the needs: when the needs tend to form clusters the
heterogeneity coefficient is ceteris paribus lower than if they are evenly spread. To make the
coefficient better comparable for different populations, we calibrate it using a bootstrapping
technique (Efron 1979) involving dividing the coefficient by the expected value (This value is
generated by averaging the heterogeneity of many random distributions of heterogeneity of the same
kind). The average random heterogeneity coefficient is an excellent value for calibration purposes
because it a natural borderline: it assumes that there is no systematic relationship between the needs
of the individuals or between the need dimensions.
• If an empirical coefficient is equal to this average random heterogeneity coefficient there is no
systematic tendency of the individuals to cluster. Each individual’s needs is totally independent
from other individuals’ needs and all combinations of needs regarding the dimensions of need are
equally likely.

18
• If an empirical coefficient is lower than this average random heterogeneity coefficient there is a
systematic tendency of the individuals to cluster. That is, there are groups of individuals with
similar needs.
• If an empirical coefficient is higher than this average random heterogeneity coefficient we would
conclude that there is a tendency for individuals’ needs to disperse, for example because one’s
needs are negatively impacted by another person’s needs. Thus, individuals who purchase
clothing with a goal of emphasizing their individuality might seek selections that they think others
are unlikely to have chosen.
The higher the coefficient the more heterogeneous are the needs of users in a sample. If the
calibrated heterogeneity coefficient equals 1, there is no systematic tendency of the users to cluster.
If it is higher than 1 there is a tendency to disperse. If Hc is lower than 1, there is some tendency of
the individuals to cluster. A coefficient of 0 means that the needs of all individuals are exactly the
same.
4. Research findings
4.1. Heterogeneity of user need
We find the security module needs of Apache users in our sample to be quite heterogeneous.
Indeed, the calibrated coefficient of heterogeneity is 0.98, indicating that there is essentially no
tendency of these users to cluster beyond chance.3
A hierarchical cluster analysis (Ward method, Squared Euclidian distance) shows the
following relationship between the number of clusters and the remaining within-cluster variance
(table 4).
Table 4: Relationship Between Number of Clusters and Remaining Cluster Variance in Apache Sample
# of clusters 2 3 4 5 10 15 16 17 50 100 128 Remaining within cluster variance (n = 128)
88.9% 80.7% 76.9% 73.7% 62.4% 55.5% 54.4% 53.3% 28.0% 6.5% 0%

19
For example, if we accepted a four-cluster solution (the mean number selected in the studies
reviewed in table 1) we would have 76.9 % remaining within cluster variance. Such a solution would
be very likely to leave many users seriously dissatisfied.
Although the measured heterogeneity in our sample is rather high, the coefficients provided
probably understate actual heterogeneity in the sample. Recall that in our questionnaire we used 45
variables that covered 45 security-related functions of web server software. Our expectation was that
this list would cover almost every aspect of need any user in our sample might experience with
respect to Apache website security. But, just in case, we added an open question asking user
respondents to list up to four additional needs they experienced that were not covered by the
standard list. Nearly 50% of the users used the opportunity to add additional functions. Twenty
two percent had one additional suggestion, 16% had two, 4.4% had 3 and 3% had 4 for a total of 108
suggestions. When duplicates were eliminated, we found a total of 92 distinct additional security-
related needs that one or more individual users found relevant.
4.2: Heterogeneity of need vs. user skill levels
Recall that Apache is a software product consisting of “open source” software. Such
software can be modified by programmers with appropriate skills. In our questionnaire, we asked
each of our respondents to indicate whether they had the skills needed to modify Apache to better
suit their needs. We also asked our respondents about the level of modification they had actually
made to the Apache code used at their website. These two measures can be seen in table 5 and, as
can be seen, they corresponded reasonably well. That is, many of those who claimed the ability to
make modifications had also done so.

20
Table 5: Customization and Programming Skills Degree of customization implemented by users No customization:
Standard version only
Security enhanced standard version of
Apache installed
Integration of additional security modules
Customized version installed that involved
coding by user % of sample
(n = 131) 42.7% 5.3% 32.8% 19.1%
Programming skills claimed by users a, b
4.2 (2.2)
4.3 (2.6)
5.3 (1.7)
6.2 (1.3)
a “Some people in the server maintenance group are able to do some modifications of Apache that involve coding” [1 = strongly disagree; 7 = strongly agree], means (standard deviations) b ANOVA F = 7.05, p < 0.000 shows that differences of means are strongly significant
Heterogeneity of need in our sample was approximately equal for respondents with and
without the skills needed to customize Apache more to their liking. We determined this by splitting
up the users in our sample into two groups: the highly skilled who stated that they were capable of
modifying Apache by writing new code (n = 62) and the less skilled users who were unsure about
this or claimed not to be able to do such modifications (n = 66).4 In table 6 we see that the degree of
heterogeneity of need is high in both groups, but is slightly higher within the group of highly skilled
users (Hc = 1.05 vs. 0.97). This difference is supported by the fact that the highly skilled users also
tend to suggest more new security related functions beyond the 45 that were incorporated in the
questionnaire (0.94 vs. 0.63 on average).
Table 6: Heterogeneity of Needs of Apache Users of Different Skill levels
Coefficient Highly skilled users (n = 62)
Not highly skilled users(n=66)
Empirical heterogeneity coefficient 216,134.41 226,493.71 Average random heterogeneity coefficient (basis: 100 random preferences, each 45 variables, ranging from 1 to 7)
205,295.22 232,201.41
Calibrated heterogeneity coefficient Hc 1.05 0.97 Average number of suggestions for further improvement (additional functions)
0.94 0.63
Skilled and unskilled users gave generally similar judgments with respect to the subjective
importance of each of the 45 Apache-related security functions included in our questionnaire. Their
assessments on this matter differed significantly with respect to only 4 of 45 functions (re function
#8, p<.05; re functions #4,13 and 18, p< .1). In all of these 4 cases, the skilled users judged the
importance of the function to be higher than did the unskilled users. Although the reasons behind
21
these similar judgments of subjective importance may differ among our respondents, this finding
raises the intriguing possibility that innovations developed by skilled users might also be of value to
unskilled users.
4.3 Satisfaction of users with Apache security functions
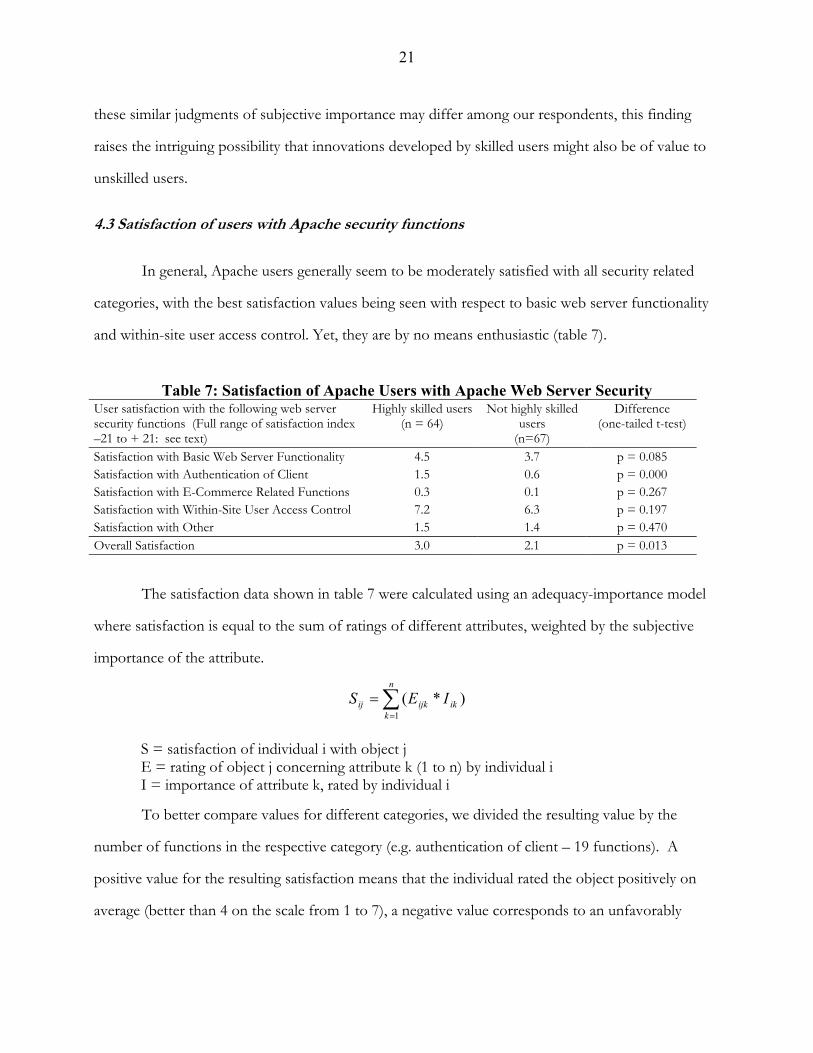
In general, Apache users generally seem to be moderately satisfied with all security related
categories, with the best satisfaction values being seen with respect to basic web server functionality
and within-site user access control. Yet, they are by no means enthusiastic (table 7).
Table 7: Satisfaction of Apache Users with Apache Web Server Security User satisfaction with the following web server security functions (Full range of satisfaction index –21 to + 21: see text)
Highly skilled users(n = 64)
Not highly skilled users
(n=67)
Difference (one-tailed t-test)
Satisfaction with Basic Web Server Functionality 4.5 3.7 p = 0.085 Satisfaction with Authentication of Client 1.5 0.6 p = 0.000 Satisfaction with E-Commerce Related Functions 0.3 0.1 p = 0.267 Satisfaction with Within-Site User Access Control 7.2 6.3 p = 0.197 Satisfaction with Other 1.5 1.4 p = 0.470 Overall Satisfaction 3.0 2.1 p = 0.013
The satisfaction data shown in table 7 were calculated using an adequacy-importance model
where satisfaction is equal to the sum of ratings of different attributes, weighted by the subjective
importance of the attribute.
∑=
=n
kikijkij IES
1)*(
S = satisfaction of individual i with object j E = rating of object j concerning attribute k (1 to n) by individual i I = importance of attribute k, rated by individual i
To better compare values for different categories, we divided the resulting value by the
number of functions in the respective category (e.g. authentication of client – 19 functions). A
positive value for the resulting satisfaction means that the individual rated the object positively on
average (better than 4 on the scale from 1 to 7), a negative value corresponds to an unfavorably
22
evaluation (worse than 4 on the scale from 1 to 7). The theoretical range of the satisfaction index is
[-21; 21].
As can be seen in table 7, the satisfaction levels of those that have the skills needed to modify
Apache is significantly higher than the satisfaction of those who do not have this ability. However,
the patterns of satisfactions and dissatisfactions are quite similar for these two types of user, with the
correlation of the two groups with respect to the satisfaction means of all 45 security functions being
quite high (r = 0.884; p<0.000). (We will develop the implications of this latter finding in our section
5 discussion.)
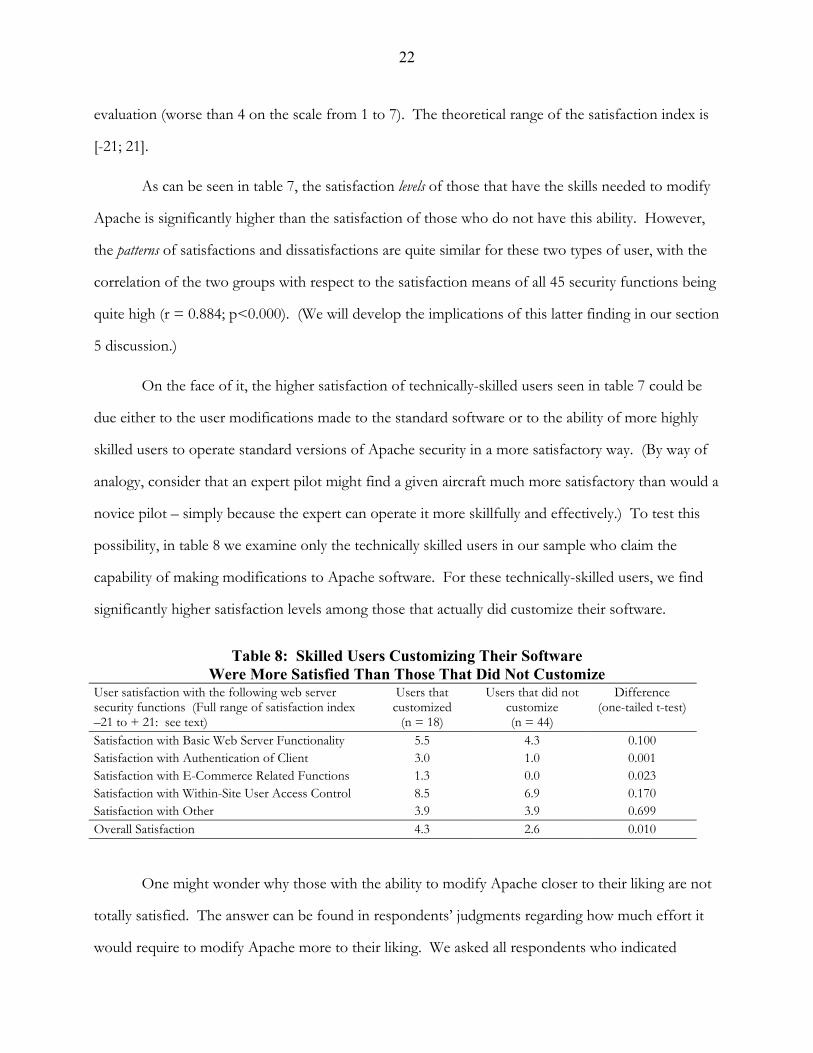
On the face of it, the higher satisfaction of technically-skilled users seen in table 7 could be
due either to the user modifications made to the standard software or to the ability of more highly
skilled users to operate standard versions of Apache security in a more satisfactory way. (By way of
analogy, consider that an expert pilot might find a given aircraft much more satisfactory than would a
novice pilot – simply because the expert can operate it more skillfully and effectively.) To test this
possibility, in table 8 we examine only the technically skilled users in our sample who claim the
capability of making modifications to Apache software. For these technically-skilled users, we find
significantly higher satisfaction levels among those that actually did customize their software.
Table 8: Skilled Users Customizing Their Software
Were More Satisfied Than Those That Did Not Customize User satisfaction with the following web server security functions (Full range of satisfaction index –21 to + 21: see text)
Users that customized
(n = 18)
Users that did not customize (n = 44)
Difference (one-tailed t-test)
Satisfaction with Basic Web Server Functionality 5.5 4.3 0.100 Satisfaction with Authentication of Client 3.0 1.0 0.001 Satisfaction with E-Commerce Related Functions 1.3 0.0 0.023 Satisfaction with Within-Site User Access Control 8.5 6.9 0.170 Satisfaction with Other 3.9 3.9 0.699 Overall Satisfaction 4.3 2.6 0.010
One might wonder why those with the ability to modify Apache closer to their liking are not
totally satisfied. The answer can be found in respondents’ judgments regarding how much effort it
would require to modify Apache more to their liking. We asked all respondents who indicated
23
dissatisfaction of a level 4 or lower with a specific function of Apache how much working time it
would cost them to improve the function to the point where they would judge it to be very
satisfactory (to be at a satisfaction level of 7). For the whole sample and all dissatisfactions, we
obtained a working time of 8,938 person days necessary to get a very satisfactory solution (≈ 34
person years). This equals $78 of incremental benefit per incremental programmer working day ($
716,758 divided by 8,938 days). This is clearly below the regular wages a skilled programmer gets.
We conclude from this that skilled users do not improve their respective Apache versions to the
point where they are perfectly satisfied because the costs of doing so would exceed the benefits.
4.4. Willingness to pay for software improvements
Estimating user willingness to pay (WTP) is known to be a difficult task. Prior research
offers several measurement concepts for willingness to pay, ranging from actual transaction data to
simulated auctions and survey data (Wertenbroich and Skiera 2001). In our study, the product in
question (improved Apache software security functionality) did not exist yet, and so we were limited
to survey data approaches to WTP. Popular methods here are conjoint experiments where
respondents value objects that consist of several attributes containing price. However, due to the
very high number of variables we used we could not employ this or similar methods (Gabor and
Granger 1966). As a consequence, we elected to employ the contingent valuation method (CVM) in
which the respondents are directly asked how much they are willing to pay for a product or service
(Mitchell and Carson 1989).
Results obtained by the contingent valuation method are found to often significantly
overestimate actual WTP (Lindsay and Knaap 1999). Our own survey of the empirical literature
supports this finding. The empirical studies we found that compare expressed WTP with actual cash
payments on average showed actual spending behavior to be only 15-20% of expressed WTP.5
Our overall approach was to ask each user that had indicated he or she was not really
satisfied with a function (i.e. if his satisfaction with the respective function was 4 or less on a 7-point
24
scale - 1 = not satisfied at all; 7 = very satisfied) to estimate how much he or she would be willing to
pay to get a very satisfactory solution regarding this function. We offered respondents payment
scales rather than open-ended approaches since research into WTP has shown that this method
provides more valid results (Donaldson, Thomas, and Torgerson 1997). To compensate for the
likely overstatement of expressed relative to actual WTP in our study, we deflated respondents’
indicated willingness to pay by 80%.
An additional deflator of an unknown amount was added by three other elements of our
analysis. First, if a user checked the category “I don’t know” (which was the seventh possible answer
on this question) we counted his answer as $0. Second, we only asked about willingness to pay
relative to the 45 functions described in the main body of the questionnaire. Willingness to pay for
items added by users on the open-ended question were not included. Third and finally, we did not
take into account that also users who are rather satisfied with a function (5 or 6 on our 7-point scale)
would probably also be willing to pay some money to get an even better solution.
After deflation, our sample of 137 respondents were found willing to pay $700,000 in
aggregate to improve Apache web server security functions to a point that fully satisfied each of their
needs (table 11). This amounts to an average of $5,232 total willingness to pay per respondent. If
we extrapolate from our sample of 137 respondents by assuming that each controls 10 of the 315,000
physical servers mounting Apache software (Netcraft as reported in Wired magazine, October, 2001)
we end up with $164,802,000 of willingness to pay in aggregate.
The Apache Software Foundation does not charge for its software, but the cost of
functionally similar Sun webserver software is about $1,100 per machine (Source: Sun website,
November, 2001). If we assume that users would pay about the same amount per machine for
Apache software if it too were a commercial product, we see that the total additional amount that
Apache users would be willing to pay to be perfectly satisfied with the security features of their
Apache software is about 50% of the total “equivalent commercial price” of Apache software
installed by users to date. (This may seem like a counterintuitively large amount. But note that the
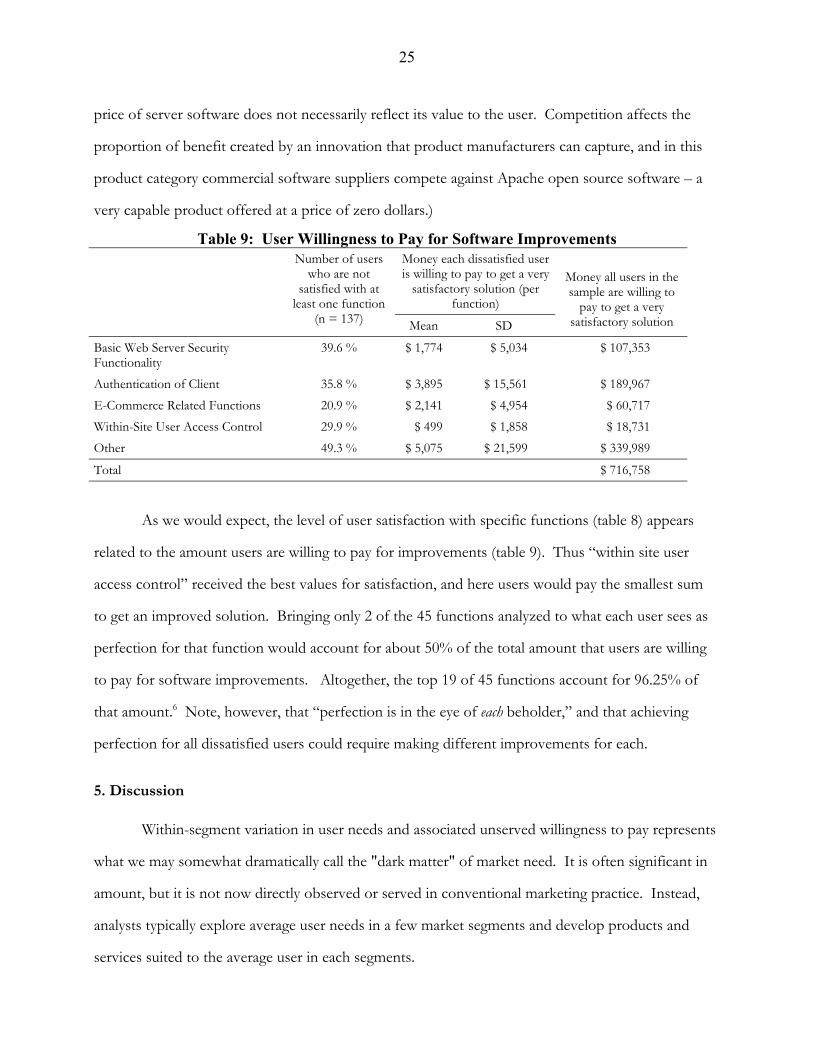
25
price of server software does not necessarily reflect its value to the user. Competition affects the
proportion of benefit created by an innovation that product manufacturers can capture, and in this
product category commercial software suppliers compete against Apache open source software – a
very capable product offered at a price of zero dollars.)
Table 9: User Willingness to Pay for Software Improvements Money each dissatisfied user
is willing to pay to get a very satisfactory solution (per
function)
Number of users who are not
satisfied with at least one function
(n = 137) Mean SD
Money all users in the sample are willing to
pay to get a very satisfactory solution
Basic Web Server Security Functionality
39.6 % $ 1,774 $ 5,034 $ 107,353
Authentication of Client 35.8 % $ 3,895 $ 15,561 $ 189,967 E-Commerce Related Functions 20.9 % $ 2,141 $ 4,954 $ 60,717 Within-Site User Access Control 29.9 % $ 499 $ 1,858 $ 18,731 Other 49.3 % $ 5,075 $ 21,599 $ 339,989
Total $ 716,758
As we would expect, the level of user satisfaction with specific functions (table 8) appears
related to the amount users are willing to pay for improvements (table 9). Thus “within site user
access control” received the best values for satisfaction, and here users would pay the smallest sum
to get an improved solution. Bringing only 2 of the 45 functions analyzed to what each user sees as
perfection for that function would account for about 50% of the total amount that users are willing
to pay for software improvements. Altogether, the top 19 of 45 functions account for 96.25% of
that amount.6 Note, however, that “perfection is in the eye of each beholder,” and that achieving
perfection for all dissatisfied users could require making different improvements for each.
5. Discussion
Within-segment variation in user needs and associated unserved willingness to pay represents
what we may somewhat dramatically call the "dark matter" of market need. It is often significant in
amount, but it is not now directly observed or served in conventional marketing practice. Instead,
analysts typically explore average user needs in a few market segments and develop products and
services suited to the average user in each segments.

26
As was noted earlier, this traditional practice makes perfect sense for a world in which it is
costly to design, produce and/or advertise products for each market segment selected. After all, if
one can only afford to provide and advertise a standard product for a few market segments, there is
little practical value in creating finer segmentations or learning more about within-segment variation
in user needs. However, the world is now changing, and it is becoming steadily cheaper to design
and produce for “markets of one.” In this new world, we think it makes sense to first analyze the
heterogeneity of user need in a marketplace via cluster analysis in conjunction with conjoint analysis.
Then, if heterogeneity is high, one may elect to increase user satisfaction via a toolkit approach that
helps users to design their own custom product solutions. In contrast, if heterogeneity is low, one
might prefer to follow the traditional approach and offer standard products adjusted to the needs of
a few market segments.
In this paper we studied user needs for and satisfaction with Apache server software security
functionality. Here, we found high heterogeneity of user need accompanied by significant user
willingness to pay for products better suited to individual needs. We also saw that users with the
technical skills to do so did sometimes modify Apache, and that users improving their own
implementation of Apache via a “toolkits for user innovation” approach showed higher satisfaction
than did users unable to modify Apache.
It is important to note that modifying and creating new products via toolkits for user
innovation is not a costless activity, and that users will employ the approach only to the extent that
their benefits exceed their costs. Costs to users consist of the one-time cost associated with
obtaining and learning to use the toolkit plus the variable cost associated with actually designing and
implementing a given modification or innovation. With respect to one-time costs, in the case of our
Apache study less than half of all users in our two samples had made the one-time investment in
coding skills that would allow them to modify Apache code. (Specifically, only 37% of our sample of
Apache Usenet posters – probably reasonably typical of average Apache users in terms of technical
capabilities - reported that they were able to modify Apache in ways that involved actually writing
new computer code. Sixty four percent indicated that they were able to download and integrate a

27
module that had been developed by others into their copy of Apache.) In the case of variable costs,
we saw in section 4.3 that users with the skills needed to modify Apache had not modified it to a
level of perfect satisfaction, but only to a level where (we assume) their incremental innovation costs
equaled their incremental innovation benefits.
The impact of these cost considerations on the toolkits for innovation approach to satisfying
heterogeneous user need is that the fraction of a user population directly benefiting from the approach
will increase as one-time and variable costs go down. However, to the extent that users with lower
skills and incentives share the needs of more highly skilled and motivated users, and to the extent
that the more highly skilled openly reveal the solutions they have developed, even a costly toolkit for
innovation can indirectly benefit the former group. This is because it typically takes less skill and
effort for a user to adopt a solution developed by a skilled user than it does to develop that solution
de novo. This point is nicely illustrated in our Apache study. As was noted above, only 37% of our
sample of representative users felt that they had the skills needed to write new code, but 64% felt
that they had the skills needed to download and use new code developed by others.
For this reason, manufacturers may find it valuable implement toolkits for innovation even if
the proportion of the target market that can directly use them is relatively small. As studies of the
sources of important innovations have shown, many innovations are developed by “lead users” for
their own non-standard needs (von Hippel 1988). Later, these lead user innovations become
attractive to the general population of user/customers, and are profitably diffused by manufacturers
(or, in the case of open source projects, by the users themselves). This is likely to be the case in the
specific instance of the Apache open source innovations studied here. Research on the
characteristics of users modifying Apache shows them to be lead users (Franke 2002).
In the case of our study, it does seem that innovations by skilled Apache users might well be
of benefit to less-skilled users. First, recall that we found (table 8) that the skilled and the less skilled
users in our sample have quite similar preferences, with a significant difference in the importance
ratings present in only 4 of 45 functions. Recall also that, while the mean satisfaction levels differed
between these two groups, the pattern of satisfaction levels is very similar. (The correlation of the two

28
groups satisfaction means for all 45 security functions is r = 0.884; p<0.000). In other words,
although both groups show different satisfaction levels (because the skilled are able to help
themselves) the satisfaction patterns were similar – which in turn means that the less skilled may well
be profit from modifications made by skilled users in the Apache case.
How generalizable is the toolkits for user innovation approach to addressing heterogeneous
user needs? After all, Apache is clearly not an ordinary product nor is it developed by a
conventionally-organized innovation process. Apache is open source software that is developed,
produced, distributed and supported by a community of users rather than by a manufacturer. The
elements of the toolkit needed to both design and modify open source software are available free to
that user community, and the “official” version of the software is put out by a community of user
volunteers working as the Apache Development Foundation.
Despite the unconventional nature of the product we studied here, we think that the
approach is widely applicable. The toolkits for user innovation approach that helps users to innovate
to address their own idiosyncratic needs is equally applicable to physical products developed by
manufacturers. For example, it has been successfully applied in the field of custom semiconductor
design for many years. Custom semiconductors are a physical product that are produced by a
relatively few manufacturers in costly fabrication facilities called silicon foundries. In this field
toolkits for user innovation are produced by third parties, and are used by custom semiconductor
customers to “design their own” custom designs that are later produced for them in silicon
foundries. Although no direct information exists on user satisfaction with this arrangement, billions
of dollars of customer-designed semiconductors are produced each year, and available evidence
suggests that designs done by the users themselves cost less and are developed in less time than can
be done by the manufacturers (von Hippel 1998, Thomke and von Hippel 2002).
Of course, the importance of addressing heterogeneous user need is independent of the
specific approach taken. Future research might identify and explore strategies in addition to toolkits
that may also serve this goal. Evolving technologies are opening the way to new solutions. We hope
that others will find it interesting to join us in exploring this fascinating subject.
29
References
Aldenfer, M.S. and Blashfield, R.K. (1984) Cluster Analysis, Newbury Park (CA): Sage
Assael, H. and Poltrack, D.F. (1999), “Relating Products to TV Program Clusters”, Journal of
Advertising Research, 39, 2, pp. 41-52
Barney, J.B. and Hoskisson, R.E. (1990): “Strategic Groups: Untested Assertions and Research
Proposals”, Managerial and Decision Economics 11, pp. 187-198
Baron, Jonathan, Thinking and Deciding, Cambridge University Press, New York, 1988.
Brown, T.C., Champ, P.A., Bishop, R.C., McCollum, D.W. (1996), “Which Response Format Reveals
the Truth about Donations to a Public Good”, Land Economics, 72, 2, pp. 152-166
Cheng, P. and Black, R.T. (1998), “Geographic Diversification and Economic Fundamentals in
Apartment Markets: A Demand Perspective”, Journal of Real Estate Portfolio Management, 4, 2, pp.
93-105
Dickinson, John R. (1990), The Bibliography of Marketing Research Methods, 3d ed. Lexington, MA:
Lexington Books.
Donaldson, C., Thomas, R., Torgerson, D.J. (1997), “Validity of Open-Ended and Payment Scale
Approaches to Eliciting Willingness to Pay”, Applied Economics, 29, pp. 79-84.
Dunne, J. and Turley, D. (1997), “Banking Schemes for Seniors-Bonus or Unwelcome Badge?”, Irish
Marketing Review, 10, 1, pp. 27-35
Efron, B. (1979) Bootstrap Methods: Another Look at the Jackknife, The Annuals of Statistics, 7, pp. 1-
26.
Franke, Nikolaus (2002), “Characteristics of Innovating Users of Apache Open Source Software”
University of Vienna Working Paper
30
Franke, Nikolaus and Sonali Shah (2001), “ How Communities Support Innovative Activities: An Exploration
of Assistance and Sharing Among End-Users,” MIT Sloan School of Management Working Paper #4164
Gabor, A. and Granger, C. (1966), “Price as an Indicator of Quality”, Economics, 33, pp. 43-70.
Gibson, Lawrence D. (2001): What's wrong with conjoint analysis?, Marketing Research 13 (4), pp.
16-19)
Green, P.E. (1971), A New Approach to Market Segmentation, Business Horizons, 20, February, pp.
61-73.
Green, P.E. (1984): Hybrid Models for Conjoint Analysis: an exploratory review, Journal of
Marketing Research 21 (May), pp. 155-169)
Green, Paul E.; Krieger, Abba M. (1991): Segmenting Markets with Conjoint Analysis, Journal of
Marketing 55 (4), pp. 20-31
Green and Srinivasan, V. (1978a): Conjoint Analysis in Consumer Research: Issues and Outlook,
Journal of Consumer Research 5 (September), pp. 103-123
Green, P.E. / Srinivasan, V. (1978b): Conjoint Analysis in Marketing: New Developments with
Implications for Research and Practice, Journal of Marketing 54 (4), pp. 3-19)
Jimenez-Martinez, J. and Polo-Redondo, Y., (2001), “Key Variables in the EDI Adoption by Retail
Firms”, Technovation, 21, pp. 385-394.
Ketchen, D.J., Jr. And Shook, C.L. (1996) “The Application of Cluster Analysis in Strategic
Management Research: An Analysis and Critique”, Strategic Management Journal, 17, 6, pp. 441-459.
Leong, E.K.F., Huang, X. and Stanners, P.-J. (1998), “Comparing the Effectiveness of the Web Site
with Traditional Media”, Journal of Advertising Research, pp. 38, 5, pp. 44-51.
Liechty, J., Tamaswamy, Cohen, S.H. (2001): Choice Menus for Mass Customization: An
Experimental Approach for Analyzing Customer Demand with an Application to a Web-Based
Information Service, Journal of Marketing Research, 38 (2), pp. 183-196.
31
Lindsey, G. and Knaap, G. (1999), “Willingness to Pay for Urban Greenway Projects”, Journal of the
American Planning Association, 65, 3, pp. 297-313.
Loomis, J., Brown, T., Lucero, B., Peterson, G. (1996), Improving Validity Experiments of
Contingent Valuation Methods: Results of Efforts to Reduce the Disparity of Hypothetical and
Actual Willingness to Pay”, Land Economics, 72, 4, pp. 450-461.
Lüthje, C. (2000) “Characteristics of Innovating Users in a Consumer Goods Field,” MIT Sloan
School of Management Working Paper No. 4331-02
Milligan, G.W. and Cooper, M.C. (1985) “An Examination of Procedures for Determining the
Number of Clusters in a Data Set”, Psychometrica, 45, pp. 159-179.
Mitchell, R.C. and Carson, R.T. (1989), Using Surveys to Value Public Goods: The Contingent Valuation
Method, Washington: Resources for the Future.
Morrison, Pamela D., John H. Roberts and Eric von Hippel (2000), “Determinants of User
Innovation and Innovation Sharing in a Local Market,” Management Science, 46, 12 (December),
pp1513-1527.
Myers, J.H. (1996), Segmentation and Positioning for Strategic Marketing Decisions, Chicago: American
Marketing Association.
Neil, H., Cummings, R., Ganderton, P., Harrison, G., McGuckin, G. (1994), “Hypothetical Surveys
and real Economic Commitments”, Land Economics, 70, pp. 145-154.
Pine, Joseph B. II. Mass Customization: The New Frontier in Business Competition, Cambridge, MA:
Harvard Business School Press 1993.
Portnov, B.A. and Pearlmutter, D. (1999), “Private Construction as a General Indicator of Urban
Development: The Case of Israel”, International Planning Studies, 4, 1, pp. 131-160.
Punj, G., Stewart D.W. (1983), Cluster Analysis in Marketing Research: Review and Suggestions for
Application, Journal of Marketing Research; 20, May, pp. 134-148.
32
Raymond, Eric (2000) “The Cathedral and the Bazaar,” O’Reilly Press
Schaffer, Catherine M., Green, Paul E. (1998), Cluster-Based Market Segmentation: Some Further
Comparisons of Alternative Approaches, The Journal of Marketing Research Society, 40 (2), pp. 155-163.
Schaub, M. and Tokar, D.M. (1999), “Patterns of Expectations about Counseling: Relations to the
Five-factor Model of Personality”, Journal of Counseling and Development, 77, 2, pp. 177-188
Seip, K., Strand, J. (1992), Willingness to Pay for Environmental Goods in Norway: A Contingent
Valuation Study with Real Payment, Environmental and Resource Economics, 2, pp. 91-106.
Thombs, D.L. and Osborn, C.J. (2001), “A Cluster Analytic Study of Clinical Orientations among
Chemical Dependency Counselors”, Journal of Counseling and Development, 79, 4, pp. 450-458
Thomke, Stefan and Eric von Hippel (2002) “Customers As Innovators,” Harvard Business Review
(April).
Toubia, O., Simester, D.I., Hauser, J.R. (2002): Fast polyhedral Adaptive Conjoint Estimation, MIT
Working Paper
von Hippel (1998) “Economics of Product Development by Users: The Impact of “Sticky” Local
Information” Management Science, vol 44, No. 5 (May) p. 629-644
von Hippel (1988) The Sources of Innovation, New York, NY, Oxford University Press
von Hippel, Eric (2001a) “Perspective: User toolkits for innovation,” The Journal of Product Innovation
Management, 18, pp 247-257.
von Hippel, Eric (2001b) “Innovation by User Communities: Learning from Open Source Software,”
Sloan Management Review (July).
Wedel, M. and Kamakura, W. (1999): Market Segmentation: Conceptual and Methodological
Foundations, Kluwer
Wertenbroich, K. and Skiera (2001), “Measuring Consumer Willingness to Pay at the Point of
Purchase”, Journal of Marketing Research (forthcoming).
33
Willis and Powe (1998) “Contingent Valuation and Real Economic Commitments: a Private Good
Experiment”, Journal of Environmental Planning and Management, 41, 5, pp. 611-619.
Wind, Y. (1978), Issues and advances in segmentation research, Journal of Marketing Research, 15,
August, pp. 317-37.
Woodman, J.S., Clark, J. and Rimmington, M. (1996), “Productivity in Hospital Kitchens”, Services
Industries Journal, 16, 3, pp. 368ff.
Appendix:
Complete listing of web server security-related functions included in study questionnaire
Basic Web Server Security Functionality: 1. Can change user access control list without restarting
server; 2. Can act as an HTTP proxy server; 3. Hierarchical permissions for directory-based
documents; 4. Web server has built-in virus scanning engine; 5. Disallow requests for files on
particular devices; 6. Has the ability to control client access to remote web server resources based on
the date and time of the client’s request; 7. Supports SSL; 8. Supports the IPsec security standard
Authentication of Client: 1. Supports NIS/password-based authentication, 2. Support LDAP-
based authentication, 3. Supports DCE authentication, 4. Support Kerberos authentication, 5.
Supports Novell Directory Services (NDS) authentication, 6. Supports the TACACS+ authentication
protocol, 7. Can authenticate against SMB servers, such as Windows NT and Samba, 8. Supports
NTLM authentication, 9. Supports SiteMinder authentication and authorization, 10. Integrated
certificate server, 11. Supports TDS authentications, 12. Can authenticate by checking the contents
of a database, 13. File-based cookie authentication, 14. Supports Windows NT domain controller
authentication, 15. Can authenticate using user-provided function/script, 16. Supports the ability to
create an authentication module that runs on a remote machine, 17. Allows multiple NCSA-style
password files, 18. Supports Lotus Notes based authentication, 19. SSL client certificates (digital
ID’s)
34
E-Commerce related Functions: 1. Supports S-HTTP, 2. Supports SET, 3. Supports real-time
credit card authorizations, 4. Supports electronic check payments, 5. Supports digitally signed
tickets, to allow the passing of authenticated data from site to site
Within-site User Access Control: 1. Prohibit access by domain name, 2. Prohibit access by IP
address, 3. Prohibit access by user and group, 4. Prohibit access by directory and file,
Configurable user groups (not just a single user list), 5. Prohibit by client certificate/digital ID, 6.
Prohibit by combination of the above
Other Functions: 1. Can hide part of a document based on security rules, 2. Can detect intrusion
attempts by examining client requests, 3. Ability to limit number of concurrent connections from
a host, 4. Supports the ability to run the Hypertext Transfer Protocol daemon (httpd) chrooted, 5.
Supports the ability to provide access control based on the “Referer” HTTP environment variable 6. Security for virtual servers
1 Our survey methodology was as follows. First, we identified all peer reviewed articles in ABI/Inform from 1986 to
2001 that used the term “cluster analysis” in the full text. We obtained 722 hits. All were checked to determine whether
actually cluster analyses were performed, whether the subject matter was market segmentation studies or equivalents, and
whether the data needed for table 1 was supplied. In cases where recent studies were appropriate but some needed data
were not supplied, we emailed to the authors with a request for it. Of 22 requests made, 3 responses supplying the
requested data were received.
2 A software author uses his or her own copyright to guarantee these rights to all users by affixing any of a number of
standard licensing notices, such as “Copyleft,” to the code. Well-known examples of free or open source software are
the GNU/Linux computer operating system, Perl programming language, and the Internet e-mail engine SendMail
(Raymond 2000). Many thousands of free and open source software projects exist today and the number is growing
rapidly. A repository of open source projects, Sourceforge.net, lists in excess of 10,000 projects and more than 100,00
registered users.
3 The empirical heterogeneity coefficient equals 817,555.95 (n = 128) and the average random heterogeneity coefficient
(basis: 100 random preferences, each 45 variables, ranging from 1 to 7) equals 835,144.43. Consequently, the calibrated
heterogeneity coefficient equals 0.98.
35
4 We asked respondents for their level of agreement with the statement “Some people in our server maintenance group
are able to do some modifications on Apache that involve coding”. A 7-point rating scale was used (anchors 1 =
strongly disagree, 7 = strongly agree). Persons responding to this statement with a 5 or lower were placed into the lower
skilled user group.
5 Brown et al (1996) in a study of willingness to pay for removal of a road from a wilderness area found expressed WTP
to be 4 to 6 times larger than actual WTP. Lindsey and Knaap (1999) in a study of WTP for a public urban greenway
found expressed WTP to be 2 to 10 times larger than actual WPT. Loomis et al (1996) found expressed willingness to
pay for art prints to be 2 times larger than actual WTP. Neil et. al. (1994) found expressed WTP for conserving an
original painting in the desert to be 9 times larger than actual WTP. Seip and Strand (1992) found that less than 10% of
those who expressed an interest in paying to join an environmental organization actually joined. Willis and Powe (1998)
found that among visitors to a castle, expressed WTP was in 60% lower than actual WTP.
6 The two functions that account for 50% of the “money left on the table” are 41 (Can detect intrusion attempts by
examining client requests) and 16 (Supports NTLM authentication). These two functions are followed in declining order
with respect to money left on the table by functions # 4, 30, 42, 40, 6, 27, 31, 20, 39, 32, 12, 8, 7, 24, 18, 44, 2, 45, 10, 1,
3, 22, 43, 23, 29, 38, 21, 13, 17, 37, 15, 25, 35, 9, 28, 19, 34, 26, 36, 5, 33, 11, and 14. (See Appendix for a capsule
description of each of these numbered functions.)


![Jonathan Stroud - [Bartimaeus 04] - The Ring of Solomon (v4.0) (Epub).Epub](https://img.pdfslide.us/doc/110x75/544ac56faf79599c438b4b1c/jonathan-stroud-bartimaeus-04-the-ring-of-solomon-v40-epubepub.jpg)