Embed Size (px)
Citation preview
CODEN:LUTEDX/(TEAT-7018)/1-15/(1992)
Minimization of the chromaticdispersion over a broad wavelengthrange in a single-mode optical fiber
Richard Lundin
Department of ElectroscienceElectromagnetic TheoryLund Institute of TechnologySweden
Richard Lundin
Department of Electromagnetic TheoryLund Institute of TechnologyP.O. Box 118SE-221 00 LundSweden
Editor: Gerhard Kristenssonc© Richard Lundin, Lund, 1992
1
Abstract
The effective refractive-index as a function of vacuum wavelength is approx-imated by Lagrange interpolation polynomials. The root-mean-square valueof the chromatic dispersion is then calculated analytically. It is demonstratedthat use of fourth degree polynomials is far more efficient than use of seconddegree polynomials. The rms-value of the chromatic dispersion over the wave-length range [1.25 µm, 1.60 µm] is calculated and minimized for step-indexfibers, triangular-index fibers, and α-power fibers. The full vector solution ofMaxwell’s equations is used. It is demonstrated that the approximate modelof the refractive-index, used in this paper and in other papers, induces an errorin the rms-value which is not negligible when designing dispersion-flattenedfibers.
1 Introduction
The predominant transmission medium in long-distance, high-capacity telecom-munication is the single-mode optical fiber. If wavelength multiplexing is to beused in order to further increase transmission capacity, then the chromatic disper-sion should be kept low over a range of vacuum wavelengths [1]. The problem of howto create such dispersion-flattened fibers is approached in this paper. The vacuumwavelength range is chosen as [1.25 µm, 1.60 µm] which is a range of low attenuationin pure silica glass.
The chromatic dispersion is defined in Section 2 and the relation to pulse-broad-ening is explained. The approximate refractive-index model to be used is definedand an efficient method of calculating the root-mean-square value of the chromaticdispersion over a broad wavelength range is presented. The error induced by theapproximate refractive-index model is investigated in the special case of a step-indexfiber. This error has recently been analyzed by Safaai-Jazi and Lu [2].
The rms-value of the chromatic dispersion is minimized in Section 3. The analysisis limited to step-index fibers, triangular-index fibers, and α-power fibers. The re-fractive-index is, in the cases of triangular-index fibers and α-power fibers, assumedto be continuous at the core-cladding boundary. These fibers are all described bytwo variables: the core radius a and the relative refractive-index increase N1 in thecore center. The concept of “relative refractive-index increase” is defined in Section2.3 . The condition that the first higher-order mode should appear at 1.25 µmyields a curved line in the N1-a-plane. The rms-value of the chromatic dispersionis calculated at different points on this line. The point of minimum chromatic dis-persion is then easily located.
2
2 Chromatic dispersion
2.1 Pulse broadening
The field components of a guided mode of an optical fiber include the factor
ej(ωt−βz)
where β is the propagation constant.The group velocity vg and the group delay τg are defined as
vg =dω
dβ(2.1)
τg =1
vg(2.2)
The group velocity, and thus the group delay, varies with the vacuum wavelength.The chromatic dispersion is defined as
C =dτgdλ0
(2.3)
where λ0 is the vacuum wavelength.The chromatic dispersion is of importance when calculating the broadening an
optical pulse undergoes when travelling along an optical fiber [1]. The basic formulain this context is [3].
σ2out = σ2
in + (∆λ0LC)2
where
σ temporal width of light pulse∆λ0 spectral width of light pulseL length of fiberC chromatic dispersion
The effective refractive-index ne is defined as
ne =β
k0
(2.4)
where k0 is the vacuum propagation constant. A useful formula for the chromaticdispersion in a single-mode fiber is
C = −λ0
c
d2nedλ2
0
(2.5)
where c is the speed of light in a vacuum and ne is the effective refractive-index ofthe fundamental mode. The formula (2.5) is derived from (2.1) – (2.4).
3
25
20
15
10
5
0
-5
mat
eria
l dis
pers
ion
in p
s/(k
m n
m)
1.601.551.501.451.401.351.30vacuum wavelength in micrometer
the material dispersionin pure silica
the material dispersionin 13.5 mole-percent Ge-doped silica
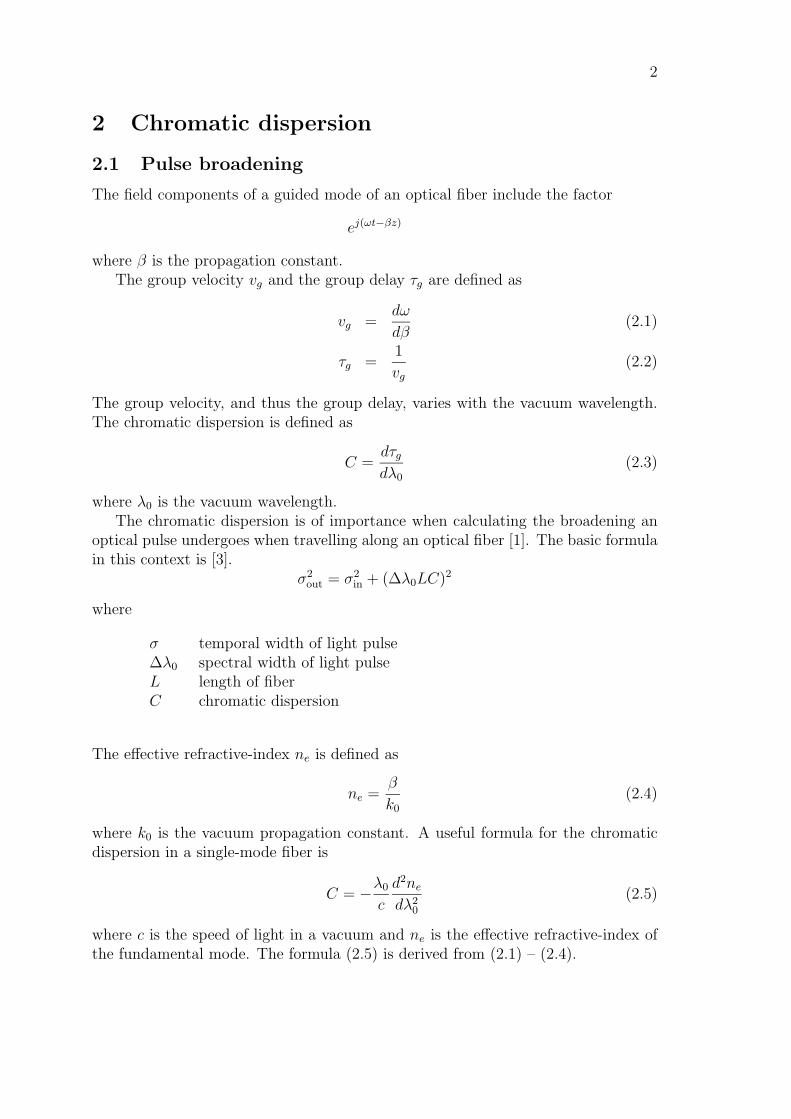
Figure 1: The material dispersion as a function of the vacuum wavelength.
2.2 The refractive-index of pure silica
A formula for the refractive-index of pure silica glass is [4, 5]
ns = C0 + C1λ20 + C2λ
40 +
C3
(λ20 − 0.035)
+C4
(λ20 − 0.035)2
+C5
(λ20 − 0.035)3
(2.6)
where λ0 is in micrometer and the coefficients are given in Table 1. Examples whichcan be used as check-values are
ns(λ0 = 1.25 micrometer) = 1.447825545
ns(λ0 = 1.60 micrometer) = 1.443787805
The material dispersion is defined as
Cm = −λ0
c
d2nsdλ2
0
(2.7)
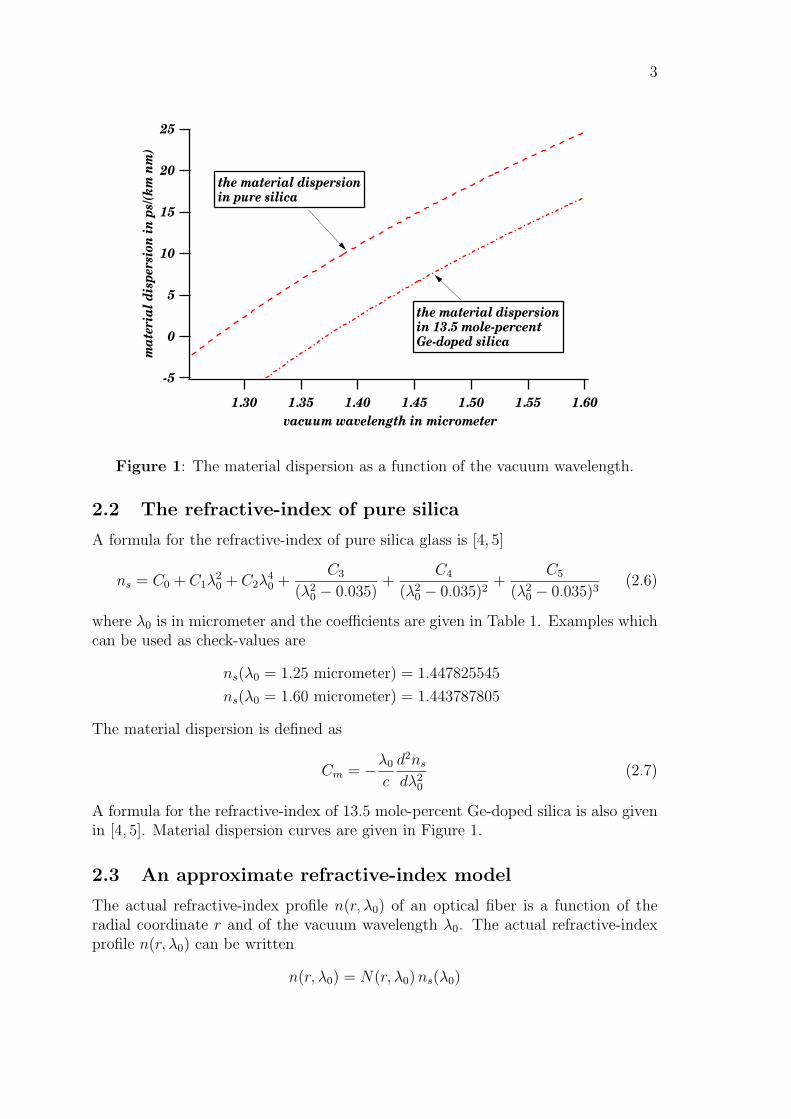
A formula for the refractive-index of 13.5 mole-percent Ge-doped silica is also givenin [4, 5]. Material dispersion curves are given in Figure 1.
2.3 An approximate refractive-index model
The actual refractive-index profile n(r, λ0) of an optical fiber is a function of theradial coordinate r and of the vacuum wavelength λ0. The actual refractive-indexprofile n(r, λ0) can be written
n(r, λ0) = N(r, λ0)ns(λ0)
4
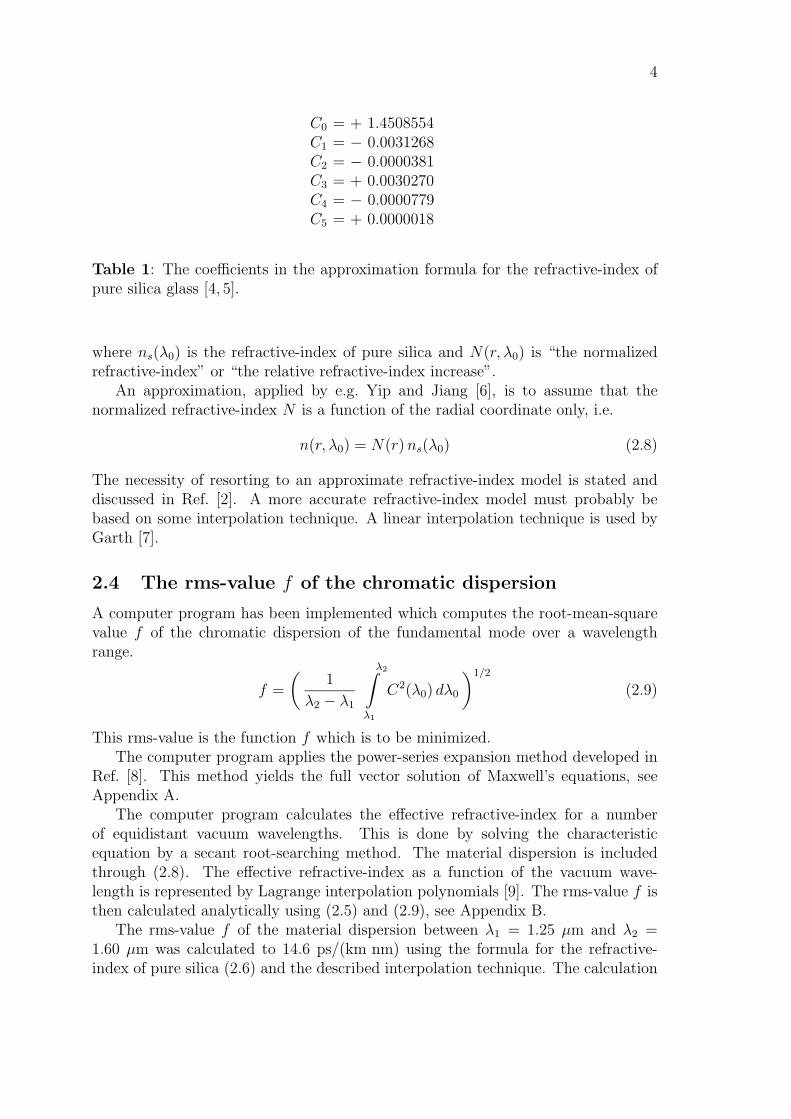
C0 = + 1.4508554C1 = − 0.0031268C2 = − 0.0000381C3 = + 0.0030270C4 = − 0.0000779C5 = + 0.0000018
Table 1: The coefficients in the approximation formula for the refractive-index ofpure silica glass [4, 5].
where ns(λ0) is the refractive-index of pure silica and N(r, λ0) is “the normalizedrefractive-index” or “the relative refractive-index increase”.
An approximation, applied by e.g. Yip and Jiang [6], is to assume that thenormalized refractive-index N is a function of the radial coordinate only, i.e.
n(r, λ0) = N(r)ns(λ0) (2.8)
The necessity of resorting to an approximate refractive-index model is stated anddiscussed in Ref. [2]. A more accurate refractive-index model must probably bebased on some interpolation technique. A linear interpolation technique is used byGarth [7].
2.4 The rms-value f of the chromatic dispersion
A computer program has been implemented which computes the root-mean-squarevalue f of the chromatic dispersion of the fundamental mode over a wavelengthrange.
f =
(1
λ2 − λ1
λ2∫λ1
C2(λ0) dλ0
)1/2
(2.9)
This rms-value is the function f which is to be minimized.The computer program applies the power-series expansion method developed in
Ref. [8]. This method yields the full vector solution of Maxwell’s equations, seeAppendix A.
The computer program calculates the effective refractive-index for a numberof equidistant vacuum wavelengths. This is done by solving the characteristicequation by a secant root-searching method. The material dispersion is includedthrough (2.8). The effective refractive-index as a function of the vacuum wave-length is represented by Lagrange interpolation polynomials [9]. The rms-value f isthen calculated analytically using (2.5) and (2.9), see Appendix B.
The rms-value f of the material dispersion between λ1 = 1.25 µm and λ2 =1.60 µm was calculated to 14.6 ps/(km nm) using the formula for the refractive-index of pure silica (2.6) and the described interpolation technique. The calculation
5
7
6
5
4
3
2
1
nu
mbe
r of
sig
nif
ican
t fi
gure
s
35302520151050number of quadrature points
fourth degree polynomials
second degree polynomials
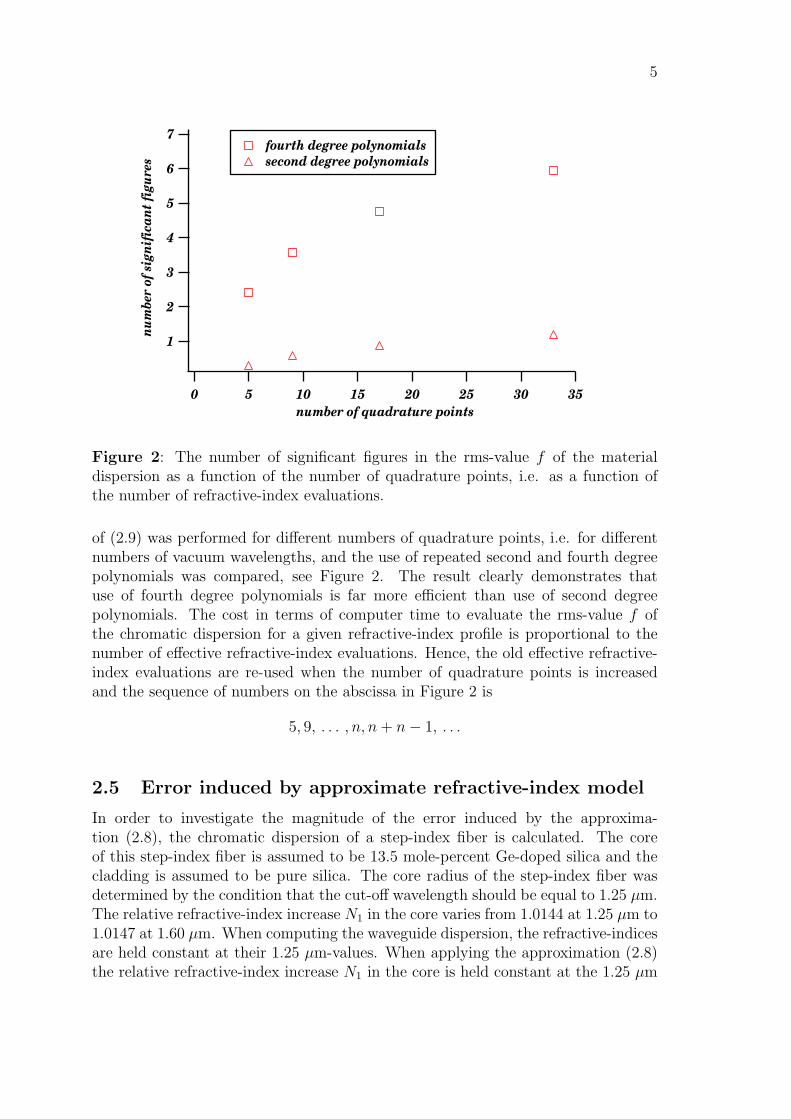
Figure 2: The number of significant figures in the rms-value f of the materialdispersion as a function of the number of quadrature points, i.e. as a function ofthe number of refractive-index evaluations.
of (2.9) was performed for different numbers of quadrature points, i.e. for differentnumbers of vacuum wavelengths, and the use of repeated second and fourth degreepolynomials was compared, see Figure 2. The result clearly demonstrates thatuse of fourth degree polynomials is far more efficient than use of second degreepolynomials. The cost in terms of computer time to evaluate the rms-value f ofthe chromatic dispersion for a given refractive-index profile is proportional to thenumber of effective refractive-index evaluations. Hence, the old effective refractive-index evaluations are re-used when the number of quadrature points is increasedand the sequence of numbers on the abscissa in Figure 2 is
5, 9, . . . , n, n+ n− 1, . . .
2.5 Error induced by approximate refractive-index model
In order to investigate the magnitude of the error induced by the approxima-tion (2.8), the chromatic dispersion of a step-index fiber is calculated. The coreof this step-index fiber is assumed to be 13.5 mole-percent Ge-doped silica and thecladding is assumed to be pure silica. The core radius of the step-index fiber wasdetermined by the condition that the cut-off wavelength should be equal to 1.25 µm.The relative refractive-index increase N1 in the core varies from 1.0144 at 1.25 µm to1.0147 at 1.60 µm. When computing the waveguide dispersion, the refractive-indicesare held constant at their 1.25 µm-values. When applying the approximation (2.8)the relative refractive-index increase N1 in the core is held constant at the 1.25 µm
6
-20
-15
-10
-5
chro
mat
ic d
ispe
rsio
n in
ps/
(km
nm
)
1.601.551.501.451.401.351.301.25vacuum wavelength in micrometer
step-index profile
λcut-off = 1.25 µm
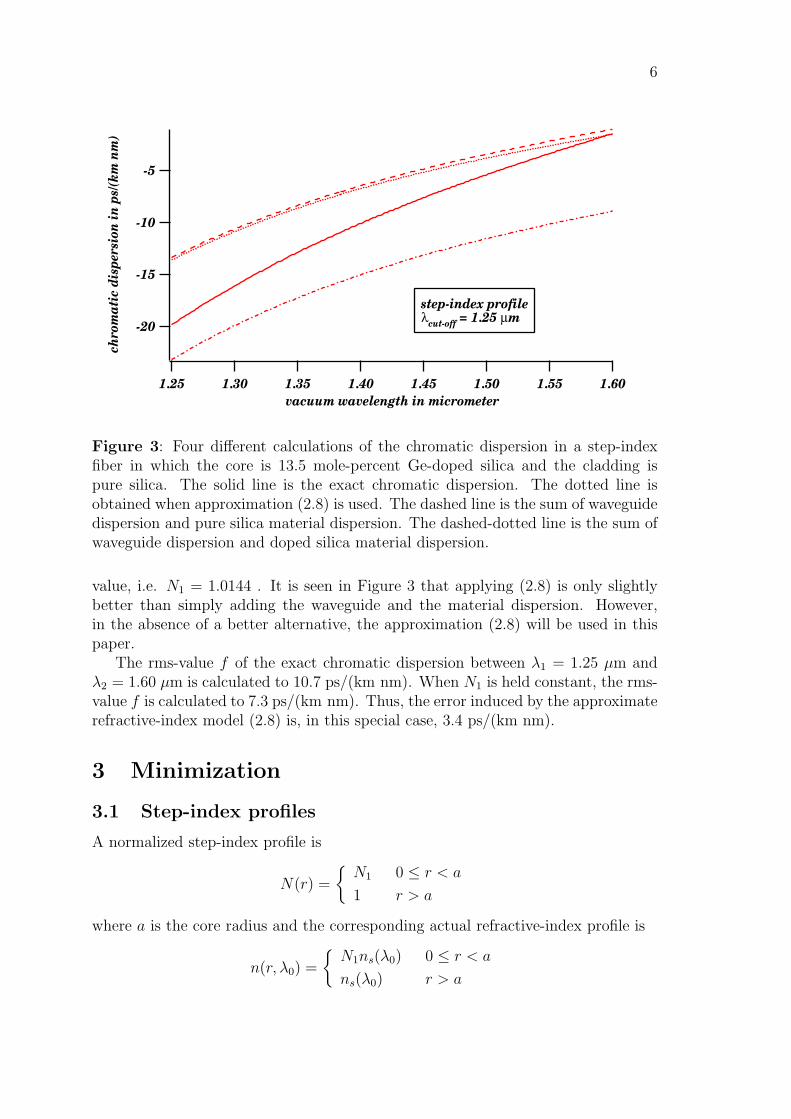
Figure 3: Four different calculations of the chromatic dispersion in a step-indexfiber in which the core is 13.5 mole-percent Ge-doped silica and the cladding ispure silica. The solid line is the exact chromatic dispersion. The dotted line isobtained when approximation (2.8) is used. The dashed line is the sum of waveguidedispersion and pure silica material dispersion. The dashed-dotted line is the sum ofwaveguide dispersion and doped silica material dispersion.
value, i.e. N1 = 1.0144 . It is seen in Figure 3 that applying (2.8) is only slightlybetter than simply adding the waveguide and the material dispersion. However,in the absence of a better alternative, the approximation (2.8) will be used in thispaper.
The rms-value f of the exact chromatic dispersion between λ1 = 1.25 µm andλ2 = 1.60 µm is calculated to 10.7 ps/(km nm). When N1 is held constant, the rms-value f is calculated to 7.3 ps/(km nm). Thus, the error induced by the approximaterefractive-index model (2.8) is, in this special case, 3.4 ps/(km nm).
3 Minimization
3.1 Step-index profiles
A normalized step-index profile is
N(r) =
{N1 0 ≤ r < a
1 r > a
where a is the core radius and the corresponding actual refractive-index profile is
n(r, λ0) =
{N1ns(λ0) 0 ≤ r < a
ns(λ0) r > a
7
1.250
1.248
1.246
1.244
1.242
1.240
cut-
off
wav
elen
gth
in
mic
rom
eter
1.0201.0151.0101.0051.000relative refractive-index increase N1
HE21
step-index profiles λcut-off = 1.25 µm
TM01 and TE01
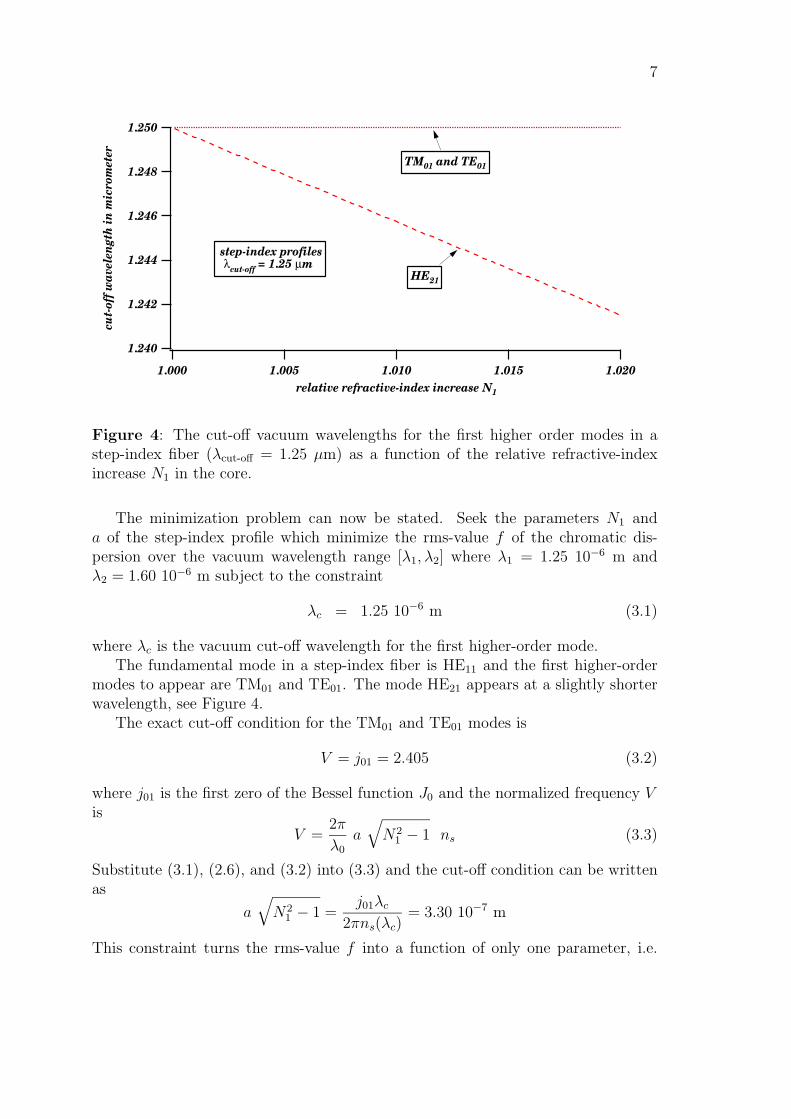
Figure 4: The cut-off vacuum wavelengths for the first higher order modes in astep-index fiber (λcut-off = 1.25 µm) as a function of the relative refractive-indexincrease N1 in the core.
The minimization problem can now be stated. Seek the parameters N1 anda of the step-index profile which minimize the rms-value f of the chromatic dis-persion over the vacuum wavelength range [λ1, λ2] where λ1 = 1.25 10−6 m andλ2 = 1.60 10−6 m subject to the constraint
λc = 1.25 10−6 m (3.1)
where λc is the vacuum cut-off wavelength for the first higher-order mode.The fundamental mode in a step-index fiber is HE11 and the first higher-order
modes to appear are TM01 and TE01. The mode HE21 appears at a slightly shorterwavelength, see Figure 4.
The exact cut-off condition for the TM01 and TE01 modes is
V = j01 = 2.405 (3.2)
where j01 is the first zero of the Bessel function J0 and the normalized frequency Vis
V =2π
λ0
a√N2
1 − 1 ns (3.3)
Substitute (3.1), (2.6), and (3.2) into (3.3) and the cut-off condition can be writtenas
a√N2
1 − 1 =j01λc
2πns(λc)= 3.30 10−7 m
This constraint turns the rms-value f into a function of only one parameter, i.e.
8
14
12
10
8
6
4
2
0
the
rms-
valu
e f
in
ps/
(km
nm
)
1.0201.0151.0101.005
relative refractive-index increase N1
step-index profiles
λcut-off = 1.25 µm
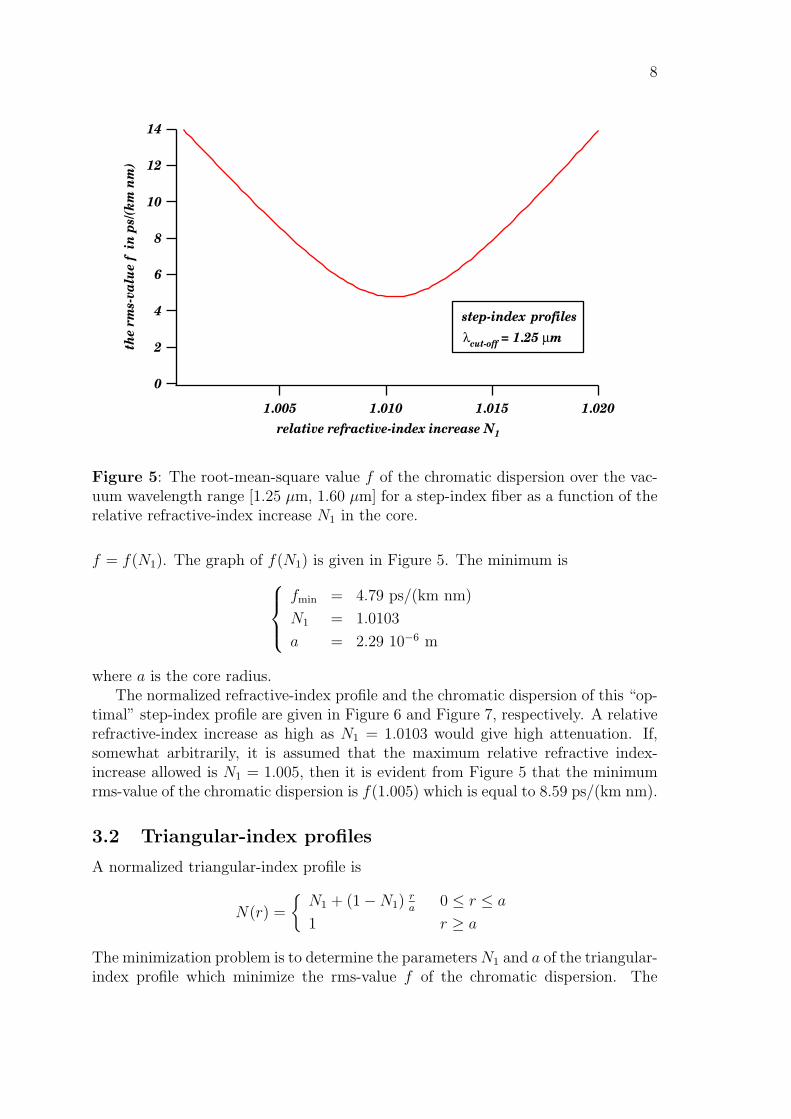
Figure 5: The root-mean-square value f of the chromatic dispersion over the vac-uum wavelength range [1.25 µm, 1.60 µm] for a step-index fiber as a function of therelative refractive-index increase N1 in the core.
f = f(N1). The graph of f(N1) is given in Figure 5. The minimum is
fmin = 4.79 ps/(km nm)
N1 = 1.0103
a = 2.29 10−6 m
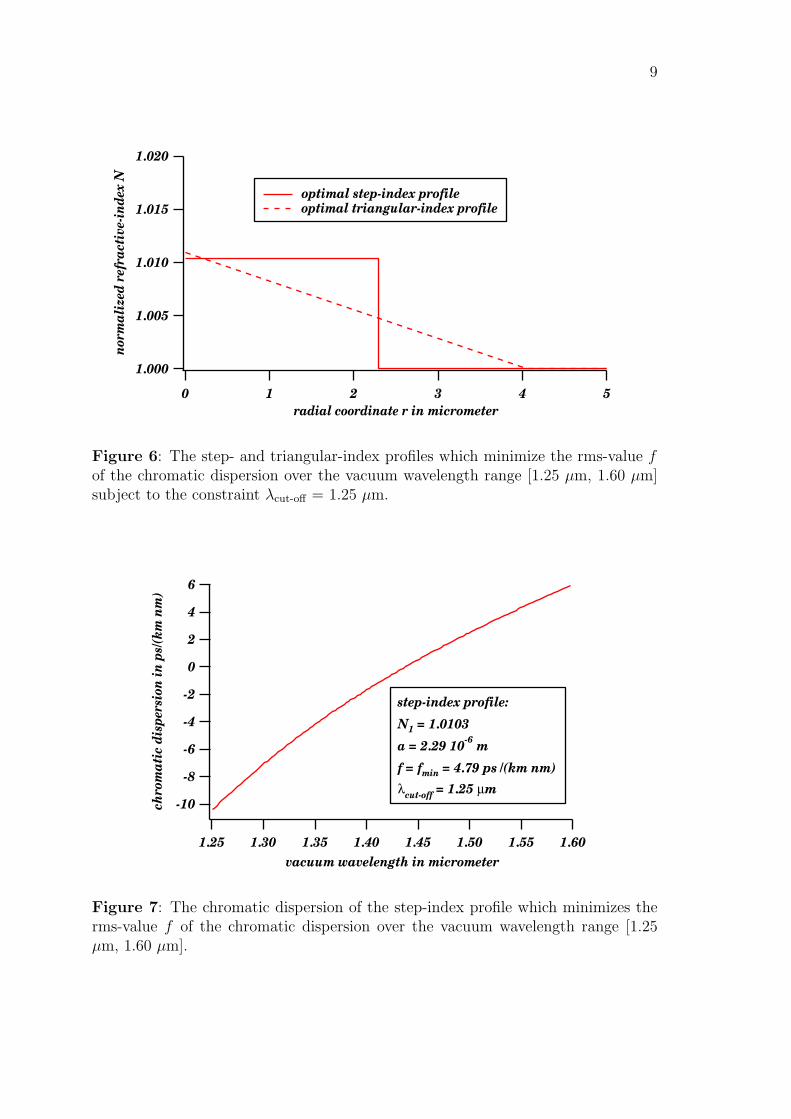
where a is the core radius.The normalized refractive-index profile and the chromatic dispersion of this “op-
timal” step-index profile are given in Figure 6 and Figure 7, respectively. A relativerefractive-index increase as high as N1 = 1.0103 would give high attenuation. If,somewhat arbitrarily, it is assumed that the maximum relative refractive index-increase allowed is N1 = 1.005, then it is evident from Figure 5 that the minimumrms-value of the chromatic dispersion is f(1.005) which is equal to 8.59 ps/(km nm).
3.2 Triangular-index profiles
A normalized triangular-index profile is
N(r) =
{N1 + (1−N1)
ra
0 ≤ r ≤ a
1 r ≥ a
The minimization problem is to determine the parametersN1 and a of the triangular-index profile which minimize the rms-value f of the chromatic dispersion. The
9
1.020
1.015
1.010
1.005
1.000
nor
mal
ized
ref
ract
ive-
inde
x N
543210radial coordinate r in micrometer
optimal step-index profile
optimal triangular-index profile
Figure 6: The step- and triangular-index profiles which minimize the rms-value fof the chromatic dispersion over the vacuum wavelength range [1.25 µm, 1.60 µm]subject to the constraint λcut-off = 1.25 µm.
-10
-8
-6
-4
-2
0
2
4
6
chro
mat
ic d
ispe
rsio
n in
ps/
(km
nm
)
1.601.551.501.451.401.351.301.25vacuum wavelength in micrometer
step-index profile: N1 = 1.0103
a = 2.29 10-6 m
f = fmin = 4.79 ps /(km nm) λcut-off = 1.25 µm
Figure 7: The chromatic dispersion of the step-index profile which minimizes therms-value f of the chromatic dispersion over the vacuum wavelength range [1.25µm, 1.60 µm].
10
1.250
1.248
1.246
1.244
1.242
1.240
cut-
off
wav
elen
gth
in
mic
rom
eter
1.0201.0151.0101.0051.000relative refractive-index increase N1
TE01
Hyb21
TM01
triangle-index profiles λcut-off = 1.25 µm
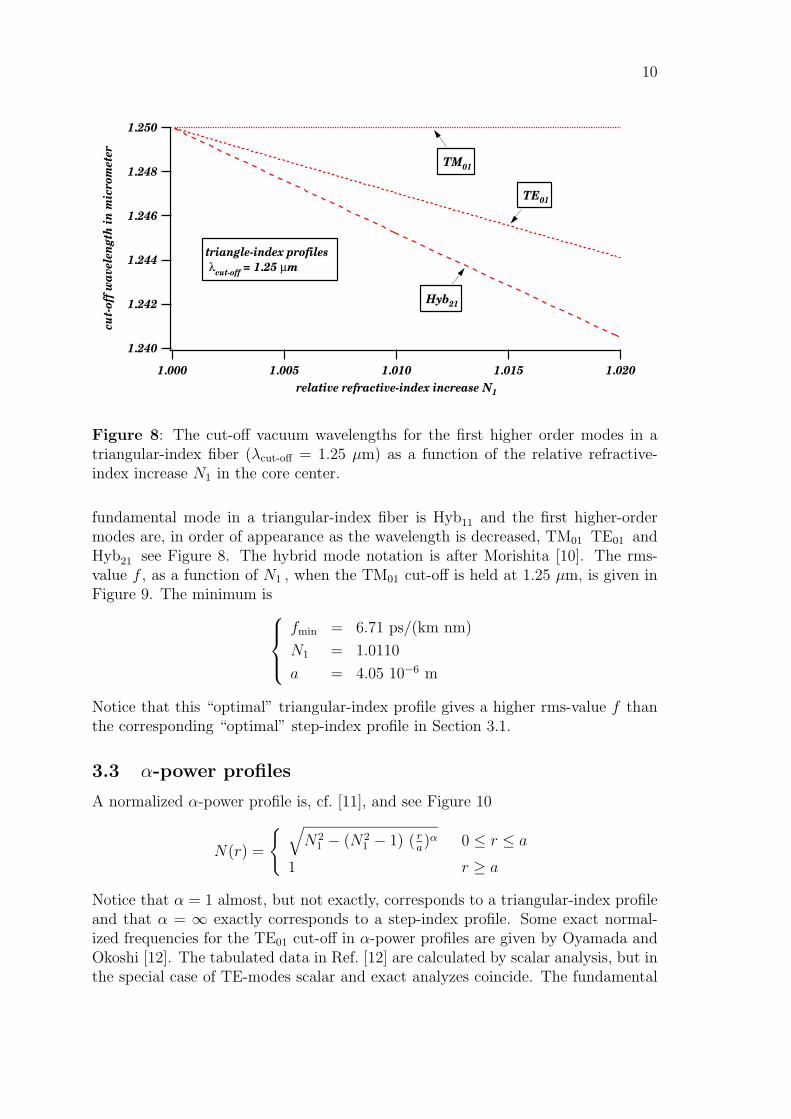
Figure 8: The cut-off vacuum wavelengths for the first higher order modes in atriangular-index fiber (λcut-off = 1.25 µm) as a function of the relative refractive-index increase N1 in the core center.
fundamental mode in a triangular-index fiber is Hyb11 and the first higher-ordermodes are, in order of appearance as the wavelength is decreased, TM01 TE01 andHyb21 see Figure 8. The hybrid mode notation is after Morishita [10]. The rms-value f , as a function of N1 , when the TM01 cut-off is held at 1.25 µm, is given inFigure 9. The minimum is
fmin = 6.71 ps/(km nm)
N1 = 1.0110
a = 4.05 10−6 m
Notice that this “optimal” triangular-index profile gives a higher rms-value f thanthe corresponding “optimal” step-index profile in Section 3.1.
3.3 α-power profiles
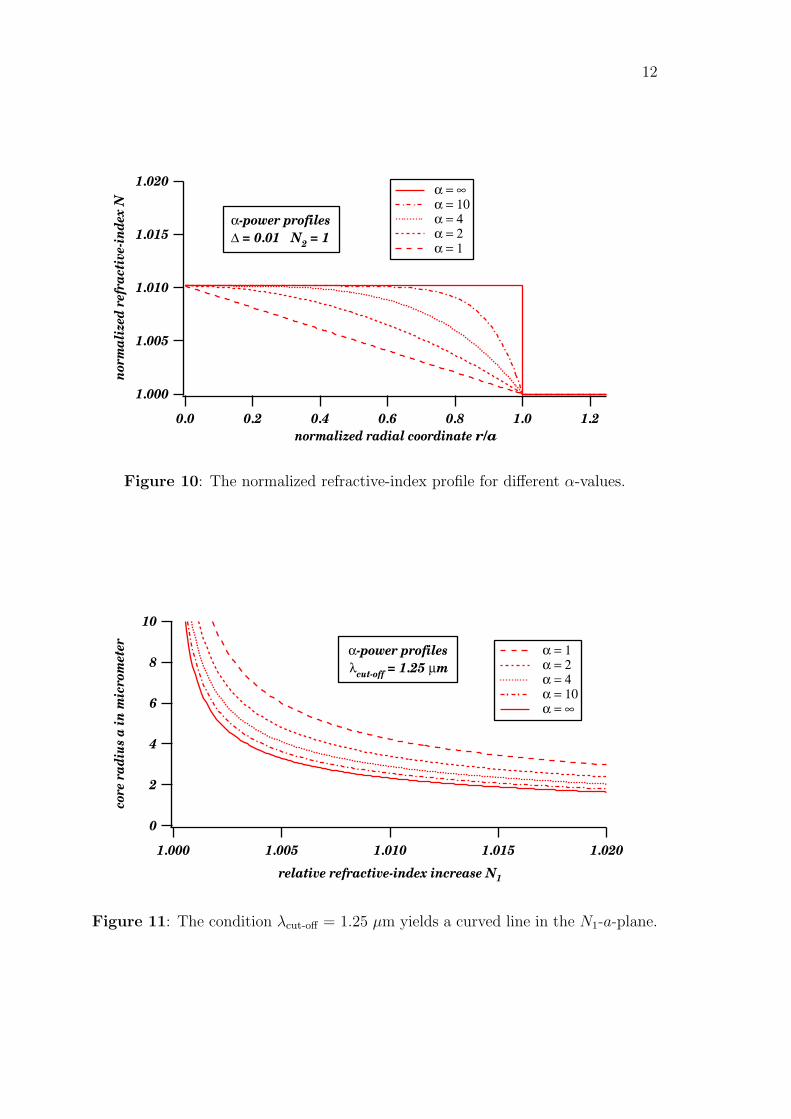
A normalized α-power profile is, cf. [11], and see Figure 10
N(r) =
{ √N2
1 − (N21 − 1) ( r
a)α 0 ≤ r ≤ a
1 r ≥ a
Notice that α = 1 almost, but not exactly, corresponds to a triangular-index profileand that α = ∞ exactly corresponds to a step-index profile. Some exact normal-ized frequencies for the TE01 cut-off in α-power profiles are given by Oyamada andOkoshi [12]. The tabulated data in Ref. [12] are calculated by scalar analysis, but inthe special case of TE-modes scalar and exact analyzes coincide. The fundamental

11
16
14
12
10
8
6
4
2
0
the
rms-
valu
e f i
n p
s/(k
m n
m)
1.0201.0151.0101.0051.000
relative refractive-index increase N1
The rms-value f
triangle-index profiles
λcut-off = 1.25 µm
Figure 9: The root-mean-square value f of the chromatic dispersion over the vac-uum wavelength range [1.25 µm, 1.60 µm] for a triangle-index fiber as a function ofthe relative refractive-index increase N1 in the core center.
mode in an α-power fiber is Hyb11 and the first higher-order mode to appear isTM01. The condition that the TM01 cut-off is 1.25 µm yields a curved line in theN1-a-plane, see Figure 11. The TE01 cut-off is given in Figure 12. The step-indexfiber provides the lowest root-mean-square chromatic dispersion, see Figure 13.
4 Conclusion
The rms-value of the chromatic dispersion can be efficiently evaluated by Lagrangeinterpolation followed by analytical differentiation and integration. The error inthis rms-value, induced by the approximate model (2.8) of the refractive-index, iscalculated to as much as 3.4 ps/(km nm) for a strongly doped, step-index fiber. Ithas been demonstrated that with this approximate model of the refractive-index andwithin the class of α-power profiles, the step-index fiber provides the lowest rms-value of the chromatic dispersion over the wavelength range [1.25 µm, 1.60 µm],namely 4.79 ps/(km nm).
Appendix A A power-series expansion method
The method in Ref. [8] is developed for a cylindrical dielectric waveguide with apiece-wise polynomial permittivity profile in the radial direction. The relative per-mittivity is equal to the square of the refractive-index. A system of four ordinarydifferential equations is derived from Maxwell’s equations. This system has twobounded solutions in the core. These solutions are constructed by a sequence ofpower-series expansions. The two bounded solutions in the cladding are expressed in
12
1.020
1.015
1.010
1.005
1.000
nor
mal
ized
ref
ract
ive-
inde
x N
1.21.00.80.60.40.20.0normalized radial coordinate r/a
α = ∞ α = 10 α = 4 α = 2 α = 1
α-power profiles
∆ = 0.01 N2 = 1
Figure 10: The normalized refractive-index profile for different α-values.
10
8
6
4
2
0
core
rad
ius
a in
mic
rom
eter
1.0201.0151.0101.0051.000
relative refractive-index increase N1
α-power profiles λcut-off = 1.25 µm
α = 1 α = 2 α = 4 α = 10 α = ∞
Figure 11: The condition λcut-off = 1.25 µm yields a curved line in the N1-a-plane.

13
1.250
1.249
1.248
1.247
1.246
1.245
1.244cut-
off
wav
elen
gth
in
mic
rom
eter
1.0201.0151.0101.0051.000
relative refractive-index increase N1
α-power profiles λcut-off = 1.25 µm
cut-off for TE01
α = ∞ α = 10 α = 4 α = 2 α = 1
Figure 12: The cut-off vacuum wavelength for the TE01 mode as a function of therelative refractive-index increase N1 in the core center for different α-power profiles.Cut-off for TM01 is 1.25 µm.
10
9
8
7
6
5
4
the
rms-
valu
e f i
n p
s/(k
m n
m)
1.0201.0151.0101.0051.000relative refractive-index increase N1
α-power profiles λcut-off = 1.25 µm
α = 1 α = 2 α = 4 α = 10 α = ∞
Figure 13: The rms-value f of the chromatic dispersion over the vacuum wave-length range [1.25 µm, 1.60 µm] for different α-power fibers as a function of therelative refractive-index increase N1 in the core center.

14
modified Bessel functions. The characteristic equation is obtained from the bound-ary conditions at the core-cladding interface. The propagation constant, and thusthe effective refractive-index ne, is obtained as a root of the characteristic equation.One detail, not explicitly mentioned in Ref. [8], is that when the azimuthal modenumber is equal to zero, the characteristic equation splits into a TM-case and a TE-case. These cases should, of course, be treated separately, otherwise double-rootsand closely spaced roots appear when solving the characteristic equation.
Appendix B Calculation of chromatic dispersion
The relevant mathematical problem in the evaluation of the rms-value of the chro-matic dispersion (2.9) is to calculate the integral∫ b
a
x2
(d2f
dx2
)2
dx
in which x stands for wavelength and f stands for effective refractive-index. Thefunction f is approximated by the fourth-degree polynomial passing through thefollowing five points [9]
xp =a+ b
2+ p
b− a4
p = −2,−1, 0, 1, 2
This polynomial is differentiated twice.
d2f
dx2=
(4
b− a
)2d2f
dp2
where
d2f
dp2=−f−2 + 16f−1 − 30f0 + 16f1 − f2
12+
+−f−2 + 2f−1 − 2f1 + f2
2p+
+f−2 − 4f−1 + 6f0 − 4f1 + 6f2
2p2
The three coefficients in this polynomial in p should be calculated numerically.∫ b
a
x2
(d2f
dx2
)2
dx =
(a+ b
2
)2 (4
b− a
)3 ∫ 2
−2
(d2f
dp2
)2
dp+
+
(a+ b
2
) (4
b− a
)2 ∫ 2
−2
2p
(d2f
dp2
)2
dp+
+
(4
b− a
) ∫ 2
−2
p2
(d2f
dp2
)2
dp
Integration gives the final expression which is used as a quadrature rule.

15
References
[1] B. J. Ainslie and C. R. Day, “A review of single-mode fibers with modifieddispersion characteristics,” J. Lightwave Technol., vol. LT-4, pp. 967-979, 1986.
[2] A. Safaai-Jazi and L. J. Lu,“Accuracy of approximate methods for the evalu-ation of chromatic dispersion in dispersion-flattened fibers,’J. Lightwave Tech-nol., vol. 8, pp. 1145-1150, 1990.
[3] D. Marcuse, “Pulse distortion in single-mode fibers,” Appl. Opt., vol. 19, pp.1653-1660, 1980.
[4] G. E. Peterson et al., “An exact numerical solution to Maxwell’s equations forlightguides,” Bell Syst. Tech. J., vol. 59, pp. 1175-1196, 1980.
[5] J. W. Fleming, “Material dispersion in lightguide glasses,” Electron. Lett., vol.14, pp. 326-328, 1978.
[6] G. L. Yip and J. J. Jiang,“Dispersion studies of a single-mode triangular-indexfiber with a trench by the vector mode analysis,”Appl. Opt., vol. 29, pp. 5343-5352, 1990.
[7] S. J. Garth,“Effect of bending on zero dispersion operation of single-mode op-tical fibers,”Appl. Opt., vol. 30, pp. 1048-1051, 1991.
[8] R. Lundin, “A general power-series expansion method for exact analysis ofthe guided modes in an optical fiber,” J. Lightwave Technol., vol. LT-4, pp.1617-1625, 1986.
[9] M. Abramowitz and I. A. Stegun, Eds. Handbook of Mathematical Functions ,Washington, DC: NBS, 1964, pp. 878-879.
[10] K. Morishita, “Hybrid modes in circular cylindrical optical fibers,”IEEE Trans.Microwave Theory Tech., vol. MTT-31, pp. 344-350, 1983.
[11] G. Keiser, Optical Fiber Communications , McGraw-Hill, 1983, p. 39.
[12] K. Oyamada and T. Okoshi, “High-accuracy numerical data on propagationcharacteristics of α-power graded core fibers,”IEEE Trans. Microwave TheoryTech., vol. MTT-28, pp. 1113-1118, 1980.