Embed Size (px)
Citation preview

UNITED STATESSECURITIES AND EXCHANGE COMMISSION
Washington, D.C. 20549
FORM 10-QþQUARTERLY REPORT PURSUANT TO SECTION 13 OR 15(d) OF THE SECURITIES EXCHANGE ACT OF 1934
For the quarterly period ended June 30, 2018or
¨TRANSITION REPORT PURSUANT TO SECTION 13 OR 15(d) OF THE SECURITIES EXCHANGE ACT OF 1934
For the transition period from _______ to ________
Commission file number: 001-38196
DOWDUPONT INC.(Exact name of registrant as specified in its charter)
Delaware 81-1224539State or other jurisdiction of incorporation or organization (I.R.S. Employer Identification No.)
c/o The Dow Chemical Company c/o E. I. du Pont de Nemours and Company2211 H.H. Dow Way, Midland, MI 48674 974 Centre Road, Wilmington, DE 19805
(989) 636-1000 (302) 774-1000(Name, address, including zip code, and telephone number, including area code, of registrant's principal executive offices)
2030 Dow Center, Midland, MI 48674 (Former name, former address and formal fiscal year, if changed since last report)
Indicate by check mark whether the registrant (1) has filed all reports required to be filed by Section 13 or 15(d) of the Securities Exchange Act of 1934 during thepreceding 12 months (or for such shorter period that the registrant was required to file such reports), and (2) has been subject to such filing requirements for thepast 90 days.
þYes ¨No
Indicate by check mark whether the registrant has submitted electronically and posted on its corporate Web site, if any, every Interactive Data File required to besubmitted and posted pursuant to Rule 405 of Regulation S-T (§2 32.405 of this chapter) during the preceding 12 months (or for such shorter period that theregistrant was required to submit and post such files).
þYes ¨No
Indicate by check mark whether the registrant is a large accelerated filer, an accelerated filer, a non-accelerated filer, smaller reporting company, or an emerginggrowth company. See the definitions of “large accelerated filer,” “accelerated filer,” “smaller reporting company,” and "emerging growth company" in Rule 12b-2of the Exchange Act.
Large accelerated filer þ Accelerated filer ¨ Non-accelerated filer ¨ Smaller reporting company ¨ Emerging growth company ¨
If an emerging growth company, indicate by check mark if the registrant has elected not to use the extended transition period for complying with any new orrevised financial accounting standards provided pursuant to Section 13(a) of the Exchange Act. ¨
Indicate by check mark whether the registrant is a shell company (as defined in Rule 12b-2 of the Act). ¨Yes þNo
The registrant had 2,307,376,875 shares of common stock, $0.01 par value, outstanding at July 31, 2018.

Table of Contents
DOWDUPONT INC.
QUARTERLY REPORT ON FORM 10-QFor the quarterly period ended June 30, 2018
TABLE OF CONTENTS
PART 1 - FINANCIAL INFORMATION PAGEItem 1. Financial Statements. 4 Consolidated Statements of Income. 4 Consolidated Statements of Comprehensive Income. 5 Consolidated Balance Sheets. 6 Consolidated Statements of Cash Flows. 7 Consolidated Statements of Equity. 8 Notes to the Consolidated Financial Statements. 9Item 2. Management's Discussion and Analysis of Financial Condition and Results of Operations. 49 Results of Operations. 51 Changes in Financial Condition. 72 Other Matters. 78Item 3. Quantitative and Qualitative Disclosures About Market Risk. 79Item 4. Controls and Procedures . 79 PART II - OTHER INFORMATION Item 1. Legal Proceedings. 80Item 1A. Risk Factors. 81Item 2. Unregistered Sales of Equity Securities and Use of Proceeds. 81Item 4. Mine Safety Disclosures. 81Item 5. Other Information. 82Item 6. Exhibits. 83 SIGNATURES 85
2

Table of Contents
DowDuPont Inc.
Throughout this Quarterly Report on Form 10-Q, except as otherwise noted by the context, the terms "Company" or "DowDuPont" used herein mean DowDuPontInc. and its consolidated subsidiaries.
FORWARD-LOOKING STATEMENTSThis communication contains “forward-looking statements” within the meaning of the federal securities laws, including Section 27A of the Securities Act of 1933,as amended, and Section 21E of the Securities Exchange Act of 1934, as amended. In this context, forward-looking statements often address expected futurebusiness and financial performance and financial condition, and often contain words such as “expect,” “anticipate,” “intend,” “plan,” “believe,” “seek,” “see,”“will,” “would,” “target,” and similar expressions and variations or negatives of these words.
On December 11, 2015, The Dow Chemical Company (“Dow”) and E. I. du Pont de Nemours and Company (“DuPont”) entered into an Agreement and Plan ofMerger, as amended on March 31, 2017, (the “Merger Agreement”) under which the companies would combine in an all-stock merger of equals transaction (the“Merger”). Effective August 31, 2017, the Merger was completed and each of Dow and DuPont became subsidiaries of DowDuPont (Dow and DuPont, and theirrespective subsidiaries, collectively referred to as the "Subsidiaries").
Forward-looking statements by their nature address matters that are, to varying degrees, uncertain, including the intended separation, subject to approval of theCompany’s Board of Directors and customary closing conditions, of DowDuPont’s agriculture, materials science and specialty products businesses in one or moretax-efficient transactions on anticipated terms (the “Intended Business Separations”). Forward-looking statements are not guarantees of future performance and arebased on certain assumptions and expectations of future events which may not be realized. Forward-looking statements also involve risks and uncertainties, manyof which are beyond the Company’s control. Some of the important factors that could cause DowDuPont’s, Dow’s or DuPont’s actual results to differ materiallyfrom those projected in any such forward-looking statements include, but are not limited to: (i) costs to achieve and achieving the successful integration of therespective agriculture, materials science and specialty products businesses of Dow and DuPont, anticipated tax treatment, unforeseen liabilities, future capitalexpenditures, revenues, expenses, earnings, productivity actions, economic performance, indebtedness, financial condition, losses, future prospects, business andmanagement strategies for the management, expansion and growth of the combined operations; (ii) costs to achieve and achievement of the anticipated synergiesby the combined agriculture, materials science and specialty products businesses; (iii) risks associated with the Intended Business Separations, including conditionswhich could delay, prevent or otherwise adversely affect the proposed transactions, including possible issues or delays in obtaining required regulatory approvalsor clearances related to the Intended Business Separations, associated costs, disruptions in the financial markets or other potential barriers; (iv) disruptions orbusiness uncertainty, including from the Intended Business Separations, could adversely impact DowDuPont’s business (either directly or as conducted by andthrough Dow or DuPont), or financial performance and its ability to retain and hire key personnel; (v) uncertainty as to the long-term value of DowDuPontcommon stock; and (vi) risks to DowDuPont’s, Dow’s and DuPont’s business, operations and results of operations from: the availability of and fluctuations in thecost of feedstocks and energy; balance of supply and demand and the impact of balance on prices; failure to develop and market new products and optimallymanage product life cycles; ability, cost and impact on business operations, including the supply chain, of responding to changes in market acceptance, rules,regulations and policies and failure to respond to such changes; outcome of significant litigation, environmental matters and other commitments and contingencies;failure to appropriately manage process safety and product stewardship issues; global economic and capital market conditions, including the continued availabilityof capital and financing, as well as inflation, interest and currency exchange rates; changes in political conditions, including trade disputes and retaliatory actions;business or supply disruptions; security threats, such as acts of sabotage, terrorism or war, natural disasters and weather events and patterns which could result in asignificant operational event for the Company, adversely impact demand or production; ability to discover, develop and protect new technologies and to protectand enforce the Company’s intellectual property rights; failure to effectively manage acquisitions, divestitures, alliances, joint ventures and other portfoliochanges; unpredictability and severity of catastrophic events, including, but not limited to, acts of terrorism or outbreak of war or hostilities, as well asmanagement’s response to any of the aforementioned factors. These risks are and will be more fully discussed in the current, quarterly and annual reports filed withthe U.S. Securities and Exchange Commission by DowDuPont. While the list of factors presented here is considered representative, no such list should beconsidered to be a complete statement of all potential risks and uncertainties. Unlisted factors may present significant additional obstacles to the realization offorward-looking statements. Consequences of material differences in results as compared with those anticipated in the forward-looking statements could include,among other things, business disruption, operational problems, financial loss, legal liability to third parties and similar risks, any of which could have a materialadverse effect on DowDuPont’s, Dow’s or DuPont’s consolidated financial condition, results of operations, credit rating or liquidity. None of DowDuPont, Dow orDuPont assumes any obligation to publicly provide revisions or updates to any forward-looking statements whether as a result of new information, futuredevelopments or otherwise, should circumstances change, except as otherwise required by securities and other applicable laws. A detailed discussion of some ofthe significant risks and uncertainties which may cause results and events to differ materially from such forward-looking statements is included in the section titled“Risk Factors” (Part I, Item 1A) of DowDuPont’s 2017 Annual Report on Form 10-K.
3

Table of Contents
PART I - FINANCIAL INFORMATION
ITEM 1. FINANCIAL STATEMENTSDowDuPont Inc.
Consolidated Statements of Income
ThreeMonthsEnded SixMonthsEnded
In millions, except per share amounts (Unaudited) Jun30,2018 Jun30,2017 Jun30,2018 Jun30,2017Net sales $ 24,245 $ 13,834 $ 45,755 $ 27,064
Cost of sales 17,974 10,761 34,289 20,955Research and development expenses 803 408 1,571 827Selling, general and administrative expenses 1,933 720 3,647 1,479Amortization of intangibles 488 157 962 312Restructuring and asset related charges (credits) - net 189 (12) 451 (13)Integration and separation costs 558 136 1,015 245Equity in earnings of nonconsolidated affiliates 250 54 507 250Sundry income (expense) - net 178 322 293 (122)Interest expense and amortization of debt discount 360 226 710 445
Income from continuing operations before income taxes 2,368 1,814 3,910 2,942Provision for income taxes on continuing operations 565 455 954 668
Income from continuing operations, net of tax 1,803 1,359 2,956 2,274Loss from discontinued operations, net of tax — — (5) —
Net income 1,803 1,359 2,951 2,274Net income attributable to noncontrolling interests 35 38 79 65
Net income available for DowDuPont Inc. common stockholders $ 1,768 $ 1,321 $ 2,872 $ 2,209
Per common share data: Earnings per common share from continuing operations - basic $ 0.76 $ 1.08 $ 1.24 $ 1.82Loss per common share from discontinued operations - basic — — — —Earnings per common share - basic $ 0.76 $ 1.08 $ 1.24 $ 1.82Earnings per common share from continuing operations - diluted $ 0.76 $ 1.07 $ 1.23 $ 1.79Loss per common share from discontinued operations - diluted — — — —Earnings per common share - diluted $ 0.76 $ 1.07 $ 1.23 $ 1.79
Dividends declared per share of common stock $ 0.76 $ 0.46 $ 1.14 $ 0.92Weighted-average common shares outstanding - basic 2,308.9 1,211.8 2,312.9 1,207.2Weighted-average common shares outstanding - diluted 2,323.6 1,229.0 2,329.0 1,225.5
Depreciation $ 940 $ 534 $ 1,893 $ 1,112Capital expenditures $ 810 $ 795 $ 1,586 $ 1,549SeeNotestotheConsolidatedFinancialStatements.
4

DowDuPont Inc.Consolidated Statements of Comprehensive Income
ThreeMonthsEnded SixMonthsEnded
In millions (Unaudited) Jun30,2018 Jun30,2017 Jun30,2018 Jun30,2017Net income $ 1,803 $ 1,359 $ 2,951 $ 2,274Other comprehensive income (loss), net of tax
Unrealized gains (losses) on investments (14) (9) (39) 8Cumulative translation adjustments (2,393) 387 (1,060) 626Pension and other postretirement benefit plans 127 101 257 203Derivative instruments 102 (39) 119 (89)Total other comprehensive income (loss) (2,178) 440 (723) 748
Comprehensive income (loss) (375) 1,799 2,228 3,022Comprehensive income attributable to noncontrolling interests, net of tax 2 40 40 93
Comprehensive income (loss) attributable to DowDuPont Inc. $ (377) $ 1,759 $ 2,188 $ 2,929SeeNotestotheConsolidatedFinancialStatements.
5

DowDuPont Inc.Consolidated Balance Sheets
In millions, except per share amounts (Unaudited) Jun30,2018 Dec31,2017
Assets Current Assets
Cash and cash equivalents (variable interest entities restricted - 2018: $116; 2017: $107) $ 9,244 $ 13,438Marketable securities 507 956Accounts and notes receivable:
Trade (net of allowance for doubtful receivables - 2018: $156; 2017: $127) 15,379 11,314 Other 4,924 5,579
Inventories 15,630 16,992Other current assets 2,213 1,614
Total current assets 47,897 49,893
InvestmentsInvestment in nonconsolidated affiliates 5,214 5,336Other investments (investments carried at fair value - 2018: $1,730; 2017: $1,512) 2,538 2,564Noncurrent receivables 578 680
Total investments 8,330 8,580
PropertyProperty 73,664 73,304Less accumulated depreciation 38,440 37,057
Net property (variable interest entities restricted - 2018: $786; 2017: $907) 35,224 36,247
Other AssetsGoodwill 59,404 59,527Other intangible assets (net of accumulated amortization - 2018: $6,451; 2017: $5,550) 32,102 33,274Deferred income tax assets 1,701 1,869Deferred charges and other assets 2,709 2,774
Total other assets 95,916 97,444
Total Assets $ 187,367 $ 192,164
Liabilities and Equity Current Liabilities
Notes payable $ 2,794 $ 1,948Long-term debt due within one year 4,606 2,067Accounts payable:
Trade 7,983 9,134 Other 4,662 3,727
Income taxes payable 874 843Accrued and other current liabilities 7,191 8,409
Total current liabilities 28,110 26,128
Long-Term Debt (variable interest entities nonrecourse - 2018: $147; 2017: $249) 26,850 30,056
Other Noncurrent LiabilitiesDeferred income tax liabilities 5,885 6,266Pension and other postretirement benefits - noncurrent 17,694 18,581Asbestos-related liabilities - noncurrent 1,179 1,237Other noncurrent obligations 7,767 7,969
Total other noncurrent liabilities 32,525 34,053
Stockholders' EquityCommon stock (authorized 5,000,000,000 shares of $0.01 par value each;
issued 2018: 2,350,333,589 shares; 2017: 2,341,455,518 shares) 24 23Additional paid-in capital 81,683 81,257Retained earnings 30,432 29,211Accumulated other comprehensive loss (10,732) (8,972)Unearned ESOP shares (145) (189)Treasury stock at cost (2018: 43,239,857 shares; 2017: 14,123,049 shares) (3,000) (1,000)
DowDuPont's stockholders' equity 98,262 100,330
Noncontrolling interests 1,620 1,597

Total equity 99,882 101,927
Total Liabilities and Equity $ 187,367 $ 192,164SeeNotestotheConsolidatedFinancialStatements.
6

DowDuPont Inc.Consolidated Statements of Cash Flows
SixMonthsEnded
In millions (Unaudited) Jun30,2018 Jun30,2017Operating Activities
Net income $ 2,951 $ 2,274Adjustments to reconcile net income to net cash used for operating activities:
Depreciation and amortization 2,980 1,517Provision (Credit) for deferred income tax (182) 40Earnings of nonconsolidated affiliates less than dividends received 199 310Net periodic pension benefit cost 56 219Pension contributions (500) (381)Net gain on sales of assets, businesses and investments (67) (190)Adjustment to gain on step acquisition of nonconsolidated affiliate 41 —Restructuring and asset related charges (credits) - net 451 (13)Amortization of Merger-related inventory step-up 1,385 —Other net loss 425 252
Changes in assets and liabilities, net of effects of acquired and divested companies: Accounts and notes receivable (4,454) (3,233)Inventories (222) (839)Accounts payable 65 826Other assets and liabilities, net (3,175) (883)
Cash used for operating activities (47) (101)Investing Activities
Capital expenditures (1,586) (1,549)Investment in gas field developments (46) (68)Proceeds from sales of property and businesses, net of cash divested 96 215Investments in and loans to nonconsolidated affiliates (2) (484)Distributions and loan repayments from nonconsolidated affiliates 55 54Proceeds from sale of ownership interests in nonconsolidated affiliates — 54Purchases of investments (1,891) (379)Proceeds from sales and maturities of investments 2,328 435Proceeds from interests in trade accounts receivable conduits 656 1,914Cash provided by (used for) investing activities (390) 192
Financing Activities Changes in short-term notes payable 800 288Proceeds from issuance of long-term debt 254 —Payments on long-term debt (842) (105)Purchases of treasury stock (2,000) —Proceeds from issuance of company stock 142 —Proceeds from sales of common stock — 357Employee taxes paid for share-based payment arrangements (118) (85)Contingent payment for acquisition of businesses — (31)Distributions to noncontrolling interests (79) (51)Dividends paid to stockholders (1,755) (1,063)Other financing activities, net (4) —Cash used for financing activities (3,602) (690)
Effect of exchange rate changes on cash, cash equivalents and restricted cash (171) 208Summary
Decrease in cash, cash equivalents and restricted cash (4,210) (391)Cash, cash equivalents and restricted cash at beginning of period 14,015 6,624Cash, cash equivalents and restricted cash at end of period $ 9,805 $ 6,233
SeeNotestotheConsolidatedFinancialStatements.

7

DowDuPont Inc.Consolidated Statements of Equity
In millions, except per shareamounts (Unaudited) CommonStock
Add'lPaidinCapital
RetainedEarnings
AccumOtherCompLoss UnearnedESOP TreasuryStock
Non-controllingInterests TotalEquity
2017 Balance at Dec 31, 2016 $ 3,107 $ 4,262 $ 30,338 $ (9,822) $ (239) $ (1,659) $ 1,242 $ 27,229
Net income available forDowDuPont Inc. commonstockholders — — 2,209 — — — — 2,209
Other comprehensive income — — — 748 — — — 748Dividends ($0.92 per common
share) — — (1,115) — — — — (1,115)Common stock issued/sold — 357 — — — 626 — 983Stock-based compensation and
allocation of ESOP shares — (415) — — 41 — — (374)Impact of noncontrolling
interests — — — — — — (74) (74)Other — (2) (15) — — — — (17)
Balance at Jun 30, 2017 $ 3,107 $ 4,202 $ 31,417 $ (9,074) $ (198) $ (1,033) $ 1,168 $ 29,589
2018 Balance at Dec 31, 2017 $ 23 $ 81,257 $ 29,211 $ (8,972) $ (189) $ (1,000) $ 1,597 $ 101,927
Adoption of accountingstandards (Note 1) — — 996 (1,037) — — — (41)
Net income available forDowDuPont Inc. commonstockholders — — 2,872 — — — — 2,872
Other comprehensive income — — — (723) — — — (723)Dividends ($1.14 per common
share) — — (2,629) — — — — (2,629)Common stock issued/sold 1 141 — — — — — 142Stock-based compensation and
allocation of ESOP shares — 285 — — 44 — — 329Impact of noncontrolling
interests — — — — — — 23 23Treasury stock purchases — — — — — (2,000) — (2,000)Other — — (18) — — — — (18)
Balance at Jun 30, 2018 $ 24 $ 81,683 $ 30,432 $ (10,732) $ (145) $ (3,000) $ 1,620 $ 99,882SeeNotestotheConsolidatedFinancialStatements.
8

Table of Contents
NOTES TO THE CONSOLIDATED FINANCIAL STATEMENTS
Table of Contents
Note Page1 Consolidated Financial Statements 92 Recent Accounting Guidance 143 Business Combinations 164 Revenue 185 Restructuring and Asset Related Charges (Credits) - Net 216 Supplementary Information 237 Income Taxes 248 Earnings Per Share Calculations 259 Inventories 2610 Goodwill and Other Intangible Assets 2611 Transfers of Financial Assets 2712 Notes Payable, Long-Term Debt and Available Credit Facilities 2813 Commitments and Contingent Liabilities 2914 Accumulated Other Comprehensive Loss 3615 Noncontrolling Interests 3716 Pension Plans and Other Postretirement Benefits 3817 Stock-Based Compensation 3818 Financial Instruments 3919 Fair Value Measurements 4320 Variable Interest Entities 4521 Segments and Geographic Regions 46
NOTE 1 - CONSOLIDATED FINANCIAL STATEMENTSBasis of PresentationEffective August 31, 2017, pursuant to the merger of equals transactions contemplated by the Agreement and Plan of Merger, dated as of December 11, 2015, asamended on March 31, 2017 ("Merger Agreement"), The Dow Chemical Company ("Dow") and E. I. du Pont de Nemours and Company ("DuPont") each mergedwith subsidiaries of DowDuPont Inc. ("DowDuPont" or the "Company") and, as a result, Dow and DuPont became subsidiaries of DowDuPont (the "Merger").Prior to the Merger, DowDuPont did not conduct any business activities other than those required for its formation and matters contemplated by the MergerAgreement. Dow was determined to be the accounting acquirer in the Merger. As a result, the historical financial statements of Dow for periods prior to the Mergerare considered to be the historical financial statements of DowDuPont.
The unaudited interim consolidated financial statements of DowDuPont and its subsidiaries were prepared in accordance with accounting principles generallyaccepted in the United States of America (“U.S. GAAP”) and reflect all adjustments (including normal recurring accruals) which, in the opinion of management,are considered necessary for the fair presentation of the results for the periods presented. Results from interim periods should not be considered indicative of resultsfor the full year. These statements should be read in conjunction with the audited consolidated financial statements and notes thereto included in the Company’sAnnual Report on Form 10-K for the year ended December 31, 2017.
Except as otherwise indicated by the context, the term "Dow" includes Dow and its consolidated subsidiaries, "DuPont" includes DuPont and its consolidatedsubsidiaries, "Union Carbide" means Union Carbide Corporation, a wholly owned subsidiary of Dow, and "Dow Silicones" means Dow Silicones Corporation(formerly known as Dow Corning Corporation, which changed its name effective as of February 1, 2018), a wholly owned subsidiary of Dow.
Changes to Prior Period Consolidated Financial StatementsAs a result of the Merger, certain reclassifications of prior period amounts have been made to improve comparability and conform with the current periodpresentation. Presentation changes were made to the consolidated statements of income, consolidated statements of cash flows and consolidated statements ofequity. In addition, certain reclassifications of prior period data have been made in the Notes to the Consolidated Financial Statements to conform with the currentperiod presentation.
9
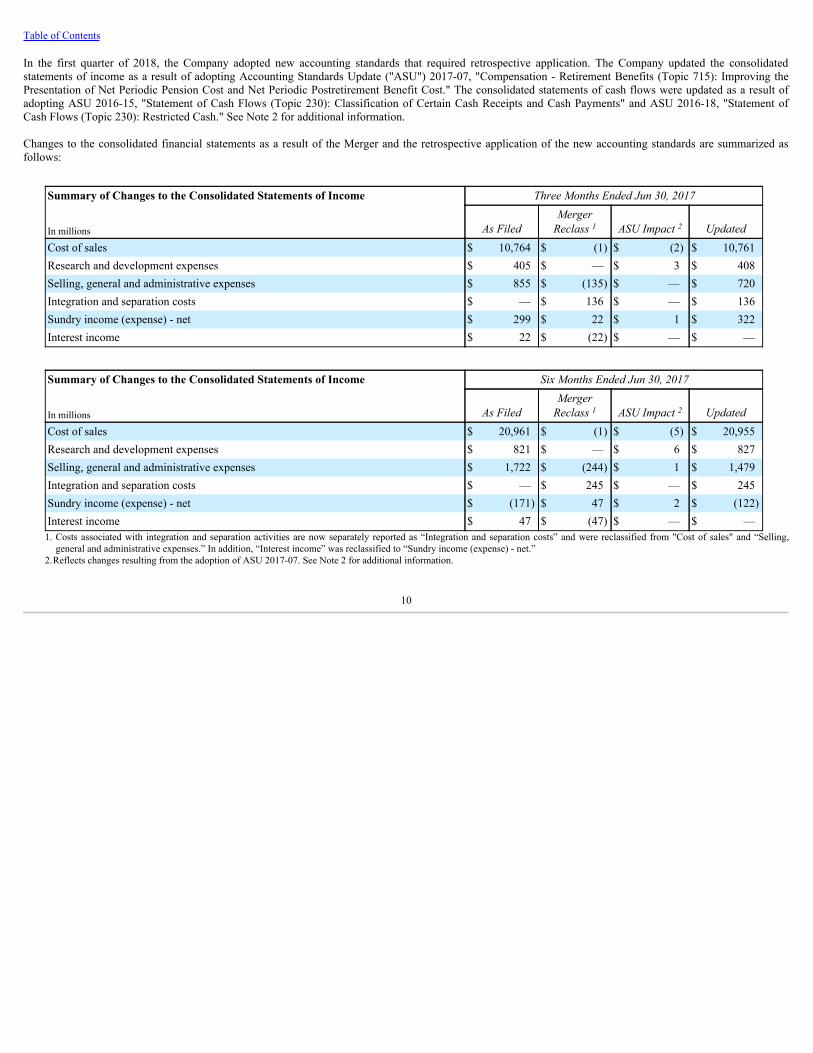
Table of Contents
In the first quarter of 2018, the Company adopted new accounting standards that required retrospective application. The Company updated the consolidatedstatements of income as a result of adopting Accounting Standards Update ("ASU") 2017-07, "Compensation - Retirement Benefits (Topic 715): Improving thePresentation of Net Periodic Pension Cost and Net Periodic Postretirement Benefit Cost." The consolidated statements of cash flows were updated as a result ofadopting ASU 2016-15, "Statement of Cash Flows (Topic 230): Classification of Certain Cash Receipts and Cash Payments" and ASU 2016-18, "Statement ofCash Flows (Topic 230): Restricted Cash." See Note 2 for additional information.
Changes to the consolidated financial statements as a result of the Merger and the retrospective application of the new accounting standards are summarized asfollows:
Summary of Changes to the Consolidated Statements of Income ThreeMonthsEndedJun30,2017
In millions AsFiledMergerReclass1 ASUImpact2 Updated
Cost of sales $ 10,764 $ (1) $ (2) $ 10,761Research and development expenses $ 405 $ — $ 3 $ 408Selling, general and administrative expenses $ 855 $ (135) $ — $ 720Integration and separation costs $ — $ 136 $ — $ 136Sundry income (expense) - net $ 299 $ 22 $ 1 $ 322Interest income $ 22 $ (22) $ — $ —
Summary of Changes to the Consolidated Statements of Income SixMonthsEndedJun30,2017
In millions AsFiledMergerReclass1 ASUImpact2 Updated
Cost of sales $ 20,961 $ (1) $ (5) $ 20,955Research and development expenses $ 821 $ — $ 6 $ 827Selling, general and administrative expenses $ 1,722 $ (244) $ 1 $ 1,479Integration and separation costs $ — $ 245 $ — $ 245Sundry income (expense) - net $ (171) $ 47 $ 2 $ (122)Interest income $ 47 $ (47) $ — $ —
1. Costs associated with integration and separation activities are now separately reported as “Integration and separation costs” and were reclassified from "Cost of sales" and “Selling,general and administrative expenses.” In addition, “Interest income” was reclassified to “Sundry income (expense) - net.”
2.Reflects changes resulting from the adoption of ASU 2017-07. See Note 2 for additional information.
10
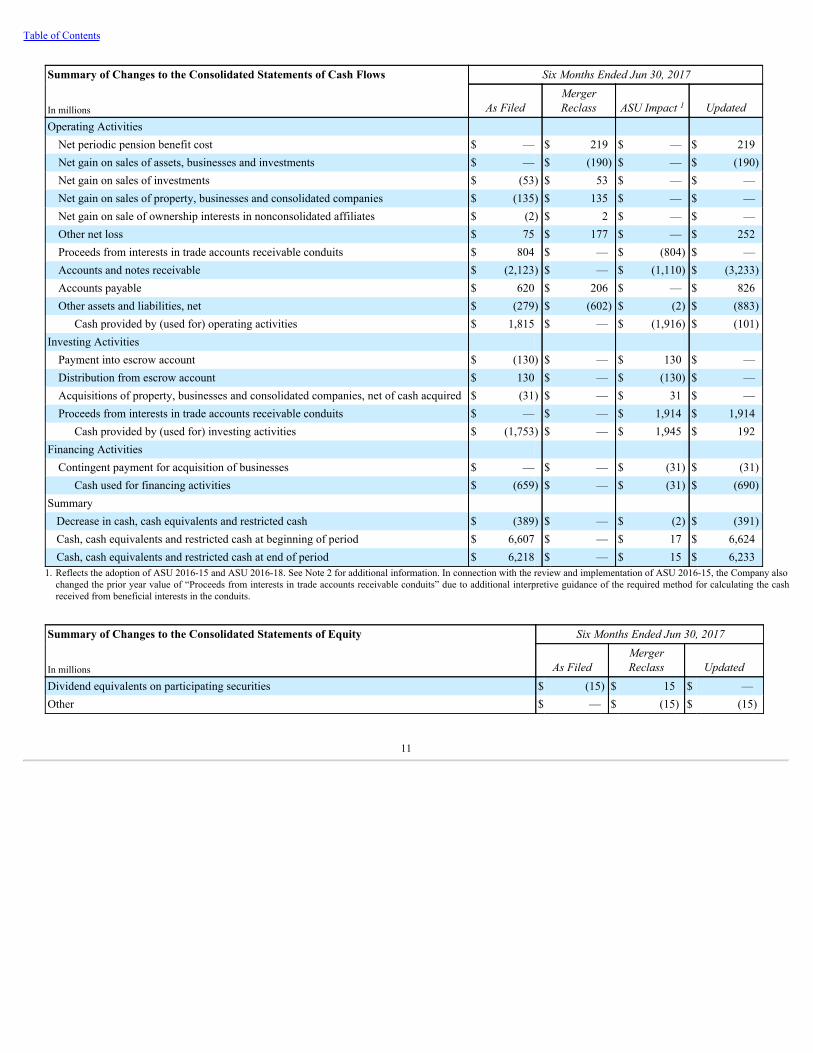
Table of Contents
Summary of Changes to the Consolidated Statements of Cash Flows SixMonthsEndedJun30,2017
In millions AsFiledMergerReclass ASUImpact1 Updated
Operating Activities Net periodic pension benefit cost $ — $ 219 $ — $ 219Net gain on sales of assets, businesses and investments $ — $ (190) $ — $ (190)Net gain on sales of investments $ (53) $ 53 $ — $ —Net gain on sales of property, businesses and consolidated companies $ (135) $ 135 $ — $ —Net gain on sale of ownership interests in nonconsolidated affiliates $ (2) $ 2 $ — $ —Other net loss $ 75 $ 177 $ — $ 252Proceeds from interests in trade accounts receivable conduits $ 804 $ — $ (804) $ —Accounts and notes receivable $ (2,123) $ — $ (1,110) $ (3,233)Accounts payable $ 620 $ 206 $ — $ 826Other assets and liabilities, net $ (279) $ (602) $ (2) $ (883)
Cash provided by (used for) operating activities $ 1,815 $ — $ (1,916) $ (101)Investing Activities
Payment into escrow account $ (130) $ — $ 130 $ —Distribution from escrow account $ 130 $ — $ (130) $ —Acquisitions of property, businesses and consolidated companies, net of cash acquired $ (31) $ — $ 31 $ —Proceeds from interests in trade accounts receivable conduits $ — $ — $ 1,914 $ 1,914
Cash provided by (used for) investing activities $ (1,753) $ — $ 1,945 $ 192Financing Activities
Contingent payment for acquisition of businesses $ — $ — $ (31) $ (31)Cash used for financing activities $ (659) $ — $ (31) $ (690)
Summary Decrease in cash, cash equivalents and restricted cash $ (389) $ — $ (2) $ (391)Cash, cash equivalents and restricted cash at beginning of period $ 6,607 $ — $ 17 $ 6,624Cash, cash equivalents and restricted cash at end of period $ 6,218 $ — $ 15 $ 6,233
1. Reflects the adoption of ASU 2016-15 and ASU 2016-18. See Note 2 for additional information. In connection with the review and implementation of ASU 2016-15, the Company alsochanged the prior year value of “Proceeds from interests in trade accounts receivable conduits” due to additional interpretive guidance of the required method for calculating the cashreceived from beneficial interests in the conduits.
Summary of Changes to the Consolidated Statements of Equity SixMonthsEndedJun30,2017
In millions AsFiledMergerReclass Updated
Dividend equivalents on participating securities $ (15) $ 15 $ —Other $ — $ (15) $ (15)
11

Table of Contents
Opening Balance Sheet Impact of Accounting Standards AdoptionIn the first quarter of 2018, the Company adopted ASU 2014-09, "Revenue from Contracts with Customers (Topic 606)" and the associated ASUs (collectively,"Topic 606"), ASU 2016-01, "Financial Instruments - Overall (Subtopic 825-10): Recognition and Measurement of Financial Assets and Financial Liabilities" andASU 2016-16, "Income Taxes (Topic 740): Intra-Entity Transfers of Assets Other Than Inventory." See Note 2 for additional information on these ASUs. Thecumulative effect on the Company's January 1, 2018, consolidated balance sheet as a result of adopting these accounting standards is summarized in the followingtable:
Summary of Impacts to the Consolidated Balance Sheet Dec31,2017 Adjustmentsdueto: Jan1,2018
In millions AsFiled Topic606 ASU2016-01 ASU2016-16 UpdatedAssets
Accounts and notes receivable - Trade $ 11,314 $ 87 $ — $ — $ 11,401Accounts and notes receivable - Other $ 5,579 $ (8) $ — $ — $ 5,571Inventories $ 16,992 $ (64) $ — $ — $ 16,928Other current assets $ 1,614 $ 130 $ — $ 31 $ 1,775
Total current assets $ 49,893 $ 145 $ — $ 31 $ 50,069Deferred income tax assets $ 1,869 $ 26 $ — $ 10 $ 1,905Deferred charges and other assets $ 2,774 $ 43 $ — $ — $ 2,817
Total other assets $ 97,444 $ 69 $ — $ 10 $ 97,523Total Assets $ 192,164 $ 214 $ — $ 41 $ 192,419Liabilities
Accounts payable - Trade $ 9,134 $ (3) $ — $ — $ 9,131Accounts payable - Other $ 3,727 $ 10 $ — $ — $ 3,737Income taxes payable $ 843 $ (2) $ — $ — $ 841Accrued and other current liabilities $ 8,409 $ 171 $ — $ — $ 8,580
Total current liabilities $ 26,128 $ 176 $ — $ — $ 26,304Deferred income tax liabilities $ 6,266 $ 3 $ — $ — $ 6,269Other noncurrent obligations $ 7,969 $ 117 $ — $ — $ 8,086
Total other noncurrent liabilities $ 34,053 $ 120 $ — $ — $ 34,173Stockholders' Equity
Retained earnings $ 29,211 $ (82) $ (20) $ 41 $ 29,150Accumulated other comprehensive loss $ (8,972) $ — $ 20 $ — $ (8,952)
DowDuPont's stockholders' equity $ 100,330 $ (82) $ — $ 41 $ 100,289Total equity $ 101,927 $ (82) $ — $ 41 $ 101,886
Total Liabilities and Equity $ 192,164 $ 214 $ — $ 41 $ 192,419
The most significant changes as a result of adopting Topic 606 relate to the reclassification of the Company's return assets and refund liabilities in the Agriculturesegment in the consolidated balance sheets. Under previous guidance, the Company accrued the amount of expected product returns as a reduction of "Accountsand notes receivable - Trade" with the value associated with the expected returns recorded in "Inventories" in the consolidated balance sheets. Under Topic 606, theCompany now records the amount of expected product returns as refund liabilities, included in "Accrued and other current liabilities" and the products expected tobe recovered as return assets, included in "Other current assets" in the consolidated balance sheets. The reclassifications of return assets and refund liabilities were$61 million and $119 million , respectively, at January 1, 2018. In addition, deferred revenue, included in "Accrued and other current liabilities" and "Othernoncurrent obligations" in the consolidated balance sheets, increased as certain performance obligations, which were previously recognized over time and related tothe licensing of certain rights to patents and technology, as well as other performance obligations, are now recognized at a point in time as none of the three criteriafor 'over time' recognition under Topic 606 are met.
In the second quarter of 2018, the Company early adopted ASU 2018-02, "Income Statement - Reporting Comprehensive Income (Topic 220): Reclassification ofCertain Tax Effects from Accumulated Other Comprehensive Income." This standard was adopted on April 1, 2018, and resulted in a $1,057 million increase toretained earnings due to the reclassification from accumulated other comprehensive loss. The reclassification was primarily related to the change in the federalcorporate tax rate and the effect of the Tax Cuts and Jobs Act of 2017 ("The Act") on the Company's pension plans, derivative instruments, available-for-salesecurities
12
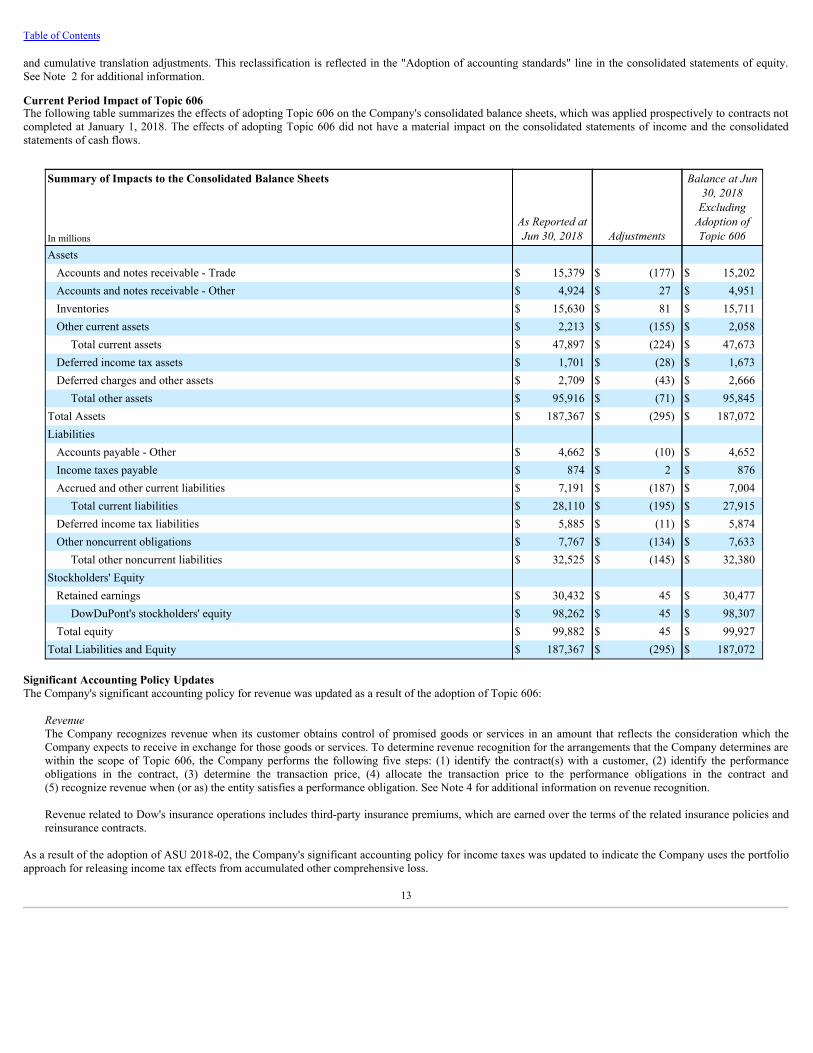
Table of Contents
and cumulative translation adjustments. This reclassification is reflected in the "Adoption of accounting standards" line in the consolidated statements of equity.See Note 2 for additional information.
Current Period Impact of Topic 606The following table summarizes the effects of adopting Topic 606 on the Company's consolidated balance sheets, which was applied prospectively to contracts notcompleted at January 1, 2018. The effects of adopting Topic 606 did not have a material impact on the consolidated statements of income and the consolidatedstatements of cash flows.
Summary of Impacts to the Consolidated Balance Sheets
AsReportedatJun30,2018 Adjustments
BalanceatJun30,2018ExcludingAdoptionofTopic606In millions
Assets Accounts and notes receivable - Trade $ 15,379 $ (177) $ 15,202Accounts and notes receivable - Other $ 4,924 $ 27 $ 4,951Inventories $ 15,630 $ 81 $ 15,711Other current assets $ 2,213 $ (155) $ 2,058
Total current assets $ 47,897 $ (224) $ 47,673Deferred income tax assets $ 1,701 $ (28) $ 1,673Deferred charges and other assets $ 2,709 $ (43) $ 2,666
Total other assets $ 95,916 $ (71) $ 95,845Total Assets $ 187,367 $ (295) $ 187,072Liabilities
Accounts payable - Other $ 4,662 $ (10) $ 4,652Income taxes payable $ 874 $ 2 $ 876Accrued and other current liabilities $ 7,191 $ (187) $ 7,004
Total current liabilities $ 28,110 $ (195) $ 27,915Deferred income tax liabilities $ 5,885 $ (11) $ 5,874Other noncurrent obligations $ 7,767 $ (134) $ 7,633
Total other noncurrent liabilities $ 32,525 $ (145) $ 32,380Stockholders' Equity
Retained earnings $ 30,432 $ 45 $ 30,477DowDuPont's stockholders' equity $ 98,262 $ 45 $ 98,307
Total equity $ 99,882 $ 45 $ 99,927Total Liabilities and Equity $ 187,367 $ (295) $ 187,072
Significant Accounting Policy UpdatesThe Company's significant accounting policy for revenue was updated as a result of the adoption of Topic 606:
RevenueThe Company recognizes revenue when its customer obtains control of promised goods or services in an amount that reflects the consideration which theCompany expects to receive in exchange for those goods or services. To determine revenue recognition for the arrangements that the Company determines arewithin the scope of Topic 606, the Company performs the following five steps: (1) identify the contract(s) with a customer, (2) identify the performanceobligations in the contract, (3) determine the transaction price, (4) allocate the transaction price to the performance obligations in the contract and(5) recognize revenue when (or as) the entity satisfies a performance obligation. See Note 4 for additional information on revenue recognition.
Revenue related to Dow's insurance operations includes third-party insurance premiums, which are earned over the terms of the related insurance policies andreinsurance contracts.
As a result of the adoption of ASU 2018-02, the Company's significant accounting policy for income taxes was updated to indicate the Company uses the portfolioapproach for releasing income tax effects from accumulated other comprehensive loss.
13

Table of Contents
NOTE 2 - RECENT ACCOUNTING GUIDANCERecently Adopted Accounting GuidanceIn the second quarter of 2018, the Company early adopted ASU 2017-12, "Derivatives and Hedging (Topic 815): Targeted Improvements to Accounting forHedging Activities," which amends the hedge accounting recognition and presentation under Accounting Standards Codification ("ASC") 815, with the objectivesof improving the financial reporting of hedging relationships to better portray the economic results of an entity's risk management activities and simplifying theapplication of hedge accounting by preparers. The new standard expands the strategies eligible for hedge accounting, relaxes the timing requirements of hedgedocumentation and effectiveness assessments, and permits, in certain cases, the use of qualitative assessments on an ongoing basis to assess hedge effectiveness.The new guidance also requires new disclosures and presentation. The new standard is effective for fiscal years, and interim periods within those fiscal years,beginning after December 15, 2018. Early adoption is permitted in any interim or annual period after issuance of the ASU. Entities must adopt the new guidance byapplying a modified retrospective approach to hedging relationships existing as of the adoption date. The adoption of the new guidance did not have a materialimpact on the consolidated financial statements.
In the second quarter of 2018, the Company early adopted ASU 2018-02, "Income Statement - Reporting Comprehensive Income (Topic 220): Reclassification ofCertain Tax Effects from Accumulated Other Comprehensive Income," which allows a reclassification from accumulated other comprehensive income to retainedearnings for stranded tax effects resulting from The Act, which was enacted on December 22, 2017, and requires certain disclosures about stranded tax effects. Anentity has the option of applying the new guidance at the beginning of the period of adoption or retrospectively to each period (or periods) in which the tax effectsrelated to items remaining in accumulated other comprehensive income are recognized. The new standard is effective for fiscal years, and interim periods withinthose fiscal years, beginning after December 15, 2018, and early adoption is permitted, including adoption in an interim period for reporting periods for whichfinancial statements have not yet been issued. The Company's adoption of the new standard was applied prospectively at the beginning of the second quarter of2018, with a reclassification of the stranded tax effects as a result of The Act from accumulated other comprehensive loss to retained earnings. See Note 1 foradditional information.
In the first quarter of 2018, the Company adopted ASU 2014-09, "Revenue from Contracts with Customers (Topic 606)," which is the new comprehensive revenuerecognition standard that supersedes the revenue recognition requirements in Topic 605, "Revenue Recognition," and most industry specific guidance. Thestandard's core principle is that a company will recognize revenue when it transfers promised goods or services to a customer in an amount that reflects theconsideration to which the company expects to be entitled in exchange for those goods or services. In 2015 and 2016, the Financial Accounting Standards Board("FASB") issued additional ASUs related to Topic 606 that delayed the effective date of the guidance and clarified various aspects of the new revenue guidance,including principal versus agent considerations, identification of performance obligations, and accounting for licenses, and included other improvements andpractical expedients. The new guidance was effective for annual and interim periods beginning after December 15, 2017. The Company elected to adopt the newguidance using the modified retrospective transition method for all contracts not completed as of the date of adoption. The Company recognized the cumulativeeffect of applying the new revenue standard as an adjustment to the opening balance of retained earnings at the beginning of the first quarter of 2018. Thecomparative periods have not been restated and continue to be accounted for under Topic 605. The adoption of the new guidance did not have a material impact onthe consolidated financial statements. See Notes 1 and 4 for additional disclosures regarding the Company's contracts with customers as well as the impact ofadopting Topic 606.
In the first quarter of 2018, the Company adopted ASU 2016-01, "Financial Instruments - Overall (Subtopic 825-10): Recognition and Measurement of FinancialAssets and Financial Liabilities," which amends the guidance in U.S. GAAP on the classification and measurement of financial instruments. Changes to the currentguidance primarily affects the accounting for equity investments, financial liabilities under the fair value option, and the presentation and disclosure requirementsfor financial instruments. In addition, the ASU clarifies guidance related to the valuation allowance assessment when recognizing deferred tax assets resulting fromunrealized losses on available-for-sale debt securities. The new standard was effective for fiscal years, and interim periods within those fiscal years, beginning afterDecember 15, 2017. The Company applied the amendments in the new guidance by means of a cumulative-effect adjustment to the opening balance of retainedearnings at the beginning of the first quarter of 2018. The adoption of the new guidance did not have a material impact on the consolidated financial statements. SeeNotes 1 and 18 for additional information.
In the first quarter of 2018, the Company adopted ASU 2016-15, "Statement of Cash Flows (Topic 230): Classification of Certain Cash Receipts and CashPayments," which addresses diversity in practice in how certain cash receipts and cash payments are presented and classified in the statements of cash flows andaddresses eight specific cash flow issues. The new standard was effective for fiscal years, and interim periods within those fiscal years, beginning after December15, 2017. A key provision in the new guidance impacted the presentation of interests in certain trade accounts receivable conduits, which were retrospectivelyreclassified from "Operating Activities" to "Investing Activities" in the consolidated statements of cash flows. See Note 1 for additional information.
14
Table of Contents
In the first quarter of 2018, the Company adopted ASU 2016-16, "Income Taxes (Topic 740): Intra-Entity Transfers of Assets Other Than Inventory," whichrequires an entity to recognize the income tax consequences of an intra-entity transfer of an asset other than inventory when the transfer occurs. The amendmentswere effective for fiscal years, and interim periods within those fiscal years, beginning after December 15, 2017. The new guidance was applied on a modifiedretrospective basis through a cumulative-effect adjustment directly to retained earnings at the beginning of the first quarter of 2018. The adoption of this guidancedid not have a material impact on the consolidated financial statements. See Note 1 for additional information.
In the first quarter of 2018, the Company adopted ASU 2016-18, "Statement of Cash Flows (Topic 230): Restricted Cash," which clarifies how entities shouldpresent restricted cash and restricted cash equivalents in the statements of cash flows, and as a result, entities will no longer present transfers between cash and cashequivalents and restricted cash and restricted cash equivalents in the statements of cash flows. An entity with a material balance of restricted cash and restrictedcash equivalents must disclose information about the nature of the restrictions. The new standard was effective for fiscal years, and interim periods within thosefiscal years, beginning after December 15, 2017. The new guidance changed the presentation of restricted cash in the consolidated statements of cash flows andwas implemented on a retrospective basis in the first quarter of 2018. See Notes 1 and 6 for additional information.
In the first quarter of 2018, the Company adopted ASU 2017-01, "Business Combinations (Topic 805): Clarifying the Definition of a Business," which narrows theexisting definition of a business and provides a framework for evaluating whether a transaction should be accounted for as an acquisition (or disposal) of assets or abusiness. The guidance requires an entity to evaluate if substantially all of the fair value of gross assets acquired is concentrated in a single identifiable asset or agroup of similar identifiable assets; if so, the set of transferred assets and activities (collectively the "set") is not a business. To be considered a business, the setwould need to include an input and a substantive process that together significantly contribute to the ability to create outputs, as defined by the ASU. The newstandard was effective for fiscal years, and interim periods within those fiscal years, beginning after December 15, 2017, and should be applied prospectively. TheCompany will apply the new guidance to all applicable transactions after the adoption date.
In the first quarter of 2018, the Company adopted ASU 2017-07, "Compensation - Retirement Benefits (Topic 715): Improving the Presentation of Net PeriodicPension Cost and Net Periodic Postretirement Benefit Cost," which amends the requirements related to the income statement presentation of the components of netperiodic benefit cost for employer sponsored defined benefit pension and other postretirement benefit plans. Under the new guidance, an entity must disaggregateand present the service cost component of net periodic benefit cost in the same income statement line items as other employee compensation costs arising fromservices rendered during the period, and only the service cost component will be eligible for capitalization. Other components of net periodic benefit cost must bepresented separately from the line items that includes the service cost. The new standard was effective for fiscal years, and interim periods within those fiscal years,beginning after December 15, 2017. Entities were required to use a retrospective transition method to adopt the requirement for separate income statementpresentation of the service cost and other components, and a prospective transition method to adopt the requirement to limit the capitalization of benefit cost to theservice component. Accordingly, in the first quarter of 2018, the Company used a retrospective transition method to reclassify net periodic benefit cost, other thanthe service component, from "Cost of sales," "Research and development expenses" and "Selling, general and administrative expenses" to "Sundry income(expense) - net" in the consolidated statements of income. See Note 1 for additional information.
Accounting Guidance Issued But Not Adopted at June 30, 2018In February 2016, the FASB issued ASU 2016-02, "Leases (Topic 842)," which requires organizations that lease assets to recognize on the balance sheet the assetsand liabilities for the rights and obligations created by those leases. The new guidance requires that a lessee recognize assets and liabilities for leases with leaseterms of more than twelve months and recognition, presentation and measurement in the financial statements will depend on its classification as a finance oroperating lease. In addition, the new guidance will require disclosures to help investors and other financial statement users better understand the amount, timingand uncertainty of cash flows arising from leases. Lessor accounting remains largely unchanged from current U.S. GAAP but does contain some targetedimprovements to align with the new revenue recognition guidance issued in 2014. The new standard is effective for fiscal years, and interim periods within thosefiscal years, beginning after December 15, 2018, using a modified retrospective approach, and early adoption is permitted. The Company has a cross-functionalteam in place to evaluate and implement the new guidance. The team continues to review existing lease arrangements and has engaged third parties to assist withthe collection of lease data. The impact of applying the practical expedients and accounting policy elections has been evaluated and the Company is in the processof documenting the related considerations and decisions. The Company is currently implementing software solutions, enhancing accounting systems and updatingbusiness processes and controls related to leases. Collectively, these activities are expected to facilitate the Company's ability to meet the new accounting anddisclosure requirements upon adoption in the first quarter of 2019. The Company is working to quantify the impact and anticipates that the adoption of the newstandard will result in a material increase in lease-related assets and liabilities in the consolidated balance sheets.
15

Table of Contents
NOTE 3 - BUSINESS COMBINATIONSMerger of Equals of Dow and DuPontAt the effective time of the Merger, each share of common stock, par value $2.50 per share, of Dow ("Dow Common Stock") (excluding any shares of DowCommon Stock that were held in treasury immediately prior to the effective time of the Merger, which were automatically canceled and retired for noconsideration) was converted into the right to receive one fully paid and non-assessable share of common stock, par value $0.01 per share, of DowDuPont("DowDuPont Common Stock"). Upon completion of the Merger, (i) each share of common stock, par value $0.30 per share, of DuPont (“DuPont CommonStock”) (excluding any shares of DuPont Common Stock that were held in treasury immediately prior to the effective time of the Merger, which were automaticallycanceled and retired for no consideration) was converted into the right to receive 1.2820 fully paid and non-assessable shares of DowDuPont Common Stock, inaddition to cash in lieu of any fractional shares of DowDuPont Common Stock, and (ii) each share of DuPont Preferred Stock $4.50 Series and DuPont PreferredStock $3.50 Series (collectively, the “DuPont Preferred Stock”) issued and outstanding immediately prior to the effective time of the Merger remains issued andoutstanding and was unaffected by the Merger.
As provided in the Merger Agreement, at the effective time of the Merger, Dow stock options and other equity awards were generally automatically converted intostock options and equity awards with respect to DowDuPont Common Stock and DuPont stock options and other equity awards, after giving effect to the exchangeratio, were converted into stock options and equity awards with respect to DowDuPont Common Stock, and otherwise generally on the same terms and conditionsunder the applicable plans and award agreements immediately prior to the effective time of the Merger.
DowDuPont intends to pursue, subject to certain customary conditions, including, among others, the effectiveness of registration statements filed with theSecurities and Exchange Commission and approval by the Board of Directors of DowDuPont, the separation of the combined Company's agriculture, materialsscience and specialty products businesses through one or more tax-efficient transactions ("Intended Business Separations").
Preliminary Allocation of Purchase PriceBased on an evaluation of the provisions of ASC 805, "Business Combinations" ("ASC 805"), Dow was determined to be the accounting acquirer in the Merger.DowDuPont has applied the acquisition method of accounting with respect to the assets and liabilities of DuPont, which have been measured at fair value as of thedate of the Merger.
DuPont's assets and liabilities were measured at estimated fair values at August 31, 2017, primarily using Level 3 inputs. Estimates of fair value representmanagement's best estimate and require a complex series of judgments about future events and uncertainties. Third-party valuation specialists were engaged toassist in the valuation of these assets and liabilities.
The total fair value of consideration transferred for the Merger was $74,680 million . Total consideration is comprised of the equity value of the DowDuPont sharesat August 31, 2017, that were issued in exchange for DuPont shares, the cash value for fractional shares, and the portion of DuPont's share awards and shareoptions earned at August 31, 2017. The following table summarizes the fair value of consideration exchanged as a result of the Merger:
Merger Consideration
In millions (except exchange ratio) DuPont Common Stock outstanding at Aug 31, 2017 868.3DuPont exchange ratio 1.2820DowDuPont Common Stock issued in exchange for DuPont Common Stock 1,113.2Fair value of DowDuPont Common Stock issued 1 $ 74,195Fair value of DowDuPont equity awards issued in exchange for outstanding DuPont equity awards 2 485Total consideration $ 74,680
1. Amount was determined based on the price per share of Dow Common Stock of $66.65 on August 31, 2017.2. Represents the fair value of replacement awards issued for DuPont's equity awards outstanding immediately before the Merger and attributable to the service periods prior to the Merger. The
previous DuPont equity awards were converted into the right to receive 1.2820 shares of DowDuPont Common Stock.
The acquisition method of accounting requires, among other things, that identifiable assets acquired and liabilities assumed be recognized on the balance sheet attheir respective fair value as of the acquisition date. In determining the fair value, DowDuPont utilized various forms of the income, cost and market approachesdepending on the asset or liability being fair valued. The estimation of fair value required significant judgments related to future net cash flows (including net sales,cost of products sold, selling and marketing costs, and working capital/contributory asset charges), discount rates reflecting the risk inherent in each cash flowstream, competitive trends, market comparables and other factors. Inputs were generally determined by taking into account historical data, supplemented by currentand anticipated market conditions, and growth rates.
16

Table of Contents
The table below presents the preliminary fair value that was allocated to DuPont's assets and liabilities based upon fair values as determined by DowDuPont. Thevaluation process to determine the fair values is not yet complete. The Company estimated the preliminary fair value of acquired assets and liabilities as of theeffective time of the Merger based on information currently available and continues to adjust those estimates upon refinement of market participant assumptions forintegrating businesses, finalization of tax returns in the pre-merger period and application of push-down accounting at the subsidiary level. In the first six months of2018, DowDuPont made measurement period adjustments to reflect facts and circumstances in existence as of the effective time of the Merger. These adjustmentsprimarily included a $394 million increase in goodwill, a $230 million decrease in property, a $117 million decrease in indefinite-lived trademarks and tradenamesand customer-related assets, a $16 million decrease in assets held for sale, a $60 million increase in other current assets, a $56 million increase in noncontrollinginterests and a $28 million decrease in investments in nonconsolidated affiliates. The preliminary fair values are substantially complete with the exception ofidentifiable other intangible assets, property, income taxes and goodwill. As the Company finalizes the fair value of assets acquired and liabilities assumed,additional purchase price adjustments may be recorded during the measurement period, but no later than one year from the date of the Merger. The Company willreflect measurement period adjustments, if any, in the period in which the adjustments are recognized. Final determination of the fair values may result in furtheradjustments to the values presented in the following table:
DuPont Assets Acquired and Liabilities Assumed on Aug 31, 2017 EstimatedfairvalueadjustedIn millions
Fair Value of Assets Acquired Cash and cash equivalents $ 4,005Marketable securities 2,849Accounts and notes receivable - Trade 6,199Accounts and notes receivable - Other 1,648Inventories 8,806Other current assets 420Assets held for sale 3,732Investment in nonconsolidated affiliates 1,626Other investments 50Noncurrent receivables 84Property 11,711Goodwill 45,499Other intangible assets 27,104Deferred income tax assets 284Deferred charges and other assets 1,932
Total Assets $ 115,949Fair Value of Liabilities Assumed
Notes payable $ 4,046Long-term debt due within one year 1,273Accounts payable - Trade 2,346Accounts payable - Other 952Income taxes payable 261Accrued and other current liabilities 3,517Liabilities held for sale 125Long-term debt 9,878Deferred income tax liabilities 8,319Pension and other postretirement benefits - noncurrent 8,056Other noncurrent obligations 2,023
Total Liabilities $ 40,796Noncontrolling interests 473Net Assets (Consideration for the Merger) $ 74,680
17
Table of Contents
IntegrationandSeparationCostsIntegration and separation costs have been and are expected to be significant in the future. The Company incurred "Integration and separation costs," reflected in"Income from continuing operations before income taxes" in the consolidated statements of income, of $558 million and $1,015 million for the three and sixmonths ended June 30, 2018, respectively, and $136 million and $245 million for the three and six months ended June 30, 2017, respectively. These costs to dateprimarily consisted of financial advisory, information technology, legal, accounting, consulting, and other professional advisory fees associated with thepreparation and execution of activities related to the Merger, post-merger integration and separation, and the ownership restructure of Dow Silicones. While theCompany assumed that a certain level of expenses would be incurred, there are many factors that could affect the total amount or the timing of these expenses, andmany of the expenses that will be incurred are, by their nature, difficult to estimate.
H&N BusinessOn March 31, 2017, DuPont entered into a definitive agreement (the "FMC Transaction Agreement") with FMC Corporation ("FMC") for FMC to acquire theassets related to DuPont's crop protection business and research and development organization (the "Divested Ag Business") that DuPont was required to divest inorder to obtain European Commission approval of the Merger. In addition, under the FMC Transaction Agreement, DuPont agreed to acquire certain assets relatingto FMC’s Health and Nutrition segment, excluding its Omega-3 products (the "H&N Business") (the sale of the Divested Ag Business and acquisition of the H&NBusiness referred to collectively as the "FMC Transactions").
On November 1, 2017, DuPont completed the FMC Transactions through the acquisition of the H&N Business and the divestiture of the Divested Ag Business.The acquisition is being integrated into the Nutrition & Biosciences segment to enhance the Company’s position as a leading provider of sustainable, bio-basedfood ingredients and allow for expanded capabilities in the pharma excipients space. DuPont accounted for the acquisition in accordance with ASC 805, whichrequires the assets acquired and liabilities assumed to be recognized on the balance sheet at their fair values as of the acquisition date. The purchase accounting andpurchase price allocation for the H&N Business are substantially complete. However, the Company continues to refine the preliminary valuation of certainacquired assets, such as intangible assets, deferred income taxes and property, which could impact the amount of residual goodwill recorded. The Company willfinalize the amounts recognized as it obtains the information necessary to complete the analysis, but no later than one year from the date of the acquisition. Thepreliminary fair value allocated to the assets acquired and liabilities assumed for the H&N Business at November 1, 2017 was $1,970 million . There were nomaterial updates to the purchase accounting and purchase price allocation for the six months ended June 30, 2018. For additional information regarding theacquisition of the H&N Business, see Note 3 to the Consolidated Financial Statements in the Company’s Annual Report on Form 10-K for the year endedDecember 31, 2017.
NOTE 4 - REVENUERevenue RecognitionThe majority of the Company's revenue is derived from product sales. In the three and six months ended June 30, 2018 , 99 percent of the Company's sales relatedto product sales ( 98 percent in the three and six months ended June 30, 2017). The remaining sales were primarily related to Dow's insurance operations andlicensing of patents and technologies. As of January 1, 2018, the Company accounts for revenue in accordance with Topic 606, except for revenue from Dow'sinsurance operations, which is accounted for in accordance with Topic 944, "Financial Services - Insurance."
Product SalesProduct sales consist of sales of the Company's products to manufacturers, distributors and farmers. The Company considers order confirmations or purchaseorders, which in some cases are governed by master supply agreements, to be contracts with a customer. Product sale contracts are generally short-term contractswhere the time between order confirmation and satisfaction of all performance obligations is less than one year. However, the Company has some long-termcontracts which can span multiple years.
18
Table of Contents
Revenues from product sales are recognized when the customer obtains control of the Company’s product, which occurs at a point in time, usually upon shipment,with payment terms typically in the range of 30 to 60 days after invoicing depending on business and geographic region, with the exception of the Agriculturesegment, where payment terms are generally less than one year after invoicing. The Company has elected the practical expedient to not adjust the amount ofconsideration for the effects of a significant financing component for all instances in which the period between payment and transfer of the goods will be one yearor less. When the Company performs shipping and handling activities after the transfer of control to the customer (e.g., when control transfers prior to shipment),these are considered fulfillment activities, and accordingly, the costs are accrued when the related revenue is recognized. Taxes collected from customers relatingto product sales and remitted to governmental authorities are excluded from revenues. The Company has elected to use the practical expedient to expense cash andnon-cash sales incentives as the amortization period for the costs to obtain the contract would have been one year or less.
Certain long-term contracts include a series of distinct goods that are delivered continuously to the customer through a pipeline (e.g., feedstocks). For these types ofproduct sales, the Company invoices the customer in an amount that directly corresponds with the value to the customer of the Company’s performance to date. Asa result, the Company recognizes revenue based on the amount billable to the customer in accordance with the right to invoice practical expedient.
The transaction price includes estimates for reductions in revenue from customer rebates and rights of return on product sales. These amounts are estimated basedupon the most likely amount of consideration to which the customer will be entitled. The Company’s obligation for rights of return is limited primarily to theAgriculture segment. All estimates are based on historical experience, anticipated performance, and the Company’s best judgment at the time to the extent it isprobable that a significant reversal of revenue recognized will not occur. All estimates for variable consideration are reassessed periodically.
For contracts with multiple performance obligations, the Company allocates the transaction price to each performance obligation based on the relative standaloneselling price. The standalone selling price is the observable price which depicts the price as if sold to a similar customer in similar circumstances.
Patents, Trademarks and LicensesThe Company enters into licensing arrangements in which it licenses certain rights of its patents and technology to customers. Revenue from the majority of theCompany’s licenses for patents and technology is derived from sales-based royalties. The Company estimates the amount of sales-based royalties to which itexpects to be entitled based on historical sales to the customer. For the remaining revenue from licensing arrangements, payments are typically received from theCompany’s licensees based on billing schedules established in each contract. Revenue is recognized by the Company when the performance obligation is satisfied.
Remaining Performance ObligationsRemaining performance obligations represent the transaction price allocated to unsatisfied or partially unsatisfied performance obligations. At June 30, 2018 , theCompany had remaining performance obligations related to material rights granted to customers for contract renewal options of $99 million and unfulfilledperformance obligations for the licensing of technology of $228 million . The Company expects revenue to be recognized for the remaining performanceobligations over the next one to six years.
The remaining performance obligations are for product sales that have expected durations of one year or less, product sales of materials delivered through apipeline for which the Company has elected the right to invoice practical expedient, or variable consideration attributable to royalties for licenses of patents andtechnology. The Company has received advance payments from customers related to long-term supply agreements and royalty payments that are deferred andrecognized over the life of the contract, with remaining contract terms that range up to 23 years. The Company will have rights to future consideration for revenuerecognized when product is delivered to the customer. These payments are included in "Accrued and other current liabilities" and "Other noncurrent obligations" inthe consolidated balance sheets.
19

Table of Contents
Disaggregation of RevenueThe Company disaggregates its revenue from contracts with customers by segment and business or major product line and geographic region, as the Companybelieves it best depicts the nature, amount, timing and uncertainty of its revenue and cash flows. See details in the tables below:
Net Trade Revenue by Segment and Business or Major Product Line ThreeMonthsEnded
Jun30,2018SixMonthsEndedJun30,2018In millions
Crop Protection $ 1,853 $ 3,348Seed 3,877 6,190
Agriculture $ 5,730 $ 9,538Coatings & Performance Monomers $ 1,084 $ 2,025Consumer Solutions 1,515 2,878
Performance Materials & Coatings $ 2,599 $ 4,903Construction Chemicals $ 226 $ 408Industrial Solutions 1,198 2,357Polyurethanes & CAV 2,458 4,828Other 3 7
Industrial Intermediates & Infrastructure $ 3,885 $ 7,600Hydrocarbons & Energy $ 1,853 $ 3,653Packaging and Specialty Plastics 4,246 8,456
Packaging & Specialty Plastics $ 6,099 $ 12,109Advanced Printing $ 136 $ 258Display & Other Technologies 82 142Interconnect Solutions 298 579Photovoltaic & Advanced Materials 282 571Semiconductor Technologies 405 806
Electronics & Imaging $ 1,203 $ 2,356Industrial Biosciences $ 561 $ 1,102Nutrition & Health 1,214 2,393
Nutrition & Biosciences $ 1,775 $ 3,495Nylon Enterprise & Polyester $ 699 $ 1,367Performance Resins 486 837Performance Solutions 283 689
Transportation & Advanced Polymers $ 1,468 $ 2,893Aramids $ 398 $ 791Construction 435 820TYVEK® Enterprise 316 608Water Solutions 262 491
Safety & Construction $ 1,411 $ 2,710Corporate $ 75 $ 151Total $ 24,245 $ 45,755
Net Trade Revenue by Geographic Region ThreeMonthsEnded
Jun30,2018SixMonthsEndedJun30,2018In millions
U.S. & Canada $ 10,452 $ 18,361EMEA 1 6,294 13,213Asia Pacific 5,398 10,188Latin America 2,101 3,993Total $ 24,245 $ 45,755
1. Europe, Middle East and Africa.
20

Table of Contents
Contract BalancesThe Company receives payments from customers based upon contractual billing schedules. Accounts receivable are recorded when the right to considerationbecomes unconditional. Contract assets include amounts related to the Company’s contractual right to consideration for completed performance obligations not yetinvoiced. Contract liabilities include payments received in advance of performance under the contract and are realized when the associated revenue is recognizedunder the contract. "Contract liabilities - current" primarily reflects deferred revenue from prepayments in the Agriculture segment for contracts with customerswhere the Company receives advance payments for product to be delivered in future periods. "Contract liabilities - noncurrent" includes advance payment forproduct that the Company has received from customers related to long-term supply agreements and royalty payments that are deferred and recognized over the lifeof the contract. The Company classifies deferred revenue as current (12 months or less) or noncurrent based on the timing of when the Company expects torecognize revenue.
Revenue recognized in the first six months of 2018 from amounts included in contract liabilities at the beginning of the period was approximately $1,925 million .The decrease in deferred revenue from December 31, 2017 to June 30, 2018 was primarily due to the timing of seed deliveries to customers for the growing seasonin U.S. & Canada in the Agriculture segment. In the first six months of 2018, the amount of contract assets reclassified to receivables as a result of the right to thetransaction consideration becoming unconditional was insignificant. The Company did not recognize any asset impairment charges related to contract assets duringthe period.
Contract Balances
Jun30,2018
Topic606AdjustmentsJan1,
2018 Dec31,2017In millions
Accounts and notes receivable - Trade $ 15,379 $ 87 $ 11,314Contract assets - current 1 $ 82 $ 58 $ —Contract assets - noncurrent 2 $ 45 $ 43 $ —Contract liabilities - current 3 $ 544 $ 52 $ 2,131Contract liabilities - noncurrent 4 $ 1,496 $ 117 $ 1,413
1. Included in "Other current assets" in the consolidated balance sheets.2. Included in "Deferred charges and other assets" in the consolidated balance sheets.3. Included in "Accrued and other current liabilities" in the consolidated balance sheets.4. Included in "Other noncurrent obligations" in the consolidated balance sheets.
NOTE 5 - RESTRUCTURING AND ASSET RELATED CHARGES (CREDITS) - NETDowDuPont Cost Synergy ProgramIn September and November 2017, DowDuPont approved post-merger restructuring actions under the DowDuPont Cost Synergy Program (the “SynergyProgram”), adopted by the DowDuPont Board of Directors. The plan is designed to integrate and optimize the organization following the Merger and in preparationfor the Intended Business Separations. Based on all actions approved to date under the Synergy Program, the Company expects to record total pretax restructuringcharges of approximately $2 billion , comprised of approximately $845 million to $935 million of severance and related benefit costs; $400 million to $540 millionof asset write-downs and write-offs; and $400 million to $450 million of costs associated with exit and disposal activities. The Synergy Program includes certainasset actions that are reflected in the preliminary fair value measurement of DuPont’s assets as of the Merger date. Current estimated total pretax restructuringcharges could be impacted by future adjustments to the preliminary fair value of DuPont’s assets.
As a result of these actions, the Company recorded pretax restructuring charges of $874 million in 2017, consisting of severance and related benefit costs of$510 million , asset write-downs and write-offs of $290 million and costs associated with exit and disposal activities of $74 million .
For the three months ended June 30, 2018, the Company recorded pretax restructuring charges of $182 million , consisting of severance and related benefit costs of$122 million , asset write-downs and write-offs of $33 million and costs associated with exit and disposal activities of $27 million . For the six months ended June30, 2018, the Company recorded pretax restructuring charges of $442 million , consisting of severance and related benefit costs of $294 million , asset write-downsand write-offs of $81 million and costs associated with exit and disposal activities of $67 million . The impact of these charges is shown as "Restructuring and assetrelated charges (credits) - net" in the consolidated statements of income. The Company expects to record additional restructuring charges in 2018 and 2019 andexpects the Synergy Program to be completed by the end of 2019.
21

Table of Contents
The following table summarizes the activities related to the Synergy Program. At June 30, 2018, $469 million was included in "Accrued and other currentliabilities" ( $377 million at December 31, 2017 ) and $148 million was included in "Other noncurrent obligations" ( $133 million at December 31, 2017 ) in theconsolidated balance sheets.
Synergy Program SeveranceandRelatedBenefitCosts
AssetWrite-downsandWrite-offs
CostsAssociatedwithExitandDisposalActivities TotalIn millions
2017 restructuring charges $ 510 $ 290 $ 74 $ 874Charges against the reserve — (290) — (290)Non-cash compensation (7) — — (7)Cash payments (64) — (3) (67)Reserve balance at Dec 31, 2017 $ 439 $ — $ 71 $ 5102018 restructuring charges 1 294 81 67 442Charges against the reserve — (81) — (81)Cash payments (194) — (58) (252)Net translation adjustment (2) — — (2)Reserve balance at Jun 30, 2018 $ 537 $ — $ 80 $ 617
1. Included in "Restructuring and asset related charges (credits) - net" in the consolidated statements of income.
Restructuring charges recorded for severance and related benefit costs were related to Corporate. The Company recorded restructuring charges of $27 million forcosts of associated with exit and disposal activities for the three months ended June 30, 2018 related to Agriculture (charge of $23 million ), Safety & Construction(charge of $9 million ) and Corporate (benefit of $5 million ). Restructuring charges of $67 million for costs associated with exit and disposal activities for the sixmonths ended June 30, 2018 related to Agriculture (charge of $37 million ), Industrial Intermediates & Infrastructure (charge of $11 million ), Packaging &Specialty Plastics (charge of $3 million ), Transportation & Advanced Polymers (benefit of $1 million ), Safety & Construction (charge of $16 million ) andCorporate (charge of $1 million ).
The Company recorded restructuring charges for asset write-downs and write-offs for the three months ended June 30, 2018, of $33 million , related to Agriculture( $14 million ), Electronics & Imaging ( $1 million ), Safety & Construction ( $3 million ) and Corporate ( $15 million ). The Company recorded restructuringcharges for asset write-downs and write-offs for the six months ended June 30, 2018, of $81 million , related to Agriculture ( $58 million ), Safety & Construction ($3 million ), Electronics & Imaging ( $2 million ) and Corporate ( $18 million ).
The Company expects to incur additional costs in the future related to its restructuring activities. Future costs are expected to include demolition costs related toclosed facilities and restructuring plan implementation costs; these costs will be recognized as incurred. The Company also expects to incur additional employee-related costs, including involuntary termination benefits, related to its other optimization activities. These costs cannot be reasonably estimated at this time.
Restructuring Plans Initiated Prior to MergerDow 2016 Restructuring PlanOn June 27, 2016, Dow's Board of Directors approved a restructuring plan that incorporated actions related to the ownership restructure of Dow Silicones. Theseactions, aligned with Dow's value growth and synergy targets, will result in a global workforce reduction of approximately 2,500 positions, with most of thesepositions resulting from synergies related to the ownership restructure of Dow Silicones.
For the three months ended June 30, 2018, Dow recorded pretax restructuring charges of $7 million , consisting of a favorable adjustment to the severance reserveof $8 million and a charge of $15 million for costs associated with exit and disposal activities. For the six months ended June 30, 2018, Dow recorded pretaxrestructuring charges of $6 million , consisting of a favorable adjustment to the severance reserve of $8 million and a charge of $14 million for costs associatedwith exit and disposal activities. The impact of these charges is shown as "Restructuring and asset related charges (credits) - net" in the consolidated statements ofincome. The 2016 restructuring activities were substantially complete at June 30, 2018, with remaining liabilities for severance and related benefit costs and costsassociated with exit and disposal activities to be settled over time.
22

Table of Contents
The following table summarizes the activities related to Dow's 2016 restructuring reserve:
2016 Restructuring SeveranceandRelatedBenefitCosts
CostsAssociatedwithExitandDisposalActivities TotalIn millions
Reserve balance at Dec 31, 2017 $ 51 $ 17 $ 68Adjustments to the reserve 1 (8) 14 6Cash payments (37) (4) (41)Reserve balance at Jun 30, 2018 $ 6 $ 27 $ 33
1. Included in "Restructuring and asset related charges (credits) - net" in the consolidated statements of income. The adjustment to severance and related benefit costs was related to Corporate.The adjustments to costs associated with exit and disposal activities were related to Performance Materials & Coatings.
NOTE 6 - SUPPLEMENTARY INFORMATIONThe Company uses "Sundry income (expense) – net" to record a variety of income and expense items such as foreign currency exchange gains and losses, interestincome, dividends from investments, gains and losses on sales of investments and assets, non-operating pension and other postretirement benefit plan credits orcosts, and certain litigation matters. For the three months ended June 30, 2018 , "Sundry income (expense) - net" was income of $178 million (income of $322million for the three months ended June 30, 2017 ). For the six months ended June 30, 2018 , "Sundry income (expense) - net" was income of $293 million(expense of $122 million for the six months ended June 30, 2017 ).
The following table provides the most significant transactions recorded in "Sundry income (expense) - net" for the three and six months ended June 30, 2018 and2017:
Sundry Income (Expense) - Net ThreeMonthsEnded SixMonthsEnded
In millions Jun30,2018 Jun30,2017 Jun30,2018 Jun30,2017Non-operating pension and other postretirement benefit plan net credit 1 $ 113 $ 1 $ 223 $ 2Interest income $ 51 $ 22 $ 106 $ 47Gain on sales of other assets and investments 2 $ 35 $ 133 $ 69 $ 137Adjustment related to Dow Silicones ownership restructure $ (41) $ — $ (41) $ —Foreign exchange gains (losses), net 3 $ (57) $ (30) $ (205) $ (56)Gain related to Nova patent infringement award 4 $ — $ 137 $ — $ 137Loss related to Dow's Bayer CropScience arbitration matter 4 $ — $ — $ — $ (469)
1. Presented in accordance with newly implemented ASU 2017-07. See Notes 1 and 2 for additional information.2. Includes a $20 million gain in the first quarter of 2018 related to Dow's sale of its equity interest in MEGlobal.3. Includes a $50 million foreign exchange loss in the first quarter of 2018, related to adjustments to DuPont's foreign currency exchange contracts as a result of U.S. tax reform.4. See Note 13 for additional information.
Accounts and Notes Receivable - Trade“Accounts and notes receivable - Trade” was $15,379 million at June 30, 2018 and $11,314 million at December 31, 2017. Notes receivable, which is a componentof “Accounts and notes receivable - Trade," was $1,740 million at June 30, 2018 and $309 million at December 31, 2017. The increase was primarily due to normalseasonality in the sales and cash collections cycle in the Agriculture segment. No other components of “Accounts and notes receivable - Trade” were more than 10percent of the total of “Accounts and notes receivable - Trade."
Cash, Cash Equivalents and Restricted CashThe Company is required to set aside funds for various activities that arise in the normal course of business including, but not limited to, insurance contracts, legalmatters and other agreements. These funds typically have legal restrictions associated with them and are deposited in an escrow account or held in a separatelyidentifiable account by the Company.
23

Table of Contents
The following table provides a reconciliation of cash, cash equivalents and restricted cash presented in the consolidated balance sheets to the total cash, cashequivalents and restricted cash presented in the consolidated statements of cash flows:
Reconciliation of Cash, Cash Equivalents and Restricted CashJun30,2018 Dec31,2017 Jun30,2017In millions
Cash and cash equivalents $ 9,244 $ 13,438 $ 6,218Restricted cash and cash equivalents 1 561 577 15Total cash, cash equivalents and restricted cash $ 9,805 $ 14,015 $ 6,233
1. Included in "Other current assets" in the consolidated balance sheets.
DuPont entered into a trust agreement in 2013 (as amended and restated in 2017), establishing and requiring DuPont to fund a trust (the "Trust") for cashobligations under certain non-qualified benefit and deferred compensation plans upon a change in control event as defined in the Trust agreement. Under the Trustagreement, the consummation of the Merger was a change in control event. At June 30, 2018, $516 million of the restricted cash balance was related to the Trust ($558 million at December 31, 2017).
NOTE 7 - INCOME TAXESOn December 22, 2017, The Act was enacted. The Act reduces the U.S. federal corporate income tax rate from 35 percent to 21 percent, requires companies topay a one-time transition tax on earnings of foreign subsidiaries that were previously tax deferred, creates new provisions related to foreign sourced earnings,eliminates the domestic manufacturing deduction and moves towards a territorial system. At June 30, 2018, the Company has not completed its accounting for thetax effects of The Act; however, as described below, the Company has made a reasonable estimate of the effects on its existing deferred tax balances and the one-time transition tax. In accordance with Staff Accounting Bulletin 118, income tax effects of The Act may be refined upon obtaining, preparing, or analyzingadditional information during the measurement period and such changes could be material. During the measurement period, provisional amounts may also beadjusted for the effects, if any, of interpretative guidance issued by U.S. regulatory and standard-setting bodies.
• As a result of The Act, the Company remeasured its U.S. federal deferred tax assets and liabilities based on the rates at which they are expected to reversein the future, which is generally 21 percent . However, the Company is still analyzing certain aspects of The Act and refining its calculations. In the threeand six months ended June 30, 2018, charges of $7 million and $24 million were recorded to “Provision for income taxes on continuing operations" toadjust the provisional amount related to the remeasurement of the Company's deferred tax balance, resulting in a net benefit of $2,642 million since theenactment of The Act.
• The Act requires a mandatory deemed repatriation of post-1986 undistributed foreign earnings and profits (“E&P”), which results in a one-time transitiontax. The Company has not yet completed its calculation of the total post-1986 foreign E&P for its foreign subsidiaries as E&P will not be finalized untilthe federal income tax return is filed. The Company has not recorded a change to the $1,580 million provisional charge recorded in the fourth quarter of2017 with respect to the one-time transition tax.
• In the six months ended June 30, 2018, the Company recorded an indirect impact of The Act related to prepaid tax on the intercompany sale of inventory.The amount recorded related to the inventory was a $54 million charge to "Provision for income taxes on continuing operations."
• For tax years beginning after December 31, 2017, The Act introduced new provisions for U.S. taxation of certain global intangible low-taxed income(“GILTI”). The Company is evaluating the policy election on whether the additional liability will be recorded in the period in which it is incurred orrecognized for the basis differences that would be expected to reverse in future years.
Each year the Company files hundreds of tax returns in the various national, state and local income taxing jurisdictions in which it operates. These tax returns aresubject to examination and possible challenge by the tax authorities. Positions challenged by the tax authorities may be settled or appealed by the Company. As aresult, there is an uncertainty in income taxes recognized in the Company’s financial statements in accordance with accounting for income taxes and accounting foruncertainty in income taxes. The ultimate resolution of such uncertainties is not expected to have a material impact on the Company's results of operations.
24

Table of Contents
NOTE 8 - EARNINGS PER SHARE CALCULATIONSThe following tables provide earnings per share calculations for the three and six months ended June 30, 2018 and 2017 :
Net Income for Earnings Per Share Calculations - Basic ThreeMonthsEnded SixMonthsEnded
In millions Jun30,2018 Jun30,20171 Jun30,2018 Jun30,20171
Income from continuing operations, net of tax $ 1,803 $ 1,359 $ 2,956 $ 2,274Net income attributable to noncontrolling interests (35) (38) (79) (65)Net income attributable to participating securities 2 (7) (6) (13) (10)Income from continuing operations attributable to common stockholders $ 1,761 $ 1,315 $ 2,864 $ 2,199Loss from discontinued operations, net of tax — — (5) —Net income attributable to common stockholders $ 1,761 $ 1,315 $ 2,859 $ 2,199
Earnings Per Share Calculations - Basic ThreeMonthsEnded SixMonthsEndedJun30,2018 Jun30,2017 Jun30,2018 Jun30,2017Dollars per share
Income from continuing operations attributable to common stockholders $ 0.76 $ 1.08 $ 1.24 $ 1.82Loss from discontinued operations, net of tax — — — —Net income attributable to common stockholders $ 0.76 $ 1.08 $ 1.24 $ 1.82
Net Income for Earnings Per Share Calculations - Diluted ThreeMonthsEnded SixMonthsEndedJun30,2018 Jun30,20171 Jun30,2018 Jun30,20171In millions
Income from continuing operations, net of tax $ 1,803 $ 1,359 $ 2,956 $ 2,274Net income attributable to noncontrolling interests (35) (38) (79) (65)Net income attributable to participating securities 2 (7) (6) (13) (10)Income from continuing operations attributable to common stockholders $ 1,761 $ 1,315 $ 2,864 $ 2,199Loss from discontinued operations, net of tax — — (5) —Net income attributable to common stockholders $ 1,761 $ 1,315 $ 2,859 $ 2,199
Earnings Per Share Calculations - Diluted ThreeMonthsEnded SixMonthsEndedJun30,2018 Jun30,2017 Jun30,2018 Jun30,2017Dollars per share
Income from continuing operations attributable to common stockholders $ 0.76 $ 1.07 $ 1.23 $ 1.79Loss from discontinued operations, net of tax — — — —Net income attributable to common stockholders $ 0.76 $ 1.07 $ 1.23 $ 1.79
Share Count Information ThreeMonthsEnded SixMonthsEndedJun30,2018 Jun30,2017 Jun30,2018 Jun30,2017Shares in millions
Weighted-average common shares - basic 2,308.9 1,211.8 2,312.9 1,207.2Plus dilutive effect of equity compensation plans 14.7 17.2 16.1 18.3Weighted-average common shares - diluted 2,323.6 1,229.0 2,329.0 1,225.5Stock options and restricted stock units excluded from EPS calculations 3 9.7 2.2 7.5 1.7
1. Prior period amounts have been updated to conform with the current year presentation.2. Dow restricted stock units (formerly termed deferred stock) are considered participating securities due to Dow's practice of paying dividend equivalents on unvested shares.3. These outstanding options to purchase shares of common stock and restricted stock units were excluded from the calculation of diluted earnings per share because the effect of including them
would have been antidilutive.
25

Table of Contents
NOTE 9 - INVENTORIESThe following table provides a breakdown of inventories:
InventoriesJun30,2018 Dec31,2017In millions
Finished goods $ 9,303 $ 9,701Work in process 3,542 4,512Raw materials 1,478 1,267Supplies 1,176 1,296Total $ 15,499 $ 16,776Adjustment of inventories to a LIFO basis 131 216Total inventories 1 $ 15,630 $ 16,992
1. In the first quarter of 2018, the Company adopted Topic 606, which resulted in a cumulative effect change to the Company's January 1, 2018 inventory balance. See Note 1 for additionalinformation.
NOTE 10 - GOODWILL AND OTHER INTANGIBLE ASSETSThe following table reflects the carrying amounts of goodwill by reportable segment:
GoodwillAgri-culture
Perf.Materials&Coatings
Ind.Interm.&Infrast.
Pack.&Spec.Plastics
Elect.&Imaging
Nutrition&Biosciences
Transp.&Adv.
PolymersSafety&Const. TotalIn millions
Net goodwill at Dec 31, 2017 $ 14,873 $ 3,669 $ 1,101 $ 5,044 $ 8,175 $ 13,200 $ 6,870 $ 6,595 $ 59,527Measurement period adjustments - Merger
1 6 — — 75 36 34 128 115 394Measurement period adjustments - H&N
Business 1 — — — — — 11 — — 11Other — 20 — — — (20) — — —Foreign currency impact (269) (21) (3) (2) (39) (120) (34) (40) (528)
Net goodwill at Jun 30, 2018 $ 14,610 $ 3,668 $ 1,098 $ 5,117 $ 8,172 $ 13,105 $ 6,964 $ 6,670 $ 59,4041. Final determination of the goodwill value assignment may result in adjustments to the preliminary value recorded.
Other Intangible AssetsThe following table provides information regarding the Company's other intangible assets:
Other Intangible Assets Jun30,2018 Dec31,2017
In millions
GrossCarryingAmount AccumAmort Net
GrossCarryingAmount AccumAmort Net
Intangible assets with finite lives: Developed technology $ 7,751 $ (2,194) $ 5,557 $ 7,627 $ (1,834) $ 5,793 Software 1,479 (833) 646 1,420 (780) 640 Trademarks/tradenames 1,775 (664) 1,111 1,814 (596) 1,218 Customer-related 14,357 (2,499) 11,858 14,537 (2,151) 12,386 Microbial cell factories 391 (14) 377 397 (6) 391 Favorable supply contracts 475 (64) 411 495 (17) 478 Other 1 621 (183) 438 703 (166) 537Total other intangible assets with finite lives $ 26,849 $ (6,451) $ 20,398 $ 26,993 $ (5,550) $ 21,443Intangible assets with indefinite lives: In-process research and development 680 — 680 710 — 710
Germplasm 2 6,265 — 6,265 6,265 — 6,265 Trademarks/tradenames 4,759 — 4,759 4,856 — 4,856Total other intangible assets $ 38,553 $ (6,451) $ 32,102 $ 38,824 $ (5,550) $ 33,274
1. Primarily consists of sales and grower networks, marketing and manufacturing alliances and noncompetition agreements.2. Germplasm is the pool of genetic source material and body of knowledge gained from the development and delivery stage of plant breeding. The Company recognized germplasm as an
intangible asset upon the Merger. This intangible asset is expected to contribute to cash flows beyond the foreseeable future and there are no legal, regulatory, contractual or other factorswhich limit its useful life.
26

Table of Contents
The following table provides information regarding amortization expense related to other intangible assets:
Amortization Expense ThreeMonthsEnded SixMonthsEnded
In millions Jun30,2018 Jun30,2017 Jun30,2018 Jun30,2017Other intangible assets, excluding software $ 488 $ 157 $ 962 $ 312Software, included in "Cost of sales" $ 25 $ 20 $ 48 $ 40
Total estimated amortization expense for 2018 and the five succeeding fiscal years is as follows:
Estimated Amortization Expense
In millions 2018 $ 1,9842019 $ 1,9262020 $ 1,8792021 $ 1,8312022 $ 1,7532023 $ 1,715
NOTE 11 - TRANSFERS OF FINANCIAL ASSETSDow has historically sold trade accounts receivable of select North American entities and qualifying trade accounts receivable of select European entities on arevolving basis to certain multi-seller commercial paper conduit entities ("conduits"). The proceeds received are comprised of cash and interests in specified assetsof the conduits (the receivables sold by Dow) that entitle Dow to the residual cash flows of such specified assets in the conduits after the commercial paper hasbeen repaid. Neither the conduits nor the investors in those entities have recourse to other assets of Dow in the event of nonpayment by the debtors.
In the fourth quarter of 2017, Dow suspended further sales of trade accounts receivable through these facilities and began reducing outstanding balances throughcollections of trade accounts receivable previously sold to such conduits. Dow has the ability to resume such sales to the conduits, subject to certain prior noticerequirements, at the discretion of Dow.
The following table summarizes the carrying value of interests held, which represents Dow's maximum exposure to loss related to the receivables sold, and thepercentage of anticipated credit losses related to the trade accounts receivable sold. Also provided is the sensitivity of the fair value of the interests held tohypothetical adverse changes in the anticipated credit losses; amounts shown below are the corresponding hypothetical decreases in the carrying value of interests.
Interests HeldJun30,2018 Dec31,2017In millions
Carrying value of interests held $ 24 $ 677Percentage of anticipated credit losses 36.81% 2.64%Impact to carrying value - 10% adverse change $ — $ —Impact to carrying value - 20% adverse change $ — $ 1
Credit losses, net of any recoveries, on receivables sold were insignificant for the three and six months ended June 30, 2018 and 2017.
27
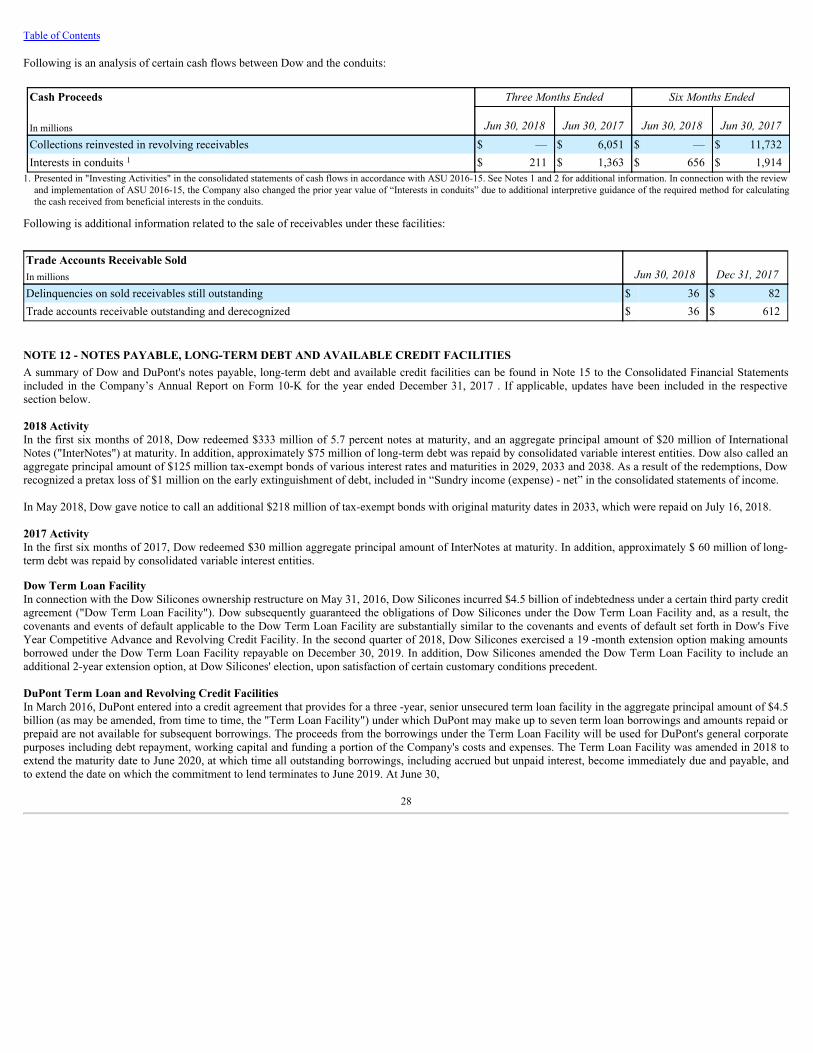
Table of Contents
Following is an analysis of certain cash flows between Dow and the conduits:
Cash Proceeds ThreeMonthsEnded SixMonthsEnded
In millions Jun30,2018 Jun30,2017 Jun30,2018 Jun30,2017 Collections reinvested in revolving receivables $ — $ 6,051 $ — $ 11,732 Interests in conduits 1 $ 211 $ 1,363 $ 656 $ 1,9141. Presented in "Investing Activities" in the consolidated statements of cash flows in accordance with ASU 2016-15. See Notes 1 and 2 for additional information. In connection with the review
and implementation of ASU 2016-15, the Company also changed the prior year value of “Interests in conduits” due to additional interpretive guidance of the required method for calculatingthe cash received from beneficial interests in the conduits.
Following is additional information related to the sale of receivables under these facilities:
Trade Accounts Receivable SoldJun30,2018 Dec31,2017In millions
Delinquencies on sold receivables still outstanding $ 36 $ 82Trade accounts receivable outstanding and derecognized $ 36 $ 612
NOTE 12 - NOTES PAYABLE, LONG-TERM DEBT AND AVAILABLE CREDIT FACILITIESA summary of Dow and DuPont's notes payable, long-term debt and available credit facilities can be found in Note 15 to the Consolidated Financial Statementsincluded in the Company’s Annual Report on Form 10-K for the year ended December 31, 2017 . If applicable, updates have been included in the respectivesection below.
2018 ActivityIn the first six months of 2018, Dow redeemed $333 million of 5.7 percent notes at maturity, and an aggregate principal amount of $20 million of InternationalNotes ("InterNotes") at maturity. In addition, approximately $75 million of long-term debt was repaid by consolidated variable interest entities. Dow also called anaggregate principal amount of $125 million tax-exempt bonds of various interest rates and maturities in 2029, 2033 and 2038. As a result of the redemptions, Dowrecognized a pretax loss of $1 million on the early extinguishment of debt, included in “Sundry income (expense) - net” in the consolidated statements of income.
In May 2018, Dow gave notice to call an additional $218 million of tax-exempt bonds with original maturity dates in 2033, which were repaid on July 16, 2018.
2017 ActivityIn the first six months of 2017, Dow redeemed $30 million aggregate principal amount of InterNotes at maturity. In addition, approximately $ 60 million of long-term debt was repaid by consolidated variable interest entities.
Dow Term Loan FacilityIn connection with the Dow Silicones ownership restructure on May 31, 2016, Dow Silicones incurred $4.5 billion of indebtedness under a certain third party creditagreement ("Dow Term Loan Facility"). Dow subsequently guaranteed the obligations of Dow Silicones under the Dow Term Loan Facility and, as a result, thecovenants and events of default applicable to the Dow Term Loan Facility are substantially similar to the covenants and events of default set forth in Dow's FiveYear Competitive Advance and Revolving Credit Facility. In the second quarter of 2018, Dow Silicones exercised a 19 -month extension option making amountsborrowed under the Dow Term Loan Facility repayable on December 30, 2019. In addition, Dow Silicones amended the Dow Term Loan Facility to include anadditional 2-year extension option, at Dow Silicones' election, upon satisfaction of certain customary conditions precedent.
DuPont Term Loan and Revolving Credit FacilitiesIn March 2016, DuPont entered into a credit agreement that provides for a three -year, senior unsecured term loan facility in the aggregate principal amount of $4.5billion (as may be amended, from time to time, the "Term Loan Facility") under which DuPont may make up to seven term loan borrowings and amounts repaid orprepaid are not available for subsequent borrowings. The proceeds from the borrowings under the Term Loan Facility will be used for DuPont's general corporatepurposes including debt repayment, working capital and funding a portion of the Company's costs and expenses. The Term Loan Facility was amended in 2018 toextend the maturity date to June 2020, at which time all outstanding borrowings, including accrued but unpaid interest, become immediately due and payable, andto extend the date on which the commitment to lend terminates to June 2019. At June 30,
28

Table of Contents
2018, DuPont had made three term loan borrowings in an aggregate principal amount of $1.5 billion and had unused commitments of $3.0 billion under the TermLoan Facility. In addition, in 2018 DuPont amended its $3.0 billion revolving credit facility to extend the maturity date to June 2020.
DuPont Repurchase FacilityIn February 2018, DuPont entered into a new committed receivable repurchase facility of up to $1,300 million (the "2018 Repurchase Facility") which expires inDecember 2018. Under the 2018 Repurchase Facility, DuPont may sell a portfolio of available and eligible outstanding customer notes receivables within theAgriculture segment to participating institutions and simultaneously agree to repurchase at a future date. The 2018 Repurchase Facility is considered a securedborrowing with the customer notes receivable inclusive of those that are sold and repurchased, equal to 105 percent of the outstanding amounts borrowed utilizedas collateral. Borrowings under the 2018 Repurchase Facility have an interest rate of LIBOR plus 0.75 percent.
At June 30, 2018, $1,208 million of notes receivable, recorded in "Accounts and notes receivable - Trade," were pledged as collateral against outstandingborrowings under the 2018 Repurchase Facility of $1,150 million , recorded in "Notes payable" on the consolidated balance sheets.
Debt Covenants and Default ProvisionsThere were no material changes to the debt covenants and default provisions related to the Subsidiaries' outstanding long-term debt and primary, private creditagreements in the first six months of 2018. For additional information on the Subsidiaries' debt covenants and default provisions, see Note 15 to the ConsolidatedFinancial Statements included in the Company's Annual Report on Form 10-K for the year ended December 31, 2017.
NOTE 13 - COMMITMENTS AND CONTINGENT LIABILITIESLitigationAsbestos-Related Matters of Union Carbide CorporationA summary of Asbestos-Related Matters of Union Carbide Corporation can be found in Note 16 to the Consolidated Financial Statements included in theCompany's Annual Report on Form 10-K for the year ended December 31, 2017 .
IntroductionUnion Carbide is and has been involved in a large number of asbestos-related suits filed primarily in state courts during the past four decades. These suitsprincipally allege personal injury resulting from exposure to asbestos-containing products and frequently seek both actual and punitive damages. The allegedclaims primarily relate to products that Union Carbide sold in the past, alleged exposure to asbestos-containing products located on Union Carbide’s premises, andUnion Carbide’s responsibility for asbestos suits filed against a former Union Carbide subsidiary, Amchem Products, Inc. (“Amchem”). In many cases, plaintiffsare unable to demonstrate that they have suffered any compensable loss as a result of such exposure, or that injuries incurred in fact resulted from exposure toUnion Carbide’s products.
Union Carbide expects more asbestos-related suits to be filed against Union Carbide and Amchem in the future, and will aggressively defend or reasonably resolve,as appropriate, both pending and future claims.
EstimatingtheAsbestos-RelatedLiabilitySince 2003, Union Carbide has engaged Ankura Consulting Group, LLC ("Ankura"), a third party actuarial specialist, to review Union Carbide's historicalasbestos-related claim and resolution activity in order to assist Union Carbide's management in estimating the asbestos-related liability. Each year, Ankura hasreviewed the claim and resolution activity to determine the appropriateness of updating the most recent Ankura study.
Based on the December 2017 Ankura review, and Union Carbide's own review of the data, Union Carbide's total asbestos-related liability through the terminal yearof 2049, including asbestos-related defense and processing costs, was $1,369 million at December 31, 2017 , and included in “Accrued and other current liabilities”and “Asbestos-related liabilities - noncurrent” in the consolidated balance sheets.
Each quarter, Union Carbide reviews claims filed, settled and dismissed, as well as average settlement and resolution costs by disease category. Union Carbide alsoconsiders additional quantitative and qualitative factors such as the nature of pending claims, trial experience of Union Carbide and other asbestos defendants,current spending for defense and processing costs, significant appellate rulings and legislative developments, trends in the tort system, and their respective effectson expected future resolution costs. Union Carbide's management considers all these factors in conjunction with the most recent Ankura study and determines
29
Table of Contents
whether a change in the estimate is warranted. Based on Union Carbide's review of 2018 activity, it was determined that no adjustment to the accrual was requiredat June 30, 2018 .
Union Carbide's asbestos related liability for pending and future claims and defense and processing costs was $1,310 million at June 30, 2018 . Approximately 16percent of the recorded liability related to pending claims and approximately 84 percent related to future claims.
SummaryThe Company's management believes the amounts recorded by Union Carbide for the asbestos-related liability (including defense and processing costs) reflectreasonable and probable estimates of the liability based upon current, known facts. However, future events, such as the number of new claims to be filed and/orreceived each year and the average cost of defending and disposing of each such claim, as well as the numerous uncertainties surrounding asbestos litigation in theUnited States over a significant period of time, could cause the actual costs for Union Carbide to be higher or lower than those projected or those recorded. Anysuch events could result in an increase or decrease in the recorded liability.
Because of the uncertainties described above, Union Carbide cannot estimate the full range of the cost of resolving pending and future asbestos-related claimsfacing Union Carbide and Amchem. As a result, it is reasonably possible that an additional cost of disposing of Union Carbide's asbestos-related claims, includingfuture defense and processing costs, could have a material impact on the Company's results of operations and cash flows for a particular period and on theconsolidated financial position.
Bayer CropScience v. Dow AgroSciences ICC ArbitrationA summary of the Bayer CropScience v. Dow AgroSciences ICC Arbitration can be found in Note 16 to the Consolidated Financial Statements included in theCompany's Annual Report on Form 10-K for the year ended December 31, 2017.
On August 13, 2012, Bayer CropScience AG and Bayer CropScience NV (together, “Bayer”) filed a request for arbitration with the International Chamber ofCommerce ("ICC") International Court of Arbitration against Dow AgroSciences LLC, a wholly owned subsidiary of Dow, and other subsidiaries of Dow(collectively, “DAS”) under a 1992 license agreement executed by predecessors of the parties (the “License Agreement”). In its request for arbitration, Bayeralleged that (i) DAS breached the License Agreement, (ii) the License Agreement was properly terminated with no ongoing rights to DAS, (iii) DAS infringed itspatent rights related to the use of the pat gene in certain soybean and cotton seed products, and (iv) Bayer was entitled to monetary damages and injunctive relief.DAS denied that it breached the License Agreement and asserted that the License Agreement remained in effect because it was not properly terminated. DAS alsoasserted that all of Bayer’s patents at issue are invalid and/or not infringed, and, therefore, for these reasons (and others), a license was not required.
A three -member arbitration tribunal presided over the arbitration proceeding (the “tribunal”). In a decision dated October 9, 2015, the tribunal determined that (i)DAS breached the License Agreement, (ii) Bayer properly terminated the License Agreement, (iii) all of the patents remaining in the proceeding are valid andinfringed, and (iv) that Bayer is entitled to monetary damages in the amount of $455 million inclusive of pre-judgment interest and costs (the “arbitral award”).One of the arbitrators, however, issued a partial dissent finding that all of the patents are invalid based on the double-patenting doctrine. The tribunal also deniedBayer’s request for injunctive relief.
On March 1, 2017, the U.S. Court of Appeals for the Federal Circuit affirmed the arbitral award. As a result of this action, in the first quarter of 2017, DASrecorded a loss of $469 million , inclusive of the arbitral award and post-judgment interest, which was included in "Sundry income (expense) - net" in theconsolidated statements of income and related to the Agriculture segment. On May 26, 2017, DAS paid the $469 million arbitral award to Bayer as a result of thatdecision. On September 11, 2017, DAS filed a petition for writofcertiorariwith the United States Supreme Court to review the case, but the Court denied DAS’spetition. The litigation is now concluded with no risk of further liability.
Rocky Flats MatterA summary of the Rocky Flats Matter can be found in Note 16 to the Consolidated Financial Statements included in the Company's Annual Report on Form 10-Kfor the year ended December 31, 2017.
Dow and Rockwell International Corporation ("Rockwell") (collectively, the "defendants") were defendants in a class action lawsuit filed in 1990 on behalf ofproperty owners ("plaintiffs") in Rocky Flats, Colorado, who asserted claims for nuisance and trespass based on alleged property damage caused by plutoniumreleases from a nuclear weapons facility owned by the U.S. Department of Energy ("DOE") but operated by Dow and Rockwell. The plaintiffs tried their case as apublic liability action under the Price Anderson Act ("PAA"). Dow and Rockwell litigated this matter in the U.S. District Court for the District of Colorado, theU.S. Tenth Circuit Court of Appeals and then filed a petition for writofcertiorariin the United States Supreme Court. On May 18, 2016, Dow, Rockwell and theplaintiffs entered into a settlement agreement for $375 million , of which $131 million was
30

Table of Contents
paid by Dow. The DOE authorized the settlement pursuant to the PAA and the nuclear hazards indemnity provisions contained in Dow's and Rockwell's contracts.On April 28, 2017, the District Court conducted a fairness hearing and granted final judgment approving the class settlement and dismissed class claims against thedefendants ("final judgment order").
On December 13, 2016, the United States Civil Board of Contract Appeals unanimously ordered the United States government to pay the amounts stipulated in theSettlement Agreement. On January 17, 2017, Dow received a full indemnity payment of $131 million from the United States government for Dow's share of theclass settlement. On January 26, 2017, Dow placed $130 million in an escrow account for the settlement payment owed to the plaintiffs. The funds weresubsequently released from escrow as a result of the final judgment order. The litigation is now concluded.
Dow Silicones Chapter 11 Related MattersA summary of the Dow Silicones Chapter 11 Related Matters can be found in Note 16 to the Consolidated Financial Statements included in the Company's AnnualReport on Form 10-K for the year ended December 31, 2017.
IntroductionIn 1995, Dow Silicones, then a 50 :50 joint venture between Dow and Corning Incorporated ("Corning"), voluntarily filed for protection under Chapter 11 of theU.S. Bankruptcy Code in order to resolve Dow Silicones' breast implant liabilities and related matters (the “Chapter 11 Proceeding”). Dow Silicones emerged fromthe Chapter 11 Proceeding on June 1, 2004 (the “Effective Date”) and is implementing the Joint Plan of Reorganization (the “Plan”). The Plan provides funding forthe resolution of breast implant and other product liability litigation covered by the Chapter 11 Proceeding and provides a process for the satisfaction ofcommercial creditor claims in the Chapter 11 Proceeding. As of June 1, 2016, Dow Silicones is a wholly owned subsidiary of Dow.
BreastImplantandOtherProductLiabilityClaimsUnder the Plan, a product liability settlement program administered by an independent claims office (the “Settlement Facility”) was created to resolve breastimplant and other product liability claims. Product liability claimants rejecting the settlement program in favor of pursuing litigation must bring suit against alitigation facility (the “Litigation Facility”). Dow Silicones has an obligation to fund the Settlement Facility and the Litigation Facility over a 16 -year period,commencing at the Effective Date. At June 30, 2018 , Dow Silicones and its insurers have made life-to-date payments of $1,762 million to the Settlement Facilityand the Settlement Facility reported an unexpended balance of $126 million .
Dow Silicones' liability for breast implant and other product liability claims ("Implant Liability") was $263 million at June 30, 2018 ( $263 million atDecember 31, 2017 ), which was included in "Other noncurrent obligations" in the consolidated balance sheets. Dow Silicones is not aware of circumstances thatwould change the factors used in estimating the Implant Liability and believes the recorded liability reflects the best estimate of the remaining funding obligationsunder the Plan; however, the estimate relies upon a number of significant assumptions, including: future claim filing levels in the Settlement Facility will be similarto those in a prior settlement program, which management uses to estimate future claim filing levels for the Settlement Facility; future acceptance rates, diseasemix, and payment values will be materially consistent with historical experience; no material negative outcomes in future controversies or disputes over Planinterpretation will occur; and the Plan will not be modified. If actual outcomes related to any of these assumptions prove to be materially different, the futureliability to fund the Plan may be materially different than the amount estimated. If Dow Silicones was ultimately required to fund the full liability up to themaximum capped value, the liability would be $2,047 million at June 30, 2018 .
CommercialCreditorIssuesThe Plan provides that each of Dow Silicones' commercial creditors (the “Commercial Creditors”) would receive in cash the sum of (a) an amount equal to theprincipal amount of their claims and (b) interest on such claims. The actual amount of interest that will ultimately be paid to these Commercial Creditors isuncertain due to pending litigation between Dow Silicones and the Commercial Creditors regarding the appropriate interest rates to be applied to outstandingobligations from the 1995 bankruptcy filing date through the Effective Date, as well as the presence of any recoverable fees, costs, and expenses. Upon the Planbecoming effective, Dow Silicones paid approximately $1,500 million to the Commercial Creditors, representing principal and an amount of interest that DowSilicones considers undisputed.
On May 10, 2017, the U.S. District Court for the Eastern District of Michigan entered a stipulated order resolving pending discovery motions and established adiscovery schedule for the Commercial Creditors matter. As a result, Dow Silicones and its third party consultants conducted further analysis of the CommercialCreditors claims and defenses. This analysis indicated the estimated remaining liability to Commercial Creditors to be within a range of $77 million to$260 million . No single amount within the range appears to be a better estimate than any other amount within the range. Therefore, Dow Silicones recorded theminimum liability within the range, which resulted in a decrease to the Commercial Creditor liability of $33 million in the second quarter of 2017, which wasincluded in "Sundry income (expense) - net" in the consolidated statements of income. At June 30, 2018 , the
31

Table of Contents
liability related to Dow Silicones' potential obligation to pay additional interest to its Commercial Creditors in the Chapter 11 Proceeding was $80 million and isincluded in "Accrued and other current liabilities" in the consolidated balance sheets ( $78 million at December 31, 2017 ). The actual amount of interest that willbe paid to these creditors is uncertain and will ultimately be resolved through continued proceedings in the District Court.
IndemnificationsIn connection with the June 1, 2016 ownership restructure of Dow Silicones, Dow is indemnified by Corning for 50 percent of future losses associated with certainpre-closing liabilities, including the Implant Liability and Commercial Creditors matters described above, subject to certain conditions and limits. The maximumamount of indemnified losses which may be recovered are subject to a cap that declines over time. No indemnification assets were recorded at June 30, 2018 orDecember 31, 2017 .
SummaryThe amounts recorded by Dow Silicones for the Chapter 11 related matters described above were based upon current, known facts, which management believesreflect reasonable and probable estimates of the liability. However, future events could cause the actual costs for Dow Silicones to be higher or lower than thoseprojected or those recorded. Any such events could result in an increase or decrease in the recorded liability.
Separation of DuPont's Performance Chemicals SegmentOn July 1, 2015, DuPont completed the separation of its Performance Chemicals segment through the spin-off of all of the issued and outstanding stock of TheChemours Company (the "Separation"). In connection with the Separation, DuPont and The Chemours Company (“Chemours”) entered into a Separationagreement (the "Separation Agreement"). Pursuant to the Separation Agreement and the amendment to the Separation Agreement, Chemours indemnifies DuPontagainst certain litigation, environmental, workers' compensation and other liabilities that arose prior to the Separation. The term of this indemnification is generallyindefinite and includes defense costs and expenses, as well as monetary and non-monetary settlements and judgments. In connection with the recognition ofliabilities related to these matters, DuPont records an indemnification asset when recovery is deemed probable. At June 30, 2018 , the indemnification assets were$87 million included in "Accounts and notes receivable - Other" and $324 million included in "Noncurrent receivables" along with the corresponding liabilities of$87 million recorded in "Accrued and other current liabilities" and $324 million included in "Other noncurrent obligations" in the consolidated balance sheets.
PFOA MattersDuPont used PFOA (collectively, perfluorooctanoic acids and its salts, including the ammonium salt), as a processing aid to manufacture some fluoropolymerresins at various sites around the world including its Washington Works' plant in West Virginia. Pursuant to the Separation Agreement discussed above, DuPont isindemnified by Chemours for the PFOA matters discussed below and has recorded a total indemnification asset of $16 million .
U.S.EnvironmentalProtectionAgency(“EPA")andNewJerseyDepartmentofEnvironmentalProtection(“NJDEP”)DuPont is obligated under agreements with the EPA, including a 2009 consent decree to which Chemours was added in 2017, and has made voluntarycommitments to the NJDEP. These obligations and voluntary commitments include surveying, sampling and testing drinking water in and around certain DuPontsites and offering treatment or an alternative supply of drinking water if tests indicate the presence of PFOA in drinking water at or greater than the national healthadvisory level established from time to time by the EPA. At June 30, 2018 , DuPont had an accrual of $16 million related to these obligations and voluntarycommitments. DuPont recorded an indemnification asset corresponding to the accrual balance at June 30, 2018 .
Leachv.DuPontIn August 2001, a class action, captioned Leach v. DuPont, was filed in West Virginia state court alleging that residents living near the Washington Works facilityhad suffered, or may suffer, deleterious health effects from exposure to PFOA in drinking water. A settlement was reached in 2004 that binds approximately 80,000residents, (the "Leach Settlement"). In addition to paying $23 million to plaintiff’s attorneys for fees and expenses and $70 million to fund a community healthproject, DuPont is obligated to fund up to $235 million for a medical monitoring program for eligible class members and to pay administrative costs and feesassociated with the program. Since the establishment in 2012 of an escrow account to fund medical monitoring as required by the settlement agreement,approximately $2 million has been contributed to the account and approximately $1 million has been disbursed from the account. DuPont also must continue toprovide water treatment designed to reduce the level of PFOA in water to six area water districts, including the Little Hocking Water Association, and private wellusers. While it is probable that DuPont will incur liabilities related to funding the medical monitoring program and providing water treatment, DuPont does notexpect any such liabilities to be material.
Under the Leach Settlement, DuPont funded a series of health studies which were completed in October 2012 by an independent science panel of experts (the "C8Science Panel"). The C8 Science Panel found probable links, as defined in the Leach Settlement,
32

Table of Contents
between exposure to PFOA and pregnancy-induced hypertension, including preeclampsia; kidney cancer; testicular cancer; thyroid disease; ulcerative colitis; anddiagnosed high cholesterol.
Leach class members may pursue personal injury claims against DuPont only for the six human diseases for which the C8 Science Panel determined a probable linkexists. Following the Leach Settlement, approximately 3,550 lawsuits alleging personal injury claims were filed in various federal and state courts in Ohio andWest Virginia. These lawsuits were consolidated in multi-district litigation ("MDL") in the U.S. District Court for the Southern District of Ohio. MDLSettlementIn the first quarter of 2017, the MDL was settled for $671 million in cash (the "MDL Settlement"), half of which was paid by Chemours and half paid by DuPont.At December 31, 2017, all payments under the settlement agreement were made by both companies. DuPont’s payment was not subject to indemnification orreimbursement by Chemours. In exchange for that payment, DuPont and Chemours are receiving releases of all claims by the settling plaintiffs. The MDLSettlement was entered into solely by way of compromise and settlement and is not in any way an admission of liability or fault by DuPont or Chemours. All of theMDL plaintiffs participated and resolved their claims within the MDL Settlement.
PostMDLSettlementPFOAPersonalInjuryClaimsThe MDL Settlement did not resolve claims of plaintiffs who did not have claims in the MDL or whose claims are based on diseases first diagnosed after February11, 2017. At June 30, 2018 , about 35 lawsuits alleging personal injury, including kidney and testicular cancer, from exposure to PFOA in drinking water had beenfiled against DuPont in West Virginia and Ohio.
In addition, three lawsuits are pending in federal court in New York on behalf of five individuals who are residents of Hoosick Falls, New York. The plaintiffsclaim personal injuries, including kidney cancer, thyroid disease and ulcerative colitis, from alleged exposure to PFOA discharged into the air and water fromnearby manufacturing facilities owned and operated by defendant third parties. Plaintiffs claim that PFOA used at the facilities was purchased from ormanufactured by DuPont and co-defendant, 3M Company. WaterUtilityandRelatedActionsActions filed by local water utilities pending in Alabama state and New Jersey federal court allege contamination from PFOA, and in the case of the Alabamaaction, perfluorinated chemicals and compounds, including PFOA (“PFCs”), used in co-defendant manufacturers’ operations. In February 2018, the State of Ohiofiled an action in Ohio state court alleging natural resource damages from historical PFOA emissions from the Washington Works site. The plaintiffs in theseactions seek monetary damages, remediation and other costs / damages.
While it is reasonably possible that DuPont could incur liabilities related to the post MDL Settlement PFOA personal injury claims and the water utility and relatedactions described above, any such liabilities are not expected to be material. Chemours is defending and indemnifying DuPont in these matters in accordance withthe amendment to the Separation Agreement discussed below.
AmendmenttoSeparationAgreementConcurrent with the MDL Settlement, DuPont and Chemours amended the Separation Agreement to provide for a limited sharing of potential future PFOAliabilities (i.e., indemnifiable losses, as defined in the Separation Agreement) for a period of five years beginning July 6, 2017. During that five -year period,Chemours will annually pay future PFOA liabilities up to $25 million and, if such amount is exceeded, DuPont would pay any excess amount up to the next $25million (which payment will not be subject to indemnification by Chemours), with Chemours annually bearing any further excess liabilities. After the five -yearperiod, this limited sharing agreement will expire, and Chemours’ indemnification obligations under the Separation Agreement will continue unchanged. Therehave been no charges incurred by DuPont under this arrangement through June 30, 2018 . Chemours has also agreed that it will not contest its liability to DuPontunder the Separation Agreement for PFOA liabilities on the basis of ostensible defenses generally applicable to the indemnification provisions under the SeparationAgreement, including defenses relating to punitive damages, fines or penalties or attorneys’ fees, and waives any such defenses with respect to PFOA liabilities.Chemours has, however, retained defenses as to whether any particular PFOA claim is within the scope of the indemnification provisions of the SeparationAgreement.
It is possible that new lawsuits could be filed against DuPont related to PFOA that may not be within the scope of the MDL Settlement. Any such new litigationwould be subject to indemnification by Chemours under the Separation Agreement, as amended.
DuPont Matters: Fayetteville Works Facility, North CarolinaPrior to the Separation of Chemours, DuPont introduced GenX as a polymerization processing aid and a replacement for PFOA at the Fayetteville Works facility.The facility is now owned and operated by Chemours which continues to manufacture and use GenX. Chemours is responding to ongoing inquiries andinvestigations from federal, state and local investigators, regulators and
33

Table of Contents
other governmental authorities as well as inquiries from the media and local community stakeholders. These inquiries and investigations involve the discharge ofGenX and certain similar compounds from the Chemours’ facility at Fayetteville Works into the Cape Fear River in Bladen County, North Carolina.
In August 2017, the U.S. Attorney’s Office for the Eastern District of North Carolina served DuPont with a grand jury subpoena for testimony and the productionof documents related to alleged discharges of GenX from the Fayetteville Works facility into the Cape Fear River. DuPont has been served with additionalsubpoenas relating to the same issue and in the second quarter of 2018, received a subpoena expanding the scope to any PFCs discharged from the FayettevilleWorks facility into the Cape Fear River. It is possible that these ongoing inquiries and investigations, including the grand jury subpoena, could result in penalties orsanctions, or that additional litigation will be instituted against Chemours and/or DuPont.
At June 30, 2018 , several actions are pending in federal court against Chemours and DuPont. These actions have been consolidated into a single purported classaction, on behalf of putative classes of property owners and residents in areas near or who draw drinking water from the Cape Fear River. These actions relate tothe alleged discharge of certain PFCs into the river from the operations and wastewater treatment at the Fayetteville Works facility and seek various relief includingmedical monitoring, property damages and injunctive relief. Separate actions filed by the various North Carolina water authorities including Cape Fear PublicUtility Authority and Brunswick County, North Carolina, have been consolidated into one action for purposes of litigation and seek actual and punitive damages aswell as injunctive relief. In addition, an action remains pending in North Carolina state court on behalf of about 100 plaintiffs who own property near theFayetteville Works facility. The plaintiffs seek damages for nuisance allegedly caused by releases of certain PFCs from the site.
Management believes the probability of loss with respect to these actions is remote.
DuPont has an indemnification claim against Chemours with respect to current and future inquiries and claims, including lawsuits, related to the foregoing. AtJune 30, 2018 , Chemours is defending and indemnifying DuPont in the pending civil actions.
Other Litigation MattersIn addition to the specific matters described above, Dow and DuPont are parties to a number of other claims and lawsuits arising out of the normal course ofbusiness with respect to product liability, patent infringement, governmental regulation, contract and commercial litigation, and other actions. Certain of theseactions purport to be class actions and seek damages in very large amounts. All such claims are being contested. Dow and DuPont have active risk managementprograms consisting of numerous insurance policies secured from many carriers at various times. These policies may provide coverage that could be utilized tominimize the financial impact, if any, of certain contingencies described above. It is the opinion of the Company’s management that the possibility is remote thatthe aggregate of all such other claims and lawsuits will have a material adverse impact on the results of operations, financial condition and cash flows of theCompany.
Gain Contingency - Dow v. Nova Chemicals Corporation Patent Infringement MatterA summary of the Dow v. Nova Chemicals Corporation Patent Infringement Matter can be found in Note 16 to the Consolidated Financial Statements included inthe Company's Annual Report on Form 10-K for the year ended December 31, 2017.
On December 9, 2010, Dow filed suit in the Federal Court in Ontario, Canada ("Federal Court") alleging that Nova Chemicals Corporation ("Nova") was infringingDow's Canadian polyethylene patent 2,106,705. Nova counterclaimed on the grounds of invalidity and non-infringement. On June 29, 2017, the Federal Courtissued a Confidential Supplemental Judgment, concluding that Nova must pay $645 million Canadian dollars (equivalent to $495 million U.S. dollars) to Dow, pluspre- and post-judgment interest, for which Dow received payment of $501 million from Nova on July 6, 2017. Although Nova is appealing portions of the damagesjudgment, certain portions of it are indisputable and will be owed to Dow regardless of the outcome of any further appeals by Nova. As a result of these actions andin accordance with ASC 450-30 "Gain Contingencies ,"Dow recorded a $160 million pretax gain in the second quarter of 2017, related to the Packaging &Specialty Plastics segment, of which $137 million was included in "Sundry income (expense) - net" and $23 million was included in "Selling, general andadministrative expenses" in the consolidated statements of income. At June 30, 2018 , Dow had $341 million ( $341 million at December 31, 2017 ) included in"Other noncurrent obligations" related to the disputed portion of the damages judgment. Dow is confident of its chances of defending the entire judgment onappeal, particularly the trial court's determinations on important factual issues, which will be accorded deferential review on appeal.
Environmental MattersAccruals for environmental matters are recorded when it is probable that a liability has been incurred and the amount of the liability can be reasonably estimatedbased on current law and existing technologies. At June 30, 2018 , the Company had accrued obligations of $1,260 million for probable environmental remediationand restoration costs, including $203 million for the remediation of Superfund sites. These obligations are included in "Accrued and other current liabilities" and"Other noncurrent obligations" in
34

Table of Contents
the consolidated balance sheets. This is management’s best estimate of the costs for remediation and restoration with respect to environmental matters for whichthe Company has accrued liabilities, although it is reasonably possible that the ultimate cost with respect to these particular matters could range up to two and a halftimes that amount. Consequently, it is reasonably possible that environmental remediation and restoration costs in excess of amounts accrued could have a materialimpact on the Company’s results of operations, financial condition and cash flows. It is the opinion of the Company’s management, however, that the possibility isremote that costs in excess of the range disclosed will have a material impact on the Company’s results of operations, financial condition or cash flows. Inherentuncertainties exist in these estimates primarily due to unknown conditions, changing governmental regulations and legal standards regarding liability, and emergingremediation technologies for handling site remediation and restoration. At December 31, 2017 , the Company had accrued obligations of $1,311 million forprobable environmental remediation and restoration costs, including $219 million for the remediation of Superfund sites.
Pursuant to the DuPont and Chemours Separation Agreement, DuPont is indemnified by Chemours for certain environmental matters, included in the liability of$1,260 million , that have an estimated liability of $236 million at June 30, 2018 , and a potential exposure that ranges up to approximately $420 million above thecurrent accrual. As such, DuPont has recorded an indemnification asset of $236 million corresponding to its accrual balance related to these matters at June 30,2018 , including $41 million related to Superfund sites.
GuaranteesThe following table provides a summary of the final expiration, maximum future payments and recorded liability reflected in the consolidated balance sheets foreach type of guarantee:
Guarantees Jun30,2018 Dec31,2017
In millionsFinal
Expiration
MaximumFuturePayments
RecordedLiability
FinalExpiration
MaximumFuturePayments
RecordedLiability
Dow guarantees 2023 $ 4,572 $ 45 2023 $ 4,774 $ 49 Dow residual value guarantees 2027 895 132 2027 889 135 Total Dow guarantees $ 5,467 $ 177 $ 5,663 $ 184 DuPont guarantees 2022 $ 256 $ — 2022 $ 260 $ — DuPont residual value guarantees 2029 36 — 2029 37 — Total DuPont guarantees $ 292 $ — $ 297 $ — Total guarantees $ 5,759 $ 177 $ 5,960 $ 184
GuaranteesThe Subsidiaries have entered into guarantee agreements arising in the ordinary course of business from relationships with customers and nonconsolidated affiliateswhen the Subsidiaries undertake an obligation to guarantee the performance of others (via delivery of cash or other assets) if specified triggering events occur.With guarantees, such as commercial or financial contracts, non-performance by the guaranteed party triggers the obligation of the Subsidiaries to make paymentsto the beneficiary of the guarantee. The majority of these guarantees relate to debt of nonconsolidated affiliates, which have expiration dates ranging from less thanone year to five years, and trade financing transactions in Latin America, which typically expire within one year of inception. The Subsidiaries current expectationis that future payment or performance related to the non-performance of others is considered remote.
Dow has entered into guarantee agreements ("Guarantees") related to project financing for Sadara Chemical Company ("Sadara"), a nonconsolidated affiliate. Thetotal of an Islamic bond and additional project financing (collectively “Total Project Financing”) obtained by Sadara is approximately $12.5 billion . Sadara had$12.4 billion of Total Project Financing outstanding at June 30, 2018 ( $12.4 billion at December 31, 2017 ). Dow's guarantee of the Total Project Financing is inproportion to Dow's 35 percent ownership interest in Sadara, or up to approximately $4.4 billion when the project financing is fully drawn. The Guarantees will bereleased upon completion of construction of the Sadara complex and satisfactory fulfillment of certain other conditions, including passage of an extensiveoperational testing program, which is expected by the middle of 2019, and must occur no later than December 2020.
Residual Value GuaranteesThe Subsidiaries provide guarantees related to leased assets specifying the residual value that will be available to the lessor at lease termination through sale of theassets to the lessee or third parties.
35

Table of Contents
NOTE 14 - ACCUMULATED OTHER COMPREHENSIVE LOSSThe following table summarizes the activity related to each component of accumulated other comprehensive loss ("AOCL") for the six months ended June 30,2018 and 2017 :
Accumulated Other Comprehensive Loss 1 UnrealizedGains(Losses)onInvestments
CumulativeTranslationAdj
PensionandOtherPostretire
BenefitsDerivativeInstruments
TotalAccumOtherComp
LossIn millions
Balance at Jan 1, 2017 $ 43 $ (2,381) $ (7,389) $ (95) $ (9,822)Other comprehensive income (loss) before reclassifications 38 632 — (73) 597Amounts reclassified from accumulated other comprehensive
income (loss) (30) (6) 203 (16) 151Net other comprehensive income (loss) $ 8 $ 626 $ 203 $ (89) $ 748Balance at Jun 30, 2017 $ 51 $ (1,755) $ (7,186) $ (184) $ (9,074)
Balance at Jan 1, 2018 2 $ 17 $ (1,935) $ (6,923) $ (111) $ (8,952)Other comprehensive income (loss) before reclassifications (41) (1,058) 9 75 (1,015)Amounts reclassified from accumulated other comprehensive
income (loss) 2 (2) 248 44 292Net other comprehensive income (loss) $ (39) $ (1,060) $ 257 $ 119 $ (723)Reclassification of stranded tax effects 3 $ (1) $ (107) $ (927) $ (22) $ (1,057)Balance at Jun 30, 2018 $ (23) $ (3,102) $ (7,593) $ (14) $ (10,732)
1. Prior period amounts have been updated to conform with the current period presentation.2. The beginning balance of "Unrealized gains (losses) on investments" was increased by $20 million to reflect the impact of the adoption of ASU 2016-01. See Notes 1 and 2 for additional
information.3. Amounts reclassified to retained earnings as a result of the adoption of ASU 2018-02. See Notes 1 and 2 for additional information.
The tax effects on the net activity related to each component of other comprehensive income (loss) for the three and six months ended June 30, 2018 and 2017 wereas follows:
Tax Benefit (Expense) ThreeMonthsEnded SixMonthsEnded
In millions Jun30,2018 Jun30,2017 Jun30,2018 Jun30,2017Unrealized gains (losses) on investments $ (3) $ (4) $ (9) $ 4Cumulative translation adjustments 25 8 20 26Pension and other postretirement benefit plans 34 48 60 95Derivative instruments 17 (7) 10 (21)Tax benefit from income taxes related to other comprehensive income items $ 73 $ 45 $ 81 $ 104
36

Table of Contents
A summary of the reclassifications out of AOCL for the three and six months ended June 30, 2018 and 2017 is provided as follows:
Reclassifications Out of Accumulated Other ComprehensiveLoss ThreeMonthsEnded SixMonthsEnded ConsolidatedStatementsof
IncomeClassificationIn millions Jun30,2018 Jun30,2017 Jun30,2018 Jun30,2017Unrealized gains (losses) on investments $ 1 $ (35) $ 3 $ (47) See (1) below
Tax expense (benefit) — 13 (1) 17 See (2) belowAfter tax $ 1 $ (22) $ 2 $ (30)
Cumulative translation adjustments $ (2) $ (6) $ (2) $ (6) See (3) belowPension and other postretirement benefit plans $ 156 $ 149 $ 310 $ 298 See (4) below
Tax benefit (34) (48) (62) (95) See (2) belowAfter tax $ 122 $ 101 $ 248 $ 203
Derivative Instruments $ 26 $ (8) $ 52 $ (15) See (5) belowTax benefit (3) — (8) (1) See (2) belowAfter tax $ 23 $ (8) $ 44 $ (16)
Total reclassifications for the period, after tax $ 144 $ 65 $ 292 $ 151 1. "Net sales" and "Sundry income (expense) - net."2. "Provision for income taxes on continuing operations."3. "Sundry income (expense) - net."4. These AOCL components are included in the computation of net periodic benefit cost of the Company's defined benefit pension and other postretirement benefit plans. See Note 16 for
additional information.5. "Cost of sales," "Sundry income (expense) - net" and "Interest expense and amortization of debt discount."
NOTE 15 - NONCONTROLLING INTERESTSOwnership interests in the Company's subsidiaries held by parties other than the Company are presented separately from the Company's equity in the consolidatedbalance sheets as "Noncontrolling interests." The amount of consolidated net income attributable to the Company and the noncontrolling interests are bothpresented on the face of the consolidated statements of income.
The following table summarizes the activity for equity attributable to noncontrolling interests for the three and six months ended June 30, 2018 and 2017 :
Noncontrolling Interests ThreeMonthsEnded SixMonthsEnded
In millionsJun30,2018
Jun30,2017
Jun30,2018
Jun30,2017
Balance at beginning of period $ 1,664 $ 1,274 $ 1,597 $ 1,242Net income attributable to noncontrolling interests 35 38 79 65Distributions to noncontrolling interests 1 (46) (27) (73) (48)Noncontrolling interests from Merger 2 — — 56 —Deconsolidation of noncontrolling interests 3 — (119) — (119)Cumulative translation adjustments (34) 3 (40) 28Other 1 (1) 1 —Balance at end of period $ 1,620 $ 1,168 $ 1,620 $ 1,168
1. Net of dividends paid to a joint venture, which were reclassified to "Equity in earnings of nonconsolidated affiliates" in the consolidated statements of income, totaled $6 million for the threemonths ended June 30, 2018 ( $3 million for the three months ended June 30, 2017 ) and $6 million for the six months ended June 30, 2018 ( $3 million for the six months ended June 30,2017 ).
2. Reflects a measurement period adjustment. See Note 3 for additional information.3. On June 30, 2017, Dow sold its ownership interest in SKC Haas Display Films group of companies.
37

Table of Contents
NOTE 16 - PENSION PLANS AND OTHER POSTRETIREMENT BENEFITS
Dow and DuPont did not merge their defined benefit pension and other postretirement benefit plans as a result of the Merger. The following table provides thecomponents of net periodic benefit cost for Dow and DuPont's significant plans:
Net Periodic Benefit Cost for All Significant Plans ThreeMonthsEnded SixMonthsEnded
In millions Jun30,2018 Jun30,2017 Jun30,2018 Jun30,2017DefinedBenefitPensionPlans:
Service cost $ 165 $ 126 $ 332 $ 251Interest cost 406 220 814 439Expected return on plan assets (705) (385) (1,414) (768)Amortization of prior service credit (6) (6) (12) (12)Amortization of net loss 169 158 340 315Curtailment/settlement 1 (4) (6) (4) (6)Net periodic benefit cost $ 25 $ 107 $ 56 $ 219
OtherPostretirementBenefits: Service cost $ 5 $ 3 $ 10 $ 6Interest cost 33 13 65 27Amortization of net gain (6) (1) (12) (3)Net periodic benefit cost $ 32 $ 15 $ 63 $ 30
1. The 2018 impact relates to the curtailment and settlement of pension plans in the U.S. and Australia. The 2017 impact relates to the curtailment and settlement of a pension plan in Korea.
On January 1, 2018, the Company adopted ASU 2017-07, which impacted the presentation of the components of net periodic benefit cost in the consolidatedstatements of income. Net periodic benefit cost, other than the service cost component, is retrospectively included in "Sundry income (expense) - net" in theconsolidated statements of income. See Notes 1 , 2 and 6 for additional information.
NOTE 17 - STOCK-BASED COMPENSATIONA summary of Dow and DuPont's stock-based compensation plans can be found in Note 20 to the Consolidated Financial Statements included in the Company’sAnnual Report on Form 10-K for the year ended December 31, 2017 . Dow and DuPont did not merge their equity incentive plans as a result of the Merger. TheDow and DuPont stock-based compensation plans were assumed by DowDuPont and continue in place with the ability to grant and issue DowDuPont commonstock.
Dow Stock Incentive PlanDow grants stock-based compensation to employees and non-employee directors under The Dow Chemical Company Amended and Restated 2012 Stock IncentivePlan (the "2012 Plan"). Effective with the Merger, on August 31, 2017, all outstanding Dow stock options and deferred stock awards were converted into stockoptions and deferred stock awards with respect to DowDuPont Common Stock. The stock options and deferred stock awards have the same terms and conditionsunder the applicable plans and award agreements prior to the Merger. Most of Dow's stock-based compensation awards are granted in the first quarter of each year.There was minimal grant activity in the second quarter of 2018 .
In the first quarter of 2018 , Dow granted the following stock-based compensation awards to employees under the 2012 Plan:
• 6.3 million stock options with a weighted-average exercise price of $71.85 per share and a weighted-average fair value of $15.46 per share; and
• 1.9 million restricted stock units ("RSUs") (formerly termed deferred stock) with a weighted-average fair value of $71.83 per share.
Effective with the first quarter of 2018 grant, Dow began using the Black-Scholes option valuation model to estimate the fair value of stock options. This valuationmethodology was adopted as a result of the Merger to align valuation methodologies with DuPont and better align with industry practice.
38

Table of Contents
DuPont Equity Incentive PlanDuPont grants stock-based compensation to certain employees, directors, and consultants through grants of stock options, time-vested RSUs, and performance-based restricted stock units (“PSUs”) under the DuPont Equity Incentive Plan ("DuPont EIP"). The previous DuPont equity awards were converted into the right toreceive 1.2820 shares of DowDuPont Common Stock. The awards have the same terms and conditions as were applicable to such equity awards immediately priorto the Merger closing date. Most of these awards have been granted annually in the first quarter of each calendar year. There was minimal grant activity in thesecond quarter of 2018 .
In the first quarter of 2018, DuPont granted the following stock-based compensation awards under the DuPont EIP:
• 3.3 million stock options with a weighted-average exercise price of $71.85 per share and a weighted-average fair value of $15.46 per share; and
• 0.8 million RSUs with a weighted-average fair value of $71.75 per share.
NOTE 18 - FINANCIAL INSTRUMENTSA summary of the Company's financial instruments, risk management policies, derivative instruments and hedging activities can be found in Note 21 of theConsolidated Financial Statements included in the Company's Annual Report on Form 10-K for the year ended December 31, 2017. If applicable, updates havebeen included in the respective section below.
The following table summarizes the fair value of financial instruments at June 30, 2018 and December 31, 2017 :
Fair Value of Financial Instruments Jun30,2018 Dec31,2017
In millions Cost Gain Loss FairValue Cost Gain Loss FairValueCash equivalents 1 $ 4,279 $ — $ — $ 4,279 $ 6,927 $ — $ — $ 6,927Restricted cash equivalents 1, 2 $ 516 $ — $ — $ 516 $ 558 $ — $ — $ 558Marketable securities:
Available-for-sale 3 $ 131 $ 2 $ — $ 133 $ 4 $ — $ — $ 4Held-to-maturity 1, 4 374 — — 374 952 — — 952Total marketable securities $ 505 $ 2 $ — $ 507 $ 956 $ — $ — $ 956
Other investments: Debt securities:
Government debt 5 $ 678 $ 8 $ (24) $ 662 $ 637 $ 13 $ (11) $ 639Corporate bonds 913 22 (28) 907 704 32 (3) 733
Total debt securities $ 1,591 $ 30 $ (52) $ 1,569 $ 1,341 $ 45 $ (14) $ 1,372Equity securities 6 $ 154 $ 20 $ (13) $ 161 $ 164 $ 2 $ (26) $ 140
Total other investments $ 1,745 $ 50 $ (65) $ 1,730 $ 1,505 $ 47 $ (40) $ 1,512Total cash and restricted cashequivalents, marketable securities andother investments $ 7,045 $ 52 $ (65) $ 7,032 $ 9,946 $ 47 $ (40) $ 9,953
Long-term debt including debt duewithin one year 7 $ (31,456) $ 467 $ (1,312) $ (32,301) $ (32,123) $ 69 $ (2,121) $ (34,175)
Derivatives relating to: Interest rates $ — $ — $ (39) $ (39) $ — $ — $ (4) $ (4)Commodities 8 — 163 (212) (49) — 130 (256) (126)Foreign currency — 301 (79) 222 — 31 (159) (128)
Total derivatives $ — $ 464 $ (330) $ 134 $ — $ 161 $ (419) $ (258)1. Prior period amounts were updated to conform with the current year presentation.2. Classified as "Other current assets" in the consolidated balance sheets.3. Available-for-sale securities with maturities of less than one year at the time of purchase.4. Held-to-maturity securities with maturities of more than three months to less than one year at the time of purchase.5. U.S. Treasury obligations, U.S. agency obligations, agency mortgage-backed securities and other municipalities’ obligations.6. Equity securities with a readily determinable fair value. Presented in accordance with ASU 2016-01. See Notes 1 and 2 for additional information.7. Cost includes fair value adjustments of $419 million at June 30, 2018 and $492 million at December 31, 2017 , related to the accounting for the Merger. Cost also includes fair value hedge
adjustments of $18 million at June 30, 2018 and $19 million at December 31, 2017 on $2,990 million of debt.8. Presented net of cash collateral.
39

Table of Contents
Debt SecuritiesThe Company's investments in debt securities are primarily classified as available-for-sale. The following table provides the investing results from available-for-sale securities for the six months ended June 30, 2018 and 2017 :
Investing Results 1 SixMonthsEnded
In millions Jun30,2018 Jun30,2017Proceeds from sales of available-for-sale securities $ 625 $ 132Gross realized gains $ 15 $ 3Gross realized losses $ (18) $ —
1. Prior year amounts were updated to conform with the current year presentation as a result of the adoption of ASU 2016-01.
For the six months ended June 30, 2018 , $1,576 million of marketable securities matured.
Equity SecuritiesThe Company's investments in equity securities with a readily determinable fair value totaled $161 million at June 30, 2018 ( $140 million at December 31, 2017 ).The net unrealized loss recognized in earnings on equity securities totaled $1 million for the three months ended June 30, 2018 , and an unrealized gain of$7 million for the six months ended June 30, 2018 . The aggregate carrying value of the Company’s investments in equity securities where fair value is not readilydeterminable totaled $96 million at June 30, 2018 , reflecting the cost of the investments. There were no adjustments to the cost basis of these investments forimpairment or observable price changes for the three and six months ended June 30, 2018 .
DerivativesInterestRateRiskManagementThe main objective of interest rate risk management is to reduce the total funding cost to the Company and to alter the interest rate exposure to the desired riskprofile. To achieve this objective, the Company hedges using interest rate swaps, “swaptions” and exchange-traded instruments.
The Company had $2,536 million notional United States dollar equivalent open interest rate derivatives designated as cash flow hedges at June 30, 2018 , with anet loss included in AOCL of $30 million after tax (net loss of $3 million after tax at December 31, 2017 ). These contracts had maturity dates that extend to 2022 .
40
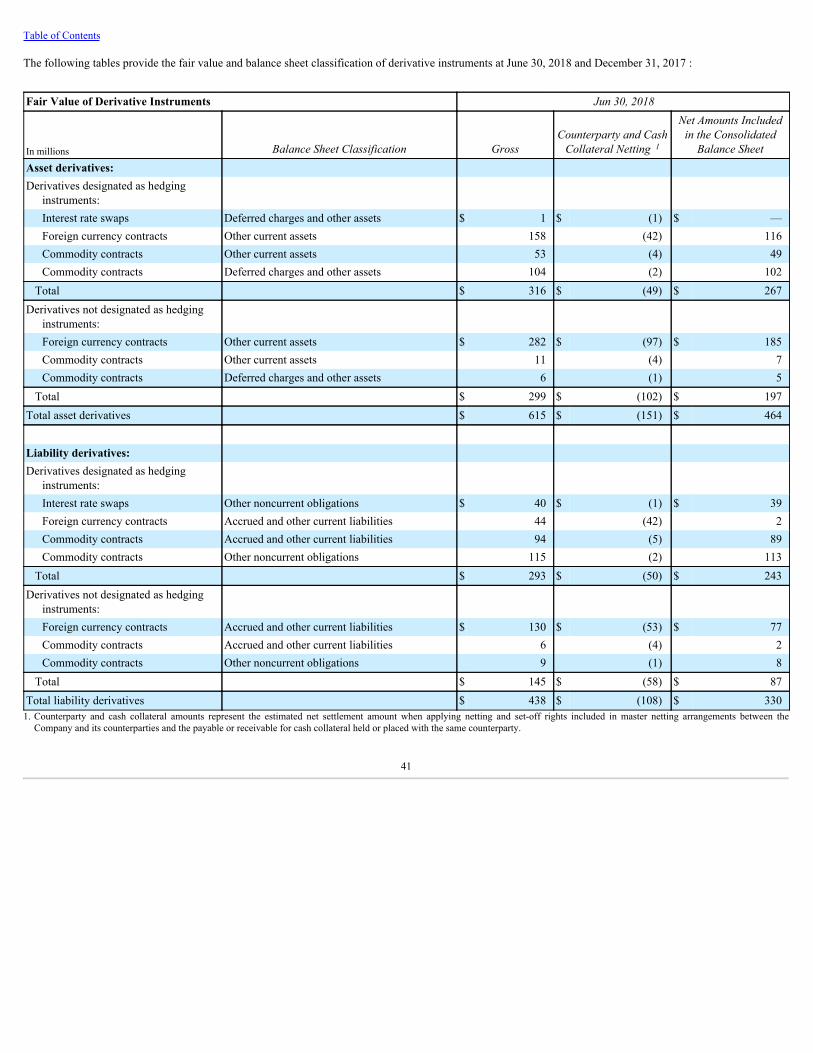
Table of Contents
The following tables provide the fair value and balance sheet classification of derivative instruments at June 30, 2018 and December 31, 2017 :
Fair Value of Derivative Instruments Jun30,2018
In millions BalanceSheetClassification GrossCounterpartyandCashCollateralNetting1
NetAmountsIncludedintheConsolidatedBalanceSheet
Asset derivatives: Derivatives designated as hedging
instruments: Interest rate swaps Deferred charges and other assets $ 1 $ (1) $ —Foreign currency contracts Other current assets 158 (42) 116Commodity contracts Other current assets 53 (4) 49Commodity contracts Deferred charges and other assets 104 (2) 102
Total $ 316 $ (49) $ 267Derivatives not designated as hedging
instruments: Foreign currency contracts Other current assets $ 282 $ (97) $ 185Commodity contracts Other current assets 11 (4) 7Commodity contracts Deferred charges and other assets 6 (1) 5
Total $ 299 $ (102) $ 197Total asset derivatives $ 615 $ (151) $ 464 Liability derivatives: Derivatives designated as hedging
instruments: Interest rate swaps Other noncurrent obligations $ 40 $ (1) $ 39Foreign currency contracts Accrued and other current liabilities 44 (42) 2Commodity contracts Accrued and other current liabilities 94 (5) 89Commodity contracts Other noncurrent obligations 115 (2) 113
Total $ 293 $ (50) $ 243Derivatives not designated as hedging
instruments: Foreign currency contracts Accrued and other current liabilities $ 130 $ (53) $ 77Commodity contracts Accrued and other current liabilities 6 (4) 2Commodity contracts Other noncurrent obligations 9 (1) 8
Total $ 145 $ (58) $ 87Total liability derivatives $ 438 $ (108) $ 330
1. Counterparty and cash collateral amounts represent the estimated net settlement amount when applying netting and set-off rights included in master netting arrangements between theCompany and its counterparties and the payable or receivable for cash collateral held or placed with the same counterparty.
41
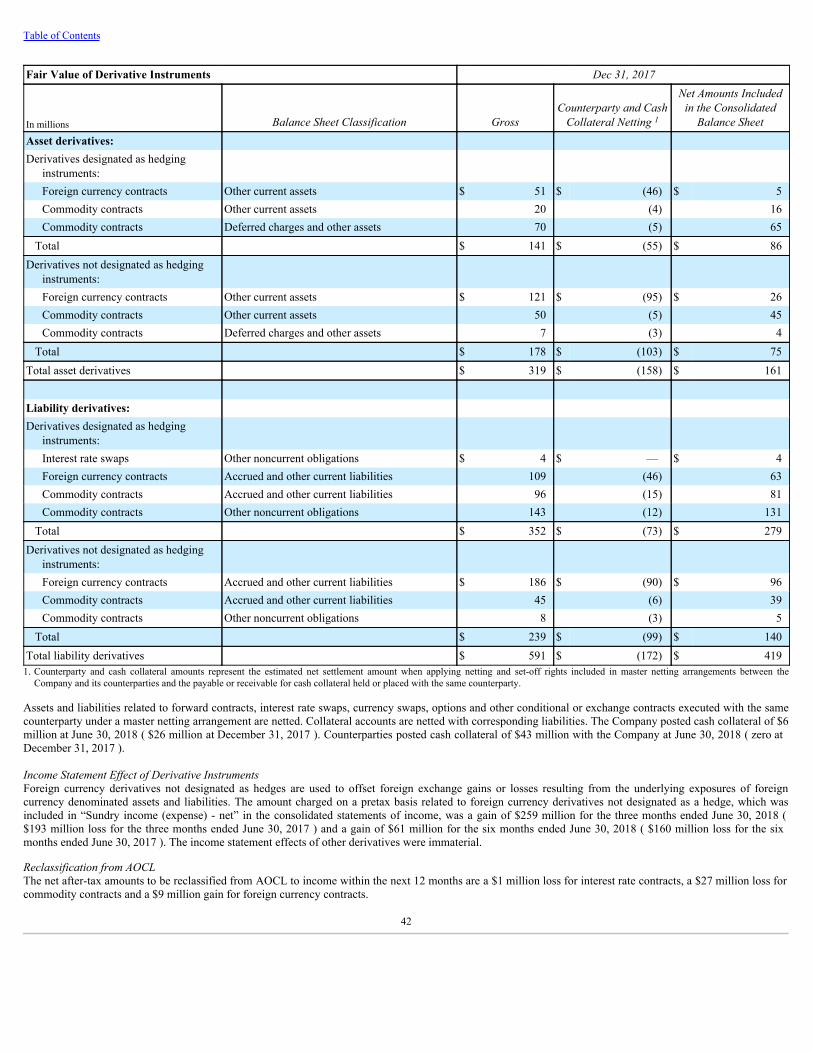
Table of Contents
Fair Value of Derivative Instruments Dec31,2017
In millions BalanceSheetClassification GrossCounterpartyandCashCollateralNetting1
NetAmountsIncludedintheConsolidatedBalanceSheet
Asset derivatives: Derivatives designated as hedging
instruments: Foreign currency contracts Other current assets $ 51 $ (46) $ 5Commodity contracts Other current assets 20 (4) 16Commodity contracts Deferred charges and other assets 70 (5) 65
Total $ 141 $ (55) $ 86Derivatives not designated as hedging
instruments: Foreign currency contracts Other current assets $ 121 $ (95) $ 26Commodity contracts Other current assets 50 (5) 45Commodity contracts Deferred charges and other assets 7 (3) 4
Total $ 178 $ (103) $ 75Total asset derivatives $ 319 $ (158) $ 161 Liability derivatives: Derivatives designated as hedging
instruments: Interest rate swaps Other noncurrent obligations $ 4 $ — $ 4Foreign currency contracts Accrued and other current liabilities 109 (46) 63Commodity contracts Accrued and other current liabilities 96 (15) 81Commodity contracts Other noncurrent obligations 143 (12) 131
Total $ 352 $ (73) $ 279Derivatives not designated as hedging
instruments: Foreign currency contracts Accrued and other current liabilities $ 186 $ (90) $ 96Commodity contracts Accrued and other current liabilities 45 (6) 39Commodity contracts Other noncurrent obligations 8 (3) 5
Total $ 239 $ (99) $ 140Total liability derivatives $ 591 $ (172) $ 419
1. Counterparty and cash collateral amounts represent the estimated net settlement amount when applying netting and set-off rights included in master netting arrangements between theCompany and its counterparties and the payable or receivable for cash collateral held or placed with the same counterparty.
Assets and liabilities related to forward contracts, interest rate swaps, currency swaps, options and other conditional or exchange contracts executed with the samecounterparty under a master netting arrangement are netted. Collateral accounts are netted with corresponding liabilities. The Company posted cash collateral of $6million at June 30, 2018 ( $26 million at December 31, 2017 ). Counterparties posted cash collateral of $43 million with the Company at June 30, 2018 ( zero atDecember 31, 2017 ).
IncomeStatementEffectofDerivativeInstrumentsForeign currency derivatives not designated as hedges are used to offset foreign exchange gains or losses resulting from the underlying exposures of foreigncurrency denominated assets and liabilities. The amount charged on a pretax basis related to foreign currency derivatives not designated as a hedge, which wasincluded in “Sundry income (expense) - net” in the consolidated statements of income, was a gain of $259 million for the three months ended June 30, 2018 ($193 million loss for the three months ended June 30, 2017 ) and a gain of $61 million for the six months ended June 30, 2018 ( $160 million loss for the sixmonths ended June 30, 2017 ). The income statement effects of other derivatives were immaterial.
ReclassificationfromAOCLThe net after-tax amounts to be reclassified from AOCL to income within the next 12 months are a $1 million loss for interest rate contracts, a $27 million loss forcommodity contracts and a $9 million gain for foreign currency contracts.
42

Table of Contents
NOTE 19 - FAIR VALUE MEASUREMENTSA summary of the Company's recurring and nonrecurring fair value measurements can be found in Note 22 to the Consolidated Financial Statements included inthe Company's Annual Report on Form 10-K for the year ended December 31, 2017. If applicable, updates have been included in the respective section below.
Fair Value Measurements on a Recurring BasisThe following tables summarize the bases used to measure certain assets and liabilities at fair value on a recurring basis:
Basis of Fair Value Measurements on a Recurring Basis at Jun 30,2018
QuotedPricesinActiveMarketsforIdenticalItems(Level1)
SignificantOtherObservableInputs
(Level2)
SignificantUnobservableInputs
(Level3) TotalIn millions
Assets at fair value:
Cash equivalents and restricted cash equivalents 1 $ — $ 4,795 $ — $ 4,795
Marketable securities 2 — 507 — 507
Interests in trade accounts receivable conduits 3 — — 24 24
Equity securities 4 22 139 — 161
Debt securities: 4
Government debt 5 — 662 — 662Corporate bonds — 907 — 907
Derivatives relating to: 6 Interest rates — 1 — 1Commodities 39 135 — 174Foreign currency — 440 — 440
Total assets at fair value $ 61 $ 7,586 $ 24 $ 7,671Liabilities at fair value:
Long-term debt including debt due within one year 7 $ — $ 32,301 $ — $ 32,301
Derivatives relating to: 6 Interest rates — 40 — 40Commodities 20 204 — 224Foreign currency — 174 — 174
Total liabilities at fair value $ 20 $ 32,719 $ — $ 32,7391. Treasury bills, time deposits, and money market funds included in "Cash and cash equivalents" and money market funds included in "Other current assets" in the consolidated balance sheets
and held at amortized cost, which approximates fair value.2. Primarily time deposits with maturities of greater than three months at time of acquisition.3. Included in "Accounts and notes receivable - Other" in the consolidated balance sheets. See Note 11 for additional information on transfers of financial assets.4. The Company’s investments in debt securities, which are primarily available-for-sale, and equity securities are included in “Other investments” in the consolidated balance sheets.5. U.S. Treasury obligations, U.S. agency obligations, agency mortgage-backed securities and other municipalities’ obligations.6. See Note 18 for the classification of derivatives in the consolidated balance sheets.7. See Note 18 for information on fair value measurements of long-term debt.
43

Table of Contents
Basis of Fair Value Measurements on a Recurring Basis at Dec 31,2017
QuotedPricesinActiveMarketsforIdenticalItems(Level1)
SignificantOtherObservableInputs
(Level2)
SignificantUnobservableInputs
(Level3) TotalIn millions
Assets at fair value:
Cash equivalents and restricted cash equivalents 1 $ — $ 7,485 $ — $ 7,485
Marketable securities 2 — 956 — 956
Interests in trade accounts receivable conduits 3 — — 677 677
Equity securities 4 88 52 — 140
Debt securities: 4
Government debt 5 — 639 — 639Corporate bonds — 733 — 733
Derivatives relating to: 6 Commodities 47 100 — 147Foreign currency — 172 — 172
Total assets at fair value $ 135 $ 10,137 $ 677 $ 10,949Liabilities at fair value:
Long-term debt including debt due within one year 7 $ — $ 34,175 $ — $ 34,175
Derivatives relating to: 6 Interest rates — 4 — 4Commodities 31 261 — 292Foreign currency — 295 — 295
Total liabilities at fair value $ 31 $ 34,735 $ — $ 34,7661. Treasury bills, time deposits, and money market funds included in "Cash and cash equivalents" and money market funds included in "Other current assets" in the consolidated balance sheets
and held at amortized cost, which approximates fair value.2. Primarily time deposits with maturities of greater than three months at time of acquisition.3. Included in "Accounts and notes receivable - Other" in the consolidated balance sheets. See Note 11 for additional information on transfers of financial assets.4. The Company’s investments in debt securities, which are primarily available-for-sale, and equity securities are included in “Other investments” in the consolidated balance sheets.5. U.S. Treasury obligations, U.S. agency obligations, agency mortgage-backed securities and other municipalities’ obligations.6. See Note 18 for the classification of derivatives in the consolidated balance sheets.7. See Note 18 for information on fair value measurements of long-term debt.
The following table summarizes the changes in fair value measurements of interests held in trade receivable conduits using Level 3 inputs for the three and sixmonths ended June 30, 2018 and 2017:
Fair Value Measurements Using Level 3 Inputs for Interests Held in TradeReceivable Conduits 1
ThreeMonthsEnded SixMonthsEnded
Jun30,2018 Jun30,2017 Jun30,2018 Jun30,2017In millions
Balance at beginning of period $ 234 $ 1,663 $ 677 $ 1,237
Gain (loss) included in earnings 2 1 (2) 3 (2)Purchases 3 — 1,386 — 2,363Settlements 3 (211) (1,363) (656) (1,914)Balance at end of period $ 24 $ 1,684 $ 24 $ 1,684
1. Included in "Accounts and notes receivable - Other" in the consolidated balance sheets.2. Included in "Selling, general and administrative expenses" in the consolidated statements of income.3. Presented in accordance with ASU 2016-15. See Notes 1 and 2 for additional information. In connection with the review and implementation of ASU 2016-15, the Company also changed the
prior year value of “Purchases” and "Settlements" due to additional interpretive guidance of the required method for calculating the cash received from beneficial interests in the conduits.
Fair Value Measurements on a Nonrecurring BasisAs part of the Synergy Program, the Company has or will shut down a number of manufacturing, research and development ("R&D") and corporate facilitiesaround the world. In the first six months of 2018 , manufacturing facilities and related assets and R&D facilities associated with this plan were written downto zero. The impairment charges related to the Synergy Program, totaling $75 million , were included in "Restructuring and asset related charges (credits) - net" inthe consolidated statements of income. See Note 5 for additional information on the Company's restructuring activities.
44

Table of Contents
NOTE 20 - VARIABLE INTEREST ENTITIESA summary of Dow and DuPont's variable interest entities ("VIEs") can be found in Note 23 to the Consolidated Financial Statements included in the Company’sAnnual Report on Form 10-K for the year ended December 31, 2017. DuPont did not hold a variable interest in any joint ventures at June 30, 2018, for which it isthe primary beneficiary. In addition, the maximum exposure to loss related to the nonconsolidated VIEs for which DuPont did hold a variable interest at June 30,2018, is not considered material to the consolidated financial statements. The following discussion addresses variable interests held by Dow.
Assets and Liabilities of Consolidated VIEsThe Company's consolidated financial statements include the assets, liabilities and results of operations of VIEs for which Dow is the primary beneficiary. Theother equity holders’ interests are reflected in "Net income attributable to noncontrolling interests" in the consolidated statements of income and "Noncontrollinginterests" in the consolidated balance sheets.
The following table summarizes the carrying amounts of these entities’ assets and liabilities included in the Company’s consolidated balance sheets at June 30,2018 and December 31, 2017 :
Assets and Liabilities of Consolidated VIEsJun30,2018 Dec31,2017In millions
Cash and cash equivalents $ 116 $ 107Other current assets 129 131Net property 786 907Other noncurrent assets 47 50Total assets 1 $ 1,078 $ 1,195Current liabilities $ 325 $ 303Long-Term debt 147 249Other noncurrent obligations 35 41Total liabilities 2 $ 507 $ 593
1. All assets were restricted at June 30, 2018 and December 31, 2017 .2. All liabilities were nonrecourse at June 30, 2018 and December 31, 2017 .
In addition, Dow holds a variable interest in an entity created to monetize accounts receivable of select European entities. Dow is the primary beneficiary of thisentity as a result of holding subordinated notes while maintaining servicing responsibilities for the accounts receivable. The carrying amounts of assets andliabilities included in the Company’s consolidated balance sheets pertaining to this entity were current assets of $7 million ( zero restricted) at June 30, 2018 ( $671million , zero restricted, at December 31, 2017 ), and current liabilities of less than $1 million ( zero nonrecourse) at June 30, 2018 (less than $1 million , zerononrecourse, at December 31, 2017 ).
Amounts presented in the consolidated balance sheets and the preceding table as restricted assets or nonrecourse obligations relating to consolidated VIEs atJune 30, 2018 and December 31, 2017 , are adjusted for intercompany eliminations and parental guarantees.
Nonconsolidated VIEsThe following table summarizes the carrying amounts of assets and liabilities included in the consolidated balance sheets at June 30, 2018 and December 31, 2017 ,related to variable interests in joint ventures or entities for which Dow is not the primary beneficiary. The Company's maximum exposure to loss is the same as thecarrying amounts, unless otherwise noted below.
Carrying Amounts of Assets and Liabilities Related toNonconsolidated VIEs Jun30,
2018Dec31,2017In millions Descriptionofassetorliability
Hemlock Semiconductor L.L.C. Equity method investment 1 $ (717) $ (752)Silicon joint ventures Equity method investments 2 $ 102 $ 103AgroFresh Solutions, Inc Equity method investment 2 $ 42 $ 51
Other receivable 3 $ — $ 41. Classified as "Other noncurrent obligations" in the consolidated balance sheets. The Company's maximum exposure to loss was zero at June 30, 2018 ( zero at December 31, 2017 ).2. Classified as "Investment in nonconsolidated affiliates" in the consolidated balance sheets.3. Classified as "Accounts and notes receivable - Other" in the consolidated balance sheets.
45

Table of Contents
NOTE 21 - SEGMENTS AND GEOGRAPHIC REGIONSThe Company's measure of profit/loss for segment reporting purposes is Operating EBITDA (for the three and six months ended June 30, 2018 ) and pro formaOperating EBITDA (for the three and six months ended June 30, 2017 ) as this is the manner in which the Company's chief operating decision maker ("CODM")assesses performance and allocates resources. The Company defines Operating EBITDA as earnings (i.e., “Income from continuing operations before incometaxes") before interest, depreciation, amortization and foreign exchange gains (losses), excluding the impact of significant items. Pro forma Operating EBITDA isdefined as pro forma earnings (i.e., pro forma “Income from continuing operations before income taxes") before interest, depreciation, amortization and foreignexchange gains (losses), excluding the impact of adjusted significant items. Reconciliations of these measures are provided on the following page. The Companyalso presents pro forma net sales for the three and six months ended June 30, 2017, as it is included in management's measure of segment performance and isregularly reviewed by the CODM. Prior year data has been updated to conform with the current year presentation.
Pro forma adjustments used in the calculation of pro forma net sales and pro forma Operating EBITDA were determined in accordance with Article 11 ofRegulation S-X. Pro forma financial information is based on the historical consolidated financial statements of Dow and DuPont, adjusted to give effect to theMerger as if it had been consummated on January 1, 2016. Pro forma adjustments have been made for (1) the preliminary purchase accounting impact, (2)accounting policy alignment, (3) the elimination of the effect of events that are directly attributable to the Merger Agreement (e.g., one-time transaction costs), (4)the elimination of the impact of transactions between Dow and DuPont, and (5) the elimination of the effect of consummated divestitures required as a condition ofregulatory approval for the Merger. Events that are not expected to have a continuing impact on the combined results (e.g., inventory step-up costs) are excludedfrom the pro forma adjustments.
Segment InformationAgri-culture
Perf.Materials&Coatings
Ind.Interm.&Infrast.
Pack.&Spec.Plastics
Elect.&Imaging
Nutrition&Biosciences
Transp.&Adv.
PolymersSafety&Const. Corp. TotalIn millions
ThreemonthsendedJun30,2018 Net sales $ 5,730 $ 2,599 $ 3,885 $ 6,099 $ 1,203 $ 1,775 $ 1,468 $ 1,411 $ 75 $ 24,245Operating EBITDA 1 $ 1,685 $ 569 $ 682 $ 1,330 $ 372 $ 433 $ 446 $ 341 $ (182) $ 5,676Equity in earnings (losses) of nonconsolidated
affiliates $ 3 $ 36 $ 96 $ 108 $ 6 $ 5 $ 1 $ 8 $ (13) $ 250
ThreemonthsendedJun30,2017 Net sales $ 1,629 $ 2,273 $ 3,015 $ 5,079 $ 677 $ 277 $ 298 $ 490 $ 96 $ 13,834Pro forma net sales $ 4,595 $ 2,255 $ 3,013 $ 5,428 $ 1,221 $ 1,494 $ 1,284 $ 1,329 $ 98 $ 20,717Pro forma Operating EBITDA 2 $ 1,165 $ 540 $ 417 $ 1,163 $ 410 $ 318 $ 308 $ 262 $ (190) $ 4,393Equity in earnings (losses) of nonconsolidated
affiliates $ 2 $ 41 $ (13) $ 33 $ — $ 2 $ — $ — $ (11) $ 54
SixmonthsendedJun30,2018 Net sales $ 9,538 $ 4,903 $ 7,600 $ 12,109 $ 2,356 $ 3,495 $ 2,893 $ 2,710 $ 151 $ 45,755Operating EBITDA 1 $ 2,576 $ 1,197 $ 1,336 $ 2,631 $ 729 $ 851 $ 883 $ 695 $ (351) $ 10,547Equity in earnings (losses) of nonconsolidated
affiliates $ 2 $ 77 $ 245 $ 167 $ 13 $ 8 $ 4 $ 13 $ (22) $ 507
SixmonthsendedJun30,2017 Net sales $ 3,197 $ 4,352 $ 5,866 $ 10,104 $ 1,332 $ 534 $ 588 $ 924 $ 167 $ 27,064Pro forma net sales $ 9,644 $ 4,318 $ 5,860 $ 10,810 $ 2,385 $ 2,918 $ 2,535 $ 2,542 $ 172 $ 41,184Pro forma Operating EBITDA 2 $ 2,626 $ 1,021 $ 929 $ 2,277 $ 737 $ 635 $ 629 $ 554 $ (401) $ 9,007Equity in earnings (losses) of nonconsolidated
affiliates $ 4 $ 132 $ 60 $ 66 $ — $ 6 $ — $ — $ (18) $ 2501. A reconciliation of "Income from continuing operations, net of tax" to Operating EBITDA is provided on the following page.2. A reconciliation of "Income from continuing operations, net of tax" to pro forma Operating EBITDA is provided on the following page.
In preparation for the Intended Business Separations, effective July 1, 2018, the results of the HSC Group joint ventures will be realigned from PerformanceMaterials & Coatings to Electronics & Imaging. The information above does not reflect this realignment.
46

Table of Contents
Reconciliation of "Income from continuing operations, net of tax" to Operating EBITDA for the Three and Six MonthsEnded Jun 30, 2018
ThreeMonthsEnded
SixMonthsEnded
In millions Jun30,2018 Jun30,2018Income from continuing operations, net of tax $ 1,803 $ 2,956+ Provision for income taxes on continuing operations 565 954Income from continuing operations before income taxes $ 2,368 $ 3,910+ Depreciation and amortization 1,496 2,980- Interest income 1 51 106+ Interest expense and amortization of debt discount 360 710- Foreign exchange gains (losses), net 1, 2 (57) (155)- Significant items (1,446) (2,898)Operating EBITDA $ 5,676 $ 10,547
1. Included in "Sundry income (expense) - net."2. Excludes a $50 million pretax foreign exchange loss significant item related to adjustments to DuPont's foreign currency exchange contracts as a result of U.S. tax reform during the six
months ended June 30, 2018.
Reconciliation of "Income from continuing operations, net of tax" to Pro Forma Operating EBITDA for the Three andSix Months Ended Jun 30, 2017
ThreeMonthsEnded
SixMonthsEnded
In millions Jun30,2017 Jun30,2017Income from continuing operations, net of tax $ 1,359 $ 2,274+ Provision for income taxes on continuing operations 455 668Income from continuing operations before income taxes $ 1,814 $ 2,942+ Depreciation and amortization 739 1,517- Interest income 1 22 47+ Interest expense and amortization of debt discount 226 445- Foreign exchange gains (losses), net 1 (30) (56)+ Pro forma adjustments 1,284 3,045- Adjusted significant items 2 (322) (1,049)Pro forma Operating EBITDA $ 4,393 $ 9,007
1. Included in "Sundry income (expense) - net."2. Adjusted significant items, excluding the impact of one-time transaction costs directly attributable to the Merger and reflected in the pro forma adjustments.
The significant items for the three and six months ended June 30, 2018, represent actual results. The adjusted significant items for the three and six months endedJune 30, 2017, are presented on a pro forma basis. The following tables summarize the pretax impact of significant items and adjusted significant items by segmentthat are excluded from Operating EBITDA and pro forma Operating EBITDA above:
Significant Items by Segment for the ThreeMonths Ended Jun 30, 2018 Agri-
culture
Perf.Materials&Coatings
Ind.Interm.&Infrast.
Pack.&Spec.Plastics
Elect.&Imaging
Nutrition&Biosciences
Transp.&Adv.
PolymersSafety&Const. Corp. TotalIn millions
Net loss on divestiture and change in jointventure ownership 1 $ 24 $ (41) $ — $ — $ — $ — $ — $ — $ — $ (17)
Integration and separation costs 2 — — — — — — — — (558) (558)Inventory step-up amortization 3 (676) — — (2) — (4) — — — (682)Restructuring and asset related charges
(credits) - net 4 (37) (15) — (3) (1) — — (12) (121) (189)Total $ (689) $ (56) $ — $ (5) $ (1) $ (4) $ — $ (12) $ (679) $ (1,446)
1. Includes a gain related to Agriculture asset sales and a loss related to post-closing adjustments related to the Dow Silicones ownership restructure.2. Integration and separation costs related to the Merger, post-Merger integration and Intended Business Separation activities, and costs related to the ownership restructure of Dow Silicones.3. Includes the fair value step-up of DuPont's inventories as a result of the Merger and the acquisition of the H&N Business. See Note 3 for additional information.4. Includes Board approved restructuring plans and asset related charges, which include other asset impairments. See Note 5 for additional information.
47

Table of Contents
Adjusted Significant Items by Segment forthe Three Months Ended Jun 30, 2017
Agri-culture
Perf.Materials&Coatings
Ind.Interm.&Infrast.
Pack.&Spec.Plastics
Elect.&Imaging
Nutrition&Biosciences
Transp.&Adv.
PolymersSafety&Const. Corp. TotalIn millions
Gain on divestiture 1 $ — $ — $ — $ — $ — $ — $ — $ — $ 7 $ 7Integration and separation costs 2 — — — — — — — — (296) (296)Litigation related charges, awards and
adjustments 3 — — — 137 — — — — — 137Restructuring and asset related charges
(credits) - net 4 — 3 — — (1) — (2) (157) 9 (148)Transaction costs and productivity actions 5 — — — — — — — — (22) (22)Total $ — $ 3 $ — $ 137 $ (1) $ — $ (2) $ (157) $ (302) $ (322)
1. Includes post-closing adjustments on the split-off of Dow's chlorine value chain.2. Integration and separation costs related to the Merger and the ownership restructure of Dow Silicones.3. Includes a patent infringement matter with Nova Chemicals Corporation. See Note 13 for additional information.4. Includes Board approved restructuring plans and asset related charges, which includes other asset impairments. See Note 5 for additional information.5. Includes implementation costs associated with Dow's restructuring programs and other productivity actions.
Significant Items by Segment for the SixMonths Ended Jun 30, 2018 Agri-
culture
Perf.Materials&Coatings
Ind.Interm.&Infrast.
Pack.&Spec.Plastics
Elect.&Imaging
Nutrition&Biosciences
Transp.&Adv.
PolymersSafety&Const. Corp. TotalIn millions
Net gain on divestitures and change in jointventure ownership 1 $ 24 $ (41) $ 20 $ — $ — $ — $ — $ — $ — $ 3
Integration and separation costs 2 — — — — — — — — (1,015) (1,015)Inventory step-up amortization 3 (1,315) — — (2) — (67) — (1) — (1,385)Restructuring and asset related charges (credits)
- net 4 (95) (14) (11) (9) (2) — 1 (19) (302) (451)Income tax related item 5 — — — — — — — — (50) (50)Total $ (1,386) $ (55) $ 9 $ (11) $ (2) $ (67) $ 1 $ (20) $ (1,367) $ (2,898)
1. Includes a gain related to Dow's sale of its equity interest in MEGlobal, a gain related to Agriculture asset sales and a loss related to post-closing adjustments on the Dow Silicones ownershiprestructure.
2. Integration and separation costs related to the Merger, post-Merger integration and Intended Business Separation activities, and costs related to the ownership restructure of Dow Silicones.3. Includes the fair value step-up of DuPont's inventories as a result of the Merger and the acquisition of the H&N Business. See Note 3 for additional information.4. Includes Board approved restructuring plans and asset related charges, which include other asset impairments. See Note 5 for additional information.5. Includes a foreign exchange loss related to adjustments to DuPont's foreign currency exchange contracts as a result of U.S. tax reform.
Adjusted Significant Items by Segment forthe Six Months Ended Jun 30, 2017 Agri-
culture
Perf.Materials&Coatings
Ind.Interm.&Infrast.
Pack.&Spec.Plastics
Elect.&Imaging
Nutrition&Biosciences
Transp.&Adv.
PolymersSafety&Const. Corp. TotalIn millions
Gains on divestitures 1 $ — $ — $ — $ — $ — $ 162 $ — $ — $ 7 $ 169Integration and separation costs 2 — — — — — — — — (538) (538)Litigation related charges, awards and
adjustments 3 (469) — — 137 — — — — — (332)Restructuring and asset related charges (credits)
- net 4 — 3 — — (3) (6) (4) (265) (25) (300)Transaction costs and productivity actions 5 — — — — — — — — (48) (48)Total $ (469) $ 3 $ — $ 137 $ (3) $ 156 $ (4) $ (265) $ (604) $ (1,049)
1. Includes the sale of DuPont's global food safety diagnostic business and post-closing adjustments on the split-off of Dow's chlorine value chain.2. Integration and separation costs related to the Merger and the ownership restructure of Dow Silicones.3. Includes an arbitration matter with Bayer CropScience and a patent infringement matter with Nova Chemicals Corporation. See Note 13 for additional information.4. Includes Board approved restructuring plans and asset related charges, which includes other asset impairments. See Note 5 for additional information.5. Includes implementation costs associated with Dow's restructuring programs and other productivity actions.
48

Table of Contents
ITEM 2. MANAGEMENT'S DISCUSSION AND ANALYSIS OF FINANCIAL CONDITION AND RESULTS OF OPERATIONSOn December 11, 2015, The Dow Chemical Company ("Dow") and E. I. du Pont de Nemours and Company ("DuPont") entered into an Agreement and Plan ofMerger ("Merger Agreement"), as amended on March 31, 2017, to effect an all-stock merger of equals strategic combination resulting in a newly formedcorporation named DowDuPont Inc. ("DowDuPont" or the "Company"). On August 31, 2017, pursuant to the Merger Agreement, Dow and DuPont each mergedwith wholly owned subsidiaries of DowDuPont ("Mergers") and, as a result of the Mergers, Dow and DuPont became subsidiaries of DowDuPont (collectively, the"Merger"). Prior to the Merger, DowDuPont did not conduct any business activities other than those required for its formation and matters contemplated by theMerger Agreement. Dow was determined to be the accounting acquirer in the Merger. As a result, the historical financial statements of Dow for the periods prior tothe Merger are considered to be the historical financial statements of DowDuPont. The results of DuPont are included in DowDuPont's consolidated results fromthe Merger date forward.
DowDuPont intends to pursue, subject to the receipt of approval by the Board of Directors ("Board") of DowDuPont and customary closing conditions, theseparation of the combined Company's agriculture, materials science and specialty products businesses through one or more tax-efficient transactions ("IntendedBusiness Separations").
Except as otherwise indicated by the context, the term "Dow" includes Dow and its consolidated subsidiaries, "DuPont" includes DuPont and its consolidatedsubsidiaries, "Union Carbide" means Union Carbide Corporation, a wholly owned subsidiary of Dow, and "Dow Silicones" means Dow Silicones Corporation(formerly known as Dow Corning Corporation, which changed its name effective as of February 1, 2018), a wholly owned subsidiary of Dow.
Items Affecting Comparability of Financial ResultsDue to the size of each of Dow's and DuPont's businesses prior to the Merger, in this section certain supplemental unaudited pro forma financial information isprovided that assumes the Merger had been consummated on January 1, 2016. Adjustments have been made in the unaudited pro forma financial information for(1) the preliminary purchase accounting impact, (2) accounting policy alignment, (3) the elimination of the effect of events that are directly attributable to theMerger Agreement (e.g., one-time transaction costs), (4) the elimination of the impact of transactions between Dow and DuPont, and (5) the elimination of theeffect of consummated divestitures required as a condition of regulatory approval for the Merger. Events that are not expected to have a continuing impact on thecombined results (e.g., inventory step-up costs) are excluded. These adjustments impacted the consolidated results as well as the reportable segments. Foradditional information, see the Supplemental Unaudited Pro Forma Combined Financial Information in this section.
OVERVIEWThe following is a summary of the results from continuing operations for the three months ended June 30, 2018 :
• The Company reported net sales in the second quarter of 2018 of $24.2 billion , up 75 percent from $13.8 billion in the second quarter of 2017. Portfolio &Other contributed 61 percent of the sales increase (62 percent increase from the Merger, impacting all segments except Performance Materials & Coatings andIndustrial Intermediates & Infrastructure, offset by a 1 percent decrease from other portfolio actions). The remainder of the increase was driven by broad-basedsales growth across all segments and geographic regions.
• Volume increased 7 percent compared with the second quarter of 2017, with increases in all operating segments, except Nutrition & Biosciences (flat),including a double-digit increase in Industrial Intermediates & Infrastructure (up 18 percent). Volume increased in all geographic regions, led by a double-digitincrease in Asia Pacific (up 18 percent).
• Local price was up 4 percent compared with the same period last year, driven primarily by broad-based pricing actions in response to higher feedstock and rawmaterial costs. Local price increased in Performance Materials & Coatings (up 10 percent), Industrial Intermediates & Infrastructure (up 8 percent), Nutrition& Biosciences (up 3 percent), Packaging & Specialty Plastics (up 2 percent) and Safety & Construction (up 1 percent) and declined in Electronics & Imaging(down 1 percent). Price was flat in Agriculture and Transportation & Advanced Polymers. Local price increased in all geographic regions.
• Currency had a favorable impact of 3 percent on sales, driven primarily by Europe, Middle East and Africa ("EMEA").
• Research and development ("R&D") expenses totaled $803 million in the second quarter of 2018 , up from $408 million in the second quarter of 2017. Selling,general and administrative ("SG&A") expenses were $1,933 million in the second quarter of 2018 , up from $720 million in the second quarter of 2017. R&Dand SG&A expenses increased primarily due to the Merger.
49

Table of Contents
• Restructuring and asset related charges (credits) - net was a $189 million charge in the second quarter of 2018, consisting of $114 million of severance andrelated benefit costs, $33 million of asset write-downs and write-offs and $42 million of costs associated with exit and disposal activities.
• Integration and separation costs were $558 million in the second quarter of 2018 , up from $136 million in the second quarter of 2017, primarily from post-Merger integration and Intended Business Separation activities.
• Equity in earnings of nonconsolidated affiliates was $250 million in the second quarter of 2018, up from $54 million in the second quarter of 2017, primarilydue to higher earnings from the Kuwait joint ventures and lower equity losses from Sadara Chemical Company ("Sadara").
• Sundry income (expense) - net was income of $178 million in the second quarter of 2018 , down from income of $322 million in the second quarter of 2017which included a gain related to the Nova patent infringement award.
• On April 25, 2018, DowDuPont announced that its Board declared a dividend of $0.38 per share, which was paid on June 15, 2018, to shareholders of recordon May 31, 2018.
• On June 25, 2018, DowDuPont announced that its Board declared a dividend of $0.38 per share, payable on September 14, 2018, to shareholders of record onAugust 31, 2018.
• The Company spent $1 billion on repurchases of DowDuPont common stock in the second quarter of 2018. At June 30, 2018, $1 billion of the $4 billion sharerepurchase program authorization remained available for additional purchases. Although there is no timeline to complete the share repurchase program, subjectto sufficient opportunities to be in the market, DowDuPont intends to repurchase approximately $1 billion of the Company's stock in the third quarter of 2018,thereby completing the share repurchase program.
In addition to the financial highlights above, the following event occurred subsequent to the second quarter of 2018:
• Andrew N. Liveris, former Executive Chairman of DowDuPont, retired on July 1, 2018.
Selected Financial Data ThreeMonthsEnded SixMonthsEnded
In millions, except per share amounts Jun30,2018 Jun30,2017 Jun30,2018 Jun30,2017Net sales $ 24,245 $ 13,834 $ 45,755 $ 27,064 Cost of sales ("COS") $ 17,974 $ 10,761 $ 34,289 $ 20,955Percent of net sales 74.1% 77.8% 74.9% 77.4% Research and development expenses $ 803 $ 408 $ 1,571 $ 827Percent of net sales 3.3% 2.9% 3.4% 3.1% Selling, general and administrative expenses $ 1,933 $ 720 $ 3,647 $ 1,479Percent of net sales 8.0% 5.2% 8.0% 5.5% Effective tax rate 23.9% 25.1% 24.4% 22.7% Net income available for common stockholders $ 1,768 $ 1,321 $ 2,872 $ 2,209 Earnings per common share – basic $ 0.76 $ 1.08 $ 1.24 $ 1.82Earnings per common share – diluted $ 0.76 $ 1.07 $ 1.23 $ 1.79
50

Table of Contents
RESULTS OF OPERATIONS
Summary of Sales Results ThreeMonthsEnded SixMonthsEnded
In millions Jun30,2018 Jun30,2017 Jun30,2018 Jun30,2017Net sales $ 24,245 $ 13,834 $ 45,755 $ 27,064Pro forma net sales $ 20,717 $ 41,184
As Reported Net Sales in the Current Period Compared with As Reported Net Sales in the Prior Period
Sales Variances by Segment and Geographic Region - As Reported
ThreeMonthsEndedJun30,2018 SixMonthsEndedJun30,2018
Percentage change fromprior year
LocalPrice&ProductMix Currency Volume
Portfolio&Other1 Total
LocalPrice&ProductMix Currency Volume
Portfolio&Other1 Total
Agriculture — % 2% 2% 248% 252% —% 3% (3)% 198% 198%Performance Materials &
Coatings 10 3 1 — 14 10 3 (1) 1 13Industrial Intermediates &
Infrastructure 8 3 18 — 29 10 4 16 — 30Packaging & Specialty
Plastics 2 3 8 7 20 1 3 9 7 20Electronics & Imaging (1) 1 5 73 78 — 1 3 73 77Nutrition & Biosciences 3 3 — 535 541 3 4 4 543 554Transportation &
Advanced Polymers — 3 6 384 393 — 4 3 385 392Safety & Construction 1 3 3 181 188 1 3 — 189 193
Total 4 % 3% 7% 61% 75% 4% 3% 6 % 56% 69%
U.S. & Canada 3 % —% 6% 89% 98% 3% —% 3 % 69% 75%EMEA 5 7 5 38 55 4 9 5 47 65Asia Pacific 5 2 18 57 82 4 3 17 56 80Latin America 6 — 1 30 37 6 — 2 32 40
Total 4 % 3% 7% 61% 75% 4% 3% 6 % 56% 69%1. Portfolio & Other primarily reflects sales related to the Merger (impacts all segments, except Performance Materials & Coatings and Industrial Intermediates & Infrastructure). Portfolio &
Other also reflects the following divestitures: a portion of Dow AgroSciences' Brazil corn seed business ("DAS Divested Ag Business"), divested on November 30, 2017 (impactingAgriculture), global Ethylene Acrylic Acid copolymers and ionomers business ("EAA Business"), divested on September 1, 2017 (impacting Packaging & Specialty Plastics) and SKC HaasDisplay Films group of companies, divested June 30, 2017 (impacting Electronics & Imaging).
The Company reported net sales in the second quarter of 2018 of $24.2 billion , up 75 percent from $13.8 billion in the second quarter of 2017 , primarily reflectingthe Merger, demand growth and increased selling prices. Sales growth was broad-based with increases in all segments and geographic regions. Portfolio & Otherchanges contributed 61 percent of the sales increase, primarily reflecting the Merger, and impacted all segments, except Performance Materials & Coatings andIndustrial Intermediates & Infrastructure. Volume increased 7 percent with gains in all segments, except Nutrition & Biosciences, which was flat. The most notablevolume increases were in Industrial Intermediates & Infrastructure (up 18 percent), Packaging & Specialty Plastics (up 8 percent), Transportation & AdvancedPolymers (up 6 percent) and Electronics & Imaging (up 5 percent). Volume increased in all geographic regions, including a double-digit increase in Asia Pacific(up 18 percent). Local price was up 4 percent compared with the same period last year, in response to higher feedstock and raw material costs. Local priceincreased in all geographic regions and most segments, with the most notable changes in Performance Materials & Coatings (up 10 percent) and IndustrialIntermediates & Infrastructure (up 8 percent), which were partially offset by Electronics & Imaging (down 1 percent). Local price in Agriculture andTransportation & Advanced Polymers was flat. Currency was up 3 percent compared with the same period last year, driven primarily by EMEA (up 7 percent).
Net sales for the first six months of 2018 were $45.8 billion , up 69 percent from $27.1 billion in the same period last year, reflecting the Merger, higher salesvolume, increased selling prices and the favorable impact of currency. Sales growth was broad-based with increases in all segments and geographic regions.Portfolio & Other changes contributed 56 percent of the sales increase, primarily reflecting the Merger. Volume increased 6 percent compared with the same periodlast year, as increases in Industrial Intermediates & Infrastructure (up 16 percent), Packaging & Specialty Plastics (up 9 percent), Nutrition & Biosciences (up4 percent) and Electronics & Imaging and Transportation & Advanced Polymers (both up 3 percent) more than offset declines in Agriculture (down 3 percent) andPerformance Materials & Coatings (down 1 percent). Safety & Construction volume was flat.
51

Table of Contents
Volume increased in all geographic regions, including a double-digit increase in Asia Pacific (up 17 percent). Local price was up 4 percent compared with the sameperiod last year, with increases in all geographic regions, driven by pricing initiatives in response to higher feedstock and raw material costs. Local price increasedin most segments, with the most notable increases in Industrial Intermediates & Infrastructure and Performance Materials & Coatings (both up 10 percent). Localprice in Agriculture, Electronics & Imaging and Transportation & Advanced Polymers was flat. Currency was up 3 percent compared with the same period lastyear, driven primarily by EMEA (up 9 percent).
As Reported Net Sales in the Current Period Compared with Pro Forma Net Sales in the Prior Period
Sales Variances by Segment and Geographic Region - Net Sales in Current Period Compared with Pro Forma Net Sales in Prior Period
ThreeMonthsEndedJun30,2018 SixMonthsEndedJun30,2018
Percentage change fromprior year
LocalPrice&ProductMix Currency Volume
Portfolio&Other1 Total
LocalPrice&ProductMix Currency Volume
Portfolio&Other1 Total
Agriculture 4% 1 % 20% — % 25 % 2% 2 % (5)% — % (1)%Performance Materials &
Coatings 10 3 2 — 15 10 4 — — 14Industrial Intermediates &
Infrastructure 8 3 18 — 29 10 4 16 — 30Packaging & Specialty
Plastics 1 3 8 — 12 1 3 8 — 12Electronics & Imaging — 1 3 (5) (1) — 2 2 (5) (1)Nutrition & Biosciences 1 3 4 11 19 1 4 4 11 20Transportation &
Advanced Polymers 5 3 6 — 14 5 4 5 — 14Safety & Construction 1 2 3 — 6 1 3 3 — 7
Total 4% 2 % 10% 1 % 17 % 3% 3 % 4 % 1 % 11 %
U.S. & Canada 4% — % 13% — % 17 % 3% — % 1 % — % 4 %EMEA 4 7 6 1 18 4 10 4 1 19Asia Pacific 3 2 15 — 20 3 3 13 — 19Latin America 5 (1) 1 1 6 5 (1) (1) 1 4
Total 4% 2 % 10% 1 % 17 % 3% 3 % 4 % 1 % 11 %1. Pro forma net sales for Agriculture excludes sales related to the November 30, 2017, divestiture of the DAS Divested Ag Business for the period January 1, 2017 through June 30, 2017. Pro
forma net sales for Packaging & Specialty Plastics excludes sales related to the September 1, 2017, divestiture of the EAA Business for the period January 1, 2017 through June 30, 2017.Portfolio & Other includes sales for the acquisition of FMC Corporation's ("FMC") Health and Nutrition Business (the "H&N Business") acquired on November 1, 2017, impacting Nutrition& Biosciences. Portfolio & Other also reflects the following divestitures: SKC Haas Display Films group of companies (divested June 30, 2017) and the authentication business (divested onJanuary 6, 2017), both impacting Electronics & Imaging; and, the divestiture of the global food safety diagnostic business (divested February 28, 2017), impacting Nutrition & Biosciences.
The Company reported net sales in the second quarter of 2018 of $24.2 billion , up 17 percent from pro forma net sales of $20.7 billion in the second quarter of2017 , with increases across all geographic regions and segments, except Electronics & Imaging (down 1 percent). Double-digit net sales increases were reported inIndustrial Intermediates & Infrastructure (up 29 percent), Agriculture (up 25 percent), Nutrition & Biosciences (up 19 percent), Performance Materials & Coatings(up 15 percent), Transportation & Advanced Polymers (up 14 percent) and Packaging & Specialty Plastics (up 12 percent). Volume increased 10 percent comparedwith pro forma results in the same period last year, with gains in all geographic regions and segments, including double-digit increases in Agriculture (up 20percent), Industrial Intermediates & Infrastructure (up 18 percent), Asia Pacific (up 15 percent) and U.S. & Canada (up 13 percent). Local price was up 4 percentcompared with pro forma results in the same period last year with increases in all geographic regions, in response to higher feedstock and raw material costs. Localprice increased across most segments, including a double-digit increase in Performance Materials & Coatings (up 10 percent). Local price in Electronics & Imagingwas flat. Currency was up 2 percent compared with the same period last year, driven primarily by EMEA (up 7 percent).
Net sales for the first six months of 2018 were $45.8 billion , up 11 percent from pro forma net sales of $41.2 billion in the same period last year, with increasesacross most segments and all geographic regions. Double-digit net sales increases were reported in Industrial Intermediates & Infrastructure (up 30 percent),Nutrition & Biosciences (up 20 percent), Performance Materials & Coatings and Transportation & Advanced Polymers (both up 14 percent) and Packaging &Specialty Plastics (up 12 percent). These increases were partially offset by declines in Agriculture and Electronics & Imaging (both down 1 percent). Net salesincreased in EMEA and Asia Pacific (both up 19 percent) and U.S. & Canada and Latin America (both up 4 percent). Volume increased 4 percent compared withpro forma results in the same period last year, as increases in Industrial Intermediates & Infrastructure (up 16 percent), Packaging & Specialty Plastics (up 8percent), Transportation & Advanced Polymers (up 5 percent), Nutrition & Biosciences (up 4 percent), Safety & Construction (up 3 percent) and Electronics &Imaging (up 2 percent) more than offset a decline in Agriculture (down 5 percent). Performance Materials & Coatings volume was flat. Volume increased in all
52
Table of Contents
geographic regions, except for Latin America (down 1 percent), including a double-digit increase in Asia Pacific (up 13 percent). Local price was up 3 percentcompared with pro forma results in the same period last year with increases in all geographic regions, driven by pricing initiatives in response to higher feedstockand raw material costs. Local price increased across most segments, including double-digit increases in Industrial Intermediates & Infrastructure and PerformanceMaterials & Coatings (both up 10 percent). Local price in Electronics & Imaging was flat. Currency was up 3 percent compared with the same period last year,driven primarily by EMEA (up 10 percent).
Cost of SalesCOS was $18.0 billion in the second quarter of 2018, up from $10.8 billion in the second quarter of 2017. The increase was primarily due to the Merger, increasedsales volume, higher feedstock and other raw material costs, and higher planned maintenance turnaround costs, which more than offset lower commissioningexpenses related to U.S. Gulf Coast growth projects and cost synergies. COS in the second quarter of 2018 was also negatively impacted by a $682 million chargefor the fair value step-up in DuPont's inventories as result of the Merger and the acquisition of the H&N Business, related to Agriculture ($676 million), Nutrition& Biosciences ($4 million) and Packaging & Specialty Plastics ($2 million). For the first six months of 2018, COS was $34.3 billion , up from $21.0 billion in the first six months of 2017. The increase was primarily due to the Merger,higher sales volume, higher feedstock and other raw material costs, increased costs from planned maintenance turnaround activity and unplanned events, whichmore than offset lower commissioning expenses related to U.S. Gulf Coast growth projects and cost synergies. COS in the first six months of 2018 was negativelyimpacted by a $1,385 million charge for the fair value step-up in DuPont's inventories as a result of the Merger and the acquisition of the H&N Business, related toAgriculture ($1,315 million), Nutrition & Biosciences ($67 million), Packaging & Specialty Plastics ($2 million) and Safety & Construction ($1 million).
Research and Development ExpensesR&D expenses totaled $803 million in the second quarter of 2018, up from $408 million in the second quarter of 2017. For the first six months of 2018, R&Dexpenses totaled $1,571 million , up from $827 million in the first six months of 2017. R&D expenses increased primarily due to the Merger.
Selling, General and Administrative ExpensesSG&A expenses were $1,933 million in the second quarter of 2018, up from $720 million in the second quarter of 2017. For the first six months of 2018, SG&Aexpenses totaled $3,647 million , up from $1,479 million in the first six months of 2017. SG&A expenses increased primarily due to the Merger.
Amortization of IntangiblesAmortization of intangibles was $488 million in the second quarter of 2018, up from $157 million in the second quarter of 2017. In the first six months of 2018,amortization of intangibles was $962 million , up from $312 million in the same period last year. The increase in amortization is primarily due to an increase inintangible assets as a result of the Merger. See Note 10 to the Consolidated Financial Statements for additional information on intangible assets.
Restructuring and Asset Related Charges (Credits) - NetDowDuPontCostSynergyProgramIn September and November 2017, DowDuPont approved post-merger restructuring actions under the DowDuPont Cost Synergy Program (the “SynergyProgram”), adopted by the DowDuPont Board of Directors. The plan is designed to integrate and optimize the organization following the Merger and in preparationfor the Intended Business Separations. Based on all actions approved to date under the Synergy Program, the Company expects to record total pretax restructuringcharges of approximately $2 billion , comprised of approximately $845 million to $935 million of severance and related benefit costs; $400 million to $540million of asset write-downs and write-offs; and $400 million to $450 million of costs associated with exit and disposal activities. The Synergy Programincludes certain asset actions that are reflected in the preliminary fair value measurement of DuPont’s assets as of the Merger date. Current estimated total pretaxrestructuring charges could be impacted by future adjustments to the preliminary fair value of DuPont’s assets.
For the three months ended June 30, 2018, the Company recorded pretax restructuring charges of $182 million , consisting of severance and related benefit costsof $122 million , asset write-downs and write-offs of $33 million and costs associated with exit and disposal activities of $27 million . For the six months endedJune 30, 2018, the Company recorded pretax restructuring charges of $442 million , consisting of severance and related benefit costs of $294 million , asset write-downs and write-offs of $81 million and costs associated with exit and disposal activities of $67 million . The restructuring charges by segment were as follows:$95 million in Agriculture, $19 million in Safety & Construction, $11 million in Industrial Intermediates & Infrastructure, $3 million in Packaging & SpecialtyPlastics, $2 million in Electronics & Imaging, $313 million in Corporate and a benefit of
53

Table of Contents
$1 million in Transportation & Advanced Polymers. The Company expects to record additional restructuring charges in 2018 and 2019 and expects the SynergyProgram to be completed by the end of 2019.
Dow2016RestructuringPlanFor the three months ended June 30, 2018, Dow recorded pretax restructuring charges of $7 million , consisting of a favorable adjustment to the severance reserveof $8 million and a charge of $15 million for costs associated with exit and disposal activities. For the six months ended June 30, 2018, Dow recorded pretaxrestructuring charges of $6 million , consisting of a favorable adjustment to the severance reserve of $8 million (related to Corporate) and a charge of $14 million(related to Performance Materials & Coatings) for costs associated with exit and disposal activities. See Note 5 to the Consolidated Financial Statements for detailson the Company's restructuring activities.
Integration and Separation CostsIntegration and separation costs, which reflect costs related to the Merger and the ownership restructure of Dow Silicones, as well as post-Merger integration andIntended Business Separation activities, were $558 million in the second quarter of 2018, up from $136 million in the second quarter of 2017. In the first sixmonths of 2018, integration and separation costs were $1,015 million , up from $245 million in the same period last year. Integration and separation costs arerelated to the Corporate segment.
Equity in Earnings of Nonconsolidated AffiliatesThe Company's share of the earnings of nonconsolidated affiliates was $250 million in the second quarter of 2018, up from $54 million in the second quarter of2017, primarily due to higher earnings from the Kuwait joint ventures (driven by increased volume and improved monoethylene glycol prices) and lower equitylosses from Sadara.
In the first six months of 2018, the Company's share of the earnings of nonconsolidated affiliates was $507 million , up from $250 million in the first six months of2017, as lower equity losses from Sadara and higher earnings from the Kuwait joint ventures were partially offset by lower equity earnings from the HSC Group,which reflected customer settlements in the first quarter of 2017 related to long-term polysilicon sales agreements.
Sundry Income (Expense) - NetSundry income (expense) – net includes a variety of income and expense items such as foreign currency exchange gains or losses, interest income, dividends frominvestments, gains and losses on sales of investments and assets, non-operating pension and other postretirement benefit plan credits or costs, and certain litigationmatters. Sundry income (expense) – net in the second quarter of 2018 was income of $178 million , compared with income of $ 322 million in the second quarter of2017. The second quarter of 2018 included income related to non-operating pension and other postretirement benefit plans, interest income, and gains on sales ofinvestments and other assets, including a $24 million gain related to Agriculture asset sales. These gains more than offset foreign currency exchange losses and a$41 million loss for an adjustment related to the Dow Silicones ownership restructure (related to Performance Materials & Coatings). The second quarter of 2017included a $137 million gain related to the Nova patent infringement award (related to Packaging & Specialty Plastics) and gains on the sale of assets andinvestments.
In the first six months of 2018, sundry income (expense) - net was income of $ 293 million compared with expense of $122 million in the first six months of 2017.In addition to the amounts previously discussed, the first six months of 2018 included a $20 million gain for post-closing adjustments on Dow's sale of its equityinterest in MEGlobal (related to Industrial Intermediates & Infrastructure) and a $50 million foreign exchange loss related to adjustments to foreign currencyexchange contracts for the change in the U.S. tax rate (related to Corporate). The first six months of 2017 included a $469 million loss related to the DowAgroscience arbitration matter with Bayer CropScience (reflected in Agriculture). See Notes 1 , 2 , 6 , 13 and 16 to the Consolidated Financial Statements foradditional information.
Interest Expense and Amortization of Debt DiscountInterest expense and amortization of debt discount was $360 million in the second quarter of 2018, up from $226 million in the second quarter of 2017. Interestexpense and amortization of debt discount was $710 million for the first six months of 2018, up from $445 million in the same period last year. The increase wasprimarily related to debt assumed in the Merger.
Provision for Income Taxes on Continuing OperationsThe Company's effective tax rate fluctuates based on, among other factors, where income is earned, reinvestment assertions regarding foreign income and the levelof income relative to tax credits available. The Company's tax rate is also influenced by the level of equity earnings, since most of the earnings from the Company'sequity method investments are taxed at the joint venture level.
On December 22, 2017, the Tax Cuts and Jobs Act ("The Act") was enacted. The Act reduces the U.S. federal corporate income tax rate from 35 percent to 21percent, requires companies to pay a one-time transition tax on earnings of certain foreign subsidiaries
54

Table of Contents
that were previously deferred, creates new provisions related to foreign sourced earnings, eliminates the domestic manufacturing deduction and moves towards aterritorial system. The Company recorded adjustments related to The Act in the first and second quarters of 2018 which resulted in charges of $71 million and $7million, respectively, to "Provision for income taxes on continuing operations."
The effective tax rate for the second quarter of 2018 was 23.9 percent , compared with an effective tax rate of 25.1 percent for the second quarter of 2017. The taxrate in the second quarter of 2018 was favorably impacted by the reduced U.S. federal corporate tax rate. The tax rate for the second quarter of 2017 was primarilyimpacted by the geographic mix of earnings.
For the first six months of 2018, the effective tax rate was 24.4 percent , compared with 22.7 percent for the first six months of 2017. The tax rate for the first sixmonths of 2018 was unfavorably impacted by non-deductible amortization of the fair value step-up in DuPont’s inventories as a result of the Merger, along withcertain provisions in The Act related to the taxability of foreign earnings. The tax rate was favorably impacted by the reduced U.S. federal corporate tax rate andthe tax benefits related to the issuance of stock-based compensation. In addition to the favorable effective tax rate impact of the geographic mix of earnings, the taxrate for the first six months of 2017 reflected the tax benefit from the Bayer CropScience arbitration matter and the adoption of Accounting Standards Update("ASU") 2016-09, which resulted in the recognition of excess tax benefits related to equity compensation in the provision for income taxes. See Notes 7 and 13 tothe Consolidated Financial Statements for additional information.
Net Income Attributable to Noncontrolling InterestsNet income attributable to noncontrolling interests was $35 million in the second quarter of 2018, down from $38 million in the second quarter of 2017. For thefirst six months of 2018, net income attributable to noncontrolling interests was $79 million , compared with $65 million for the same period last year.
Net Income Available for DowDuPont Inc. Common StockholdersNet income available for common stockholders was $1,768 million , or $0.76 per share, in the second quarter of 2018 , compared with $1,321 million , or $1.07 pershare, in the second quarter of 2017 . Net income available for common stockholders in the first six months of 2018 was $2,872 million or $1.23 per share,compared with $2,209 million , or $1.79 per share, in the same period of 2017 . See Note 8 to the Consolidated Financial Statements for details on the Company'searnings per share calculations.
SUPPLEMENTAL UNAUDITED PRO FORMA COMBINED FINANCIAL INFORMATIONThe following supplemental unaudited pro forma combined statements of income (the "unaudited pro forma income statements") for DowDuPont are presented toillustrate the estimated effects of the Merger, assuming that the Merger had been consummated on January 1, 2016. Activity for the three and six months endedJune 30, 2017, was prepared on a pro forma basis (the “unaudited pro forma information”). The unaudited pro forma information was prepared in accordance withArticle 11 of Regulation S-X. Pro forma adjustments have been made for (1) the preliminary purchase accounting impact, (2) accounting policy alignment, (3) theelimination of the effect of events that are directly attributable to the Merger Agreement (e.g., one-time transaction costs), (4) the elimination of the impact oftransactions between Dow and DuPont, and (5) the elimination of the effect of consummated divestitures required as a condition of approval for the Merger. Eventsthat are not expected to have a continuing impact on the combined results (e.g., inventory step-up costs) are excluded from the unaudited pro forma information.The unaudited pro forma information does not reflect restructuring or integration activities or other costs following the Merger that may be incurred to achieve costor growth synergies of DowDuPont. The unaudited pro forma income statement provides shareholders with summary financial information and historical data thatis on a basis consistent with how DowDuPont reports current financial information.
The Merger was accounted for under Accounting Standards Codification ("ASC") Topic 805, "Business Combinations" ("ASC 805"), under which Dow wasdesignated as the accounting acquirer in the Merger for accounting purposes. Under ASC 805, Dow accounted for the transaction by using Dow historical financialinformation and accounting policies and adding the assets and liabilities of DuPont as of August 31, 2017 (the "Merger Date") at their respective fair values. Theassets and liabilities of DuPont were measured based on various preliminary estimates at the Merger Date using assumptions that DowDuPont believes arereasonable based on information that was currently available. The fair value estimates reflected in the unaudited pro forma information are based on those used inthe Current Report on Form 8-K/A filed with the SEC on October 26, 2017, and subsequent measurement period adjustments are not reflected. DowDuPont intendsto complete and finalize the allocation of consideration as soon as practicable within the measurement period in accordance with ASC 805, but no later than oneyear following the closing date of the Merger. Differences between these preliminary estimates and the final acquisition accounting may occur and thesedifferences could have a material impact on the accompanying unaudited pro forma income statements and DowDuPont’s future results of operations.
55
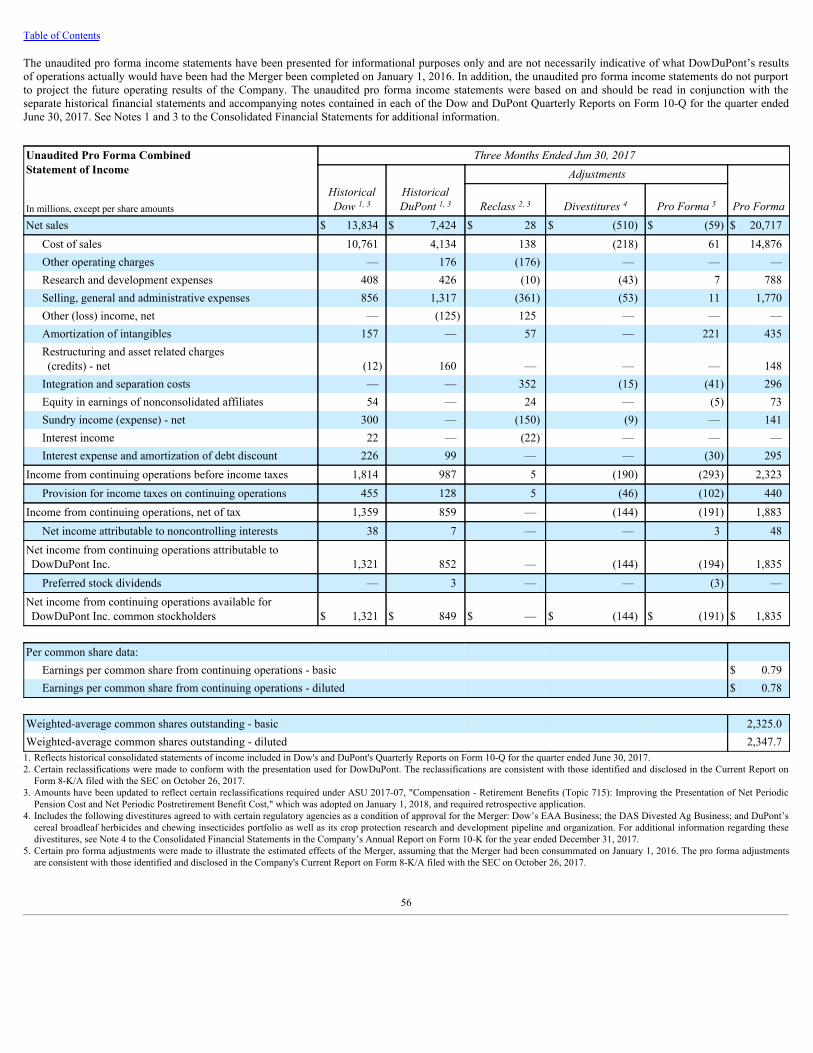
Table of Contents
The unaudited pro forma income statements have been presented for informational purposes only and are not necessarily indicative of what DowDuPont’s resultsof operations actually would have been had the Merger been completed on January 1, 2016. In addition, the unaudited pro forma income statements do not purportto project the future operating results of the Company. The unaudited pro forma income statements were based on and should be read in conjunction with theseparate historical financial statements and accompanying notes contained in each of the Dow and DuPont Quarterly Reports on Form 10-Q for the quarter endedJune 30, 2017. See Notes 1 and 3 to the Consolidated Financial Statements for additional information.
Unaudited Pro Forma CombinedStatement of Income
ThreeMonthsEndedJun30,2017 Adjustments
In millions, except per share amountsHistoricalDow1,3
HistoricalDuPont1,3 Reclass2,3 Divestitures4 ProForma5 ProForma
Net sales $ 13,834 $ 7,424 $ 28 $ (510) $ (59) $ 20,717Cost of sales 10,761 4,134 138 (218) 61 14,876Other operating charges — 176 (176) — — —Research and development expenses 408 426 (10) (43) 7 788Selling, general and administrative expenses 856 1,317 (361) (53) 11 1,770Other (loss) income, net — (125) 125 — — —Amortization of intangibles 157 — 57 — 221 435Restructuring and asset related charges(credits) - net (12) 160 — — — 148
Integration and separation costs — — 352 (15) (41) 296Equity in earnings of nonconsolidated affiliates 54 — 24 — (5) 73Sundry income (expense) - net 300 — (150) (9) — 141Interest income 22 — (22) — — —Interest expense and amortization of debt discount 226 99 — — (30) 295
Income from continuing operations before income taxes 1,814 987 5 (190) (293) 2,323Provision for income taxes on continuing operations 455 128 5 (46) (102) 440
Income from continuing operations, net of tax 1,359 859 — (144) (191) 1,883Net income attributable to noncontrolling interests 38 7 — — 3 48
Net income from continuing operations attributable toDowDuPont Inc. 1,321 852 — (144) (194) 1,835
Preferred stock dividends — 3 — — (3) —Net income from continuing operations available forDowDuPont Inc. common stockholders $ 1,321 $ 849 $ — $ (144) $ (191) $ 1,835
Per common share data:
Earnings per common share from continuing operations - basic $ 0.79Earnings per common share from continuing operations - diluted $ 0.78
Weighted-average common shares outstanding - basic 2,325.0Weighted-average common shares outstanding - diluted 2,347.7
1. Reflects historical consolidated statements of income included in Dow's and DuPont's Quarterly Reports on Form 10-Q for the quarter ended June 30, 2017.2. Certain reclassifications were made to conform with the presentation used for DowDuPont. The reclassifications are consistent with those identified and disclosed in the Current Report on
Form 8-K/A filed with the SEC on October 26, 2017.3. Amounts have been updated to reflect certain reclassifications required under ASU 2017-07, "Compensation - Retirement Benefits (Topic 715): Improving the Presentation of Net Periodic
Pension Cost and Net Periodic Postretirement Benefit Cost," which was adopted on January 1, 2018, and required retrospective application.4. Includes the following divestitures agreed to with certain regulatory agencies as a condition of approval for the Merger: Dow’s EAA Business; the DAS Divested Ag Business; and DuPont’s
cereal broadleaf herbicides and chewing insecticides portfolio as well as its crop protection research and development pipeline and organization. For additional information regarding thesedivestitures, see Note 4 to the Consolidated Financial Statements in the Company’s Annual Report on Form 10-K for the year ended December 31, 2017.
5. Certain pro forma adjustments were made to illustrate the estimated effects of the Merger, assuming that the Merger had been consummated on January 1, 2016. The pro forma adjustmentsare consistent with those identified and disclosed in the Company's Current Report on Form 8-K/A filed with the SEC on October 26, 2017.
56

Table of Contents
Unaudited Pro Forma CombinedStatement of Income
SixMonthsEndedJun30,2017 Adjustments
In millions, except per share amountsHistoricalDow1,3
HistoricalDuPont1,3 Reclass2,3 Divestitures4 ProForma5 ProForma
Net sales $ 27,064 $ 15,167 $ 73 $ (994) $ (126) $ 41,184Cost of sales 20,955 8,448 271 (417) 52 29,309Other operating charges — 380 (380) — — —Research and development expenses 827 826 (20) (78) 14 1,569Selling, general and administrative expenses 1,724 2,546 (610) (102) 22 3,580Other (loss) income, net — 77 (77) — — —Amortization of intangibles 312 — 108 — 443 863Restructuring and asset related charges(credits) - net (13) 312 — — — 299
Integration and separation costs — — 631 (15) (78) 538Equity in earnings of nonconsolidated affiliates 250 — 42 — (11) 281Sundry income (expense) - net (169) — (26) (11) — (206)Interest income 47 — (47) — — —Interest expense and amortization of debt discount 445 183 — — (60) 568
Income from continuing operations before income taxes 2,942 2,549 (35) (393) (530) 4,533Provision for income taxes on continuing operations 668 352 (35) (78) (186) 721
Income from continuing operations, net of tax 2,274 2,197 — (315) (344) 3,812Net income attributable to noncontrolling interests 65 15 — — 5 85
Net income from continuing operations attributable toDowDuPont Inc. 2,209 2,182 — (315) (349) 3,727
Preferred stock dividends — 5 — — (5) —Net income from continuing operations available forDowDuPont Inc. common stockholders $ 2,209 $ 2,177 $ — $ (315) $ (344) $ 3,727
Per common share data:
Earnings per common share from continuing operations - basic $ 1.60Earnings per common share from continuing operations - diluted $ 1.59
Weighted-average common shares outstanding - basic 2,320.4Weighted-average common shares outstanding - diluted 2,344.4
1. Reflects historical consolidated statements of income included in Dow's and DuPont's Quarterly Reports on Form 10-Q for the quarter ended June 30, 2017.2. Certain reclassifications were made to conform with the presentation used for DowDuPont. The reclassifications are consistent with those identified and disclosed in the Current Report on
Form 8-K/A filed with the SEC on October 26, 2017.3. Amounts have been updated to reflect certain reclassifications required under ASU 2017-07, "Compensation - Retirement Benefits (Topic 715): Improving the Presentation of Net Periodic
Pension Cost and Net Periodic Postretirement Benefit Cost," which was adopted on January 1, 2018, and required retrospective application.4. Includes the following divestitures agreed to with certain regulatory agencies as a condition of approval for the Merger: Dow’s EAA Business; the DAS Divested Ag Business; and DuPont’s
cereal broadleaf herbicides and chewing insecticides portfolio as well as its crop protection research and development pipeline and organization. For additional information regarding thesedivestitures, see Note 4 to the Consolidated Financial Statements in the Company’s Annual Report on Form 10-K for the year ended December 31, 2017.
5. Certain pro forma adjustments were made to illustrate the estimated effects of the Merger, assuming that the Merger had been consummated on January 1, 2016. The pro forma adjustmentsare consistent with those identified and disclosed in the Company's Current Report on Form 8-K/A filed with the SEC on October 26, 2017.
57

Table of Contents
OUTLOOKBroad-based consumer strength continues to drive economic expansion and DowDuPont's underlying business growth. Leading indicators, such as manufacturingoutput, employment, wages and consumer spending remain largely constructive, supporting increased global economic activity. The Company sees some discreteheadwinds, most notably currency fluctuations, particularly in Agriculture, and higher raw materials costs in all three divisions. Looking ahead, DowDuPontcontinues to expect above-market growth through much of the Company's business portfolio, driven by its innovations, growth investments, geographic reach andleading market positions.
ImpactFromRecentlyEnactedTariffsCertain countries where the Company’s products are manufactured, distributed or sold have recently enacted or are considering imposing new tariffs on certainproducts. The Company has analyzed the potential impact from tariffs that took effect on July 6, 2018 and does not expect such tariffs will have a material impacton its results of operations in 2018 because of the Company’s mitigation actions and its global asset base. The Company will continue to monitor the situation andtake actions, where possible, to mitigate any potential impact as events unfold.
SEGMENT RESULTSThe Company's measure of profit/loss for segment reporting purposes is Operating EBITDA (for the three and six months ended June 30, 2018 ) and pro formaOperating EBITDA (for the three and six months ended June 30, 2017 ) as this is the manner in which the Company's chief operating decision maker ("CODM")assesses performance and allocates resources. The Company defines Operating EBITDA as earnings (i.e., “Income from continuing operations before incometaxes") before interest, depreciation, amortization and foreign exchange gains (losses), excluding the impact of significant items. Pro forma Operating EBITDA isdefined as pro forma earnings (i.e., pro forma “Income from continuing operations before income taxes") before interest, depreciation, amortization and foreignexchange gains (losses), excluding the impact of adjusted significant items. Reconciliations of these measures can be found in Note 21 to the ConsolidatedFinancial Statements. The Company also presents pro forma net sales for the three and six months ended June 30, 2017 , as it is included in management’s measureof segment performance and is regularly reviewed by the CODM. Prior year data has been updated to conform with the current year presentation.
Pro forma adjustments used in the calculation of pro forma net sales and pro forma Operating EBITDA were determined in accordance with Article 11 ofRegulation S-X and were based on the historical consolidated financial statements of Dow and DuPont, adjusted to give effect to the Merger as if it had beenconsummated on January 1, 2016. For additional information on the pro forma adjustments made, see Supplemental Unaudited Pro Forma Combined FinancialInformation in the preceding section.
58

Table of Contents
AGRICULTUREThe Agriculture segment leverages the Company’s technology, customer relationships and industry knowledge to improve the quantity, quality and safety of theglobal food supply and the global production agriculture industry. Land available for worldwide agricultural production is increasingly limited so productiongrowth will need to be achieved principally through improving crop yields and productivity. The segment’s two global businesses, Seed and Crop Protection,deliver a broad portfolio of products and services that are specifically targeted to achieve gains in crop yields and productivity, including well-established brands ofseed products, crop chemicals, seed treatment, agronomy and digital services. R&D focuses on leveraging germplasm and plant science technology to increasefarmer productivity and to enhance the value of grains and oilseeds through improved seed traits, superior seed germplasm and effective use of crop protectionsolutions.
Agriculture ThreeMonthsEnded SixMonthsEnded
In millions Jun30,2018 Jun30,2017 Jun30,2018 Jun30,2017Net sales $ 5,730 $ 1,629 $ 9,538 $ 3,197Pro forma net sales $ 4,595 $ 9,644Operating EBITDA $ 1,685 $ 2,576 Pro forma Operating EBITDA $ 1,165 $ 2,626Equity earnings $ 3 $ 2 $ 2 $ 4
Agriculture ThreeMonthsEnded SixMonthsEnded
Percentage change from prior year Jun30,2018 Jun30,2018ChangeinNetSalesfromPriorPerioddueto:
Local price & product mix —% — %Currency 2 3Volume 2 (3)Portfolio & other 248 198Total 252% 198 %
ChangeinNetSalesinCurrentPeriodfromProFormaNetSalesinPriorPerioddueto: Local price & product mix 4% 2 %Currency 1 2Volume 20 (5)Portfolio & other — —Total 25% (1)%
Agriculture net sales were $5,730 million in the second quarter of 2018, up from $1,629 million in the second quarter of 2017. Net sales in the second quarter of2018 were up 25 percent from pro forma net sales of $4,595 million in the second quarter of 2017. The increase was primarily due to 20 percent in volume growth,a 4 percent increase in local price and a 1 percent benefit from currency.
Volume growth in the segment primarily reflected sales recovered from weather-related delays to the start of the planting seasons in the Northern Hemisphere,which benefited both Seed and Crop Protection, and growth in global insecticide sales driven by strong demand creation efforts for SPINOSYN™ products andnew product launches, partially offset by lower expected planted area in U.S. & Canada for corn and soybeans. The increase in local price was driven by Seed fromcontinued penetration of new corn hybrids and A-series soybeans.
Operating EBITDA was $1,685 million in the second quarter of 2018, up 45 percent from pro forma Operating EBITDA of $1,165 million in the second quarter of2017. Volume growth, higher selling prices in Seed, cost synergies, favorable currency and lower pension/OPEB costs were partially offset by lower expectedplanted area in U.S. & Canada, higher soybean royalty costs, increased R&D spend to continue advancing the pipeline and investments in digital platforms.
Agriculture net sales were $9,538 million for the first six months of 2018, up from $3,197 million in the first six months of 2017. Net sales in the first six monthsof 2018 were down 1 percent from pro forma net sales of $9,644 million in the first six months of 2017. Net sales declined as a 5 percent decrease in volume waspartially offset by a 2 percent increase in local price and a 2 percent benefit from currency.
59

Table of Contents
The decline in volume was driven by lower expected planted area in U.S. & Canada and lower sales in the Brazil safrinha season, partially offset by growth inglobal insecticide sales driven by new product launches. The increase in local price was driven by Seed from continued penetration of new corn hybrids and A-series soybeans.
Operating EBITDA was $2,576 million in the first six months of 2018, down 2 percent from pro forma Operating EBITDA of $2,626 million in the first six monthsof 2017. Cost synergies, favorable currency, lower pension/OPEB costs and sales gains in Crop Protection were more than offset by higher soybean royalty costs,the weak safrinha season in Brazil, and investments to support new product launches and digital platforms.
Updated OutlookThe Operating EBTIDA outlook for 2018 is now expected to be up slightly as compared with 2017 pro forma Operating EBITDA driven by favorable impacts onnet sales from new product introductions and pricing, as well as favorable impacts from cost synergies and lower pension/OPEB costs, partly offset by lowerexpected planted area in U.S. & Canada, a weaker safrinha season, higher royalty expense and investments in R&D and digital platforms.
PERFORMANCE MATERIALS & COATINGSThe Performance Materials & Coatings segment consists of two global businesses: Coatings & Performance Monomers and Consumer Solutions. Using silicones,acrylics and cellulosics-based technology platforms, these businesses serve the needs of the coatings, home care, personal care, appliance and industrial end-markets. The segment has broad geographic reach with R&D and manufacturing facilities located in key geographic regions. This segment also includes the resultsof the HSC Group joint ventures.
In preparation for the Intended Business Separations, effective July 1, 2018, the results of the HSC Group joint ventures will be realigned from PerformanceMaterials & Coatings to Electronics & Imaging. The information below does not reflect this realignment.
Performance Materials & Coatings ThreeMonthsEnded SixMonthsEnded
In millions Jun30,2018 Jun30,2017 Jun30,2018 Jun30,2017Net sales $ 2,599 $ 2,273 $ 4,903 $ 4,352Pro forma net sales $ 2,255 $ 4,318Operating EBITDA $ 569 $ 1,197 Pro forma Operating EBITDA $ 540 $ 1,021Equity earnings $ 36 $ 41 $ 77 $ 132
Performance Materials & Coatings ThreeMonthsEnded SixMonthsEnded
Percentage change from prior year Jun30,2018 Jun30,2018ChangeinNetSalesfromPriorPerioddueto:
Local price & product mix 10% 10 %Currency 3 3Volume 1 (1)Portfolio & other — 1Total 14% 13 %
ChangeinNetSalesinCurrentPeriodfromProFormaNetSalesinPriorPerioddueto: Local price & product mix 10% 10 %Currency 3 4Volume 2 —Portfolio & other — —Total 15% 14 %
Performance Materials & Coatings net sales were $2,599 million in the second quarter of 2018, up from net sales of $2,273 million in the second quarter of 2017.Net sales increased 15 percent compared with pro forma net sales of $2,255 million in the same quarter last year, with local price up 10 percent, a benefit fromcurrency of 3 percent, primarily in EMEA, and volume up 2 percent. Local price increased in all geographic regions and in both businesses. Local price increasedin Consumer Solutions primarily due to disciplined price/volume management in upstream silicone intermediates, as well as in performance silicone products.
60

Table of Contents
Coatings & Performance Monomers local price increased in all geographic regions in response to higher feedstock and raw material costs. Volume increased inCoatings & Performance Monomers driven by demand growth in architectural coatings. Volume increased in Consumer Solutions due to broad-based demand inAsia Pacific, while volume decreased in all other geographic regions, except U.S. & Canada, which was flat.
Operating EBITDA was $569 million in the second quarter of 2018, up 5 percent from pro forma Operating EBITDA of $540 million in the second quarter of2017, as higher selling prices more than offset increased feedstock and other raw material costs and lower gains from sales of assets and investments.
Performance Materials & Coatings net sales for the first six months of 2018 were $4,903 million , up from net sales of $4,352 million in the first six months of2017. Net sales increased 14 percent compared with pro forma net sales of $4,318 million in the first six months of 2017, with local price up 10 percent and abenefit from currency of 4 percent, primarily in EMEA, while volume was flat. Local price increased in both businesses and all geographic regions. Volumeincreased in Consumer Solutions and decreased in Coatings & Performance Monomers. Volume decreased in all geographic regions, except Asia Pacific.
Operating EBITDA was $1,197 million for the first six months of 2018, up 17 percent from pro forma Operating EBITDA of $1,021 million in the first six monthsof 2017, as higher selling prices and cost synergies more than offset increased feedstock and other raw material costs, lower gains from the sales of assets andinvestments, and lower equity earnings from the HSC Group, which reflected customer settlements in the first quarter of 2017 related to long-term polysilicon salesagreements.
Updated OutlookThe Operating EBITDA outlook for 2018 is expected to improve when compared with 2017 pro forma Operating EBITDA as anticipated declines in equityearnings from the HSC Group joint ventures, due to settlements with a customer related to long-term polysilicon sales agreements in 2017, will no longer have anunfavorable impact on the segment with the realignment from Performance Materials & Coatings to Electronics & Imaging.
61

Table of Contents
INDUSTRIAL INTERMEDIATES & INFRASTRUCTUREThe Industrial Intermediates & Infrastructure segment consists of three global businesses: Construction Chemicals, Industrial Solutions, and Polyurethanes &CAV. These customer-centric global businesses develop and market customized materials using advanced technology and unique chemistries. These businessesserve the needs of market segments as diverse as appliance, coatings, infrastructure, and oil and gas. The segment has broad geographic reach and R&D andmanufacturing facilities located in key geographic regions. This segment also includes a portion of the results of EQUATE Petrochemical Company K.S.C.C.("EQUATE"), The Kuwait Olefins Company K.S.C.C. ("TKOC"), Map Ta Phut Olefins Company Limited and Sadara, all joint ventures of the Company.
Dow is responsible for marketing a majority of Sadara products outside of the Middle East zone through Dow's established sales channels. As part of thisarrangement, Dow purchases and sells Sadara products for a marketing fee.
Industrial Intermediates & Infrastructure ThreeMonthsEnded SixMonthsEnded
In millions Jun30,2018 Jun30,2017 Jun30,2018 Jun30,2017Net sales $ 3,885 $ 3,015 $ 7,600 $ 5,866Pro forma net sales $ 3,013 $ 5,860Operating EBITDA $ 682 $ 1,336 Pro forma Operating EBITDA $ 417 $ 929Equity earnings (losses) $ 96 $ (13) $ 245 $ 60
Industrial Intermediates & Infrastructure ThreeMonthsEnded SixMonthsEnded
Percentage change from prior year Jun30,2018 Jun30,2018ChangeinNetSalesfromPriorPerioddueto:
Local price & product mix 8% 10%Currency 3 4Volume 18 16Portfolio & other — —Total 29% 30%
ChangeinNetSalesinCurrentPeriodfromProFormaNetSalesinPriorPerioddueto: Local price & product mix 8% 10%Currency 3 4Volume 18 16Portfolio & other — —Total 29% 30%
Industrial Intermediates & Infrastructure net sales were $3,885 million in the second quarter of 2018, up from net sales of $3,015 million in the second quarter of2017. Net sales increased 29 percent compared with pro forma net sales of $3,013 million in the same quarter last year, with volume up 18 percent, local price up8 percent and currency up 3 percent. Volume and local price increased in all businesses and geographic regions. Polyurethanes & CAV reported volume increasesin all geographic regions, reflecting growth in EMEA and Asia Pacific from the continued ramp up of production from Sadara and increased demand for vinylchloride monomer ("VCM") and methylene diphenyl diisocyanate ("MDI") in North America. Industrial Solutions volume increased in all geographic regionsreflecting increasing production from Sadara and increased demand in products sold in electronics processing, food and feed manufacturing, pharmaceuticalapplications and crop protection. Construction Chemicals volume increased driven by higher demand for acrylic and methyl cellulosics-based products in NorthAmerica. Local price increases were driven by higher feedstock and other raw material costs, pricing initiatives and increased demand for caustic soda and productssold in downstream systems applications. Currency had a benefit of 3 percent, primarily in EMEA.
Operating EBITDA was $682 million in the second quarter of 2018, up 64 percent compared with pro forma Operating EBITDA of $417 million in the secondquarter of 2017. Operating EBITDA increased as the impact of higher selling prices, demand growth, the benefit from currency on sales, cost synergies, higherequity earnings from the Kuwait joint ventures and lower equity losses from Sadara more than offset higher feedstock and other raw material costs and theunfavorable impact of currency on costs.
Industrial Intermediates & Infrastructure net sales for the first six months of 2018 were $7,600 million, up from net sales of $5,866 million in the first six months of2017. Net sales increased 30 percent compared with pro forma net sales of $5,860 million
62

Table of Contents
in the first six months of 2017, with volume up 16 percent, local price up 10 percent and currency up 4 percent. Volume and local price increased in all businessesand geographic regions.
Operating EBITDA was $1,336 million for the first six months of 2018, up 44 percent from pro forma Operating EBITDA of $929 million in the first six months of2017. Compared with pro forma Operating EBITDA from the same period last year, Operating EBITDA increased as the impact of higher selling prices, demandgrowth, the benefit from currency on sales, cost synergies, higher equity earnings from the Kuwait joint ventures and lower equity losses from Sadara more thanoffset higher feedstock and other raw material costs and the unfavorable impact of currency on costs.
PACKAGING & SPECIALTY PLASTICSThe Packaging & Specialty Plastics segment is a market-oriented portfolio composed of two global businesses: Hydrocarbons & Energy and Packaging andSpecialty Plastics. The segment is advantaged through its low cost position into key feedstocks and broad geographic reach, with manufacturing facilities located inall geographic regions. It also benefits from R&D expertise to deliver leading-edge technology that provides a competitive benefit to customers in food packagingand other high-growth end-use markets like transportation and consumer durables. Taken together, the businesses in this segment represent the world's leadingplastics franchise. This segment also includes the results of The Kuwait Styrene Company K.S.C.C. and The SCG-Dow Group, as well as a portion of the results ofEQUATE, TKOC, Map Ta Phut Olefins Company Limited and Sadara, all joint ventures of the Company.
Dow is responsible for marketing a majority of Sadara products outside of the Middle East zone through Dow’s established sales channels. As part of thisarrangement, Dow purchases and sells Sadara products for a marketing fee.
Packaging & Specialty Plastics ThreeMonthsEnded SixMonthsEnded
In millions Jun30,2018 Jun30,2017 Jun30,2018 Jun30,2017Net sales $ 6,099 $ 5,079 $ 12,109 $ 10,104Pro forma net sales $ 5,428 $ 10,810Operating EBITDA $ 1,330 $ 2,631 Pro forma Operating EBITDA $ 1,163 $ 2,277Equity earnings $ 108 $ 33 $ 167 $ 66
Packaging & Specialty Plastics ThreeMonthsEnded SixMonthsEnded
Percentage change from prior year Jun30,2018 Jun30,2018ChangeinNetSalesfromPriorPerioddueto:
Local price & product mix 2% 1%Currency 3 3Volume 8 9Portfolio & other 7 7Total 20% 20%
ChangeinNetSalesinCurrentPeriodfromProFormaNetSalesinPriorPerioddueto: Local price & product mix 1% 1%Currency 3 3Volume 8 8Portfolio & other — —Total 12% 12%
Packaging & Specialty Plastics net sales were $6,099 million in the second quarter of 2018, up from net sales of $5,079 million in the second quarter of 2017. Netsales increased 12 percent compared with pro forma net sales of $5,428 million in the same quarter last year, with volume up 8 percent, currency up 3 percent,primarily in EMEA, and local price up 1 percent. Volume increased in both businesses and across all geographic regions supported by new capacity additions onthe U.S. Gulf Coast and increased production at Sadara. Packaging and Specialty Plastics volume growth was driven by double-digit increases in food and specialtypackaging, industrial and consumer packaging solutions and rigid packaging applications. Volume also increased from strong demand growth in elastomersapplications. Hydrocarbons & Energy volume increased due to higher sales of ethylene and
63

Table of Contents
ethylene by-products. Local price increased in all areas, except North America, which was flat. Local price increased in Packaging and Specialty Plastics inresponse to higher feedstock and other raw material costs while price was flat in Hydrocarbons & Energy.
Operating EBITDA was $1,330 million in the second quarter of 2018, up 14 percent from pro forma Operating EBITDA of $1,163 million in the second quarter of2017. Compared with pro forma Operating EBITDA from the same quarter last year, Operating EBITDA increased as the impact of higher sales volume, thebenefit from currency on sales, increased supply from growth projects, cost synergies, higher equity earnings and lower start-up and commissioning costs morethan offset higher feedstock and other raw materials costs, the unfavorable impact of currency on costs and increased costs from planned maintenance turnarounds.
Packaging & Specialty Plastics net sales for the first six months of 2018 were $12,109 million, up from net sales of $10,104 million in the first six months of 2017.Net sales increased 12 percent compared with pro forma net sales of $10,810 million in the first six months of 2017, with volume up 8 percent, currency up 3percent, primarily in EMEA, and local price up 1 percent. Volume increased in both businesses and across all geographic regions primarily due to new capacityadditions on the U.S. Gulf Coast and increased production at Sadara. Local price increased in Packaging and Specialty Plastics in response to higher feedstock andother raw material costs which more than offset decreases in Hydrocarbons prices.
Operating EBITDA was $2,631 million for the first six months of 2018, up 16 percent from pro forma Operating EBITDA of $2,277 million in the first six monthsof 2017. Compared with pro forma Operating EBITDA from the same period last year, Operating EBITDA increased as the impact of higher sales volume, thebenefit from currency on sales, increased supply from growth projects, cost synergies, higher equity earnings and lower start-up and commissioning costs morethan offset higher feedstock and other raw materials costs, the unfavorable impact of currency on costs, increased costs from planned maintenance turnarounds andthe impact of weather-related disruptions on the U.S. Gulf Coast.
64
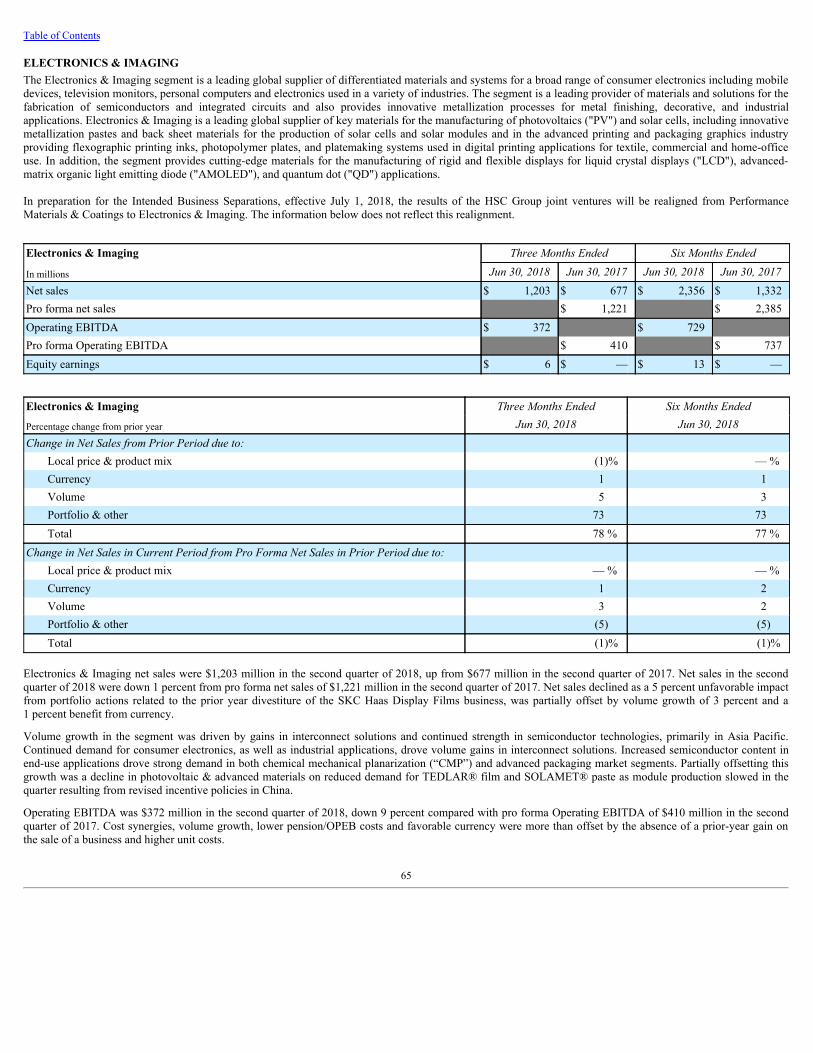
Table of Contents
ELECTRONICS & IMAGINGThe Electronics & Imaging segment is a leading global supplier of differentiated materials and systems for a broad range of consumer electronics including mobiledevices, television monitors, personal computers and electronics used in a variety of industries. The segment is a leading provider of materials and solutions for thefabrication of semiconductors and integrated circuits and also provides innovative metallization processes for metal finishing, decorative, and industrialapplications. Electronics & Imaging is a leading global supplier of key materials for the manufacturing of photovoltaics ("PV") and solar cells, including innovativemetallization pastes and back sheet materials for the production of solar cells and solar modules and in the advanced printing and packaging graphics industryproviding flexographic printing inks, photopolymer plates, and platemaking systems used in digital printing applications for textile, commercial and home-officeuse. In addition, the segment provides cutting-edge materials for the manufacturing of rigid and flexible displays for liquid crystal displays ("LCD"), advanced-matrix organic light emitting diode ("AMOLED"), and quantum dot ("QD") applications.
In preparation for the Intended Business Separations, effective July 1, 2018, the results of the HSC Group joint ventures will be realigned from PerformanceMaterials & Coatings to Electronics & Imaging. The information below does not reflect this realignment.
Electronics & Imaging ThreeMonthsEnded SixMonthsEnded
In millions Jun30,2018 Jun30,2017 Jun30,2018 Jun30,2017Net sales $ 1,203 $ 677 $ 2,356 $ 1,332Pro forma net sales $ 1,221 $ 2,385Operating EBITDA $ 372 $ 729 Pro forma Operating EBITDA $ 410 $ 737Equity earnings $ 6 $ — $ 13 $ —
Electronics & Imaging ThreeMonthsEnded SixMonthsEnded
Percentage change from prior year Jun30,2018 Jun30,2018ChangeinNetSalesfromPriorPerioddueto:
Local price & product mix (1)% — %Currency 1 1Volume 5 3Portfolio & other 73 73Total 78 % 77 %
ChangeinNetSalesinCurrentPeriodfromProFormaNetSalesinPriorPerioddueto: Local price & product mix — % — %Currency 1 2Volume 3 2Portfolio & other (5) (5)Total (1)% (1)%
Electronics & Imaging net sales were $1,203 million in the second quarter of 2018, up from $677 million in the second quarter of 2017. Net sales in the secondquarter of 2018 were down 1 percent from pro forma net sales of $1,221 million in the second quarter of 2017. Net sales declined as a 5 percent unfavorable impactfrom portfolio actions related to the prior year divestiture of the SKC Haas Display Films business, was partially offset by volume growth of 3 percent and a1 percent benefit from currency.
Volume growth in the segment was driven by gains in interconnect solutions and continued strength in semiconductor technologies, primarily in Asia Pacific.Continued demand for consumer electronics, as well as industrial applications, drove volume gains in interconnect solutions. Increased semiconductor content inend-use applications drove strong demand in both chemical mechanical planarization (“CMP”) and advanced packaging market segments. Partially offsetting thisgrowth was a decline in photovoltaic & advanced materials on reduced demand for TEDLAR® film and SOLAMET® paste as module production slowed in thequarter resulting from revised incentive policies in China.
Operating EBITDA was $372 million in the second quarter of 2018, down 9 percent compared with pro forma Operating EBITDA of $410 million in the secondquarter of 2017. Cost synergies, volume growth, lower pension/OPEB costs and favorable currency were more than offset by the absence of a prior-year gain onthe sale of a business and higher unit costs.
65

Table of Contents
Electronics & Imaging net sales were $2,356 million for the first six months of 2018, up from $1,332 million in the first six months of 2017. Net sales for the firstsix months of 2018 were down 1 percent from pro forma net sales of $2,385 million in the first six months of 2017. Net sales declined as a 5 percent unfavorableimpact from portfolio actions related to prior year divestitures of the SKC Haas Display Films and Authentications businesses, was partially offset by volumegrowth of 2 percent and a 2 percent benefit from currency. Volume growth in the segment was driven by gains in semiconductor technologies and interconnectsolutions, primarily in Asia Pacific, partially offset by a decline in photovoltaic & advanced materials.
Operating EBITDA was $729 million for the first six months of 2018, down 1 percent from pro forma Operating EBITDA of $737 million for the first six monthsof 2017. Cost synergies, lower pension/OPEB costs, volume growth and favorable currency, were more than offset by the absence of a prior-year gain on the saleof a business and higher unit costs.
Updated OutlookThe Operating EBITDA outlook for 2018 is now expected to be slightly down when compared with 2017 pro forma Operating EBITDA as anticipated declines inequity earnings from the HSC Group joint ventures will have an unfavorable impact on the segment with the realignment from Performance Materials & Coatingsto Electronics & Imaging. Prior year HSC Group equity earnings included favorable settlements with a customer related to long-term polysilicon sales agreements.
NUTRITION & BIOSCIENCESThe Nutrition & Biosciences segment is an innovation-driven and customer-focused segment that provides solutions for the global food and beverage, pharma,personal care, energy and animal nutrition markets. The segment consists of two operating segments: Nutrition & Health and Industrial Biosciences. The Nutrition& Health business is one of the world's largest producers of specialty food ingredients, developing and manufacturing solutions for the global food and beveragemarket. The Nutrition & Health business is also one of the world's largest producers of cellulosic- and alginates-based pharma excipients. The IndustrialBiosciences business is an industry pioneer and innovator that works with customers to improve the performance, productivity and sustainability of their productsand processes through biotechnology and engineering solutions including enzymes, biomaterials, biocides and antimicrobial solutions and process technology.
Nutrition & Biosciences ThreeMonthsEnded SixMonthsEnded
In millions Jun30,2018 Jun30,2017 Jun30,2018 Jun30,2017Net sales $ 1,775 $ 277 $ 3,495 $ 534Pro forma net sales $ 1,494 $ 2,918Operating EBITDA $ 433 $ 851 Pro forma Operating EBITDA $ 318 $ 635Equity earnings $ 5 $ 2 $ 8 $ 6
Nutrition & Biosciences ThreeMonthsEnded SixMonthsEnded
Percentage change from prior year Jun30,2018 Jun30,2018ChangeinNetSalesfromPriorPerioddueto:
Local price & product mix 3% 3%Currency 3 4Volume — 4Portfolio & other 535 543Total 541% 554%
ChangeinNetSalesinCurrentPeriodfromProFormaNetSalesinPriorPerioddueto: Local price & product mix 1% 1%Currency 3 4Volume 4 4Portfolio & other 11 11Total 19% 20%
66

Table of Contents
Nutrition & Biosciences net sales were $1,775 million in the second quarter of 2018, up from $277 million in the second quarter of 2017. Net sales in the secondquarter of 2018 were up 19 percent from pro forma net sales of $1,494 million in the second quarter of 2017. The increase was primarily due to an 11 percent netbenefit from portfolio actions due to the acquisition of FMC’s Health & Nutrition business, 4 percent in volume growth, a 3 percent benefit from currency and a 1percent increase in local price.
Volume growth in the segment was led by Nutrition & Health on improved demand for specialty proteins and continued gains in probiotics and pharmaceuticalexcipients, primarily in Asia Pacific and U.S. & Canada. Industrial Biosciences volume grew on increased demand for bioactives in animal nutrition and home andpersonal care applications, coupled with improvement in clean technologies due to alkylation offerings in Asia Pacific and EMEA and acid equipment sales.
Operating EBITDA was $433 million in the second quarter of 2018, up 36 percent compared with pro forma Operating EBITDA of $318 million in the secondquarter of 2017, driven by a portfolio benefit, cost synergies, volume growth and lower pension/OPEB costs.
Nutrition & Biosciences net sales were $3,495 million for the first six months of 2018, up from $534 million in the first six months of 2017. Net sales for the firstsix months of 2018 were up 20 percent from pro forma net sales of $2,918 million in the first six months of 2017. The increase was primarily due to an 11 percentnet benefit from portfolio actions due to the acquisition of FMC's Health & Nutrition business, 4 percent in volume growth, a 4 percent benefit from currency and a1 percent increase in local price.
Volume growth in the segment was led by Nutrition & Health on gains in probiotics, pharmaceutical excipients and specialty proteins driven by demand in AsiaPacific. Industrial Biosciences volume grew on improvement in clean technologies due to alkylation offerings in Asia Pacific and EMEA. Demand for bioactives inanimal nutrition and home and personal care applications and microbial solutions in energy markets also contributed to volume growth.
Operating EBITDA was $851 million for the first six months of 2018, up 34 percent from pro forma Operating EBITDA of $635 million in the first six months of2017, driven by favorable portfolio actions, cost synergies, volume growth and lower pension/OPEB costs, partially offset by higher costs due to growthinvestments.
67

Table of Contents
TRANSPORTATION & ADVANCED POLYMERSThe Transportation & Advanced Polymers segment provides high-performance engineering resins, adhesives, lubricants and parts to engineers and designers in thetransportation, electronics, medical, industrial and consumer end-markets to enable systems solutions for demanding applications and environments. The segmentdelivers a broad range of polymer-based high-performance materials in its product portfolio, including elastomers and thermoplastic and thermoset engineeringpolymers which are used by customers to fabricate components for mechanical, chemical and electrical systems. In addition, the segment produces innovative anddifferentiated adhesive technologies to meet customer specifications for durability, crash performance, and healthcare applications. Transportation & AdvancedPolymers also targets the performance plastics and fluid solutions markets by developing technologies that differentiate customers’ products with improvedperformance characteristics.
Transportation & Advanced Polymers ThreeMonthsEnded SixMonthsEnded
In millions Jun30,2018 Jun30,2017 Jun30,2018 Jun30,2017Net sales $ 1,468 $ 298 $ 2,893 $ 588Pro forma net sales $ 1,284 $ 2,535Operating EBITDA $ 446 $ 883 Pro forma Operating EBITDA $ 308 $ 629Equity earnings $ 1 $ — $ 4 $ —
Transportation & Advanced Polymers ThreeMonthsEnded SixMonthsEnded
Percentage change from prior year Jun30,2018 Jun30,2018ChangeinNetSalesfromPriorPerioddueto:
Local price & product mix —% —%Currency 3 4Volume 6 3Portfolio & other 384 385Total 393% 392%
ChangeinNetSalesinCurrentPeriodfromProFormaNetSalesinPriorPerioddueto: Local price & product mix 5% 5%Currency 3 4Volume 6 5Portfolio & other — —Total 14% 14%
Transportation & Advanced Polymers net sales were $1,468 million in the second quarter of 2018, up from $298 million in the second quarter of 2017. Net sales inthe second quarter of 2018 were up 14 percent from pro forma net sales of $1,284 million in the second quarter of 2017. The increase was due to 6 percent ofvolume growth, a 5 percent increase in local price and a 3 percent benefit from currency.
Transportation & Advanced Polymers net sales were $2,893 million for the first six months of 2018, up from $588 million in the first six months of 2017. Net salesin the first six months of 2018 were up 14 percent from pro forma net sales of $2,535 million in the first six months of 2017. The increase was due to 5 percent ofvolume growth, a 5 percent increase in local price and a 4 percent benefit from currency.
Volume growth in the second quarter of 2018 and for the first six months of 2018 was primarily due to performance solutions, led by growth in KALREZ® andVESPEL® high-performance parts in the electronics and aerospace markets, nylon enterprise & polyester due to growth in ZYTEL® and performance resins dueto growth in DELRIN® and HYTREL® in the automotive market. Broad-based volume growth was driven by growth in both Asia Pacific and EMEA.
The increase in local price in the second quarter of 2018 and for the first six months of 2018, primarily in nylon enterprise & polyester, was driven by tight polymersupply and higher feedstock costs.
Operating EBITDA was $446 million in the second quarter of 2018, up 45 percent compared with pro forma Operating EBITDA of $308 million in the secondquarter of 2017. Operating EBITDA was $883 million for the first six months of 2018, up 40 percent from pro forma Operating EBITDA of $629 million in thefirst six months of 2017.
68
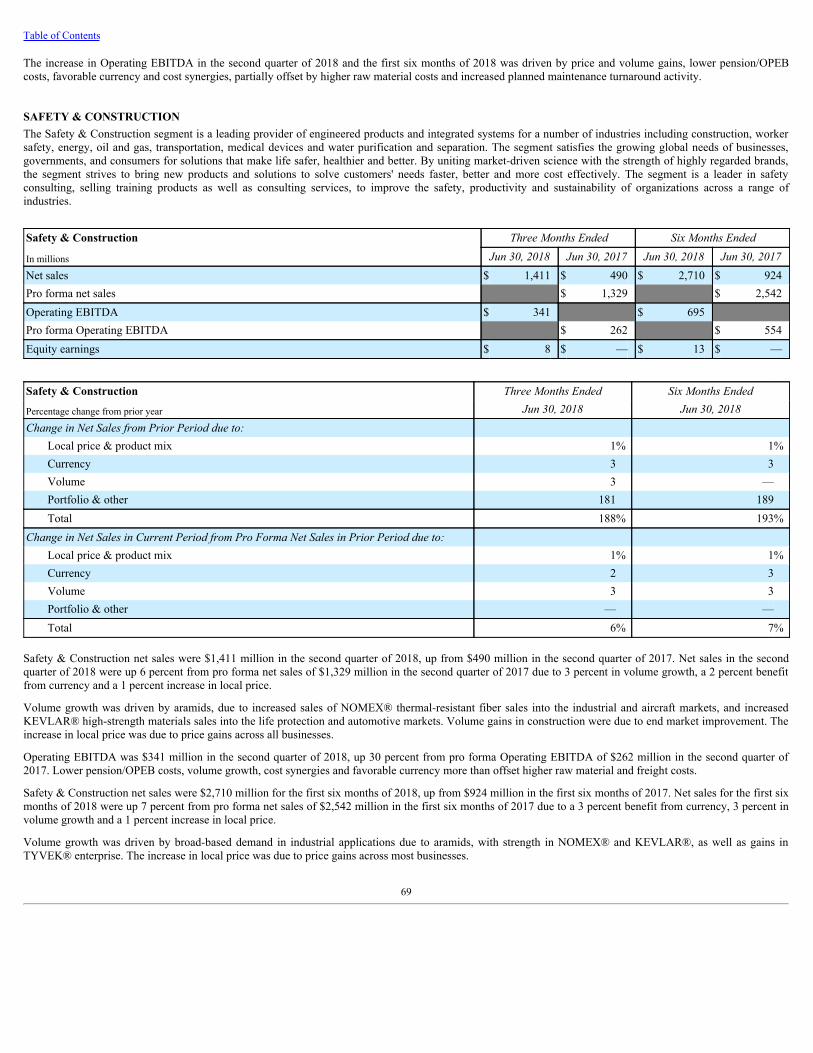
Table of Contents
The increase in Operating EBITDA in the second quarter of 2018 and the first six months of 2018 was driven by price and volume gains, lower pension/OPEBcosts, favorable currency and cost synergies, partially offset by higher raw material costs and increased planned maintenance turnaround activity.
SAFETY & CONSTRUCTIONThe Safety & Construction segment is a leading provider of engineered products and integrated systems for a number of industries including construction, workersafety, energy, oil and gas, transportation, medical devices and water purification and separation. The segment satisfies the growing global needs of businesses,governments, and consumers for solutions that make life safer, healthier and better. By uniting market-driven science with the strength of highly regarded brands,the segment strives to bring new products and solutions to solve customers' needs faster, better and more cost effectively. The segment is a leader in safetyconsulting, selling training products as well as consulting services, to improve the safety, productivity and sustainability of organizations across a range ofindustries.
Safety & Construction ThreeMonthsEnded SixMonthsEnded
In millions Jun30,2018 Jun30,2017 Jun30,2018 Jun30,2017Net sales $ 1,411 $ 490 $ 2,710 $ 924Pro forma net sales $ 1,329 $ 2,542Operating EBITDA $ 341 $ 695 Pro forma Operating EBITDA $ 262 $ 554Equity earnings $ 8 $ — $ 13 $ —
Safety & Construction ThreeMonthsEnded SixMonthsEnded
Percentage change from prior year Jun30,2018 Jun30,2018ChangeinNetSalesfromPriorPerioddueto:
Local price & product mix 1% 1%Currency 3 3Volume 3 —Portfolio & other 181 189Total 188% 193%
ChangeinNetSalesinCurrentPeriodfromProFormaNetSalesinPriorPerioddueto: Local price & product mix 1% 1%Currency 2 3Volume 3 3Portfolio & other — —Total 6% 7%
Safety & Construction net sales were $1,411 million in the second quarter of 2018, up from $490 million in the second quarter of 2017. Net sales in the secondquarter of 2018 were up 6 percent from pro forma net sales of $1,329 million in the second quarter of 2017 due to 3 percent in volume growth, a 2 percent benefitfrom currency and a 1 percent increase in local price.
Volume growth was driven by aramids, due to increased sales of NOMEX® thermal-resistant fiber sales into the industrial and aircraft markets, and increasedKEVLAR® high-strength materials sales into the life protection and automotive markets. Volume gains in construction were due to end market improvement. Theincrease in local price was due to price gains across all businesses.
Operating EBITDA was $341 million in the second quarter of 2018, up 30 percent from pro forma Operating EBITDA of $262 million in the second quarter of2017. Lower pension/OPEB costs, volume growth, cost synergies and favorable currency more than offset higher raw material and freight costs.
Safety & Construction net sales were $2,710 million for the first six months of 2018, up from $924 million in the first six months of 2017. Net sales for the first sixmonths of 2018 were up 7 percent from pro forma net sales of $2,542 million in the first six months of 2017 due to a 3 percent benefit from currency, 3 percent involume growth and a 1 percent increase in local price.
Volume growth was driven by broad-based demand in industrial applications due to aramids, with strength in NOMEX® and KEVLAR®, as well as gains inTYVEK® enterprise. The increase in local price was due to price gains across most businesses.
69

Table of Contents
Operating EBITDA was $695 million for the first six months of 2018, up 25 percent from pro forma Operating EBITDA of $554 million in the first six months of2017, due primarily to lower pension/OPEB costs, cost synergies, volume growth and favorable currency, partially offset by higher raw material and freight costs.
CORPORATECorporate includes certain enterprise and governance activities (including insurance operations, environmental operations, geographic management, etc.); businessincubation platforms; non-business aligned joint ventures; gains and losses on the sales of financial assets; non-business aligned litigation expenses; discontinuedor non-aligned businesses and pre-commercial activities.
Corporate ThreeMonthsEnded SixMonthsEnded
In millions Jun30,2018 Jun30,2017 Jun30,2018 Jun30,2017Net sales $ 75 $ 96 $ 151 $ 167Pro forma net sales $ 98 $ 172Operating EBITDA $ (182) $ (351) Pro forma Operating EBITDA $ (190) $ (401)Equity losses $ (13) $ (11) $ (22) $ (18)
Net sales for Corporate, which primarily relate to Dow's insurance operations, were $75 million in the second quarter of 2018 , compared with net sales of $96million and pro forma net sales of $98 million in the second quarter of 2017 . For the first six months of 2018 , net sales were $151 million , compared with netsales of $167 million and pro forma net sales of $172 million in the same period of 2017 .
Operating EBITDA was a loss of $182 million in the second quarter of 2018 , compared with a pro forma Operating EBITDA loss of $190 million in the secondquarter of 2017 . In the first six months of 2018 , Operating EBITDA was a loss of $351 million compared with a pro forma Operating EBITDA loss of $401million in the same period last year. Compared with pro forma Operating EBITDA in the first six months of 2017, Operating EBITDA improved primarily due tolower pre-commercial expenses, lower discontinued business costs and cost synergies.
70

Table of Contents
SUPPLEMENTAL DIVISION INFORMATIONDiscussion of segment revenue, operating EBITDA and price/volume metrics on a divisional basis for Agriculture is based on the results of the Agriculturesegment; for Materials Science is based on the combined results of the Performance Materials & Coatings segment, the Industrial Intermediates & Infrastructuresegment and the Packaging & Specialty Plastics segment; and for Specialty Products is based on the combined results of the Electronics & Imaging segment, theNutrition & Biosciences segment, the Transportation & Advanced Polymers segment and the Safety & Construction segment. The Corporate segment is notincluded in the division metrics. The segment disclosures have been presented in this manner for informational purposes only and should not be viewed as anindication of each division’s current or future operating results on a standalone basis assuming completion of the Intended Business Separations. See the sectionentitled “Segment Results” for additional qualitative analysis on segment performance.
Net Sales by Division ThreeMonthsEnded SixMonthsEnded
In millions Jun30,2018 Jun30,20171 Jun30,2018 Jun30,20171
Agriculture $ 5,730 $ 4,595 $ 9,538 $ 9,644Performance Materials & Coatings 2,599 2,255 4,903 4,318Industrial Intermediates & Infrastructure 3,885 3,013 7,600 5,860Packaging & Specialty Plastics 6,099 5,428 12,109 10,810
Materials Science $ 12,583 $ 10,696 $ 24,612 $ 20,988Electronics & Imaging 1,203 1,221 2,356 2,385Nutrition & Biosciences 1,775 1,494 3,495 2,918Transportation & Advanced Polymers 1,468 1,284 2,893 2,535Safety & Construction 1,411 1,329 2,710 2,542
Specialty Products $ 5,857 $ 5,328 $ 11,454 $ 10,380
Net Sales Varianceby Division 1
ThreeMonthsEndedJun30,2018 SixMonthsEndedJun30,2018LocalPrice&ProductMix Currency Volume
Portfolio/Other2 Total
LocalPrice&ProductMix Currency Volume
Portfolio/Other2 Total
Percent change from prioryear
Agriculture 4% 1% 20% —% 25% 2% 2% (5)% —% (1)%Materials Science 5% 3% 10% —% 18% 5% 4% 8 % —% 17 %Specialty Products 1% 3% 4% 2% 10% 2% 3% 3 % 2% 10 %
Operating EBITDA by Division ThreeMonthsEnded SixMonthsEnded
In millions Jun30,2018 Jun30,20171 Jun30,2018 Jun30,20171
Agriculture $ 1,685 $ 1,165 $ 2,576 $ 2,626Performance Materials & Coatings 569 540 1,197 1,021Industrial Intermediates & Infrastructure 682 417 1,336 929Packaging & Specialty Plastics 1,330 1,163 2,631 2,277
Materials Science $ 2,581 $ 2,120 $ 5,164 $ 4,227Electronics & Imaging 372 410 729 737Nutrition & Biosciences 433 318 851 635Transportation & Advanced Polymers 446 308 883 629Safety & Construction 341 262 695 554
Specialty Products $ 1,592 $ 1,298 $ 3,158 $ 2,5551. Information for the three and six months ended June 30, 2017, was prepared on a pro forma basis.2. Pro forma net sales for Agriculture excludes sales related to the November 30, 2017, divestiture of a portion of the DAS Divested Ag Business for the period January 1, 2017 through June 30,
2017. Pro forma net sales for Materials Science excludes sales related to the September 1, 2017, divestiture of the EAA Business for the period January 1, 2017 through June 30, 2017.Portfolio & Other includes sales for the acquisition of the H&N Business acquired on November 1, 2017, impacting Specialty Products. Portfolio & Other also reflects the followingdivestitures: SKC Haas Display Films group of companies (divested June 30, 2017), the authentication business (divested on January 6, 2017), and the divestiture of the global food safetydiagnostic business (divested February 28, 2017), all impacting Specialty Products.
71

Table of Contents
CHANGES IN FINANCIAL CONDITIONThe Company had cash and cash equivalents and marketable securities of $9,751 million at June 30, 2018 and $14,394 million at December 31, 2017, of which$7,141 million at June 30, 2018 and $12,177 million at December 31, 2017, was held by subsidiaries in foreign countries, including United States territories. Foreach of its foreign subsidiaries, the Company makes an assertion regarding the amount of earnings intended for permanent reinvestment, with the balance availableto be repatriated to the United States.
The Company is currently evaluating the impact of The Act on its permanent reinvestment assertion. The Act requires companies to pay a one-time transition taxon earnings of foreign subsidiaries, a majority of which were previously considered permanently reinvested by the Company (see Note 7 to the ConsolidatedFinancial Statements for further details of The Act). A tax liability was accrued for the estimated U.S. federal tax on all unrepatriated earnings at December 31,2017, in accordance with The Act. The cash held by foreign subsidiaries for permanent reinvestment is generally used to finance the subsidiaries' operationalactivities and future foreign investments. The Company has the ability to repatriate additional funds to the U.S., which could result in an adjustment to the taxliability for foreign withholding taxes, foreign and/or U.S. state income taxes and the impact of foreign currency movements. During 2018, the Company has andexpects to continue repatriating certain funds from its non-U.S. subsidiaries that are not needed to finance local operations or separation activities; however, theseparticular repatriation activities have not and are not expected to result in a significant incremental tax liability to the Company.
The Company’s cash flows from operating, investing and financing activities, as reflected in the consolidated statements of cash flows, are summarized in thefollowing table. The results for the six months ended June 30, 2017, represent Dow only. The results for the six months ended June 30, 2018, reflect the results ofboth Dow and DuPont.
Cash Flow Summary SixMonthsEnded
In millions Jun30,2018 Jun30,20171
Cash provided by (used for): Operating activities $ (47) $ (101)Investing activities (390) 192Financing activities (3,602) (690)Effect of exchange rate changes on cash, cash equivalents and restricted cash (171) 208
Summary Decrease in cash, cash equivalents and restricted cash $ (4,210) $ (391)Cash, cash equivalents and restricted cash at beginning of period 14,015 6,624Cash, cash equivalents and restricted cash at end of period $ 9,805 $ 6,233
1. Updated for ASU 2016-15 and ASU 2016-18. See Notes 1 and 2 to the Consolidated Financial Statements for additional information.
ReclassificationofPriorPeriodAmountsRelatedtoAccountsReceivableSecuritizationIn connection with the review and implementation of ASU 2016-15, the Company changed the prior period presentation and amount of proceeds from interests intrade accounts receivable conduits due to additional interpretive guidance related to the required method for calculating the cash received from beneficial interestsin the conduits. In the first six months of 2017, changes related to the calculation and presentation of proceeds from interests in trade accounts receivable conduitsresulted in a reclassification of $1,914 million from cash used for operating activities to cash provided by investing activities.
CashFlowsfromOperatingActivitiesIn the first six months of 2018, cash used for operating activities was $47 million , compared with cash used for operating activities of $101 million in the sameperiod last year. In the first six months of 2018, cash used for working capital requirements, pension contributions and integration and separation costs more thanoffset increased cash earnings. In the first six months of 2017, cash used for working capital requirements and pension contributions more than offset cashearnings.
Net Working CapitalJun30,2018 Dec31,2017In millions
Current assets $ 47,897 $ 49,893
Current liabilities 28,110 26,128Net working capital $ 19,787 $ 23,765Current ratio 1.70:1 1.91:1
72

Table of Contents
CashFlowsfromInvestingActivitiesIn the first six months of 2018, cash used for investing activities was $390 million , reflecting purchases of investments and capital expenditures, which werepartially offset by proceeds from sales and maturities of investments and proceeds from interests in trade accounts receivable conduits. In the first six months of2017, cash provided by investing activities was $192 million , primarily due to proceeds from interests in trade accounts receivable conduits, proceeds from salesand maturities of investments and net proceeds from sales of property and businesses, which more than offset capital expenditures, loans to Sadara and purchasesof investments.
Capital spending was $1,586 million in the first six months of 2018, compared with $1,549 million in the first six months of 2017. The Company expects full yearcapital spending in 2018 to be approximately $4.2 billion to $4.4 billion. In addition, the Company expects approximately $600 million of additional capitalspending for targeted cost synergy and business separation projects by the end of 2018.
In the first six months of 2018, Dow entered into a shareholder loan reduction agreement with Sadara and converted $140 million of the existing loan balance intoequity. Dow expects to loan between zero and $200 million to Sadara during the remainder of 2018. All or a portion of the outstanding loans to Sadara couldpotentially be converted into equity in future periods.
CashFlowsfromFinancingActivitiesIn the first six months of 2018, cash used for financing activities was $3,602 million compared with $690 million in the same period last year. The increase wasprimarily due to purchases of treasury stock, increased payments on long-term debt, increased dividends paid to stockholders and lower proceeds fromsales/issuance of common stock, which were partially offset by an increase in notes payable and issuance of long-term debt.
Free Cash FlowThe Company defines free cash flow as cash provided by operating activities less capital expenditures. Under this definition, free cash flow represents the cash thatremains available to the Company, after investing in its asset base, to fund obligations using the Company's primary source of incremental liquidity - cash flowsfrom operating activities. Free cash flow is an integral financial measure used in the Company's financial planning process. This financial measure is notrecognized in accordance with U.S. GAAP and should not be viewed as an alternative to U.S. GAAP financial measures of performance. All companies do notcalculate non-GAAP financial measures in the same manner and, accordingly, the Company's free cash flow definition may not be consistent with themethodologies used by other companies.
For additional information relating to the change in cash used for operating activities, see the discussion above under the section entitled "Cash Flows fromOperating Activities."
Reconciliation of "Cash Used for Operating Activities" to Free Cash Flow SixMonthsEnded
In millions Jun30,2018 Jun30,20171
Cash used for operating activities $ (47) $ (101)Capital expenditures (1,586) (1,549)Free Cash Flow $ (1,633) $ (1,650)
1. "Cash used for operating activities" was updated for ASU 2016-15 and ASU 2016-18. See Notes 1 and 2 to the Consolidated Financial Statements for additional information.
Liquidity & Financial FlexibilityThe Company’s primary source of incremental liquidity is cash flows from operating activities. The generation of cash from operations and each of Dow's andDuPont's (the "Subsidiaries") ability to access the commercial paper market, the long-term debt market, syndicated credit lines, bilateral credit lines and bankfinancing, including committed repurchase facilities, are expected to meet the Company’s ordinary course cash requirements for working capital, capitalexpenditures, debt maturities, dividend payments, share repurchases, contributions to pension plans and other needs. The Company’s primary liquidity sources arethrough the Subsidiaries as discussed below. Management expects that the Company and each of the Subsidiaries will continue to have sufficient liquidity andfinancial flexibility to meet respective business obligations as they come due.
73

Table of Contents
Dow's Liquidity SourcesCreditRatingsAt July 31, 2018, Dow's credit ratings were as follows:
Credit Ratings Long-TermRating Short-TermRating OutlookStandard & Poor’s BBB A-2 StableMoody’s Investors Service Baa2 P-2 StableFitch Ratings BBB F2 Rating Watch Positive
Downgrades in Dow's credit ratings would increase borrowing costs on certain indentures and could impact its ability to access credit markets.
CommercialPaper-DowDow issues promissory notes under U.S. and Euromarket commercial paper programs. At June 30, 2018 , Dow had $500 million of commercial paper outstanding ($231 million at December 31, 2017 ). Dow maintains access to the commercial paper market at competitive rates. Amounts outstanding under Dow's commercialpaper programs during the period may be greater, or less, than the amount reported at the end of the period. Subsequent to June 30, 2018 , Dow issuedapproximately $1.1 billion of commercial paper.
CommittedCreditFacilities-DowIn the event the Company has short-term liquidity needs, it can access liquidity through Dow's committed and available credit facilities. On May 27, 2018, Dowrenewed a $200 million Bilateral Revolving Credit Facility agreement, which has a maturity date in May 2020 and provides for interest at floating rates, as definedin the agreement. On July 20, 2018, Dow renewed a $200 million Bilateral Revolving Credit Facility agreement, which has a maturity date in July 2020 andprovides for interest at floating rates, as defined in the agreement.
In connection with the Dow Silicones ownership restructure, on May 31, 2016, Dow Silicones incurred $4.5 billion of indebtedness under a certain third partycredit agreement ("Dow Term Loan Facility"). Dow subsequently guaranteed the obligations of Dow Silicones under the Dow Term Loan Facility and, as a result,the covenants and events of default applicable to the Dow Term Loan Facility are substantially similar to the covenants and events of default set forth in Dow'sFive Year Competitive Advance and Revolving Credit Facility. In the second quarter of 2018, Dow Silicones exercised a 19-month extension option makingamounts borrowed under the Dow Term Loan Facility repayable on December 30, 2019, and amended the Dow Term Loan Facility to include an additional 2-yearextension option, at Dow Silicones' election, upon satisfaction of certain customary conditions precedent.
At June 30, 2018 , Dow had total committed credit facilities of $10.9 billion with remaining available credit facilities of $6.4 billion. See Note 15 to theConsolidated Financial Statements included in the Company's Annual Report on Form 10-K for the year ended December 31, 2017, for additional information oncommitted and available credit facilities.
AccountsReceivableSecuritizationFacilities-DowDow has access to committed accounts receivable securitization facilities in the United States and Europe, from which amounts available for funding are basedupon available and eligible accounts receivable within each of the facilities. Dow renewed the United States facility in June 2015, as amended in June 2018, for aterm that extends to September 2018. The Europe facility was renewed in July 2015, as amended in June 2018, for a term that extends to October 2018.
In the fourth quarter of 2017, Dow suspended further sales of trade accounts receivable through these facilities and began reducing outstanding balances throughcollections of trade accounts receivable previously sold to such conduits. Dow has the ability to resume such sales to the conduits, subject to certain prior noticerequirements, at the discretion of Dow. See Note 11 to the Consolidated Financial Statements for additional information.
74

Table of Contents
DuPont's Liquidity SourcesCreditRatingsAt July 31, 2018, DuPont's credit ratings were as follows:
Credit Ratings Long-TermRating Short-TermRating OutlookStandard & Poor’s A- A-2 StableMoody’s Investors Service A3 P-2 NegativeFitch Ratings A F1 Rating Watch Negative
Downgrades in DuPont's credit ratings would increase borrowing costs on certain indentures and could impact its ability to access debt capital markets.
CommercialPaper-DuPontDuPont issues promissory notes under U.S. commercial paper programs. At June 30, 2018 , DuPont had $737 million of commercial paper outstanding ( $1,436million at December 31, 2017 ). DuPont maintains access to the commercial paper market at competitive rates.
CommittedCreditFacilities-DuPontIn the event the Company has short-term liquidity needs, it can access liquidity through DuPont's committed and available credit facilities. At June 30, 2018 ,DuPont had total committed credit facilities of $8.8 billion with remaining available credit facilities of $6.1 billion. See Note 15 to the Consolidated FinancialStatements included in the Company's Annual Report on Form 10-K for the year ended December 31, 2017, for additional information on committed and availablecredit facilities.
TermLoanandRevolvingCreditFacilities-DuPontIn March 2016, DuPont entered into a credit agreement that provides for a three-year, senior unsecured term loan facility in the aggregate principal amount of $4.5billion (as may be amended, from time to time, the "Term Loan Facility") under which DuPont may make up to seven term loan borrowings and amounts repaid orprepaid are not available for subsequent borrowings. The proceeds from the borrowings under the Term Loan Facility will be used for DuPont's general corporatepurposes including debt repayment, working capital and funding a portion of the Company's costs and expenses. The Term Loan Facility was amended in 2018 toextend the maturity date to June 2020, at which time all outstanding borrowings, including accrued but unpaid interest, become immediately due and payable, andto extend the date on which the commitment to lend terminates to June 2019. At June 30, 2018, DuPont had made three term loan borrowings in an aggregateprincipal amount of $1.5 billion and had unused commitments of $3.0 billion under the Term Loan Facility. In addition, in 2018, DuPont amended its $3.0 billionrevolving credit facility to extend the maturity date to June 2020.
CommittedReceivableRepurchaseFacility-DuPontIn February 2018, in line with seasonal agricultural working capital requirements, DuPont entered into a committed receivable repurchase agreement of up to $1.3billion (the "2018 Repurchase Facility") which expires in December 2018. From time to time, DuPont and the banks modify the monthly commitment amounts tobetter align with working capital requirements. Under the 2018 Repurchase Facility, DuPont may sell a portfolio of available and eligible outstanding customernotes receivables within the Agriculture segment to participating institutions and simultaneously agree to repurchase at a future date. See Note 12 to theConsolidated Financial Statements for additional information.
DebtThe Company’s public debt instruments and primary, private credit agreements (collectively "Debt Instruments") reside with the Subsidiaries. See Note 12 to theConsolidated Financial Statements for information related to the Subsidiaries' notes payable and long-term debt activity since December 31, 2017, including debtretired and issued. The following table reflects the debt of the Subsidiaries:
Total DebtJun30,2018 Dec31,2017
In millions Dow DuPont Total Dow DuPont TotalNotes payable $ 862 $ 1,932 $ 2,794 $ 484 $ 1,464 $ 1,948
Long-term debt due within one year 2,837 1,769 4,606 752 1,315 2,067
Long-term debt 17,122 9,728 26,850 19,765 10,291 30,056Total debt $ 20,821 $ 13,429 $ 34,250 $ 21,001 $ 13,070 $ 34,071
75

Table of Contents
The Debt Instruments of the Subsidiaries contain, among other provisions, certain customary restrictive covenant and default provisions. Dow’s Five YearCompetitive Advance and Revolving Credit Facility contains a financial covenant that Dow must maintain its ratio of consolidated indebtedness to its consolidatedcapitalization at no greater than 0.65 to 1.00 at any time the aggregate outstanding amount of loans under the Five Year Competitive Advance and Revolving CreditFacility equals or exceeds $500 million. The ratio of Dow’s consolidated indebtedness to its consolidated capitalization was 0.42 to 1.00 at June 30, 2018 .DuPont’s Term Loan Facility and revolving credit facility contain a financial covenant requiring that the ratio of total indebtedness to total capitalization forDuPont and its consolidated subsidiaries not exceed 0.6667 to 1.00. At June 30, 2018 , management believes each of the Subsidiaries were in compliance with allof their respective covenants and default provisions. For additional information on the Subsidiaries' debt covenants and default provisions, see Note 15 to theConsolidated Financial Statements included in the Company's Annual Report on Form 10-K for the year ended December 31, 2017.
DividendsOn April 25, 2018, the Company announced that its Board declared a dividend of $0.38 per share, paid on June 15, 2018, to shareholders of record on May 31,2018. On June 25, 2018, the Company announced that its Board declared a dividend of $0.38 per share, payable on September 14, 2018, to shareholders of recordon August 31, 2018.
Share Repurchase ProgramOn November 2, 2017, the Company announced the Board authorized an initial $4 billion share repurchase program, which has no expiration date. In the first sixmonths of 2018, the Company spent $2 billion on repurchases of DowDuPont common stock under the program. At June 30, 2018, $1 billion of the $4 billion sharerepurchase program authorization remained available for additional purchases. Although there is no timeline to complete the share repurchase program, subject tosufficient opportunities to be in the market, DowDuPont intends to repurchase approximately $1 billion of the Company's stock in the third quarter of 2018, therebycompleting the share repurchase program.
For additional information related to the share repurchase program, see Part II, Item 2. Unregistered Sales of Equity Securities and Use of Proceeds.
Pension PlansDow and DuPont did not merge their pension plans and other postretirement benefit plans as a result of the Merger. Dow and DuPont have defined benefit pensionplans in the United States and a number of other countries. Dow and DuPont's funding policies are to contribute to defined benefit pension plans in the UnitedStates and a number of other countries based on pension funding laws and local currency requirements. Contributions exceeding funding requirements may andhave been made at Dow and DuPont's discretion.
DuPont is evaluating making a discretionary contribution in the third quarter of 2018 to its principal U.S. pension plan. Any such contribution could be funded byexisting cash balances and/or cash from other available sources of liquidity. The determination to make such a contribution as well as the amount of any suchcontribution, depends on a number of factors including tax-deductible limits and capital structure considerations. In 2017, DuPont made contributions of $2.9billion to its principal U.S. pension plan and expects the amount of any contribution made to this plan in 2018 to be less than half of the contributions DuPont madeto this plan in 2017.
For additional information regarding Dow and DuPont's pension plans, see Note 16 to the Consolidated Financial Statements and Note 19 to the ConsolidatedFinancial Statements in the Company's Annual Report on Form 10-K for the year ended December 31, 2017.
RestructuringDowDuPontCostSynergyProgramThe activities related to the DowDuPont Cost Synergy Program ("Synergy Program") are expected to result in additional cash expenditures of approximately $920million to $1,060 million , primarily by the end of 2019, consisting of severance and related benefit costs and costs associated with exit and disposal activities,including environmental remediation (see Note 5 to the Consolidated Financial Statements). The Synergy Program includes certain asset actions that are reflectedin the preliminary fair value measurement of DuPont’s assets as of the Merger date. Current estimated total pretax restructuring charges could be impacted byfuture adjustments to the preliminary fair value of DuPont’s assets. The Company expects to incur additional costs in the future related to its restructuringactivities. Future costs are expected to include demolition costs related to closed facilities and restructuring plan implementation costs; these costs will berecognized as incurred. The Company also expects to incur additional employee-related costs, including involuntary termination benefits, related to its otheroptimization activities. These costs cannot be reasonably estimated at this time.
76

Table of Contents
Contractual ObligationsInformation related to the Company’s contractual obligations, commercial commitments and expected cash requirements for interest can be found in theCompany's 2017 Annual Report on Form 10-K, Part II, Item 7. Management's Discussion and Analysis of Financial Condition and Results of Operations, Liquidityand Capital Resources. Additional information related to these obligations can be found in Notes 15, 16 and 19 to the Consolidated Financial Statements in theCompany’s 2017 Annual Report on Form 10-K. With the exception of the item noted below, there have been no material changes in the Company’s contractualobligations since December 31, 2017.
Contractual Obligations PaymentsDueIn
In millions 2018 2019-2020 2021-20222023andbeyond Total
Purchase obligations 1 $ 4,058 $ 6,000 $ 4,699 $ 7,551 $ 22,3081. Includes take-or-pay and throughput obligations and outstanding purchase orders and other commitments greater than $1 million, obtained through a survey conducted by the Subsidiaries.
Off-balance Sheet ArrangementsOff-balance sheet arrangements are obligations the Company has with nonconsolidated entities related to transactions, agreements or other contractualarrangements. The Company holds variable interests in joint ventures accounted for under the equity method of accounting. The Company is not the primarybeneficiary of these joint ventures and therefore is not required to consolidate the entities (see Note 20 to the Consolidated Financial Statements). In addition, seeNote 11 to the Consolidated Financial Statements for information regarding the transfer of financial assets.
Guarantees arise in the ordinary course of business from relationships with customers and nonconsolidated affiliates when the Subsidiaries undertake an obligationto guarantee the performance of others if specific triggering events occur. The Subsidiaries had combined outstanding guarantees at June 30, 2018 , of $5,759million , compared with $5,960 million at December 31, 2017 . Additional information related to the guarantees of the Subsidiaries can be found in the“Guarantees” section of Note 13 to the Consolidated Financial Statements.
Fair Value MeasurementsSee Note 19 to the Consolidated Financial Statements for additional information concerning fair value measurements.
77

Table of Contents
OTHER MATTERSRecent Accounting GuidanceSee Note 2 to the Consolidated Financial Statements for a summary of recent accounting guidance.
Critical Accounting EstimatesThe preparation of financial statements and related disclosures in conformity with accounting principles generally accepted in the United States of America (“U.S.GAAP”) requires management to make judgments, assumptions and estimates that affect the amounts reported in the consolidated financial statements andaccompanying notes. Note 1 to the Consolidated Financial Statements in the Company’s Annual Report on Form 10-K for the year ended December 31, 2017(“2017 10-K”) describes the significant accounting policies and methods used in the preparation of the consolidated financial statements. DowDuPont’s accountingpolicies that are impacted by judgments, assumptions and estimates are described in Management’s Discussion and Analysis of Financial Condition and Results ofOperations in the Company’s 2017 10-K. Since December 31, 2017, there have been no material changes in the Company’s accounting policies that are impactedby judgments, assumptions and estimates.
Asbestos-Related Matters of Union Carbide CorporationUnion Carbide is and has been involved in a large number of asbestos-related suits filed primarily in state courts during the past four decades. These suitsprincipally allege personal injury resulting from exposure to asbestos-containing products and frequently seek both actual and punitive damages. The allegedclaims primarily relate to products that Union Carbide sold in the past, alleged exposure to asbestos-containing products located on Union Carbide’s premises, andUnion Carbide’s responsibility for asbestos suits filed against a former Union Carbide subsidiary, Amchem. In many cases, plaintiffs are unable to demonstrate thatthey have suffered any compensable loss as a result of such exposure, or that injuries incurred in fact resulted from exposure to Union Carbide’s products.
The table below provides information regarding asbestos-related claims pending against Union Carbide and Amchem based on criteria developed by UnionCarbide and its external consultants.
Asbestos-Related Claim Activity 2018 2017Claims unresolved at Jan 1 15,427 16,141Claims filed 3,537 3,644Claims settled, dismissed or otherwise resolved (5,230) (3,875)Claims unresolved at Jun 30 13,734 15,910Claimants with claims against both Union Carbide and Amchem (4,928) (5,648)Individual claimants at Jun 30 8,806 10,262
Plaintiffs’ lawyers often sue numerous defendants in individual lawsuits or on behalf of numerous claimants. As a result, the damages alleged are not expresslyidentified as to Union Carbide, Amchem or any other particular defendant, even when specific damages are alleged with respect to a specific disease or injury. Infact, there are no personal injury cases in which only Union Carbide and/or Amchem are the sole named defendants. For these reasons and based upon UnionCarbide’s litigation and settlement experience, Union Carbide does not consider the damages alleged against Union Carbide and Amchem to be a meaningful factorin its determination of any potential asbestos-related liability.
For additional information, see Asbestos-Related Matters of Union Carbide Corporation in Note 13 to the Consolidated Financial Statements and Part II, Item 1.Legal Proceedings.
Valuation of Assets and Impairment ConsiderationsAs a result of the Merger and the related acquisition method of accounting, DuPont’s assets and liabilities were measured at fair value, and any declines inprojected cash flows could have a material, negative impact on the fair value of the Company’s reporting units and assets, particularly within the Agriculture andSpecialty Products divisions, and therefore could result in an impairment. During the third quarter of 2018, strategic business reviews will commence with thefocus on alignment of the businesses to the Company’s overall growth strategy which includes a focus on core business offerings and higher margin product lines.Strategic decisions resulting from these reviews will be considered and could result in changes to the factors and assumptions used to determine the fair value ofthe Company’s reporting units and indefinite-lived intangible assets from those made in the purchase accounting from the Merger and the 2017 annual impairmenttesting process. Changes to those assumptions could significantly impact the results of goodwill and indefinite-lived intangible assets impairment testing includinga potential third quarter impairment.
78

Table of Contents
ITEM 3. QUANTITATIVE AND QUALITATIVE DISCLOSURES ABOUT MARKET RISKSee Note 18 to the Consolidated Financial Statements. See also Part II, Item 7A. Quantitative and Qualitative Disclosures About Market Risk, of the Company's2017 Annual Report on Form 10-K for information on the Company's utilization of financial instruments and an analysis of the sensitivity of these instruments.
ITEM 4. CONTROLS AND PROCEDURESEvaluation of Disclosure Controls and ProceduresAs of the end of the period covered by this Quarterly Report on Form 10-Q, the Company carried out an evaluation, under the supervision and with theparticipation of the Company’s Disclosure Committee and the Company’s management, including the Chief Executive Officer and the Chief Financial Officer, ofthe effectiveness of the design and operation of the Company’s disclosure controls and procedures pursuant to paragraph (b) of Exchange Act Rules 13a-15 and15d-15. Based upon that evaluation, the Chief Executive Officer and the Chief Financial Officer concluded that the Company’s disclosure controls and procedureswere effective.
Changes in Internal Control Over Financial ReportingThere were no changes in the Company's internal control over financial reporting identified in connection with the evaluation required by paragraph (d) ofExchange Act Rules 13a-15 and 15d-15 that was conducted during the last fiscal quarter that have materially affected, or are reasonably likely to materially affect,the Company's internal control over financial reporting.
79

Table of Contents
DowDuPont Inc.PART II - OTHER INFORMATION
ITEM 1. LEGAL PROCEEDINGSThe Company and its subsidiaries are subject to various litigation matters, including, but not limited to, product liability, patent infringement, antitrust claims, andclaims for third party property damage or personal injury stemming from alleged environmental torts. Information regarding certain of these matters is set forthbelow and in Note 13 to the Consolidated Financial Statements.
LitigationAsbestos-RelatedMattersofUnionCarbideCorporation,awhollyownedsubsidiaryofDowNo material developments regarding this matter occurred in the second quarter of 2018. For a current status of this matter, see Note 13 to the ConsolidatedFinancial Statements; and Management’s Discussion and Analysis of Financial Condition and Results of Operations, Asbestos-Related Matters of Union CarbideCorporation.
PFOA:EnvironmentalandLitigationProceedingsFor purposes of this report, the term PFOA means collectively perfluorooctanoic acid and its salts, including the ammonium salt and does not distinguish betweenthe two forms. Information related to this matter is included in Note 13 to the Consolidated Financial Statements under the heading PFOA.
FayettevilleWorksFacility,Fayetteville,NorthCarolinaIn August 2017, the U.S. Attorney’s Office for the Eastern District of North Carolina served DuPont with a grand jury subpoena for testimony and the productionof documents related to alleged discharges of GenX from the Fayetteville Works facility into the Cape Fear River. DuPont has been served with additionalsubpoenas relating to the same issue and in the second quarter of 2018, received a subpoena expanding the scope to any PFCs discharged from the FayettevilleWorks facility into the Cape Fear River. Additional information related to this matter is included in Note 13 to the Consolidated Financial Statements under theheading "DuPont Matters: Fayetteville Works Facility, North Carolina."
LaPortePlant,LaPorte,Texas-CropProtection-ReleaseIncidentInvestigationsOn November 15, 2014, there was a release of methyl mercaptan at DuPont’s La Porte facility. The release occurred at the site’s Crop Protection unit resulting infour employee fatalities inside the unit. DuPont continues to cooperate with governmental agencies, including the U.S. Environmental Protection Agency ("EPA"),the Chemical Safety Board and the Department of Justice ("DOJ"), which are still conducting investigations. These investigations could result in sanctions and civilor criminal penalties against DuPont. In the second quarter of 2018, DuPont and the EPA reached a resolution-in-principle regarding certain EPA civil claims. Theresolution-in-principle, for $3.1 million, is subject to court approval and public notice.
Environmental ProceedingsThe Company believes it is remote that the following matters will have a material impact on its financial position, liquidity or results of operations. The descriptionis included per Regulation S-K, Item 103(5)(c) of the Securities Exchange Act of 1934.
Freeport,Texas;Plaquemine,Louisiana;andSt.Charles,Louisiana,Steam-AssistedFlaresMatterOn July 5, 2018, Dow received a draft consent decree from the EPA, DOJ and Louisiana Department of Environmental Quality (“DEQ”), relating to the operationof steam-assisted flares at Dow’s olefins manufacturing facilities in Freeport, Texas; Plaquemine, Louisiana; and St. Charles, Louisiana. Discussions between theEPA, the DOJ and the DEQ are ongoing.
LaPortePlant,LaPorte,Texas-EPAMultimediaInspectionThe EPA conducted a multimedia investigation at DuPont's La Porte facility in January 2008. DuPont, the EPA and the DOJ began discussions in the fall of 2011relating to the management of certain materials in the facility's waste water treatment system, hazardous waste management, flare and air emissions. Thesediscussions, which include possible resolutory actions, continue.
SabinePlant,Orange,Texas-EPAMultimediaInspectionIn June 2012, DuPont began discussions with the EPA and the DOJ related to multimedia inspections that the EPA conducted at the Sabine facility in March 2009and December 2015. The discussions involve the management of materials in the facility's waste water treatments system, hazardous waste management, flare andair emissions, including leak detection and repair. These discussions, which include possible resolutory actions, continue.
80
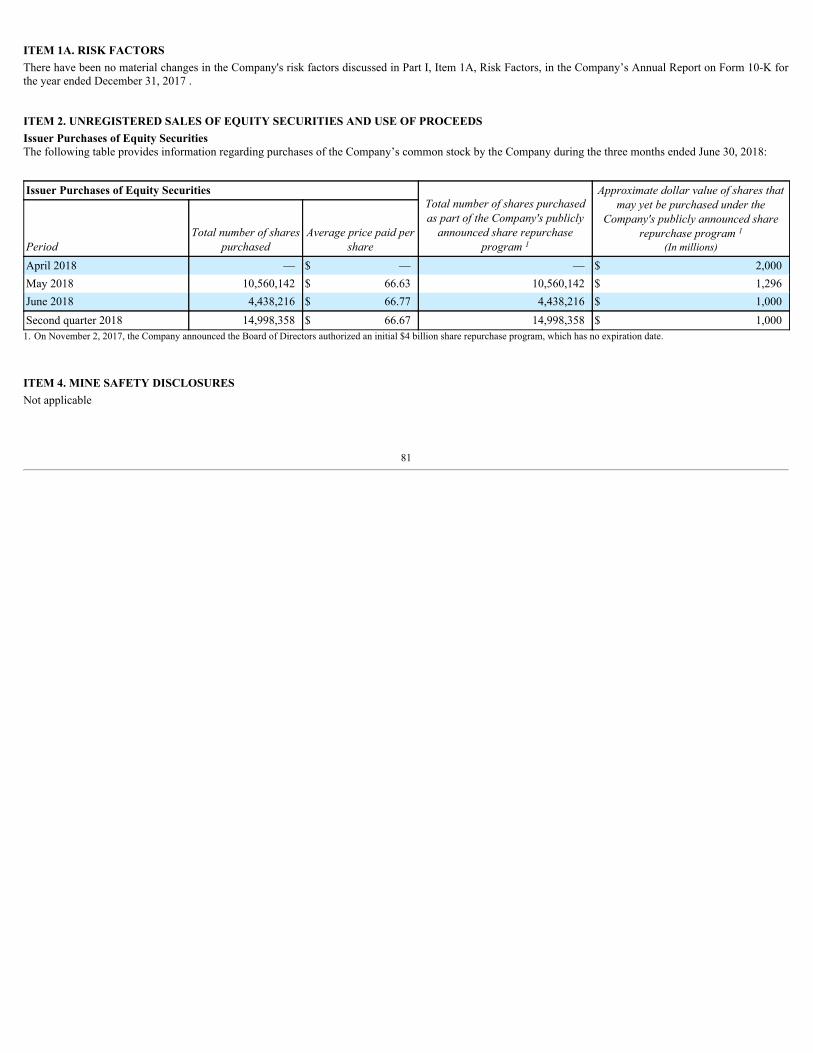
ITEM 1A. RISK FACTORSThere have been no material changes in the Company's risk factors discussed in Part I, Item 1A, Risk Factors, in the Company’s Annual Report on Form 10-K forthe year ended December 31, 2017 .
ITEM 2. UNREGISTERED SALES OF EQUITY SECURITIES AND USE OF PROCEEDSIssuer Purchases of Equity SecuritiesThe following table provides information regarding purchases of the Company’s common stock by the Company during the three months ended June 30, 2018:
Issuer Purchases of Equity Securities TotalnumberofsharespurchasedaspartoftheCompany'spubliclyannouncedsharerepurchase
program1
Approximatedollarvalueofsharesthatmayyetbepurchasedunderthe
Company'spubliclyannouncedsharerepurchaseprogram1
(Inmillions)PeriodTotalnumberofshares
purchasedAveragepricepaidper
shareApril 2018 — $ — — $ 2,000May 2018 10,560,142 $ 66.63 10,560,142 $ 1,296June 2018 4,438,216 $ 66.77 4,438,216 $ 1,000Second quarter 2018 14,998,358 $ 66.67 14,998,358 $ 1,000
1. On November 2, 2017, the Company announced the Board of Directors authorized an initial $4 billion share repurchase program, which has no expiration date.
ITEM 4. MINE SAFETY DISCLOSURESNot applicable
81

Table of Contents
ITEM 5. OTHER INFORMATIONIn the first quarter of 2018, the Company adopted new accounting standards that required retrospective application. The Company updated the ConsolidatedStatements of Income as a result of adopting Accounting Standards Update ("ASU") 2017-07, "Compensation - Retirement Benefits (Topic 715): Improving thePresentation of Net Periodic Pension Cost and Net Periodic Postretirement Benefit Cost." The Consolidated Statements of Cash Flows were updated as a result ofadopting ASU 2016-15, "Statement of Cash Flows (Topic 230): Classification of Certain Cash Receipts and Cash Payments" and ASU 2016-18, "Statement ofCash Flows (Topic 230): Restricted Cash." See Notes 1 and 2 for additional information.
Changes to the Consolidated Financial Statements as a result of the retrospective application of the new accounting standards are summarized as follows:
Summary of Changes to the Consolidated Statements of Income In millions
FortheYearsEndedDec31,2017
AsFiled2017
Updated12016
AsFiled2016
Updated12015
AsFiled2015
Updated1
Cost of sales $ 50,414 $ 49,791 $ 37,640 $ 37,668 $ 37,745 $ 37,512Research and development expenses $ 2,110 $ 2,141 $ 1,584 $ 1,593 $ 1,598 $ 1,564Selling, general and administrative expenses $ 4,021 $ 4,064 $ 2,956 $ 2,953 $ 2,948 $ 2,898Sundry income (expense) - net $ 966 $ 417 $ 1,452 $ 1,486 $ 4,716 $ 4,399
1. Reflects changes resulting from the adoption of ASU 2017-07.
Summary of Changes to the Consolidated Statements of Cash Flows In millions
FortheYearsEndedDec31,2017
AsFiled2017
Updated12016
AsFiled2016
Updated12015
AsFiled2015
Updated1
Operating Activities Accounts and notes receivable $ (2,589) $ (4,959) $ (1,539) $ (4,252) $ (84) $ (3,427)Proceeds from interests in trade accounts receivable conduits $ 2,269 $ — $ 1,257 $ — $ 1,034 $ —Other assets and liabilities, net $ 1,563 $ 1,565 $ (717) $ (723) $ (48) $ (44)
Cash provided by operating activities $ 8,695 $ 4,058 $ 5,600 $ 1,624 $ 7,607 $ 3,234Investing Activities
Payment into escrow / trust accounts $ (701) $ — $ (835) $ — $ — $ —Distribution from escrow / trust accounts $ 143 $ — $ 835 $ — $ — $ —Acquisitions of property and businesses, net of cash acquired $ 19 $ 50 $ (187) $ (187) $ (123) $ (123)Cash acquired in step acquisition of nonconsolidated affiliate $ — $ — $ 1,050 $ 1,070 $ — $ —Proceeds from interests in trade accounts receivable conduits $ — $ 4,639 $ — $ 3,970 $ — $ 4,377
Cash provided by (used for) investing activities $ 4,274 $ 9,502 $ (3,479) $ 511 $ (1,350) $ 3,027Financing Activities
Contingent payment for acquisition of businesses $ — $ (31) $ — $ — $ — $ —Other financing activities, net $ (1) $ (1) $ (2) $ (2) $ (88) $ (89)
Cash used for financing activities $ (6,523) $ (6,554) $ (4,014) $ (4,014) $ (3,132) $ (3,133)Summary
Increase (decrease) in cash, cash equivalents and restricted cash $ 6,831 $ 7,391 $ (1,970) $ (1,956) $ 2,923 $ 2,926Cash, cash equivalents and restricted cash at beginning of period $ 6,607 $ 6,624 $ 8,577 $ 8,580 $ 5,654 $ 5,654Cash, cash equivalents and restricted cash at end of period $ 13,438 $ 14,015 $ 6,607 $ 6,624 $ 8,577 $ 8,580
1. Reflects the adoption of ASU 2016-15 and ASU 2016-18. In connection with the review and implementation of ASU 2016-15, the Company also changed the value of “Proceeds frominterests in trade accounts receivable conduits” due to additional interpretive guidance of the required method for calculating the cash received from beneficial interests in the conduits.
82
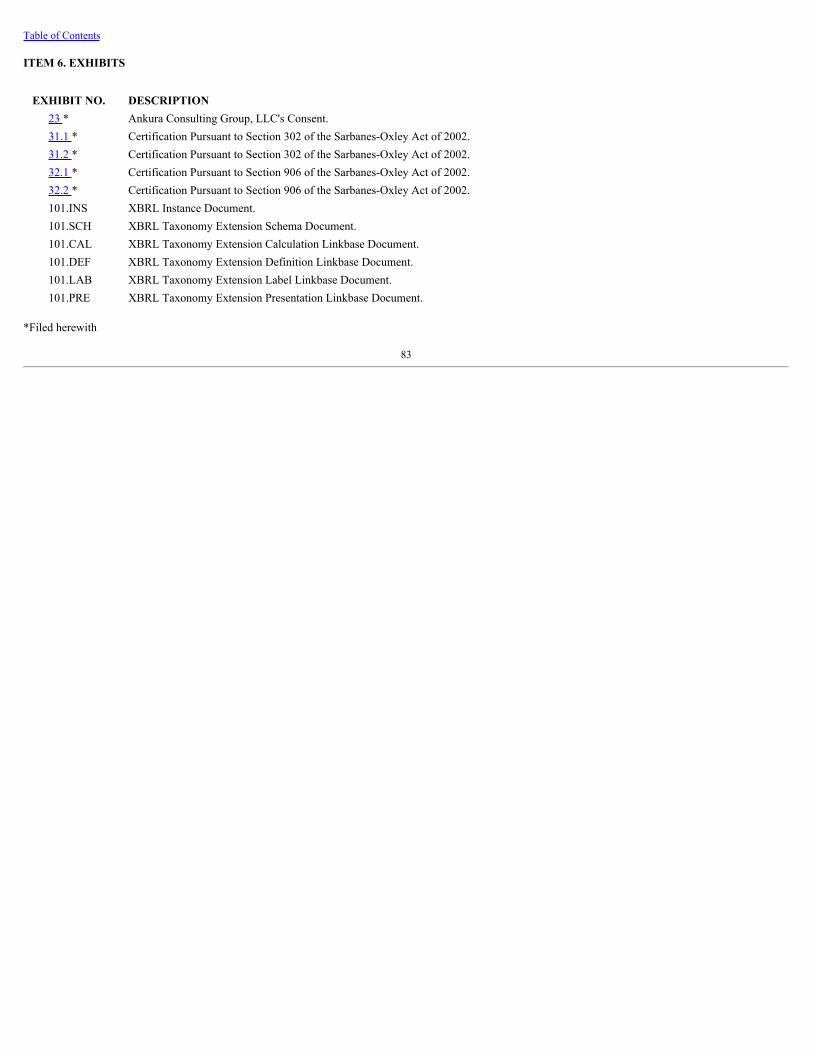
Table of Contents
ITEM 6. EXHIBITS
EXHIBIT NO. DESCRIPTION 23 * Ankura Consulting Group, LLC's Consent. 31.1 * Certification Pursuant to Section 302 of the Sarbanes-Oxley Act of 2002. 31.2 * Certification Pursuant to Section 302 of the Sarbanes-Oxley Act of 2002. 32.1 * Certification Pursuant to Section 906 of the Sarbanes-Oxley Act of 2002. 32.2 * Certification Pursuant to Section 906 of the Sarbanes-Oxley Act of 2002. 101.INS XBRL Instance Document. 101.SCH XBRL Taxonomy Extension Schema Document. 101.CAL XBRL Taxonomy Extension Calculation Linkbase Document. 101.DEF XBRL Taxonomy Extension Definition Linkbase Document. 101.LAB XBRL Taxonomy Extension Label Linkbase Document. 101.PRE XBRL Taxonomy Extension Presentation Linkbase Document.
*Filed herewith
83

Table of Contents
DowDuPont Inc.Trademark Listing
®™ CORIAN, DELRIN, HYTREL, KALREZ, KEVLAR, NOMEX, SOLAMET, SPINOSYN, TEDLAR, TYVEK, VESPEL and ZYTEL are trademarks of TheDow Chemical Company ("Dow") or E. I. du Pont de Nemours and Company ("DuPont") or affiliated companies of Dow or DuPont.
84

Table of Contents
DowDuPont Inc.Signatures
Pursuant to the requirements of the Securities Exchange Act of 1934, the registrant has duly caused this report to be signed on its behalf by the undersignedthereunto duly authorized.
DOWDUPONT INC.
Registrant
Date: August 3, 2018
By: /s/ JEANMARIE F. DESMOND By: /s/ RONALD C. EDMONDSName: Jeanmarie F. Desmond Name: Ronald C. EdmondsTitle: Co-Controller Title: Co-ControllerCity: Wilmington City: MidlandState: Delaware State: Michigan
85

Ankura Consulting Group, LLC's Consent EXHIBIT 23
DowDuPont Inc.:
Ankura Consulting Group, LLC (“Ankura”) hereby consents to the use of Ankura's name and the reference to Ankura's reports in this Quarterly Report on Form10-Q of DowDuPont Inc. for the period ended June 30, 2018 , and the incorporation by reference thereof in the following Registration Statements of DowDuPontInc.:
Form S-8: Nos. 333-220330 333-220324
/s/ B. THOMAS FLORENCEB. Thomas FlorenceSenior Managing DirectorAnkura Consulting Group, LLCAugust 3, 2018
86

DowDupont Inc. EXHIBIT 31.1
Certification Pursuant to Section 302 of the Sarbanes-Oxley Act of 2002
I, Edward D. Breen, certify that:
1. I have reviewed this quarterly report on Form 10-Q of DowDuPont Inc.;
2. Based on my knowledge, this report does not contain any untrue statement of a material fact or omit to state a material fact necessary to make the statementsmade, in light of the circumstances under which such statements were made, not misleading with respect to the period covered by this report;
3. Based on my knowledge, the financial statements, and other financial information included in this report, fairly present in all material respects the financialcondition, results of operations and cash flows of the registrant as of, and for, the periods presented in this report;
4. The registrant’s other certifying officer and I are responsible for establishing and maintaining disclosure controls and procedures (as defined in Exchange ActRules 13a-15(e) and 15d-15(e)) and internal control over financial reporting (as defined in Exchange Act Rules 13a-15(f) and 15d-15(f)) for the registrant andhave:
a) designed such disclosure controls and procedures, or caused such disclosure controls and procedures to be designed under our supervision, to ensure thatmaterial information relating to the registrant, including its consolidated subsidiaries, is made known to us by others within those entities, particularlyduring the period in which this report is being prepared;
b) designed such internal control over financial reporting, or caused such internal control over financial reporting to be designed under our supervision, toprovide reasonable assurance regarding the reliability of financial reporting and the preparation of financial statements for external purposes in accordancewith generally accepted accounting principles;
c) evaluated the effectiveness of the registrant’s disclosure controls and procedures and presented in this report our conclusions about the effectiveness of thedisclosure controls and procedures, as of the end of the period covered by this report based on such evaluation; and
d) disclosed in this report any change in the registrant’s internal control over financial reporting that occurred during the registrant’s most recent fiscalquarter (the registrant’s fourth fiscal quarter in the case of an annual report) that has materially affected, or is reasonably likely to materially affect, theregistrant’s internal control over financial reporting; and
5. The registrant’s other certifying officer and I have disclosed, based on our most recent evaluation of internal control over financial reporting, to the registrant’sauditors and the audit committee of registrant’s board of directors (or persons performing the equivalent function):
a) all significant deficiencies and material weaknesses in the design or operation of internal control over financial reporting which are reasonably likely toadversely affect the registrant’s ability to record, process, summarize and report financial information; and
b) any fraud, whether or not material, that involves management or other employees who have a significant role in the registrant’s internal control overfinancial reporting.
Date: August 3, 2018
/s/ EDWARD D. BREENEdward D. BreenChief Executive Officer
87

DowDupont Inc. EXHIBIT 31.2
Certification Pursuant to Section 302 of the Sarbanes-Oxley Act of 2002
I, Howard I. Ungerleider, certify that:
1. I have reviewed this quarterly report on Form 10-Q of DowDuPont Inc.;
2. Based on my knowledge, this report does not contain any untrue statement of a material fact or omit to state a material fact necessary to make the statementsmade, in light of the circumstances under which such statements were made, not misleading with respect to the period covered by this report;
3. Based on my knowledge, the financial statements, and other financial information included in this report, fairly present in all material respects the financialcondition, results of operations and cash flows of the registrant as of, and for, the periods presented in this report;
4. The registrant’s other certifying officer and I are responsible for establishing and maintaining disclosure controls and procedures (as defined in Exchange ActRules 13a-15(e) and 15d-15(e)) and internal control over financial reporting (as defined in Exchange Act Rules 13a-15(f) and 15d-15(f)) for the registrant andhave:
a) designed such disclosure controls and procedures, or caused such disclosure controls and procedures to be designed under our supervision, to ensure thatmaterial information relating to the registrant, including its consolidated subsidiaries, is made known to us by others within those entities, particularlyduring the period in which this report is being prepared;
b) designed such internal control over financial reporting, or caused such internal control over financial reporting to be designed under our supervision, toprovide reasonable assurance regarding the reliability of financial reporting and the preparation of financial statements for external purposes in accordancewith generally accepted accounting principles;
c) evaluated the effectiveness of the registrant’s disclosure controls and procedures and presented in this report our conclusions about the effectiveness of thedisclosure controls and procedures, as of the end of the period covered by this report based on such evaluation; and
d) disclosed in this report any change in the registrant’s internal control over financial reporting that occurred during the registrant’s most recent fiscalquarter (the registrant’s fourth fiscal quarter in the case of an annual report) that has materially affected, or is reasonably likely to materially affect, theregistrant’s internal control over financial reporting; and
5. The registrant’s other certifying officer and I have disclosed, based on our most recent evaluation of internal control over financial reporting, to the registrant’sauditors and the audit committee of registrant’s board of directors (or persons performing the equivalent function):
a) all significant deficiencies and material weaknesses in the design or operation of internal control over financial reporting which are reasonably likely toadversely affect the registrant’s ability to record, process, summarize and report financial information; and
b) any fraud, whether or not material, that involves management or other employees who have a significant role in the registrant’s internal control overfinancial reporting.
Date: August 3, 2018
/s/ HOWARD I. UNGERLEIDERHoward I. UngerleiderChief Financial Officer
88

DowDupont Inc. EXHIBIT 32.1
Certification Pursuant to Section 906 of the Sarbanes-Oxley Act of 2002
I, Edward D. Breen, Chief Executive Officer of DowDuPont Inc. (the “Company”), certify that:
1. the Quarterly Report on Form 10-Q of the Company for the quarter ended June 30, 2018 as filed with the Securities and Exchange Commission (the “Report”)fully complies with the requirements of Section 13(a) or 15(d) of the Securities Exchange Act of 1934; and
2. the information contained in the Report fairly presents, in all material respects, the financial condition and results of operations of the Company.
/s/ EDWARD D. BREENEdward D. BreenChief Executive OfficerAugust 3, 2018
89
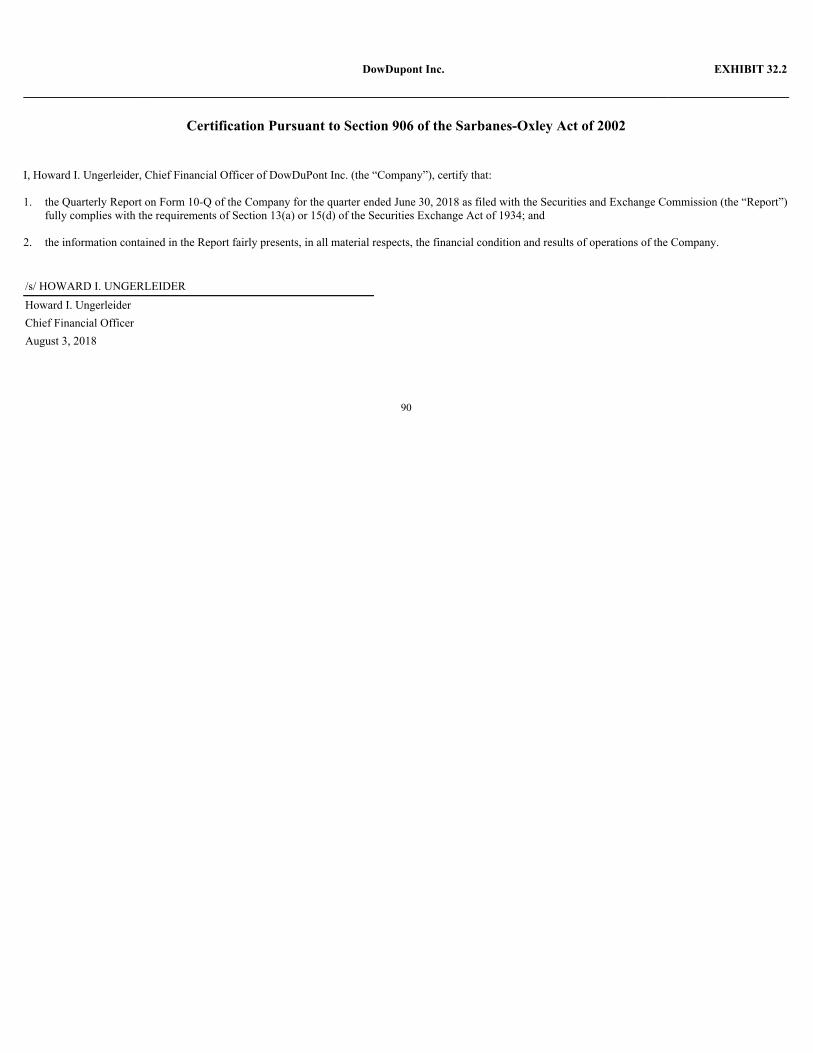
DowDupont Inc. EXHIBIT 32.2
Certification Pursuant to Section 906 of the Sarbanes-Oxley Act of 2002
I, Howard I. Ungerleider, Chief Financial Officer of DowDuPont Inc. (the “Company”), certify that:
1. the Quarterly Report on Form 10-Q of the Company for the quarter ended June 30, 2018 as filed with the Securities and Exchange Commission (the “Report”)fully complies with the requirements of Section 13(a) or 15(d) of the Securities Exchange Act of 1934; and
2. the information contained in the Report fairly presents, in all material respects, the financial condition and results of operations of the Company.
/s/ HOWARD I. UNGERLEIDERHoward I. UngerleiderChief Financial OfficerAugust 3, 2018
90