Embed Size (px)
Citation preview

Dehumidification Enhancement of Direct Expansion Systems
Through Component Augmentation of the Cooling Coil
Douglas Kosar Muthasamy Swami Richard Raustad Principal Research Engineer Program Director Senior Research Engineer
Energy Resources Center Don Shirey Mangesh Basarkar Department of Mechanical and
Industrial Engineering Principal Research Engineer Research Engineer
College of Engineering Florida Solar Energy Center University of Illinois at Chicago University of Central Florida
Chicago, Illinois Cocoa, Florida
ABSTRACT Diverse air conditioning products with enhanced
dehumidification features are being introduced to meet the increased moisture laden ventilation air requirements of ASHRAE Standard 62 in humid climates. In this evaluation, state point performance spreadsheet models for single path, mixed air packaged systems compare a conventional “off the shelf” direct expansion (DX) cooling system and its performance to systems that augment the DX coil with enhanced dehumidification components, such as heat exchangers and desiccant dehumidifiers. Using common performance metrics for comparisons at ARI rating conditions, these alternative systems define a best practice for enhanced dehumidification performance. The state point performance spreadsheet models combine available algorithms from the EnergyPlusTM simulation program for DX coils and heat exchangers with newly developed algorithms for desiccant dehumidifiers. All the models and their algorithms are applied in EnergyPlusTM for simulations of annual system cooling performance, including sensible and latent loads met, energy consumed, and humidity levels maintained, in select building types and climatic locations. Per this EnergyPlusTM analysis, these enhanced dehumidification systems present challenging decision-making tradeoffs between humidity control improvements over conventional DX systems, condensing (compressor) unit energy consumption reductions versus DX cool and reheat approaches, and fan energy use increases due to the additional component pressure drops.
BACKGROUND A recent report (NCEMBT 2005A) has
documented the emergence of diverse air conditioning products with enhanced dehumidification features in the HVAC marketplace in the last few years. The leading issue (Kosar 1998) being addressed with these new cooling systems is the large dehumidification requirement presented by moisture laden outside air that is being mechanically
introduced into buildings to meet the increased ventilation rates of ASHRAE Standard 62-1989 and its revisions over the last 15 years. The availability of humidity design weather data (Harriman 1999) in the ASHRAE Handbook of Fundamentals since 1997 and the ready quantification of outside air dehumidification loads by others (Harriman 1997), has also made it much more straightforward to determine a HVAC moisture removal design needs for a building, especially those originating from outside airstreams. But now we are faced with an array of system offerings to apply to our buildings and their dehumidification needs. In this paper a comparison is made of single path, mixed air, all electric packaged systems encompassing a conventional “off the shelf” DX system, with and without condenser reheat, along with three other enhanced dehumidification DX system packages to provide insight into their respective state point performance and annual cooling performance capabilities.
State point performance spreadsheet models developed during this study are used to compare a conventional direct expansion (DX) cooling system and its performance to a DX coil with a condenser (desuperheat) reheat coil downstream, and systems that augment the DX coil with enhanced dehumidification components including a wraparound heat pipe heat exchanger, a desiccant dehumidifier also in a "wraparound" configuration, and a post coil desiccant dehumidifier regenerated by condenser waste heat. Using common performance metrics for comparisons at ARI rating conditions, the findings show how these three alternative systems define a best practices performance which can: 1) approach the high performance of an ideal cooling system that can shift its sensible capacity to latent capacity without an efficiency penalty; and 2) far exceed the poor performance of the simple, but inefficient condenser waste heat reheat approach. Only essential highlights of this earlier portion of the study will be reported in this paper since those
ESL-HH-06-07-41
Proceedings of the Fifteenth Symposium on Improving Building Systems in Hot and Humid Climates, Orlando, FL, July 24-26, 2006
findings are presented in detail in another publication (Kosar 2006).
The state point performance spreadsheet models combine available algorithms from the EnergyPlusTM simulation program for DX coils, reheat coils and heat exchangers with newly developed algorithms for desiccant dehumidifiers. All these models and their algorithms are applied in EnergyPlusTM for annual cooling simulations of system performance, including sensible and latent loads met, energy consumed, and humidity levels maintained, in select building types and climatic locations. Per this analysis, these enhanced dehumidification systems present challenging decision-making tradeoffs between humidity control improvements over conventional DX systems, condensing (compressor) unit energy consumption reductions versus DX cool and reheat approaches, and fan energy use increases due to the additional component pressure drops. Details of this later portion of the study will be reported in this paper.
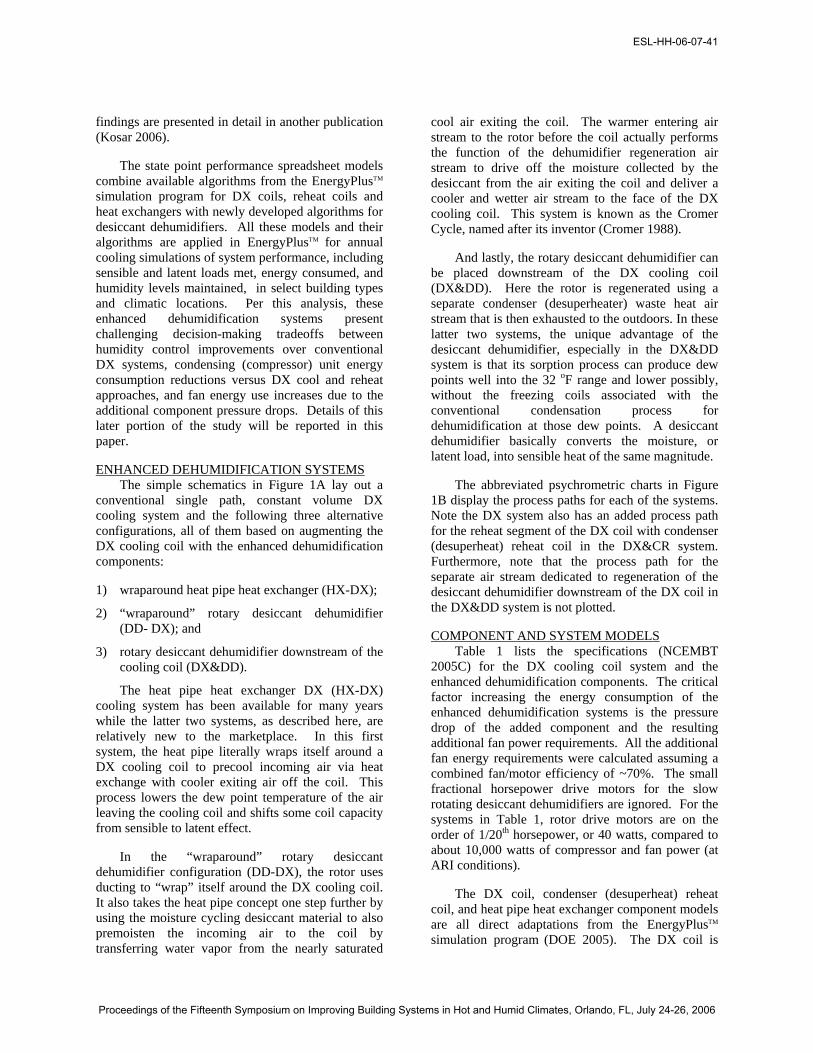
ENHANCED DEHUMIDIFICATION SYSTEMS The simple schematics in Figure 1A lay out a
conventional single path, constant volume DX cooling system and the following three alternative configurations, all of them based on augmenting the DX cooling coil with the enhanced dehumidification components:
1) wraparound heat pipe heat exchanger (HX-DX);
2) “wraparound” rotary desiccant dehumidifier (DD- DX); and
3) rotary desiccant dehumidifier downstream of the cooling coil (DX&DD).
The heat pipe heat exchanger DX (HX-DX) cooling system has been available for many years while the latter two systems, as described here, are relatively new to the marketplace. In this first system, the heat pipe literally wraps itself around a DX cooling coil to precool incoming air via heat exchange with cooler exiting air off the coil. This process lowers the dew point temperature of the air leaving the cooling coil and shifts some coil capacity from sensible to latent effect.
In the “wraparound” rotary desiccant dehumidifier configuration (DD-DX), the rotor uses ducting to “wrap” itself around the DX cooling coil. It also takes the heat pipe concept one step further by using the moisture cycling desiccant material to also premoisten the incoming air to the coil by transferring water vapor from the nearly saturated
cool air exiting the coil. The warmer entering air stream to the rotor before the coil actually performs the function of the dehumidifier regeneration air stream to drive off the moisture collected by the desiccant from the air exiting the coil and deliver a cooler and wetter air stream to the face of the DX cooling coil. This system is known as the Cromer Cycle, named after its inventor (Cromer 1988).
And lastly, the rotary desiccant dehumidifier can be placed downstream of the DX cooling coil (DX&DD). Here the rotor is regenerated using a separate condenser (desuperheater) waste heat air stream that is then exhausted to the outdoors. In these latter two systems, the unique advantage of the desiccant dehumidifier, especially in the DX&DD system is that its sorption process can produce dew points well into the 32 oF range and lower possibly, without the freezing coils associated with the conventional condensation process for dehumidification at those dew points. A desiccant dehumidifier basically converts the moisture, or latent load, into sensible heat of the same magnitude.
The abbreviated psychrometric charts in Figure 1B display the process paths for each of the systems. Note the DX system also has an added process path for the reheat segment of the DX coil with condenser (desuperheat) reheat coil in the DX&CR system. Furthermore, note that the process path for the separate air stream dedicated to regeneration of the desiccant dehumidifier downstream of the DX coil in the DX&DD system is not plotted.
COMPONENT AND SYSTEM MODELS Table 1 lists the specifications (NCEMBT
2005C) for the DX cooling coil system and the enhanced dehumidification components. The critical factor increasing the energy consumption of the enhanced dehumidification systems is the pressure drop of the added component and the resulting additional fan power requirements. All the additional fan energy requirements were calculated assuming a combined fan/motor efficiency of ~70%. The small fractional horsepower drive motors for the slow rotating desiccant dehumidifiers are ignored. For the systems in Table 1, rotor drive motors are on the order of 1/20th horsepower, or 40 watts, compared to about 10,000 watts of compressor and fan power (at ARI conditions).
The DX coil, condenser (desuperheat) reheat coil, and heat pipe heat exchanger component models are all direct adaptations from the EnergyPlusTM simulation program (DOE 2005). The DX coil is
ESL-HH-06-07-41
Proceedings of the Fifteenth Symposium on Improving Building Systems in Hot and Humid Climates, Orlando, FL, July 24-26, 2006

DX
Figure 1A. DX System and DX Systems with Enhanced Dehumidification Components at ARI Rating Conditions
Table 1. DX and Enhanced Dehumidification Component Specifications
DD
+
+
51.0 gr/lb
7.3 g/kg
70.6 oFdb
21.4 oCdb
48.7 oFdp
9.3 oCdp
57.8 oFwb
14.3 oCwb
78.6 gr/lb
11.2 g/kg
80.0 oFdb
26.7 oCdb
60.4 oFdp
15.8 oCdp
67.0 oFwb
19.4 oCwb
67.1 gr/lb
9.6 g/kg
57.4 oFdb
14.1 oCdb
56.0 oFdp
13.3 oCdp
56.6 oFwb
13.7 oCwb
126.8 gr/lb
18.1 g/kg
102.2 oFdb
39.0 oCdb
73.9 oFdp
23.2 oCdp
81.0 oFwb
27.2 oCwb
110.0 gr/lb
15.7 g/kg
115.0 oFdb
46.1 oCdb
69.8 oFdp
21.0 oCdp
81.6 oFwb
27.6 oCwb
CAEA
OA+RA SADX
DD
++
++
51.0 gr/lb
7.3 g/kg
70.6 oFdb
21.4 oCdb
48.7 oFdp
9.3 oCdp
57.8 oFwb
14.3 oCwb
51.0 gr/lb
7.3 g/kg
70.6 oFdb
21.4 oCdb
48.7 oFdp
9.3 oCdp
57.8 oFwb
14.3 oCwb
78.6 gr/lb
11.2 g/kg
80.0 oFdb
26.7 oCdb
60.4 oFdp
15.8 oCdp
67.0 oFwb
19.4 oCwb
78.6 gr/lb
11.2 g/kg
80.0 oFdb
26.7 oCdb
60.4 oFdp
15.8 oCdp
67.0 oFwb
19.4 oCwb
67.1 gr/lb
9.6 g/kg
57.4 oFdb
14.1 oCdb
56.0 oFdp
13.3 oCdp
56.6 oFwb
13.7 oCwb
67.1 gr/lb
9.6 g/kg
57.4 oFdb
14.1 oCdb
56.0 oFdp
13.3 oCdp
56.6 oFwb
13.7 oCwb
126.8 gr/lb
18.1 g/kg
102.2 oFdb
39.0 oCdb
73.9 oFdp
23.2 oCdp
81.0 oFwb
27.2 oCwb
126.8 gr/lb
18.1 g/kg
102.2 oFdb
39.0 oCdb
73.9 oFdp
23.2 oCdp
81.0 oFwb
27.2 oCwb
110.0 gr/lb
15.7 g/kg
115.0 oFdb
46.1 oCdb
69.8 oFdp
21.0 oCdp
81.6 oFwb
27.6 oCwb
110.0 gr/lb
15.7 g/kg
115.0 oFdb
46.1 oCdb
69.8 oFdp
21.0 oCdp
81.6 oFwb
27.6 oCwb
CAEA
OA+RA SA
Legend
DX System HX-DX System
DD-DX System DX&DD System
Component TypesDX = Direct Expansion Cooling CoilHX = Heat Pipe Heat ExchangerDD = Desiccant Dehumidifier
Air StreamsOA = Outside AirRA = Return AirCA = Condenser AirEA = Exhaust AirSA = Supply Air
Component Performance
Dry Bulb Temperature
HumidityRatio
+ increase
decrease
no change
+ increase
decrease
no change
Component Performance
Dry Bulb Temperature
HumidityRatio
++ increase
decrease
no change
++ increase
decrease
no change
State Point Conditions
hu
wet bulb temperature te
dry bulb temperature
midity ratio
dew point mperature
Airflow
10 tons
35.2 kW
Nominal DX Capacity
3500 cfm
1652 L/s
nditionsState Point Co
hu
wet bulb temperature te
dry bulb temperature
midity ratio
dew point mperature
hu
wet bulb temperature te
dry bulb temperature
midity ratio
dew point mperature
Airflow
10 tons
35.2 kW
Nominal DX Capacity
3500 cfm
1652 L/s
DX
78.6 gr/lb
11.2 g/kg
80.0 oFdb
26.7 oCdb
60.4 oFdp
15.8 oCdp
67.0 oFwb
19.4 oCwb
67.1 gr/lb
9.6 g/kg
57.4 oFdb
14.1 oCdb
56.0 oFdp
13.3 oCdp
56.6 oFwb
13.7 oCwb
OA+RA SADX
78.6 gr/lb
11.2 g/kg
80.0 oFdb
26.7 oCdb
60.4 oFdp
15.8 oCdp
67.0 oFwb
19.4 oCwb
78.6 gr/lb
11.2 g/kg
80.0 oFdb
26.7 oCdb
60.4 oFdp
15.8 oCdp
67.0 oFwb
19.4 oCwb
67.1 gr/lb
9.6 g/kg
57.4 oFdb
14.1 oCdb
56.0 oFdp
13.3 oCdp
56.6 oFwb
13.7 oCwb
67.1 gr/lb
9.6 g/kg
57.4 oFdb
14.1 oCdb
56.0 oFdp
13.3 oCdp
56.6 oFwb
13.7 oCwb
OA+RA SADX
78.6 gr/lb
11.2 g/kg
67.8 oFdb
19.9 oCdb
60.4 oFdp
15.8 oCdp
63.0 oFwb
17.2 oCwb
58.5 gr/lb
8.4 g/kg
53.0 oFdb
11.7oCdb
52.3 oFdp
11.3 oCdp
52.6 oFwb
11.4 oCwb
58.5 gr/lb
8.4 g/kg
65.1 oFdb
18.4 oCdb
52.3 oFdp
11.3 oCdp
57.5 oFwb
14.2 oCwb
HX HX
+
78.6 gr/lb
11.2 g/kg
80.0 oFdb
26.7 oCdb
60.4 oFdp
15.8 oCdp
67.0 oFwb
19.4 oCwb
DX
78.6 gr/lb
11.2 g/kg
67.8 oFdb
19.9 oCdb
60.4 oFdp
15.8 oCdp
63.0 oFwb
17.2 oCwb
78.6 gr/lb
11.2 g/kg
67.8 oFdb
19.9 oCdb
60.4 oFdp
15.8 oCdp
63.0 oFwb
17.2 oCwb
58.5 gr/lb
8.4 g/kg
53.0 oFdb
11.7oCdb
52.3 oFdp
11.3 oCdp
52.6 oFwb
11.4 oCwb
58.5 gr/lb
8.4 g/kg
53.0 oFdb
11.7oCdb
52.3 oFdp
11.3 oCdp
52.6 oFwb
11.4 oCwb
58.5 gr/lb
8.4 g/kg
65.1 oFdb
18.4 oCdb
52.3 oFdp
11.3 oCdp
57.5 oFwb
14.2 oCwb
58.5 gr/lb
8.4 g/kg
65.1 oFdb
18.4 oCdb
52.3 oFdp
11.3 oCdp
57.5 oFwb
14.2 oCwb
HX HX
++
78.6 gr/lb
11.2 g/kg
80.0 oFdb
26.7 oCdb
60.4 oFdp
15.8 oCdp
67.0 oFwb
19.4 oCwb
78.6 gr/lb
11.2 g/kg
80.0 oFdb
26.7 oCdb
60.4 oFdp
15.8 oCdp
67.0 oFwb
19.4 oCwb
OA+RA
DX
SA
88.4 gr/lb
12.6 g/kg
74.6 oFdb
23.7 oCdb
63.6 oFdp
17.6 oCdp
67.2 oFwb
19.6 oCwb
68.3 gr/lb
9.8 g/kg
57.4 oFdb
14.1 oCdb
56.5 oFdp
13.6oCdp
56.9 oFwb
13.8 oCwb
DD
++
58.5 gr/lb
8.4 g/kg
62.8 oFdb
1 oCdb
52.3 oFdp
11.3 oCdp
.6 oFwb
13.6 oCwb
17.
56
78.6 gr/lb
11.2 g/kg
80.0 o b
26.7
60.4 oFdp
15.8 oCdp
67.0 oFwb
19.4 o b
OA+RA
SA
DX
FdoCdb
Cw
88.4 gr/lb
12.6 g/kg
74.6 oFdb
23.7 oCdb
63.6 oFdp
17.6 oCdp
67.2 oFwb
19.6 oCwb
88.4 gr/lb
12.6 g/kg
74.6 oFdb
23.7 oCdb
63.6 oFdp
17.6 oCdp
67.2 oFwb
19.6 oCwb
68.3 gr/lb
9.8 g/kg
57.4 oFdb
14.1 oCdb
56.5 oFdp
13.6oCdp
56.9 oFwb
13.8 oCwb
DD
++++
58.5 gr/lb
8.4 g/kg
62.8 oFdb
1 oCdb
52.3 oFdp
11.3 oCdp
.6 oFwb
13.6 oCwb
17.
56
58.5 gr/lb
8.4 g/kg
62.8 oFdb
1 oCdb
52.3 oFdp
11.3 oCdp
.6 oFwb
13.6 oCwb
17.
56
78.6 gr/lb
11.2 g/kg
80.0 o b
26.7
60.4 oFdp
15.8 oCdp
67.0 oFwb
19.4 o b
FdoCdb
Cw
78.6 gr/lb
11.2 g/kg
80.0 o b
26.7
60.4 oFdp
15.8 oCdp
67.0 oFwb
19.4 o b
OA+RA
SA
ARI ARI
I ARI
FdoCdb
Cw
AR
1
11
1 2 3
2
3
2
DX
DD
+
+
51.0 gr/lb
7.3 g/kg
70.6 oFdb
21.4 oCdb
48.7 oFdp
9.3 oCdp
57.8 oFwb
14.3 oCwb
78.6 gr/lb
11.2 g/kg
80.0 oFdb
26.7 oCdb
60.4 oFdp
15.8 oCdp
67.0 oFwb
19.4 oCwb
67.1 gr/lb
9.6 g/kg
57.4 oFdb
14.1 oCdb
56.0 oFdp
13.3 oCdp
56.6 oFwb
13.7 oCwb
126.8 gr/lb
18.1 g/kg
102.2 oFdb
39.0 oCdb
73.9 oFdp
23.2 oCdp
81.0 oFwb
27.2 oCwb
110.0 gr/lb
15.7 g/kg
115.0 oFdb
46.1 oCdb
69.8 oFdp
21.0 oCdp
81.6 oFwb
27.6 oCwb
OA+RA SA
CAEA
DX
DD
++
++
51.0 gr/lb
7.3 g/kg
70.6 oFdb
21.4 oCdb
48.7 oFdp
9.3 oCdp
57.8 oFwb
14.3 oCwb
51.0 gr/lb
7.3 g/kg
70.6 oFdb
21.4 oCdb
48.7 oFdp
9.3 oCdp
57.8 oFwb
14.3 oCwb
78.6 gr/lb
11.2 g/kg
80.0 oFdb
26.7 oCdb
60.4 oFdp
15.8 oCdp
67.0 oFwb
19.4 oCwb
78.6 gr/lb
11.2 g/kg
80.0 oFdb
26.7 oCdb
60.4 oFdp
15.8 oCdp
67.0 oFwb
19.4 oCwb
67.1 gr/lb
9.6 g/kg
57.4 oFdb
14.1 oCdb
56.0 oFdp
13.3 oCdp
56.6 oFwb
13.7 oCwb
67.1 gr/lb
9.6 g/kg
57.4 oFdb
14.1 oCdb
56.0 oFdp
13.3 oCdp
56.6 oFwb
13.7 oCwb
126.8 gr/lb
18.1 g/kg
102.2 oFdb
39.0 oCdb
73.9 oFdp
23.2 oCdp
81.0 oFwb
27.2 oCwb
126.8 gr/lb
18.1 g/kg
102.2 oFdb
39.0 oCdb
73.9 oFdp
23.2 oCdp
81.0 oFwb
27.2 oCwb
110.0 gr/lb
15.7 g/kg
115.0 oFdb
46.1 oCdb
69.8 oFdp
21.0 oCdp
81.6 oFwb
27.6 oCwb
110.0 gr/lb
15.7 g/kg
115.0 oFdb
46.1 oCdb
69.8 oFdp
21.0 oCdp
81.6 oFwb
27.6 oCwb
OA+RA SA
CAEA
Legend
DX System HX-DX System
DD-DX System DX&DD System
Component TypesDX = Direct Expansion Cooling CoilHX = Heat Pipe Heat ExchangerDD = Desiccant Dehumidifier
Air StreamsOA = Outside AirRA = Return AirCA = Condenser AirEA = Exhaust AirSA = Supply Air
Component Performance
Dry Bulb Temperature
HumidityRatio
+ increase
decrease
no change
+ increase
decrease
no change
Component Performance
Dry Bulb Temperature
HumidityRatio
++ increase
decrease
no change
++ increase
decrease
no change
State Point Conditions
humidity ratio
wet bulb temperature
dew point temperature
dry bulb temperature
Airflow
10 tons
35.2 kW
Nominal DX Capacity
3500 cfm
1652 L/s
State Point Conditions
humidity ratio
wet bulb temperature
dew point temperature
dry bulb temperature
humidity ratio
wet bulb temperature
dew point temperature
dry bulb temperature
Airflow
10 tons
35.2 kW
Nominal DX Capacity
3500 cfm
1652 L/s
DX
78.6 gr/lb
11.2 g/kg
80.0 oFdb
26.7 oCdb
60.4 oFdp
15.8 oCdp
67.0 oFwb
19.4 oCwb
67.1 gr/lb
9.6 g/kg
57.4 oFdb
14.1 oCdb
56.0 oFdp
13.3 oCdp
56.6 oFwb
13.7 oCwb
OA+RA SADX
78.6 gr/lb
11.2 g/kg
80.0 oFdb
26.7 oCdb
60.4 oFdp
15.8 oCdp
67.0 oFwb
19.4 oCwb
78.6 gr/lb
11.2 g/kg
80.0 oFdb
26.7 oCdb
60.4 oFdp
15.8 oCdp
67.0 oFwb
19.4 oCwb
67.1 gr/lb
9.6 g/kg
57.4 oFdb
14.1 oCdb
56.0 oFdp
13.3 oCdp
56.6 oFwb
13.7 oCwb
67.1 gr/lb
9.6 g/kg
57.4 oFdb
14.1 oCdb
56.0 oFdp
13.3 oCdp
56.6 oFwb
13.7 oCwb
OA+RA SADX
78.6 gr/lb
11.2 g/kg
67.8 oFdb
9 oCdb
60.4 oFdp
15.8 oCdp
63.0 oFwb
17.2 oCwb
19.
58.5 gr/lb
8.4 g/kg
53.0 oFdb
11.7oCdb
52.3 oFdp
11.3 oCdp
52.6 oFwb
11.4 oCwb
58.5 gr/lb
8.4 g/kg
65.1 oFdb
18.4 oCdb
52.3 oFdp
11.3 oCdp
57.5 oFwb
14.2 oCwb
HX HX
+
78.6 gr/lb
11.2 g/kg
80.0 oFdb
26.7 oCdb
60.4 oFdp
15.8 oCdp
67.0 oFwb
19.4 oCwb
DX
78.6 gr/lb
11.2 g/kg
67.8 oFdb
9 oCdb
60.4 oFdp
15.8 oCdp
63.0 oFwb
17.2 oCwb
19.
78.6 gr/lb
11.2 g/kg
67.8 oFdb
9 oCdb
60.4 oFdp
15.8 oCdp
63.0 oFwb
17.2 oCwb
19.
58.5 gr/lb
8.4 g/kg
53.0 oFdb
11.7oCdb
52.3 oFdp
11.3 oCdp
52.6 oFwb
11.4 oCwb
58.5 gr/lb
8.4 g/kg
53.0 oFdb
11.7oCdb
52.3 oFdp
11.3 oCdp
52.6 oFwb
11.4 oCwb
58.5 gr/lb
8.4 g/kg
65.1 oFdb
18.4 oCdb
52.3 oFdp
11.3 oCdp
57.5 oFwb
14.2 oCwb
58.5 gr/lb
8.4 g/kg
65.1 oFdb
18.4 oCdb
52.3 oFdp
11.3 oCdp
57.5 oFwb
14.2 oCwb
HX HX
++
78.6 gr/lb
11.2 g/kg
80.0 oFdb
26.7 oCdb
60.4 oFdp
15.8 oCdp
67.0 oFwb
19.4 oCwb
78.6 gr/lb
11.2 g/kg
80.0 oFdb
26.7 oCdb
60.4 oFdp
15.8 oCdp
67.0 oFwb
19.4 oCwb
OA+RA SA
DX
88.4 gr/lb
12.6 g/kg
74.6 oFdb
23.7 oCdb
63.6 oFdp
17.6 oCdp
67.2 oFwb
19.6 oCwb
68.3 gr/lb
9.8 g/kg
57.4 oFdb
14.1 oCdb
56.5 oFdp
13.6oCdp
56.9 oFwb
13.8 oCwb
DD
++
58.5 gr/lb
8.4 g/kg
62.8 oFdb
1 oCdb
52.3 oFdp
11.3 oCdp
.6 oFwb
13.6 oCwb
17.
56
78.6 gr/lb
11.2 g/kg
80.0 o b
26.7
60.4 oFdp
15.8 oCdp
67.0 oFwb
19.4 o b
OA+RA
SA
DX
FdoCdb
Cw
88.4 gr/lb
12.6 g/kg
74.6 oFdb
23.7 oCdb
63.6 oFdp
17.6 oCdp
67.2 oFwb
19.6 oCwb
88.4 gr/lb
12.6 g/kg
74.6 oFdb
23.7 oCdb
63.6 oFdp
17.6 oCdp
67.2 oFwb
19.6 oCwb
68.3 gr/lb
9.8 g/kg
57.4 oFdb
14.1 oCdb
56.5 oFdp
13.6oCdp
56.9 oFwb
13.8 oCwb
DD
++++
58.5 gr/lb
8.4 g/kg
62.8 oFdb
1 oCdb
52.3 oFdp
11.3 oCdp
.6 oFwb
13.6 oCwb
17.
56
58.5 gr/lb
8.4 g/kg
62.8 oFdb
1 oCdb
52.3 oFdp
11.3 oCdp
.6 oFwb
13.6 oCwb
17.
56
78.6 gr/lb
11.2 g/kg
80.0 o b
26.7
60.4 oFdp
15.8 oCdp
67.0 oFwb
19.4 o b
FdoCdb
Cw
78.6 gr/lb
11.2 g/kg
80.0 o b
26.7
60.4 oFdp
15.8 oCdp
67.0 oFwb
19.4 o b
OA+RA
SA
ARI ARI
I ARI
FdoCdb
Cw
AR
1
11
1 2 3
2
3
2
Additional Pressure Drop (inch WG) for Face Velocity (fpm)
at cfm/ton of
Component (in System)
Description
350 250 150 DX 10 ton nominal system
with 4 row coil at 3500 cfm
ARI EER = 10.5 SHR = 0.758
HX (in HX-DX) 3 row heat pipe (with various FPI)
for 45% effectiveness at different cfm/ton with
face area/fpm matching DX coil
0.67
420
0.48
300
0.29
180
DD (in DD-DX) 4 inch depth Type 3 desiccant dehumidification rotor with 50/50
process and regeneration face area split
1.40
575
1.30
530
1.06
440
DD (in DX&DD) 4 inch depth Type 3 desiccant dehumidification rotor with 50/50
face area split process and regeneration with 115 oF
regeneration temperature from
1.51
800
1.51
800
1.51
800
condenser waste heat airstream
ESL-HH-06-07-41
Proceedings of the Fifteenth Symposium on Improving Building Systems in Hot and Humid Climates, Orlando, FL, July 24-26, 2006

DX/DX&CR
DD-DX
HX-DX
DX&DD
DX/DX&CR
DD-DX
HX-DX
DX&DD
Figure 1B. ARI Rating Condition Process Paths for DX and Enhanced Dehumidification DX Systems
ESL-HH-06-07-41
Proceedings of the Fifteenth Symposium on Improving Building Systems in Hot and Humid Climates, Orlando, FL, July 24-26, 2006
based on the EnergyPlusTM DX Cooling Coil Model which uses the rated capacity, Sensible Heat Ratio (SHR), and Energy Input Ratio (EIR is the inverse of the Coefficient of Performance or COP, which is defined later in the Performance Metrics section of this paper) obtained under ARI Standards 210/240 along with curve fitted performance data for calculations of capacity and COP at off-ARI operating conditions. This model is intended for operation between 250 and 500 cfm/ton (to 33.6 to 67.2 L/s.kW) but has demonstrated reasonable performance representations down to 150 cfm/ton (20.2 L/s.kW). Sensible and latent capacity splits are determined using the ARI rated SHR and the coil dew point/bypass factor approach. This approach is analogous to the NTU-effectiveness calculations in the EnergyPlusTM Air to Air Generic Heat Exchanger Model that is used to model the heat pipe. These heat exchanger calculations are used in conjunction with ARI Standard 1060 effectiveness data generated at 100% and 75% of rated airflow to determine performance at airflows between 50% and 130% of the rated airflow. Coupling the EnergyPlusTM DX and HX models in an iterative spreadsheet allows calculation of their combined performance in the HX-DX system. The condenser (desuperheat) reheat coil is based on the EnergyPlusTM Desuperheater Heating Coil Model. This heat reclaim coil reheats the air leaving the cooling coil but is limited to 30% of the total heat of rejection (THR) of the condenser, the maximum without causing refrigerant condensation and impacting the DX system performance.
Through discussions with manufacturers, it was determined that both the “wraparound” (Trane 2005) and condenser waste heat regenerated (Munters 2005) desiccant dehumidifiers are new Brunauer Type 3 isotherm desiccant rotors, not yet modeled in public domain simulation programs, including EnergyPlusTM. So for the earlier state point performance analysis, a preliminary curve fit of performance data from a rotor manufacturer selection program (Proflute 2005) for a condenser waste heat (115 oF) regenerated Type 1 desiccant dehumidifier had been developed. It has been coupled with the EnergyPlusTM DX model and applied to an iterative spreadsheet that allows calculation of their combined performance in the DX&DD system. Based on interactions with another manufacturer (Trane 2005), a DD model based on their actual empirical Type 3 rotor data was coupled with the EnergyPlusTM DX model in an iterative spreadsheet that allows calculation of their combined performance in the DD-DX system. For the later annual cooling performance modeling, a finite difference desiccant dehumidifier
modeling program was used to generate the two needed Type 3 desiccant dehumidifier performance datasets. These new desiccant dehumidifier models were incorporated into the EnergyPlusTM program code for the cooling simulations of the DD-DX and DX&DD systems.
PERFORMANCE METRICS The following commonly used performance
metrics from existing HVAC industry rating standards were utilized to compare the enhanced dehumidification systems (NCEMBT 2005B):
1) Coefficient of Performance (COP) defines a system’s overall efficiency non-dimensionally as total cooling (sensible and latent) capacity over total energy input, including compressors, fans, and controls, but not rotor drive motors.
2) Sensible Heat Ratio (SHR) defines the fraction of a system’s total cooling capacity that is sensible, and in turn latent (1-SHR).
3) Apparatus Dew Point (ADP) temperature defines a system’s delivered humidity level, which will determine if a system can meet the latent load without increasing airflow over that required to meet the sensible load. In this article we will make a further distinction by defining the CDP as Coil DP or the dew point temperature leaving the DX cooling coil, and the SDP as the System DP or the dew point leaving the entire system including any enhanced dehumidification component.
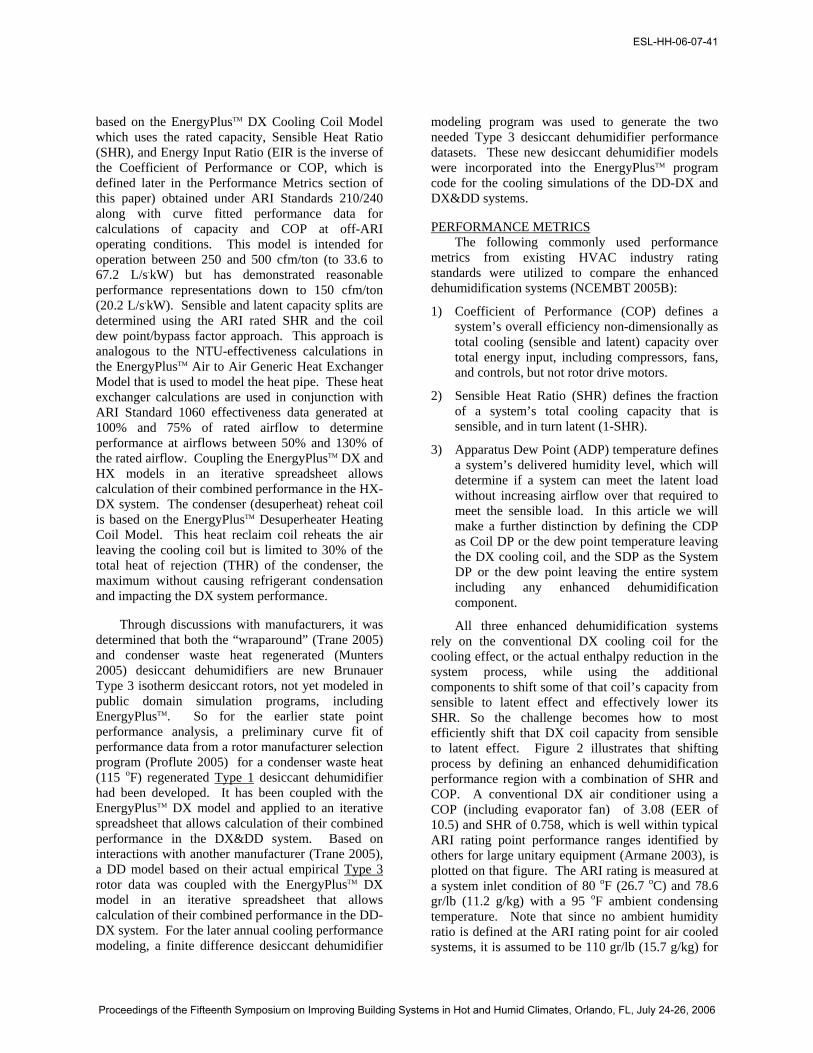
All three enhanced dehumidification systems rely on the conventional DX cooling coil for the cooling effect, or the actual enthalpy reduction in the system process, while using the additional components to shift some of that coil’s capacity from sensible to latent effect and effectively lower its SHR. So the challenge becomes how to most efficiently shift that DX coil capacity from sensible to latent effect. Figure 2 illustrates that shifting process by defining an enhanced dehumidification performance region with a combination of SHR and COP. A conventional DX air conditioner using a COP (including evaporator fan) of 3.08 (EER of 10.5) and SHR of 0.758, which is well within typical ARI rating point performance ranges identified by others for large unitary equipment (Armane 2003), is plotted on that figure. The ARI rating is measured at a system inlet condition of 80 oF (26.7 oC) and 78.6 gr/lb (11.2 g/kg) with a 95 oF ambient condensing temperature. Note that since no ambient humidity ratio is defined at the ARI rating point for air cooled systems, it is assumed to be 110 gr/lb (15.7 g/kg) for
ESL-HH-06-07-41
Proceedings of the Fifteenth Symposium on Improving Building Systems in Hot and Humid Climates, Orlando, FL, July 24-26, 2006
0.00
0.50
1.00
1.50
2.00
2.50
3.00
3.50
0.0 0.1 0.2 0.3 0.4 0.5 0.6 0.7 0.8 0.9 1.SHR
CO
P
0
Ideal Latent Capacity Shift COP
Condenser Reheat COP
ARI Rating Point
0.00
0.50
1.00
1.50
2.00
2.50
3.00
3.50
0.0 0.1 0.2 0.3 0.4 0.5 0.6 0.7 0.8 0.9 1.SHR
CO
P
0
Ideal Latent Capacity Shift COP
Condenser Reheat COP
ARI Rating Point
Figure 2. Enhanced Dehumidification Performance Region
0.00
0.50
1.00
1.50
2.00
2.50
3.00
3.50
0.0 0.1 0.2 0.3 0.4 0.5 0.6 0.7 0.8 0.9 1.0SHR
CO
P
Ideal Latent Capacity Shift COPCondenser Reheat COPDX COPHX-DX COPDD-DX COPDX&DD COP
350 cfm/ton250 cfm/ton150 cfm/ton
ARI Rating Point
0.00
0.50
1.00
1.50
2.00
2.50
3.00
3.50
0.0 0.1 0.2 0.3 0.4 0.5 0.6 0.7 0.8 0.9 1.0SHR
CO
P
Ideal Latent Capacity Shift COPCondenser Reheat COPDX COPHX-DX COPDD-DX COPDX&DD COP
350 cfm/ton250 cfm/ton150 cfm/ton
ARI Rating Point
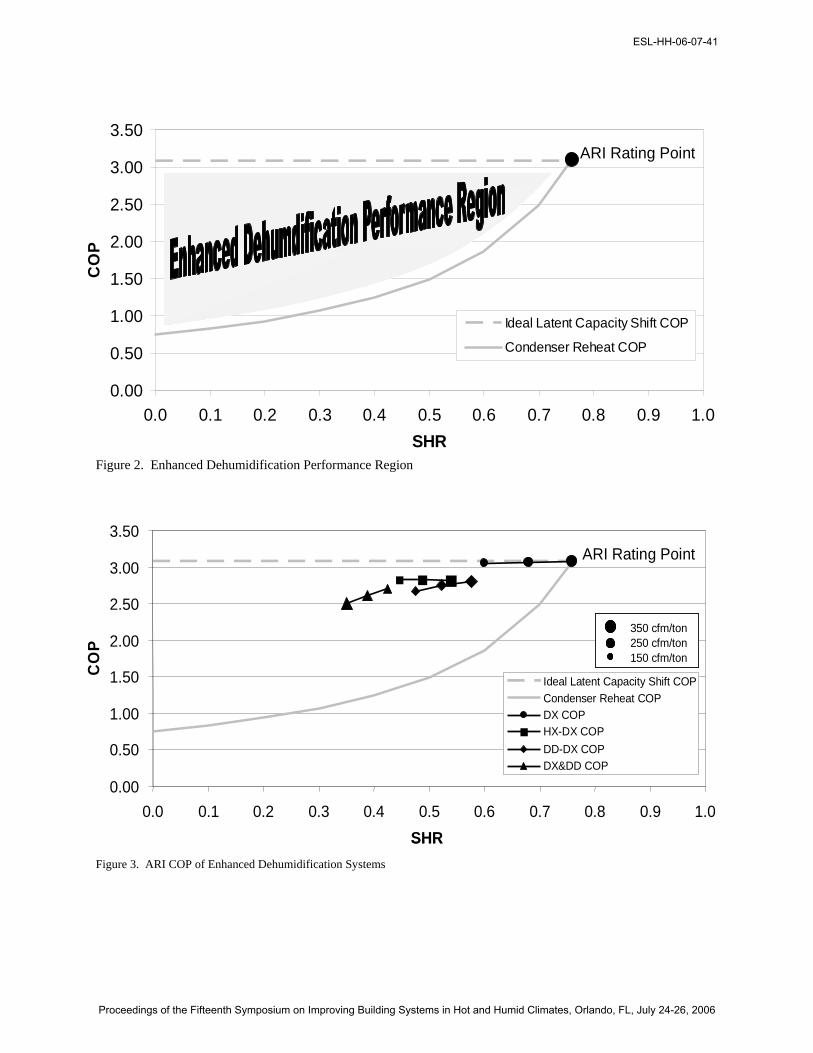
Figure 3. ARI COP of Enhanced Dehumidification Systems
ESL-HH-06-07-41
Proceedings of the Fifteenth Symposium on Improving Building Systems in Hot and Humid Climates, Orlando, FL, July 24-26, 2006
0.00
2.00
4.00
6.00
8.00
10.00
12.00
0.0 0.1 0.2 0.3 0.4 0.5 0.6 0.7 0.8 0.9 1.0SHR
Cap
acit
y (t
on
s)
DX Capacity
HX-DX Capacity
DD-DX Capacity
DX&DD Capacity
350 cfm/ton250 cfm/ton150 cfm/ton
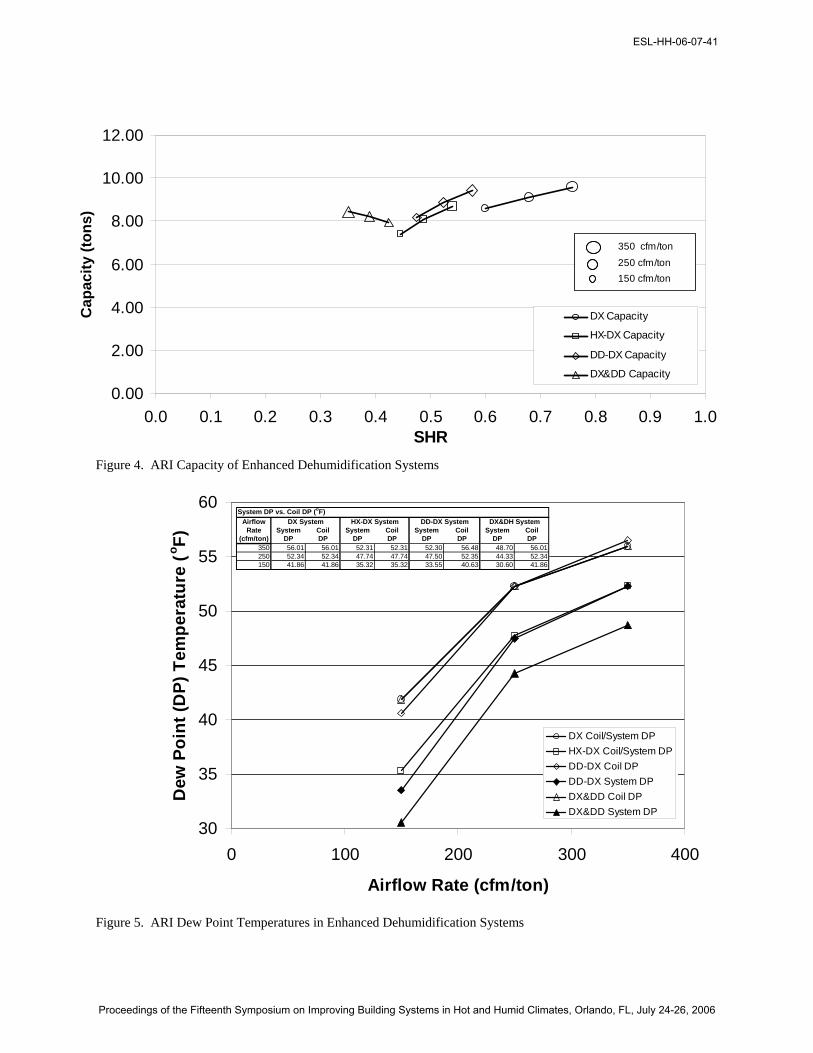
Figure 4. ARI Capacity of Enhanced Dehumidification Systems
30
35
40
45
50
55
60
0 100 200 300 400
Airflow Rate (cfm/ton)
Dew
Po
int
(DP
) T
emp
erat
ure
(oF
)
DX Coil/System DPHX-DX Coil/System DPDD-DX Coil DPDD-DX System DPDX&DD Coil DPDX&DD System DP
System DP vs. Coil DP (oF)
AirflowRate System Coil System Coil System Coil System Coil
(cfm/ton) DP DP DP DP DP DP DP DP350 56.01 56.01 52.31 52.31 52.30 56.48 48.70 56.01250 52.34 52.34 47.74 47.74 47.50 52.35 44.33 52.34150 41.86 41.86 35.32 35.32 33.55 40.63 30.60 41.86
DD-DX System DX&DH SystemDX System HX-DX System
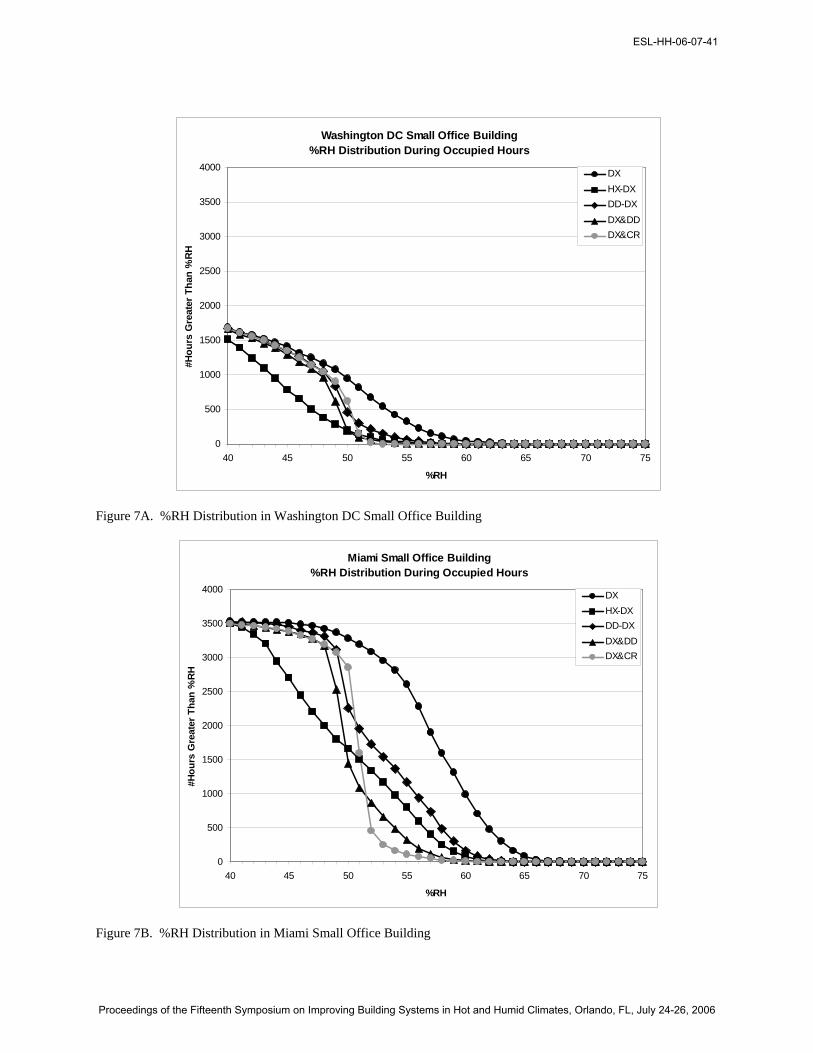
Figure 5. ARI Dew Point Temperatures in Enhanced Dehumidification Systems
ESL-HH-06-07-41
Proceedings of the Fifteenth Symposium on Improving Building Systems in Hot and Humid Climates, Orlando, FL, July 24-26, 2006

the DX&DD system using ambient air for desiccant dehumidifier regeneration. The plot shows two lines emanating from that single point. The curved line represents a DX system utilizing free condenser reheat to lower its SHR. Such equipment is now offered by all the major HVAC equipment manufacturers. As that line nears the vertical COP axis, the performance approaches that of a typical DX dehumidifier with a dehumidification only capacity COP of around 0.75. That curve represents a minimum performance level which any enhanced dehumidification system offering must exceed. The dashed horizontal line represents an ideal scenario where the shift of sensible to latent capacity occurs without any loss in COP. No real system can achieve that level of performance by modifying the base DX coil system, which is represented by the single ARI rating data point. However, real systems that approach that level of performance over the lower range of SHRs will define a best practice approach for enhanced dehumidification equipment. The area in Figure 2 bounded by the COP axis, the horizontal ideal performance line, and the free reheat curve defines an enhanced dehumidification performance region.
ARI STATE POINT PERFORMANCE Based on the models and metrics from the
preceding sections, the ARI rating point performance of the systems is compared and discussed in the following sections.
Coefficient of Performance Against the backdrop of the enhanced
dehumidification region, the systems discussed and their COPs at ARI rating conditions are plotted for three airflow rates (cfm/ton or L/s.kW levels) in Figure 3. The detailed state point conditions at the inlet and outlet of each component in the system operating at 350 cfm/ton (47.0 L/s.kW) is delineated in the system schematics of Figure 1. The compilation of data points in Figure 4 infers a current best practice curve for enhanced dehumidification systems utilizing different component augmentations to achieve lower SHRs versus the DX cooling coil alone. As expected, lowering the airflow rate on the DX cooling coil system (DX) is a logical first step to lowering SHR with little loss in COP. Adding a wraparound heat pipe heat exchanger (HX-DX) or desiccant dehumidifier (DD-DX) provides comparable, additional SHR reductions by preconditioning air into the coil with similar COP losses due to the extra fan power requirements. The post DX coil integration of a desiccant dehumidifier using condenser waste regeneration (DX&DD)
provides the greatest SHR reduction but with the largest COP penalty. Compared to the other three systems, the SHR trends with lowering airflow rates are reversed for this system in Figure 3. It is typical of a desiccant dehumidifier operation, that even though the leaving humidity level decreases as airflow rate decreases, the capacity (the product of humidity depression and total airflow) decreases. This decease in dehumidification capacity is coupled with a decrease in the sensible heating from the dehumidifier as well. The resulting increase in sensible capacity and decrease in latent capacity raises overall SHR with lowering airflow rates.
A little further psychrometric analysis of the state point conditions in Figure 1A/1B helps explain these results further. When in the 45% effectiveness range, a heat pipe heat exchanger provides about a 12 oF (6.7 oC) closer dry bulb temperature approach to the saturation curve from the ARI rating conditions. On an equivalent enthalpy basis, that closer approach equates to about a 4 oF (2.2 oC) increase in dew point depression at the coil. On that portion of the saturation curve that amounts to upwards of a 10 grains/lb (1.4 g/kg) greater depression in the moisture level leaving the coil.
In discussions with the manufacturer currently applying wraparound desiccant dehumidifiers, those rotors are being selected to cycle about 10 grains of moisture as well, providing about an equivalent depression in moisture level leaving that system. Whereas the heat pipe heat exchanger processes follow a constant humidity ratio line, the desiccant dehumidifier processes follow essentially a constant enthalpy line.
The placement of the desiccant dehumidifier downstream of the DX coil, with a separate air stream dedicated to regeneration at a higher 115 oF temperature, provides about 15 grains/lb (2.1 g/kg) of depression in the moisture level of the air after the coil. The commensurate temperature rise is somewhat greater than a constant enthalpy process due to the higher regeneration temperature source and heat carryover effects. This contributes to the additional decline in COP, especially at the higher airflow rates when the dehumidifier capacity is maximized. It should be reiterated here that a Brunauer Type 1 isotherm desiccant dehumidifier was being utilized in this DX&DD state performance modeling. Use of a Type 3 isotherm desiccant dehumidifier resulting from ongoing finite difference modeling is expected to lessen that temperature rise somewhat due to lower heat of adsorption effects.
ESL-HH-06-07-41
Proceedings of the Fifteenth Symposium on Improving Building Systems in Hot and Humid Climates, Orlando, FL, July 24-26, 2006

Total Cooling Capacity
Figure 4 plots the total cooling capacities of the systems at the ARI rating conditions for the same three airflow rates. In general, capacities drop with airflow rates as cold coil based systems suffer COP degradations and realize diminishing returns in total cooling effect with decreasing apparatus dew points. Also psychrometrically, as the saturation curve becomes more shallow at lower dew point temperatures there is less latent effect accomplished with each drop in dew point temperature. The DX&DD system is less sensitive to this phenomena since its post coil desiccant dehumidifier with its separate regeneration airstream can drive additional moisture removal via an adsorption process independent of the DX cooling coil. Again the SHR trends are reversed for the post coil desiccant dehumidifier system (DX&DD) compared to the other systems, as explained in the COP section.
Coil and System DP It was noted earlier that desiccant dehumidifiers
and their adsorption process, have the unique advantage of producing dew points well into the 32 oF (0 oC) range and lower, without the freezing coils associated with the conventional condensation process for dehumidification at those dew points. Figure 5 illustrates this point by plotting both the dew point temperature off the DX coil and that supplied by the entire system. For the DX and HX-DX system the CDP and SDP are one and the same. With the addition of a wraparound desiccant dehumidifier to the DX coil in the DD-DX system, it can deliver air at a SDP 4 to 7 oF (2.2 to 3.9 oC) lower than the CDP as a result of the adsorption process after the DX cooling coil. Likewise for the DX&DD system, air can be delivered at a SDP 7 to 11 oF (3.9 to 6.1 oC) lower than the CDP as a result of the adsorption process in the downstream desiccant dehumidifier.
The concern over freezing cooling coils is exemplified by the values at the lowest airflow rate of 150 cfm/ton (20.2 L/s.kW). The DX coil in the DX, DD-DX, and DX&DD are all operating above a CDP of 40 oF (4.4 oC), while the DX coil in the HX-DX system is near freezing at 35 oF (1.7 oC). In fact, the other systems are still operating in a CDP range in which manufacturers may only offer custom DX systems. Generally, packaged DX systems operate at a 45 oF (7.2 oC) or higher CDP at typical design conditions. The HX-DX system would have to employ “tilt control” or other means to reduce the effectiveness of the heat pipe and raise the DX CDP. This will raise the resulting SHR, but not effect the
COP or overall capacity of the HX-DX system. When necessary in the DD-DX system, air can be preheated up to 15 oF (8.3 oC) with condenser waste heat to false load the system. This will raise the resulting SHR, and significantly lower the COP and overall capacity of the DD-DX system. The DX&DD system with its post coil desiccant dehumidifier would typically utilize conventional DX only system compressor staging/unloading controls to prevent a freezing coil.
OTHER STATE POINT PERFORMANCE In addition to ARI conditions, 10 other system
inlet conditions were evaluated and are reported in detail in another publication (Kosar 2006). These 10 other system inlet conditions ranged from 100% outside air (OA) through mixed (50% and 15% OA) air (MA) to 100% return air (RA) at 75 oF (23.9 oC) and 50% RH. The OA conditions selected were typical of 3 design ambient conditions for a hot and humid climate: 1) design dry bulb (DB) temperature of 94 oF (34.4 oC) and 110 gr/lb (15.7 g/kg); 2) design dew point (DP) of 140 gr/lb (20.0 g/kg) and 83 oF (28.3 oC); and 3) design latent part load (PL) condition (Harriman 2002) of 110 gr/lb (15.7 g/kg) and 75 oF (23.9 oC).
EDUCATIONAL MODELING TOOL – for System State Point Performance
While sophisticated modeling tools such as EnergyPlus are essential for research of the complex annual cooling simulations of system applications in various building types and climate locations, there is also a need for simpler, user friendly modeling tools for education to aid in market transformation. As part of this overall research effort, training materials are being developed to assist in: 1) educating the HVAC specifying chain about enhanced dehumidification components; and 2) demonstrating the resulting performance of component integrations with a new system modeling tool. Target platforms for these educational initiatives are professional societies, such as the American Society for Heating, Refrigerating, and Air Conditioning (ASHRAE) and their professional development seminars and short courses, and trade organizations, such as the National Energy Management Institute (NEMI) and their union HVAC training centers. Efforts are now underway with NEMI and ASHRAE to schedule pilot educational initiatives later in 2006 and 2007.
The new computer based analysis tool developed for this educational initiative is a Windows TM based, Visual Basic TM coded, user interactive program. It is
ESL-HH-06-07-41
Proceedings of the Fifteenth Symposium on Improving Building Systems in Hot and Humid Climates, Orlando, FL, July 24-26, 2006

Figure 6. Screen Shots of Educational Enhanced Dehumidification System State Point Performance Comparative Modeling Tool
ESL-HH-06-07-41
Proceedings of the Fifteenth Symposium on Improving Building Systems in Hot and Humid Climates, Orlando, FL, July 24-26, 2006

capable of constructing a limited set of user defined integrated DX cooling equipment configurations with conventional and enhanced dehumidification components. Those equipment configurations encompass all of the single path systems presented in this paper, plus a dual path DX coil system with a dedicated OA coil and separate secondary RA coil. The computer code uses the same basic performance algorithms from the available, public domain EnergyPlusTM DX coil, condenser (desuperheat) reheat coil, and heat pipe heat exchanger component models, along with the newly developed, EnergyPlusTM compatible Brunauer Type 3 desiccant dehumidifier models from this research . It generates system state point calculations for inlet and outlet conditions, along with pressure drops, of each component and then provides side by side tables for alternative system performance comparisons, including supply air conditions, capacity, SHR, COP, and power requirements. Screen shots from this tool are shown in Figure 6. It is anticipated that this computer program will be made available to the public via low-cost means such as ASHRAE Short Course outreach activities and no-cost means such as NCEMBT and DOE sponsor website downloads by late 2006/early 2007.
ENERGYPLUSTM MODELING TOOL – for Annual Cooling System Performance
All five systems discussed in the preceding sections of this paper -- the conventional DX cooling coil without (DX) and with (DX&CR) condenser reheat, along with the DX coil augmented by a wraparound heat pipe heat exchanger (HX-DX), “wraparound” rotary desiccant dehumidifier (DD- DX), and downstream rotary desiccant dehumidifier (DX&DD) -- were simulated in EnergyPlusTM for select building types and climate locations. Results are reported in detail in another publication (NCEMBT 2006). For brevity in this paper, results for only two building types -- the small office building and retail store -- in two weather data cities -- Washington DC and Miami -- are provided here to exemplify performance trends for the 5 systems.
Several of the key specifications for the systems and buildings are delineated in Tables, 2, 3A, and 3B. The EnergyPlusTM building input files were identical to the small office and retail store utilized in ASHRAE Research Project (RP) 1254 (Witte 2006) and the Washington DC and Miami locations were a subset of the weather data cities used in that ASHRAE RP-1254, as well. The 4 non-desiccant dehumidifier augmented systems utilized the same
EnergyPlusTM models as the ASHRAE research project too, but several assumptions regarding their performance (ARI COP, part load efficiency curve coefficients, fan efficiency, etc.) were different. For those readers contrasting performance results with ASHRAE 1254-RP for the common systems/building/cities, the dramatically reduced electric energy consumption levels reported here are due predominately to the much higher overall fan efficiency assumed here (69.3% versus 19.2% in RP-1254) and the resulting lower W/cfm fan energy requirements (after accounting for different pressure drop assumptions as well). The low overall fan efficiency used in ASHRAE 1254-RP is an unfortunate artifact of the earlier, dated phases of the research that was prescribed for use in later research phases.
All buildings were held to a 75 oF (23.9 oC) dry bulb temperature setpoint while occupied. All systems, except the DX system, were also controlled to maintain 50% RH nominally. Two advanced modeling features in EnergyPlusTM (and not found in preceding simulation tools such as DOE 2.1E) complicate the control process efforts to maintain the target humidity levels. EnergyPlusTM models building capacitance effects. Moisture levels may rise in building materials and furnishings, especially during unoccupied hours. The moisture capacitance of these building elements can be 10 to 25 times that of the air in the building (EPA 2001) and moisture exchange can significantly delay regaining humidity control. EnergyPlusTM also models the latent capacity degradation effect for a cooling coil at part-load conditions. In nearly all commercial buildings, when the system compressor cycles off, the supply air fan continues to operate to provide the outdoor air ventilation requirements prescribed by ASHRAE Standard 62. Moisture condensed previously on the cooling coil (and water in the drain pan) will evaporate back into the supply airstream degrading latent cooling performance (Shirey 2004). This degradation is most significant with a single-stage cooling coil, however some degradation also occurs with modulated and staged cooling systems as well.
The DX coil model used in the DX and DX&CR systems was 2 stage with 60% of the total capacity in the 1st stage. Due to current system model limitations, the 2 stage operation had to be emulated by a 1 stage DX coil model in the HX-DX, DD-DX, and DX&DD systems. Additional control algorithms were also introduced for the DD-DX and DX&DD systems to dictate DD operation (rotation). Neither
ESL-HH-06-07-41
Proceedings of the Fifteenth Symposium on Improving Building Systems in Hot and Humid Climates, Orlando, FL, July 24-26, 2006

of these systems was equipped with a bypass damper for the DD.
All system capacities were sized consistently with ASHRAE RP-1254 using the ASHRAE 0.4% design dry temperature condition for the given weather data city. The DX coil cooling capacity and air flow rates remained unchanged from the ASHRAE RP-1254 values for the DX and DX&CR systems. However, two further modifications were made for the HX-DX system. The latent degradation model was adjusted to emulate a 2-stage cooling coil instead of a 1-stage coil (ASHRAE RP-1254). Also per Table 3A and 3B, the capacity of the DX coil and the volumetric airflow rate were adjusted (retaining the cfm/ton ratio) to match the runtime fraction count of unity (# hours at 100% on-time/hour) for the DX cooling coil in the HX-DX system to the runtime fraction count of unity for the DX coil in the DD-DX system. The same procedure was also repeated for the DX&DD simulation runs, where the coil capacity and volumetric flow rate were adjusted iteratively (cfm/ton = constant) to match the runtime fraction count of unity of the DX cooling coil for the DX&DD with the runtime fraction count of unity of the DX cooling coil for the DD-DX system for each city and building type. The DX&DD system also includes the adjustment to the EnergyPlus latent degradation model to emulate a 2-stage cooling coil. All this sizing manipulation was done to ensure that the performance of all the systems could be compared more directly with each other.
The desiccant dehumidifier performance for the DD-DX and DX&DD systems was modeled based on a set of steady-state performance data tables and curve fits generated by a detailed UIC finite difference desiccant dehumidifier simulation over large range of psychrometric conditions. Part-load performance was modeled by simply adjusting the full-load performance of the integrated cooling system by the DX cooling coil part-load ratio. Again, the DX cooling coil performance information (ARI COP, part load efficiency curve coefficients, fan efficiency, etc.) were the same as the other systems. However, fan pressure drop was modified as shown in Table 2 for the higher pressure drop desiccant dehumidifier components. Humidity control for the DD-DX and DX&DD systems was modeled as follows: if the zone RH was above 50% during the previous simulation time step, then the desiccant rotor was locked on during the current simulation time step, while compressor runtime was established to meet the thermostat cooling set-point temperature.
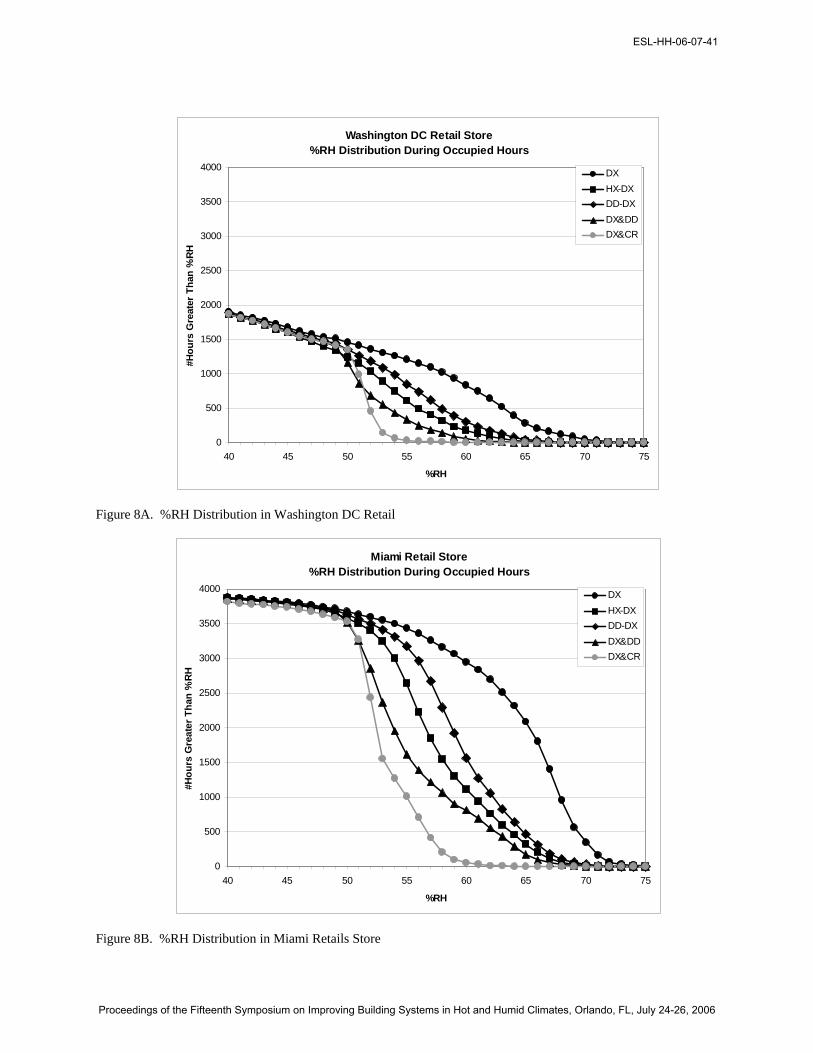
For enhanced dehumidification systems to even be considered in an application, inadequacies of conventional DX system humidity control must be evident. Figures 7A/7B and 8A/8B show the building %RH distribution (at the nominal 75 oF dry bulb temperature setpoint) during occupied hours for the small office building (3540 occupied hours) and retail store (3905 occupied hours), respectively, in Washington DC/Miami climates. Two major factors drive the shape of the %RH profiles for the DX system: climate and %OA. First, climate influences are pronounced as seen by the dramatic increase in hours over 50%RH for the conventional DX system in the pervasive high outdoor humidity levels of the Miami climate versus the Washington DC climate over the course of a weather year. Second, the %OA is higher in the retail store (38 to 45%) versus office building (16 to 20%) application and results in more hours at higher %RH levels for the higher %OA building type. A conventional system with only a DX coil controlled by a thermostat cannot provide the lower SHR necessary to meet the moisture laden ventilation air loads in more humid climates, especially in buildings with higher %OA requirements.
The DX&CR system adds a condenser reheat coil downstream of the DX coil to false load the cooling process with sensible heat that allows longer runtimes to better satisfy the dehumidification requirement called for by the 50%RH setpoint of the “de”humidistat, as shown in Figures 7A/7B and 8A/8B. The other 3 enhanced dehumidification systems provide varying degrees of improved dehumidification over the DX system. The static heat pipe with no active tilt/other control yields a fixed heat exchange effectiveness in the HX-DX system that can overdry a building in less humid climates or lower %OA buildings as shown in Figures 7A/7B. The DD-DX and DX&DD systems both have controls that turn off the desiccant dehumidifier (stop rotation of the rotor) which preclude the overdrying. The DX&DD with its independently operating desiccant dehumidifier downstream of the cooling coil, shows the resulting %RH performance closest to that of the “brute force” cool and reheat approach of the DX&CR system. However, it is clear that the HX-DX, DD-DX, and DX&DD systems all still show the need for optimization of component capacity and control as illustrated by the hours where their resulting %RH exceeds the DX&CR system.
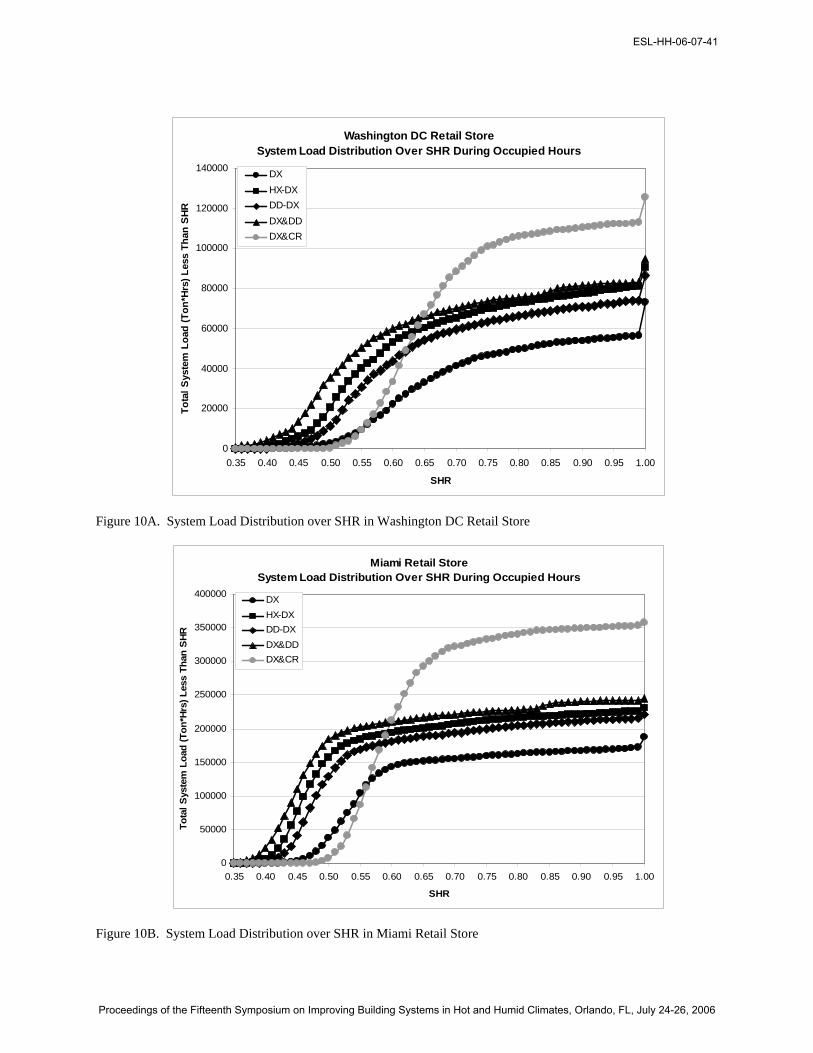
Figures 9A/9B and 10A/10B show the system load distribution over SHR for the small office
ESL-HH-06-07-41
Proceedings of the Fifteenth Symposium on Improving Building Systems in Hot and Humid Climates, Orlando, FL, July 24-26, 2006

Table 2. System Fan and Pressure Drop Data
System Nominal Supply Flow (CFM/ton)
Fan Efficiency
(%)
Motor Efficiency
(%)
Total Fan Efficiency
(%)
Pressure Drop (inches water)
Supply Regen DX 350 77.0 90.0 69.3 1.470
HX-DX 350 77.0 90.0 69.3 2.143 DD-DX 350 77.0 90.0 69.3 2.370 DX&DD 350 77.0 90.0 69.3 2.295 0.825 DX-CR 350 77.0 90.0 69.3 1.470
Table 3A. System Data for Small Office Building
Washington DC: Occupied Hours: 3540 System Zone: 6599.78 sq. ft. System Outside Air: 561.08 cfm System System
Capacity (tons)
Supply Airflow
(cfm)
System Airflow Rate
(cfm/ton)
Supply Fan Power
(W/cfm)
Nominal Supply Fan
Power (W/ton)
System Outside Air Fraction of Supply Air (%)
DX 9.04 3211.22 355.42 0.25 87.7 17.47% HX-DX 10.99 3902.98 355.14 0.36 127.81 14.38% DD-DX 9.22 3277.52 355.43 0.4 141.48 17.12% DX&DD 8.36 2966.43 354.86 0.39 136.76 18.91% DX-CR 9.04 3211.22 355.42 0.25 87.7 17.47% Miami: Occupied Hours: 3540 System Zone: 6599.78 sq. ft. System Outside Air: 561.08 cfm System System
Capacity (tons)
Supply Airflow
(cfm)
System Airflow Rate
(cfm/ton)
Supply Fan Power
(W/cfm)
Nominal Supply Fan
Power (W/ton)
System Outside Air Fraction of Supply Air (%)
DX 8.63 3068.04 355.43 0.25 87.77 18.29% HX-DX 9.82 3485.56 355.12 0.36 127.74 16.10% DD-DX 8.81 3131.39 355.43 0.4 141.46 17.92% DX&DD 7.82 2777.85 355.26 0.39 136.91 20.20% DX-CR 8.63 3068.04 355.43 0.25 87.77 18.29% Table 3B. System Data for Retail Store
Washington DC: Occupied Hours: 3905 System Zone: 78997.43 sq. ft. System Outside Air: 18325.33 cfm System System
Capacity (tons)
Supply Airflow
(cfm)
System Airflow Rate
(cfm/ton)
Supply Fan Power
(W/cfm)
Nominal Supply Fan
Power (W/ton)
System Outside Air Fraction of Supply Air (%)
DX 117.71 41836.49 355.43 0.25 87.75 43.80% HX-DX 133.64 47505.29 355.48 0.36 127.93 38.58% DD-DX 120.14 42700.25 355.43 0.4 141.45 42.92% DX&DD 127.24 45195.71 355.20 0.39 136.9 40.55% DX-CR 117.71 41836.49 355.43 0.25 87.75 43.80% Miami: Occupied Hours: 3905 System Zone: 78997.43 sq. ft. System Outside Air: 18325.33 cfm System System
Capacity (tons)
Supply Airflow
(cfm)
System Airflow Rate
(cfm/ton)
Supply Fan Power
(W/cfm)
Nominal Supply Fan
Power (W/ton)
System Outside Air Fraction of Supply Air (%)
DX 114.45 40680.08 355.43 0.25 87.76 45.05% HX-DX 130.79 46492.47 355.47 0.36 127.93 39.32% DD-DX 116.82 41519.97 355.43 0.4 141.45 44.14% DX&DD 133.35 47505.29 356.24 0.39 137.3 38.57% DX-CR 114.45 40680.08 355.43 0.25 87.76 45.05%
ESL-HH-06-07-41
Proceedings of the Fifteenth Symposium on Improving Building Systems in Hot and Humid Climates, Orlando, FL, July 24-26, 2006
Washington DC Small Office Building%RH Distribution During Occupied Hours
0
500
1000
1500
2000
2500
3000
3500
4000
40 45 50 55 60 65 70 75
%RH
#Ho
urs
Gre
ater
Th
an %
RH
DXHX-DXDD-DXDX&DDDX&CR
Figure 7A. %RH Distribution in Washington DC Small Office Building
Miami Small Office Building%RH Distribution During Occupied Hours
0
500
1000
1500
2000
2500
3000
3500
4000
40 45 50 55 60 65 70 75
%RH
#Ho
urs
Gre
ater
Th
an %
RH
DXHX-DXDD-DXDX&DDDX&CR
Figure 7B. %RH Distribution in Miami Small Office Building
ESL-HH-06-07-41
Proceedings of the Fifteenth Symposium on Improving Building Systems in Hot and Humid Climates, Orlando, FL, July 24-26, 2006
Washington DC Retail Store%RH Distribution During Occupied Hours
0
500
1000
1500
2000
2500
3000
3500
4000
40 45 50 55 60 65 70 75
%RH
#Ho
urs
Gre
ater
Th
an %
RH
DXHX-DXDD-DXDX&DDDX&CR
Figure 8A. %RH Distribution in Washington DC Retail
Miami Retail Store%RH Distribution During Occupied Hours
0
500
1000
1500
2000
2500
3000
3500
4000
40 45 50 55 60 65 70 75
%RH
#Ho
urs
Gre
ater
Th
an %
RH
DXHX-DXDD-DXDX&DDDX&CR
Figure 8B. %RH Distribution in Miami Retails Store
ESL-HH-06-07-41
Proceedings of the Fifteenth Symposium on Improving Building Systems in Hot and Humid Climates, Orlando, FL, July 24-26, 2006

Washington DC Small Office Building
System Load Distribution Over SHR During Occupied Hours
0
1000
2000
3000
4000
5000
6000
7000
8000
0.45 0.50 0.55 0.60 0.65 0.70 0.75 0.80 0.85 0.90 0.95 1.00
SHR
To
tal
Sys
tem
Lo
ad (
To
n*H
rs)
Les
s T
han
SH
R
DXHX-DXDD-DXDX&DDDX&CR
Figure 9A. System Load Distribution over SHR in Washington DC Small Office Building
Miami Small Office BuildingSystem Load Distribution Over SHR During Occupied Hours
0
2000
4000
6000
8000
10000
12000
14000
16000
0.45 0.50 0.55 0.60 0.65 0.70 0.75 0.80 0.85 0.90 0.95 1.00
SHR
To
tal
Sys
tem
Lo
ad (
To
n*H
rs)
Les
s T
han
SH
R
DXHX-DXDD-DXDX&DDDX&CR
Figure 9B. System Load Distribution over SHR in Miami Small Office Building
ESL-HH-06-07-41
Proceedings of the Fifteenth Symposium on Improving Building Systems in Hot and Humid Climates, Orlando, FL, July 24-26, 2006
Washington DC Retail StoreSystem Load Distribution Over SHR During Occupied Hours
0
20000
40000
60000
80000
100000
120000
140000
0.35 0.40 0.45 0.50 0.55 0.60 0.65 0.70 0.75 0.80 0.85 0.90 0.95 1.00
SHR
To
tal
Sys
tem
Lo
ad (
To
n*H
rs)
Les
s T
han
SH
RDXHX-DXDD-DXDX&DDDX&CR
Figure 10A. System Load Distribution over SHR in Washington DC Retail Store
Miami Retail StoreSystem Load Distribution Over SHR During Occupied Hours
0
50000
100000
150000
200000
250000
300000
350000
400000
0.35 0.40 0.45 0.50 0.55 0.60 0.65 0.70 0.75 0.80 0.85 0.90 0.95 1.00
SHR
To
tal
Sys
tem
Lo
ad (
To
n*H
rs)
Les
s T
han
SH
R
DXHX-DXDD-DXDX&DDDX&CR
Figure 10B. System Load Distribution over SHR in Miami Retail Store
ESL-HH-06-07-41
Proceedings of the Fifteenth Symposium on Improving Building Systems in Hot and Humid Climates, Orlando, FL, July 24-26, 2006
Small Office Building -- Miami
0
2,000
4,000
6,000
8,000
10,000
12,000
14,000
16,000
18,000
DX HX-DX DD-DX DX&DD DX&CRSyst em T ype
Latent Load
Sensible Load
Small Office Building -- Washington DC
0
2,000
4,000
6,000
8,000
10,000
12,000
14,000
16,000
18,000
DX HX-DX DD-DX DX&DD DX&CRSyst em T ype
Latent Load
Sensible Load
Retail Store -- Miami
0
50,000
100,000
150,000
200,000
250,000
300,000
350,000
400,000
DX HX-DX DD-DX DX&DD DX&CRSyst em T ype
Latent Load
Sensible Load
Retail Store -- Washington DC
0
50,000
100,000
150,000
200,000
250,000
300,000
350,000
400,000
DX HX-DX DD-DX DX&DD DX&CRSyst em Type
Latent Load
Sensible Load
Figure 11. System Cooling Load Summary Comparison with Sensible and Latent Load Breakdown
ESL-HH-06-07-41
Proceedings of the Fifteenth Symposium on Improving Building Systems in Hot and Humid Climates, Orlando, FL, July 24-26, 2006

Small Office Building -- Miami
0
2,000
4,000
6,000
8,000
10,000
12,000
14,000
16,000
18,000
20,000
DX HX-DX DD-DX DX&DD DX&CR
S y st e m Ty pe
Supply Fan
Condensing Unit
Small Office Building -- Washington DC
0
2,000
4,000
6,000
8,000
10,000
12,000
14,000
16,000
18,000
20,000
DX HX-DX DD-DX DX&DD DX&CR
S y st e m Ty pe
Supply Fan
Condensing Unit
Retail Store -- Miami
0
50,000
100,000
150,000
200,000
250,000
300,000
350,000
400,000
DX HX-DX DD-DX DX&DD DX&CR
S y st e m Ty pe
Supply Fan
Condensing Unit
Retail Store -- Washington DC
0
50,000
100,000
150,000
200,000
250,000
300,000
350,000
400,000
DX HX-DX DD-DX DX&DD DX&CR
S y st e m Ty pe
Supply Fan
Condensing Unit
Figure 12. System Electricity Usage Summary Comparison with Supply Fan and Condensing Unit Breakdown
ESL-HH-06-07-41
Proceedings of the Fifteenth Symposium on Improving Building Systems in Hot and Humid Climates, Orlando, FL, July 24-26, 2006

building and retail store, respectively, in Washington DC/Miami climates. In these plots the resulting improvement in %RH control seen in Figures 7A/7B and 8A/8B manifests itself as additional system load at lower SHR, as well as greater system loads overall, versus the conventional DX system. The one exception to note in this general trend is the DX&CR system. As noted before, the DX&CR system achieves its improvements in %RH control by false loading the DX coil with sensible heat thus dramatically increasing its system loading at higher SHR levels. The HX-DX, DD-DX, and DX&DD systems all achieve better %RH control by actively removing more moisture in their system cooling processes than the conventional DX system (refer back to Figures 1A and 1B).
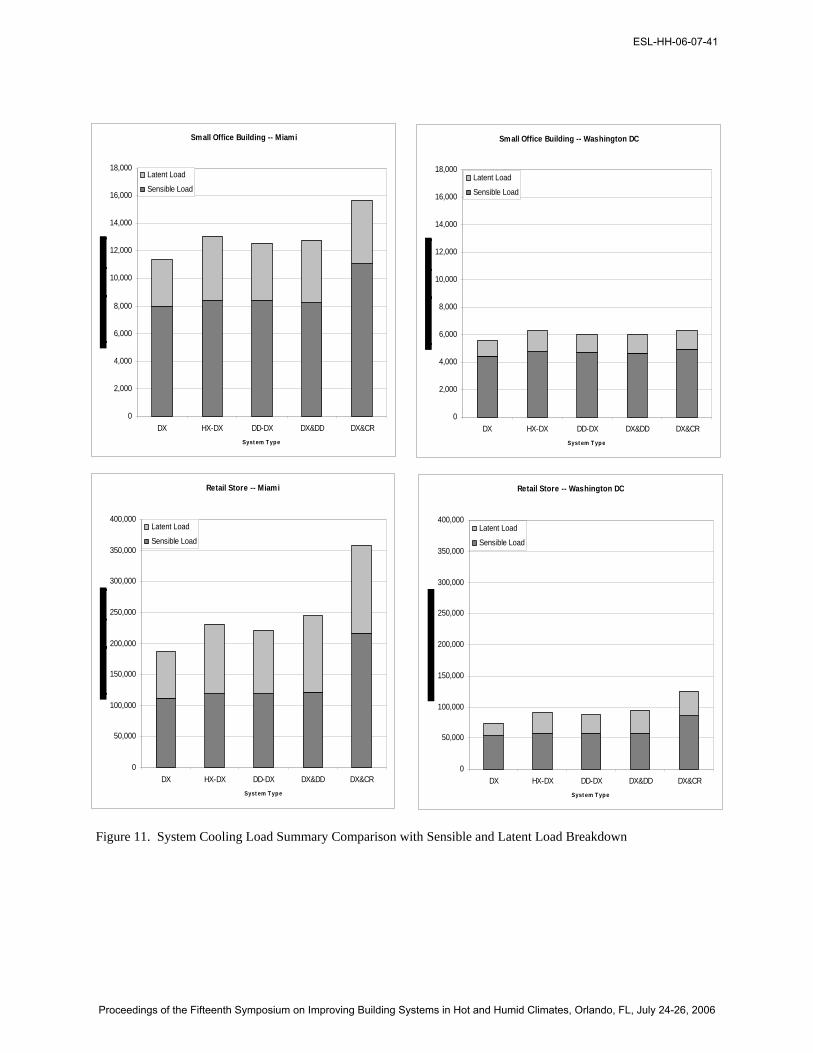
Figure 11 breaks down those total system loads by latent and sensible loads (in ton-hrs). Here the advantage of the HX-DX, DD-DX, and DX&DD systems over the “brute force” cool and reheat approach of the DX&CR system becomes clear. In all but the less humid, lower %OA application (small office building in Washington DC), there is a significant increase in sensible load associated with the DX&CR system operation.
However, ultimately it is system energy consumption that determines preferred operating approaches to improved dehumidification. In Figure 12, a breakdown of the system energy consumption (in kWh) by supply fan and condensing unit (compressor and condenser fan) is provided. Note that the supply fan energy consumption is for continuous operation, essentially during occupied hours for the entire year. Here, the increased pressure drops of the added components in the HX-DX, DD-DX, and DX&DD systems and the resulting increases in supply fan power exceed the savings in condensing unit operation versus the DX&CR, except in the higher OA% building applications and more humid locations (Miami Retail store). Note as in ASHRAE RP-1254, no pressure drop or additional fan power was imposed on those systems with condenser heat reclaim coils – in the DX&CR and DX&DD (separate desiccant regeneration air stream) systems.
CONCLUSIONS Augmenting a conventional single path, mixed
air DX cooling coil with enhanced dehumidification components can substantially increase an integrated system’s moisture removal capacity resulting in a lower SHR that can better match higher latent loading applications. The enhanced dehumidification
components evaluated were a wraparound heat pipe heat exchanger, a desiccant dehumidifier also in a "wraparound" configuration, and a post coil desiccant dehumidifier regenerated by condenser waste heat. Based on a state point performance analysis, these integrated systems provided the ability to reduce typical SHR levels for packaged, “off the shelf” DX only systems at ARI rating conditions of 0.75 to below 0.50 in certain enhanced dehumidification systems while limiting losses in COP and capacity. These three alternative systems define a best practices performance which can: 1) approach the high performance of an ideal cooling system that can shift its sensible capacity to latent capacity without an efficiency penalty; and 2) far exceed the poor performance of the simple but less efficient condenser waste heat reheat approach.
Based on EnergyPlusTM annual cooling performance analysis, these enhanced dehumidification systems present challenging decision-making tradeoffs between humidity control improvements over conventional DX systems, condensing (compressor) unit energy consumption reductions versus DX cool and reheat approaches, and fan energy use increases due to the additional component pressure drops. If improved humidity control is required, the application of these enhanced dehumidification systems provide least operating energy approaches in higher OA% building applications and more humid locations. A follow-on phase of this ongoing research will address the prospect of even lower operating energy approaches utilizing dual path DX systems with a dedicated system for OA conditioning coupled with a “separate” secondary DX coil for residual and primarily sensible RA cooling,.
ACKNOWLEDGEMENTS The authors would like to thank the National
Center for Energy Management and Building Technologies (NCEMBT) and the Department of Energy (DOE) for their financial support of this research, as well as the Trane Company and Munters Corporation for their technical assistance during this research.
REFERENCES Amrane, K., G.C. Hourahan, G. Potts. 2003. “Latent Performance of Unitary Equipment.” ASHRAE Journal 45(1): 28-31.
Cromer, C.J. 1988. “Cooling System”, U.S. Patent Office, Patent Number 4,719,761.
ESL-HH-06-07-41
Proceedings of the Fifteenth Symposium on Improving Building Systems in Hot and Humid Climates, Orlando, FL, July 24-26, 2006

Department of Energy. 2005. EnergyPlus Engineering Reference (EnergyPlus Calculations). http://www.eere.energy.gov/buildings/energyplus/documentation.html
Environmental Protection Agency. 2001. Indoor Humidity Assessment Tool (IHAT) Reference. www.epa.gov/iaq/schooldesign/saves.html
Harriman, L.G., D. Plager, D.R. Kosar. 1997. “Dehumidification and Cooling Loads from Ventilation Air.” ASHRAE Journal 39(11): 37-45.
Harriman, L.G., D.G. Colliver, K. Q. Hart. 1999. “New Weather Data for Energy Calculations.” ASHRAE Journal 41(3): 31-38.
Harriman, L.G., J. Judge. 2002. “Dehumidification Equipment Advances.” ASHRAE Journal 44(8): 22-27.
Kosar, D.R., M.J. Witte, D.B. Shirey, R.L. Hedrick. 1998. “Dehumidification Issues of Standard 62-1989.” ASHRAE Journal 40(3): 71-75.
Kosar, D.R. 2006. “Dehumidification System Enhancements.” ASHRAE Journal 48(2): 48-58.
Munters Corporation. 2005. Personal communication
National Center for Energy Management and Building Technologies. 2005A. NCEMBT-050430-5, Task 6: Integrating Advanced Humidity Control to Reduce Energy Use, Quarterly Report, January - March 2005.
National Center for Energy Management and Building Technologies. 2005B. NCEMBT-TBD, Task 6: Integrating Advanced Humidity Control to Reduce Energy Use, Quarterly Report, April - June 2005.
National Center for Energy Management and Building Technologies. 2005C. NCEMBT-TBD, Task 6: Integrating Advanced Humidity Control to Reduce Energy Use, Quarterly Report, July - September 2005.
National Center for Energy Management and Building Technologies. 2006. NCEMBT-TBD, Task 6: Integrating Advanced Humidity Control to Reduce Energy Use, Final Report, April 2006.
Proflute AB. 2005. ProCalc 2.14., Sweden, www.proflute.se .
Shirey III, D.B, Henderson Jr. H. I., 2004. “Dehumidification at Part Load.” ASHRAE Journal 46(4): 42-47.
Trane Company. 2005. Personal communication.
Witte, M.J., R.H. Henninger. 2006. ASHRAE RP-1254 Evaluating the Ability of Unitary Equipment to Maintain Adequate Humidity Levels, Phase II Final Report, http://resourcecenter.ashrae.org/store/ashrae/.
ESL-HH-06-07-41
Proceedings of the Fifteenth Symposium on Improving Building Systems in Hot and Humid Climates, Orlando, FL, July 24-26, 2006