Embed Size (px)
Citation preview
DOT’s Need for an Improved Test Method and Examples of Implementation of Surface Resistivity
Tyson D. Rupnow, Ph.D., P.E.
Associate Director, Research
Louisiana Transportation Research Center
Resistivity Measurements in Concrete April 13, 2016

Outline
Background Need for a new (or at least improved) test
method DOT’s state of the practice Implementation efforts
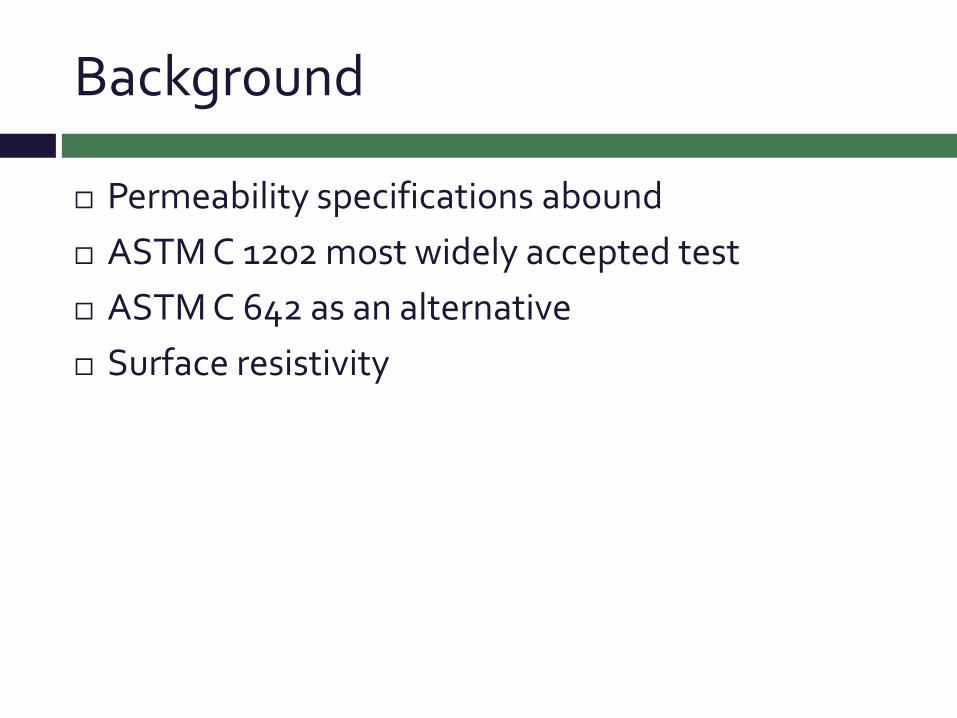
Background
Permeability specifications abound ASTM C 1202 most widely accepted test ASTM C 642 as an alternative Surface resistivity
Background
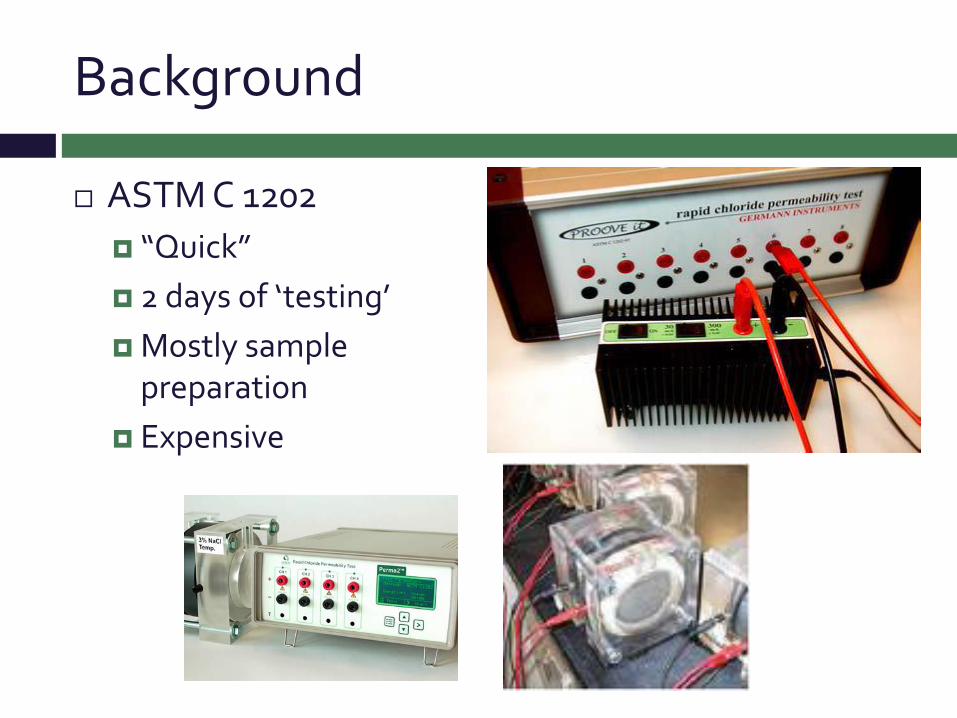
ASTM C 1202 “Quick” 2 days of ‘testing’ Mostly sample
preparation Expensive
Background
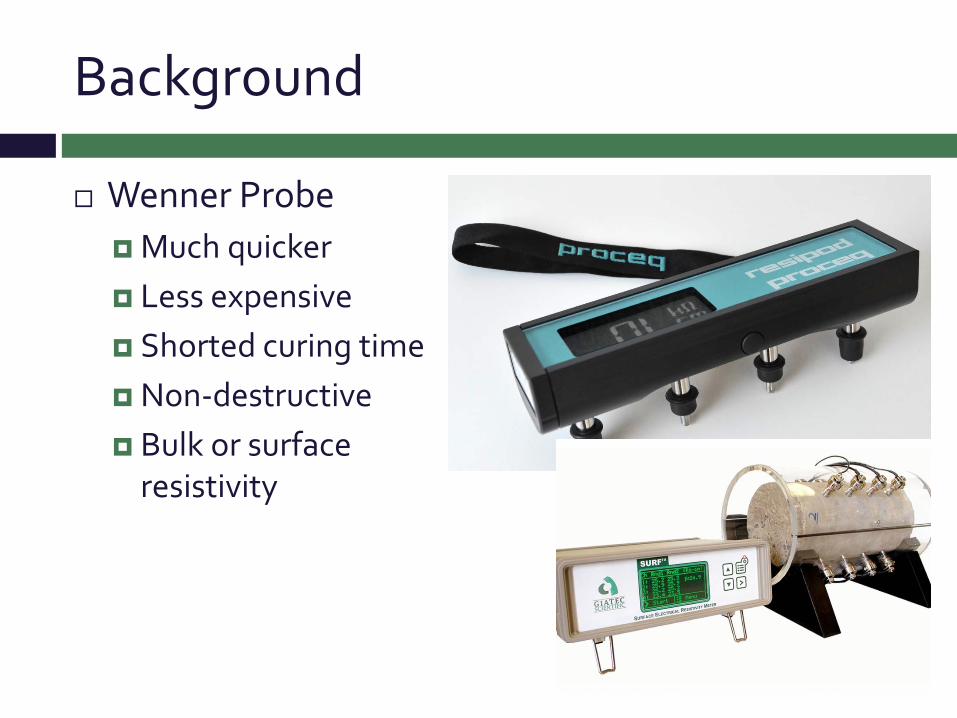
Wenner Probe Much quicker Less expensive Shorted curing time Non-destructive Bulk or surface
resistivity

Why the Need?
Grandpa’s concrete does not cut it anymore Different construction strategies
Get in, get out, stay out is preferred Do more with less. . .
Different winter maintenance strategies New and more aggressive deicer solutions
Ever shrinking budgets Construction and maintenance
DOT State of Practice
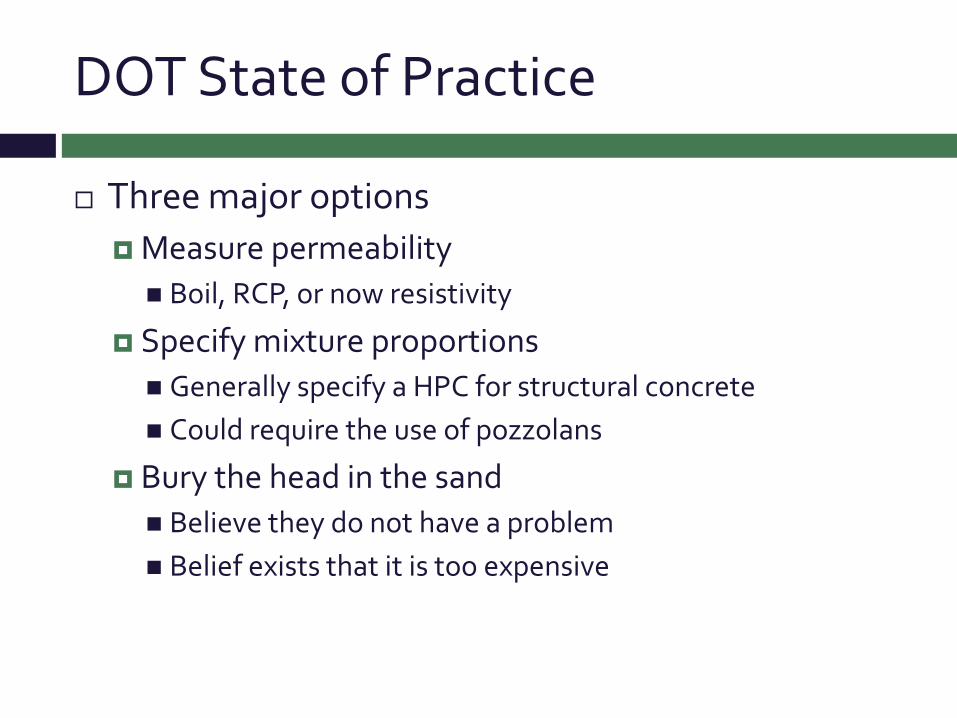
Three major options Measure permeability Boil, RCP, or now resistivity
Specify mixture proportions Generally specify a HPC for structural concrete Could require the use of pozzolans
Bury the head in the sand Believe they do not have a problem Belief exists that it is too expensive
DOT State of Practice
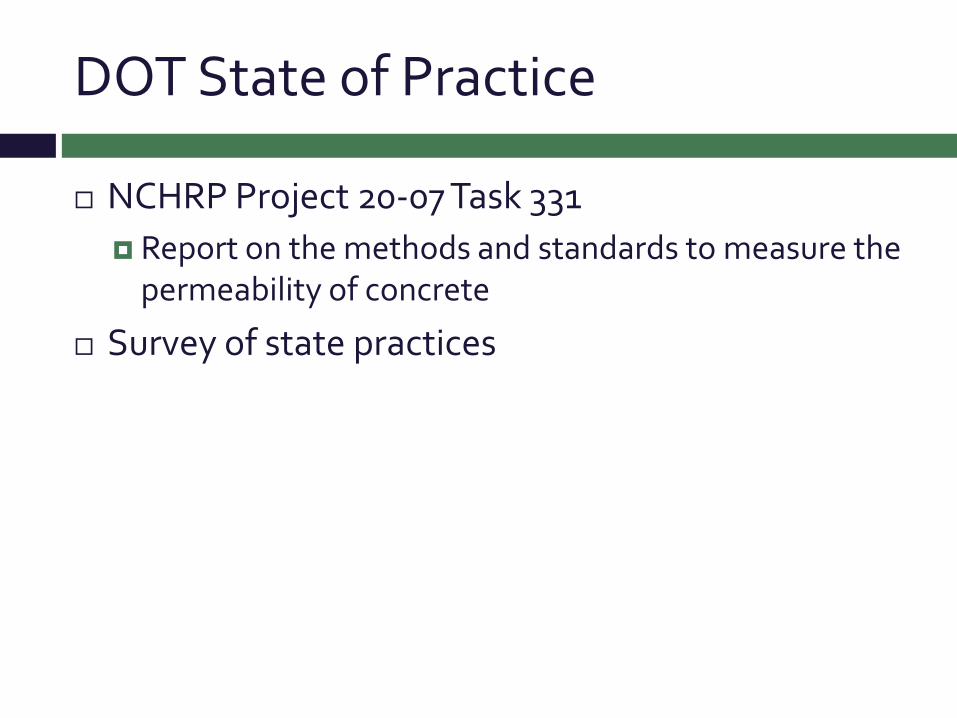
NCHRP Project 20-07 Task 331 Report on the methods and standards to measure the
permeability of concrete
Survey of state practices
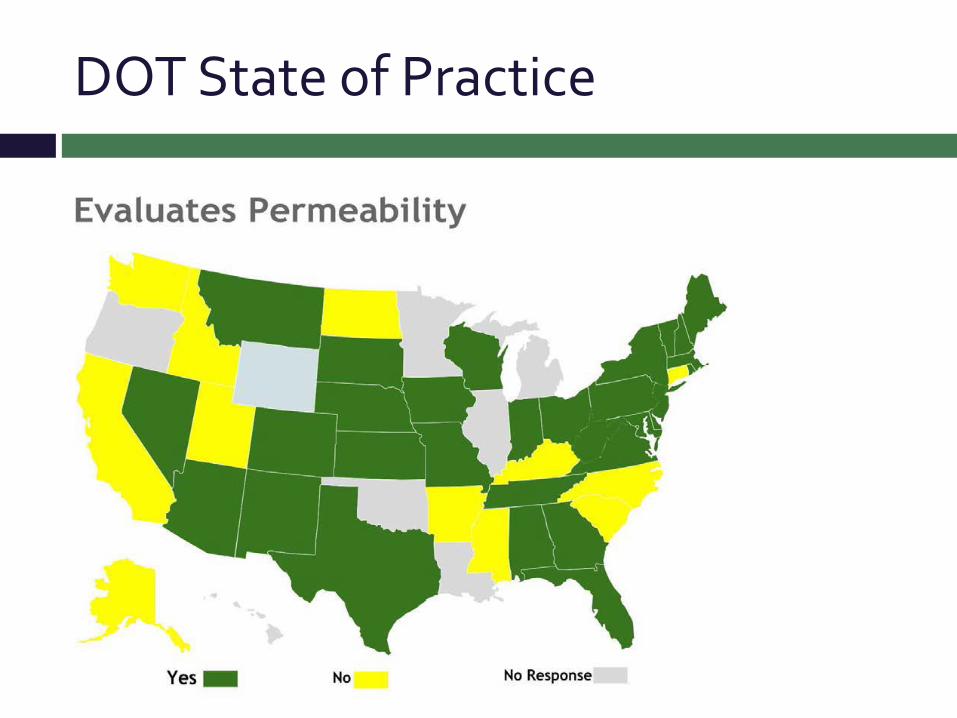
DOT State of Practice
DOT State of Practice
30+ states evaluate permeability 90+ % of those states utilize ion permeability in the
form of RCP, boil, or salt ponding Additionally 50% of those states are either moving to
or using surface or bulk resistivity
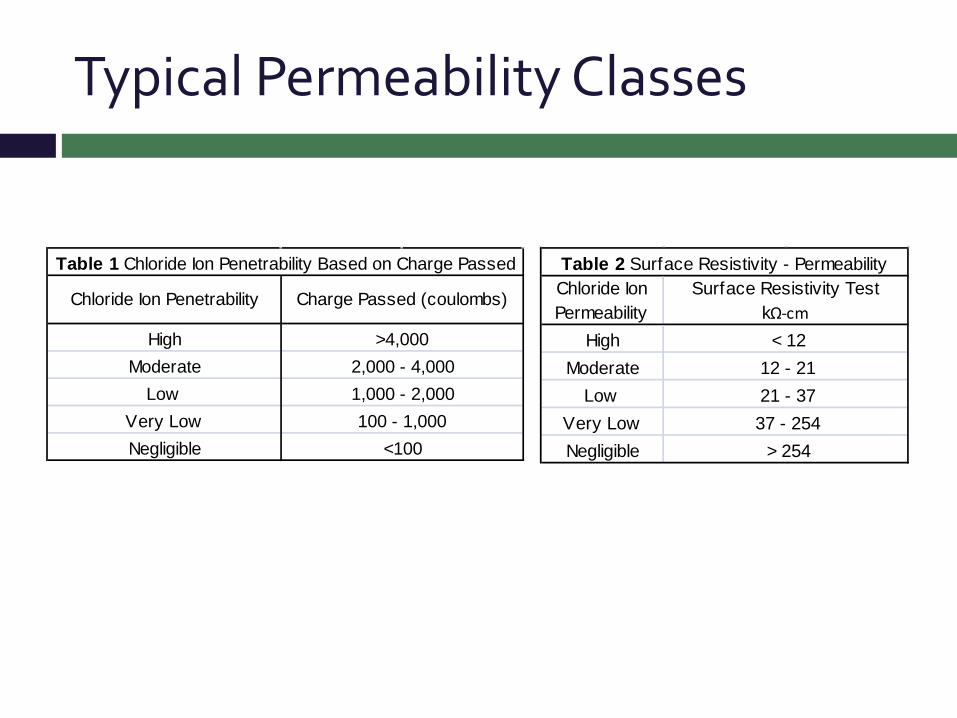
Typical Permeability Classes
Chloride Ion Permeability
HighModerate
LowVery LowNegligible
Table 2 Surface Resistivity - PermeabilitySurface Resistivity Test
kΩ-cm < 12
> 254
12 - 21 21 - 37 37 - 254
Chloride Ion Penetrability
HighModerate
LowVery LowNegligible
Table 1 Chloride Ion Penetrability Based on Charge Passed
Charge Passed (coulombs)
>4,000
<100
2,000 - 4,0001,000 - 2,000100 - 1,000
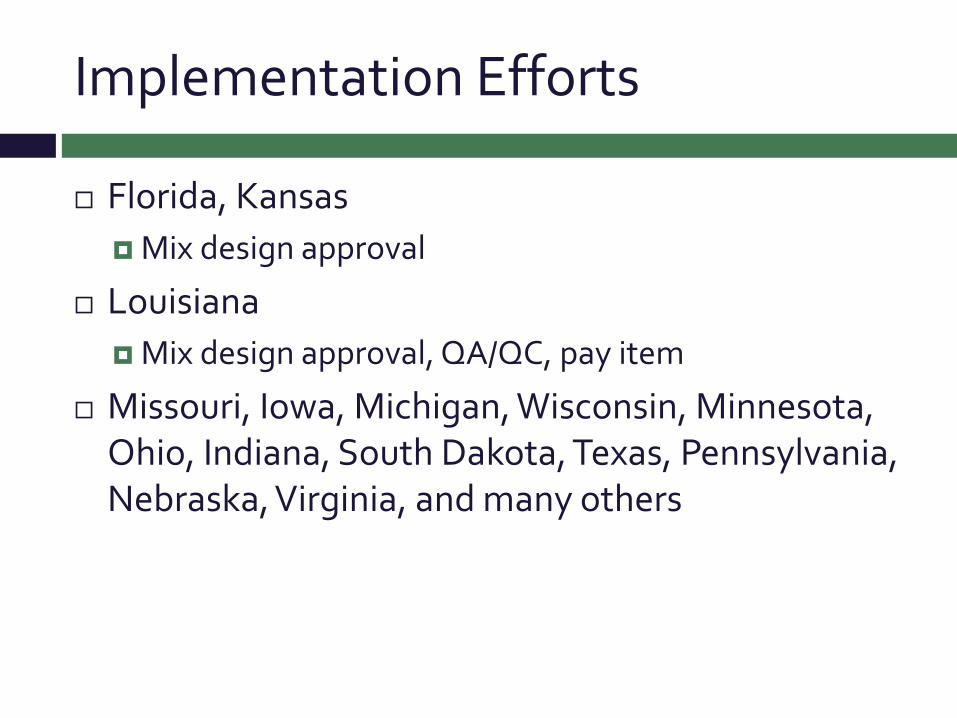
Implementation Efforts
Florida, Kansas Mix design approval
Louisiana Mix design approval, QA/QC, pay item
Missouri, Iowa, Michigan, Wisconsin, Minnesota, Ohio, Indiana, South Dakota, Texas, Pennsylvania, Nebraska, Virginia, and many others
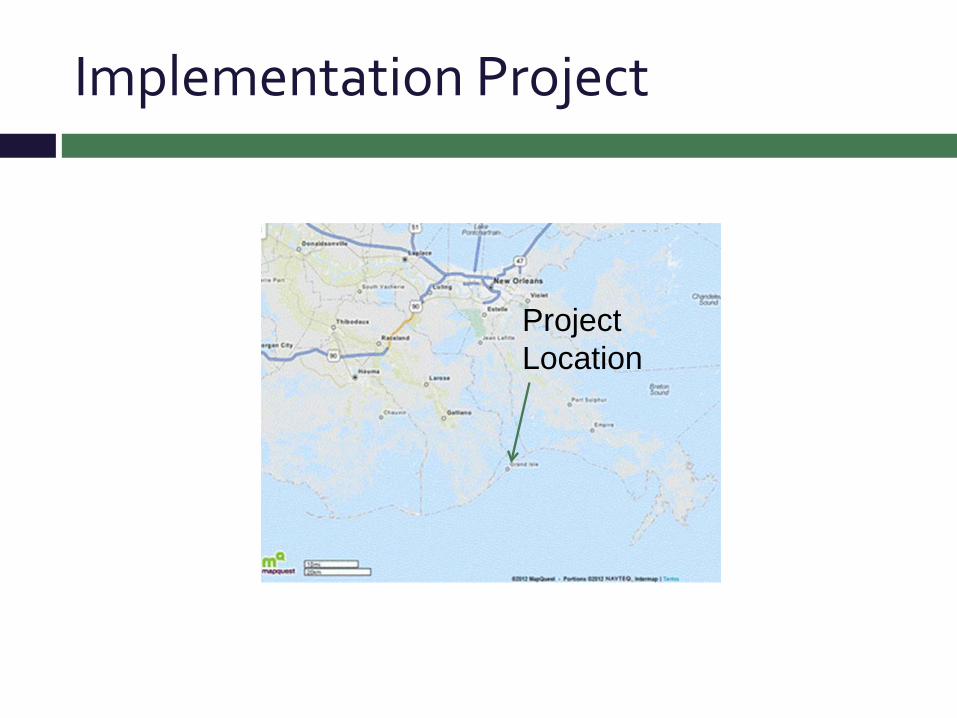
Implementation Project
Project Location
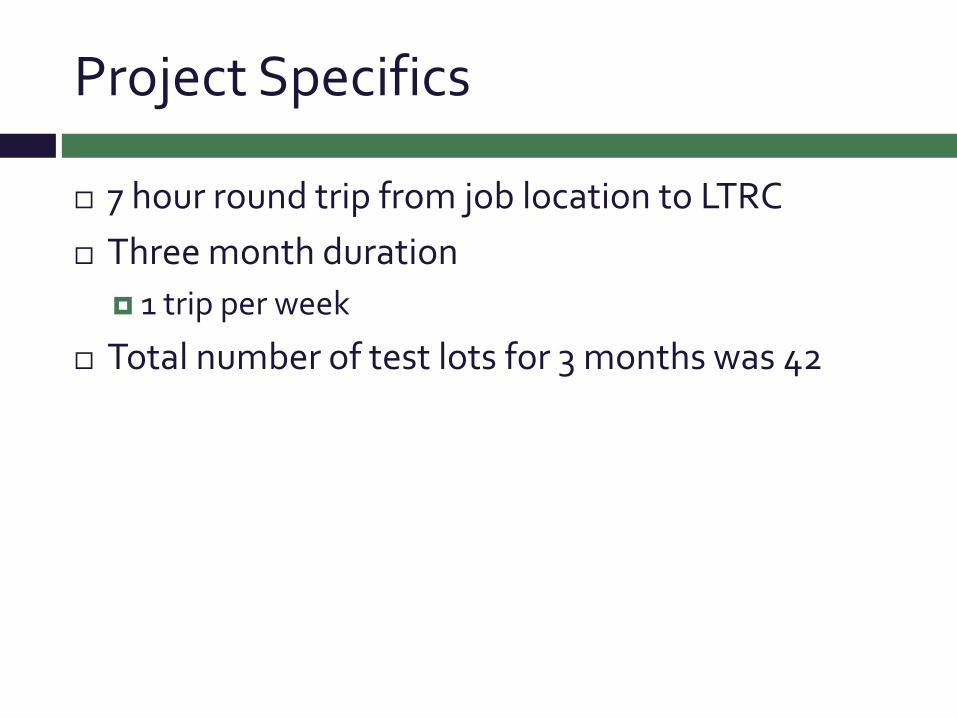
Project Specifics
7 hour round trip from job location to LTRC Three month duration
1 trip per week
Total number of test lots for 3 months was 42

Savings Realized?
Time savings $117 per week for a total of $1,400
Mileage savings @$0.50 per mile and about 140 miles saved per week $70 per week for a total of $840
Testing costs ASTM C1202 - $8,402 DOTD TR233 - $332 Savings - $7,711
TOTAL SAVINGS = $9,951

More Savings!
Saved about $10,000 in first project implementation efforts About $40,000 per year or $160,000 for the life of the
project
Using an average of 50 structures under construction per year by LADOTD @ a conservative savings of $20,000 per year DOTD will save about $1,000,000 in operational costs
per year
Does not include savings from increased service life!
Implementation Effort Fast-Tracked
DOTD TR 233 was developed 1 day training session to educate LADOTD
personnel Included a video and a performance exam
Implementation Lessons Learned
Expect the savings to grow exponentially when bridge design shifts to permeability requirements for all structures
Expect the savings for Contractor QC to be equal to or greater than DOTD Operational savings
Led to a change in future specifications for structures 27 kΩ-cm (4 x 8 in. sample @ 28-days of age)
Summary
DOT’s resources are strained Need for a new or improved method to measure
earlier with more precision Public is more aware of costs, and less tolerant of
closures, repairs, etc.
Summary
Bulk or surface resistivity can meet the DOT needs if implemented properly
Generally the savings in personnel time will offset the cost of the equipment
Savings over the life of the structure considerably increase the cost to benefit ratio
Fully implemented in several states
Acknowledgements
FHWA LADOTD and LTRC Randy Young, Shane Laws, Matt Tircuit Scott Reech, Benjamin Shearer, Jacob Newgard,
Anthony Saladino, Brandon Pitre, and Brennon Hughes, Katie Johnson
Mike Ricca NCHRP Assistance
Cecil Jones, Laura McCauley, Ed Harrigan
Further Information
Training Video Link http://www.ltrc.lsu.edu/videotraining/Resistivity/Resis
tivity.swf
TR Procedure Link http://www.dotd.la.gov/highways/construction/lab/te
stproc/tr_233_final.pdf
Surface Resistivity Standard Test Method Development
TRB Webinar April 13, 2016
!Kenneth A. Snyder
Materials and Structural Systems Division National Institute of Standards and Technology
1
Concrete Surface Resistivity:
Objectives: “understand the…”
• … difference between Resistance & Resistivity
• … difference between surface and bulk concrete measurements
• … minimum information needed to conduct a resistivity measurement
• … factors affecting an accurate resistivity measurements
• … requirements of commercial surface resistivity test equipment
• … status of the ASTM method under development
2
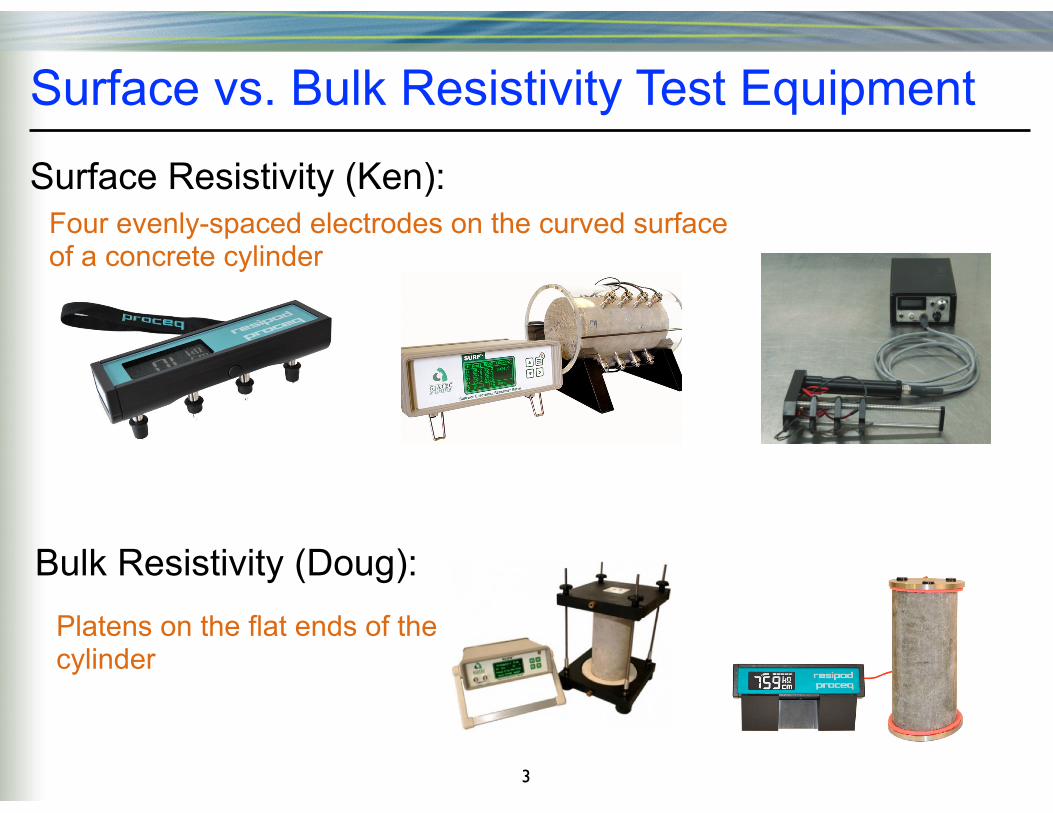
Surface vs. Bulk Resistivity Test Equipment
Surface Resistivity (Ken):
3
Four evenly-spaced electrodes on the curved surface of a concrete cylinder
Bulk Resistivity (Doug):Platens on the flat ends of the cylinder
Resistance vs. Resistivity
Resistance: (Extrinsic Property)• Ratio of voltage (V) to current (I) passing through an object
• Depends on the shape and size of the “resistor”
• Depends upon the geometry of the electrodes applying the voltage
Resistivity: (Intrinsic Property)
• Independent of shape and size of the specimen
• Independent of the electrode geometry - IMPORTANT!
• A given specimen has only one resistivity, regardless of the electrode geometry
4
Analogous to mass (extrinsic) vs. density (intrinsic)
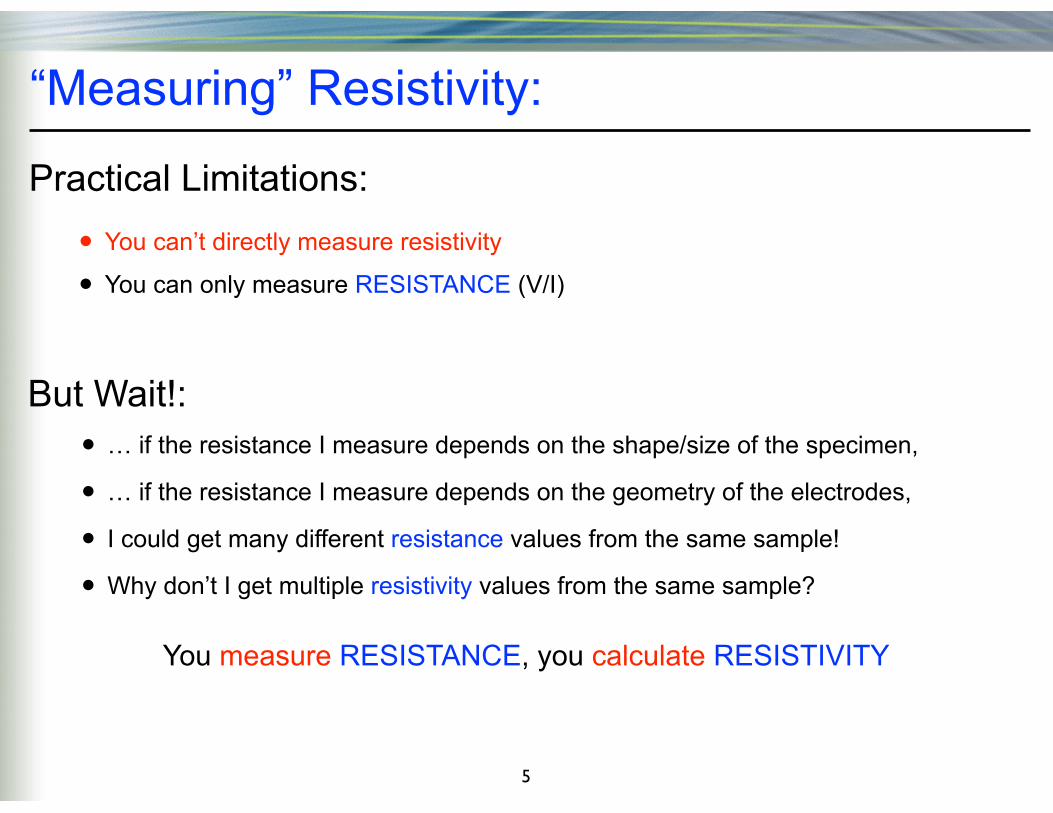
“Measuring” Resistivity:
Practical Limitations:
• You can’t directly measure resistivity
• You can only measure RESISTANCE (V/I)
But Wait!:• … if the resistance I measure depends on the shape/size of the specimen,
• … if the resistance I measure depends on the geometry of the electrodes,
• I could get many different resistance values from the same sample!
• Why don’t I get multiple resistivity values from the same sample?
5
You measure RESISTANCE, you calculate RESISTIVITY
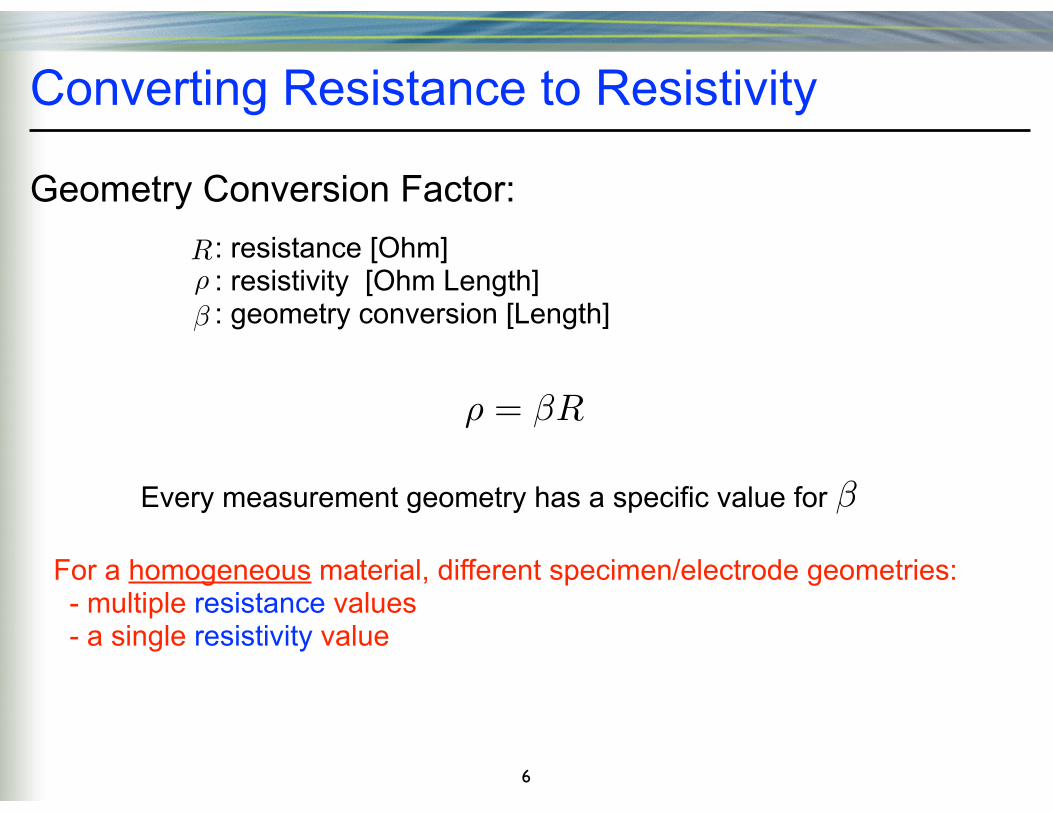
Converting Resistance to Resistivity
Geometry Conversion Factor:
6
: resistance [Ohm] : resistivity [Ohm Length] : geometry conversion [Length]
R
= R
Every measurement geometry has a specific value for
For a homogeneous material, different specimen/electrode geometries: - multiple resistance values - a single resistivity value
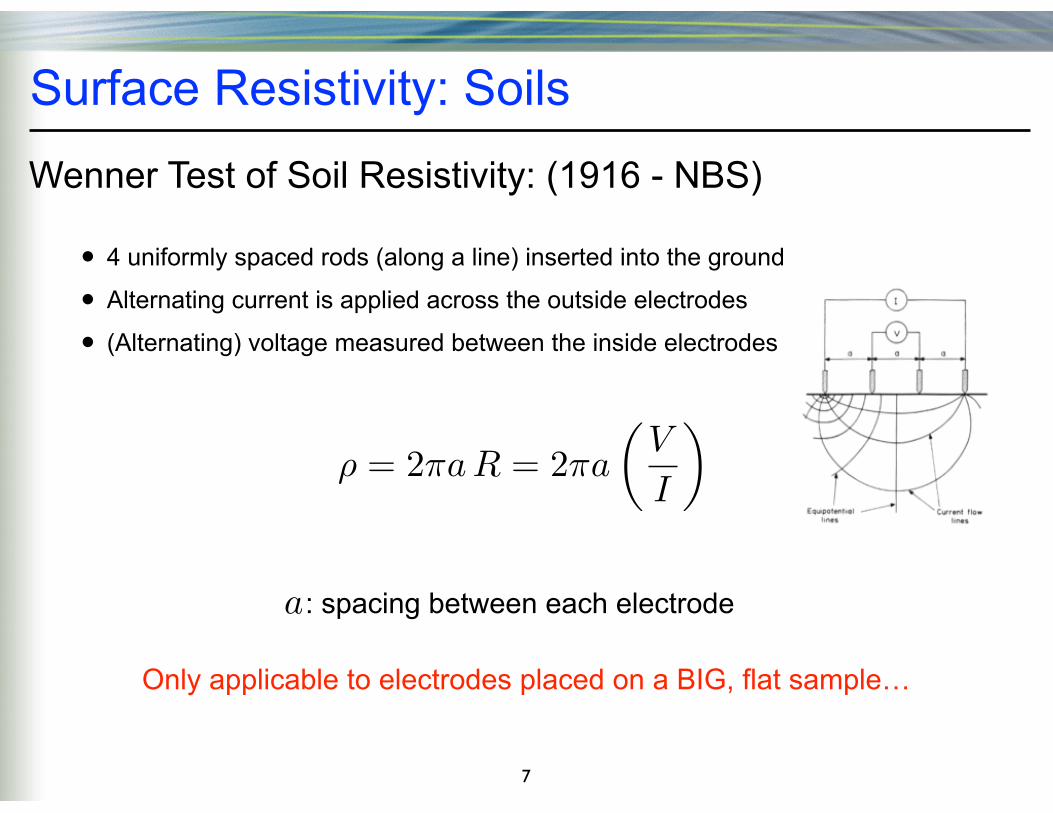
Surface Resistivity: Soils
Wenner Test of Soil Resistivity: (1916 - NBS)
• 4 uniformly spaced rods (along a line) inserted into the ground
• Alternating current is applied across the outside electrodes
• (Alternating) voltage measured between the inside electrodes
7
a: spacing between each electrode
= 2aR = 2a
V
I
Only applicable to electrodes placed on a BIG, flat sample…
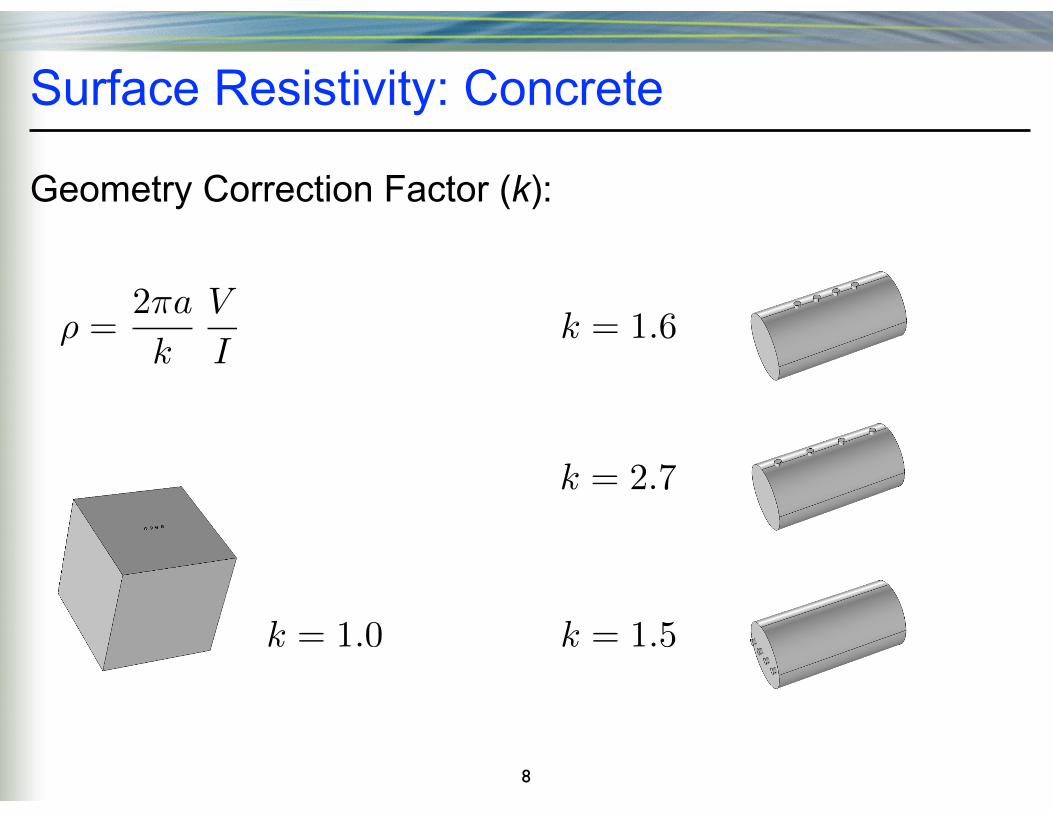
Surface Resistivity: Concrete
Geometry Correction Factor (k):
8
=2a
k
V
Ik = 1.6
k = 2.7
k = 1.5k = 1.0
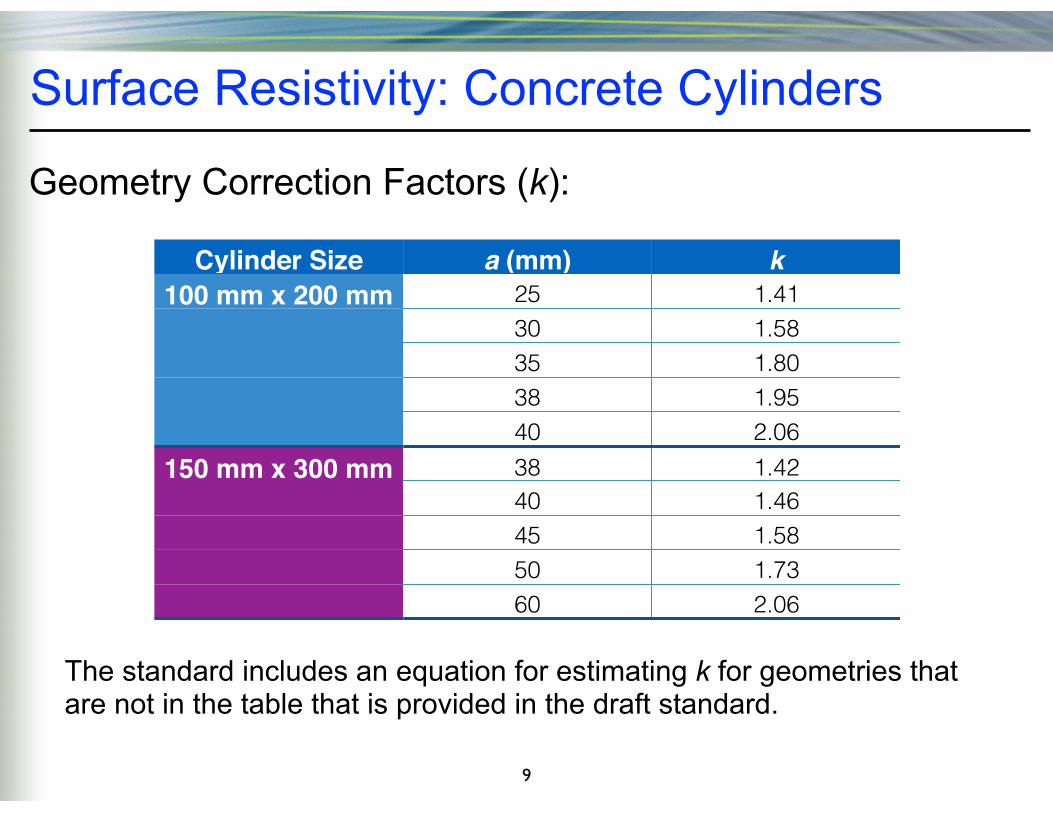
Surface Resistivity: Concrete Cylinders
9
Geometry Correction Factors (k):
Cylinder Size a (mm) k100 mm x 200 mm 25 1.41
30 1.5835 1.8038 1.9540 2.06
150 mm x 300 mm 38 1.4240 1.4645 1.5850 1.7360 2.06
The standard includes an equation for estimating k for geometries that are not in the table that is provided in the draft standard.
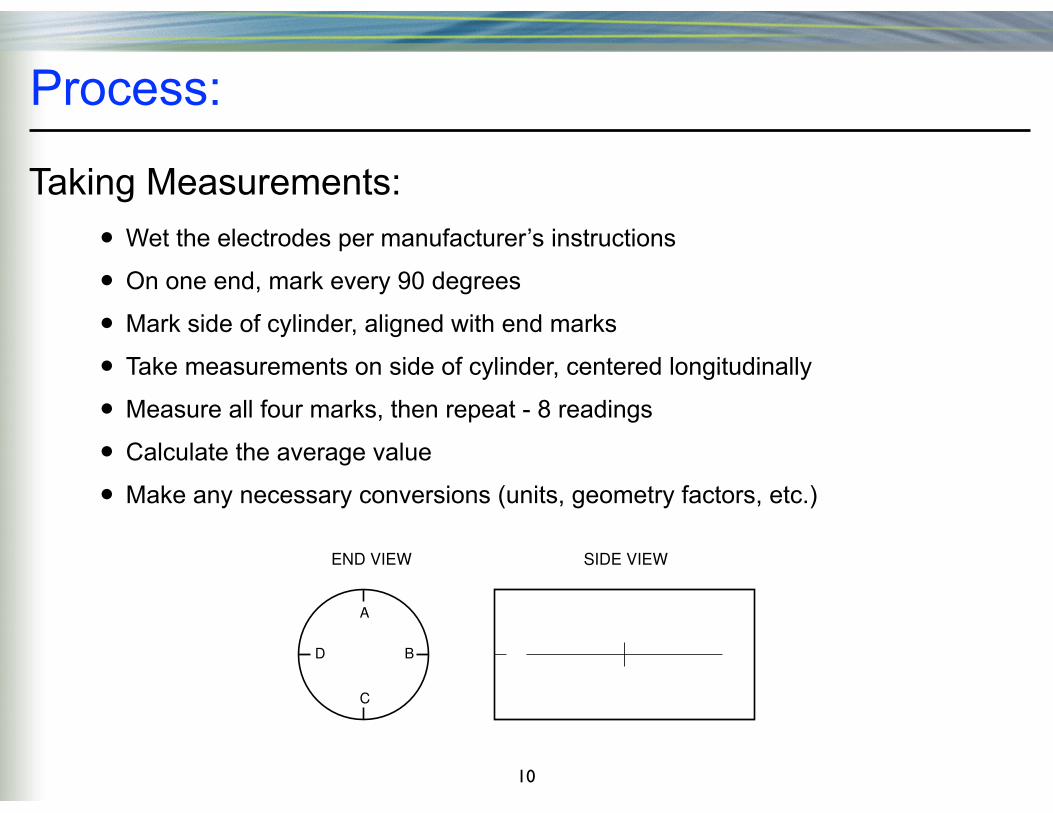
Process:
10
Taking Measurements:
B
END VIEW SIDE VIEW
A
C
D
• Wet the electrodes per manufacturer’s instructions
• On one end, mark every 90 degrees
• Mark side of cylinder, aligned with end marks
• Take measurements on side of cylinder, centered longitudinally
• Measure all four marks, then repeat - 8 readings
• Calculate the average value
• Make any necessary conversions (units, geometry factors, etc.)
Homogeneity:
Homogeneous Specimen:
11
• The surface/bulk methods estimate the same quantity
• The only difference: The geometry conversion factor
Inhomogeneous Specimen:• Source: drying or leaching
• The two methods depend differently on inhomogeneities
• Unless the inhomogeneity is well-characterized:
Each test method will give a different wrong/meaningless result from an inhomogeneous specimen
Commercial Device Requirements:
12
• alternating current - a DC measurement will not work
• minimum electrode spacing: 25 mm - depends on aggregate size
• display resistivity or resistance (to a specified precision)
• operator must be able to determine the device’s geometry factor
The intent is to be as inclusive as possible - no “one” standard device !Requirements:
ASTM Test Method Development
Status of new ASTM test method
13
• No standardized “curing”
• Have a precision and bias statement
• Undergoing C09.66 Subcommittee balloting
!
Additional interested parties are welcome to join C09.66!
Development of Bulk Resistivity Test Methods
R. Doug Hooton, NSERC/CAC Industrial Research Chair in Concrete Durability & Sustainability UNIVERSITY OF TORONTO
DEPT. CIVIL ENGINEERING
TRB Webinar April 13, 2016
With thanks to Ms. Gita Charmchi MASc 2015, and Ms. Ester Karkar, MASc 2013
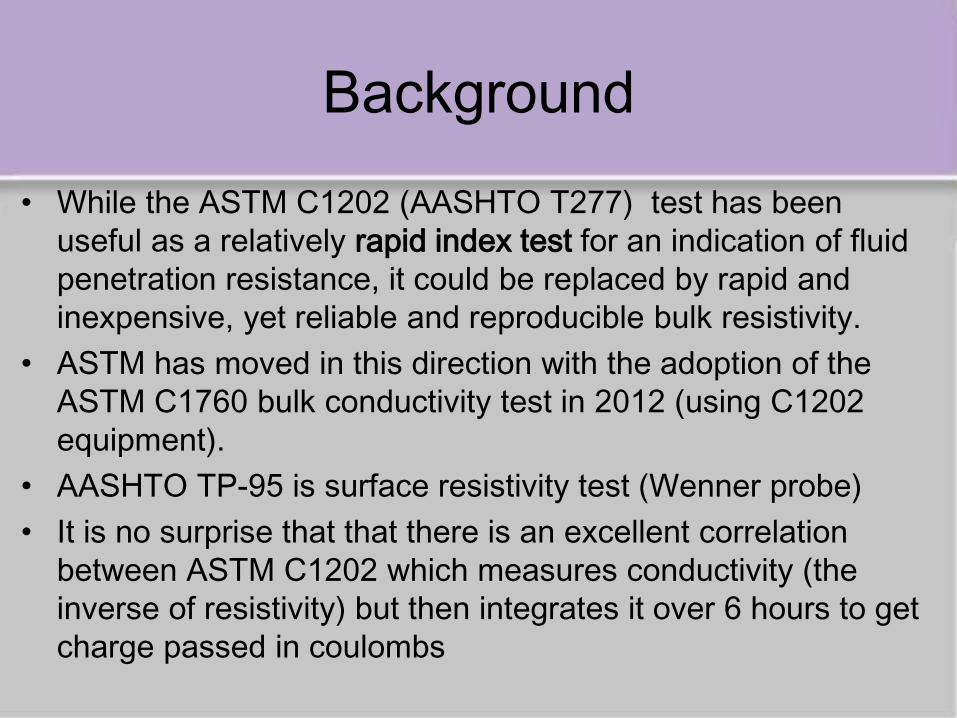
Background • While the ASTM C1202 (AASHTO T277) test has been
useful as a relatively rapid index test for an indication of fluid penetration resistance, it could be replaced by rapid and inexpensive, yet reliable and reproducible bulk resistivity.
• ASTM has moved in this direction with the adoption of the ASTM C1760 bulk conductivity test in 2012 (using C1202 equipment).
• AASHTO TP-95 is surface resistivity test (Wenner probe) • It is no surprise that that there is an excellent correlation
between ASTM C1202 which measures conductivity (the inverse of resistivity) but then integrates it over 6 hours to get charge passed in coulombs
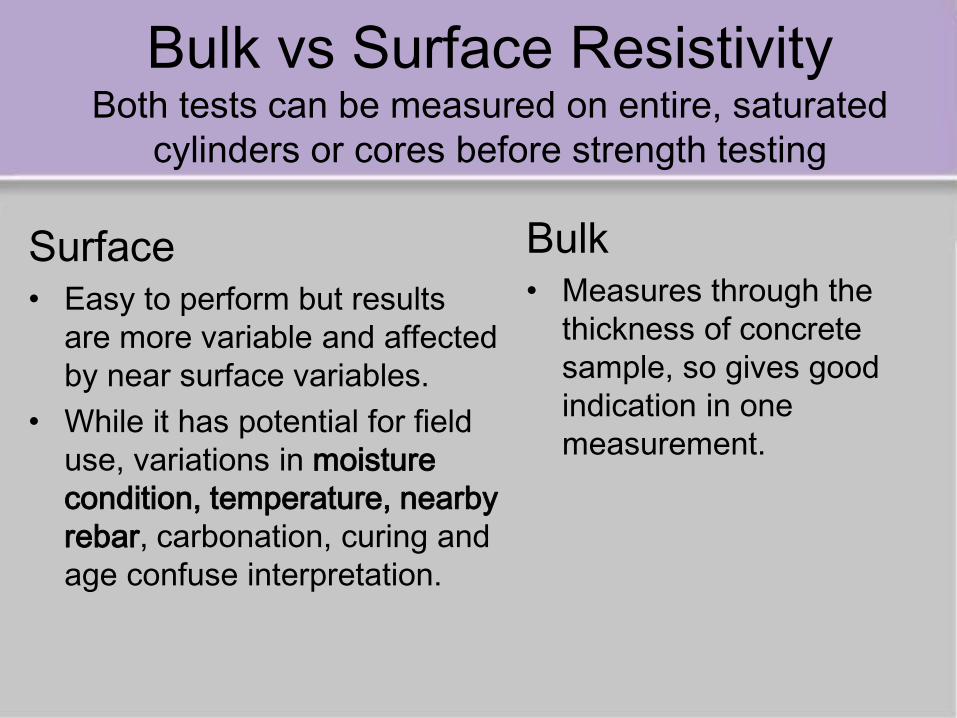
Bulk vs Surface Resistivity Both tests can be measured on entire, saturated
cylinders or cores before strength testing
Surface • Easy to perform but results
are more variable and affected by near surface variables.
• While it has potential for field use, variations in moisture condition, temperature, nearby rebar, carbonation, curing and age confuse interpretation.
Bulk • Measures through the
thickness of concrete sample, so gives good indication in one measurement.
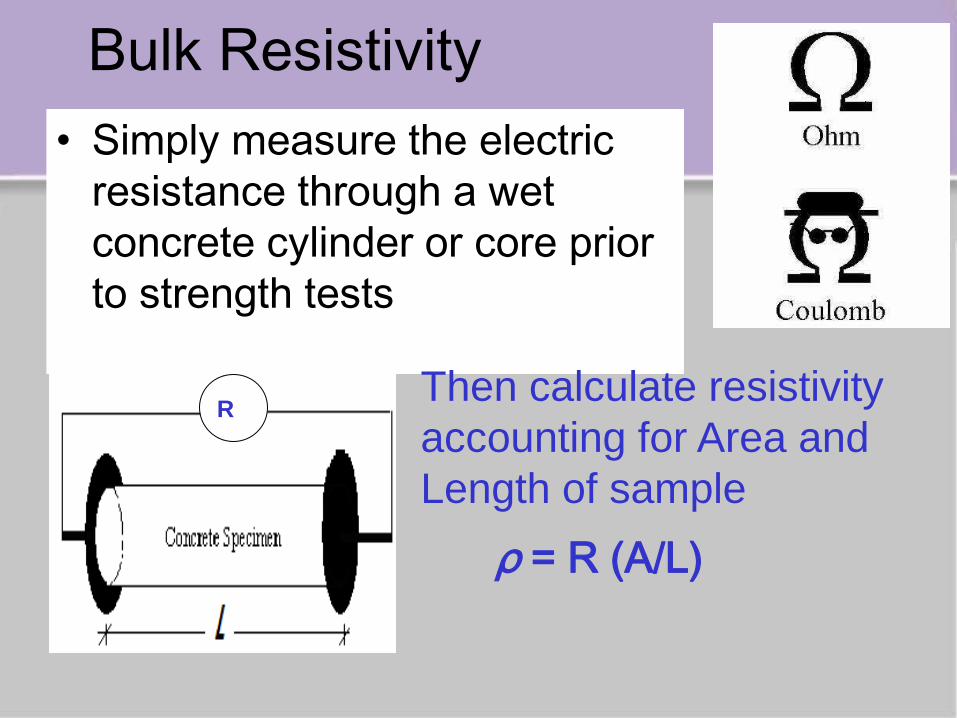
Bulk Resistivity • Simply measure the electric
resistance through a wet concrete cylinder or core prior to strength tests
Then calculate resistivity accounting for Area and Length of sample
ρ = R (A/L)
R
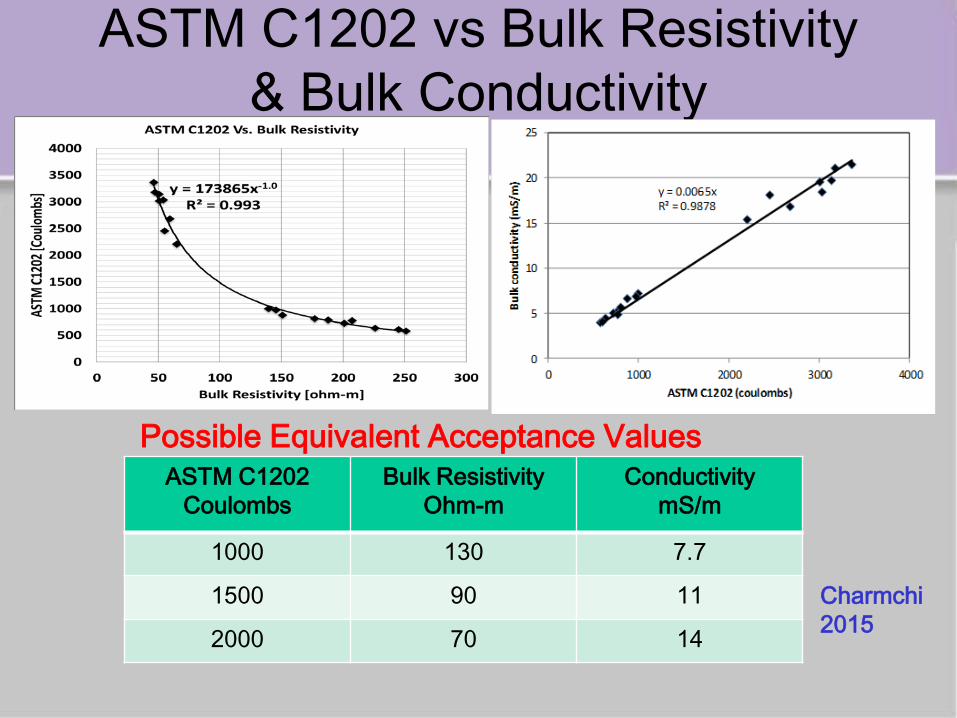
ASTM C1202 vs Bulk Resistivity & Bulk Conductivity
ASTM C1202 Coulombs
Bulk Resistivity Ohm-m
Conductivity mS/m
1000 130 7.7
1500 90 11
2000 70 14
Possible Equivalent Acceptance Values
Charmchi 2015
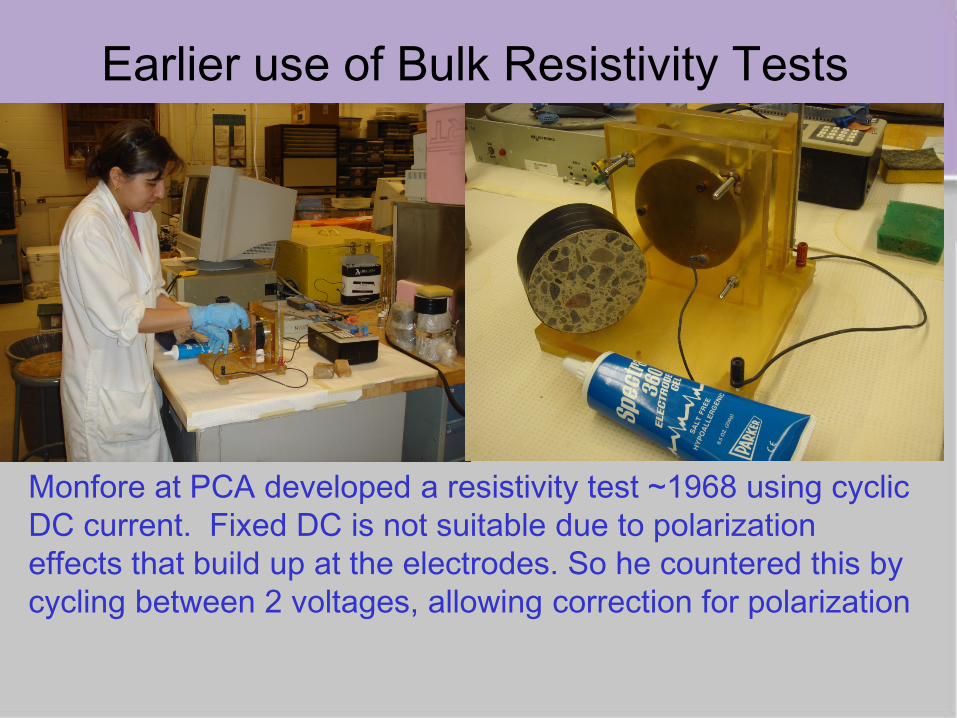
Earlier use of Bulk Resistivity Tests
Monfore at PCA developed a resistivity test ~1968 using cyclic DC current. Fixed DC is not suitable due to polarization effects that build up at the electrodes. So he countered this by cycling between 2 voltages, allowing correction for polarization
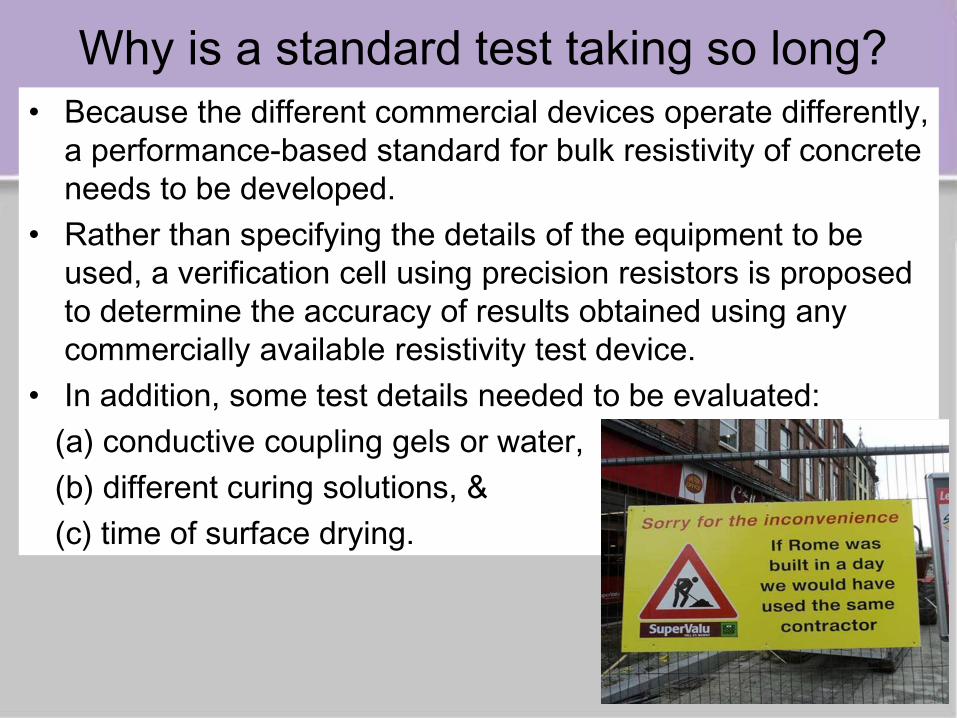
Why is a standard test taking so long? • Because the different commercial devices operate differently,
a performance-based standard for bulk resistivity of concrete needs to be developed.
• Rather than specifying the details of the equipment to be used, a verification cell using precision resistors is proposed to determine the accuracy of results obtained using any commercially available resistivity test device.
• In addition, some test details needed to be evaluated: (a) conductive coupling gels or water, (b) different curing solutions, & (c) time of surface drying.
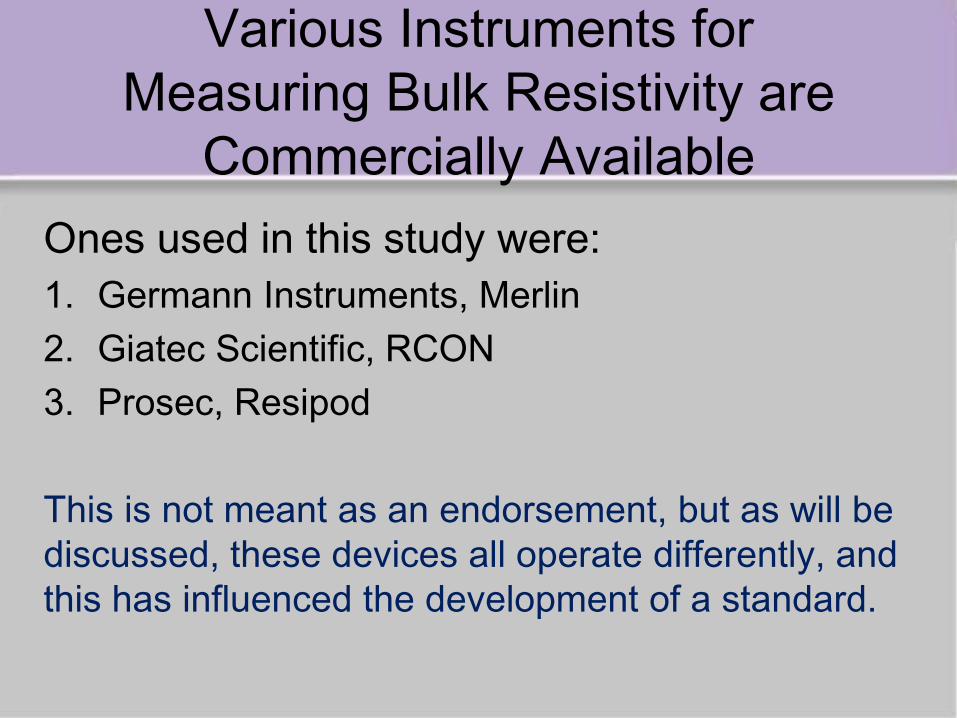
Various Instruments for Measuring Bulk Resistivity are
Commercially Available Ones used in this study were: 1. Germann Instruments, Merlin 2. Giatec Scientific, RCON 3. Prosec, Resipod This is not meant as an endorsement, but as will be discussed, these devices all operate differently, and this has influenced the development of a standard.
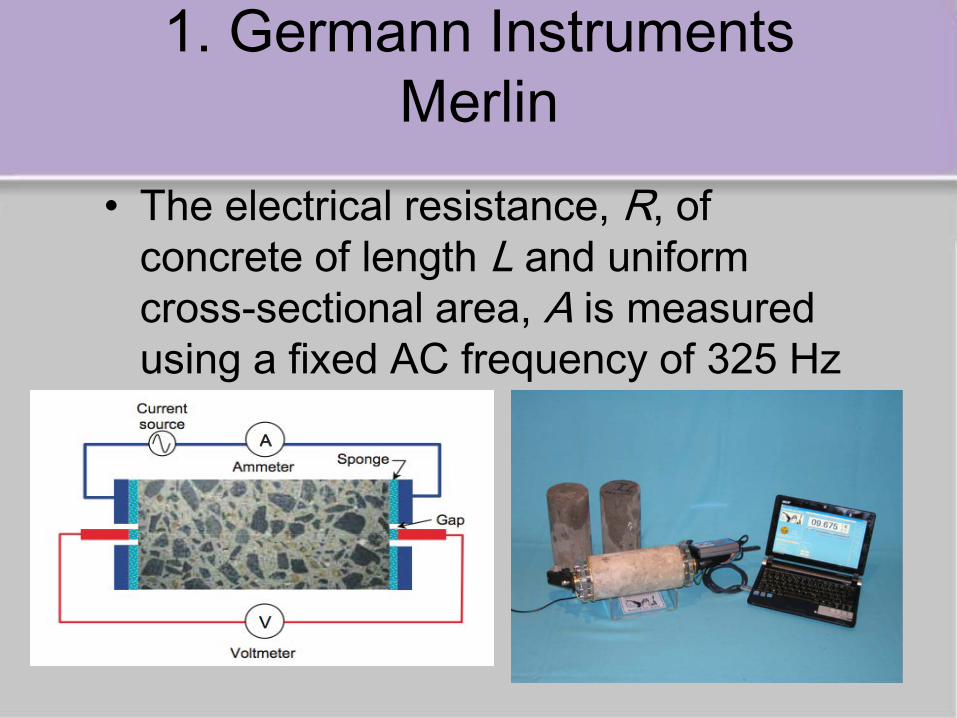
1. Germann Instruments Merlin
• The electrical resistance, R, of concrete of length L and uniform cross-sectional area, A is measured using a fixed AC frequency of 325 Hz
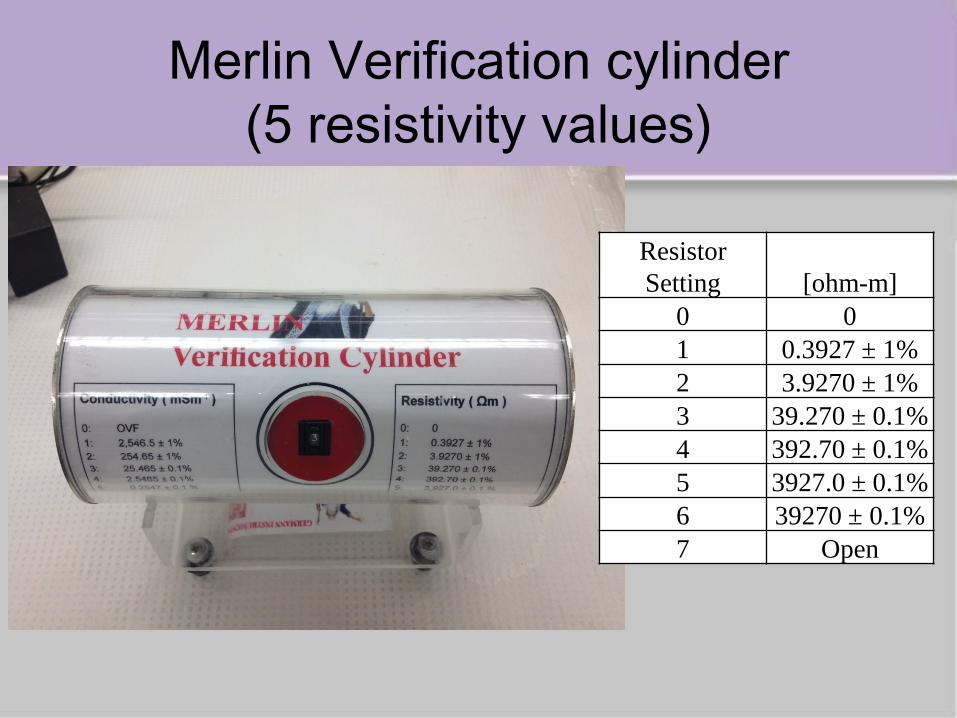
Merlin Verification cylinder (5 resistivity values)
Resistor Setting [ohm-m]
0 0 1 0.3927 ± 1% 2 3.9270 ± 1% 3 39.270 ± 0.1% 4 392.70 ± 0.1% 5 3927.0 ± 0.1% 6 39270 ± 0.1% 7 Open
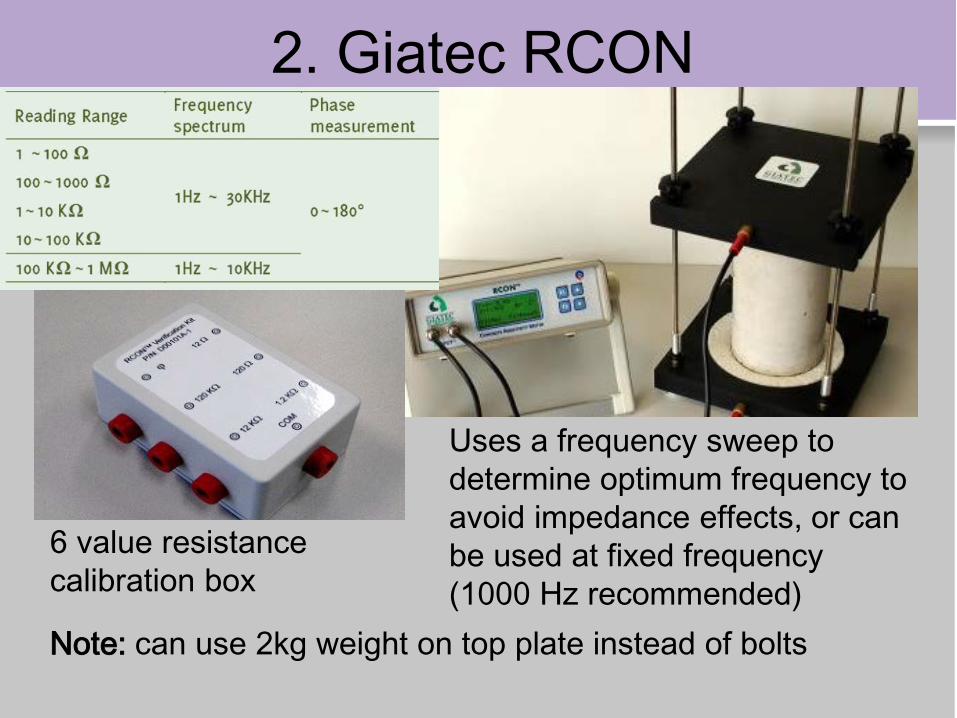
2. Giatec RCON
6 value resistance calibration box
Uses a frequency sweep to determine optimum frequency to avoid impedance effects, or can be used at fixed frequency (1000 Hz recommended)
Note: can use 2kg weight on top plate instead of bolts
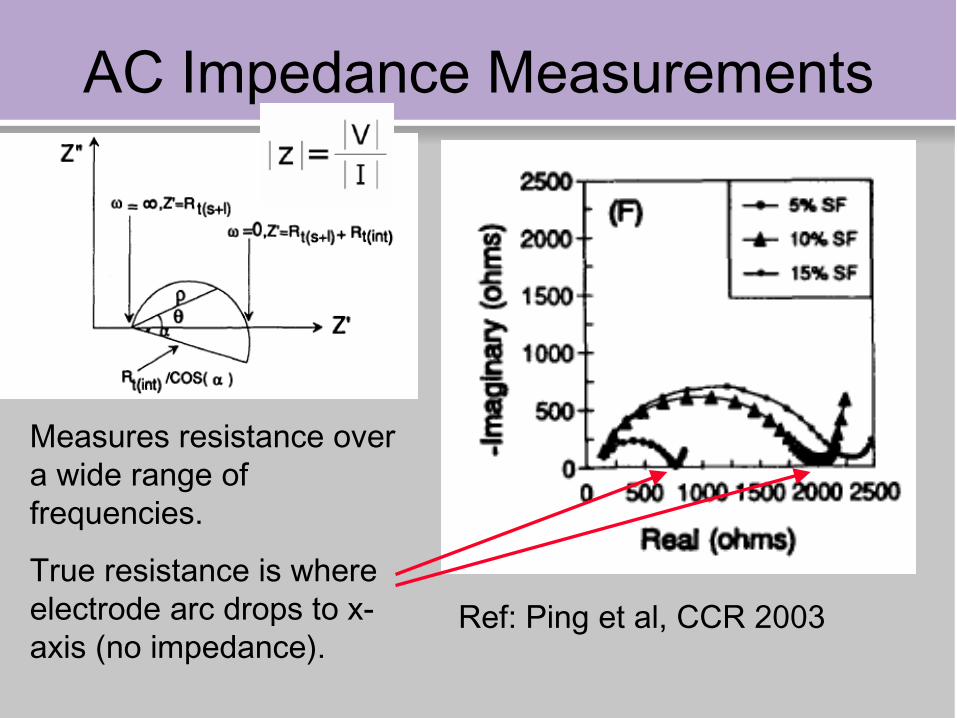
AC Impedance Measurements
Ref: Ping et al, CCR 2003
Measures resistance over a wide range of frequencies.
True resistance is where electrode arc drops to x-axis (no impedance).
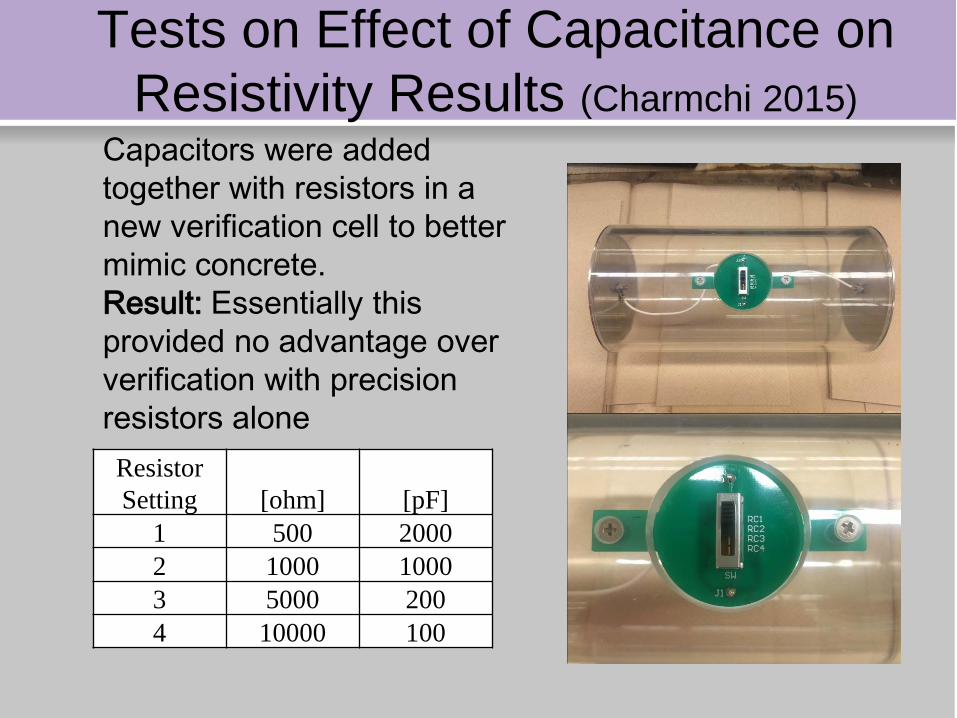
Tests on Effect of Capacitance on Resistivity Results (Charmchi 2015)
Resistor Setting [ohm] [pF]
1 500 2000 2 1000 1000 3 5000 200 4 10000 100
Capacitors were added together with resistors in a new verification cell to better mimic concrete. Result: Essentially this provided no advantage over verification with precision resistors alone
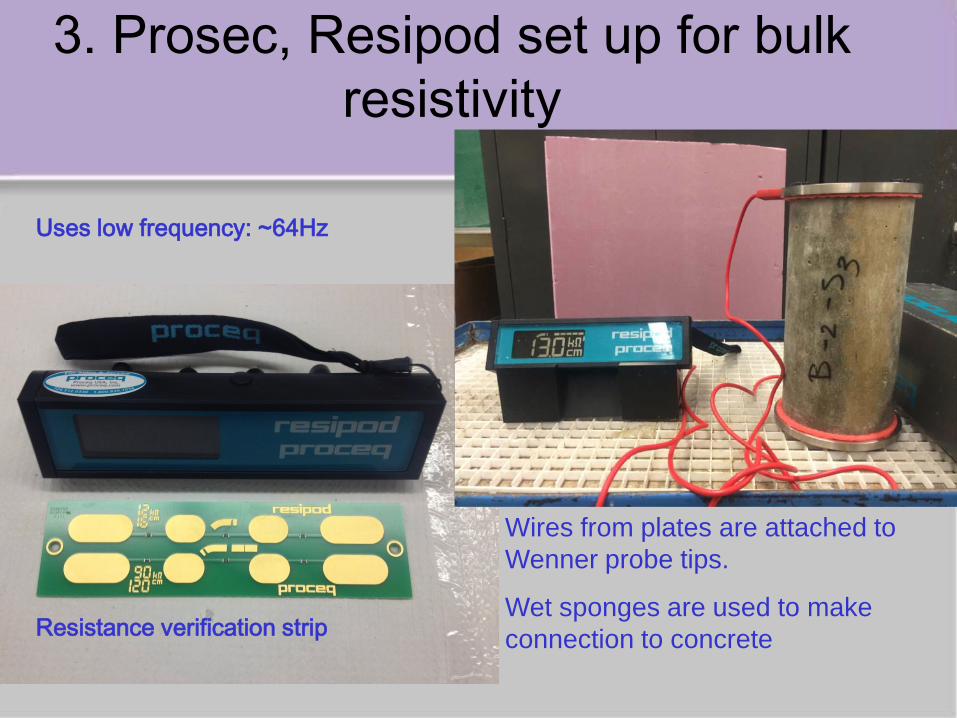
3. Prosec, Resipod set up for bulk resistivity
Wires from plates are attached to Wenner probe tips.
Wet sponges are used to make connection to concrete
Uses low frequency: ~64Hz
Resistance verification strip
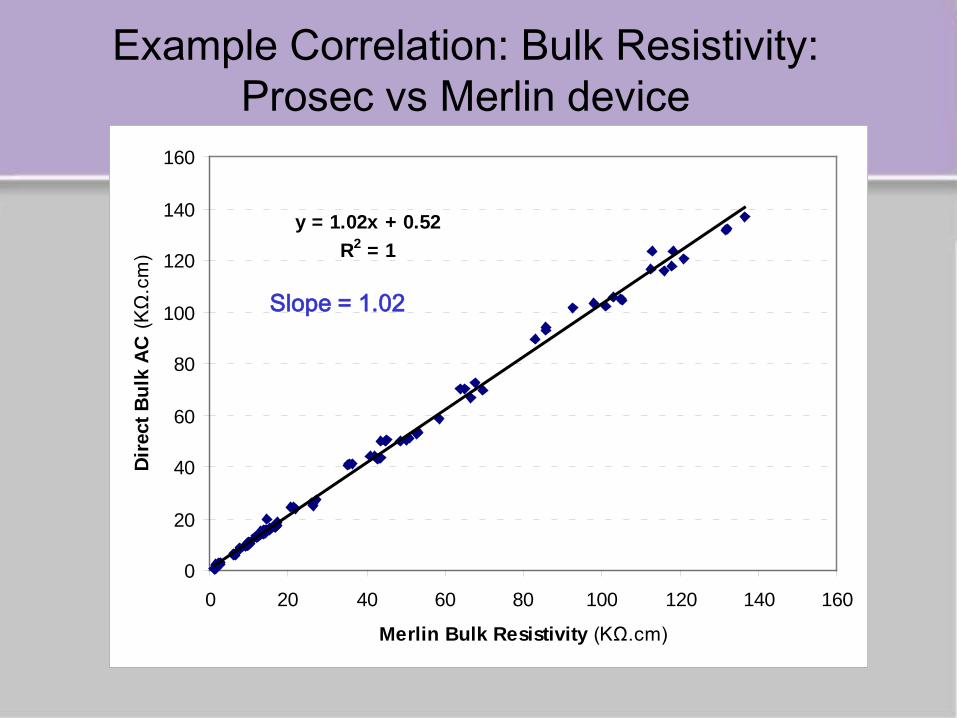
Example Correlation: Bulk Resistivity: Prosec vs Merlin device
y = 1.02x + 0.52R2 = 1
0
20
40
60
80
100
120
140
160
0 20 40 60 80 100 120 140 160
Merlin Bulk Resistivity (KΩ.cm)
Dire
ct B
ulk
AC (K
Ω.c
m)
Slope = 1.02
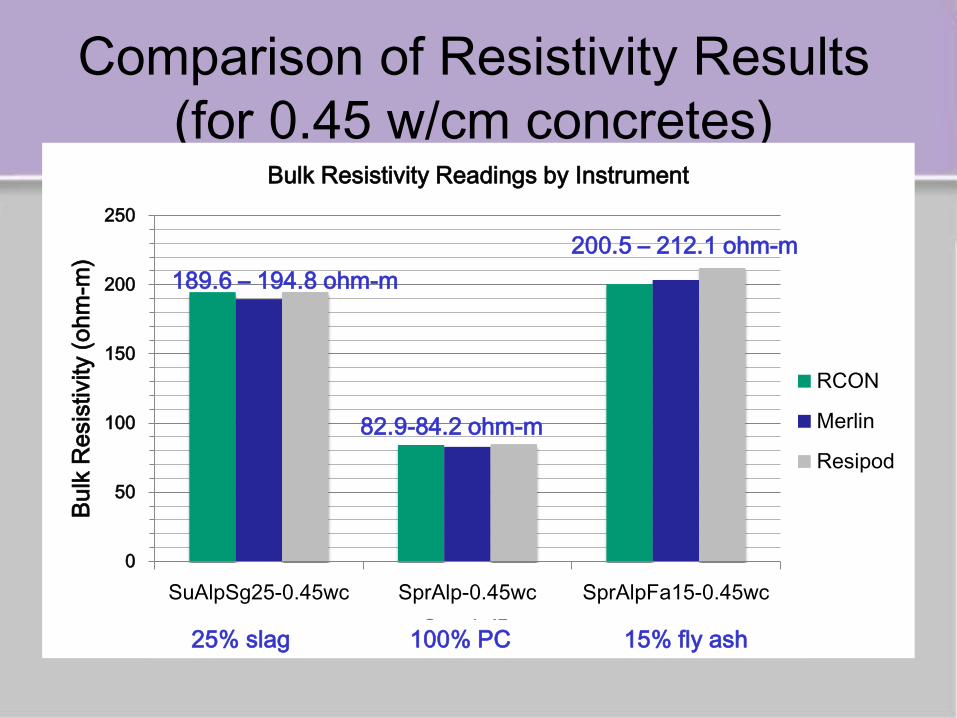
Comparison of Resistivity Results (for 0.45 w/cm concretes)
0
50
100
150
200
250
SuAlpSg25-0.45wc SprAlp-0.45wc SprAlpFa15-0.45wc
Bulk
Res
istiv
ity (o
hm-m
)
Sample ID
Bulk Resistivity Readings by Instrument
RCON
Merlin
Resipod82.9-84.2 ohm-m
200.5 – 212.1 ohm-m
25% slag 100% PC 15% fly ash
189.6 – 194.8 ohm-m
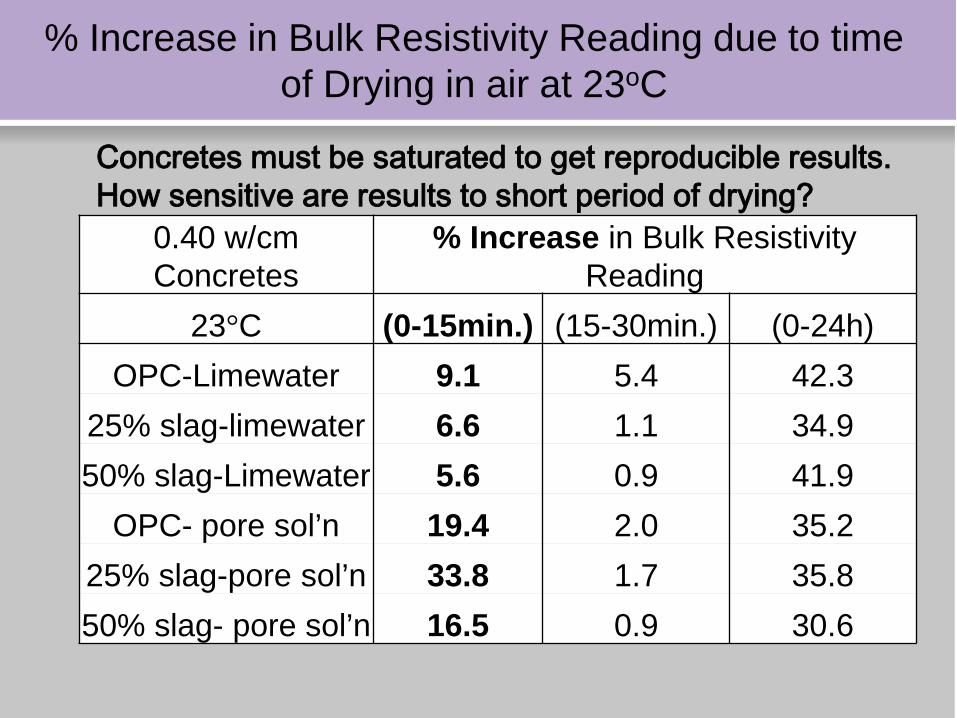
% Increase in Bulk Resistivity Reading due to time of Drying in air at 23oC
0.40 w/cm Concretes
% Increase in Bulk Resistivity Reading
23°C (0-15min.) (15-30min.) (0-24h) OPC-Limewater 9.1 5.4 42.3
25% slag-limewater 6.6 1.1 34.9 50% slag-Limewater 5.6 0.9 41.9
OPC- pore sol’n 19.4 2.0 35.2 25% slag-pore sol’n 33.8 1.7 35.8 50% slag- pore sol’n 16.5 0.9 30.6
Concretes must be saturated to get reproducible results. How sensitive are results to short period of drying?
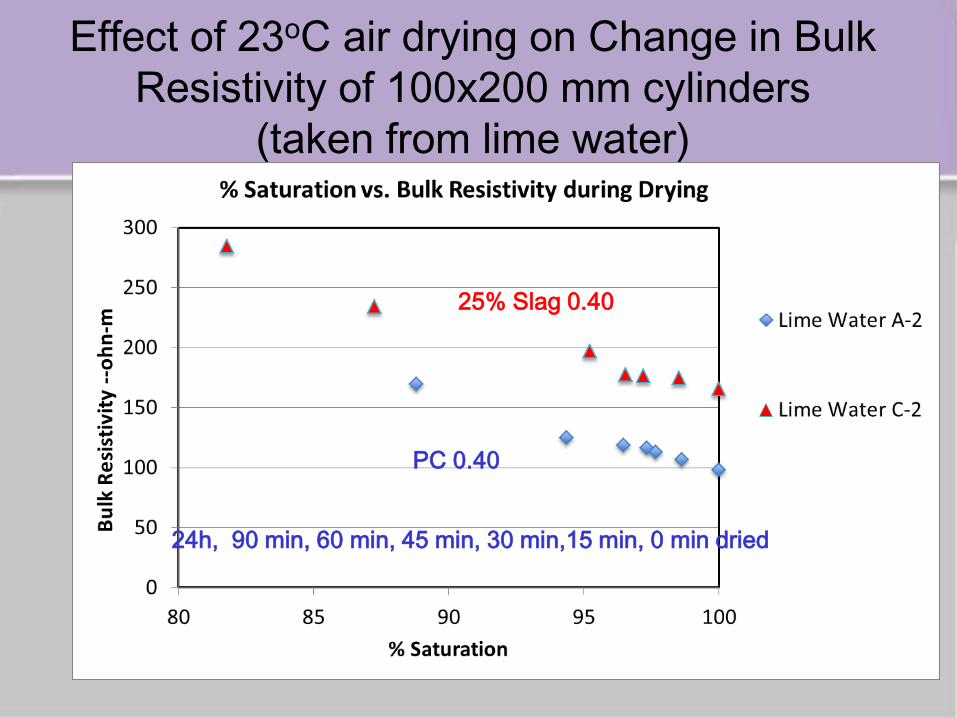
Effect of 23oC air drying on Change in Bulk Resistivity of 100x200 mm cylinders
(taken from lime water)
24h, 90 min, 60 min, 45 min, 30 min,15 min, 0 min dried
25% Slag 0.40
PC 0.40
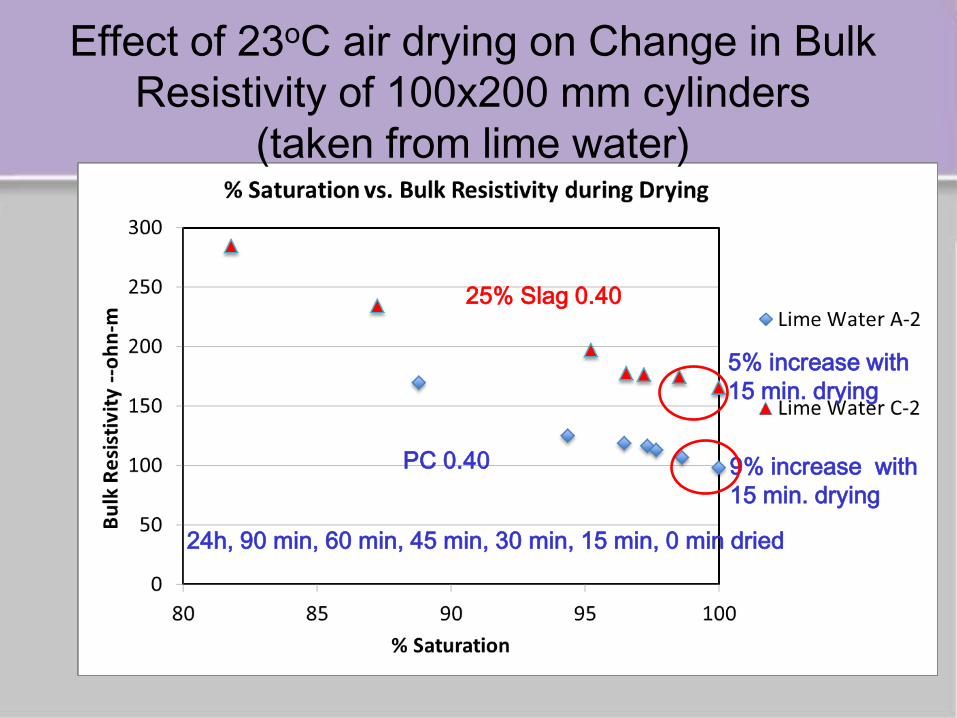
Effect of 23oC air drying on Change in Bulk Resistivity of 100x200 mm cylinders
(taken from lime water)
24h, 90 min, 60 min, 45 min, 30 min, 15 min, 0 min dried
25% Slag 0.40
PC 0.40 9% increase with 15 min. drying
5% increase with 15 min. drying
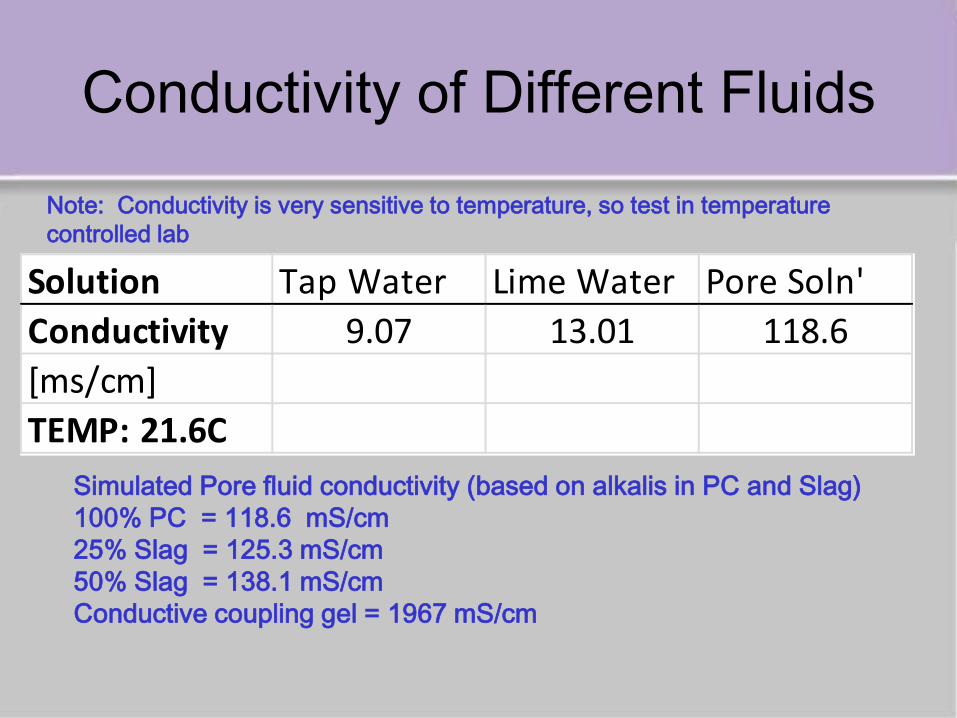
Conductivity of Different Fluids
Solution Tap Water Lime Water Pore Soln'Conductivity 9.07 13.01 118.6[ms/cm]TEMP: 21.6C
Simulated Pore fluid conductivity (based on alkalis in PC and Slag) 100% PC = 118.6 mS/cm 25% Slag = 125.3 mS/cm 50% Slag = 138.1 mS/cm Conductive coupling gel = 1967 mS/cm
Note: Conductivity is very sensitive to temperature, so test in temperature controlled lab
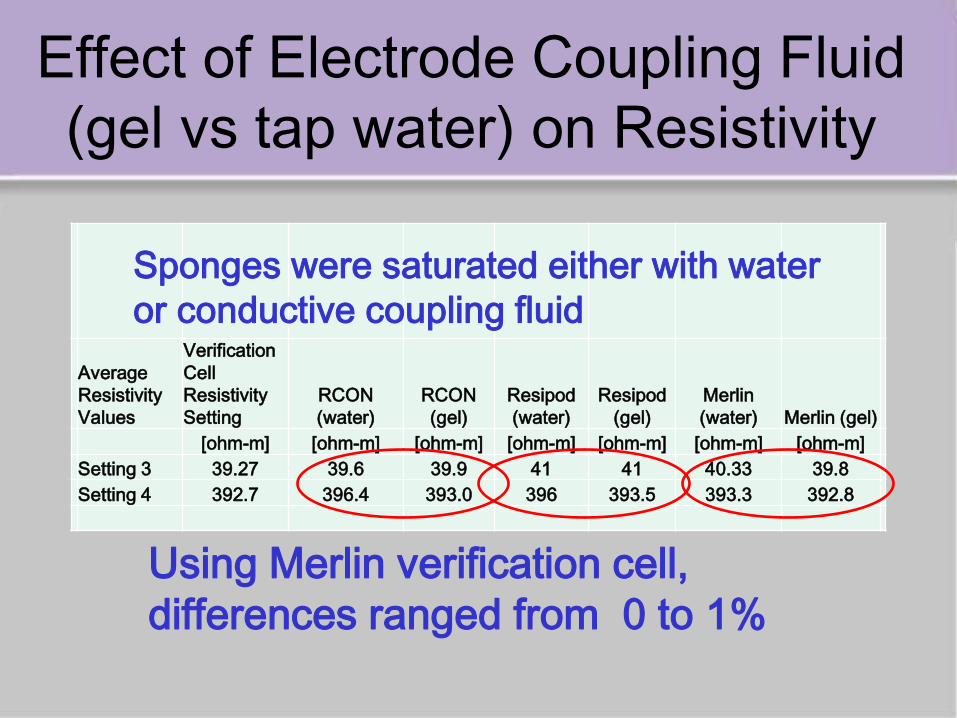
Effect of Electrode Coupling Fluid (gel vs tap water) on Resistivity
Average Resistivity Values
Verification Cell Resistivity Setting
RCON (water)
RCON (gel)
Resipod (water)
Resipod (gel)
Merlin (water) Merlin (gel)
[ohm-m] [ohm-m] [ohm-m] [ohm-m] [ohm-m] [ohm-m] [ohm-m] Setting 3 39.27 39.6 39.9 41 41 40.33 39.8 Setting 4 392.7 396.4 393.0 396 393.5 393.3 392.8
Using Merlin verification cell, differences ranged from 0 to 1%
Sponges were saturated either with water or conductive coupling fluid
Electrode Connections using saturated sponges
• Placing a 2 kg ( 5lb) weight on top of top electrode plate to get better connection of electrodes reduces resistivity results by 8-9%.
• Using a weight to clamp ends is faster than bolts.
• Merlin C-Clamp is adequate without added weight
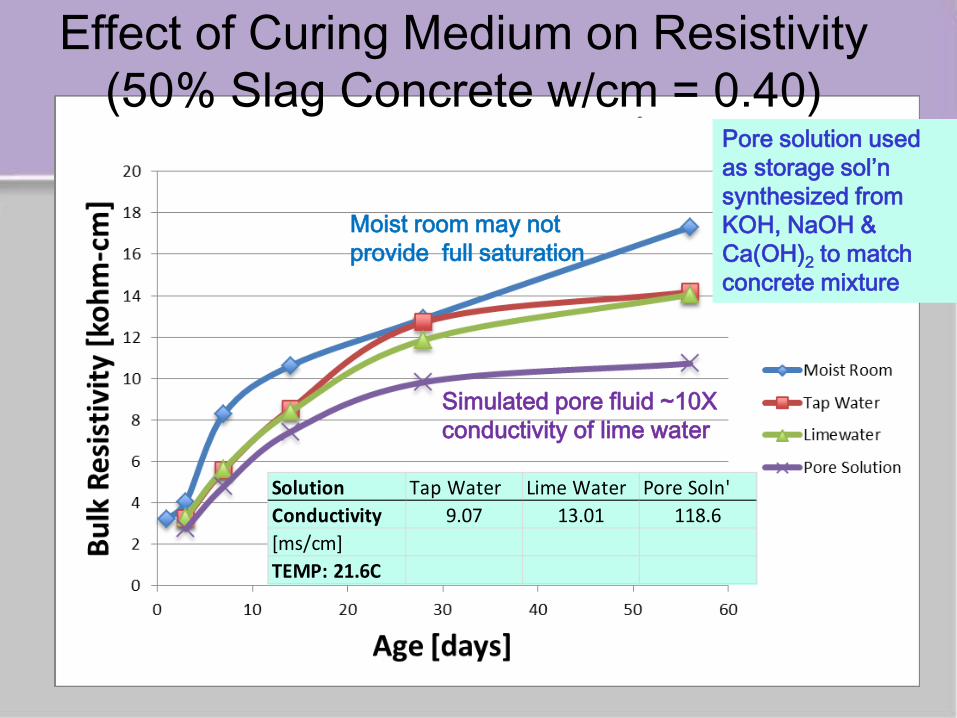
Effect of Curing Medium on Resistivity (50% Slag Concrete w/cm = 0.40)
Solution Tap Water Lime Water Pore Soln'Conductivity 9.07 13.01 118.6[ms/cm]TEMP: 21.6C
Moist room may not provide full saturation
Simulated pore fluid ~10X conductivity of lime water
Pore solution used as storage sol’n synthesized from KOH, NaOH & Ca(OH)2 to match concrete mixture
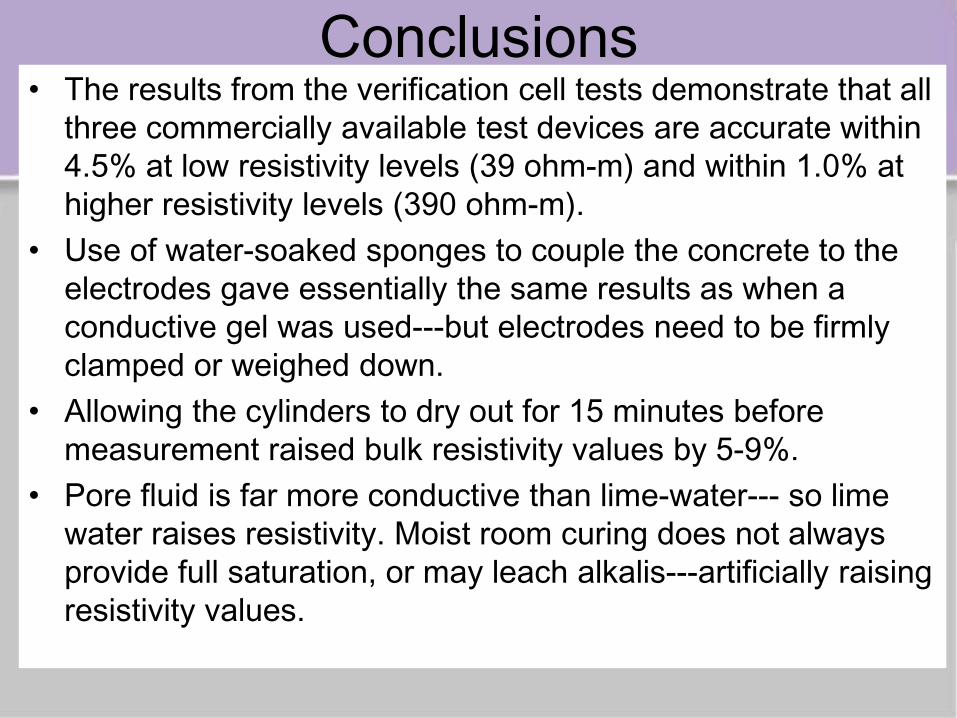
Conclusions • The results from the verification cell tests demonstrate that all
three commercially available test devices are accurate within 4.5% at low resistivity levels (39 ohm-m) and within 1.0% at higher resistivity levels (390 ohm-m).
• Use of water-soaked sponges to couple the concrete to the electrodes gave essentially the same results as when a conductive gel was used---but electrodes need to be firmly clamped or weighed down.
• Allowing the cylinders to dry out for 15 minutes before measurement raised bulk resistivity values by 5-9%.
• Pore fluid is far more conductive than lime-water--- so lime water raises resistivity. Moist room curing does not always provide full saturation, or may leach alkalis---artificially raising resistivity values.

Next Step in Standardization
• Finish detailed write up of test method • Work with Jason Weiss to include
calculation of Formation Factor in Test method or in Appendix

Resistivity Webinar, April 13th, 2016 Slides Prepared by Jason Weiss Slide 1 of 15
Thoughts About Resistivity Testing, the Formation Factor, and Specifications
Jason Weiss, Oregon State University
April 13th, 2016
Resistivity Webinar, April 13th, 2016 Slides Prepared by Jason Weiss Slide 2 of 15
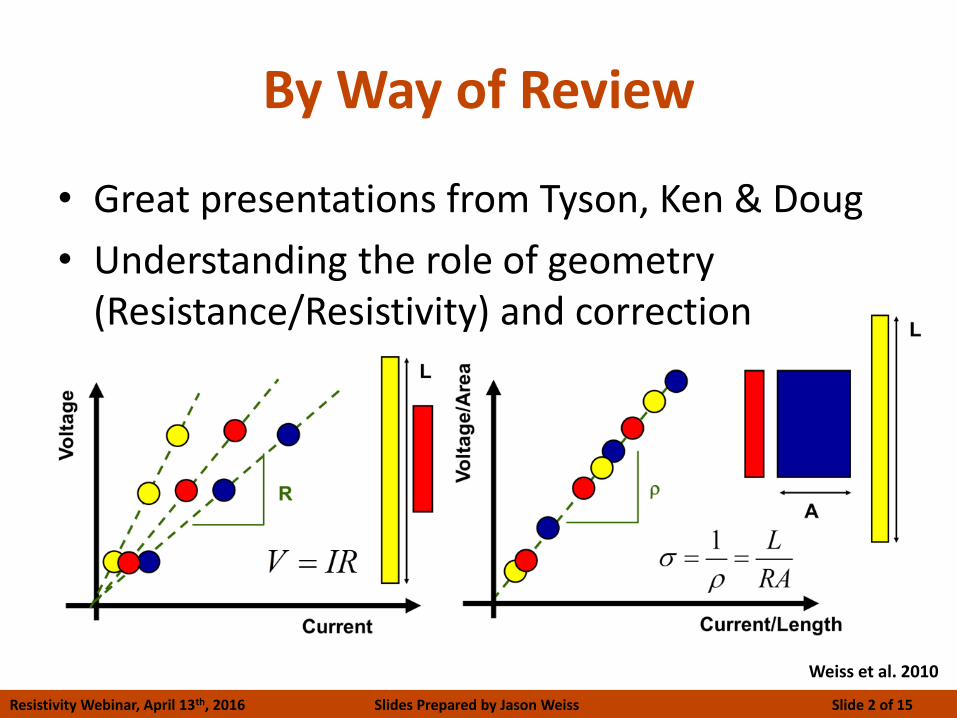
By Way of Review
• Great presentations from Tyson, Ken & Doug
• Understanding the role of geometry (Resistance/Resistivity) and correction
Weiss et al. 2010
Resistivity Webinar, April 13th, 2016 Slides Prepared by Jason Weiss Slide 3 of 15
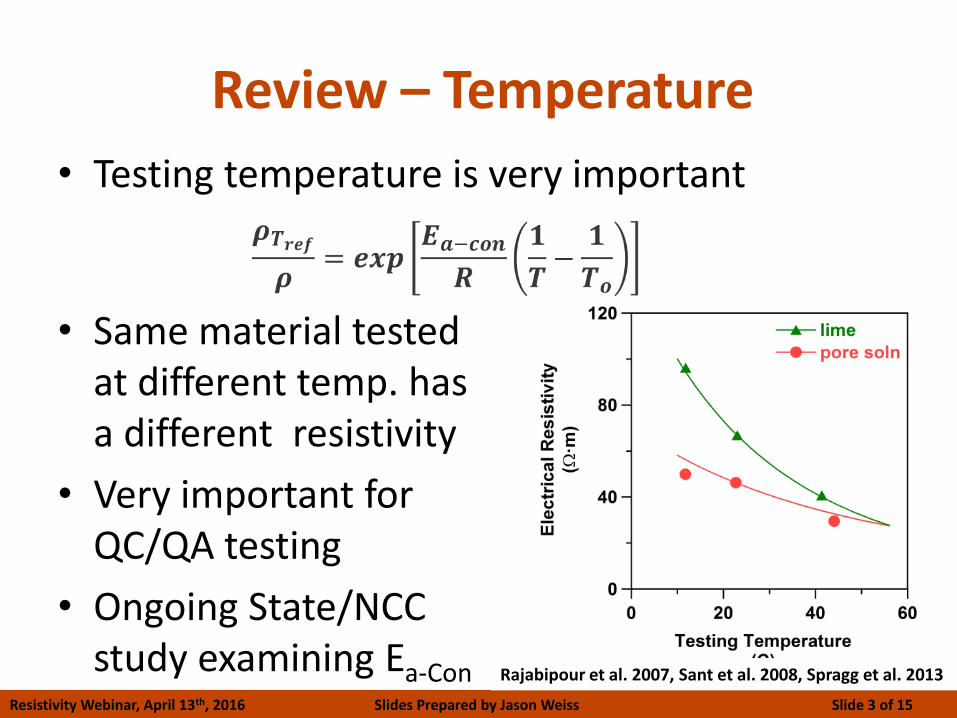
Review – Temperature
• Testing temperature is very important
• Same material tested at different temp. has a different resistivity
• Very important for QC/QA testing
• Ongoing State/NCC study examining Ea-Con Rajabipour et al. 2007, Sant et al. 2008, Spragg et al. 2013
Resistivity Webinar, April 13th, 2016 Slides Prepared by Jason Weiss Slide 4 of 15
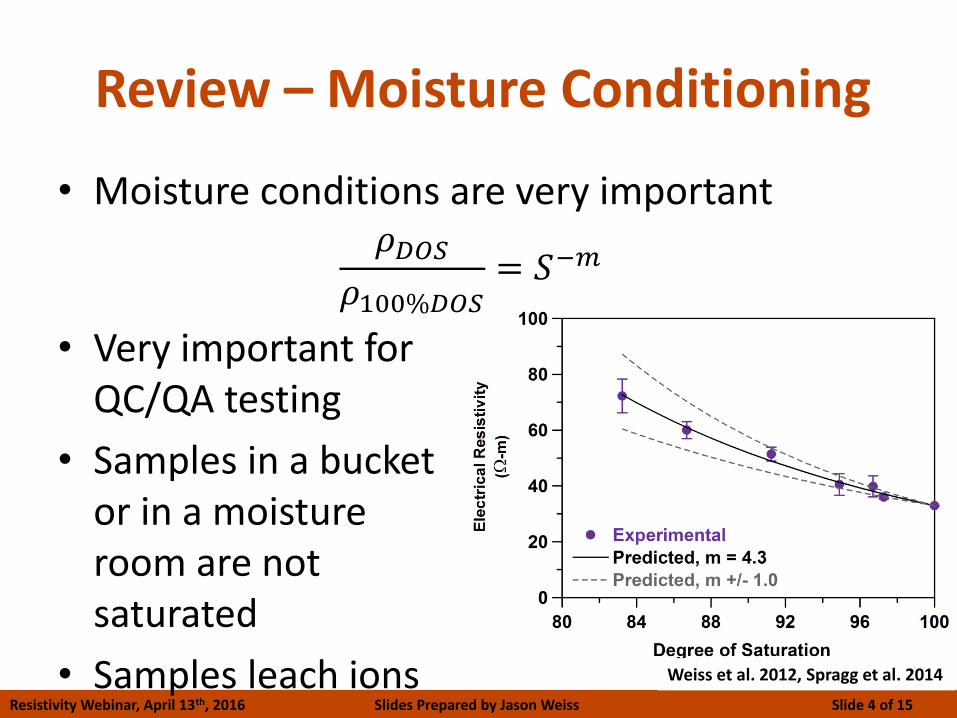
Review – Moisture Conditioning
• Moisture conditions are very important
• Very important for QC/QA testing
• Samples in a bucket or in a moisture room are not saturated
• Samples leach ions Weiss et al. 2012, Spragg et al. 2014
𝜌𝐷𝑂𝑆𝜌100%𝐷𝑂𝑆
= 𝑆−𝑚
Resistivity Webinar, April 13th, 2016 Slides Prepared by Jason Weiss Slide 5 of 15
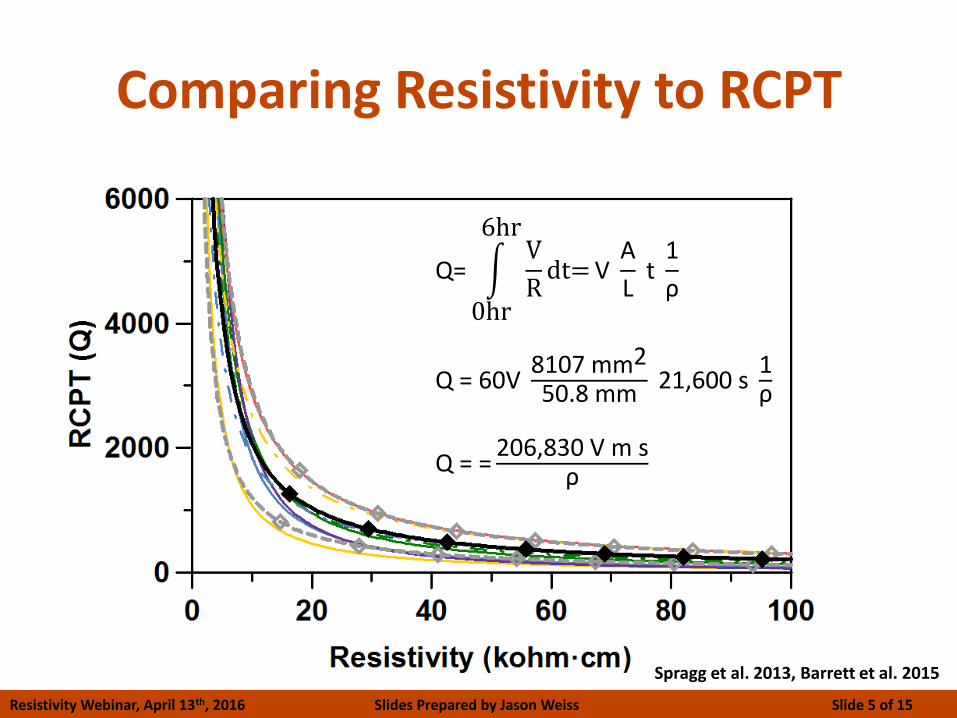
Comparing Resistivity to RCPT
Spragg et al. 2013, Barrett et al. 2015
Q= V
Rdt=
6hr
0hr
V A
L t
1
ρ
Q = 60V 8107 mm2
50.8 mm 21,600 s
1ρ
Q = =206,830 V m s
ρ
Resistivity Webinar, April 13th, 2016 Slides Prepared by Jason Weiss Slide 6 of 15
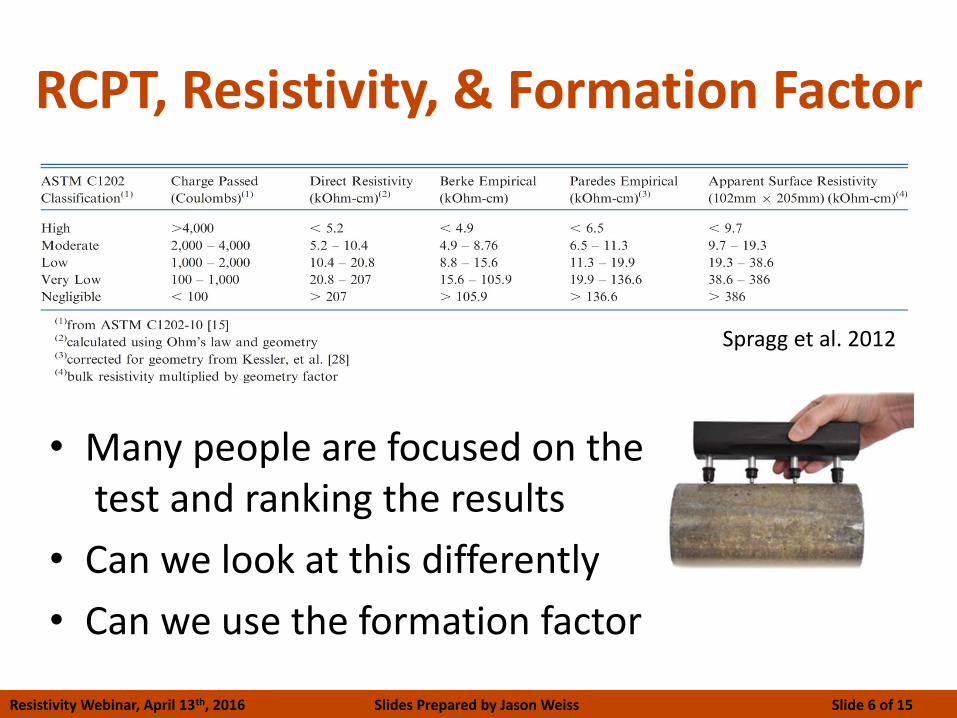
RCPT, Resistivity, & Formation Factor
• Many people are focused on the test and ranking the results
• Can we look at this differently
• Can we use the formation factor
Spragg et al. 2012
Resistivity Webinar, April 13th, 2016 Slides Prepared by Jason Weiss Slide 7 of 15
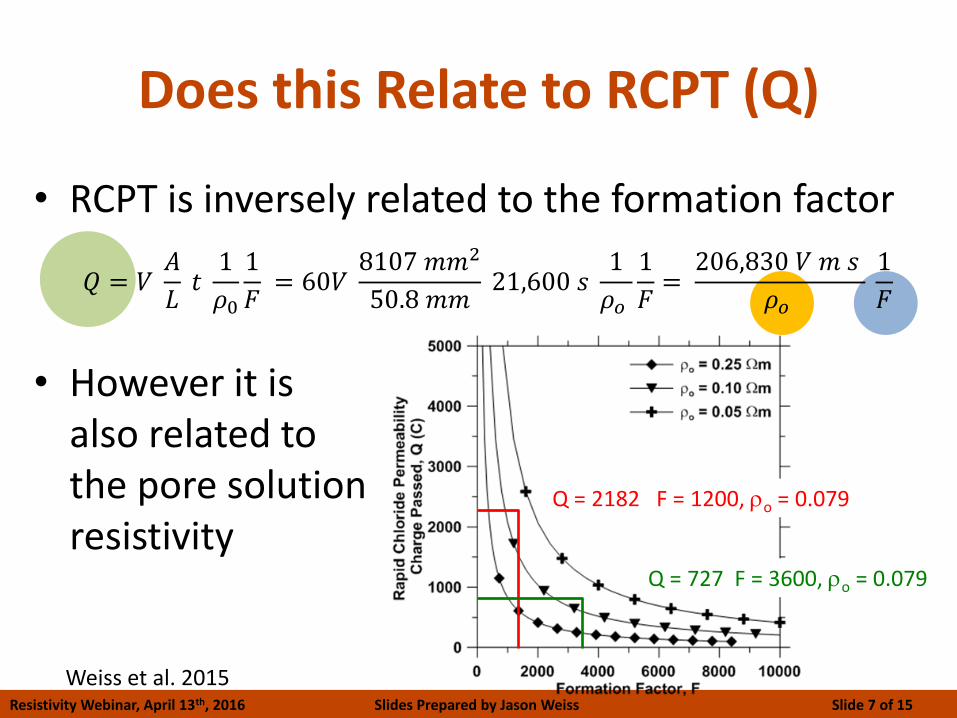
Does this Relate to RCPT (Q)
• RCPT is inversely related to the formation factor
• However it is also related to the pore solution resistivity
𝑄 = 𝑉 𝐴
𝐿 𝑡 1
𝜌0
1
𝐹 = 60𝑉
8107 𝑚𝑚2
50.8 𝑚𝑚 21,600 𝑠
1
𝜌𝑜
1
𝐹= 206,830 𝑉 𝑚 𝑠
𝜌𝑜 1
𝐹
Weiss et al. 2015
Q = 2182 F = 1200, ro = 0.079
Q = 727 F = 3600, ro = 0.079
Resistivity Webinar, April 13th, 2016 Slides Prepared by Jason Weiss Slide 8 of 15
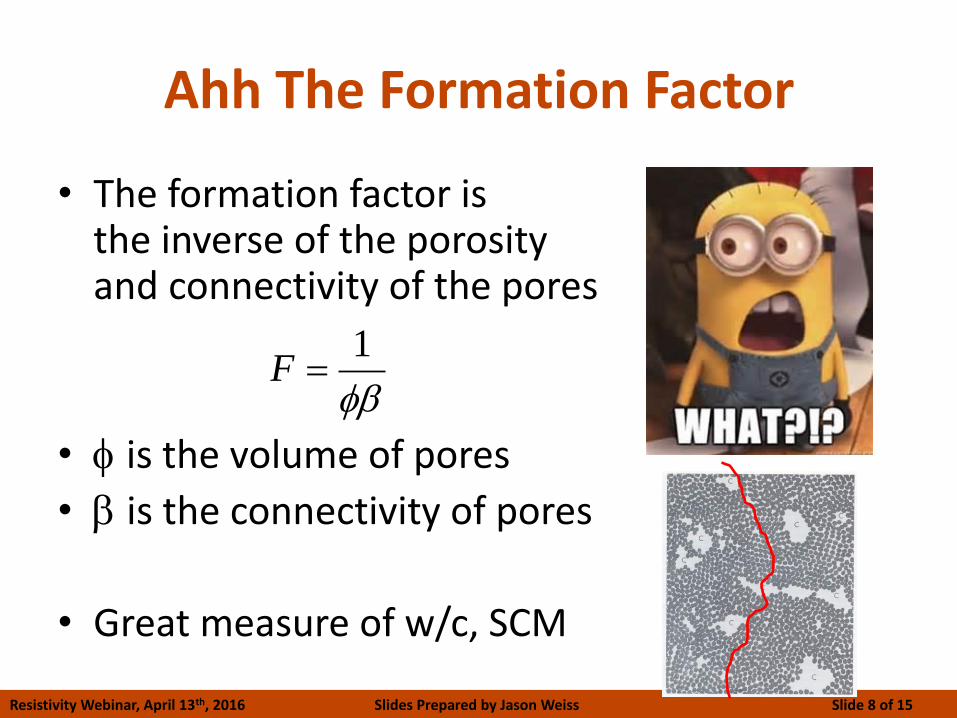
Ahh The Formation Factor
• The formation factor is the inverse of the porosity and connectivity of the pores
• f is the volume of pores
• b is the connectivity of pores
• Great measure of w/c, SCM
fb
1F
Resistivity Webinar, April 13th, 2016 Slides Prepared by Jason Weiss Slide 9 of 15
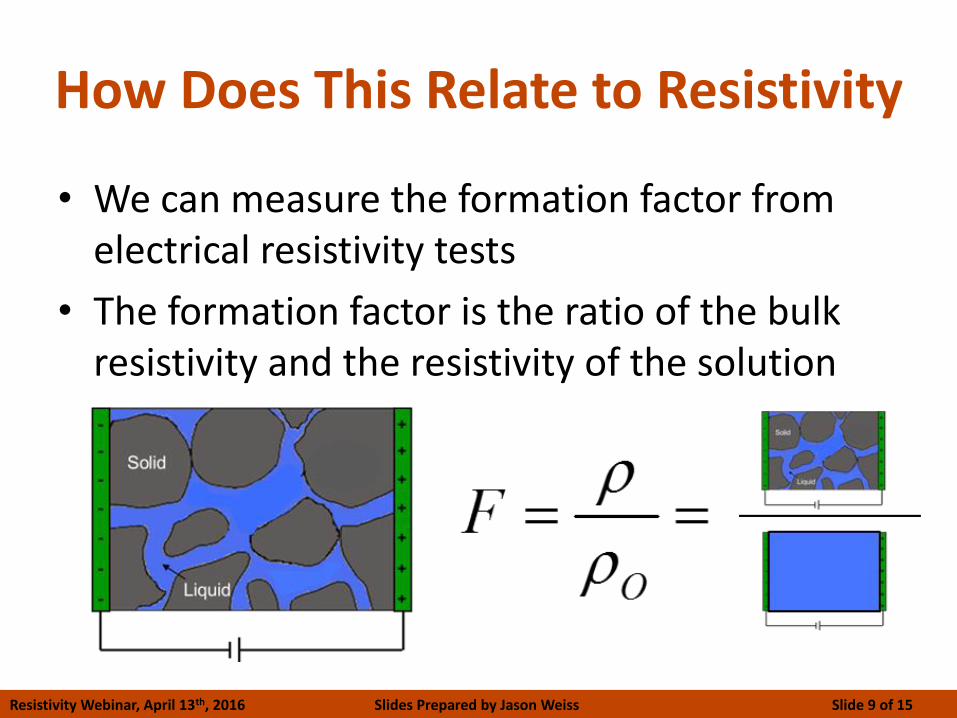
How Does This Relate to Resistivity
• We can measure the formation factor from electrical resistivity tests
• The formation factor is the ratio of the bulk resistivity and the resistivity of the solution

Resistivity Webinar, April 13th, 2016 Slides Prepared by Jason Weiss Slide 10 of 15
An Example of the Formation Factor
• Assume we want concrete bridge deck that lasts for 75 years
• 2.5 inches of cover
• Indianapolis Indiana
• Deicing salt application
Barrett et al. 2015
Resistivity Webinar, April 13th, 2016 Slides Prepared by Jason Weiss Slide 11 of 15
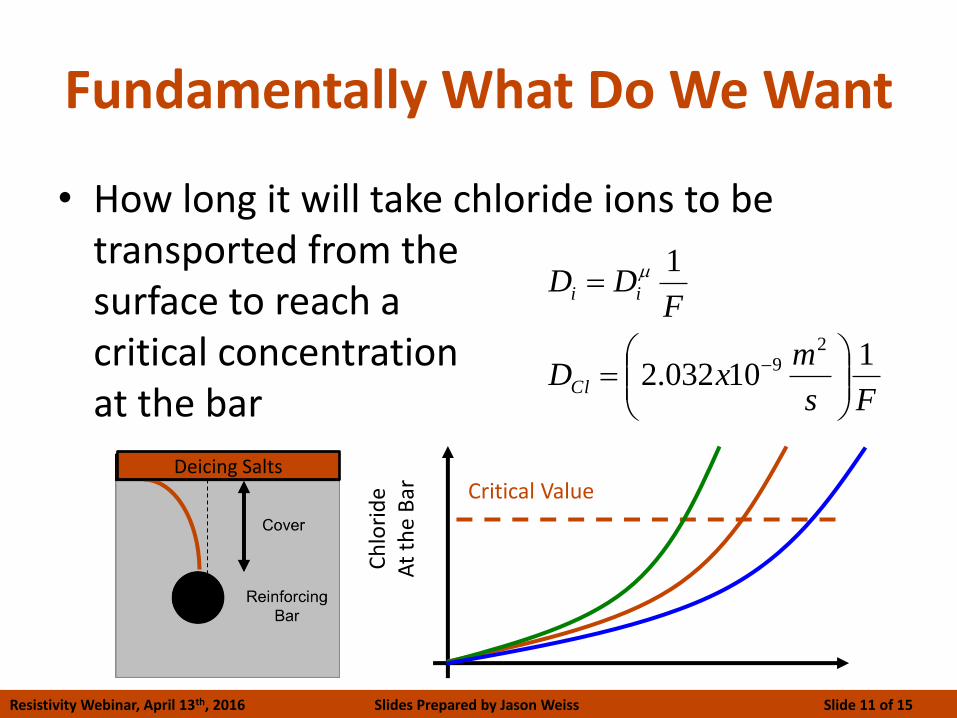
Fundamentally What Do We Want
• How long it will take chloride ions to be transported from the surface to reach a critical concentration at the bar
Ch
lori
de
A
t th
e B
ar
Critical Value
Fs
mxD
FDD
Cl
ii
110032.2
1
29
Deicing Salts
Resistivity Webinar, April 13th, 2016 Slides Prepared by Jason Weiss Slide 12 of 15
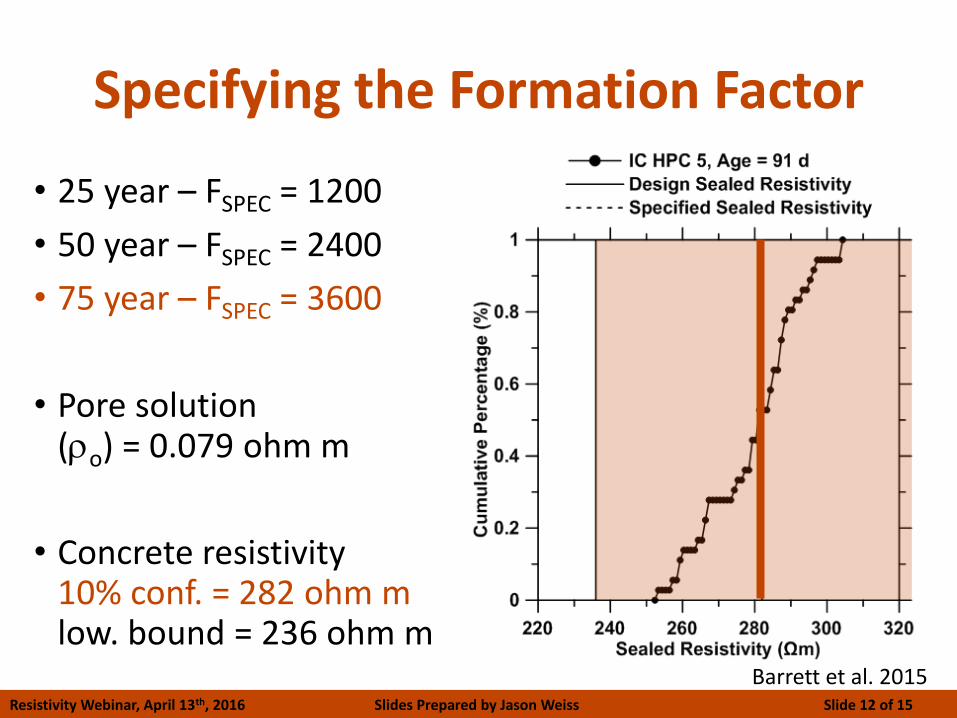
Specifying the Formation Factor
• 25 year – FSPEC = 1200
• 50 year – FSPEC = 2400
• 75 year – FSPEC = 3600
• Pore solution (ro) = 0.079 ohm m
• Concrete resistivity 10% conf. = 282 ohm m low. bound = 236 ohm m
Barrett et al. 2015
Resistivity Webinar, April 13th, 2016 Slides Prepared by Jason Weiss Slide 13 of 15
Some Things to Consider
• Each project in a region has the same F but different resistivity based cement
• F changes by region due to differences in temperature and exposure conditions
• Resistivity here is shown for a sealed concrete which is very fast to perform
• Many samples can be tested on a bridge as shown in the last plot
• Variability is key, this enables quantification
Resistivity Webinar, April 13th, 2016 Slides Prepared by Jason Weiss Slide 14 of 15
Summary and Implementation
• Temperature, leaching and moisture are important and should be considered
• Formation factor is a fundamental property that can be obtained from resistivity
• One should specify formation factor and use the resistivity in the field as a quality control measure

Resistivity Webinar, April 13th, 2016 Slides Prepared by Jason Weiss Slide 15 of 15
Thank you Are There Any Questions
Jason Weiss , Edwards Distinguished Professor
Additional Resources http://cce.oregonstate.edu/resistivity