Embed Size (px)
Citation preview
OTIC FILE COPY
DOT/FAA/CT-902 Dallas/Fort Worth SimulationFAA Technical CenterAtlanticoCity InternatioalAirport 0Phase II- Triple SimultaneousParallel ILS Approaches
LO
q
CTA INCORPORATEDEnglish Creek CenterThe Courtyard, Suite 204
I McKee City, N.J. 08232
March 1990
Final Report
This document is avaliable to the U.S. publicthrough the National Technical InformationService, Springfield, Virginia 22161
DTICELECTE
JUL 20 0OU.S. Department of Transportation
I A Amnsrto .
p=blic rO = = == =
Appwvd kw ~b~e lea
,I
NOTICE
This document is disseminated under the sponsorshipof the U.S. Department of Transportation in the interest ofInformation exchange. The United States Governmentassumes no liability for the contents or use thereof.
The United States Government does not endorseproducts or manufacturers. Trade or manufacturers'names appear herein solely because they are consideredessential to the objective of this report.
r
ACKNOWLEDGEMENTS
This simulation was a cooperative effort among many individuals:The air traffic controllers, who served as subjects, Mr. RonnieUhlenhaker and the technical observers from the D/FW Program Officewho contributed their considerable experience and professionalismto the study. Mr. Ralph Dority, of the National Airspace CapacityStaff, ATO-20, and other members of the D/FW Task Force madenoteworthy contributions to the overall planning of the simulation.Mr. Lee Paul (ATC Technology Branch/FAA Technical Center), whowrote the simulation plan, and Dr. Ephraim Shochet (TechnicalProgram Manager) provided invaluable guidance throughout theplanning, execution, and analysis stages. Thanks are alsoexpressed to Mr. George Kupp and Mr. Hank Smallacombe of theTechnical Center who managed much of the day-to-day operation ofthe simulation. The efforts of Mr. Dick Algeo (CRMI), whoperformed the data reduction, along with Mr. Dan Warburton and hisstaff, who provided computer support, are also gratefullyacknowledged.
Accession ForNT13 CP:A&I
' DTIC TA.Q
Unarno n c e dJustl lcatlo
Fy _
Di3trlbutlon/
Av bilitty Codes
r-~ Wvi n/or-
Dit'Spcial
~ILJ
iii
Technical Report Documentation Page1. Report N . 2. Government Accession No. 3. Recipient s Catalog No.
DOT/FAA/CT-90/2
4. T tie ctd 5.bt,, e 5. Report Date
Dallas/Fort Worth Simulation March 1990Phase II -- Triple Simultaneous Parallel 6. Performing OrganizatonCodeILS Approaches (Turbojets)
I8. Performing Organization Report No.7 A. rO" s
DOT/FAA/CT-90/2
9. P eiormn Organ. zaton Name Ond Aadress 10 Work Unn No. fTRAIS)
CTA INCORPORATEDEnglish Creek Center, The Courtyard, Suite 204 11. Contract or GrantNo.McKee City, NJ 08232 DTFA03-89-C-00023-340400
13. Type of Report and Period Covered
12 Sponsoring Agency Name and Address FU.S. Department of Transportation Final ReportFederal Aviation Administration October - January 1990Technical Center • 14. Sponsoring Agency Code
Atlantic City International Airport, NJ 08405 ACD-340SvopD ementary Notes
16 Abstract
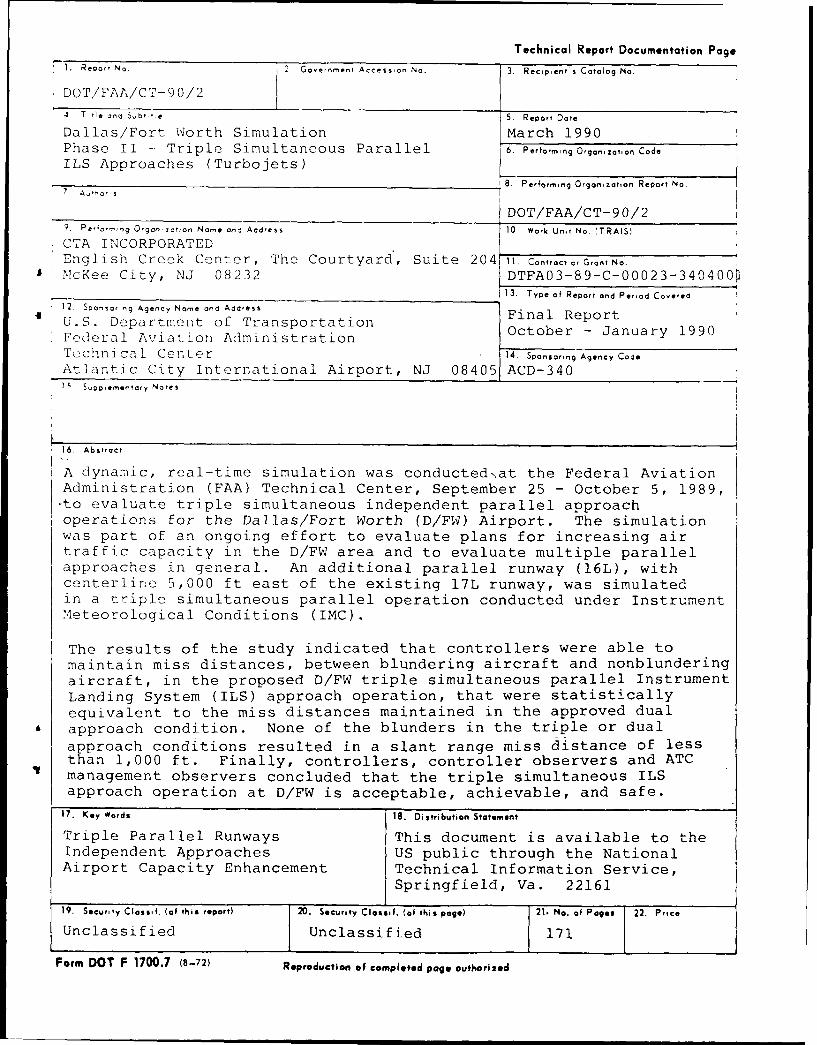
A dynamic, real-time simulation was conducted-at the Federal AviationAdministration (FAA) Technical Center, September 25 - October 5, 1989,-to evaluate triple simultaneous independent parallel approachoperations for the Dallas/Fort Worth (D/FW) Airport. The simulationwas part of an ongoing effort to evaluate plans for increasing airtraffic capacity in the D/FW area and to evaluate multiple parallelapproaches in general. An additional parallel runway (16L), withcenterline 5,000 ft east of the existing 17L runway, was simulatedin a triple simultaneous parallel operation conducted under InstrumentMeteorological Conditions (IMC).
The results of the study indicated that controllers were able tomaintain miss distances, between blundering aircraft and nonblunderingaircraft, in the proposed D/FW triple simultaneous parallel InstrumentLanding System (ILS) approach operation, that were statisticallyequivalent to the miss distances maintained in the approved dualapproach condition. None of the blunders in the triple or dualapproach conditions resulted in a slant range miss distance of lessthan 1,000 ft. Finally, controllers, controller observers and ATCmanagement observers concluded that the triple simultaneous ILSapproach operation at D/FW is acceptable, achievable, and safe.
17. Key Words 18. Distribution Statement
Triple Parallel Runways This document is available to theIndependent Approaches US public through the NationalAirport Capacity Enhancement Technical Information Service,
Springfield, Va. 22161
19. Security Classf. (of this report) 20. Security Classif. (of this page) 21. No. of Pages 22. Price
Unclassified Unclassified 171
Form DOT F 1700.7 (8-72) Repoduction of completed page outhorized
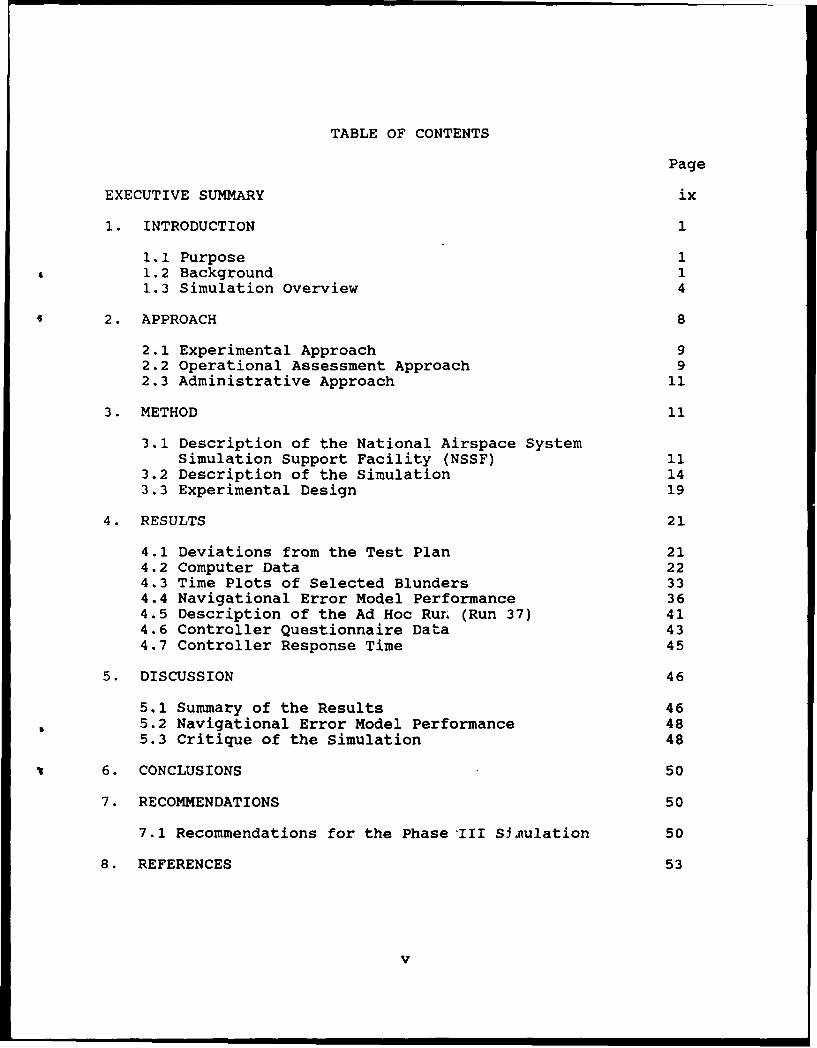
TABLE OF CONTENTS
Page
EXECUTIVE SUMMARY ix
1. INTRODUCTION 1
1.1 Purpose 11.2 Background 11.3 Simulation Overview 4
2. APPROACH 8
2.1 Experimental Approach 92.2 Operational Assessment Approach 92.3 Administrative Approach 11
3. METHOD 11
3.1 Description of the National Airspace SystemSimulation Support Facility (NSSF) 11
3.2 Description of the Simulation 143.3 Experimental Design 19
4. RESULTS 21
4.1 Deviations from the Test Plan 214.2 Computer Data 224.3 Time Plots of Selected Blunders 334.4 Navigational Error Model Performance 364.5 Description of the Ad Hoc Run (Run 37) 414.6 Controller Questionnaire Data 434.7 Controller Response Time 45
5. DISCUSSION 46
5.1 Summary of the Results 465.2 Navigational Error Model Performance 485.3 Critique of the Simulation 48
6. CONCLUSIONS 50
7. RECOMMENDATIONS 50
7.1 Recommendations for the Phase III SJnulation 50
8. REFERENCES 53
v
TABLE OF CONTENTS (continued)
APPENDIXES
A - Aircraft Proximity Index (API)
B - Blunder Scenarios Used for the D/FW Phase IISimulation
C - Controller Questionnaire and ModifiedCooper-Harper Scale
D - Industry Observer Questionnaire
E - Data Analysis Computer Files
F - Original Simulation Schedule
G - Controller Information Questionnaire andConsent. Form
H - Technical Observer Report
I - Controller Report
ViV
vi
LIST OF ILLUSTRATIONS
Figure Page
1 D/FW Airport Configuration 6
2 Operational Assessment Decision Tree 10
3 NSSF Controller Laboratory 12
4 NSSF Radar Display 13
5 Video Map Display 15
6 Standard Deviation of Aircraft from the Localizer(ft) as a Function of Distance to Threshold (nmi) 16
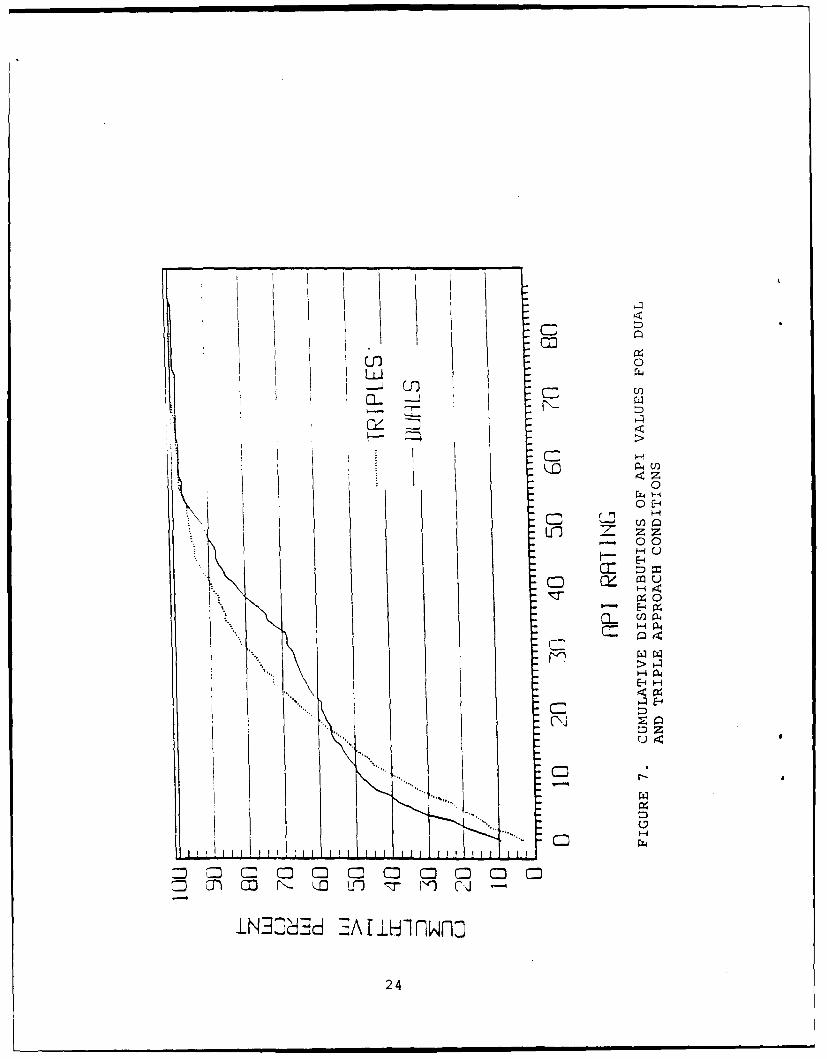
7 Cumulative Distributions of API Values for Dualand Triple Approach Conditions 24
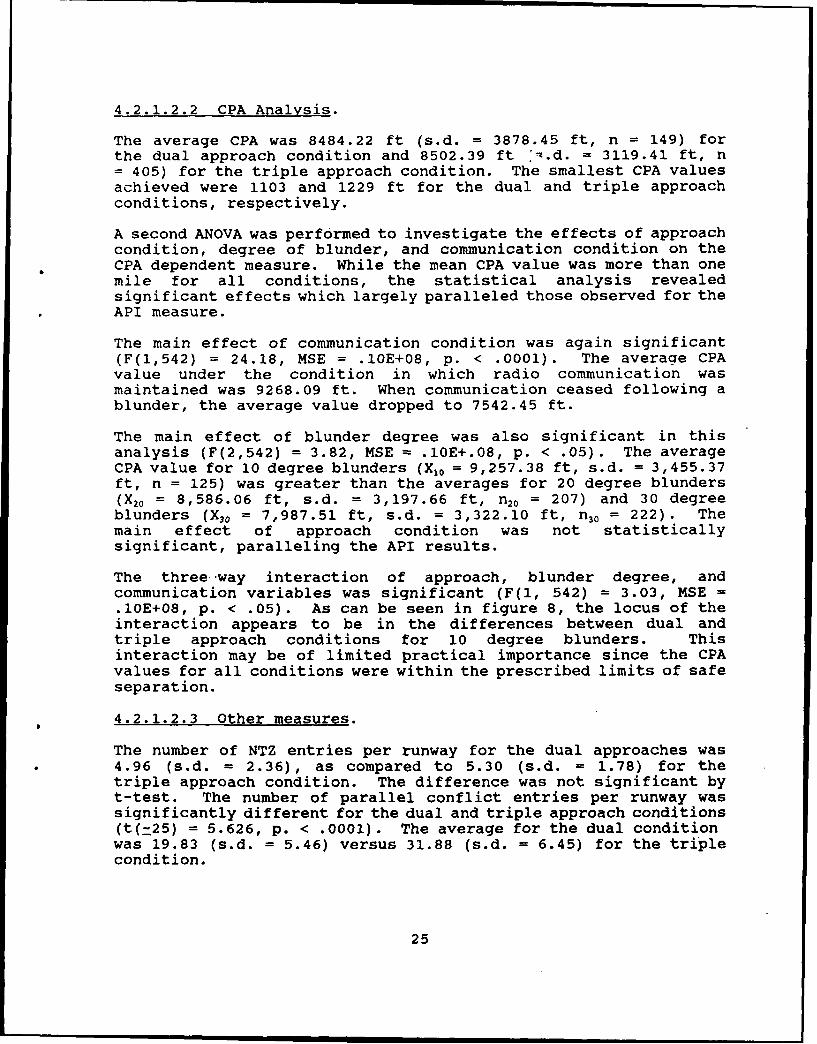
8 Average of CPA Values as a Function of ApproachCondition, Degree of Blunder, andCommunication Condition 26
9 Average CPA Value (ft) as a Function of Degreeof Blunder and Communication Condition 29
10 Average CPA Values as a Function of the Numberof Runways Threatened and the Degree of Blunder 30
11 Graphic Representation of Comparable ConditionsWithin the Dual and Triple Approach Conditions 31
12 Graphic Plot for Example 1 34
13 Graphic Plot for Example 2 37
14 Graphic Plot for Example 3 39
15 Flight Technical Error for the ThreeNavigational Models Used in D/FW Phase II 42
vii
LIST OF TABLES
Table Page
1 Turn On Altitudes and Glide Slope Interceptsfor the D/FW Phase II Simulation 5
2 Digital Data for Example 1 35
3 Digital Data for Example 2 38
4 Digital Data for Example 3 40
viii
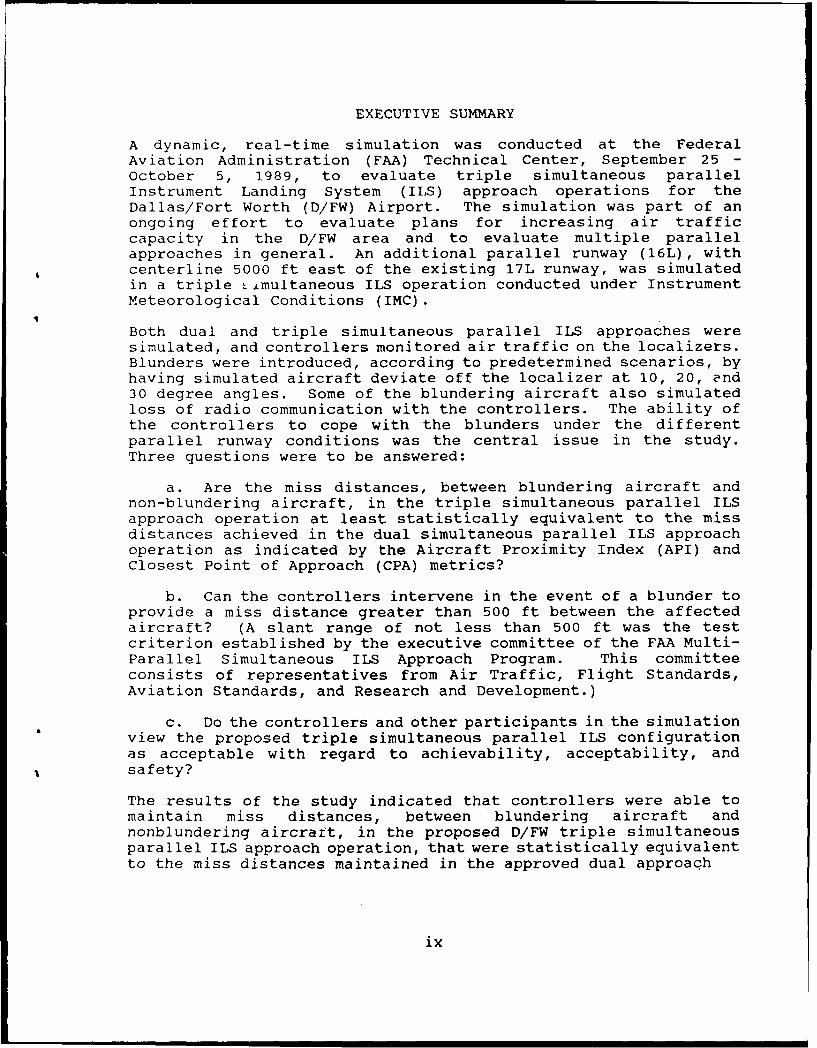
EXECUTIVE SUMMARY
A dynamic, real-time simulation was conducted at the FederalAviation Administration (FAA) Technical Center, September 25 -October 5, 1989, to evaluate triple simultaneous parallelInstrument Landing System (ILS) approach operations for theDallas/Fort Worth (D/FW) Airport. The simulation was part of anongoing effort to evaluate plans for increasing air trafficcapacity in the D/FW area and to evaluate multiple parallelapproaches in general. An additional parallel runway (16L), withcenterline 5000 ft east of the existing 17L runway, was simulatedin a triple -.multaneous ILS operation conducted under InstrumentMeteorological Conditions (IMC).
Both dual and triple simultaneous parallel ILS approaches weresimulated, and controllers monitored air traffic on the localizers.Blunders were introduced, according to predetermined scenarios, byhaving simulated aircraft deviate off the localizer at 10, 20, and30 degree angles. Some of the blundering aircraft also simulatedloss of radio communication with the controllers. The ability ofthe controllers to cope with the blunders under the differentparallel runway conditions was the central issue in the study.Three questions were to be answered:
a. Are the miss distances, between blundering aircraft andnon-blundering aircraft, in the triple simultaneous parallel ILSapproach operation at least statistically equivalent to the missdistances achieved in the dual simultaneous parallel ILS approachoperation as indicated by the Aircraft Proximity Index (API) andClosest Point of Approach (CPA) metrics?
b. Can the controllers intervene in the event of a blunder toprovide a miss distance greater than 500 ft between the affectedaircraft? (A slant range of not less than 500 ft was the testcriterion established by the executive committee of the FAA Multi-Parallel Simultaneous ILS Approach Program. This committeeconsists of representatives from Air Traffic, Flight Standards,Aviation Standards, and Research and Development.)
c. Do the controllers and other participants in the simulationview the proposed triple simultaneous parallel ILS configurationas acceptable with regard to achievability, acceptability, andsafety?
The results of the study indicated that controllers were able tomaintain miss distances, between blundering aircraft andnonblundering aircraft, in the proposed D/FW triple simultaneousparallel ILS approach operation, that were statistically equivalentto the miss distances maintained in the approved dual approach
ix
condition. None of the blunders in the triple or dual approachconditions resulted in a slant range miss distance of less than1000 ft. Thirdly, controllers, controller observers, and ATCmanagement observers concluded that the triple simultaneous ILSapproach operation at D/FW is acceptable, achievable, and safe.
x
1. INTRODUCTION.
1.1 PURPOSE.
This simulation was conducted to evaluate, using real-timesimulation, triple simultaneous ILS approach operations at theDallas/Fort Worth (D/FW) International Airport during InstrumentMetecrological Conditions (IMC). Specifically, the simulationhelped to determine whether triple simultaneous ILS approachoperations are comparable to current dual approach operations.
1.2 BACKGROUND.
1.2.1 Airport Capacity.
Substantial increases in aviation traffic have been projected overthe next two decades. In order to meet this anticipated increase,long-term efforts are under way to increase the capacity of theNational Airspace System (NAS).
As part of this effort, a five phase airport capacity improvementprogram is being conducted. The first three phases of the programevaluate triple and quadruple independent parallel runway approachconfigurations and scenarios at D/FW. This is followed by thedevelopment of national separation standards for application toother airports based on existing and upgraded equipment (Phases IVand V, respectively). This report covers Phase II.
One means of expanding NAS capacity is to create additionalairports. Although some are planned, new airports are costly,require a long time to plan and build, and often face political andsocial obstacles. Adding runways to existing airports is moretimely and less expensive if space is available, and the requiredstandards can be maintained for aircraft separation. Making themost efficient use of existing facilities provides near-termpayoffs at minimal cost.
The number of aircraft that can land at a facility is subject tospecial restrictions under IMC. Permitting more than two (thecurrent limit) simultaneous ILS approaches can increase the numberof landings which may occur under these conditions.
1.2.2 Safety.
At a minimum, triple and quadruple simultaneous ILS approaches, atleast 4300 ft apart, would be subject to the same limitations asdual simultaneous ILS approaches. Special requirements forsimultaneous ILS approaches are described below. (1]
1
a. Provide a minimum of 1000 ft vertical or a minimum of 3nautical miles (nmi) radar separation between aircraft during turn-on to parallel final approach. Provide minimum applicable radarseparation between aircraft on the same final approach course.
b. Separate monitor controllers, each with transmit/receive andoverride capability on the local control frequency, shall ensureaircraft do not penetrate the depicted No Transgressicn Zone (NTZ).
c. Aircraft established on a final approach course are separatedfrom aircraft established on an adjacent parallel final approachcourse provided neither aircraft penetrates the depicted NTZ.
Numerous studies by the FAA have addressed these requirements andoperations research based models of the system have been employedto study safety restrictions and capacity limits [2, 3, 4, 5, 6,7, 8, 9, and 101. Any change in standard procedures requiresrigorous testing to ensure that safety is not compromised.
1.2.3 Multiple Parallel Runway Studies Previous to the D/FWSeries.
Several studies involving parallel runway approaches and relatedissues have already been completed. Some of these haveinvestigated the effects of reducing separation between aircraftduring parallel approaches. The minimum acceptable separationdepends, in part, on aircraft navigational accuracy.
In 1975, a thorough study was conducted of aircraft navigationalaccuracy under normal operating conditions [4]. A simulationconducted in 1984 was the first to investigate navigationalaccuracy in the context of parallel instrument approaches. Thisinvestigation considered runways spaced 3000, 3400, and 4300 ftapart, employing both standard and modified radar displays usingthree levels of radar accuracy and update rates [11]. The resultsof the 1984 study have been questioned because 1) the navigationalaccuracy of the traffic samples may have been poor and 2) some ofthe analyses did not conform to the analytical models cited [6, 7].However, the 1984 study did establish the importance ofnavigational accuracy in determining system capacity and showed therelationships between a number of system parameters and thecontrollers' abilities to cope with blunders.
Since the 1984 simulation was carried out, a major- navigationsurvey was completed at the Chicago O'Hare facility [12]. Thisstudy and another study conducted at the Memphis InternationalAirport [13] have provided additional data for refining thenavigational error model in Phase II and future simulations in theD/FW series. It is important that the navigational error modelused in ATC simulation of parallel runways operations provide bothan accurate statistical representation of approaches on thelocalizer and visually realistic target movement to the
2
controllers. Navigational accuracy also affects blunder detection.If all simulated aircraft were to fly visually perfect ILSapproaches, then blundering aircraft would be easier to detect thanthey would be when navigational error is modeled in the simulation.
Additional real-time air traffic control (ATC) simulations havebeen conducted at the FAA Technical Center [14, 15] to investigateparallel runway questions. These studies are an importantcomplement to the models cited previously since they generateestimates of the model parameters and, more importantly, allowdirect observation of controller performance and recording ofcriterion measures related to safety and capacity. The 1988 D/FWand Atlanta Tower simulations are of direct interest to this studysince they addressed most of the issues unique to multiple runwayoperations and shared some of the methodology of the 1984simulation.
The Atlanta simulation evaluated two alternative runwayconfigurations. The first configuration included the addition ofa third parallel runway; the second included a 30 degree convergingrunway. The additional parallel runway was situated 3000 ft southof the existing runway - less than the current required separationdistance for simultaneous approaches (i.e., 4300 ft). Threetechnological changes were employed for the purpose of improvingcontroller performance in monitoring simultaneous approaches: 1)a 1-second update rate, high resolution radar, 2) an automatedalert to permit controller detection of aircraft entering the NTZ,and 3) !n expanded scale on the radar display. Aircraft blundersof 10, 20, and 30 degrees were executed, some with loss of radiocommunication. All approaches were flown with minimal navigationalerror.
The results of the Atlanta study projected an increase in capacityof up to 40 percent with the addition of either the parallel orconverging runway, depending on weather conditions. The extent ofrunway separation, degree of blunder, and number of runwaysthreatened all had significant impacts on safety related criterionmeasures.
The Atlanta simulation and the first simulation in the D/FW seriesboth used a metric called the Aircraft Proximity Index (API) tomeasure the severity of a parallel conflict situation between twoaircraft [see Appendix A]. The API, which ranges from 0 to 100,is a weighted measure of the smallest lateral and verticalseparation distances reached in each conflict, with verticalseparation being given more weight. while not to be considered anabsolute measure of safety or risk, the API does provide a usefultool in quantifying conflicts. An alternative measure of aircraftproximity is Closest Point of Approach (CPA), which is the smallestslant range separation achieved between two aircraft. This measurealso was used in the Atlanta study, as well as in the D/FW seriesof simulations.
3
1.2.4 D/FW Phase I.
During the 1990s, traffic in the D/FW terminal area is projectedto increase by as much as 100 percent [16]. To help meet thisanticipated growth, the D/FW Task Force was created. The TaskForce produced the D/FW Metroplex Air Traffic System Plan. Itspurpose was to provide procedures Zor the D/FW terminal area forthe period 1995 through 2005. The D/FW Phase I simulation was atwo-part study designed to test selected aspects of the plan. Thefirst part of the simulation evaluated concepts for usingadditional routes, navigational aids, runways, and en route andTerminal Radar Approach Control Facility (TRACON) traffic flows inthe initial implementation of the plan. The second part of theD/FW Phase I study focused on the proposed use of quadruplesimultaneous approaches.
The D/FW Phase I study simulated two additional arrival runwayswith turbojet aircraft on the existing runways and props andturboprops on the proposed outer runways.
As in the Atlanta study, analysis for the D/FW Phase I study wasbased largely on a detailed review of individual conflictsituations. The results of this analysis indicated that blundersthreatening two or more approaches were no more dangerous thanthose threatening only one other approach. The evaluation teamconcluded that quadruple approaches could be "conducted withoutincident even when the system was repeatedly challenged by aircraftblundering 30 degrees off course without communications."
1.3 SIMULATION OVERVIEW.
Unlike Phase I, the present study focused exclusively on themultiple simultaneous approach operation. The Phase II D/FWsimulation was designed to examine the safety issues relative tothe addition of a third independent parallel approach to the D/FWfacility.
The controllers manned the approach or departure monitor positions.Aircraft entered the simulator, already on the ILS, approximately20 nmi from the threshold. The aircraft flew at 180 knots (+ or -4 knots) until intercepting the glide slope. The aircraft beganthe approach with the standard aircraft separation distance asdetermined by aircraft type. Every 1 to 5 minutes an aircraft wasrandomly chosen to execute a blunder. A blunder was a deviationof 10, 20, or 30 degrees from the ILS heading toward the adjacentILS. The controllers issued vector changes to aircraft affecteddirectly or indirectly by the blundering aircraft. Thecontrollers' task was to maintain adequate distances betweenaircraft at all times. The D/FW Phase II simulation had otherfeatures which distinguished it from previous studies. These aredescribed in the following sections.
4
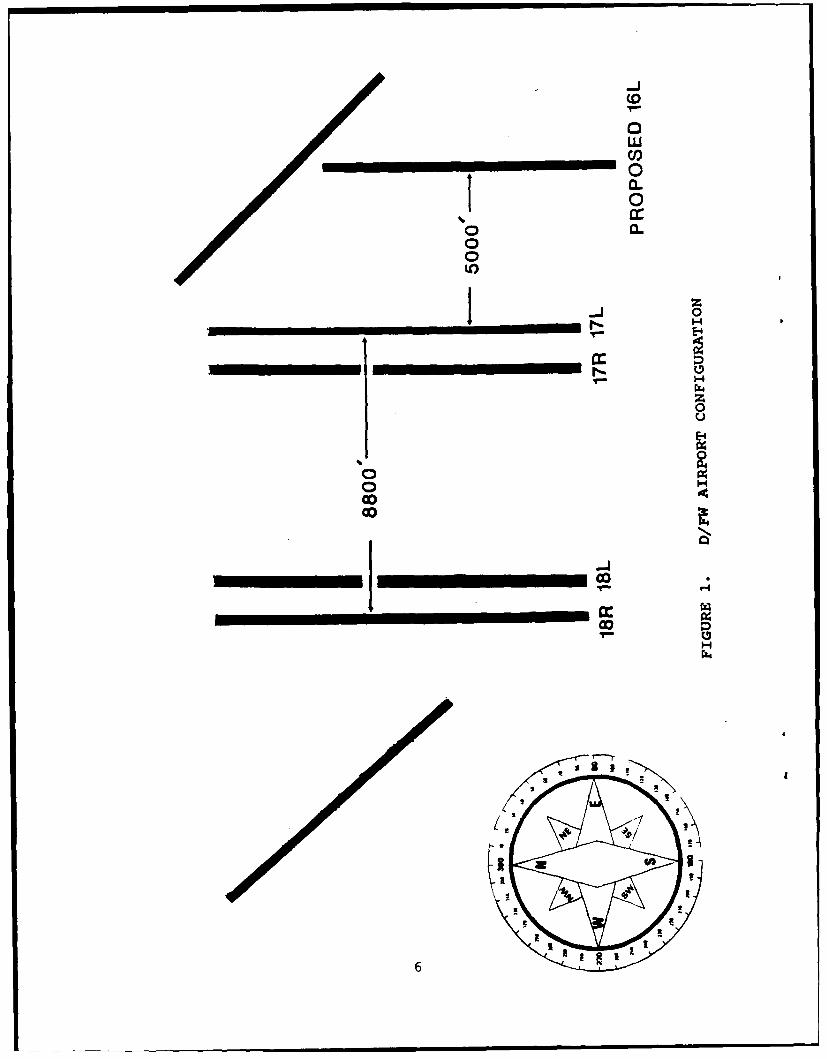
1.3.1 D/FW Airport Configuration.
The current D/FW airport configuration is shown in figure 1.Runways 17L and 18R, having centerlines separated by 8800 ft, wereused for the simulation, along with a proposed 8500 ft runway, 16L,with its centerline located 5000 ft east of the runway 17Lcenterline. For the dual runway airport conditions, an east anda west airport were simulated. The east airport consisted ofrunways 17L and 16L, separated by 5000 ft. The west airportconsisted of runways 17L and 18R, separated by 8800 ft. There areno major geographical or architectural obstructions at D/FW airportrequiring special traffic handling procedures.
1.3.2 Flightpaths.
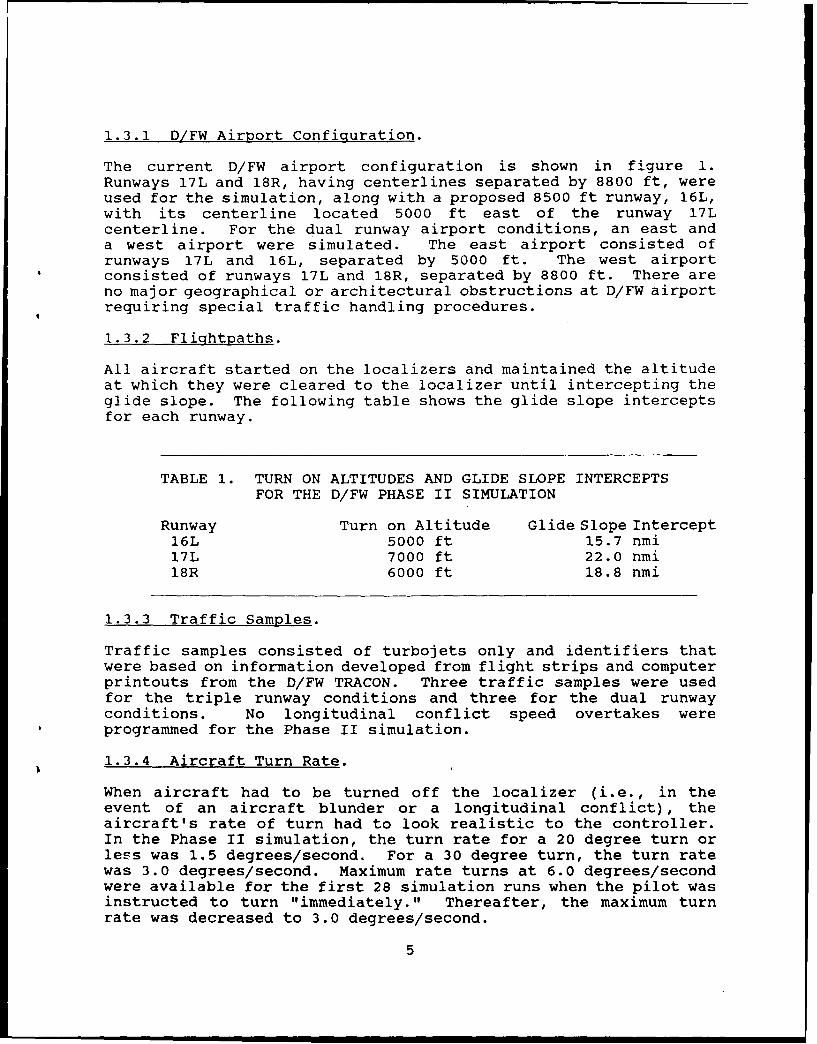
All aircraft started on the localizers and maintained the altitudeat which they were cleared to the localizer until intercepting theglide slope. The following table shows the glide slope interceptsfor each runway.
TABLE 1. TURN ON ALTITUDES AND GLIDE SLOPE INTERCEPTSFOR THE D/FW PHASE II SIMULATION
Runway Turn on Altitude Glide Slope Intercept16L 5000 ft 15.7 nmi17L 7000 ft 22.0 nmi18R 6000 ft 18.8 nmi
1.3.3 Traffic Samples.
Traffic samples consisted of turbojets only and identifiers thatwere based on information developed from flight strips and computerprintouts from the D/FW TRACON. Three traffic samples were usedfor the triple runway conditions and three for the dual runwayconditions. No longitudinal conflict speed overtakes wereprogrammed for the Phase II simulation.
1.3.4 Aircraft Turn Rate.
When aircraft had to be turned off the localizer (i.e., in theevent of an aircraft blunder or a longitudinal conflict), theaircraft's rate of turn had to look realistic to the controller.In the Phase II simulation, the turn rate for a 20 degree turn orless was 1.5 degrees/second. For a 30 degree turn, the turn ratewas 3.0 degrees/second. Maximum rate turns at 6.0 degrees/secondwere available for the first 28 simulation runs when the pilot wasinstructed to turn "immediately." Thereafter, the maximum turnrate was decreased to 3.0 degrees/second.
5
CL(0
00
raC,,
00
Gooco0
00
(30
_ _ _ _ _ H
1.3.5 Blunder Scenarios.
The test director and his assistant initiated blunders by directingsimulator pilots to turn a particular aircraft away from thelocalizer. All blunders were scripted. Ten different scripts wereused for the triple approach condition, and five scripts were usedfor each of the dual runway airports. Representative scripts areshown in Appendix B. The scripts or scenarios specified 1) therun time at which the blunder was to occur (TIME), 2) the runwayassignment of the blundering aircraft (RW), 3) the blunderingaircraft, by position (e.g., second from the bottom of the radarscope) (A/C#), 4) the direction (LR) and degree of turn (AMT), 5)continuation or loss of radio communication with the controller(COMM), and 6) the time between the initiation of each successiveblunder (INTERVAL). The scripts were created in accordance withthe following guidelines:
a. The time for the initiation of the blunder was selected froma random distribution of intervals having an average of 3 minutes,a minimum of 1, and maximum of 5 minutes.
b. The runway to which the blundering aircraft was assigned wasselected at random so that each of the runways being used had anequal probability of being selected.
c. The direction of turn was chosen so that aircraft on outsidelocalizers were always turned inward toward the other localizer(s);aircraft on the middle localizer were given an equal probabilityof blundering either to the right or to the left.
d. The size of the turn away from the assigned localizer was10, 20, or 30 degrees. Degree of turn was randomly assigned toeach aircraft, with the restriction that 60 percent of the aircraftwould make a 30 degree turn, 20 percent would make a 20 degreeturn, and 20 percent would make a 10 degree turn.
e. Some blundering aircraft were directed on a random basis tocease communication with the controller after the blunder wasinitiated. The probability of a scripted communications failurefollowing a blunder was 50 percent.
Approximately 2 weeks prior to the simulation, members of the EX-COM viewed one of the traffic samples with a blunder scenario, inorder to determine the number of blunders which would result in aslant range of 500 ft or less between aircraft if a controller didnot intervene to rectify the situation. It was the opinion of theEX-COM that the number observed (3-4) was sufficient and that nochanges would be required in the scenarios prior to the start ofthe study.
7
1.3.6 Questions Addressed in This Study.
The simulation addressed three questions for the proposed triplesimultaneous ILS approach configuration:
a. Are the miss distances, between blundering aircraft and non-blundering aircraft, in the triple simultaneous ILS approachoperation at least statistically equivalent to the miss distancesachieved in the dual simultaneous ILS approach operation asindicated by the API and CPA metrics.
b. Can the controllers intervene in the event of a blunder toprovide a miss distance (greater than 500 ft) between the affectedaircraft.
c. Do the controllers and other participants in the simulationview the proposed triple simultaneous ILS configuration asacceptable with regard to achievability, acceptability, and safety.
2. APPROACH.
The principal goal of this study was to determine whether theproposed triple approach operations are as safe as the existingdual approach operation. The minimum requirement for modifyingATC standard procedures is the demonstration of undiminishedsafety. Evidence supporting undiminished safety as a result ofproposed system changes can be obtained in a number of ways:
a. Demonstrate, through the collection and analysis ofoperational data, that present standards are unnecessarilyrestrictive.
b. Conduct flight tests supporting the feasibility and safetyof proposed changes.
c. Conduct operations research, math modeling, or fast-timesimulation and examine the impact of proposed changes on a varietyof operational parameters and contingencies.
d. Conduct real-time ATC simulation studies of the changedsystem, introducing errors and failures, and compare the resultswith those of present operations.
These methods are neither independent nor mutually exclusive.Reliable field data are essential for successful modeling and forsimulation. Real-time ATC, flight simulation, and flight testingare needed to generate estimates of the operational parameters usedfor modeling and fast-time simulation. Modeling provides aframework for collecting and analyzing field data. The D/FW PhaseII study, a real-time ATC simulation, can, therefore, be viewed as
8
part of an ongoing process of gathering, analyzing, and evaluatingddta to investigate the feasibility and acceptability of multiplesimultaneous approach operations.
Three approaches were used in this study to evaluate the proposedsimultaneous approach operation. One was based on the direct andindirect comparison of the three-runway operation with the presentstandard of two-runway operations. This was called the"Experimental Approach." The second consisted of an assessment ofsystem performance against a set of predetermined criteria. Thiswas called the "Operational Assessment Approach." The third wasbased on observations and reports from industry representatives andparticipating controllers concerning the conduct and implicationsof the simulation. This was termed the "Administrative Approach."
The focus of this report is the Experimental Approach. The othertwo approaches are summarized in the discussion section and areused to help explain experimental results, relate them to theobservational data, and draw conclusions about their meaning.Although this report emphasizes the Experimental Approach, allthree approaches are described in the following sections.
2.1 EXPERIMENTAL APPROACH.
The Experimental Approach involved the comparison of systemperformance when only two runways were involved (today's operation)with the outcome of comparable events involving three runways. Itcompared two-runway airports with three-runway airports and furtheranalyzed the three-runway airport data, comparing events that aretypical of two-runway operations with those that are unique tothree-runway operations. Data for these comparisons came from theintroduction of scripted blunders into the simulation runs.Blunders of 10, 20, and 30 degrees were initiated at various pointsduring the simulation runs and the controllers' ability to handlethe blunder situations by maintaining adequate distance betweenaircraft was the main criterion measure. This approach focused onstatistical analyses of data on the distance between aircraftinvolved in conflict situations as measured by API and CPA.Results were interpreted in light of the safety related questionsposed in the study.
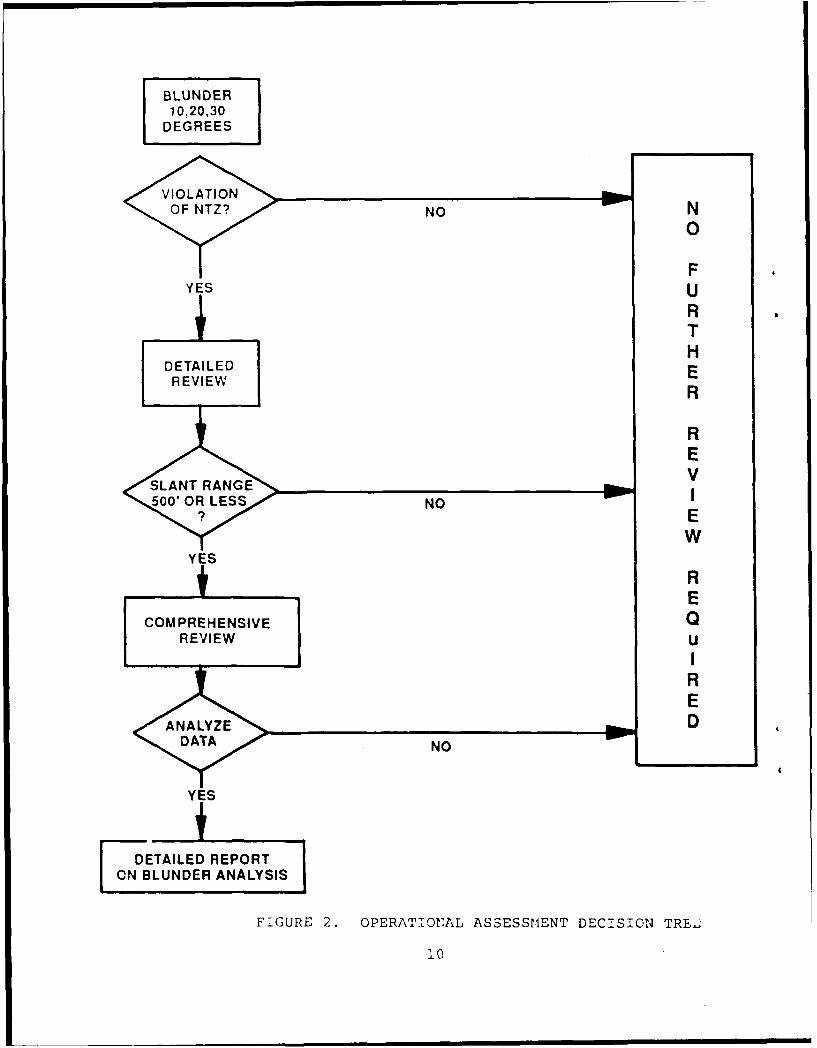
2.2 OPERATIONAL ASSESSMENT APPROACH.
The Operational Assessment Approach evaluated each incident thatmet criteria outlined in figure 2, Operational Assessment DecisionTree, as if it had occurred in an operational environment. Adetermination was made of its seriousness and cause. Theoperational assessment approach differed from the ExperimentalApproach in two ways. First, only a small subset of data wasconsidered, specifically, data for those occurrences which wouldhave major safety implications if they occurred in the operationalenvironment. Second, each occurrence of this type was considered
9
BLUNDER110,20,301
0
FYES U
RT
R
RE
EwRE
COMPREHENSIVEQREVIEW U
RE
FI UR 2.AYZ
DPR T~ A S E S E T D C S O R
i>0
individually, and was subjected to a detailed analysis by anexecutive committee (EX-COM). The analysis of each event utilizeddata from many sources, including controller and technical observerreports, computer data, and video and audio tape materials.
2.3 ADMINISTRATIVE APPROACH.
The Administrative Approach consisted of observations and reportsfrom the controllers who participated in the study and fromrepresentatives from industry and the aviation community whowitnessed the simulation. Overview analysis provided in a reportby EX-COM was also part of this approach. The views of partici-pating controllers concerning the simulation came from two sources:1) comments provided in the controller questionnaire administeredfollowing each run, and 2) a controller report includingevaluations and recommendations, produced after the completion ofthe simulation. A questionnaire was also distributed to industryobservers, providing the opportunity to collect their insights intothe simulation as well as related issues of broader scope.
3. METHOD.
3.1 DESCRIPTION OF THE NATIONAL AIRSPACE SYSTEM SIMULATION SUPPORTFACILITY (NSSF).
This study took place at the FAA Technical Center, Atlantic CityInternational Airport, New Jersey, using the NSSF. The NSSF housesa general purpose ATC simulator designed to provide a realistictest bed for developing, testing, and evaluating advanced ATCconcepts, airspace management plans, and procedures. The simulatorconsists of three subsystems: 1) the Controller Laboratory, 2) theNSSF Simulator Pilot Complex, and 3) the Central Computer Facility.
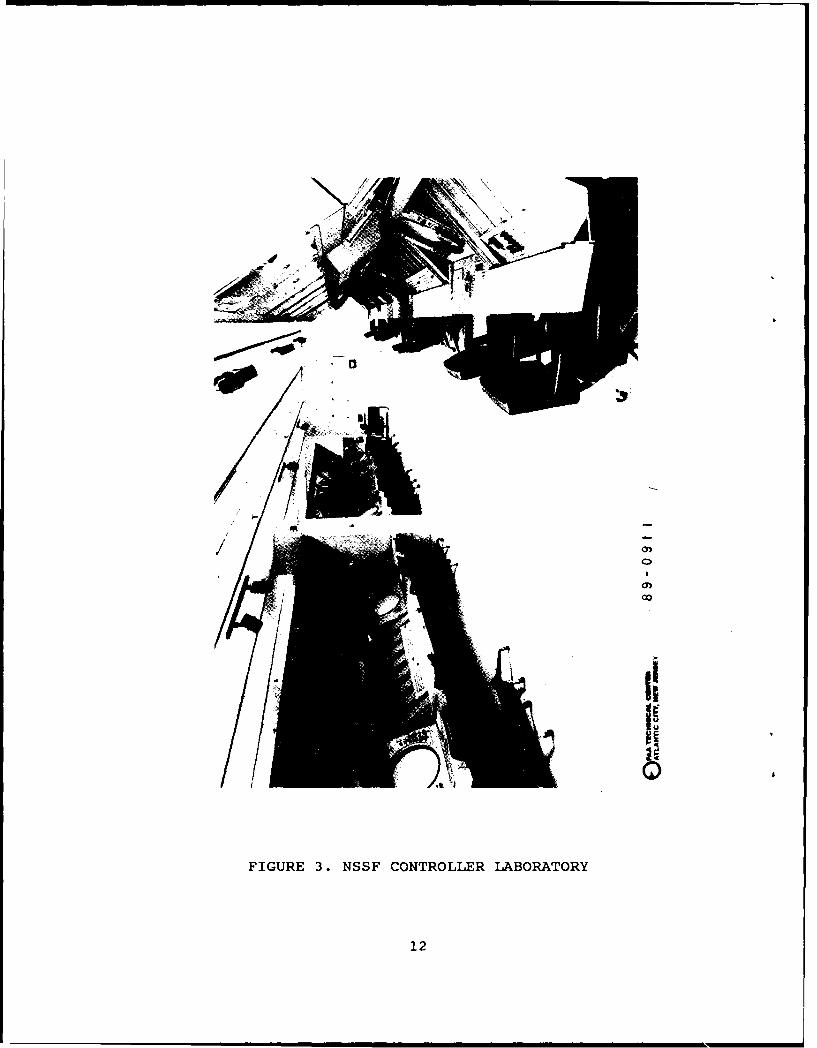
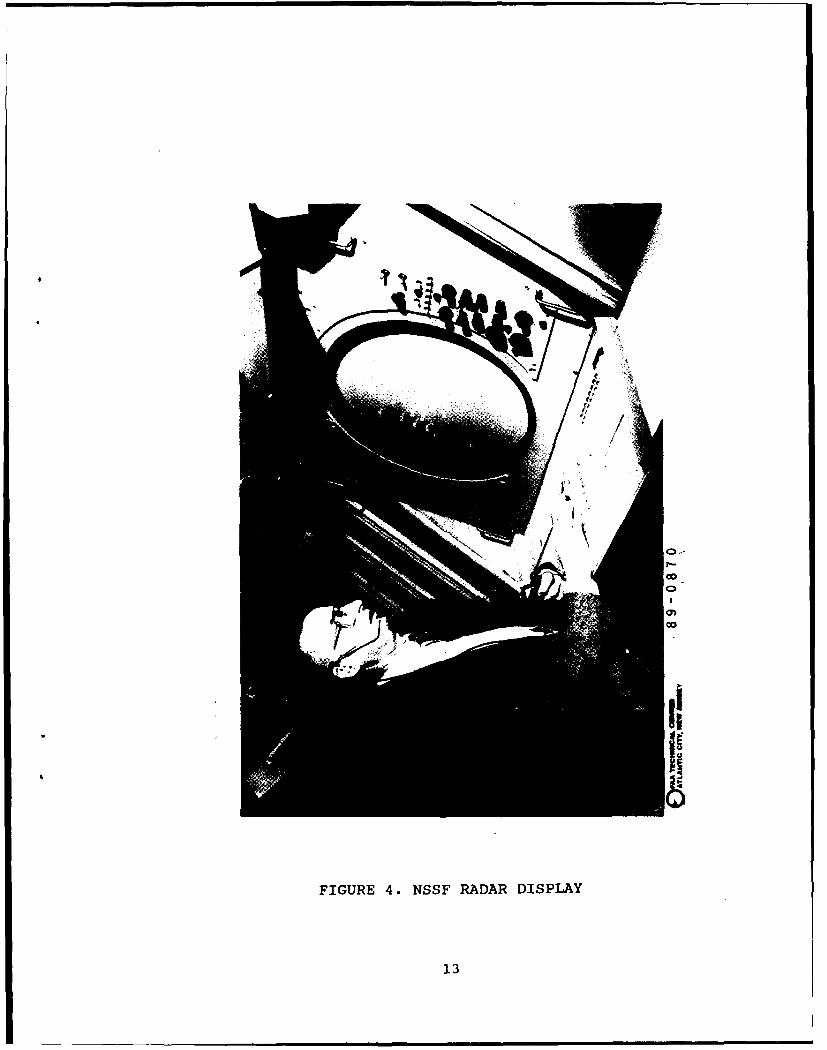
The Controller Laboratory simulates an en route or terminal controlroom and contains eight digital, random write displays andassociated keyboard entry and communication equipment (see figure3). The radar displays are similar to standard Automated RadarTerminal System (ARTS) and en route plan view displays (PVDs).They provide track history by showing "=" marks at each of theaircraft's last three target positions, rather than through the useof phosphor persistence as in ARTS (see figure 4). The laboratoryis realistically configured permitting participating controllersto function with little or no acclimation. A communications systemprovides controller-to-controller, controller-to-pilot (NSSFsimulator operator), and pilot-to-controller communication.
The NSSF Simulator Pilot Complex houses the individuals who "pilot"the simulation aircraft and the equipment they use to accomplishthis task. NSSF simulator pilots are in voice contact withcontrollers and respond to controller instructions by enteringkeystrokes onto a specialized keyboard. These actions result inthe simulated aircraft changing course, altitude, or speed. Each
li
00
00
iIi
FIGURE 3. NSSF CONTROLLER LABORATORY
12
C.
FIGURE 4. NSSF RADAR DISPLAY
13
NSSF simulator pilot can control as many as 10 aircraft. Aircraftresponses are programmed to be consistent with the type of aircraftbeing simulated.
The NSSF computer in the Central Computer Facility generates thesimulation targets and records data on aircraft position andstatus.
3.2 DESCRIPTION OF THE SIMULATION.
3.2.1 Video Map Presentation.
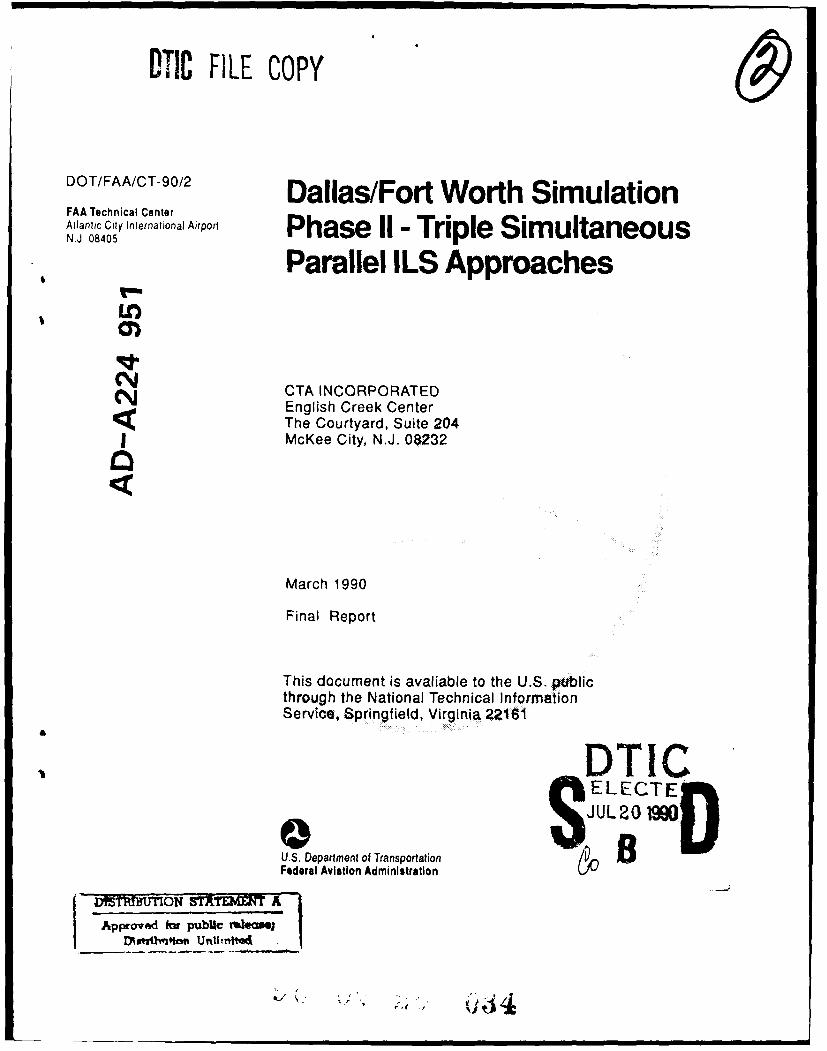
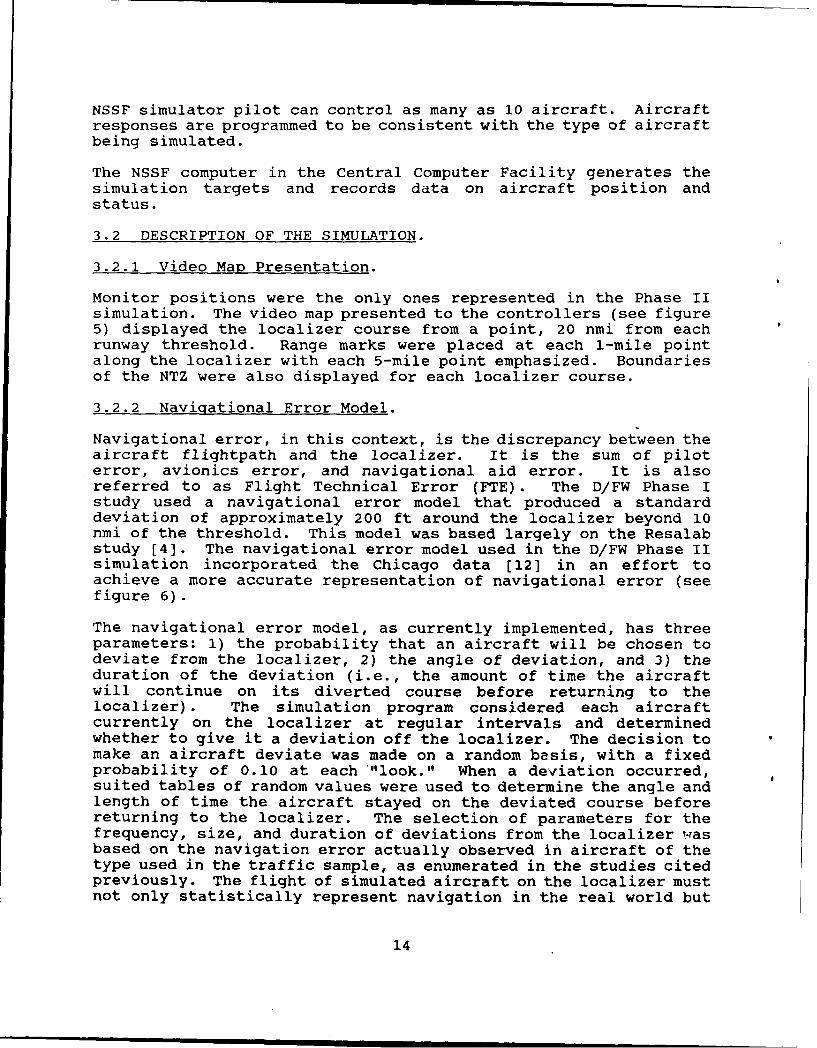
Monitor positions were the only ones represented in the Phase IIsimulation. The video map presented to the controllers (see figure5) displayed the localizer course from a point, 20 nmi from eachrunway threshold. Range marks were placed at each 1-mile pointalong the localizer with each 5-mile point emphasized. Boundariesof the NTZ were also displayed for each localizer course.
3.2.2 Navigational Error Model.
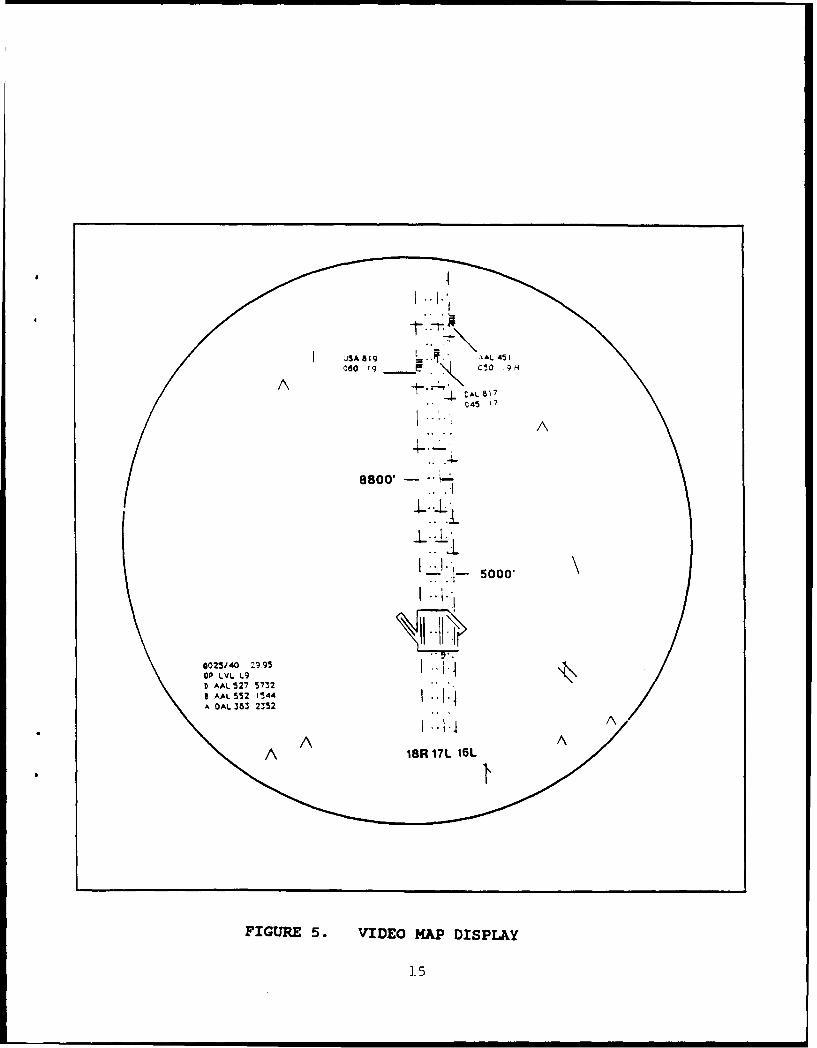
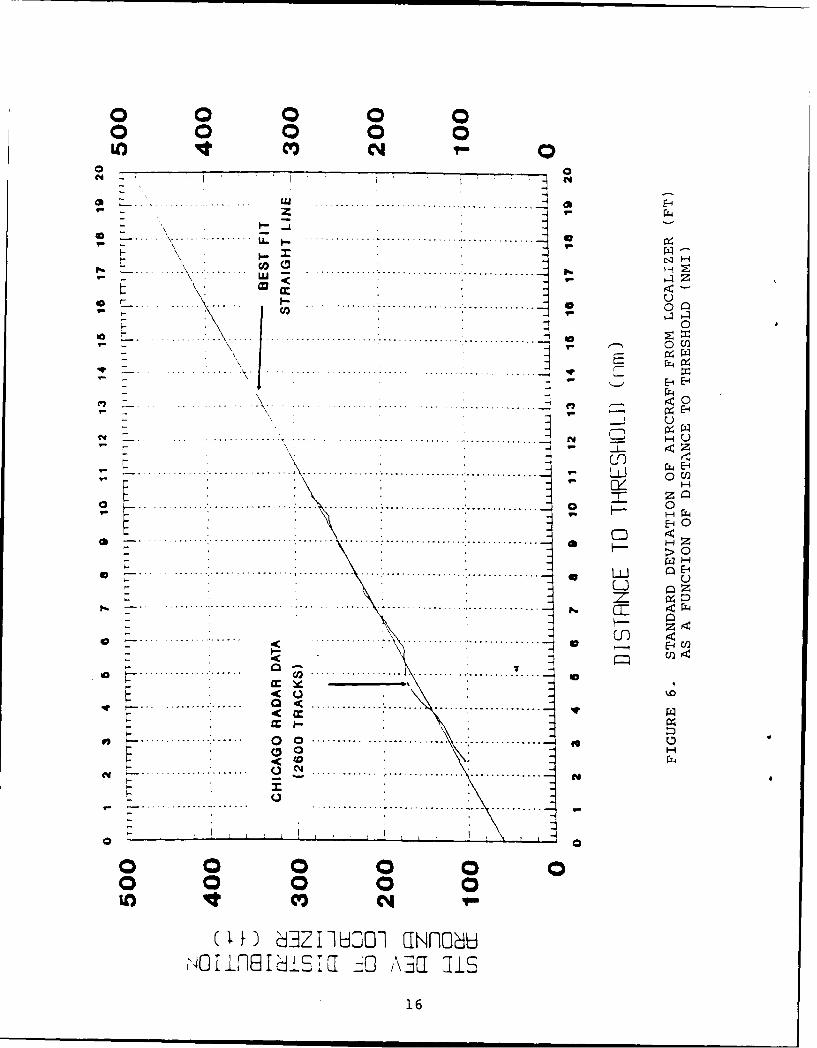
Navigational error, in this context, is the discrepancy between theaircraft flightpath and the localizer. It is the sum of piloterror, avionics error, and navigational aid error. It is alsoreferred to as Flight Technical Error (FTE). The D/FW Phase Istudy used a navigational error model that produced a standarddeviation of approximately 200 ft around the localizer beyond 10nmi of the threshold. This model was based largely on the Resalabstudy [4]. The navigational error model used in the D/FW Phase IIsimulation incorporated the Chicago data [12] in an effort toachieve a more accurate representation of navigational error (seefigure 6).
The navigational error model, as currently implemented, has threeparameters: 1) the probability that an aircraft will be chosen todeviate from the localizer, 2) the angle of deviation, and 3) theduration of the deviation (i.e., the amount of time the aircraftwill continue on its diverted course before returning to thelocalizer). The simulation program considered each aircraftcurrently on the localizer at regular intervals and determinedwhether to give it a deviation off the localizer. The decision tomake an aircraft deviate was made on a random basis, with a fixedprobability of 0.10 at each "'look." When a deviation occurred,suited tables of random values were used to determine the angle andlength of time the aircraft stayed on the deviated course beforereturning to the localizer. The selection of parameters for thefrequency, size, and duration of deviations from the localizer wasbased on the navigation error actually observed in aircraft of thetype used in the traffic sample, as enumerated in the studies citedpreviously. The flight of simulated aircraft on the localizer mustnot only statistically represent navigation in the real world but
14
US 81 LAL 45
I
.4-.8800 . I
5000
4025/40 2995 iOP LVL L.9
DAAL 527 5732I AAL 552 154AA OAL 363 2352
FIGURE 5. VIDEO MAP DISPLAY
J5
o 0 0 00 0 0 0 0It) N%
.. . ........ .. ......
~.z r1'S
... ...- - . . ,. . .:.. ........ .................. .... ............... ..... ............... ... ....... .... .._2 C0
5--.
. .. .................. ............
. .. ... .... ....... . ........... .. ......0' 0
- .. . ................ ... ............... ......................
. . . -\\ E-4
4 ... .. . 94 U
t- c
z
. ii..... 0
O~ 0
-z CI-.
00[ . HS 0 ~f I
zz
10
.. ......... .....
.................. 0 ...........................< r16
must also provide controllers with visually realistic targetmotion. The D/FW Phase II navigational model was a product ofthese two constraints.
As in the Phase I simulation, controllers were permitted to directstraying aircraft to return to the localizer. If no action wastaken, the aircraft would return to the localizer on its own.
3.2.3 Questionnaires and Other Written Materials.
A questionnaire was administered to the controllers after thecompletion of each run. The questionnaire assessed the level ofdifficulty, realism, and controllability of the task on a scal. of1 to 10. A mental workload rating scale, the Modified Cooper-Harper Scale, was also attached to the questionnaires. This scalehas been validated and employed in a variety of applications. Thescale consists of a decision tree which is used by the subject torate the level of difficulty and mental workload associated witha given task. A copy of the questionnaire and the Modified CooperHarper Scale (with instructions) are provided as Appendix C. Aspart of the Administrative Approach to this study, representativesfrom industry were to observe the simulation and provide theirobjective views of the test and its implications. Accordingly, aquestionnaire was prepared to solicit the assessments of theseobservers (see Appendix D). The questionnaire included two rating-scale questions concerning the degree of realism in the simulationand the feasibility of triple simultaneous ILS approaches. A thirdquestion sought additional comments and suggestions.
A log book was used by experimenters as an aid in recording theirobservations of controller actions, blunders, and any unusualevents constituting deviations from the Test Plan.. The log bookalso served as a checklist for ensuring correct controller-runwaypairings and operating the audio and video equipment. Signs wereprepared for placement at the top of each radar workstation foreach run. The signs indicated the runway number to be monitoredat that workstation, as well as a letter code (A-E) used toidentify the controller assigned to the workstation during the run.
3.2.4 Data Collection.
During the course of each simulation run, data were collected bothmanually and automatically. Automated data collection was providedby the NSSF computer which continuously recorded system variablessuch as aircraft position and speed once per second. The computeralso recorded all simulator pilot inputs and the time at which eachoccurred.
Controller and simulator pilot voice communications were recordedusing a 20-channel audio recorder. An S-VHS camcorder mounted ona tripod was used to make continuous video recordings of a radardisplay which was dedicated to that purpose. Video recordings were
17
made of all triple approach runs and the east dual-runway airportruns. Controllers' voices were recorded on the video tape, usinga pair of microphones above the controllers' displays.
The systematic video and audio recording of the entire simulationwas performed as a means of augmenting analysis of individualblunders. The video and audio tape recordings of the simulationalso provided a method by which controller response time could bemore precisely estimated. This enabled experimenters to evaluatethe relationship between blunder initiation time and controllerresponse time, as well as the relationship between controllerresponse time and the initiation of a change in the instructedaircraft's performance.
Manual data collection was provided by technical observers fromD/FW who sat behind the controllers and took detailed notes foreach blunder and its associated controller responses. As notedboth industry observers and contractor personnel provided datathrough the completion of questionnaires and log books.
3.2.5 Data Reduction.
The data collected by the simulation computer were summarized onthe same system at the end of each day and the files copied tofloppy disk for eventual transfer to PCs for data analysis. Asample of each type of computer file generated is shown in AppendixE. Information contained in the computer summary files includedthe following:
a. number of NTZ transgressions;
b. number of parallel conflicts;
c. API and CPA values for parallel conflicts;
d. number of longitudinal conflicts;
e. API and CPA values for longitudinal conflicts;
f. response time to blunders (estimated from pilot messagetime);
g. number of blunder responses to nonblunders (i.e., falsealarms);
h. number of communications;
i. number of speed changes;
j. number of nonblundering approaches aborted; and
k. number of aircraft landed.
18
Additional data reduction was performed using Lotus 1-2-3, a PC-
based spreadsheet software program.
3.2.6 Data Analysis.
Data analysis was performed using the Complete Statistical System(CSS), release 2.1, a product of STATSOFT, Inc. CSS functions usedin the analysis included Descriptive Statistics, T-tests, Analysisof Variance (ANOVAs), and Nonparametric Statistics (Mann-WhitneyU).
In addition to the statistical analysis, technical and industryobserver reports, comments from controller questionnaires andreports, and experimenters' log books were reviewed and summarized.
3.3 EXPERIMENTAL DESIGN.
3.3.1 Subjects.
The subjects were five air traffic control specialists and/orsupervisors from the D/FW TRACON. The subjects were volunteers andwere selected in accordance with the National Air TrafficControllers Association (NATCA) D/FW local and the D/FW TRACONunderstanding on Employee Participation Group (EPG) participation.One of the air traffic control specialists was the NATCA D/FW areasafety representative and the D/FW TRACON local representative forthe project. The subjects had an average of 15.6 years ofexperience in ATC, with a minimum of 7 years and a maximum of 30years. All had at least 4 years of experience working parallelapproaches.
3.3.2 Design.
A total of 40 simulation runs over 9 working days were planned.The original simulation schedule, including controller runwayassignments, is shown in Appendix F. Twelve runs were scheduledwith dual approaches, with the dual runs distributed at thebeginning, middle, and end of the 2-week test period. Two dualapproach airports were set up during each of the dual approachruns, a west airport with runways 18R and 17L, and an east airportwith runways 17L and 16L. Twenty-eight runs utilized triple runwayapproaches and were interspersed with the dual approach runs.
Assignments of controllers to runs and runway positions were madeon a random basis with the following restrictions:
a. Controller assignments were balanced between dual and tripleapproach runs.
19
b. Runway assignments were balanced between left and rightrunways in the dual approach runs and the inner and outer runwaysin the triple approach runs.
c. Each controller participated in approximately the same number
of runs on a given day.
Independent variables in this study consisted of the following:
a. the number of runways (2 or 3);
b. the direction of the blunder (to the left or right of thelocalizer);
c. the degree of turn of the blundering aircraft (10, 20, or 30degrees); and
d. loss or maintenance of radio communications betweenblundering aircraft and controllers.
The main dependent variables of interest in this study relate tosafety. The primary dependent measures related to safety were CPAand API. Other safety measures included the number of NTZ entries,the numbers of parallel and longitudinal conflicts, and the numberof pilot warning messages.
Dependent measures derived from the controller questionnaire werethe ratings of the level of realism, difficulty, andcontrollability for each of the runs, and the mental workloadscores from the Modified Cooper-Harper Scale.
3.3.3 Procedure Used to Conduct the Simulation.
3.3.3.1 Orientation.
Prior to the start of the simulation, participating controllerswere briefed on the procedures to be followed during thesimulation. They were given the schedule of simulation runs andinstructions for completing the questionnaires which wereadministered at the conclusion of each run. Each controller wasinformed of his assigned letter code (A-E) which was used inpairing the controllers and runways throughout the simulation.The controllers were informed that letter codes would be used inall subsequent data collection, analysis, and reporting in orderto ensure anonymity. Controllers were also asked to complete aquestionnaire providing information about their backgrounds in ATCand a consent form to confirm their willingness to participate inthe simulation (see Appendix G). The controllers were told thatthey could withdraw from the simulation at any time. Following thebriefing, D/FW controllers were given a tour of the FAA TechnicalCenter and a demonstration of the equipment they were to use. Nosimulation runs were conducted on the day of the briefing.
20
3.3.3.2 Data Runs.
The following day, the test director and his assistant instructedthe controllers on the use of the PVDs after which the simulationwas initiated. Controllers participated in approximately fiveruns per day over the next 8 days (excluding weekends), with a 15-20 minute rest period between runs. Directly following each runthe controllers completed the questionnaire and the ModifiedCooper-Harper Scale.
4. RESULTS.
This section presents the findings of the simulation. Section 4.1details the deviations from the Test Plan procedure which occurredin the Phase II simulation. Section 4.2 presents the results ofthe statistical analyses of the computer data. Time plots ofselected blunders are described in Section 4.3, and thenavigational model data is presented in Section 4.4. Section 4.5describes the results of an ad hoc run (i.e., run 37). Thecontroller questionnaire data are discussed in Section 4.6.Finally, Section 4.7 describes the results of the video and audiotape analysis of controller response time conducted.
4.1 DEVIATIONS FROM THE TEST PLAN.
A number of deviations from the Test Plan occurred during thesimulation. Those deviations which had implications for the dataanalysis are enumerated in the following sections.
4.1.1 Changes of Schedule.
The schedule depicted in Appendix E was not strictly followedduring the simulation runs. There were several reasons for this,including equipment malfunctions, major changes in the navigationalmodel (see Section 4.1.3), and the loss of one controller'sparticipation following run 26. As a result of these and otherunavoidable events, the total number of valid runs conducted was33. Of these, only 6 were dual approach runs; 27 were tripleapproach runs. Three of the 6 dual runs occurred at the beginningof the study and were subject to effects of practice and a numberof simulator pilot errors. Analysis of the dual runs indicated nosignificant differences between runs even in the presence of theeffects just described.
4.1.2 Variations in Simulation Run Time.
Simulation runs were to be 60 minutes in length. While thisschedule was followed during the first half of the experiment, inthe second half the simulation runs were often halted following thelast blunder (i.e., at approximately 58 minutes into the run).
21
4.1.3 Adjustments in the Navigational Model.
Two adjustments were made to the navigational model during thesimulation. The first occurred after the second run, the changewas major, necessitating that the first two runs be eliminated fromthe data analysis. The second change, a relatively minor one,followed run 32 and is explained in Section 4.4. The data analysespresented in the following sections do not distinguish between thefirst 29 and the last 4 valid runs on the basis of navigationalmodel. However, a discussion of the three models used and theresulting navigational error data are presented in Section 4.4.
4.2 COMPUTER DATA.
In addition to the descriptive statistics reported (e.g., means,standard deviations), the analyses of the computer data utilizeda number of inferential statistics, including analysis of varianceand t-tests for independent samples.
With regard to the analysis of variance technique, two types ofeffects are considered, main effects and interactions. A maineffect is the effect of a variable considered in isolation. Forexample, the main effect of communication condition would considerthe effect of having (or not having) radio communication betweencontroller and simulator pilot, on a system performance measure,such as API. Other variables which might influence this effect(e.g., runway separation, degree of blunder) are ignored.
An interaction, on the other hand, represents the joint effect oftwo or more variables, considered together. A significantinteraction occurs when either 1) a variable has disproportionateeffects at different levels of the other variable(s), or 2) avariable has opposite effects at different levels of the othervariable(s). As an example, if API values increased from the dualto the triple approach condition for the radio communicationcondition, but decreased from the dual to triple approach conditionfor the no radio communication condition, an interaction wouldexist in the data.
Main effects and interactions in an analysis of variance aredenoted by F statistic values. The presentation of these valuesis exemplified by F(1,21) = 19.05, MSE = 2.43, p. < .01, where thenumbers in parentheses following the F signify the numerator anddenominator degrees of freedom. MSE stands for mean square error,the error term used in the F test.
Finally, t-tests are used in this report to compare the means oftwo independent samples. the format used to report the "t" isexemplified by (t(5) = 2.14, p. < .01), where the number in
22
parentheses following the "t" signifies the degrees of freedom forthe test. In those cases in which sample sizes differ for the twoindependent samples, the degrees of freedom value is aproximated.1
4.2.1 Dual Versus Triple Approach Comparisons.
The data analysis reported in this section compares dual and tripleapproaches with regard to airport safety issues.
4.2.1.1 Aircraft Activity Data.
The mean number of aircraft handled per runway was 38.92 (s.d. =.83, n = 24) in the dual approach condition and 38.54 (s.d. = 1.41,n = 81) in the triple approach condition. Because scriptedblunders were included in the simulation, fewer aircraft werelanded than were initially handled. The mean number of aircraftlanded per runway was 22.46 (s.d. = 2.50, n = 24) for the dualapproach condition and 23.91 (s.d. = 3.07, n 81) for the tripleapproach condition. On the average, the number of aircraft landedduring each 1-hour simulation was 45 for each of the dual runwayconfigurations and 72 for the three-runway configuration.
4.2.1.2 Safety Data.
4.2.1.2.1 API Analysis.
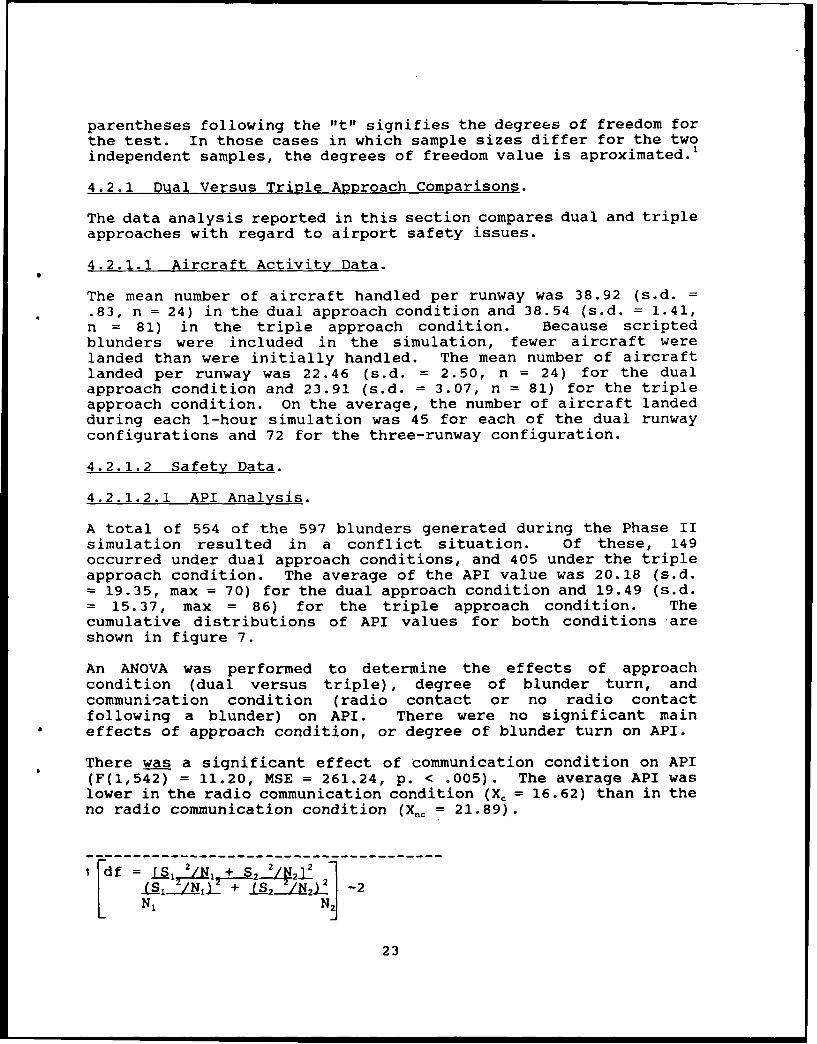
A total of 554 of the 597 blunders generated during the Phase IIsimulation resulted in a conflict situation. Of these, 149occurred under dual approach conditions, and 405 under the tripleapproach condition. The average of the API value was 20.18 (s.d.= 19.35, max = 70) for the dual approach condition and 19.49 (s.d.= 15.37, max = 86) for the triple approach condition. Thecumulative distributions of API values for both conditions *areshown in figure 7.
An ANOVA was performed to determine the effects of approachcondition (dual versus triple), degree of blunder turn, andcommunication condition (radio contact or no radio contactfollowing a blunder) on API. There were no significant maineffects of approach condition, or degree of blunder turn on API.
There was a significant effect of communication condition on API(F(1,542) = 11.20, MSE = 261.24, p. < .005). The average API waslower in the radio communication condition (X, = 16.62) than in theno radio communication condition (Xn = 21.89).
23
* cc0
CYC
I 0rZ4 I-A
IF) ZzzS00
Ix
E- Z
Cj
n z
C C c 0 C C CM~~K COl r,- r") =I C i -
iN3.'7d*=d -=A iIn m
24
4.2.1.2.2 CPA Analysis.
The average CPA was 8484.22 ft (s.d. = 3878.45 ft, n = 149) forthe dual approach condition and 8502.39 ft '-.d. = 3119.41 ft, n= 405) for the triple approach condition. The smallest CPA valuesachieved were 1103 and 1229 ft for the dual and triple approachconditions, respectively.
A second ANOVA was performed to investigate the effects of approachcondition, degree of blunder, and communication condition on theCPA dependent measure. While the mean CPA value was more than onemile for all conditions, the statistical analysis revealedsignificant effects which largely paralleled those observed for theAPI measure.
The main effect of communication condition was again significant(F(1,542) = 24.18, MSE = .IOE+08, p. < .0001). The average CPAvalue under the condition in which radio communication wasmaintained was 9268.09 ft. When communication ceased following ablunder, the average value dropped to 7542.45 ft.
The main effect of blunder degree was also significant in thisanalysis (F(2,542) = 3.82, MSE = .10E+.08, p. < .05). The averageCPA value for 10 degree blunders (X10 = 9,257.38 ft, s.d. = 3,455.37ft, n = 125) was greater than the averages for 20 degree blunders(X20 = 8,586.06 ft, s.d. = 3,197.66 ft, n20 = 207) and 30 degreeblunders (X30 = 7,987.51 ft, s.d. = 3,322.10 ft, n30 = 222). Themain effect of approach condition was not statisticallysignificant, paralleling the API results.
The three.-way interaction of approach, blunder degree, andcommunication variables was significant (F(I, 542) = 3.03, MSE =.1OE+08, p. < .05). As can be seen in figure 8, the locus of theinteraction appears to be in the differences between dual andtriple approach conditions for 10 degree blunders. Thisinteraction may be of limited practical importance since the CPAvalues for all conditions were within the prescribed limits of safeseparation.
4.241.2.3 Other measures.
The number of NTZ entries per runway for the dual approaches was4.96 (s.d. = 2.36), as compared to 5.30 (s.d. = 1.78) for thetriple approach condition. The difference was not significant byt-test. The number of parallel conflict entries per runway wassignificantly different for the dual and triple approach conditions(t(=25) = 5.626, p. < .0001). The average for the dual conditionwas 19.83 (s.d. = 5.46) versus 31.88 (s.d. = 6.45) for the triplecondition.
25
C=C
C0
, w,
LU4
0 W
00U E-4 E-4
C)- ' (\j > 00
C3 CD C 3 -
CD C C CD 0C CD C C- C N
26
The average number of warnings per runway was 33.71 (s.d. = 14.65)in the dual approach condition and 27.28 (s.d. = 7.87) in thetrip..e approach condition. This difference was not significant byt-tevt. However, the number of pilot messages per runway diddiffer significantly between the dual and triple approaches (t(-l6)= 2.886, p. < .01). The average number of messages was 74.08 (s.d.= 17.18) in the dual condition and 60.22 (s.d. = 12.16) in thetriple condition.
Neither dual nor triple approach conditions resulted in anyoccurrence producing a slant range distance 500 ft or less betweentarget centers.
4.2.2 Analysis of Blunders Threatening One Versus Two Runways.
This section describes the analysis of blunders in the tripleapproach condition alone. Those which threatened two runways(i.e., blunders initiated from 16L or 18R) are compared with thoseinitiated from 17L, which threatened only one runway.
4.2.2.1 API Analysis.
An ANOVA was performed to determine the effects of number ofrunways threatened, communication condition, and degree of blunderon API for the triple approach data. There was a significant maineffect of the number of runways threatened (F(1,393) = 4.76, MSE= 227.51, p. < .05). The average API value was greater when onerunway was threatened (Xj = 21.12, nj = 134) than when two runwayswere threatened (X2 = 17.61, n2 = 271). The effect of thecommunication condition was also significant in this analysis(F(1,393) = 4.86, MSE = 227.51, p. <.05). The average API valuewas greater (Xnc = 20.5, nn, = 198) when communication ceased betweenthe pilot and controller than when communication was maintained (X,= 17.12, n, = 207).
4.2.2.2 CPA Analysis.
An analysis of variance was similarly conducted for the closestpoint of approach data. The main effect of number of runwaysthreatened was significant (F(1,393) = 6.43, MSE = .86E+07, p. <.05). The average CPA value was smaller for blunders threateningonly one runway (X, = 7941.10 ft) than for those threatening tworunways (X2 = 8779.93 ft).
The effect of the communication condition was also significant inthis analysis (F(1,393) = 19.64, MSE = .86E+07, p. <.0001). Theaverage CPA value for the no communication condition (Xn, = 7856.01,n,-=198) was smaller than the average for the communicationcondition (X, = 9,120.666, n, = 207).
27
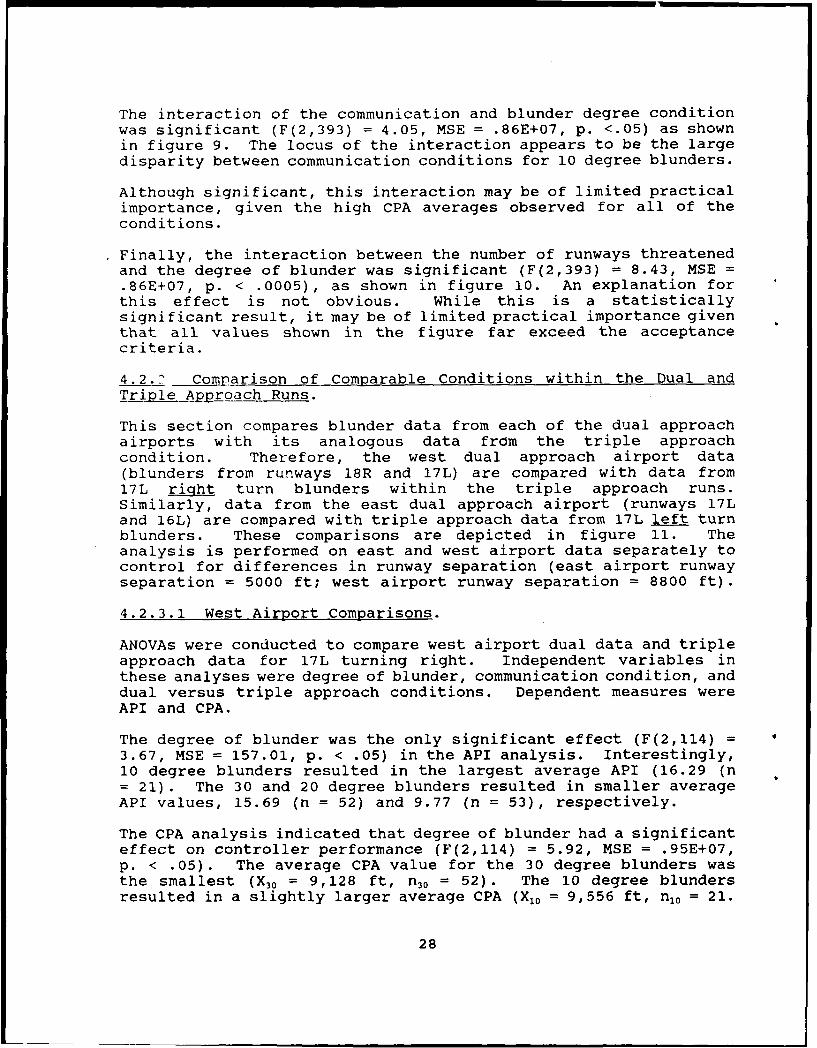
The interaction of the communication and blunder degree conditionwas significant (F(2,393) = 4.05, MSE = .86E+07, p. <.05) as shownin figure 9. The locus of the interaction appears to be the largedisparity between communication conditions for 10 degree blunders.
Although significant, this interaction may be of limited practicalimportance, given the high CPA averages observed for all of theconditions.
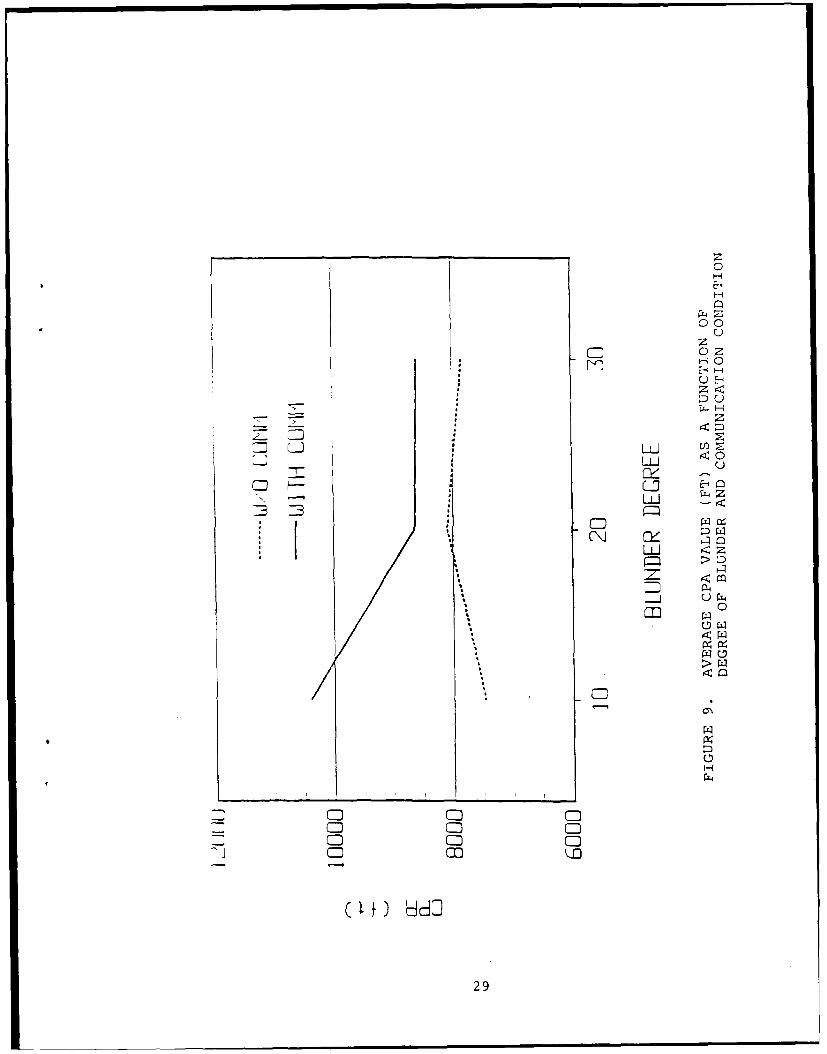
Finally, the interaction between the number of runways threatenedand the degree of blunder was significant (F(2,393) = 8.43, MSE =.86E+07, p. < .0005), as shown in figure 10. An explanation forthis effect is not obvious. While this is a statisticallysignificant result, it may be of limited practical importance giventhat all values shown in the figure far exceed the acceptancecriteria.
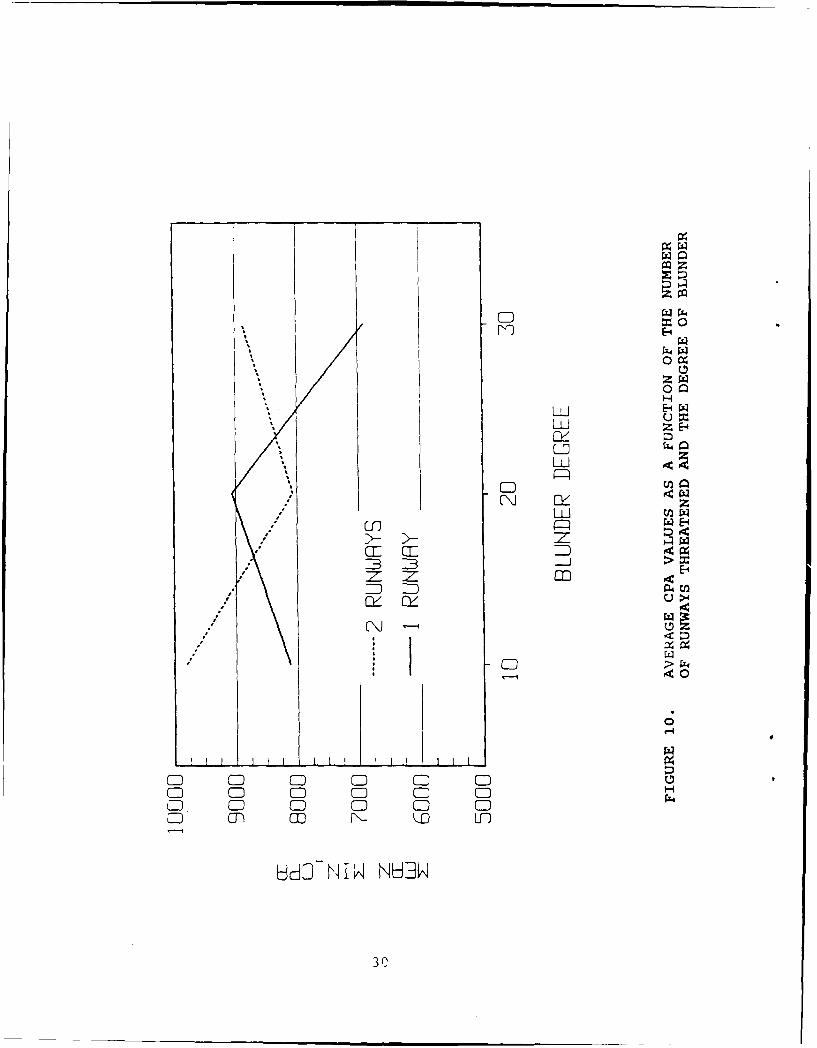
4.2.? Comparison of Comparable Conditions within the Dual andTriple Approach Runs.
This section compares blunder data from each of the dual approachairports with its analogous data from the triple approachcondition. Therefore, the west dual approach airport data(blunders from runways 18R and 17L) are compared with data from17L right turn blunders within the triple approach runs.Similarly, data from the east dual approach airport (runways 17Land 16L) are compared with triple approach data from 17L left turnblunders. These comparisons are depicted in figure 11. Theanalysis is performed on east and west airport data separately tocontrol for differences in runway separation (east airport runwayseparation = 5000 ft; west airport runway separation = 8800 ft).
4.2.3.1 West Airport Comparisons.
ANOVAs were conducted to compare west airport dual data and tripleapproach data for 17L turning right. Independent variables inthese analyses were degree of blunder, communication condition, anddual versus triple approach conditions. Dependent measures wereAPI and CPA.
The degree of blunder was the only significant effect (F(2,114) =
3.67, MSE = 157.01, p. < .05) in the API analysis. Interestingly,10 degree blunders resulted in the largest average API (16.29 (n= 21). The 30 and 20 degree blunders resulted in smaller averageAPI values, 15.69 (n = 52) and 9.77 (n = 53), respectively.
The CPA analysis indicated that degree of blunder had a significanteffect on controller performance (F(2,114) = 5.92, MSE = .95E+07,p. < .05). The average CPA value for the 30 degree blunders wasthe smallest (X30 = 9,128 ft, n30 = 52). The 10 degree blundersresulted in a slightly larger average CPA (X10 = 9,556 ft, n10 = 21.
28
-1
00
0
* z
LIU
C
C W
W)i <id
294
H
E-4
(02w0zw
)-u =
'IL
E-4
JC C4
m E-1)
ddZCL LIf)~P
3(i4
c2- CL -c- dk
rz - __ _ __ _ _ ZC
< zU
00
AlLa 0
I--P Q<
_ _ _ _ _ _ _ _ _ _:-
Co4
Z LUJ N1< (a *-
0
CLC
31
While 20 degree blunders resulted in a much larger average CPA (X20
= 11,000 ft, n20 = 53).
4.2.3.2 East Airport Comparisons.
In the analyses to follow, the east airport dual approaches 17L and16L are compared with the triple approach data for 17L aircraftblundering toward the 16L localizer. The ANOVAs in these analyseshad degree of blunder, communication condition and approachcondition as independent variables and API and CPA as dependentvariables.
The API ANOVA for the east airport comparisons indicated nosignificant effects of degree of blunder, communication condition,or approach condition. Conversely, the ANOVA on the CPA dataindicated a significant effect of blunder degree (F(2,145) = 5.28,MSE = .93E+07, p. < .01) and communication condition (F(1,145) =8.23, MSE = .93E+07, p. < .005). The average CPA for -he 30 degreeblunder condition (X30 = 5,906 ft, n30 = 71) was less than theaverage CPAs for 20 degree (X20 = 7,038 ft, n20 = 47) and 10 degree(X10 = 8,198 ft, n10 = 39) blunder conditions. The average CPA forthe no communication condition (Xn, = 5,942 ft, n,, = 91) was lessthan the average CPA for the communication condition (X, = 8,016ft, n, = 66).
4.2.4 Comparison of the Dual Runway Airports.
The final analysis performed on the computer data compared the twodual runway airports which differed, primarily, in terms of runwayseparation. The east airport approaches were separated by 5000 ftand the west airport approaches were separated by 8800 ft.
The data for the two dual approach airports differed in a numberof ways. First, the number of aircraft handled was significantlygreater for the east airport (approaches 17L and 16L) than for thewest airport (approaches 18R and 17L) (t(5) = 5.721, p. < .001).An average of 78.83 aircraft was handled for the east airportduring each run, in comparison to 76.83 aircraft for the westairport. Second, although more aircraft were handled for the eastairport, significantly more were landed for the west airport (t(5)= 2.909, p. < .025). An average of 48 aircraft landed at the westairport during a run, while approximately 42 landed at the eastairport.
A number of measures indicated that the east airport was moredifficult to control than the west airport. For example, thenumber of NTZ entries was much higher, on the average, for the eastairport than for the west airport (t(5) = 14.7, p. < .001). Therewas an average of 5.5 NTZ entries per run for the west airport, incontrast to an average of 14.33 NTZ entries for the east airport.More warnings and more pilot messages were issued per run for theeast airport than for the west airport (t(5) = 2.711, p. < .025 and
32

t(5) = 2.966, p. < .025, respectively). The number of pilotmessages averaged 125.67 per run for the west airport, and 170.67for the east airport. Similarly, the number of warnings for thewest airport averaged 49.17 per run while the east airport averagewas 85.67. Finally, API values were much higher, on the average,for the east airport runs than for the west airport runs (t(5) =3.701, p. < .005). The average API values were 27.41 (s.d. =21.01, n = 81) and 11.57 (s.d. = 12.74, n = 68) and for the eastand west airports, respectively.
4.2.5 Concluding Remarks Concerning the Computer Data.
Given the large volume of data collected, it is not surprising thata number of statistically significant effects were observed.However, it should be noted that the practical significance of theobserved differences is minimal in many cases.
The low API values and high CPA values cited consistentlythroughout the result section indicate that all of the conditionsof this study resulted in acceptable performance from thestandpoint of the safety measures.
4.3 TIME PLOTS OF SELECTED BLUNDERS.
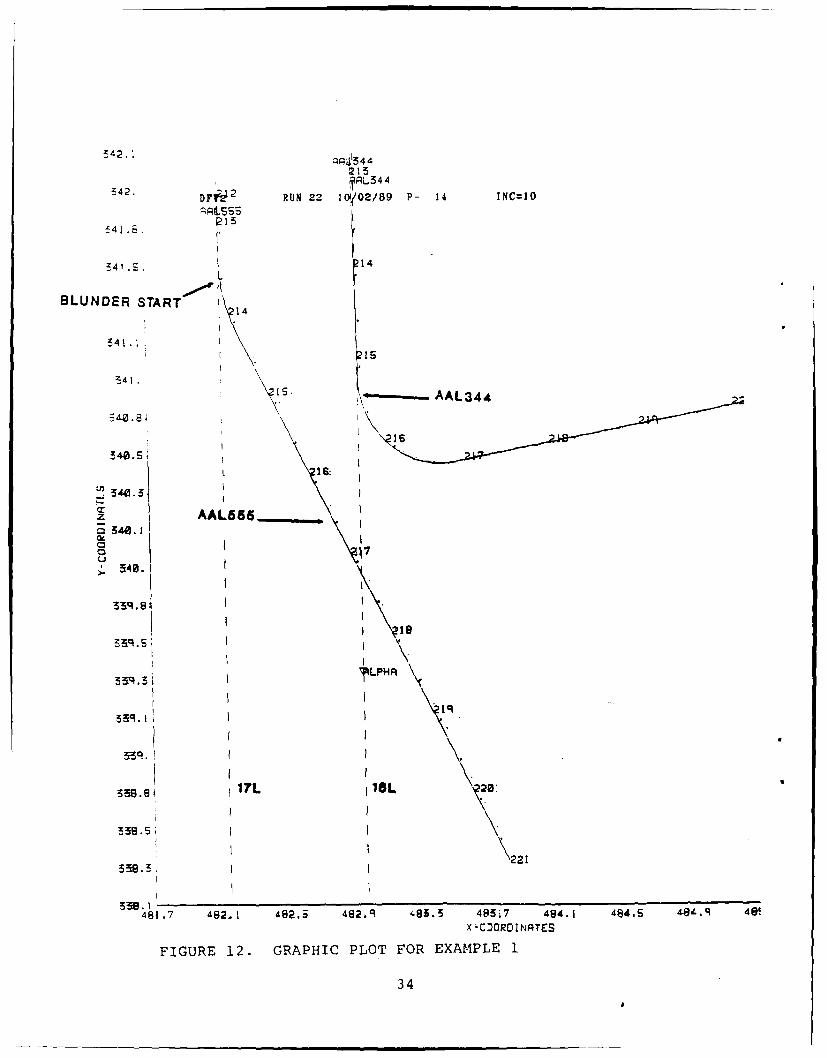
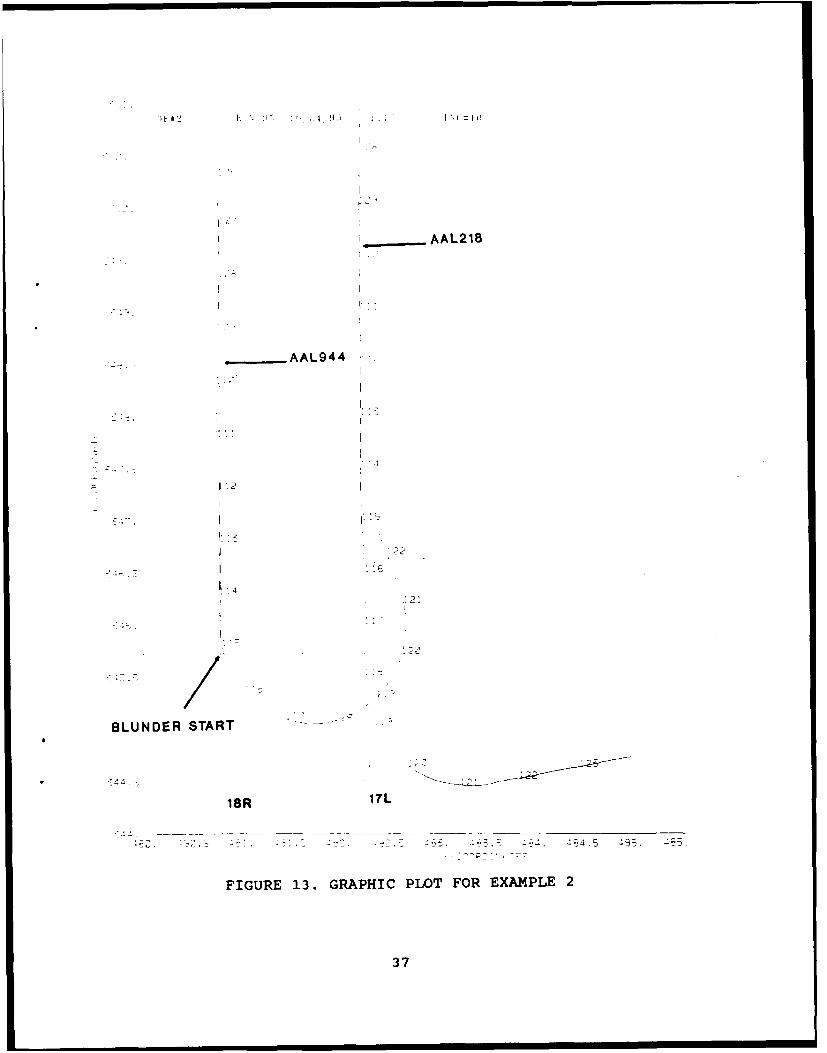
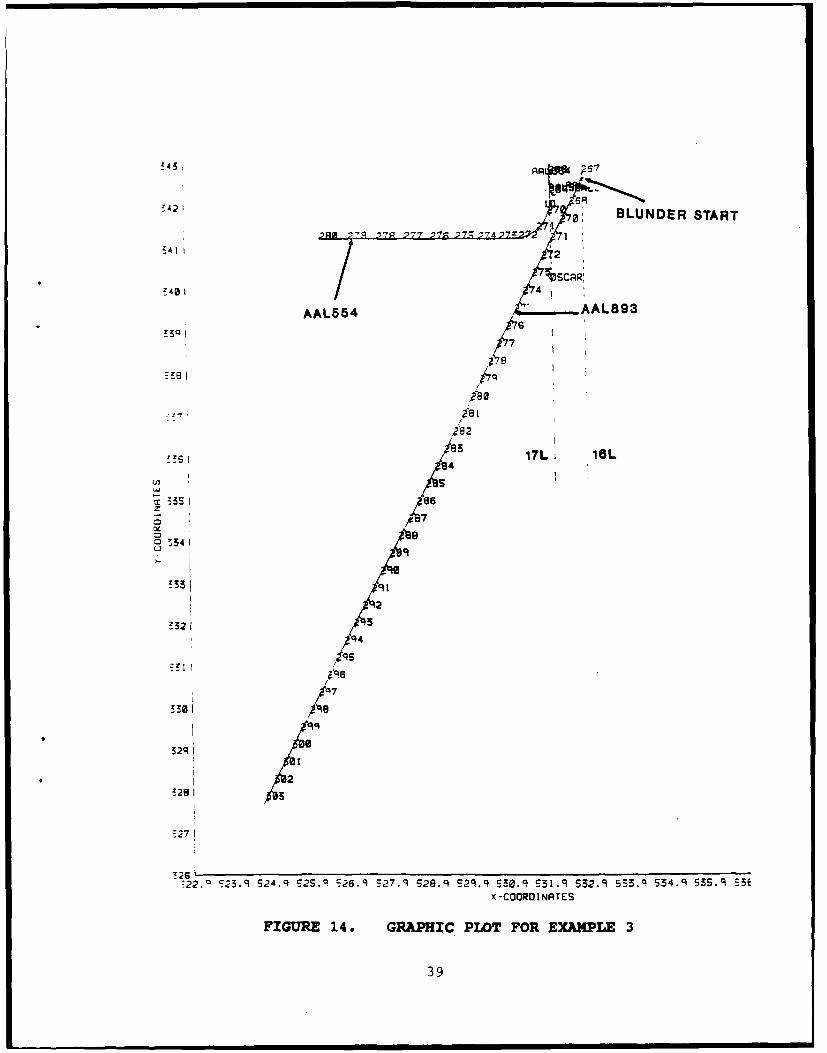
Graphic plots served as a useful tool in the analysis of some ofthe more serious blunders. The graphic plots represent theaircraft's lateral movement along the localizer. As shown infigure 12, the localizers are indicated by vertical dashed linesand the aircraft tracks are solid lines that follow and eventuallydeviate from the localizer lines. The horizontal (x) and vertical(y) axes are marked in nautical miles from an imaginary origin.Simulation time (recorded along the aircraft tracks) is marked in10 second increments. The aircraft identification is indicated atthe beginning of each track. Table 2 provides an example of thedigital data associated with a graphic plot. The data includeincrement time (from the plot), simulation time (seconds), xcoordinate, y coordinate, altitude, ground speed, track status(1000 = Off-Flight-Plan on Vectors, 1060 = Flying ILS Approach,1061 = Homing to ILS Approach, 1068 = Deviating from ILS Approach),and the distance the aircraft traveled since the plot wasinitiated. The following are descriptions of three blunders withtheir associated graphic plots and digital data.
The first example, shown in figure 12, had the smallest CPA valueof all the blunders in which a pilot error was not detected. Itinvolved AAL555 inbound on 17L and AAL344 inbound on 16L. At 2139simulation time (between 213 and 214 on the graphic plot), AAL555began a 30 degree blunder to the left and ceased communication withthe controller. The controller for 16L vectored AAL344 immediatelyleft to heading 080 and instructed AAL344 to climb and maintain4000 ft. This vector change was initiated by AAL344 atapproximately 2159 simulation time (between 215 and 216 on the
33
542.: .AA544215, L344
542. DFj 2 RUN 22 10'02/89 P- 14 INC=1O
541 .8 15
54t .-S 14
BLUNDER START
341.1
i ,
340.5
53q 1
z I AAL6
f
3434
33qs. 31
539.51 ~PA
3q.j
3388117L 08L
\221
33.481.7 482. 1 482.3 492.: 'z83.53 485. 7 484.1 484.S 5 9~ 48!X -CfORDINATES
FIGURE 12. GRAPHIC PLOT FOR EXAMPLE 1
34
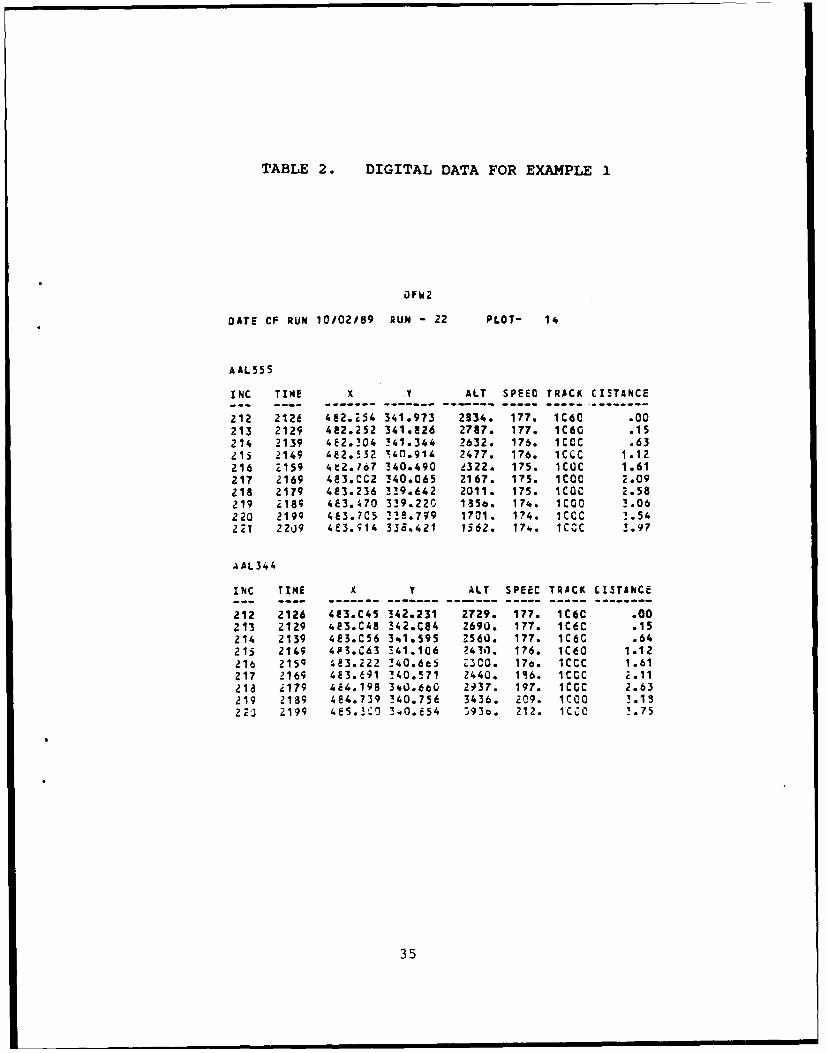
TABLE 2. DIGITAL DATA FOR EXAMPLE 1
OFW2
DATE CF RUN 10/02/59 RUN - 22 PLOT- 14
AAL555
INC TIME X V ALT SPEEC TRACK CISTANCE
212 2126 4e2.254 341.973 2334. 177. 1C60 .00213 2129 482.252 341.826 2787. 177. 1C60 .15214 2139 4E2.304 341.344 2632. 176. ICOC .63215 2149 482.532 l4n.914 2477. 176. 1CCC 1.12
216 2159 4e2.167 340.490 2322. 175. 1COC 1.61217 2169 483.CC2 340.065 2167. 175. iCOO 2.09218 2179 4e3.236 339.642 2011. 175. ICOC 2.58219 Z18; 4e3.470 339.220 1350. 174. ICOO 3.06220 2199 4E3.7C5 238.779 1701. 174. 1CCC !.54221 22U9 413.914 338.421 1562. 174. 1COC 3.97
AAL344
INC TINE x y ALT SPEEC TRICK CISTINCE
212 2126 483.C45 342.231 2729. 177. 1C6C .00213 2129 4E3.C48 342.C84 2690. 177. 1CdC .15214 2139 413.C56 341.595 2560. 177. 1C6C .64215 2149 4$3.C63 341.106 ?43il. 176. 1Cto 1.12216 2159 4e3.222 !40.6e5 Z3C0. 17o. 1CCC 1.61217 2169 413.691 140.571 2440. 196. 1CCC 2.1121a i179 4Z4.198 340.660 2437. 197. lCCC 2.63219 2189 484.739 340.756 3436. 209. ICOO 3.13220 21919 4E5.2CO 340.654 93o. 212. 1CCC !.75
35
graphic plot). At simulation time 2156 the two aircraft camewithin approximately 2795 ft laterally at approximately the samealtitude. The API rating for this blunder was 68. Additionalreview of the video tape and the technical observer commentsindicated that there were no unusual delays in controller responsetimes or any pilot errors.
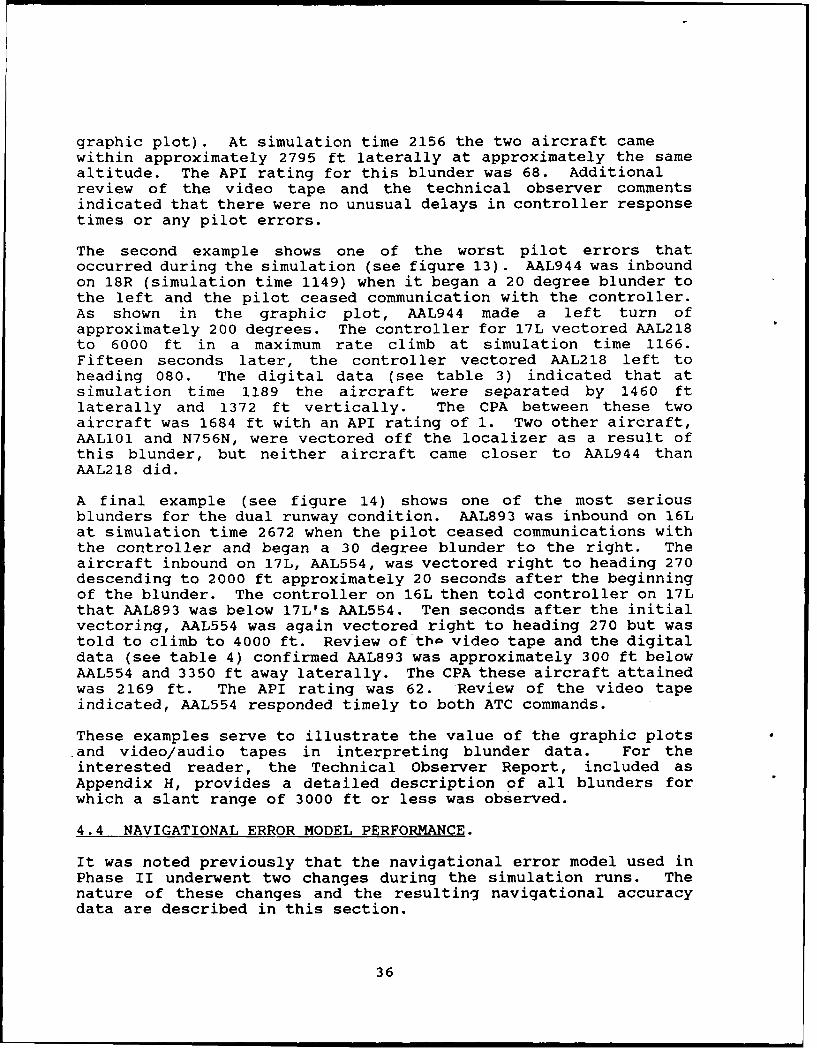
The second example shows one of the worst pilot errors thatoccurred during the simulation (see figure 13). AAL944 was inboundon 18R (simulation time 1149) when it began a 20 degree blunder tothe left and the pilot ceased communication with the controller.As shown in the graphic plot, AAL944 made a left turn ofapproximately 200 degrees. The controller for 17L vectored AAL218to 6000 ft in a maximum rate climb at simulation time 1166.Fifteen seconds later, the controller vectored AAL218 left toheading 080. The digital data (see table 3) indicated that atsimulation time 1189 the aircraft were separated by 1460 ftlaterally and 1372 ft vertically. The CPA between these twoaircraft was 1684 ft with an API rating of 1. Two other aircraft,AAL101 and N756N, were vectored off the localizer as a result ofthis blunder, but neither aircraft came closer to AAL944 thanAAL218 did.
A final example (see figure 14) shows one of the most seriousblunders for the dual runway condition. AAL893 was inbound on 16Lat simulation time 2672 when the pilot ceased communications withthe controller and began a 30 degree blunder to the right. Theaircraft inbound on 17L, AAL554, was vectored right to heading 270descending to 2000 ft approximately 20 seconds after the beginningof the blunder. The controller on 16L then told controller on 17Lthat AAL893 was below 17L's AAL554. Ten seconds after the initialvectoring, AAL554 was again vectored right to heading 270 but wastold to climb to 4000 ft. Review of tba video tape and the digitaldata (see table 4) confirmed AAL893 was approximately 300 ft belowAAL554 and 3350 ft away laterally. The CPA these aircraft attainedwas 2169 ft. The API rating was 62. Review of the video tapeindicated, AAL554 responded timely to both ATC commands.
These examples serve to illustrate the value of the graphic plotsand video/audio tapes in interpreting blunder data. For theinterested reader, the Technical Observer Report, included asAppendix H, provides a detailed description of all blunders forwhich a slant range of 3000 ft or less was observed.
4.4 NAVIGATIONAL ERROR MODEL PERFORMANCE.
It was noted previously that the navigational error model used inPhase II underwent two changes during the simulation runs. Thenature of these changes and the resulting navigational accuracydata are described in this section.
36
AAL218
O-AAL944II
18R i7L
FIGURE 13. GRAPHIC PLOT FOR EXAMPLE 2
37
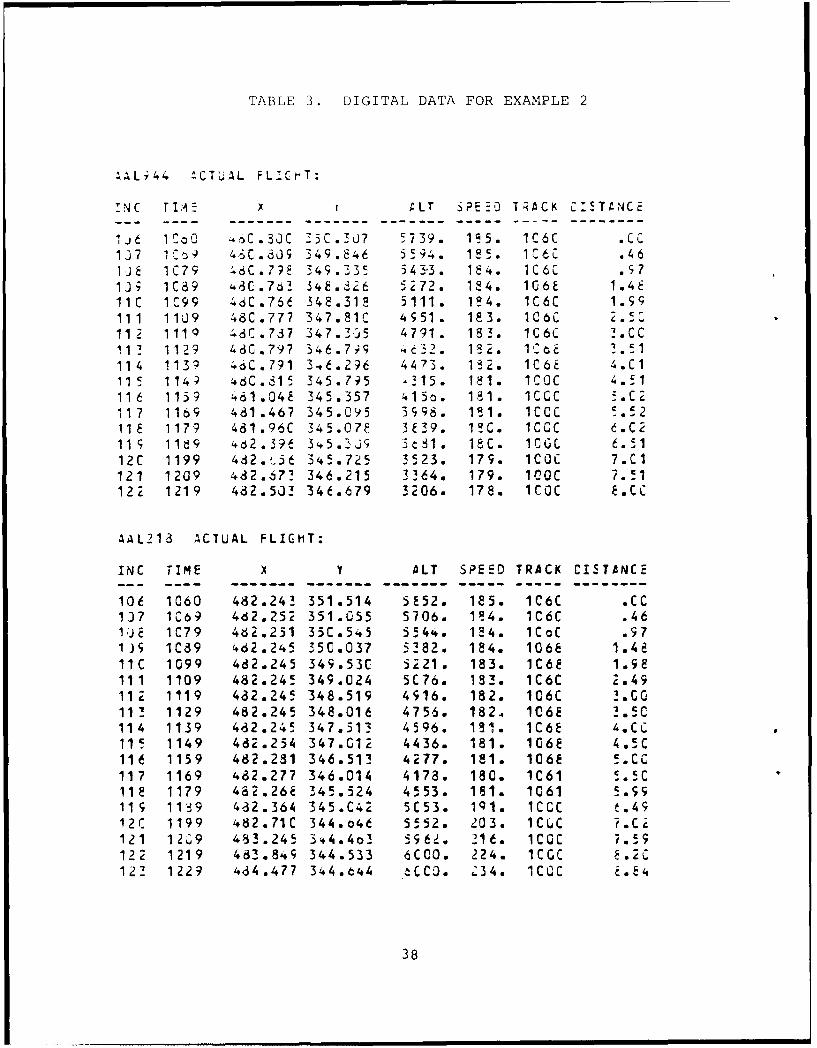
TABLE 3. DIGITAL DATA FOR EXAMPLE 2
,AL- 4 -CTUAL FLICi-T:
!NC TIA E xLT SPEmO T;ACK C:!TgNC2
1J6 ICo0 'oC.32C 35C.357 5739. 195. lC6C .CC137 1C , 4&C.809 349.846 5594. 185. lC6C .46
ijE 1C79 '6C.?9 349.335 5433. 184. 1C6C .97
139 1C89 44C.763 34E-.26 5272. 184. 1068 1.4E
lic 1C99 46C.766 348.318 5111. 184. 1C6C 1.59
111 11J9 48C.777 347.91C 4S51. 183. 1C6C 2.5,*
11 2 1119 8 C.737 347.3.]5 4791. 183. IC6C .CC112 1129 48C.797 346.7 .7.c32. 12. 1'C 0.5 1
114 1139 46C.791 3-,6.296 4473. i2. 1C6E 4.C1
115 1149 46C.815 345.795 -315. le1. ICOC 4.51
116 1159 461.04E 345.357 41I5 . 181. ICCC 5.C2
117 1169 481.467 345.095 3S98. 1 1. 1COC !.52
11E 1179 481.96C 345.07E 3f39. 18C. ICOC d.C2119 1189 462.396 35.239J 3cbl. 18C. 10CL 6.51
12C 1199 442.-56 345.725 3523. 179. 1COC 7.Cl
121 1209 4d2.67? 346.215 3364. 179. 100C 7.!1
122 1219 482.503 346.679 3206. 178. 1COC E.Cc
AAL213 ACTUAL FLIGHT:
INC TIME ALT SPEED TRACK CISTANCE
106 1060 482.24! 351.514 5E52. 185. 1C6C .CC1J7 1C069 4d2.252 351.055 5706. 14. 1C6C .461JE 1C79 462.251 35C.545 5544. 1 4. 1CC .97
1)s 1C89 4d2.245 350.037 5182. 184. 106t 1.48
11C 1099 482.245 349.53C 5221. 183. 1C6t 1.98111 1109 482.245 349.024 5C76. 183. 1C6C 2.49112 1119 482.245 348.519 4916. 182. IC6C !.00
11! 1129 482.245 348.016 4756. 1824 106E 3.5C114 1139 482.245 347.513 4596. 131. 1C6E 4.CC115 1149 482.254 347.G12 4436. 181. 106E 4.5C116 1159 482.281 346.513 4277. 181. 106e 5.C0
117 1169 482.277 346.014 4178. 180. lC61 !.5C
118 1179 482.26E 345.524 4553. 181. 1061 5.99119 11,39 432.364 345.C42 5C53. 11. ICCC t.49
12C 1199 482.71C 344.046 5552. 203. 1C C ?,Ce
121 1269 483.245 344.4o3 1596 . 216. ICOC 7.59
122 1219 483.84q 344.533 6C0. 224. ICGC 8.2C122 1229 434.477 344.t44 tCC3. 234. 1C0C .E
38
! 4 3 A 6
SA2_ BLUNDER STARTIq '1R )7
411 2SCAAL554 AALS93
ZiaB I
~a2
17L 16L
q44
qets7i8
-7q7
0 4191
Z22
-- 2 . C. 2 5 q 2 , 2 S . q 5 . 2 7 .q 2 8 .9 2 9 . q 5 0 .9 .5 1 .9 5 2 .9 5 3 . 9, 5 4 .9 5 3 . 9 S5
x -COOROINRTES
FIGURE 14 * GRAPHIC PLOT FOR EXAMPLE 3
39
/9s
7!
q
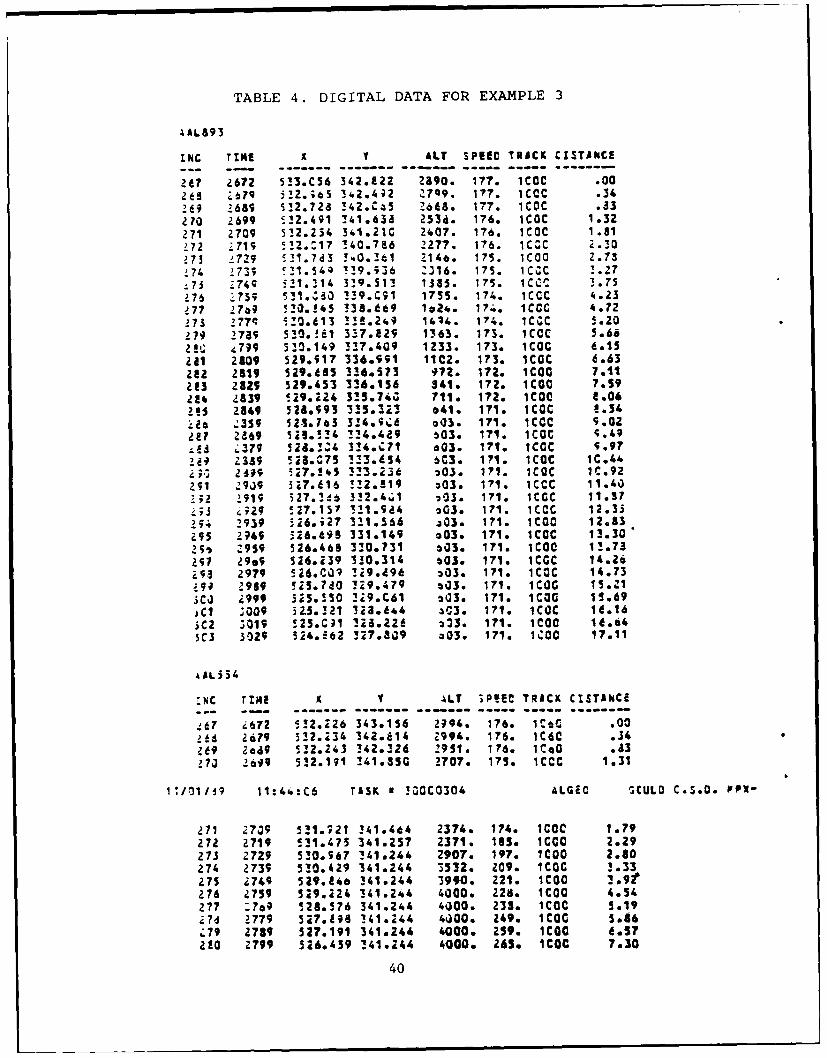
TABLE 4. DIGITAL DATA FOR EXAMPLE 3
AAL893
INC T1ZE x y ALT SPE6 TRACK CISTAKCE- - - --------- -- - -- -------------
201 2672 5!3.CS6 342.922 2390. 177. ICOC .00263 :6?9 32. is 342.42 2749. 177. ICOC .34269 2689 5!2.728 !42.CZ5 Z6a68. 177. ICOC .83270 2699 532.491 341.635a 2536. 176. ICOC 1.32271 Z709 5!2.254 341,21C 2407. 176. 1COC 1.81
i72 -719 5!2.C17 140.786 2277. 176. 1CCC 2.30273 729 531.7d3 3%0.161 2146. 175. 1COO 2.7$274 !73; c!1.544 1!9.;36 16. 17S. 1CCC !.27.7j :74; 521.!14 3!9.51! 1385. 175. 1CCC 3.7571 --754 531.2) !39.C;1 1755. 174, lCCc 4.23077 7 !9 5.0.!45 338.t69 1o24. 174. ICCC 4.72!73 277C 4!0.613 3!.249 14 4. 174. 1CCC 5.20Z79 27a 530.81 337.129 1363. 173. 1CoC 5.66z!1. e799 510.149 337.409 1233. 173. 1COC 6.1521l 2809 529.917 336.991 1iCZ. 173. ICOC 6.63
212 2819 529.485 3!6.$73 97z. 172. 1COc 7.1123 2829 529.453 3!6.156 341. 172. ICOG 7.59284 2839 129.224 3!5.743 711. 172. 1Co0 e.06Z!j 2849 524.993 3!5.23 a41. 171. lCOC !.54',I .359 523.743 3!4.96 .03. 171. 1CCC 9,02Z17 2869 523.!34 134.4Z9 503. 171. I9C O.49-13 L379 52d4.!4 3!4,c71 *03. 171. ICGC 9.9729 Z339 528.C75 33.654 C3. 171. ICOC 1C.442 ;, 2409 ;27.!45 3!3.236 203. 171. 1CQC 1C.92291 Z909 527.616 !!2.119 i03. 171. lCCC 11.40-;2 2919 27.!d6 3!2.41 203. 171. ICOC 11.3?;is e29 !27.157 1!1,94 *03. 171. 1CCC 12.33;54 2939 326.;27 321.566 303. 171. 1COC 12.83295 2949 526.698 331.149 z03. 171. ICOC 13.305,3 1939 526,469 320.731 103, 171. lC0 1!.73
257 29o9 526.i39 330.314 603. 171. ICGC 14.26Z93 2979 516.Ca? li9.296 303. 171. lCOC 14.73;9; 2989 5i5,?d0 !29.479 .03. 171. 1CUG 11.213CJ 999 3i5. S0 29.C61 *03. 171. 1CoG 1S.69JC1 ;009 5z$.21 iia.644 ac3. 171. 1Coc 16.16;C2 ;019 !25.C;1 32.226 23. 171. lcoc 14.645Cs 3029 524.62 327.309 *03. 171. 1C0C 17.11
zN'C TiE y A .LT 3PME TRACK CISTAiNC
67 72 5!2.126 343,156 2994. 176. 1C*C .00!! 2679 32.234 342.614 2994, 176. 1c6C .34Z69 2.d9 532,243 342o326 2951. 176. 1C*O .1303 2649 5!2.191 !41.35G 2707. 175. 1CCC 1.31
1 /01/ 9 11:44:C6 TASK a !a0C0304 ALGiC SCULD C.SO, PPW*
271 27a9 5!1.721 341.4*4 2374. 174. lCOC 1.79272 2719 531.475 341.257 2371. 185. ICCO 2.29273 2729 530.967 341.244 2907. 197. ICO 2.80274 2739 530.429 341.244 3532. 209. iCOG !.33275 Z749 529.146 341.244 3990. 221. lCoo 3.9f276 2759 5;9.224 341.244 4000. 228. 1COC 4.54277 :7*9 528.576 341.244 4000. 23. 1Coc 5.1927d 2779 517.1 8 141.244 4-.00. 249. lC0G 5.86Z79 2789 527.191 341.244 4000. 259. ICOC 6.5?210 2799 526.439 341.144 4000. 263. ICOC 7.30
40
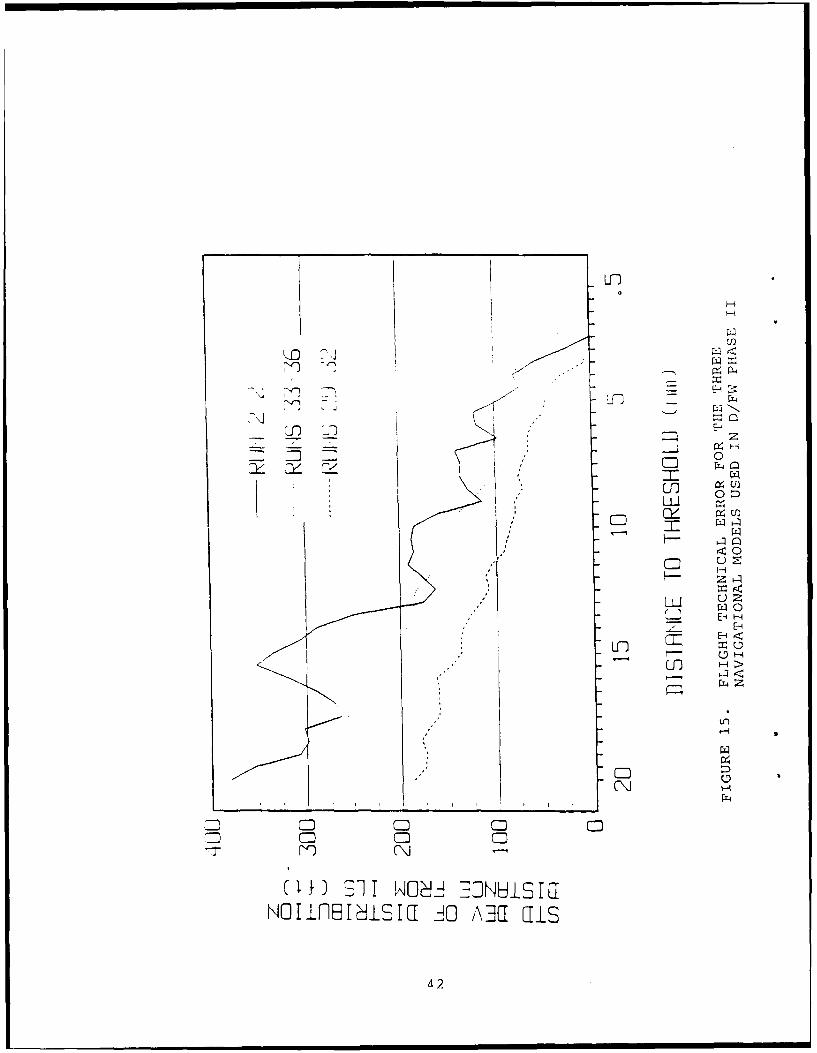
The initial navigational error model was designed to produce anaverage deviation from the ILS of zero ft at 20 nmi from thethreshold with a standard deviation of 400 ft. The modelparameters were 1) a probability of .10, that an aircraft woulddeviate from the localizer during any given second of thesimulation run, 2) a turn angle randomly selected from arectangular distribution with a mean equal to zero and a range of± 10 degrees, and 3) the number of seconds the aircraft woulddeviate from the localizer, which was set equal to the number ofnmi the aircraft was from the threshold at the initiation of thedeviation, plus 4 seconds. This model produced the level of FTEexemplified by run 2-2 in figure 15, and was used during the firsttwo runs of the simulation. However, the controllers and technicalobservers indicated that the amount of aircraft deviation wasunrealistically large in these two runs. This model was modifiedto reduce deviation from the localizer.
The second model used the same principal components as the firstmodel except the duration of the deviation was reduced. The numberof seconds an aircraft would deviate in the second model was setequal to one half the number of nmi the aircraft was from thethreshold. This adjustment to the model effectively reduced theFTE to less than 200 ft at the point 20 nmi from the threshold.This can be seen in figure 15 for runs 29 to 32. The second modelwas used for runs 3 through 32.
The navigational error model was further improved in run 33. Thisrevision included changes to both the deviation angle distributionand the deviation duration. The deviation duration set in theoriginal model - the number of nmi from the threshold plus 4seconds - was again used in this final version. The angle ofdeviation was randomly selected from a normal distribution with amean of zero degrees and a standard deviation of 3.4 degrees.Negative angles were designated as left turns off the localizer andpositive angles as right turns.
The third model produced deviations greater than those found in thesecond model but less than the original model, as shown for runs33 - 36 in figure 15. The third model proved to produce bothvisually realistic and the statistically correct flight paths.
4.5 DESCRIPTION OF THE AD HOC RUN (RUN 37).
An ad hoc run (run 37) was introduced to reexamine previous runsand to create new blunders for examination. To achieve this goala typical traffic sample was run in the simulation. Variations inaircraft speed were introduced to produce overtakes. Additionally,blunders were created inside the final approach fix. The blunderswere generated by personnel from AFS-400 and AVN-540 to create thegreatest potential for conflict.
41
I)
c::) r1-, M
_c 0nJ
CD
CD:E
E--
H--
cn u
0 CD0 04
I I I IN
NOI~ln TcdIs8iu ig /\3a fiLLS
Eighteen blunders were initiated in run 37. Ten of those involvedcessation of communications between controllers and pilots. Twelveof the blunders originated from 17L, four from 16L, and two from18R. Thirteen had blunder angles of 30 degrees, three had 10degree blunder angles, and two had 20 degree angles.
The observed APIs ranged from 6 to 54 with an average of 36.75(s.d. = 14.65), and the CPAs ranged from 1863 to 9590 ft with anaverage of 4662 ft (s.d. = 2409 ft). The results of this runindicated that controllers were able to adequately control thetraffic under all of the conditions created.
4.6 CONTROLLER QUESTIONNAIRE DATA.
4.6.1 Controller Performance.
The first question in the questionnaire required controllers torate their performance during the preceding run. The rating scaleranged from 1 (poor) to 10 (superior). Controllers rated theirperformance as good or superior in both the dual (X2 = 8.4, s.d.= 1.2, n2 = 24) and triple (X = 8.3, s.d. = 1.3., n3 = 81) approachconditions. An ANOVA performed on the data indicated nosignificant differences in the ratings attributable to either theapproach condition or the runway assignment of the controller.
An ANOVA was performed to compare the ratings for the dual approachairports which differed, primarily, in terms of runway separation.Separation was greater for the west airport than for the eastairport. Controllers rated their performance as better (F(1,22)= 5.42, MSE = 1.30, p. < .05) for the west airport (Xw = 8.91) thanfor the east airport (XE = 7.83).
4.6.2 Activity Level.
Controllers were asked to rate the level of activity required foreach run. The scale for this question ranged from 1 (minimal) to10 (intense). The average rating for both the dual and tripleapproach conditions was 5.0, indicating a moderate level ofworkload throughout the study. However, there was a significanteffect of runway assignment (F(2,99) = 12.9, MSE = 3.62, p. < .05).Controllers viewed their activity levels as higher when workingrunway 16L (X16 = 5.70) than when working either 17L (X17 = 4.90) or18R (X18 = 4.51).
Ratings also differed between the east and west airports. Activitylevels were viewed as much higher for the east airport (XE = 6.17,s.d. = 1.11) than for the west airport (Xw = 3.92, s.d. = 1.62).
4.6.3 Stress Level.
Perceived level of stress was rated in the third question on ascale ranging from 1 (slight) to 10 (extreme). The average rating
43
for both dual and triple approach conditions was 4.0, indicatinga low to moderate level of perceived stress throughout the study.There were no differences attributable to runway assignment.Controllers perceived a higher level of stress (F(1,22) = 11.14,MSE = 1.81, p. < .05) when working the east airport (XE = 4.92,s.d. 1.31) than when working the west airport (Xw = 3.08, s.d.= 1.38).
4.6.4 System Workability.
The fourth question addressed the issue of system workability,using a scale ranging from 1 (strong yes) to 10 (strong no).Although an ANOVA indicated that the dual approach condition (X2= 1.8) was viewed as significantly more workable (F(1,99) = 4.62,MSE = .67, p. < .05) than the triple approach condition (X3 = 2.3),both conditions were viewed as highly workable.
Workability ratings differed for the three runways (F(2,99) = 3.86,MSE = .67, p. < .05), with runway 18R (X18 = 1.94) viewed as moreworkable than 17L or 16L (X17 = 2.22 and X16 = 2.27, respectively).There was a significant interaction of approach condition andrunway assignment (F(2,99) = 5.39, MSE = .67, p. < .05). Ingeneral, the 16L runway in the dual approach condition was seen asless workable (X2 16 2.67) than all of the other runwayassignments.
Finally, an ANOVA performed for the dual approach airport dataalone indicated that controllers viewed the west airport as moreworkable than the east airport (F(1,22) = 21.56, MSE = .38, p.<.05). The average ratings for the east and west airports were 2.33and 1.17, respectively.
4.6.5 Modified Cooper-Harper Scale Ratings.
The Modified Cooper-Harper Scale was used to assess the mentalworkload of the controllers during the simulation runs. The ratingscale ranged from 1 (very easy to perform with minimal mentaleffort) to 10 (impossible to perform). An ANOVA indicated nodifferences in mental workload for the dual and triple approachconditions, for which the average workload ratings were 2.3 and2.4, respectively.
Mental workload was perceived as higher (F(1,21) = 11.09, MSE =.60, p. < .05) for the east airport dual approach condition (XE =
2.91) than for the west airport (Xw = 1.83).
In summary, mental workload was rated as low in all of theconditions tested during the simulation.
44
4.7 CONTROLLER RESPONSE TIME.
With the addition of systematic video and audio taping in the PhaseII simulation, it was possible to obtain direct measures ofcontroller response time. Nevertheless, because the video andaudio tape information is not linked directly with data in thecomputer files, the analysis of controller response time is atedious, time consuming process. The results presented in thissection represent data fiom the one run which has been analyzed.A number of relationships can be specified as a result of theanalysis of controller response time, as follows.
a. The amount of time between the onset of a blunder and thecontroller's perception of the blunder, and the effect of degreeof blunder on perception time.
b. The amount of time between the controller's verbalinstruction and the related NSSF simulator pilot entry.
c. The amount of time between the controller's instruction andthe first visible indication of an aircraft status change on theradar display.
Sixteen blunders were initiated in east airport dual approach runchosen for this analysis. There were seven 30 degree blunders,seven 20 degree blunders, and two 10 degree blunders. Although thesample size is small, the following results provide a preliminaryindication of two of the three relationships denoted above.
The time between an aircraft's initiation of a blunder andcontroller resfonse time was measured for all of the blunders.There appears to be an inverse relationship between degree ofblunder and controller response time. The average response timeto 10 degree blunders was 16 seconds (s.d. = 4.24 s, n10 = 2). For20 degree blunders the average controller response time was 13.29seconds (s.d. = 4.42 s, n20 = 7). Finally, the controller responsetime for 30 degree blunders averaged only 9.29 seconds (s.d. = 4.15s, n30 = 7)
The time between a controller's instruction and a correspordingsimulator pilot entry was also measured. To do this, controllerinstructions were divided into two types: 1) warning messages,which require only a single keystroke response by the simulatorpilot, and 2) vector/altitude instructions, which require multiplekeystroke responses by the simulator pilot. There were 47 warningmessages and 32 vector/altitude instructions in the sample. Theaverage time between controller instruction and simulator pilotresponse was 6.11 seconds (s.d. = 2.12 s) for warning messages and10.66 seconds (s.d. = 4.8 s) for vector/altitude instructions.
Finally, the time between the controller's instruction and thefirst visible change in aircraft vector or altitude was measured.
45
This analysis paralleled the pilot response analysis justdiscussed. The average time between controller instruction andvisible display change was 8.22 seconds (s.d. = 2.6 s, n = 9) forwarning messages and 15.22 seconds (s.d. = 4.6 s, n = 23) forvector/altitude instructions.
5. DISCUSSION.
5.1 SUMMARY OF THE RESULTS.
The results of the Phase II simulation support the conclusion thattriple simultaneous parallel ILS approaches can be conducted safelyat the D/FW facility.
Although statistically significant differences were observed in anumber of the computer data analyses, the degree of observeddifferences was generally small. The differences have few, if any,implications for the operations to be conducted at D/FW.
API values were generally low and none of the blunders resulted ina slant range of less than 1000 ft between two aircraft.Therefore, no special investigations were necessary in conjunctionwith the Operational Assessment Approach (see Section 2.1.2).
A significant difference was detected between dual and tripleapproach conditions in only one of the various analyses performedon the computer data. A difference in CPA values between approachconditions was detected in a second order (three way) interactionbetween blunder degree, communication condition, and approachconditions. This finding may be of limited significance since theCPA values were all within the prescribed limits of safe operation.
Additionally, none of the analyses favored dual over tripleapproaches. Overall, the worst performance in this study occurredin the east airport dual approach condition, for 20 degree blundersin which radio contact was not maintained with the controller.
The lack of radio communications by the blundering aircraftproduced more severe conflicts than occurred when the blunderingaircraft maintained radio communications, as indicated by thesignificant differences in API values and CPAs. Additionally therewas a significant effect of blunder degree on conflict severity,as indicated by the CPAs. This difference was not detected in theAPI analysis. The 30 degree blunders produced the smallest CPAsfollowed by 20 degree and 10 degree blunders.
The results of the data analysis for blunders threatening onerunway versus two runways indicated that blunders threatening onerunway created more serious conflict situations as indicated by thelarger average API values and the smaller average CPA values.
46
An analysis of 50 blunders indicated that there were no significantdifferences between the one and two runway threatened conditionswith respect to the time interval between blunder initiation andaltitude/vector change entry. There was, however, a differencebetween conditions in the commands issued to the threatenedaircraft. When one runway was threatened, the controller issueda vector change to the threatened aircraft. When two runways werethreatened, the controller for runway 17L, the runway adjacent tothe blundering aircraft, would immediately issue an altitude changeto the threatened aircraft. Normally, this was a command to climb.The controller for the outside runway, farthest from the blunderingaircraft's approach, would issue a vector change to any threatenedaircraft. Once the outside runway's aircraft had achieved safeseparation from the middle runway's aircraft, the middle aircraftwould be issued a vector change. This procedure was followed foralmost all of the blunders which threatened two runways.
The procedural differences cited in the previous paragraph mayexplain the superior system performance in the two runwaysthreatened condition. Because blundering aircraft alwaysmaintained a uniform descent following the blunder, altitude changeinstructions to nonblundering, threatened aircraft would cause morerapid changes in both CPA and API values than would vector changes.Vector changes were normally issued in the one runway threatenedcondition, the API was higher in that condition than in the tworunway's threatened condition, in which altitude changeinstructions rapidly decreased the API value. Likewise the CPAwould increase in the two runways threatened condition faster thanit would in the situation in which only one runway was threatened.
The analysis of comparable events in the dual and triple approachconditions indicated no significant differences between approachconditions. Differences were found in API and CPA values betweenblunder degree conditions. For the east airport comparable eventsanalysis, the API analysis showed no significant effects, but theCPA analysis indicated that the 30 degree blunder condition wasworst followed by 20 and 10 degree blunder conditions. For theanalogous west airport comparison, the API analysis indicated that10 degree blunders resulted in the largest average API. The 30degree blunders resulted in a slightly smaller average API, and the20 degree blunders resulted in the smallest average API. The CPAanalysis differed in that 30 degree blunders had the smallest CPAfollowed closely by 10 degree blunders, and 20 degree blundersrespectively.
The results of the dual approach airport comparisons indicated thatrunway separation did impact the safety measures in the predicteddirection. In general, there were more NTZ entries, higher APIvalues, and smaller CPA values for the east airport (runwayseparation = 5000 ft) than for the west airport (runway separation= 8800 ft).
47
The questionnaires indicated that controllers discriminatedsomewhat among the conditions employed in this study. Thecontrollers, overall, found all of the conditions to be highlyworkable. The mental workload was considered to be low, and theactivity and stress levels moderate and low, respectively.Controller self-ratings of performance were good to superiorthroughout the simulation.
Finally, the controller response time measures provided valuableinsight concerning both controller and system performance. Therewas an inverse relationship between controller response time anddegree of blunder. Additionally, the type of command issued hadan effect on both simulator pilot response times and safetymeasures. Longer, more complicated, vector changes produced longerdelays in simulator operator entry. Secondly, response timemeasurement analysis revealed that smaller APIs and larger CPAscould be produced by initially issuing an increase in altitude tononblundering aircraft before issuing a vector change.
5.2 NAVIGATIONAL ERROR MODEL PERFORMANCE.
The navigational error model used at the end of the Phase IIsimulation appeared reasonable to the controllers and wasconsistent with the Chicago data [11]. However, furtherrefinements of the model are likely to be made for the Phase IIIsimulation.
5.3 CRITIQUE OF THE SIMULATION.
This section describes issues noted by researchers, observers, andcontrollers during the Phase II simulation. Section 7.1, suggestsimprovements in the simulation models and the procedures forpossible implementation in Phase III of the D/FW series.
5.3.1 Limitations of the Simulation.
5.3.1.1 Navigational Error Model.
The navigational error model underwent 2 changes during the courseof the simulation. The final model, in place for the last eightruns of Phase II, was accepted by controllers as realistic.However, there is still need for further refinements to the modelin light of the Chicago data (12].
5.3.1.2 Aircraft Turn Rates.
The maximum aircraft turn rate of 6 degrees per second wasavailable for most of the runs in Phase II and was viewed asunrealistic. In response to comments from the industry observers,the final nine runs of the simulation employed only the 3 degreesper second turn rate to provide a more realistic depiction ofaircraft performance.
48
5.3.1.3 Speed Overtakes.
There were no longitudinal conflicts created by speed overtakes inthe Phase II simulation except in the ad hoc run. Controllerscommented that one of their most frequent activities is thehandling of aircraft speed adjustments, and that speed overtakesshould be included in the simulation.
5.3.1.4 Blunders.
Industry observers felt that the number of blunders that occurredwithin 2 nmi of the threshold was insufficient. They also notedthat the continuing descent of blundering aircraft toward thethreshold was not realistic. Controllers and some observerscommented that the frequency of blunders (i.e., approximately every3 minutes) was too high and, that blunders were, thus, toopredictable.
5.3.2 Procedural Issues.
5.3.2.1 Simulation Run Schedule.
Controllers, because of equipment failures and other contingencies,were occasionally required to serve in more than three simulationruns in one day. Fatigue, therefore, was a concern expressed insimulation reports.
5.3.2.2 Practice Effects.
Practice effects were observed in simulator pilot performance.Most of the NSSF simulator pilot errors occurred in the early runs.In addition, measures such as the number of pilot messages showeddecreases after the first few runs. Because acclimation does occurfor both controllers and NSSF simulator pilots, predeterminedpractice runs should be incorporated into each simulation.
5.3.2.3 Measurement of 'ontroller Response Time.
Accurate and efficient measurement of controller response time isimportant for the understanding of both controller and systemperformance. Response time data should be "collected" in the samemanner as the other computer data. This would also ensure dataaccuracy.
6. CONCLUSIONS.
The Phase II Dallas/Fort Worth (D/FW) simulation investigated thepotential of triple simultaneous Instrument Landing System (ILS)approaches. Analysis of the Aircraft Proximity Index (API) andClosest Point of Approach (CPA) metrics indicated that triplesimultaneous ILS approaches resulted in miss distances
49
statistically equivalent to those which occurred in the dualsimultaneous parallel ILS approaches for the given D/FWconfiguration.
No blunder in either the dual or triple configuration resulted ina slant range miss distance of 1000 ft or less.
Finally, controllers, controller observers, and Air Traffic Control(ATC) management observers concluded that the triple simultaneousILS approach operation at D/FW is acceptable, achievable, and safe.
7. RECOMMENDATIONS.
7.1 RECOMMENDATIONS FOR THE PHASE III SIMULATION.
The Dallas Fort WoL'th (D/FW) Phase III simulation, to be conductedin the near future, will investigate quadruple simultaneousInstrument Landing System (ILS) approaches at the D/FW Airport.The methodology for Phase III will be similar to that of Phase II.Given the comments of the participants in the Phase II simulation,presented in Section 5.3, the following are recommendations withregard to Phase III and future simulations.
7.1.1 Proposed Changes in the Simulation.
7.1.1.1 Navigational Error Model.
While controllers viewed the navigational error model in place atthe end of Phase II as realistic, there should be a continuingeffort to improve the navigational error model so that a completeand accurate representation of flight technical error (FTE) willbe achieved for the critical simulations to be conducted in PhasesIV and V of the National Airport Capacity Enhancement Program. Anumber of enhancements have been proposed and should be furtherinvestigated for the Phase III simulation.
7.1.1.2 Aircraft Turn Rate.
Industry observers recommended that data from missed approachsimulation studies conducted at the FAA in Oklahoma City, as wellas data collected at the Chicago O'Hare facility, be used to assessthe aircraft turn rate model before the Phase III simulation.
7.1.1.3 Speed Overtakes.
Since the maintenance of longitudinal spacing is an integral partof the monitor controller's work, it is recommended that some speedovertakes (i.e., one or two per run) be included in the Phase IIIsimulation.
50
7.1.1.4 Blunders.
Because of suggestions by industry observers and other participantsduring the Phase II simulation, a number of recommendations aremade with regard to the blunder scenarios for Phase III. Moretraffic samples and blunder scenarios should be developed, so thatcontrollers will be less able to predict blundering aircraft.
7.1.1.5 Altitude Maintenance of Blundering Aircraft.
To achieve a more accurate representation of blundering aircraftperformance in the simulation, it is recommended that blunderingaircraft not uniformly descend toward the runway following theblunder. In actuality, aircraft would be more likely to maintainaltitude after such an event. Therefore, it is further recommendedthat some blundering aircraft maintain altitude and others descend,to attain a more realistic representation.
7.1.1.6 Proximity of Blundering Aircraft to Threshold.
Finally, it is not infeasible that aircraft might blunder within2 nautical miles (nmi) of the threshold. Therefore, it isrecommended that one or two of the aircraft in each Phase III runinitiate blunders within 2 nmi of the threshold.
7.1.2 Procedural ChanQes for Phase III.
7.1.2.1 Simulation Schedule.
It is recommended that controllers not be asked to serve in morethan two consecutive runs or more than three runs per day.Otherwise, fatigue may become a relevant performance factor.
It is recommended that practice runs, which are not subject toformal analysis, be incorporated in the Phase III simulation forthe benefit of both controllers and simulator pilots.
7.1.2.2 Controller Performance Measures.
The controller response time measure is a valuable one. It is,therefore, recommended that a means be found by which to measureresponse time "on-line" in upcoming simulations. In particular,the potential gains of new technologies such as high update radarand blunder alerting systems may be subject to the perceptuallimitations of the controller. The measurement of controllerresponse time is one means to assess the controller benefitsderived from these new technologies.
51
REFERENCES
1. Federal Aviation Administration, Air Traffic Control,DOT/FAA/HDBK 7110.65F, September 21, 1989.
2. McLaughlin, Francis X., An Analysis of the Separation BetweenDual Instrument Approaches, Franklin Institute Labs, FAA/BRD-14/12, April 1960.
3. Haines, A. L., Reduction of Parallel Runway Requirements, TheMITRE Corp., MTR-6282, January 1973.
4. Resalab Inc., Lateral Separation, Report FAA-RD-72-58, VolumesI and II, July 1975.
5. ICAO, Manual on the Use of the Collision Risk Model for ILSOperations, Document No. 9274-AN/904, 1980.
6. Haines, A. L., and Swedish, W. J., Requirements for Independentand Dependent Parallel Instrument Approaches at Reduced RunwaySpacing, The MITRE Corp., MTR-81W15, May 1981.
7. Shimi, T. N., Swedish, W. J., and Newman, L. C., Requirementsfor Instrument Approaches to Triple Parallel Runways, The MITRECorp., MTR-81W145, July 1981.
8. Romei, Joseph, An Exploratory Study of Simultaneous Approaches,FAA Technical Center, Atlantic City, New Jersey, December 1981.
9. Steinberg, Herbert A., "Collision and Missed Approach Risks inHigh-Capacity Airport Operations," Proceedings of the IEEE,Vol. 38, No. 3, pg. 314.
10. Atlschuler, S. and Elsayed, E., "Simultaneous ILS Approachesto Closely Spaced Parallel Runways: Literature Survey andParameter Identification," RutQers IE Working Paper Series,No. 89-102, Piscataway, New Jersey, February 1989.
11. Buckanin, D., Guishard, R., and Paul, L., Closely SpacedIndependent Parallel Runway Simulation, DOT/FAA/CT-84/85,October 1984.
12. Timoteo, B., and Thomas J., Chicago O'Hare Simultaneous ILSApproach Data Collection and Analysis, DOT/FAA/CT-TN90/11, FAATechnical Center (to be published).
13. Buckanin, D, and Biedrzycki, R., Navigation Performance ofAircraft Making Dependent Instrument Landing System (ILS)Approaches at Memphis International Airport, DOT/FAA/CT-TN86/59, FAA Technical Center, February 1987.
53
14. Paul, L., Shochet, E. and Algeo, R., Atlanta Tower Simulation,DOT/FAA/CT-TN89/27, FAA Technical Center, March 1989.
15. Paul, L., Shochet, E. and Algeo, R., Dallas/Forth WorthSimulation, DOT/FAA/CT-TN89/28, FAA Technical Center, March1989.
16. U. S. Department of Transportation, Federal AviationAdministration, D/FW Metroplex Air Traffic System Plan (seealso Appendix A, Dallas/Fort Worth Simulation, Reference 14above).
54

APPENDIX A
AIRCRAFT PROXIMITY INDEX (API)
THE EVALUATION OF CONFLICTS IN AIR TRAFFIC CONTROL SIMULATIONSLee E. Paul, ACD-340
BACKGROUND
Air Traffic Control (ATC) Simulation is an essential researchtool for the improvement of the National Airspace System(NAS). Simulation can never offer all of the complexity andsubtlety of the real world, with live radar, actual aircraft,full communications systems and the rest of the ATC environ-ment, but it can provide an intensive exercise of key portionsof the system -- with controllers in the loop.
Proper use of simulation starts with carefully defining thequestions to be answered and then developing a simulationenvironment which includes the features that could influencethe process under study. The selection of a simulation envi-ronment, the development of scenarios, the choice of data tobe recorded, and the method of analysis are part science, partart.
An important benefit of simulation is that it permits theexploration of systems, equipment failures, and human errorsthat would be too dangerous to study with aircraft, or thatoccur so rarely in the system that they cannot be fully under-stood and evaluated. A current example of this use has to dowith the introduction of blunders1 in parallel runwayinstrument approaches.
The introduction of large numbers of system errors is a usefulway to study safety, but the analysis of the outcomes of theseincidents is not always simple or clear cut.
SAFETY EVALUATION
1. CONFLICTS
The occurrence of a conflict in normal ATC operations is con-sidered prima facie evidence of a human or system error.Identifying (and counting) conflicts under a variety ofconditions is one way to expose a system problem.
A conflict is defined as the absence of safe separation between twoaircraft flying IFR. At its simplest, safe separation requires: (a)The aircraft must be laterally separated by .3 na or 5 na, depending
1. A blunder is defined as an unexpected turn towards an adjacentapproach by an aircraft already established on the ILS.
\FILES\API-SLAN August 9, 1989 1
A-1
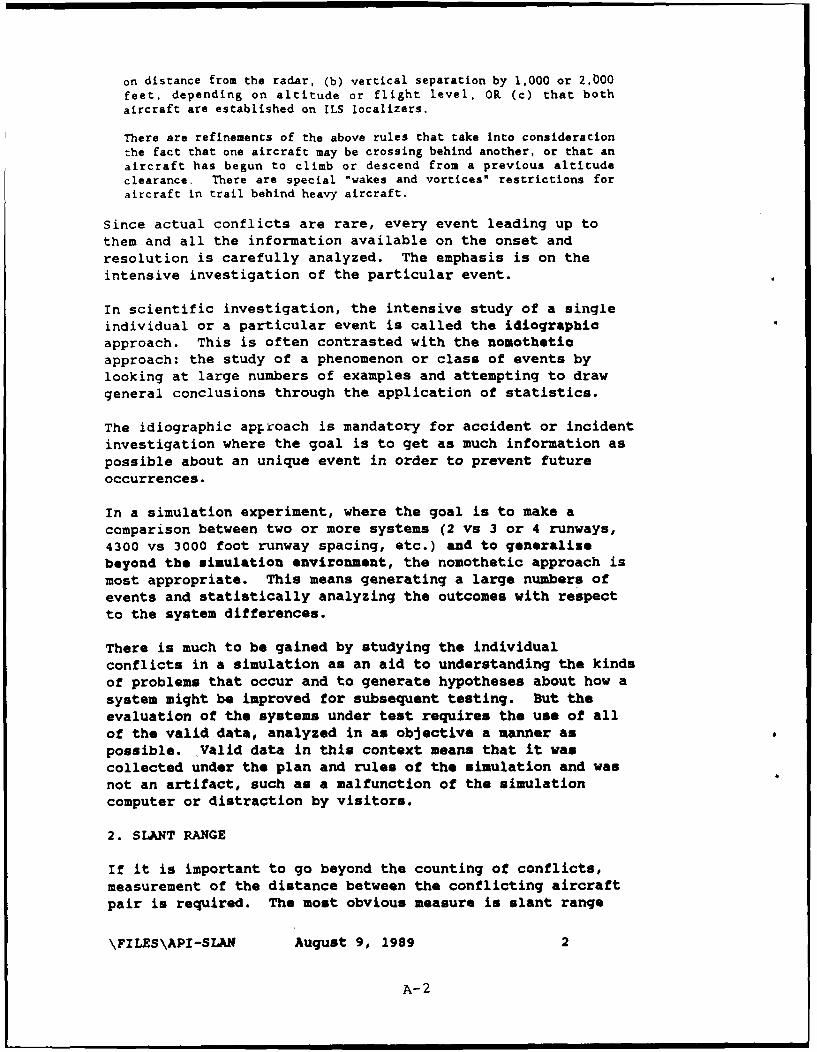
on distance from the radar, (b) vertical separation by 1,000 or 2,000feet, depending on altitude or flight level, OR (c) that bothaircraft are established on ILS localizers.
There are refinements of the above rules that take into consideration
the fact that one aircraft may be crossing behind another, or that anaircraft has begun to climb or descend from a previous altitudeclearance. There are special "wakes and vortices" restrictions foraircraft in trail behind heavy aircraft.
Since actual conflicts are rare, every event leading up to
them and all the information available on the onset andresolution is carefully analyzed. The emphasis is on theintensive investigation of the particular event.
In scientific investigation, the intensive study of a singleindividual or a particular event is called the idiographicapproach. This is often contrasted with the nomothetlcapproach: the study of a phenomenon or class of events bylooking at large numbers of examples and attempting to drawgeneral conclusions through the application of statistics.
The idiographic approach is mandatory for accident or incidentinvestigation where the goal is to get as much information aspossible about an unique event in order to prevent futureoccurrences.
In a simulation experiment, where the goal is to make acomparison between two or more systems (2 vs 3 or 4 runways,4300 vs 3000 foot runway spacing, etc.) and to generalizebeyond the simulation environment, the nomothetic approach ismost appropriate. This means generating a large numbers ofevents and statistically analyzing the outcomes with respectto the system differences.
There is much to be gained by studying the individualconflicts in a simulation as an aid to understanding the kinds
of problems that occur and to generate hypotheses about how asystem might be improved for subsequent testing. But theevaluation of the systems under test requires the use of allof the valid data, analyzed in as objective a manner aspossible. Valid data in this context means that it wascollected under the plan and rules of the simulation and wasnot an artifact, such as a malfunction of the simulationcomputer or distraction by visitors.
2. SLANT RANGE
If it is important to go beyond the counting of conflicts,measurement of the distance between the conflicting aircraftpair is required. The most obvious measure is slant range
\FILES\API-SLAN August 9, 1989 2
A-2
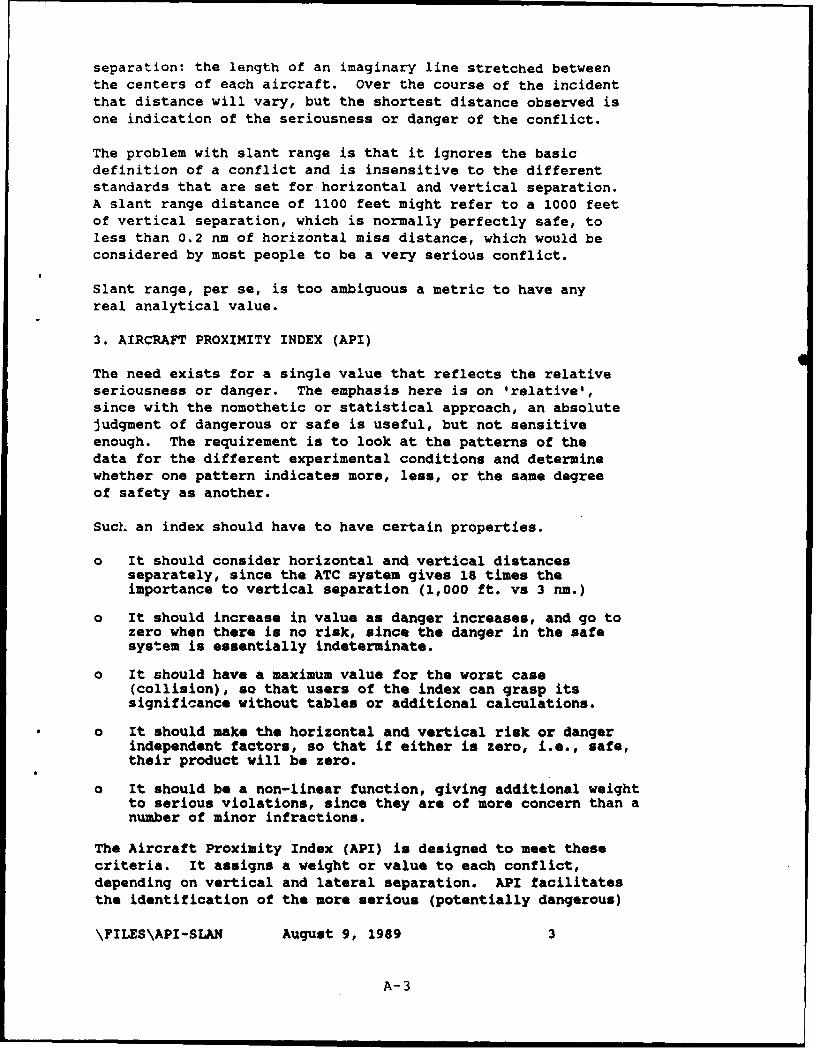
separation: the length of an imaginary line stretched betweenthe centers of each aircraft. Over the course of the incidentthat distance will vary, but the shortest distance observed isone indication of the seriousness or danger of the conflict.
The problem with slant range is that it ignores the basicdefinition of a conflict and is insensitive to the differentstandards that are set for horizontal and vertical separation.A slant range distance of 1100 feet might refer to a 1000 feetof vertical separation, which is normally perfectly safe, toless than 0.2 nm of horizontal miss distance, which would beconsidered by most people to be a very serious conflict.
Slant range, per se, is too ambiguous a metric to have anyreal analytical value.
3. AIRCRAFT PROXIMITY INDEX (API)
The need exists for a single value that reflects the relativeseriousness or danger. The emphasis here is on 'relative',since with the nomothetic or statistical approach, an absolutejudgment of dangerous or safe is useful, but not sensitiveenough. The requirement is to look at the patterns of thedata for the different experimental conditions and determinewhether one pattern indicates more, less, or the same degreeof safety as another.
Such an index should have to have certain properties.
o It should consider horizontal and vertical distancesseparately, since the ATC system gives 18 times theimportance to vertical separation (1,000 ft. vs 3 rim.)
o It should increase in value as danger increases, and go tozero when there is no risk, since the danger in the safesystem is essentially indeterminate.
" It should have a maximum value for the worst case(collision), so that users of the index can grasp itssignificance without tables or additional calculations.
o It should make the horizontal and vertical risk or dangerindependent factors, so that if either is zero, i.e., safe,their product will be zero.
o It should be a non-linear function, giving additional weightto serious violations, since they are of more concern than anumber of minor infractions.
The Aircraft Proximity Index (API) is designed to meet thesecriteria. It assigns a weight or value to each conflict,depending on vertical and lateral separation. API facilitatesthe identification of the more serious (potentially dangerous)
\FILES\API-SLAN August 9, 1989 3
A-3
conflictions in a data base where many conflictions arepresent. 100 has been chosen, somewhat arbitrarily, for themaximum value of the API.
APPROACH
During a simulation API can be computed whenever a conflict
exists. For convenience, this is taken to be when two
aircraft have less than 1,000 feet of vertical separation AND
less than 3.0 miles of lateral separation. It is computed
once per second during the conflict. The API of the conflict
is the largest value obtained.
API considers vertical and horizontaa distances separately,then combines the two in a manner than gives them equalweight; equal in the sense that a loss of half the required3.0 NM horizontal separation has the same effect as the lossof half the required 1000 feet of vertical separation.
COMPUTATION
The API ranges from 100 for a mid-air collision to 0 for thevirtual absence of a technical confliction. A linear decreasein distance between the aircraft, either vertically orlaterally, increases the API by the power of 2.
Computation is as follows:
Dv = vertical distance between a/c (in feet)
DH = horizontal distance (Naut. Miles (6,076'))
API = (1,000-DV)2 *(3-DH) 2 /(90,000)
To simplify its use, API is rounded off to the nearestinteger, i.e.,
API =INT((I,000-Dv) 2 *(3_DH) 2/(90,000)+.5)
The rounding process zeros API's less than 0.5. This includesdistances closer than 2 nm AND 800 feet. The contour plot inFigure 1, page 7, demonstrates the cutoff for API - 1.
See Tables 1 and 2 on page 6 for typical values of API at avariety of distances.
Figure 2, page 8, is a 3-dimensional plot showing the relation-ship between API and vertical and horizontal separationgraphically. Figure 3, page 9, shows the same information ina slightly different way. Anything outside the contour at the
\FILES\API-SLAN August 9, 1989 4
A-4
base is '0'. In figure 4, page 10, a contour plot of API forhorizontal and vertical distances from 0 to 500 feet is shown,with 300-foot and 500-foot slant range distances superimposed.
The index is not intended as a measure of acceptable risk, butit meets the need to look at aircraft safety in a more compre-hensive way than simply counting conflictions or counting thenumber of aircraft that came closer than 200 feet, or someother arbitrary value.
It should be used to compare conflicts in similarenvironments. I.e., an API of 70 in enroute airspace withspeeds of 600 kts is not necessarI'y the same concern as a 70in highly structured terminal airspace with speeds under 250kts.
Since the API is computed every second, it may be useful toexamine its dynamics over time as a means of understanding thecontrol process.
\FILES\API-SLAN August 9, 1989 5
A-5
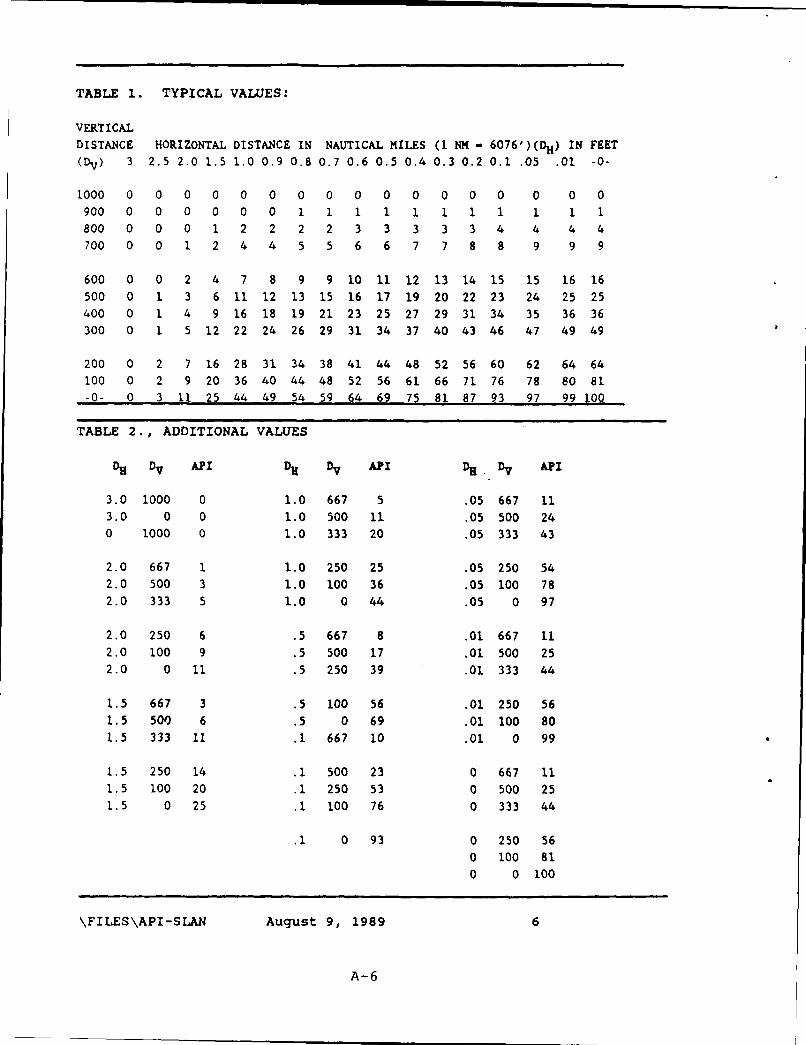
TABLE 1. TYPICAL VALUES:
VERTICALDISTANCE HORIZONTAL DISTANCE IN NAUTICAL MILES (I NM - 60 76 ')(DH) IN FEET(Dv) 3 2.5 2.0 1.5 1.0 0.9 0.8 0.7 0.6 0.5 0.4 0.3 0.2 0.1 .05 .01 -0-
1000 0 0 0 0 0 0 0 0 0 0 0 0 0 0 0 0 0
900 0 0 0 0 0 0 1 1 1 1 1 1 1 1 1 1 1
800 0 0 0 1 2 2 2 2 3 3 3 3 3 4 4 4 4700 0 0 1 2 4 4 5 5 6 6 7 7 8 8 9 9 9
600 0 0 2 4 7 8 9 9 10 11 12 13 14 15 15 16 16500 0 1 3 6 11 12 13 15 16 17 19 20 22 23 24 25 25
400 0 1 4 9 16 18 19 21 23 25 27 29 31 34 35 36 36300 0 1 5 12 22 24 26 29 31 34 37 40 43 46 47 49 49
200 0 2 7 16 28 31 34 38 41 44 48 52 56 60 62 64 64100 0 2 9 20 36 40 44 48 52 56 61 66 71 76 78 80 81
-0- 0 3 11 25 44 49 54 59 64 69 75 81 87 93 97 99 100
TABLE 2., ADDITIONAL VALUES
DH Dv API DH DV API DR DV API
3.0 1000 0 1.0 667 5 .05 667 113.0 0 0 1.0 500 11 .05 500 240 1000 0 1.0 333 20 .05 333 43
2.0 667 1 1.0 250 25 .05 250 542.0 500 3 1.0 100 36 .05 100 782.0 333 5 1.0 0 44 .05 0 97
2.0 250 6 .5 667 8 .01 667 112.0 100 9 .5 500 17 .01 500 252.0 0 11 .5 250 39 .01 333 44
1.5 667 3 .5 100 56 .01 250 561.5 500 6 .5 0 69 .01 100 80
1.5 333 11 .1 667 10 .01 0 99
1.5 250 14 .1 500 23 0 667 111.5 100 20 .1 250 53 0 500 251.5 0 25 .1 100 76 0 333 44
.1 0 93 0 250 56
0 100 81
0 0 100
\FILES\API-SLAN August 9, 1989 6
A-6
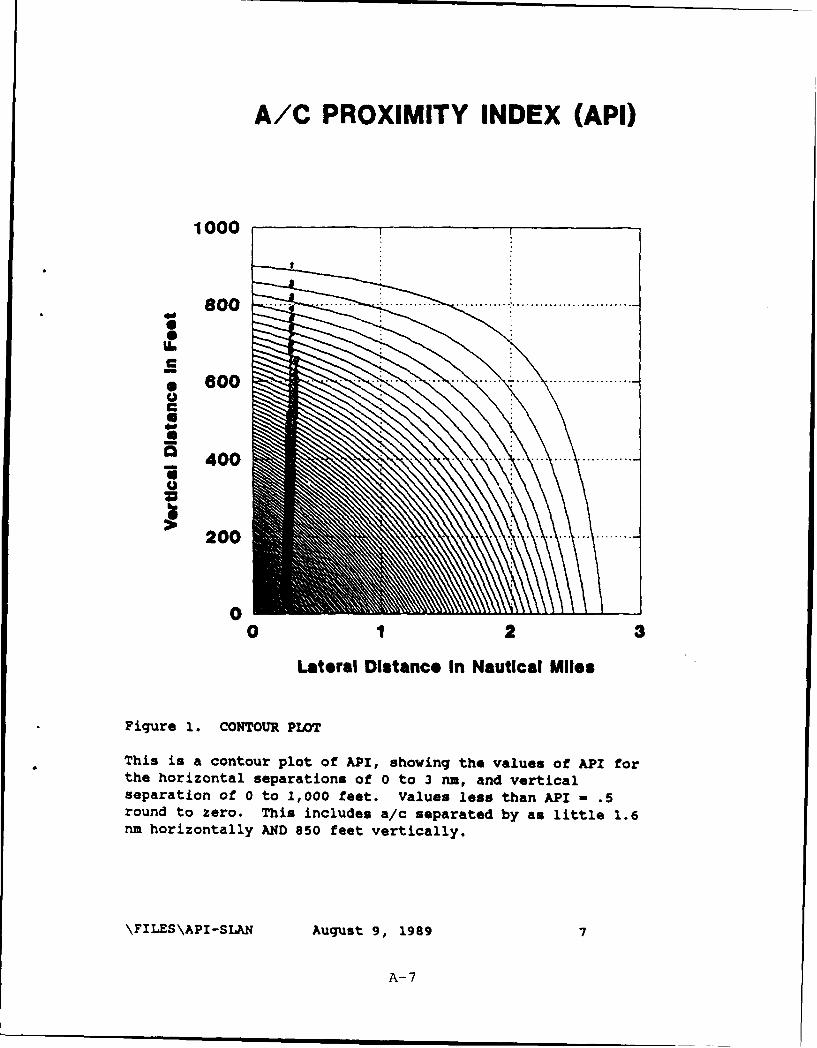
A/C PROXIMITY INDEX (API)
1000
S o o .. .. ...... . ........ ... ............. .......................
UmC
4 0 0 . ............. .
2 0 0 .. .. ... .........
00 12 3
Lateral Distance In Nautical Miles
Figure 1. CONTOUR pLOT
This is a contour plot of API, showing the values of API forthe horizontal separations of 0 to 3 nm, and verticalseparation of 0 to 1,000 feet. Values less than API - .5round to zero. This includes a/c separated by an little 1.6nm horizontally AND 850 feet vertically.
\FILES\API-SLAN August 9, 1989 7
A-7
C
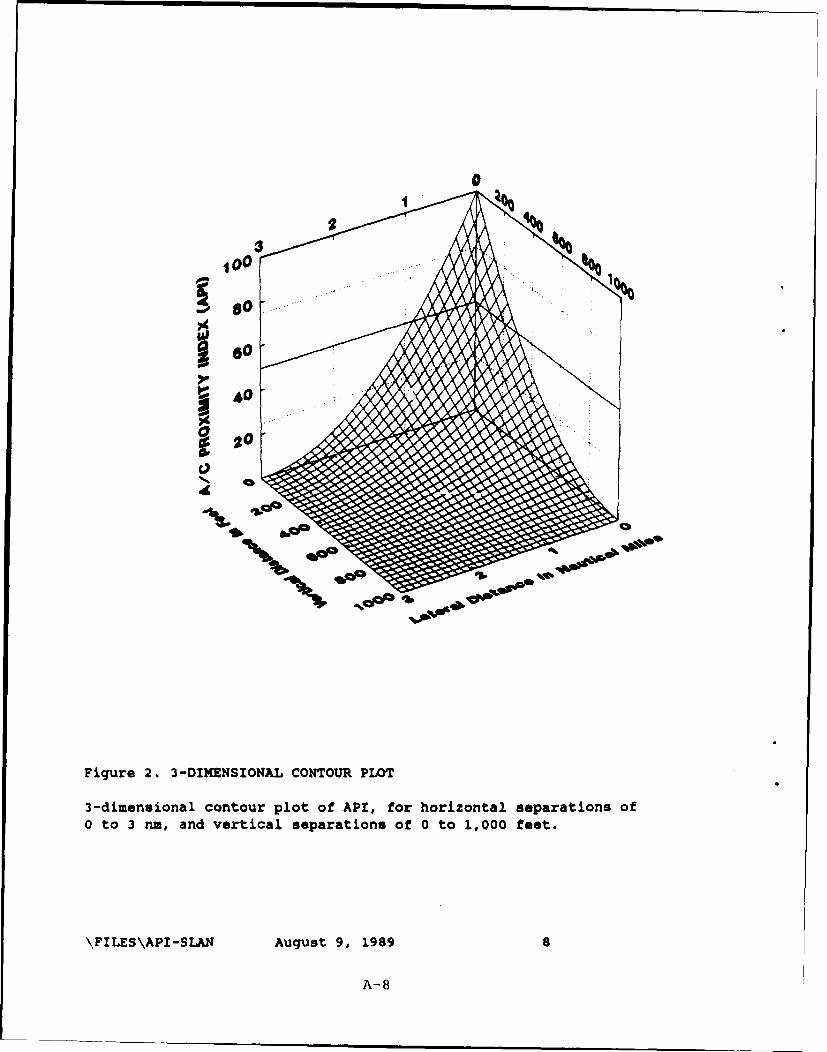
0
100..
21
a-)
Figure 2. 3-DIMENSIONAL CONTOUR PLOT
3-dimensional contour plot of API, for horizontal separations of0 to 3 na, and vertical separations of 0 to 1,000 feet.
\FILES\API-SLAN August 9, 1989 8
A-8
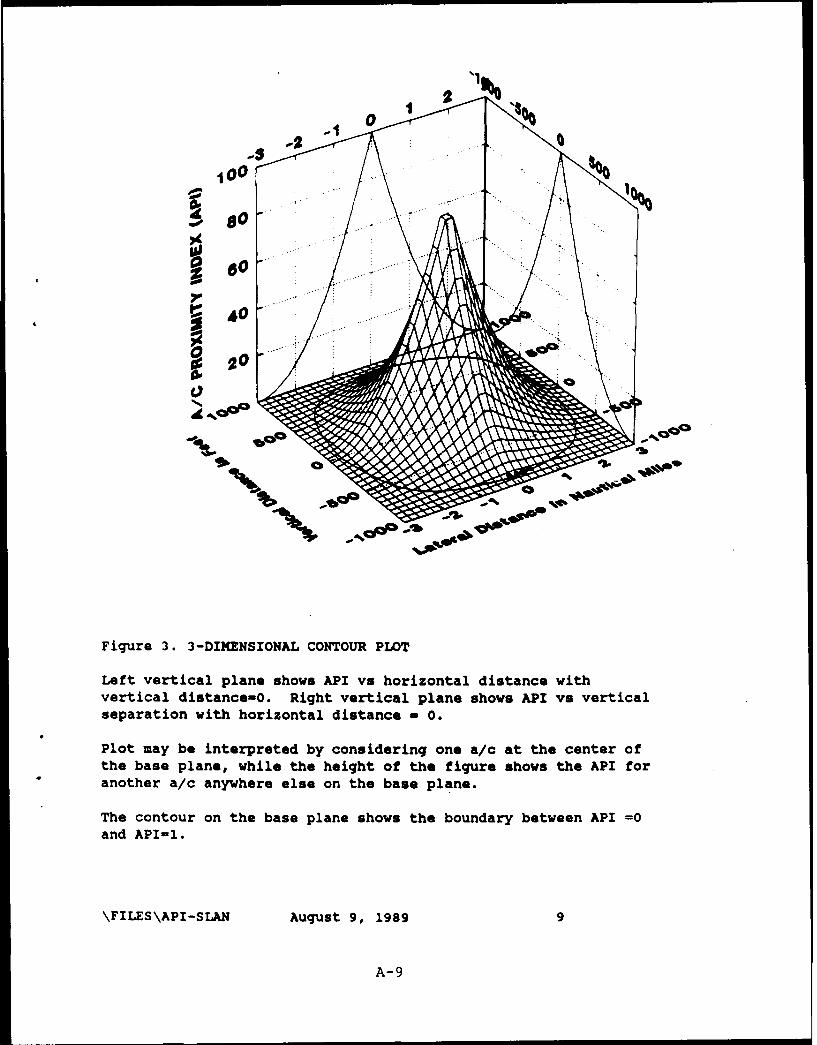
100
20
Figure 3. 3-DIMENSIONAL CONTOUR PLOT
Left vertical plane shows API vs horizontal distance withvertical distance-0. Right vertical plane shows API vs verticalseparation with horizontal distance - 0.
Plot may be interpreted by considering one a/c at the center ofthe base plane, while the height of the figure shows the API foranother a/c anywhere else on the base plane.
The contour on the base plane shows the boundary between API =0and API-1.
\FILES\API-SLAN August 9, 1989 9
A-9
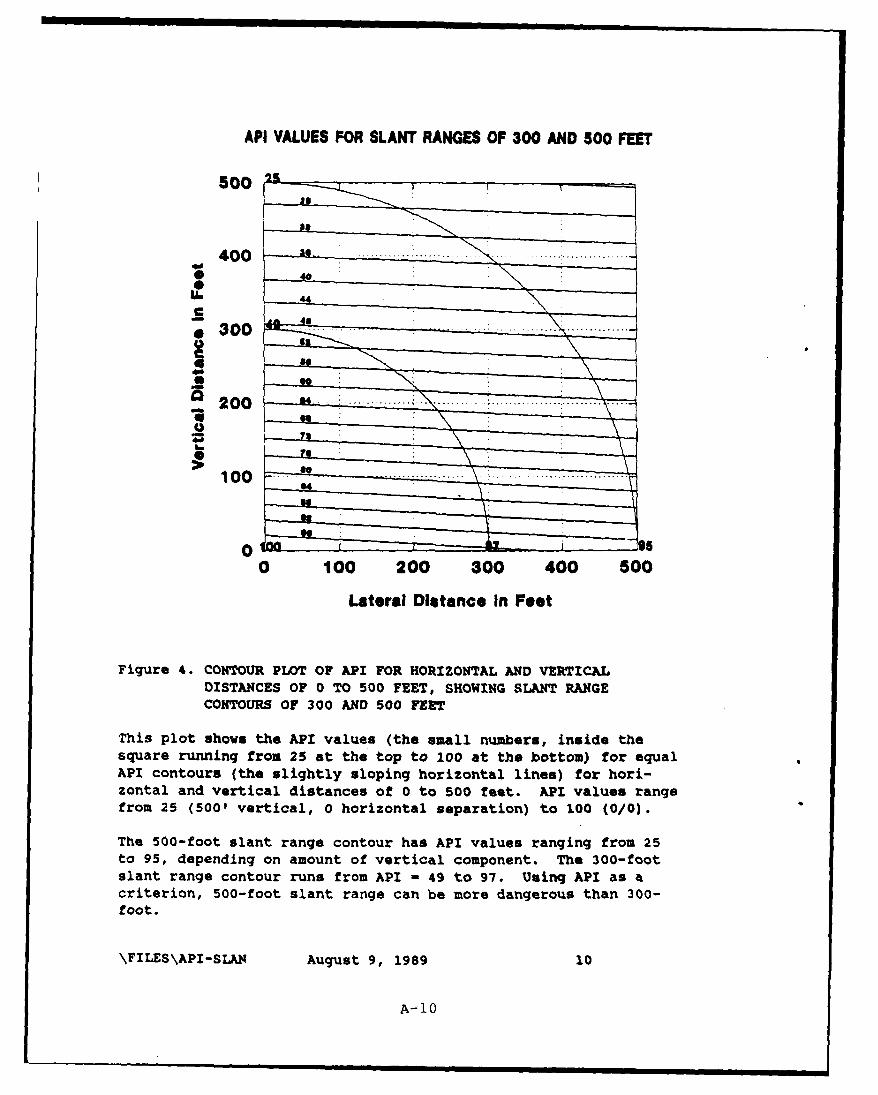
API VALUES FOR SLANT RANGES OF 300 AND 500 FEET
500 2
4 0 0.. .......... .
C .. .... .. ... .000
100
00
0 100 200 300 400 500
Lateral Distance in Feet
Figure 4. CONTOUR PLOT OF API FOR HORIZONTAL AND VERTICALDISTANCES OF 0 TO 500 FEET, SHOWING SLANT RANGECONTOURS OF 300 AND 500 FEET
This plot shows the API values (the small numbers, inside thesquare running from 25 at the top to 100 at the bottom) for equalAPI contours (the slightly sloping horizontal lines) for hori-zontal and vertical distances of 0 to 500 feet. API values rangefrom 25 (500' vertical, 0 horizontal separation) to 100 (0/0).
The 500-foot slant range contour has API values ranging from 25to 95, depending on amount of vertical component. The 300-footslant range contour runs from API - 49 to 97. Using API as acriterion, 500-foot slant range can be more dangerous than 300-foot.
\FILES\API-SLAN August 9, 1989 10
A-10

APPENDIX B
BLUNDER SCENARIOS USED FOR THE D/FW PHASE II SIMULATION
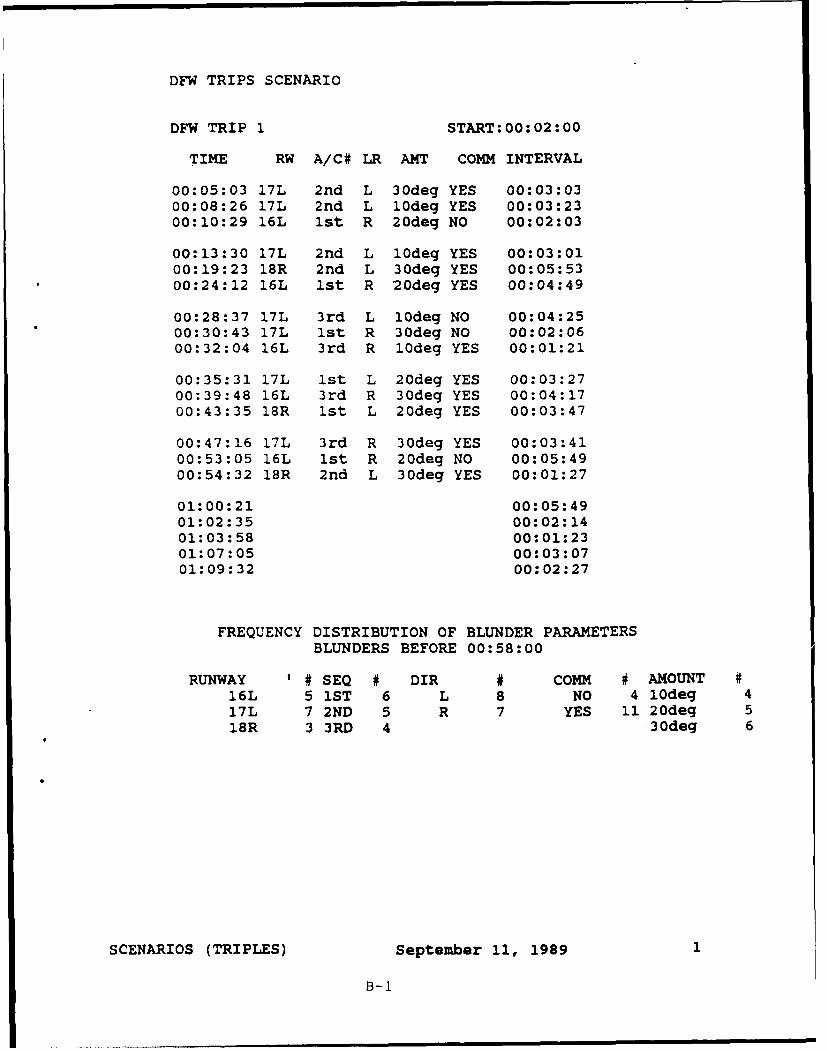
DFW TRIPS SCENARIO
DFW TRIP 1 START:00:02:00
TIME RW A/C# LR AMT COMM INTERVAL
00:05:03 17L 2nd L 30deg YES 00:03:0300:08:26 17L 2nd L 10deg YES 00:03:2300:10:29 16L ist R 20deg NO 00:02:03
00:13:30 17L 2nd L 10deg YES 00:03:0100:19:23 18R 2nd L 30deg YES 00:05:5300:24:12 16L 1st R 20deg YES 00:04:49
00:28:37 17L 3rd L 10deg NO 00:04:2500:30:43 17L ist R 30deg NO 00:02:0600:32:04 16L 3rd R 10deg YES 00:01:21
00:35:31 17L 1st L 20deg YES 00:03:2700:39:48 16L 3rd R 30deg YES 00:04:1700:43:35 18R 1st L 20deg YES 00:03:47
00:47:16 17L 3rd R 30deg YES 00:03:4100:53:05 16L 1st R 20deg NO 00:05:4900:54:32 18R 2nd L 30deg YES 00:01:27
01:00:21 00:05:4901:02:35 00:02:1401:03:58 00:01:2301:07:05 00:03:0701:09:32 00:02:27
FREQUENCY DISTRIBUTION OF BLUNDER PARAMETERSBLUNDERS BEFORE 00:58:00
RUNWAY ' # SEQ # DIR # COMM # AMOUNT #16L 5 1ST 6 L 8 NO 4 10deg 417L 7 2ND 5 R 7 YES 11 20deg 518R 3 3RD 4 30deq 6
SCENARIOS (TRIPLES) September 11, 1989
B-i
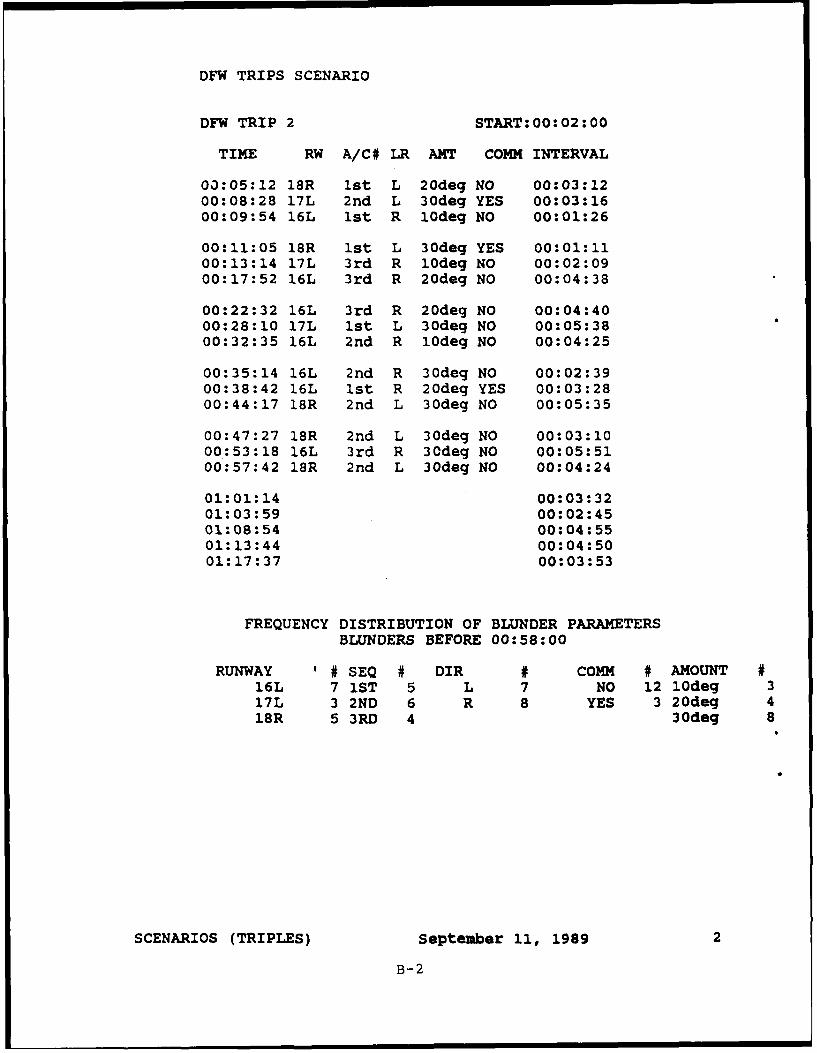
DFW TRIPS SCENARIO
DFW TRIP 2 START:00:02:00
TIME RW A/C# LR AMT COMM INTERVAL
03:05:12 18R 1st L 20deg NO 00:03:1200:08:28 17L 2nd L 30deg YES 00:03:1600:09:54 16L 1st R 10deg NO 00:01:26
00:11:05 18R 1st L 30deg YES 00:01:1100:13:14 17L 3rd R 10deg NO 00:02:0900:17:52 16L 3rd R 20deg NO 00:04:38
00:22:32 16L 3rd R 20deg NO 00:04:4000:28:10 17L 1st L 30deg NO 00:05:3800:32:35 16L 2nd R 10deg NO 00:04:25
00:35:14 16L 2nd R 30deg NO 00:02:3900:38:42 16L 1st R 20deg YES 00:03:2800:44:17 18R 2nd L 30deg NO 00:05:35
00:47:27 18R 2nd L 30deg NO 00:03:1000:53:18 16L 3rd R 30deg NO 00:05:5100:57:42 18R 2nd L 30deg NO 00:04:24
01:01:14 00:03:3201:03:59 00:02:4501:08:54 00:04:5501:13:44 00:04:5001:17:37 00:03:53
FREQUENCY DISTRIBUTION OF BLUNDER PARAMETERSBLUNDERS BEFORE 00:58:00
RUNWAY ' # SEQ # DIR # COMM # AMOUNT #16L 7 1ST 5 L 7 NO 12 10deg 317L 3 2ND 6 R 8 YES 3 20deg 418R 5 3RD 4 30deg 8
SCENARIOS (TRIPLES) September 11, 1989 2
B-2
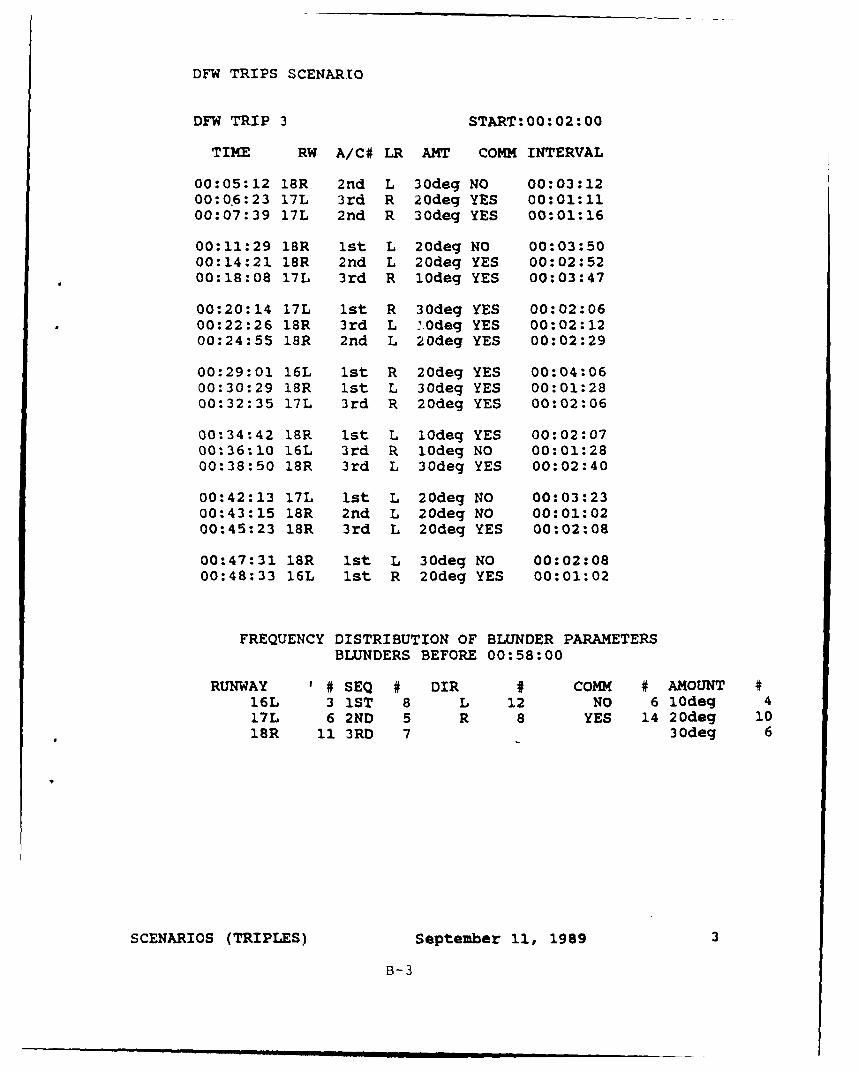
DFW TRIPS SCENARIO
DFW TRIP 3 START:00:02:00
TIME RW A/C# LR AMT COMM INTERVAL
00:05:12 18R 2nd L 30deg NO 00:03:1200:0.6:23 17L 3rd R 20deg YES 00:01:1100:07:39 17L 2nd R 30deg YES 00:01:16
00:11:29 18R ist L 20deg NO 00:03:5000:14:21 18R 2nd L 20deg YES 00:02:5200:18:08 17L 3rd R lodeg YES 00:03:47
00:20:14 17L 1st R 30deg YES 00:02:0600:22:26 18R 3rd L 2,Odeg YES 00:02:1200:24:55 18R 2nd L 20deg YES 00:02:29
00:29:01 16L 1st R 20deg YES 00:04:0600:30:29 18R Ist L 30deg YES 00:01:2800:32:35 17L 3rd R 20deg YES 00:02:06
00:34:42 18R 1st L lOdeg YES 00:02:0700:36:10 16L 3rd R lOdeg NO 00:01:2800:38:50 18R 3rd L 30deg YES 00:02:40
00:42:13 17L 1st L 20deg NO 00:03:2300:43:15 18R 2nd L 20deg NO 00:01:0200:45:23 18R 3rd L 20deg YES 00:02:08
00:47:31 18R Ist L 30deg NO 00:02:0800:48:33 16L 1st R 20deg YES 00:01:02
FREQUENCY DISTRIBUTION OF BLUNDER PARAMETERSBLUNDERS BEFORE 00:58:00
RUNWAY '# SEQ # DIR # COMM # AMOUNT #16L 3 1ST 8 L 12 NO 6 10deg 417L 6 2ND 5 R 8 YES 14 20deg 1018R 11 3RD 7 30deg 6
SCENARIOS (TRIPLES) September 11, 1989 3
B-3
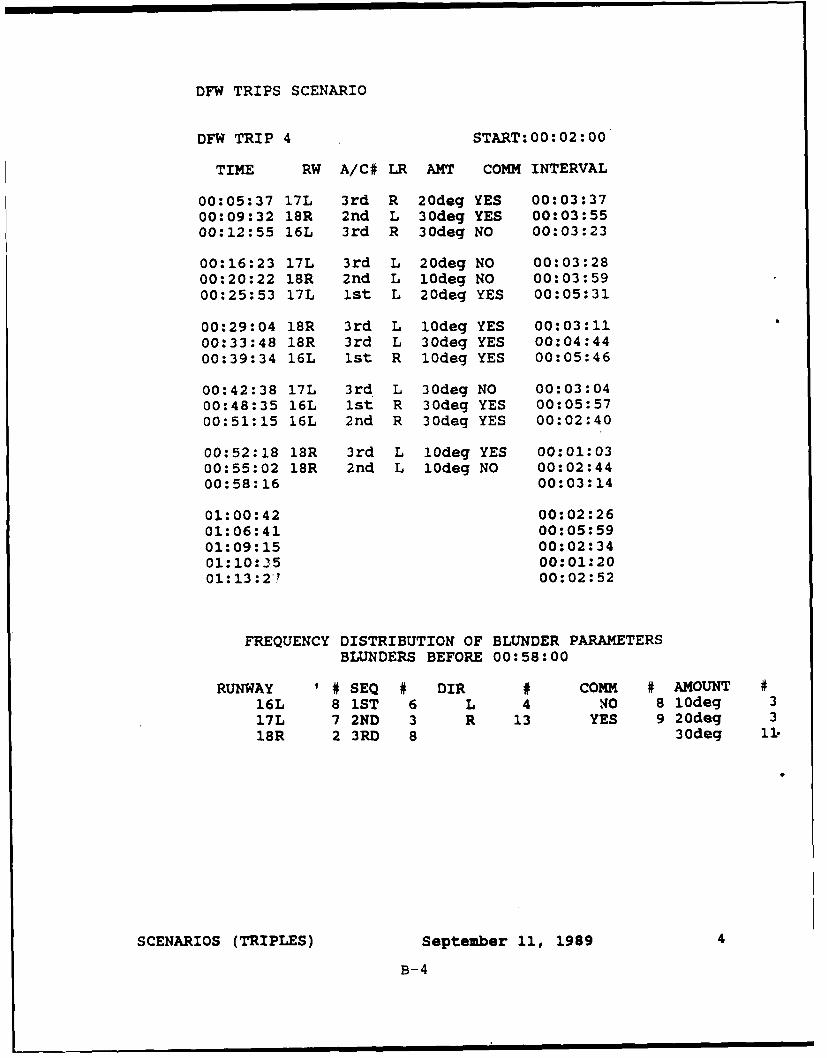
DFW TRIPS SCENARIO
DFW TRIP 4 START:00:02:00
TIME RW A/C# LR AMT COMM INTERVAL
00:05:37 17L 3rd R 20deg YES 00:03:3700:09:32 18R 2nd L 30deg YES 00:03:5500:12:55 16L 3rd R 30deg NO 00:03:23
00:16:23 17L 3rd L 20deg NO 00:03:2800:20:22 18R 2nd L 10deg NO 00:03:5900:25:53 17L 1st L 20deg YES 00:05:31
00:29:04 18R 3rd L 10deg YES 00:03:1100:33:48 18R 3rd L 30deg YES 00:04:4400:39:34 16L 1st R 10deg YES 00:05:46
00:42:38 17L 3rd L 30deg NO 00:03:0400:48:35 16L 1st R 30deg YES 00:05:5700:51:15 16L 2nd R 30deg YES 00:02:40
00:52:18 18R 3rd L 10deg YES 00:01:0300:55:02 18R 2nd L 10deg NO 00:02:4400:58:16 00:03:14
01:00:42 00:02:2601:06:41 00:05:5901:09:15 00:02:3401:10:.25 00:01:2001:13:2'7 00:02:52
FREQUENCY DISTRIBUTION OF BLUNDER PARAMETERSBLUNDERS BEFORE 00:58:00
RUNWAY ' # SEQ # DIR # COMM # AMOUNT #16L 8 1ST 6 L 4 4O 8 10deg 317L 7 2ND 3 R 13 YES 9 20deg 318R 2 3RD 8 30deg 11.
SCENARIOS (TRIPLES) September 11, 1989 4
B-4
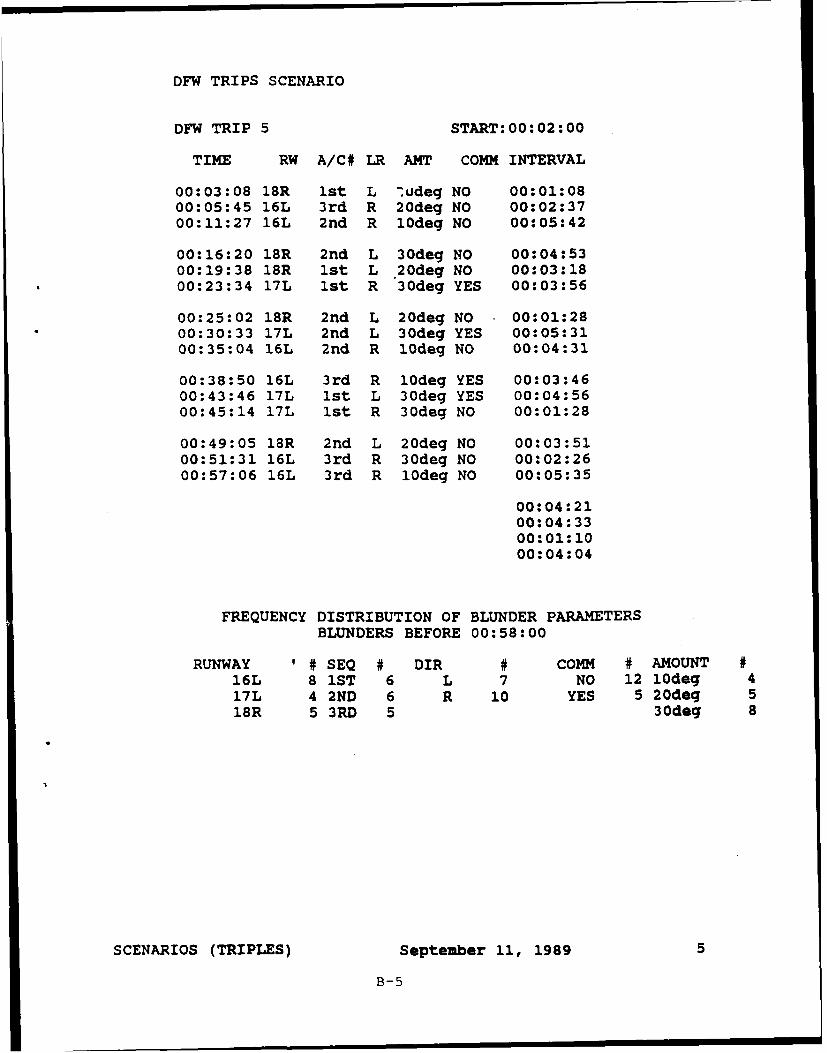
DFW TRIPS SCENARIO
DFW TRIP 5 START:00:02:00
TIME RW A/C# LR AMT COMM INTERVAL
00:03:08 18R 1st L tudeg NO 00:01:0800:05:45 16L 3rd R 20deg NO 00:02:3700:11:27 16L 2nd R 10deg NO 00:05:42
00:16:20 18R 2nd L 30deg NO 00:04:5300:19:38 18R 1st L 20deg NO 00:03:1800:23:34 17L 1st R 30deg YES 00:03:56
00:25:02 18R 2nd L 20deg NO 00:01:2800:30:33 17L 2nd L 30deg YES 00:05:3100:35:04 16L 2nd R 10deg NO 00:04:31
00:38:50 16L 3rd R 10deg YES 00:03:4600:43:46 17L 1st L 30deg YES 00:04:5600:45:14 17L 1st R 30deg NO 00:01:28
00:49:05 18R 2nd L 20deg NO 00:03:5100:51:31 16L 3rd R 30deg NO 00:02:2600:57:06 16L 3rd R 10deg NO 00:05:35
00:04:2100:04:3300:01:1000:04:04
FREQUENCY DISTRIBUTION OF BLUNDER PARAMETERSBLUNDERS BEFORE 00:58:00
RUNWAY '# SEQ # DIR COMM # AMOUNT #16L 81ST 6 L 7 NO 2 10deg 417L 4 2ND 6 R 10 YES 5 20deq 518R 5 3RD 5 30deg 8
SCENARIOS (TRIPLES) September 11, 1989 5
B-5
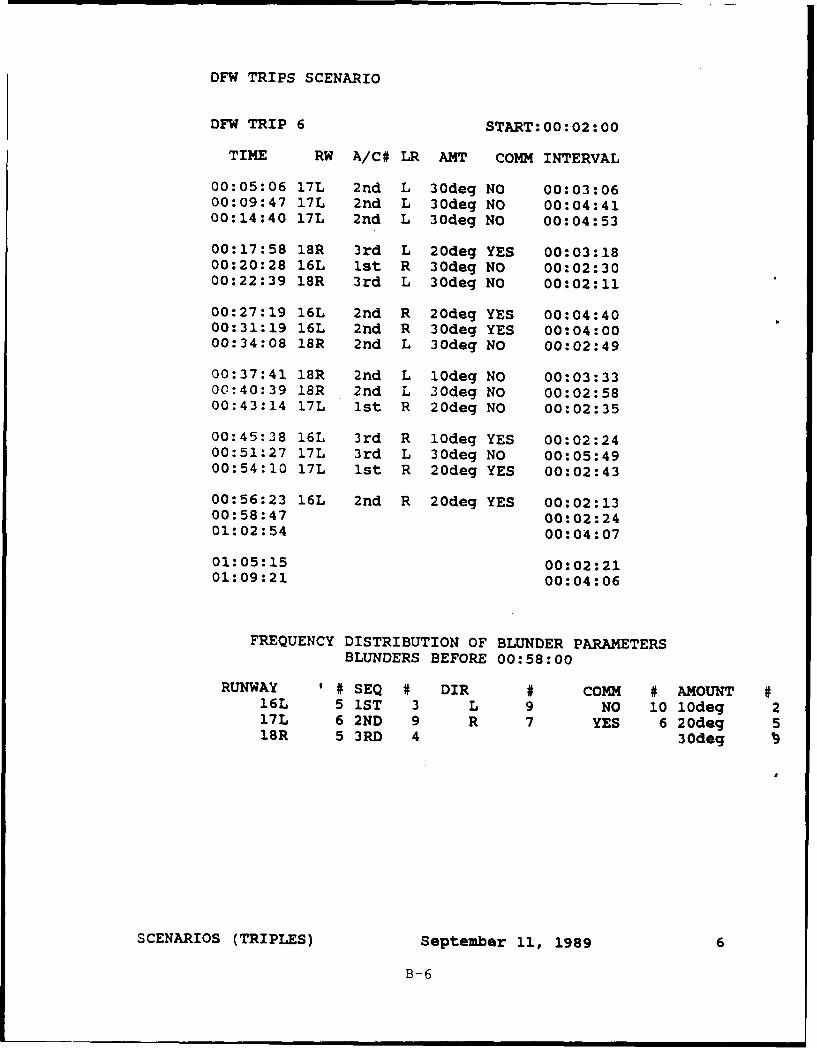
DFW TRIPS SCENARIO
DFW TRIP 6 START:O0:02:00
TIME RW A/C# LR AMT COMM INTERVAL
00:05:06 17L 2nd L 30deg NO 00:03:0600:09:47 17L 2nd L 30deg NO 00:04:4100:14:40 17L 2nd L 30deg NO 00:04:53
00:17:58 18R 3rd L 20deg YES 00:03:1800:20:28 16L 1st R 30deg NO 00:02:3000:22:39 18R 3rd L 30deg NO 00:02:11
00:27:19 16L 2nd R 20deg YES 00:04:4000:31:19 16L 2nd R 30deg YES 00:04:0000:34:08 18R 2nd L 30deg NO 00:02:49
00:37:41 18R 2nd L 10deg NO 00:03:3300:40:39 18R 2nd L 30deg NO 00:02:5800:43:14 17L 1st R 20deg NO 00:02:35
00:45:38 16L 3rd R 10deg YES 00:02:2400:51:27 17L 3rd L 30deg NO 00:05:4900:54:10 17L 1st R 20deg YES 00:02:43
00:56:23 16L 2nd R 20deg YES 00:02:1300:58:47 00:02:2401:02:54 00:04:07
01:05:15 00:02:2101:09:21 00:04:06
FREQUENCY DISTRIBUTION OF BLUNDER PARAMETERSBLUNDERS BEFORE 00:58:00
RUNWAY '# SEQ # DIR # COMM # AMOUNT #16L 5 1ST 3 L 9 NO 10 lodeg 217L 6 2ND 9 R 7 YES 6 20deg 518R 5 3RD 4 30deg
SCENARIOS (TRIPLES) September 11, 1989 6
B-6
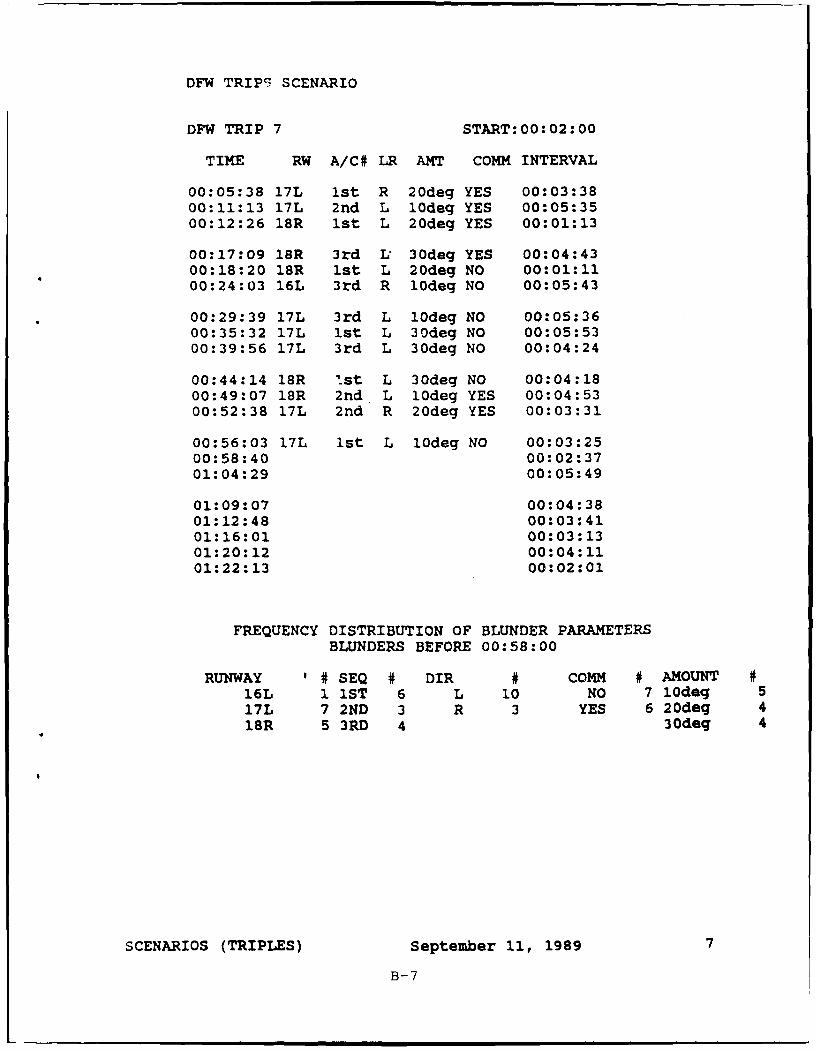
DFW TRIPS SCENARIO
DFW TRIP 7 START:00:02:00
TIME RW A/C# LR AMT COMM INTERVAL
00:05:38 17L 1st R 20deg YES 00:03:3800:11:13 17L 2nd L 10deg YES 00:05:3500:12:26 18R ist L 20deg YES 00:01:13
00:17:09 18R 3rd L 30deg YES 00:04:4300:18:20 18R Ist L 20deg NO 00:01:1100:24:03 16L 3rd R 10deg NO 00:05:43
00:29:39 17L 3rd L 10deg NO 00:05:3600:35:32 17L 1st L 30deg NO 00:05:5300:39:56 17L 3rd L 30deg NO 00:04:24
00:44:14 18R ist L 30deg NO 00:04:1800:49:07 18R 2nd L 10deg YES 00:04:5300:52:38 17L 2nd R 20deg YES 00:03:31
00:56:03 17L 1st L lOdeg NO 00:03:2500:58:40 00:02:3701:04:29 00:05:49
01:09:07 00:04:3801:12:48 00:03:4101:16:01 00:03:1301:20:12 00:04:1101:22:13 00:02:01
FREQUENCY DISTRIBUTION OF BLUNDER PARAMETERSBLUNDERS BEFORE 00:58:00
RUNWAY '# SEQ # DIR # COMM # AMOUNT #16L 1 IST 6 L 10 NO 7 lodeg 517L 7 2ND 3 R 3 YES 6 20deq 418R 5 3RD 4 30deg 4
SCENARIOS (TRIPLES) September 11, 1989 7
B-7
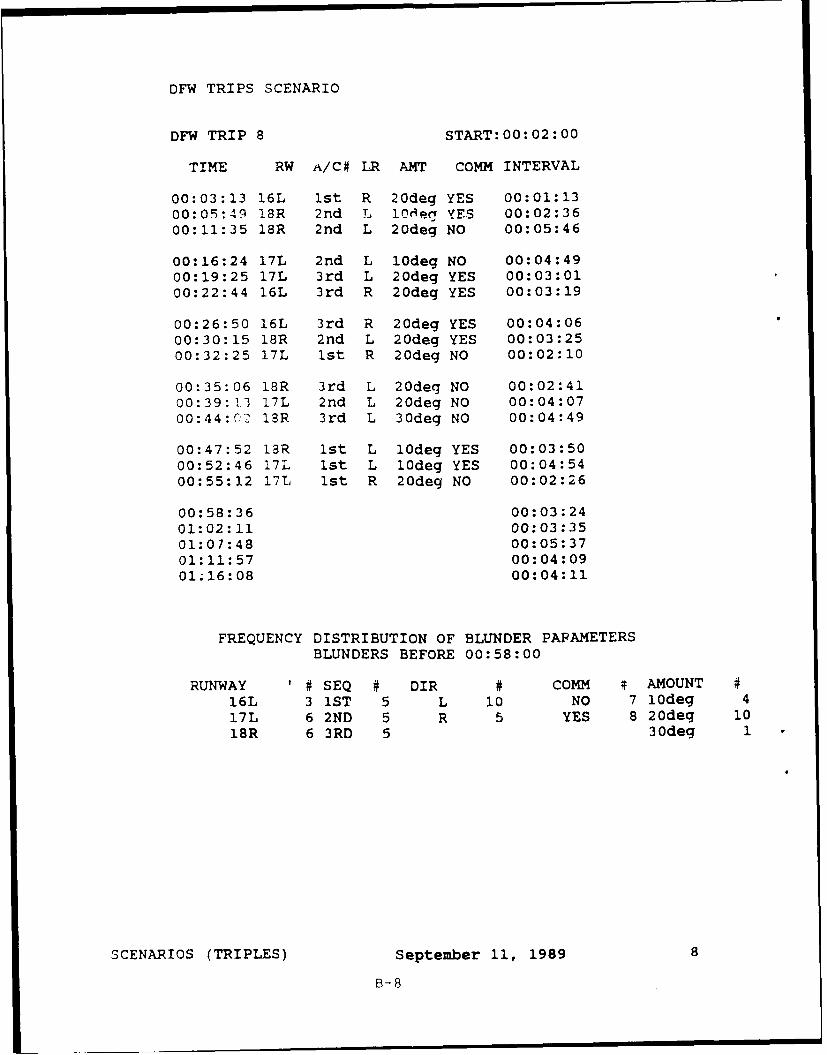
DFW TRIPS SCENARIO
DFW TRIP 8 START:00:02:00
TIME RW A/C# LR AMT COMM INTERVAL
00:03:13 16L 1st R 20deg YES 00:01:1300:05:419 18R 2nd L !0deg YES 00:02:3600:11:35 18R 2nd L 20deg NO 00:05:46
00:16:24 17L 2nd L 10deg NO 00:04:4900:19:25 17L 3rd L 20deg YES 00:03:0100:22:44 16L 3rd R 20deg YES 00:03:19
00:26:50 16L 3rd R 20deg YES 00:04:0600:30:15 18R 2nd L 20deg YES 00:03:2500:32:25 17L 1st R 20deg NO 00:02:10
00:35:06 18R 3rd L 20deg NO 00:02:4100:39:13 17L 2nd L 20deg NO 00:04:0700:44:02 18R 3rd L 30deg NO 00:04:49
00:47:52 13R 1st L 10deg YES 00:03:5000:52:46 17L ist L 10deg YES 00:04:5400:55:12 17L 1st R 20deg NO 00:02:26
00:58:36 00:03:2401:02:11 00:03:3501:07:48 00:05:3701:11:57 00:04:0901;16:08 00:04:11
FREQUENCY DISTRIBUTION OF BLUNDER PAPAMETERSBLUNDERS BEFORE 00:58:00
RUNWAY ' # SEQ # DIR # COMM # AMOUNT #
16L 3 1ST 5 L 10 NO 7 lodeg 417L 6 2ND 5 R 5 YES 8 20deg 1018R 6 3RD 5 30deg 1
SCENARIOS (TRIPLES) September 11, 1989 8
B-8
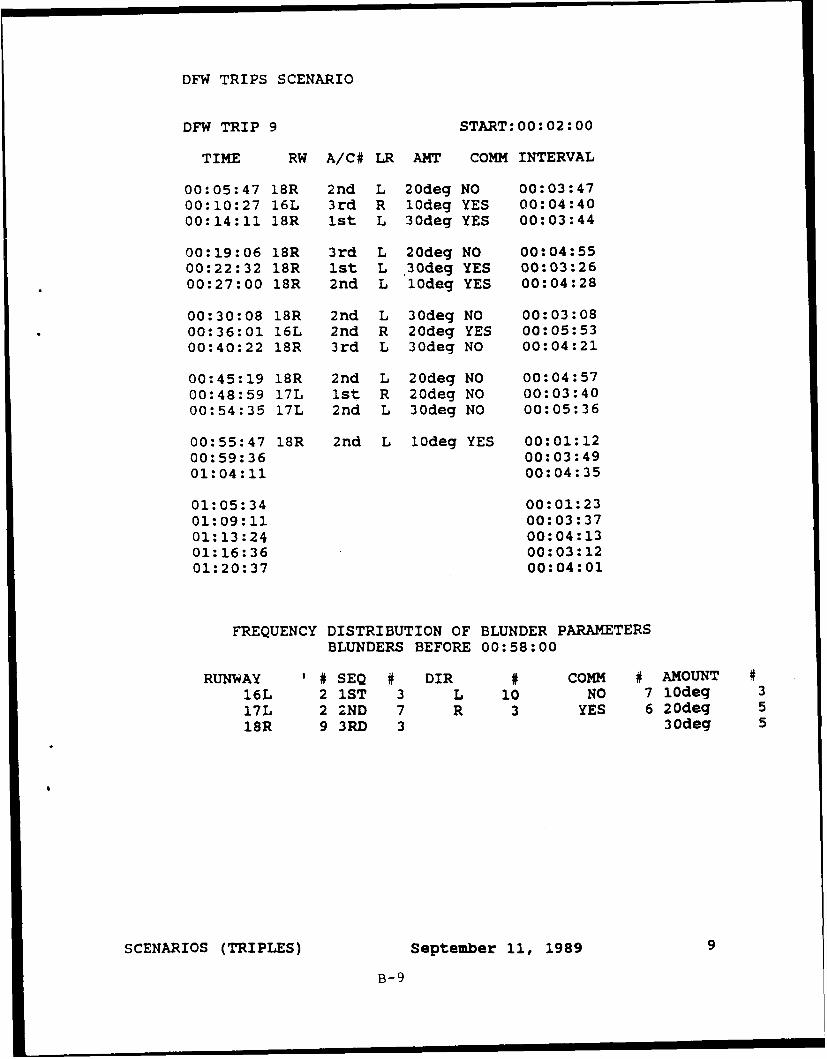
DFW TRIPS SCENARIO
DFW TRIP 9 START:00:02:00
TIME RW A/C# LR AMT COMM INTERVAL
00:05:47 18R 2nd L 20deg NO 00:03:4700:10:27 16L 3rd R 10deg YES 00:04:4000:14:11 18R 1st L 30deg YES 00:03:44
00:19:06 18R 3rd L 20deg NO 00:04:5500:22:32 18R 1st L *30deg YES 00:03:2600:27:00 18R 2nd L 10deg YES 00:04:28
00:30:08 18R 2nd L 30deg NO 00:03:0800:36:01 16L 2nd R 20deg YES 00:05:5300:40:22 18R 3rd L 30deg NO 00:04:21
00:45:19 18R 2nd L 20deg NO 00:04:5700:48:59 17L ist R 20deg NO 00:03:4000:54:35 17L 2nd L 30deg NO 00:05:36
00:55:47 18R 2nd L 10deg YES 00:01:1200:59:36 00:03:4901:04:11 00:04:35
01:05:34 00:01:2301:09:11 00:03:3701:13:24 00:04:1301:16:36 00:03:1201:20:37 00:04:01
FREQUENCY DISTRIBUTION OF BLUNDER PARAMETERSBLUNDERS BEFORE 00:58:00
RUNWAY ' # SEQ # DIR # COMM # AMOUNT #16L 2 IST 3 L 10 NO 7 10deg 317L 2 2ND 7 R 3 YES 6 20deg 518R 9 3RD 3 30deg 5
SCENARIOS (TRIPLES) September 11, 1989 9
B-9
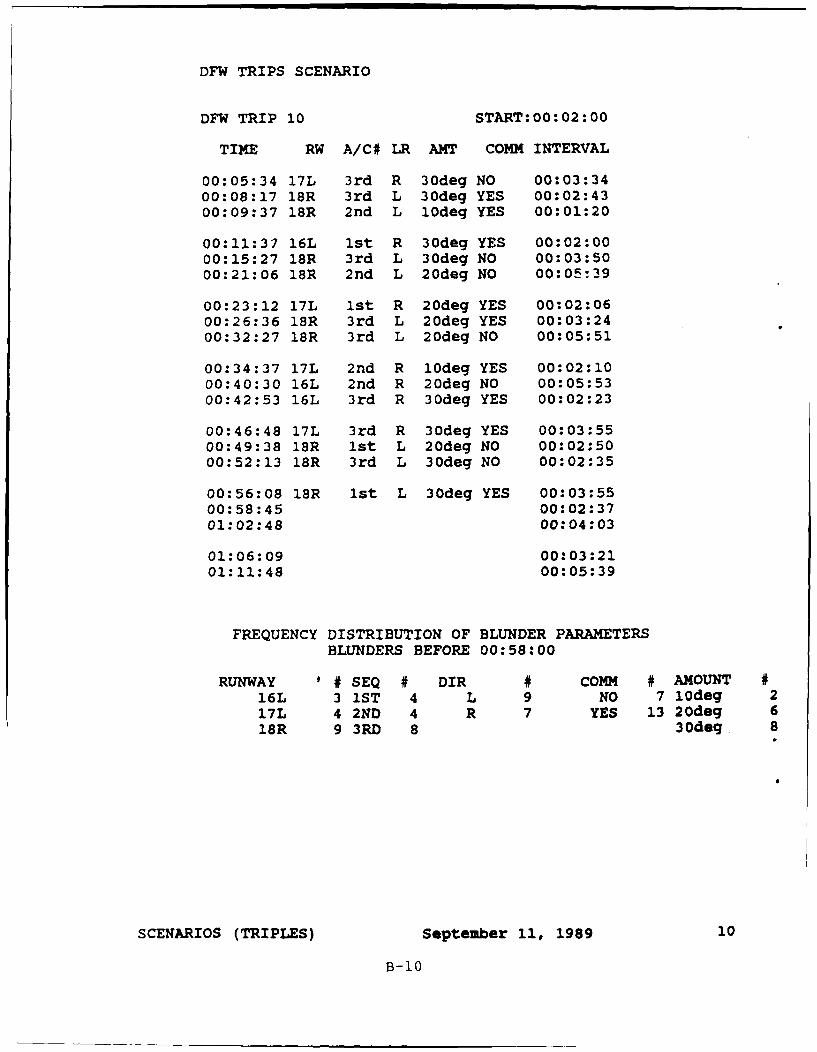
DFW TRIPS SCENARIO
DFW TRIP 10 START:00:02:00
TIME RW A/C# LR AMT COMM INTERVAL
00:05:34 17L 3rd R 30deg NO 00:03:3400:08:17 18R 3rd L 30deg YES 00:02:4300:09:37 18R 2nd L 10deg YES 00:01:20
00:11:37 16L 1st R 30deg YES 00:02:0000:15:27 18R 3rd L 30deg NO 00:03:5000:21:06 18R 2nd L 20deg NO 00:05:39
00:23:12 17L 1st R 20deg YES 00:02:0600:26:36 18R 3rd L 20deg YES 00:03:2400:32:27 18R 3rd L 20deg NO 00:05:51
00:34:37 17L 2nd R 10deg YES 00:02:1000:40:30 16L 2nd R 20deg NO 00:05:5300:42:53 16L 3rd R 30deg YES 00:02:23
00:46:48 17L 3rd R 30deg YES 00:03:5500:49:38 18R 1st L 20deg NO 00:02:5000:52:13 18R 3rd L 30deg NO 00:02:35
00:56:08 18R 1st L 30deg YES 00:03:5500:58:45 00:02:3701:02:48 00:04:03
01:06:09 00:03:2101:11:48 00:05:39
FREQUENCY DISTRIBUTION OF BLUNDER PARAMETERSBLUNDERS BEFORE 00:58:00
RUNWAY # SEQ # DIR # COMM # AMOUNT #16L 3 1ST 4 L 9 NO 7lodeg 217L 4 2ND 4 R 7 YES 13 20deg 618R 9 3RD 8 30deg. 8
SCENARIOS (TRIPLES) September 11, 1989 10
B-10
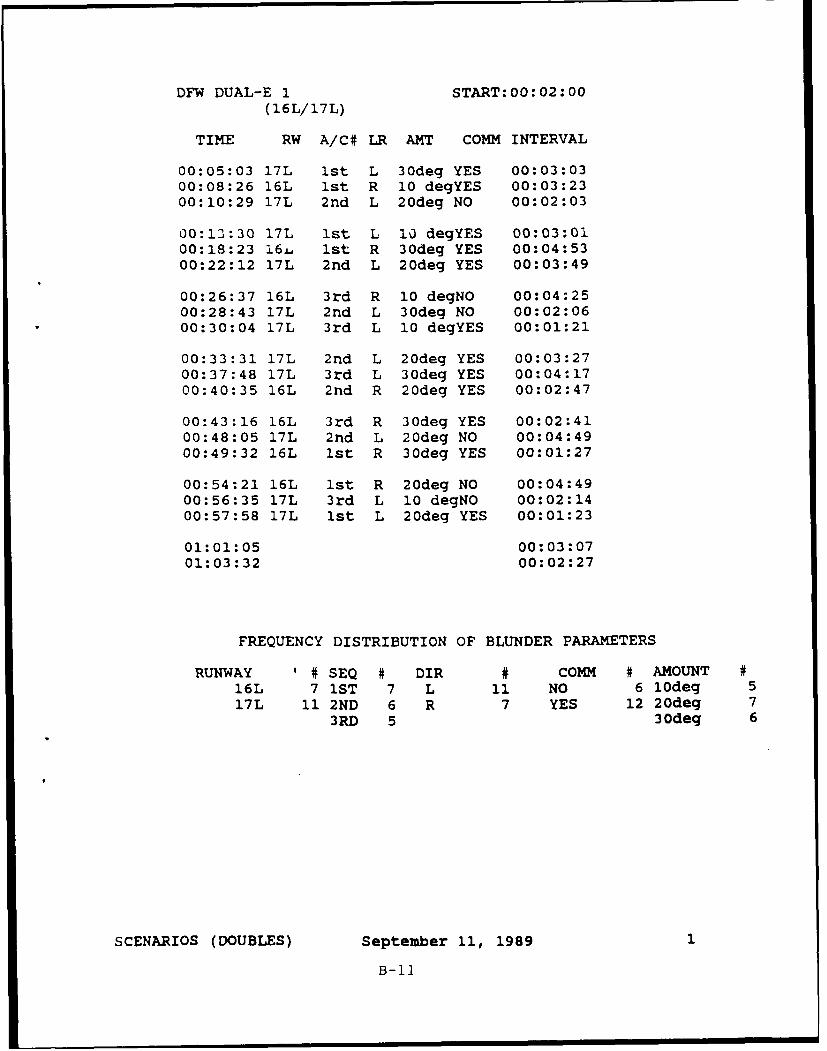
DFW DUAL-E 1 START:00:02:00
(16L/17L)
TIME RW A/C# LR AMT COMM INTERVAL
00:05:03 17L 1st L 30deg YES 00:03:0300:08:26 16L ist R 10 degYES 00:03:2300:10:29 17L 2nd L 20deg NO 00:02:03
00:13:30 17L 1st L 10 degYES 00:03:0100:18:23 16j, 1st R 30deg YES 00:04:5300:22:12 17L 2nd L 20deg YES 00:03:49
00:26:37 16L 3rd R 10 degNO 00:04:2500:28:43 17L 2nd L 30deg NO 00:02:0600:30:04 17L 3rd L 10 degYES 00:01:21
00:33:31 17L 2nd L 20deg YES 00:03:2700:37:48 17L 3rd L 30deg YES 00:04:1700:40:35 16L 2nd R 20deg YES 00:02:47
00:43:16 16L 3rd R 30deg YES 00:02:4100:48:05 17L 2nd L 20deg NO 00:04:4900:49:32 16L 1st R 30deg YES 00:01:27
00:54:21 16L 1st R 20deg NO 00:04:4900:56:35 17L 3rd L 10 degNO 00:02:1400:57:58 17L 1st L 20deg YES 00:01:23
01:01:05 00:03:0701:03:32 00:02:27
FREQUENCY DISTRIBUTION OF BLUNDER PARAMETERS
RUNWAY # SEQ # DIR # COMM # AMOUNT #16L 7 1ST 7 L 11 NO 6 10deg 517L 11 2ND 6 R 7 YES 12 20deg 7
3RD 5 30deg 6
SCENARIOS (DOUBLES) September 11, 1989 1
B-1l
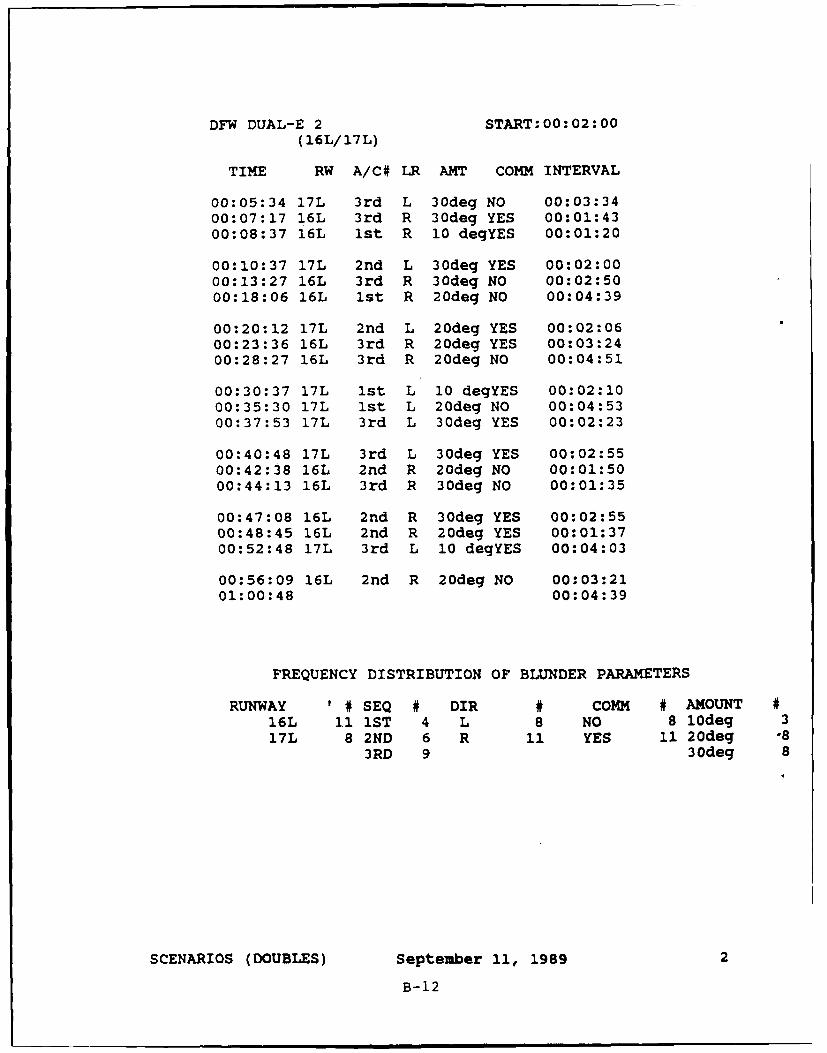
DFW DUAL-E 2 START:00:02:00
(16L/17L)
TIME RW A/C# LR AMT COMM INTERVAL
00:05:34 17L 3rd L Jodeg NO 00:03:3400:07:17 16L 3rd R 30deg YES 00:01:4300:08:37 16L 1st R 10 degYES 00:01:20
00:10:37 17L 2nd L 3Odeg YES 00:02:0000:13:27 16L 3rd R 30deg NO 00:02:5000:18:06 16L 1st R 2odeq NO 00:04:39
00:20:12 17L 2nd L 20deg YES 00:02:0600:23:36 16L 3rd R 2odeg YES 00:03:2400:28:27 16L 3rd R 2odeg NO 00:04:51
00:30:37 17L 1st L 10 degYES 00:02:1000:35:30 17L 1st L 2odeg NO 00:04:5300:37:53 17L 3rd L 3odeg YES 00:02:23
00:40:48 17L 3rd L 3odeg YES 00:02:5500:42:38 16L 2nd R 2odeg NO 00:01:5000:44:13 16L 3rd R 3odeg No 00:01:35
00:47:08 16L 2nd R 30deg YES 00:02:5500:48:45 16L 2nd R 2odeg YES 00:01:3700:52:48 17L 3rd L 10 degYES 00:04:03
00:56:09 16L 2nd R 2odeg No 00:03:2101:00:48 00:04:39
FREQUENCY DISTRIBUTION OF BLUNDER PARAMETERS
RUNWAY '#SEQ # DIR # COMM # AM4OUNT #16L 11 ST 4 L 8 NO 8 l0deg 317L 8 2ND 6 R 11 YES 11 2Odeg .8
3RD 9 30deg 8
SCENARIOS (DOUBLES) September 11, 1989 2
B- 12
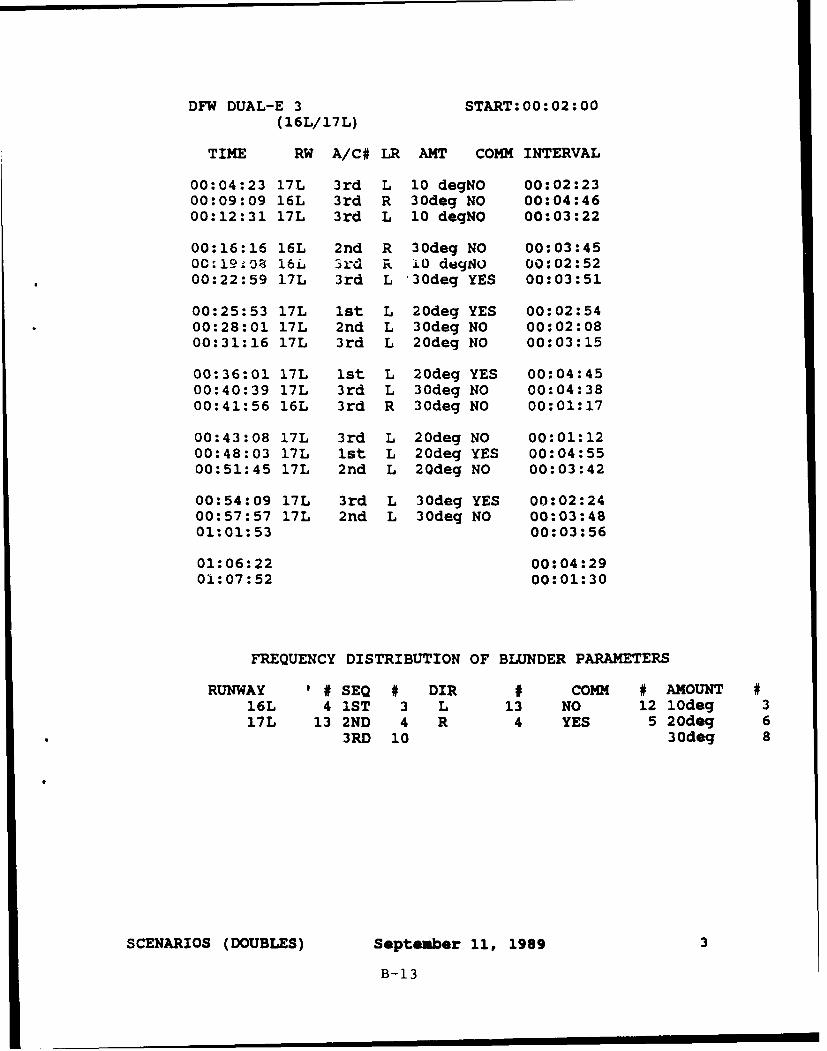
DFW DUAL-E 3 START:00:02:00
(16L/17L)
TIME RW A/C# LR AMT COMM INTERVAL
00:04:23 17L 3rd L 10 degNO 00:02:2300:09:09 16L 3rd R 30deg NO 00:04:4600:12:31 17L 3rd L 10 degNO 00:03:22
00:16:16 16L 2nd R 30deg NO 00:03:4500:19.08 16L 3rd R .0 dogNo 00:02:5200:22:59 17L 3rd L "30deg YES 00:03:51
00:25:53 17L 1st L 20deg YES 00:02:5400:28:01 17L 2nd L 30deg NO 00:02:0800:31:16 17L 3rd L 20deg NO 00:03:15
00:36:01 17L Ist L 20deg YES 00:04:4500:40:39 17L 3rd L 30deg NO 00:04:3800:41:56 16L 3rd R 30deg NO 00:01:17
00:43:08 17L 3rd L 20deg NO 00:01:1200:48:03 17L 1st L 20deg YES 00:04:5500:51:45 17L 2nd L 20deg NO 00:03:42
00:54:09 17L 3rd L 30deg YES 00:02:2400:57:57 17L 2nd L 30deg NO 00:03:4801:01:53 00:03:56
01:06:22 00:04:2901:07:52 00:01:30
FREQUENCY DISTRIBUTION OF BLUNDER PARAMETERS
RUNWAY '# SEQ # DIR # COMM # AMOUNT #16L 4 1ST 3 L 13 NO 12 lodeg 317L 13 2ND 4 R 4 YES 5 20deg 6
3RD 10 30deg 8
SCENARIOS (DOUBLES) September 11, 1989 3
B-13
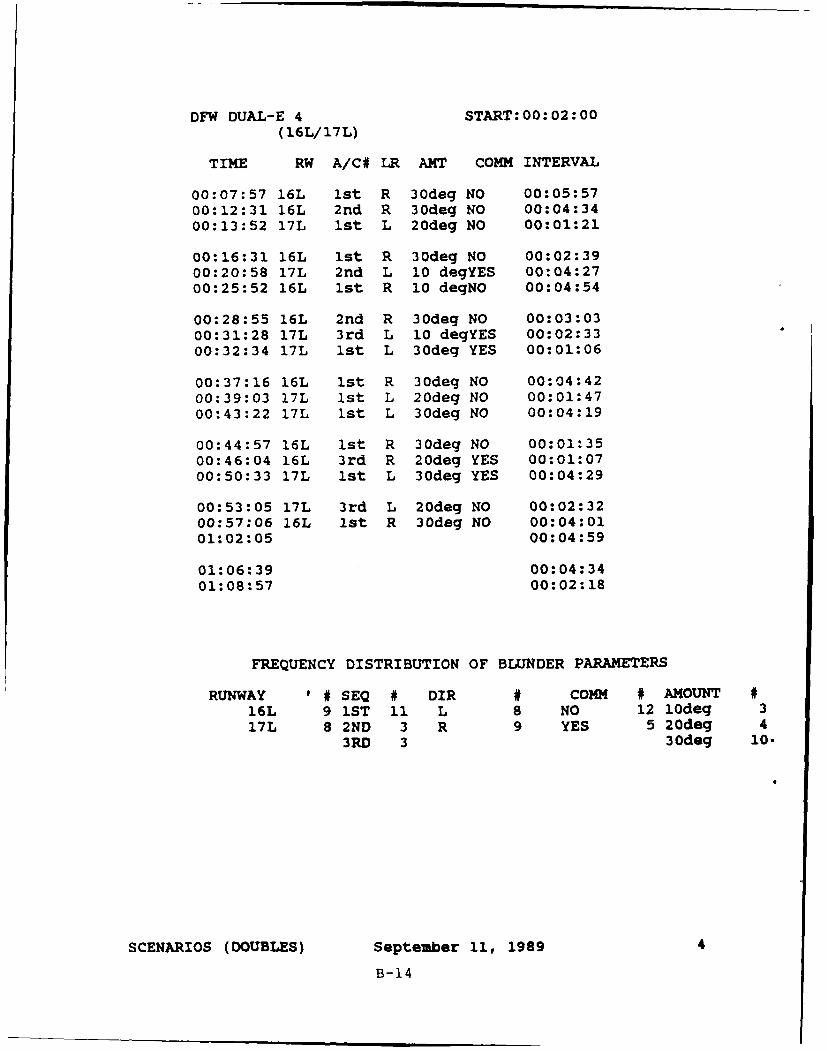
DFW DUAL-E 4 START:00:02:00
(16L/17L)
TIME RW A/C# LR AMT COMM INTERVAL
00:07:57 16L 1st R 30deg NO 00:05:5700:12:31 16L 2nd R 30deg NO 00:04:3400:13:52 17L 1st L 20deg NO 00:01:21
00:16:31 16L 1st R 30deg NO 00:02:3900:20:58 17L 2nd L 10 degYES 00:04:2700:25:52 16L ist R 10 degNO 00:04:54
00:28:55 16L 2nd R 30deg NO 00:03:0300:31:28 17L 3rd L 10 degYES 00:02:3300:32:34 17L 1st L 30deg YES 00:01:06
00:37:16 16L 1st R 30deg NO 00:04:4200:39:03 17L 1st L 20deg NO 00:01:4700:43:22 17L 1st L 30deg NO 00:04:19
00:44:57 16L 1st R 30deg NO 00:01:3500:46:04 16L 3rd R 20deg YES 00:01:0700:50:33 17L 1st L 30deg YES 00:04:29
00:53:05 17L 3rd L 20deg NO 00:02:3200:57:06 16L ist R 30deg NO 00:04:0101:02:05 00:04:59
01:06:39 00:04:3401:08:57 00:02:18
FREQUENCY DISTRIBUTION OF BLUNDER PARAMETERS
RUNWAY # SEQ # DIR # COMM # AMOUNT #16L 9 1ST 11 L 8 NO12 lodeg 317L 8 2ND 3 R 9 YES 5 20deg 4
3RD 3 30deg 10.
SCENARIOS (DOUBLES) September 11, 1989 4
B-14
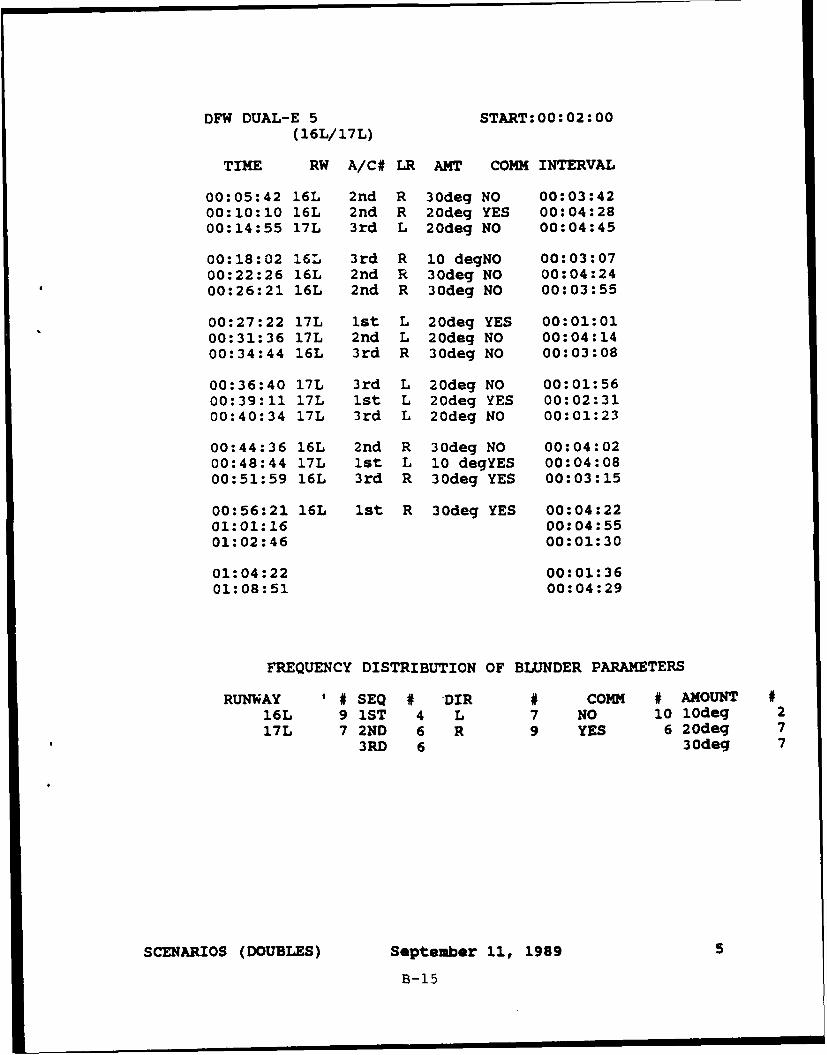
DFW DUAL-E 5 START:00:02:00
(16L/17L)
TIME RW A/C# LR ANT COMM INTERVAL
00:05:42 16L 2nd R 30deg NO 00:03:4200:10:10 16L 2nd R 20deg YES 00:04:2800:14:55 17L 3rd L 20deg NO 00:04:45
00:18:02 16L 3rd R 10 degNO 00:03:0700:22:26 16L 2nd R 30deg NO 00:04:2400:26:21 16L 2nd R 30deg NO 00:03:55
00:27:22 17L 1st L 20deg YES 00:01:0100:31:36 17L 2nd L 20deg NO 00:04:1400:34:44 16L 3rd R 30deg NO 00:03:08
00:36:40 17L 3rd L 20deg NO 00:01:5600:39:11 17L 1st L 20deg YES 00:02:3100:40:34 17L 3rd L 20deg NO 00:01:23
00:44:36 16L 2nd R 30deg NO 00:04:0200:48:44 17L 1st L 10 degYES 00:04:0800:51:59 16L 3rd R 30deg YES 00:03:15
00:56:21 16L 1st R 30deg YES 00:04:2201:01:16 00:04:5501:02:46 00:01:30
01:04:22 00:01:3601:08:51 00:04:29
FREQUENCY DISTRIBUTION OF BLUNDER PARAMETERS
RUNWAY '# SEQ # -DIR # COMM # AMOUNT #16L 9 1ST 4 L 7 NO lo lodeg 217L 7 2ND 6 R 9 YES 6 20deg 7
*3RD 6 30deg 7
SCENARIOS (DOUBLES) September 11, 1989 5
B-15
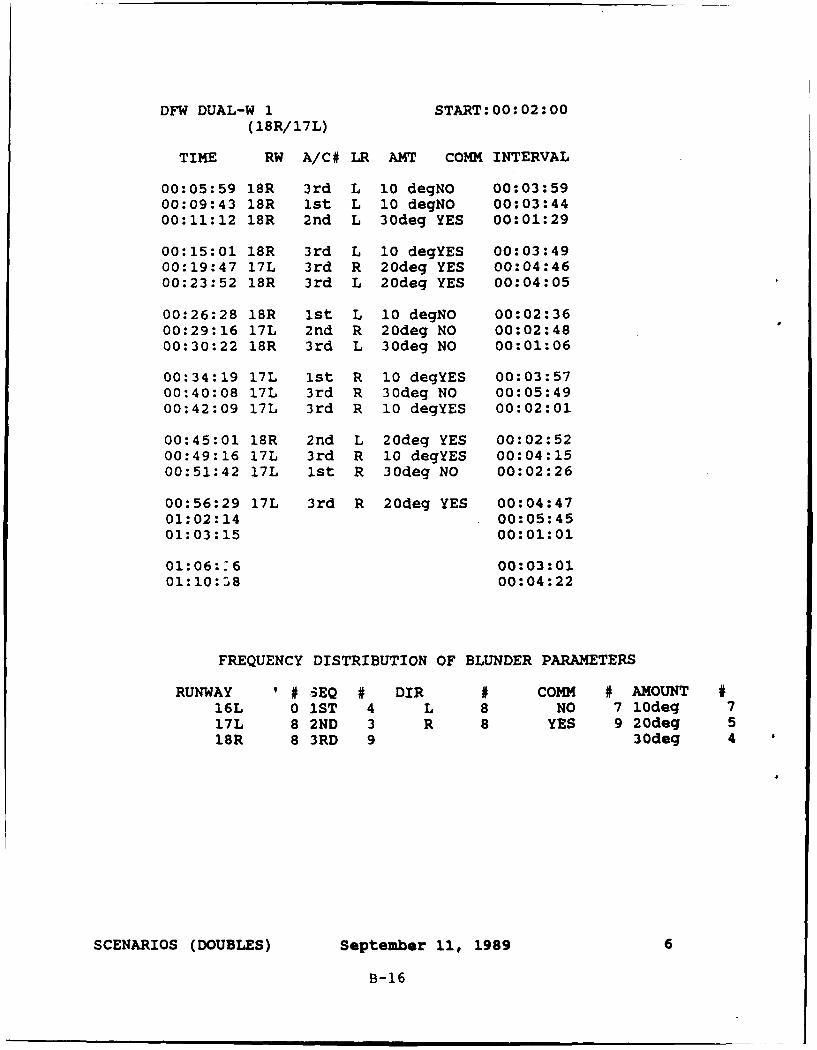
DFW DUAL-W 1 START:00:02:00
(18R/17L)
TIME RW A/C# LR AMT COMM INTERVAL
00:05:59 18R 3rd L 10 degNO 00:03:5900:09:43 18R 1st L 10 degNO 00:03:4400:11:12 18R 2nd L 30deg YES 00:01:29
00:15:01 18R 3rd L 10 degYES 00:03:4900:19:47 17L 3rd R 20deg YES 00:04:4600:23:52 18R 3rd L 20deg YES 00:04:05
00:26:28 18R 1st L 10 degNO 00:02:3600:29:16 17L 2nd R 20deg NO 00:02:4800:30:22 18R 3rd L 30deg NO 00:01:06
00:34:19 17L ist R 10 degYES 00:03:5700:40:08 17L 3rd R 30deg NO 00:05:4900:42:09 17L 3rd R 10 degYES 00:02:01
00:45:01 18R 2nd L 20deg YES 00:02:5200:49:16 17L 3rd R 10 degYES 00:04:1500:51:42 17L 1st R 30deg NO 00:02:26
00:56:29 17L 3rd R 20deg YES 00:04:4701:02:14 00:05:4501:03:15 00:01:01
01:06::6 00:03:0101:10:58 00:04:22
FREQUENCY DISTRIBUTION OF BLUNDER PARAMETERS
RUNWAY '# EQ # DIR # COMM # AMOUNT #16L 0 1ST 4 L 8 NO 7 10deg 717L 8 2ND 3 R 8 YES 9 20deg 518R 8 3RD 9 30deg 4
SCENARIOS (DOUBLES) September 11, 1989 6
B-16
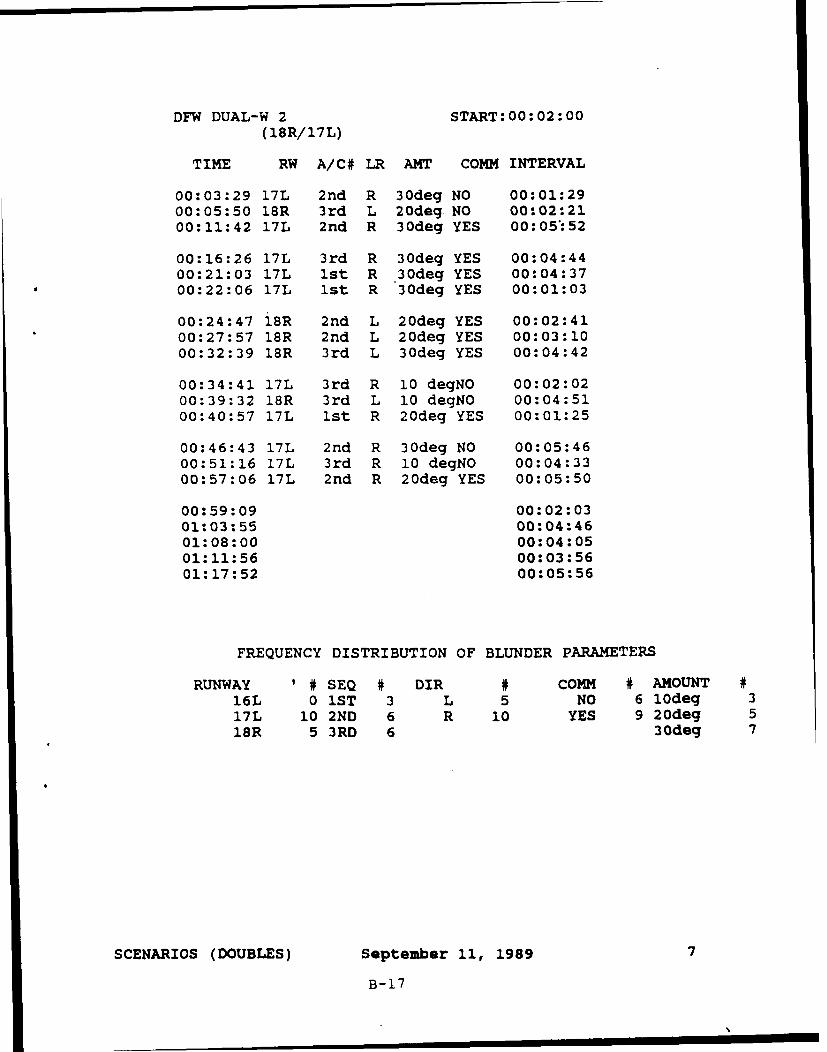
DFW DUAL-W 2 START:00:02:00
(18R/17L)
TIME RW A/C# LR AMT COMM INTERVAL
00:03:29 17L 2nd R 30deg NO 00:01:2900:05:50 18R 3rd L 20deg NO 00:02:2100:11:42 17L 2nd R 30deg YES 00:05'52
00:16:26 17L 3rd R 30deg YES 00:04:4400:21:03 17L 1st R 30deg YES 00:04:3700:22:06 17L 1st R 30deg YES 00:01:03
00:24:47 i8R 2nd L 20deg YES 00:02:4100:27:57 18R 2nd L 20deg YES 00:03:1000:32:39 18R 3rd L 30deg YES 00:04:42
00:34:41 17L 3rd R 10 degNO 00:02:0200:39:32 18R 3rd L 10 degNO 00:04:5100:40:57 17L 1st R 20deg YES 00:01:25
00:46:43 17L 2nd R 30deg NO 00:05:4600:51:16 17L 3rd R 10 degNO 00:04:3300:57:06 17L 2nd R 20deg YES 00:05:50
00:59:09 00:02:0301:03:55 00:04:4601:08:00 00:04:0501:11:56 00:03:5601:17:52 00:05:56
FREQUENCY DISTRIBUTION OF BLUNDER PARAMETERS
RUNWAY '# SEQ # DIR # COMM # AMOUNT #16L 0 1ST 3 L 5 NO 6 10deg 317L 10 2ND 6 R 10 YES 9 20deg 518R 5 3RD 6 30deg 7
SCENARIOS (DOUBLES) September 11, 1989 7
B-17
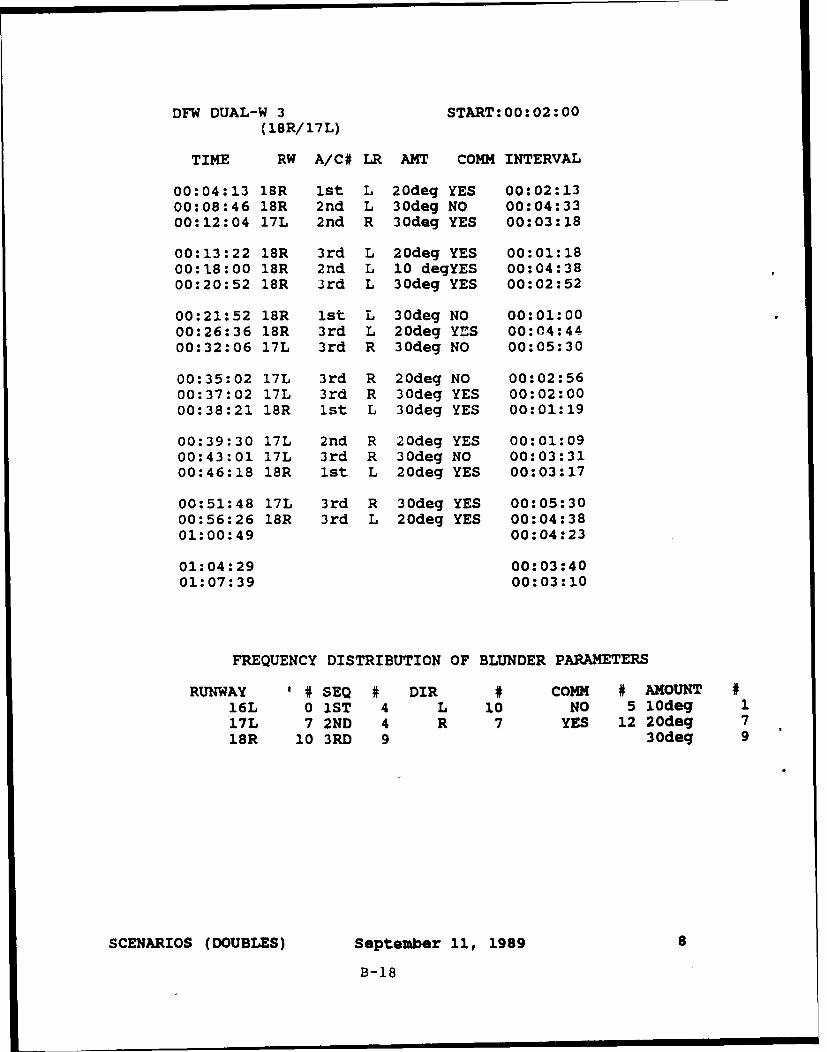
DFW DUAL-W 3 START:00:02:00
(18R/17L)
TIME RW A/C# LR AMT COMM INTERVAL
00:04:13 18R 1st L 20deg YES 00:02:1300:08:46 18R 2nd L 30deg NO 00:04:3300:12:04 17L 2nd R 30deg YES 00:03:18
00:13:22 18R 3rd L 20deg YES 00:01:1800:18:00 18R 2nd L 10 degYES 00:04:3800:20:52 18R 3rd L 30deg YES 00:02:52
00:21:52 18R 1st L 30deg NO 00:01:0000:26:36 18R 3rd L 20deg YES 00:04:4400:32:06 17L 3rd R 30deg NO 00:05:30
00:35:02 17L 3rd R 20deg NO 00:02:5600:37:02 17L 3rd R 30deg YES 00:02:0000:38:21 18R 1st L 30deg YES 00:01:19
00:39:30 17L 2nd R 20deg YES 00:01:0900:43:01 17L 3rd R 30deg NO 00:03:3100:46:18 18R 1st L 20deg YES 00:03:17
00:51:48 17L 3rd R 30deg YES 00:05:3000:56:26 18R 3rd L 20deg YES 00:04:3801:00:49 00:04:23
01:04:29 00:03:4001:07:39 00:03:10
FREQUENCY DISTRIBUTION OF BLUNDER PARAMETERS
RUNWAY '# SEQ # DIR # COMM #5 AMOUNT #16L 0 1ST 4 L 10 NO 510deg 117L 7 2ND 4 R 7 YES 12 20deg 718R 10 3RD 9 30deg 9
SCENARIOS (DOUBLES) September 11, 1989 8
B-18
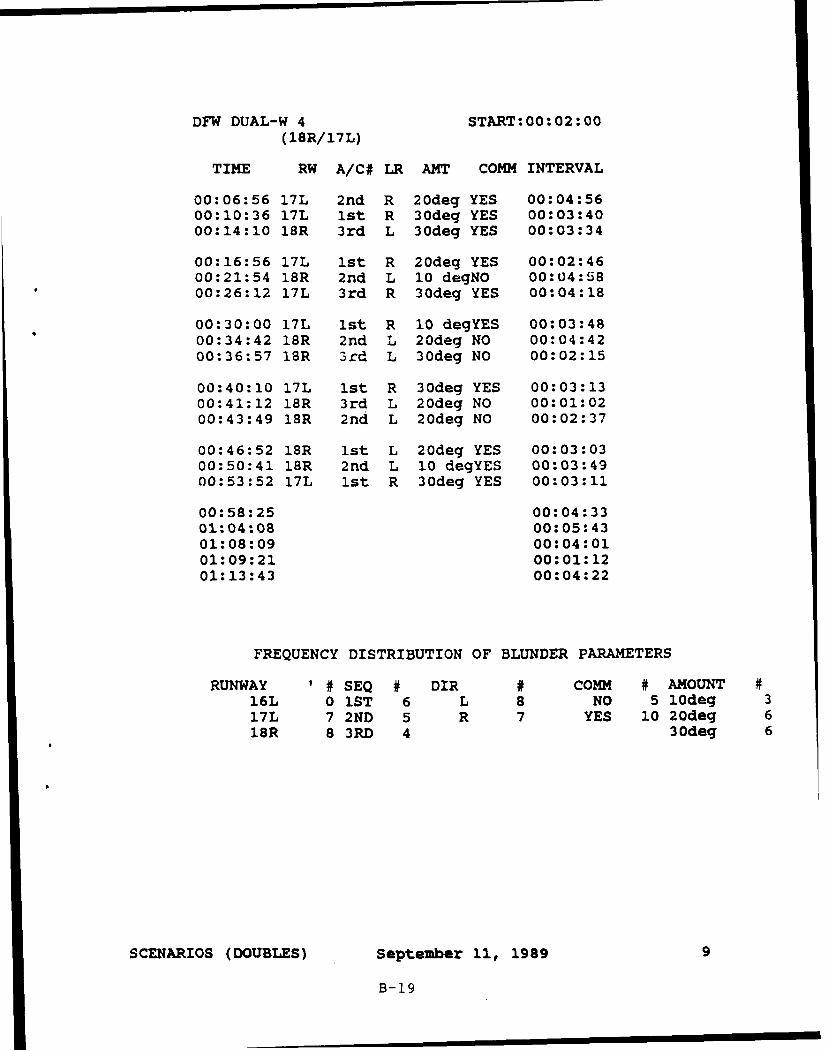
DFW DUAL-W 4 START:00:02:00
(18R/17L)
TIME RW A/C# LR AMT COMM INTERVAL
00:06:56 17L 2nd R 20deg YES 00:04:5600:10:36 17L 1st R 30deg YES 00:03:4000:14:10 18R 3rd L 30deg YES 00:03:34
00:16:56 17L Ist R 20deg YES 00:02:4600:21:54 18R 2nd L 10 degNO 00:04:5800:26:12 17L 3rd R 30deg YES 00:04:18
00:30:00 17L 1st R 10 degYES 00:03:4800:34:42 18R 2nd L 20deg NO 00:04:4200:36:57 18R 3rd L 30deg NO 00:02:15
00:40:10 17L 1st R 30deg YES 00:03:1300:41:12 18R 3rd L 20deg NO 00:01:0200:43:49 18R 2nd L 20deg NO 00:02:37
00:46:52 18R 1st L 20deg YES 00:03:0300:50:41 18R 2nd L 10 degYES 00:03:4900:53:52 17L 1st R 30deg YES 00:03:11
00:58:25 00:04:3301:04:08 00:05:4301:08:09 00:04:0101:09:21 00:01:1201:13:43 00:04:22
FREQUENCY DISTRIBUTION OF BLUNDER PARAMETERS
RUNWAY '# SEQ # DIR # COMM # AMOUNT #16L 0 1ST 6 L 8 NO 5 10deg 317L 7 2ND 5 R 7 YES 10 20deg 618R 8 3RD 4 30deg 6
SCENARIOS (DOUBLES) September 11, 1989 9
B-19
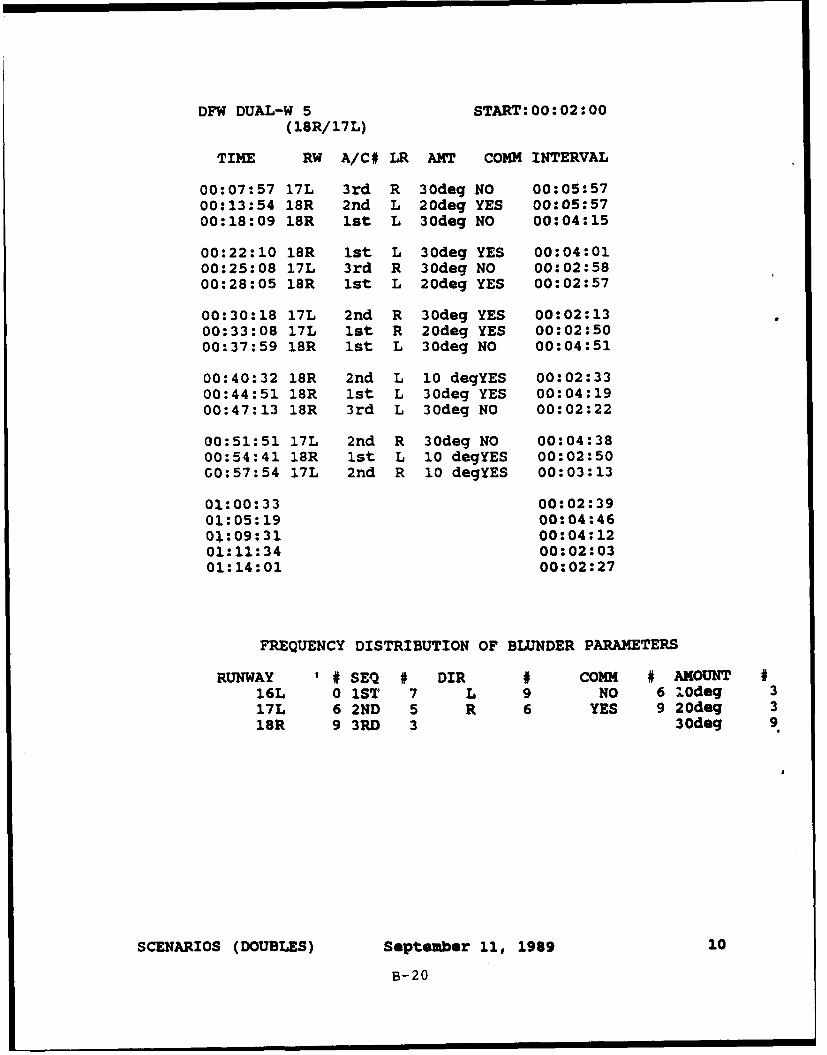
DFW DUAL-W 5 START:00:02:00
(18R/17L)
TIME RW A/C# LR AMT COMM INTERVAL
00:07:57 17L 3rd R 30deg NO 00:05:5700:13:54 18R 2nd L 20deg YES 00:05:5700:18:09 18R 1st L 30deg NO 00:04:15
00:22:10 18R 1st L 30deg YES 00:04:0100:25:08 17L 3rd R 30deg NO 00:02:5800:28:05 18R 1st L 20deg YES 00:02:57
00:30:18 17L 2nd R 30deg YES 00:02:1300:33:08 17L 1st R 20deg YES 00:02:5000:37:59 18R 1st L 30deg NO 00:04:51
00:40:32 18R 2nd L 10 degYES 00:02:3300:44:51 18R 1st L 30deg YES 00:04:1900:47:13 18R 3rd L 30deg NO 00:02:22
00:51:51 17L 2nd R 30deg NO 00:04:3800:54:41 18R 1st L 10 degYES 00:02:50G0:57:54 17L 2nd R 10 degYES 00:03:13
01:00:33 00:02:3901:05:19 00:04:4601:09:31 00:04:1201:11:34 00:02:0301:14:01 00:02:27
FREQUENCY DISTRIBUTION OF BLUNDER PARAMETERS
RUNWAY '# SEQ # DIR # COMM # AMOUNT #16L 0 1ST 7 L 9 NO 6 Odeg 317L 6 2ND 5 R 6 YES 9 20deg 318R 9 3RD 3 30deg 9
SCENARIOS (DOUBLES) September 11, 1989 10
B-20
APPENDIX C
CONTROLLER QUESTIONNAIRE AND MODIFIED COOPER-HARPER SCALE
RATING SCALE INSTRUCTIONS
After each of the following sessions, you will give a ratingon a Modified Cooper-Harper Scale for workload. This ratingscale and important definitions for using the scale are givenbelow. Before you begin, we will review:
1. The definition of the terms used in thescale,
2. The steps you should follow in making your
rating on the scale, and
3. How you should think of the ratings.
If you have any questions, as we review these points, please ask.
Important Definitions
To understand and use the Modified Cooper-Harper Scaleproperly, it is important that you understand the terms used onthe scale and how they apply in this simulation.
First, "instructed task" is the ATC control task y will bedoing in this simulation. It includes monitoring the aircraftalong the localizer, maintaining the required separationdistances, and doing all the duties associated with this task.
Second, the "operator" Is yQ.. Because the scale can beused in different situations, the person the rating Is theoperator. You will be operating the system and then using therating scale to quantify your experience.
Third, the "system" is the complete group of equipment youwill be using in doing the instructed task. For the presentsimulation, the system is the D/FW runways, localizers, and airtraffic patterns. (Differences between the ATC suite simulator,its instruments, controls and radar displays, and the ATC suitein DFW are not a factor in the assessment of the system. Anydifficulties arising due to differences between the simulationsuite and DFW should be noted on the controller questionnaire.)The systems being compared in this simulation are the twoparallel runway system and the three parallel runway system.
Fourth, "errors" Include any of the following: loss ofseparation, near misses, and similar occurrences. In otherwords, errors are any appreciable deviation from the desired"operator/system" performance.
Finally, "mental workload" is the integrated mental effortrequired to perform the instructed task. It includes such
C-i
factors a s level o-f attention, depth )f thinking, and level Co fcon2entration required by the instructed task.
Rating Scale Steps
On the Modified Cooper-Harper Scale you will notice thatthere is a series of decisions which follow a predeterminedlogical sequence. This logical sequence is designed to help youmake more consistent and accurate ratings. Thus, you shouldfollow the logic sequence on the scale for each of your ratingsin the simulations.
The steps which you will follow in using the rating scalelogic are as follows:
1. First you will decide if the instructed taskcan be accomplished all of the time. If the3n-wer is no, move to the right and circle10.
2. Second, you will decide if adequateperfor nce is attainable. Adequateperfoi ,nce means that the errors are smalland inconsequential in controlling the airtraffic. If they are not, then there aremajor deficiencies in the system and youshould proceed to the right. By reading thedescriptions associated with numbers 7, 8,and 9, you should be able to select the onethat best describes the situation you haveexperienced. You should then circle the mostappropriate number.
3. If adequate performance is attainable yournext decision is whether your mental workloadfor the instructed task is acceptable. If itis not acceptable, you should select a ratingof 4, 5, or 6. One of these ratings shoulddescribe the situation you have experienced.You should circle the most appropriatenumber.
4. If mental workload is acceptable, you shouldthen move to one of the top threedescriptions on the scale. You should readand carefully select the rating 1, 2, or 3based on the situation you have experienced.
R you are to circle only one number, and you shouldfollow the logic of the scale. You should always begin at thelower left and follow the logic path to decide on a rating. In
C-2
particular, do not skip any steps. Otherwise, your rating maynot be valid and reliable.
How You Should Think of the Rating.
Before you begin rating, there are several points that needto be emphasized.
First, be sure to try to perform the instructed task asinstructed and make all your evaluations within the context ofthe instructed task. Try to maintain adequate performance asspecified for your task.
Second, the rating scale is not a test of your personalskill. On all of your ratings, you will be evaluating the systemfor the general user population, not yourself. You should makethe assumption that problems encountered are not problems youcreated. They are problems created by the system and theinstructed task. In other words, don't blame yourself if thesystem is deficient, blame the system.
Third, try to avoid the problem of nit picking an especiallygood system, or saying that a system which is difficult to use isnot difficult to use at all. Also, try not to overreact todifferences between the simulated system and the actual system.Thus, to avoid any problems, just always try to "tell it like itis" in making your ratings.
If you have any questions, please ask the supervisor at thistime
C-3
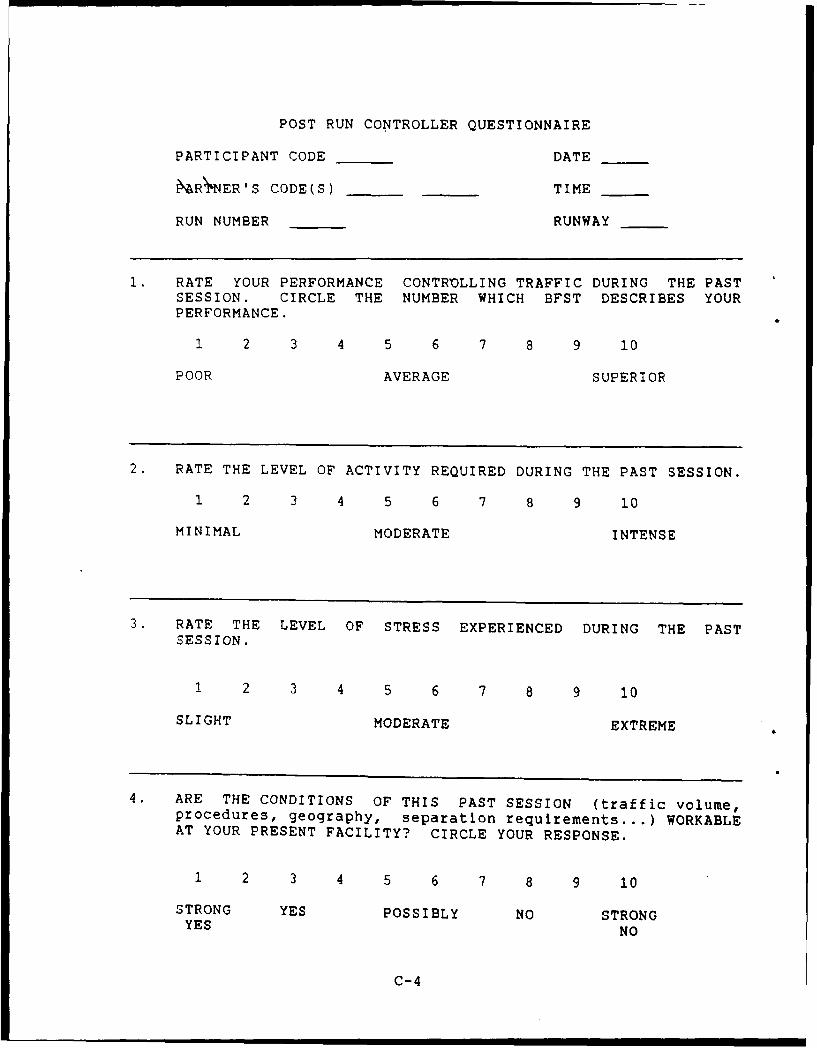
POST RUN CONTROLLER QUESTIONNAIRE
PARTICIPANT CODE DATE
4RIER'S CODE(S) TIME
RUN NUMBER RUNWAY
1. RATE YOUR PERFORMANCE CONTROLLING TRAFFIC DURING THE PASTSESSION. CIRCLE THE NUMBER WHICH BFST DESCRIBES YOURPERFORMANCE.
1 2 3 4 5 6 7 8 9 10
POOR AVERAGE SUPERIOR
2. RATE THE LEVEL OF ACTIVITY REQUIRED DURING THE PAST SESSION.
1 2 3 4 5 6 7 8 9 10
MINIMAL MODERATE INTENSE
3. RATE THE LEVEL OF STRESS EXPERIENCED DURING THE PASTSESSION.
1 2 3 4 5 6 7 8 9 10
SLIGHT MODERATE EXTREME
4. ARE THE CONDITIONS OF THIS PAST SESSION (traffic volume,procedures, geography, separation requirements...) WORKABLEAT YOUR PRESENT FACILITY? CIRCLE YOUR RESPONSE.
1 2 3 4 5 6 7 8 9 10
STRONG YES POSSIBLY NO STRONGYES NO
C-4
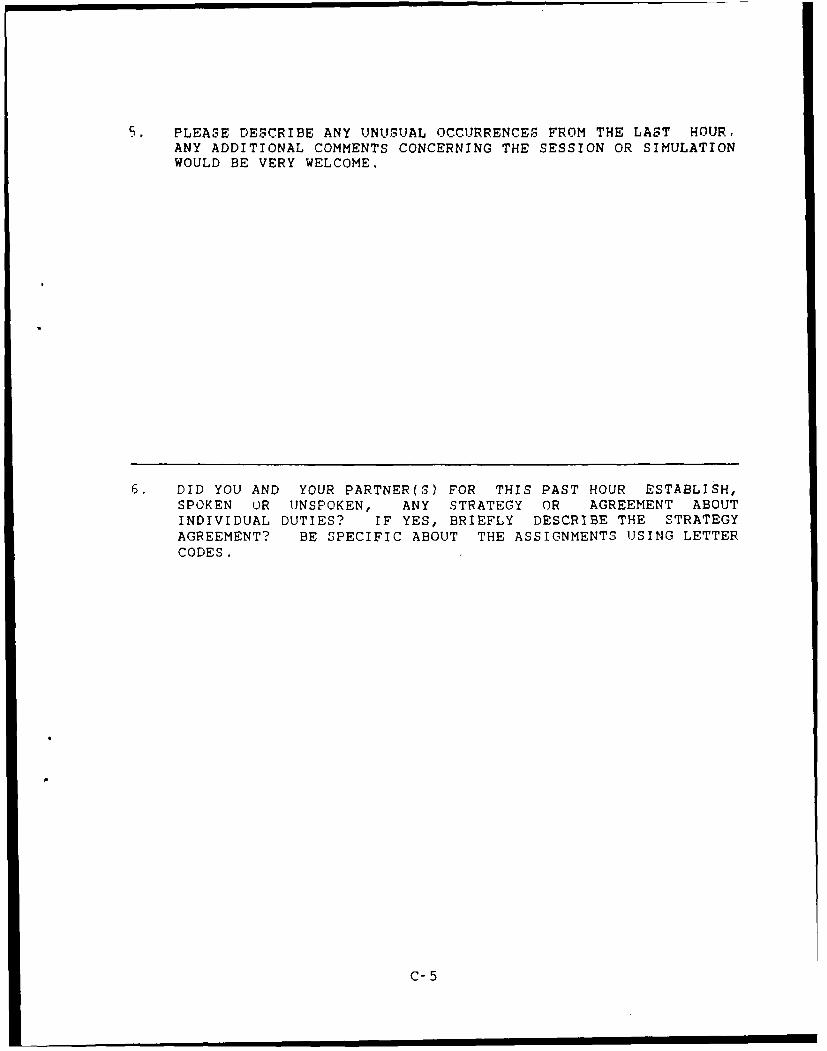
S. PLEASE DESCRIBE ANY UNUSUAL OCCURRENCES FROM THE LAST HOUR.ANY ADDITIONAL COMMENTS CONCERNING THE SESSION OR SIMULATIONWOULD BE VERY WELCOME.
6. DID YOU AND YOUR PARTNER(S) FOR THIS PAST HOUR ESTABLISH,SPOKEN OR UNSPOKEN, ANY STRATEGY OR AGREEMENT ABOUTINDIVIDUAL DUTIES? IF YES, BRIEFLY DESCRIBE THE STRATEGYAGREEMENT? BE SPECIFIC ABOUT THE ASSIGNMENTS USING LETTERCODES.
C-5
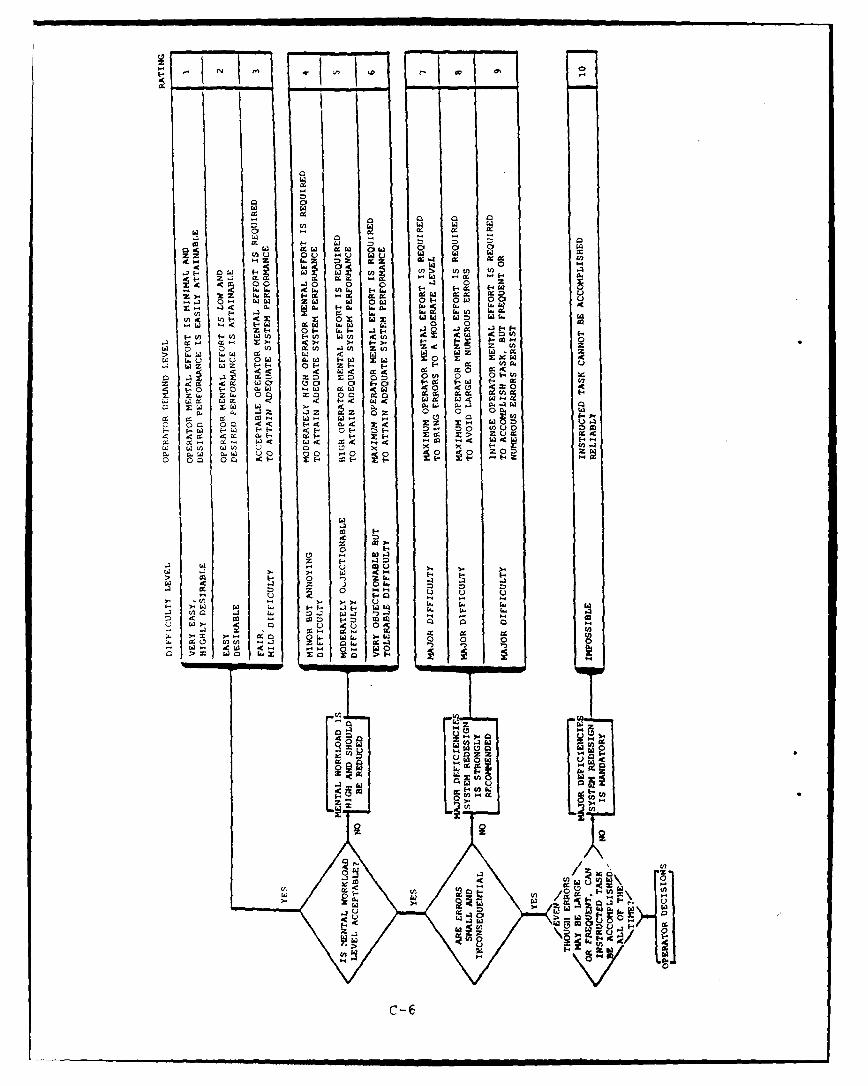
go =
- 0 00u 0 4.'
L. . 0
2z w f, g 0 01.
4 00 .3 0 u 0 2 4 0 6. z
a - I.. W w 0w ot w 0
41- 4 C6 16 1- 0. L.A.
00( 0 0 01- w . .- j. 4 . 1.H
cr- xz x2 2S 0 41.2 Z12 woc01rW 0> L. - u 0. 1.w -0 .0wL. 1- - a E 2 1z I-.2 1.1
. W 4 I-.2 2 w.. z r 0 0 :c
L . 1 0 V) 00 0.U Zcn V42)Z
1. 1 -C L.0 %I 0 0-, 610 (.1. w.. w 1f2 a: 2 47t-0 Z -0 Q,1 01 Z1 x 1- 0
M~0 L. 01w0-o Itv
.gL 00 zl 0 o~ C', La 1 ~cc 0 cc 0 601. 1.4 ).2
0~g -0 w- I . .~ 0~
0. W a. - 2 u .~ 2z 0 0 00 0 zon0 00 44 14 04 4 2 -
2 ~ ~ ~ L 04- 04.30~X X - ~ ll.
44 u
0 U1-
w~ ~~ -3 - a1
1-~ 0041 - 1
190
7
Ic m - ).
2 ~ ~ 1- o 0
0 M -
0 3
L 4K 0a
CZ-6
APPENDIX D
INDUSTRY OBSERVER QUESTIONNAIRE
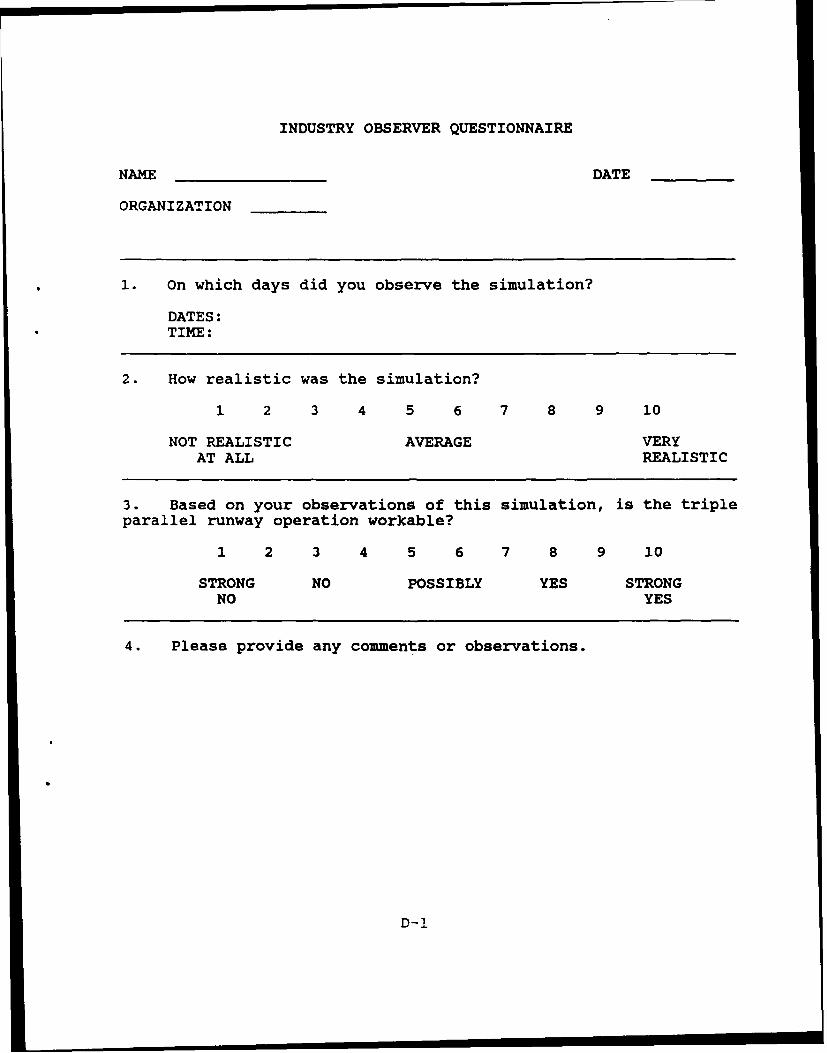
INDUSTRY OBSERVER QUESTIONNAIRE
NAME DATE
ORGANIZATION
1. On which days did you observe the simulation?
DATES:TIME:
2. How realistic was the simulation?
1 2 3 4 5 6 7 8 9 10
NOT REALISTIC AVERAGE VERYAT ALL REALISTIC
3. Based on your observations of this simulation, is the tripleparallel runway operation workable?
1 2 3 4 5 6 7 8 9 10
STRONG NO POSSIBLY YES STRONGNO YES
4. Please provide any comments or observations.
D-1

APPENDIX E
DATA ANALYSIS COMPUTER FILES
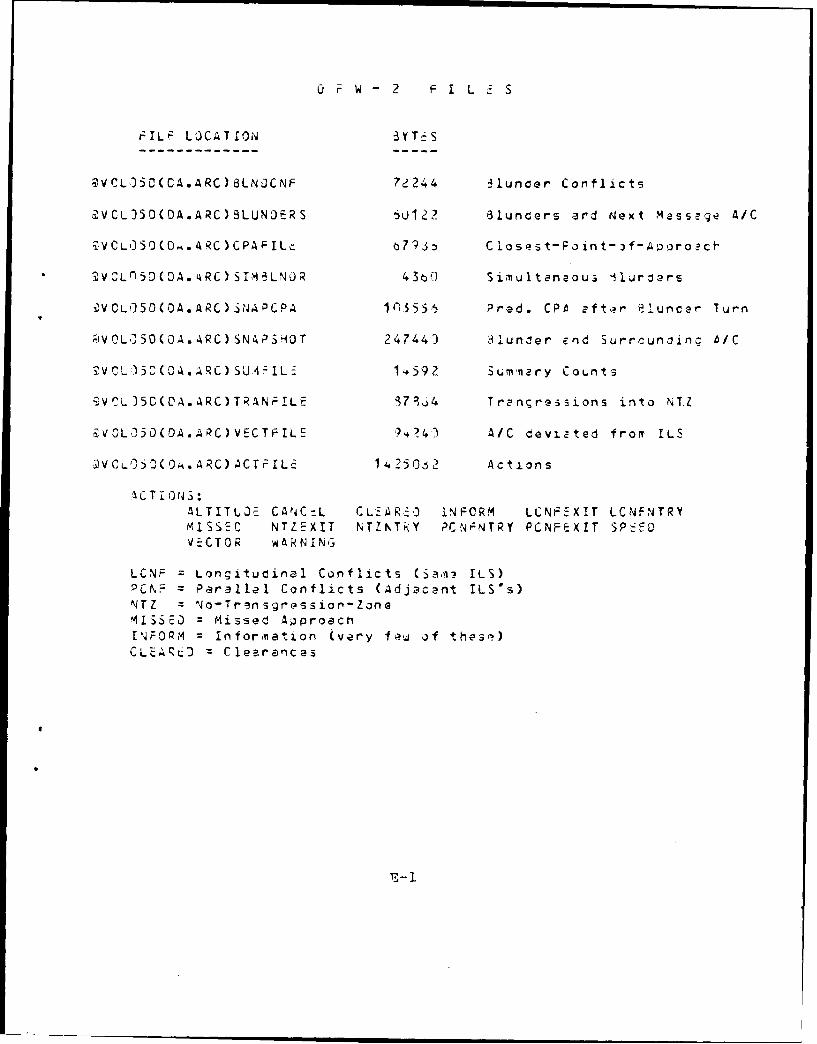
0 F W-2 F IL S
FILF LOCATION 3 Y T -S
@VCL,350(CA.ARC)8LNJCNF 72244 iluncer Conflicts
, VCL)SO(DA.ARC)3LUN!JERS 622 81uncers ard N4ext Massege A/C
VCL35J(..ARCCPAFILc 7?: Clospst-Point-z~f-Aporoect-
D .r5 . R SMiN 4 3 e)) Simnultaneous 11iradrs
i VOL05D(OA.ARC)SNAPCPA 4-15t, Pred. CPA 2ft,4r 9-1uncar Turn
@VCL,"5D(OA.ARC)SN4PSH.Tr 24744) Iunder End Surrcunjinc A/C
3VOL15C(GA.ARC)SUAzIL-- 1-4592 Su.mmary Counts
@V-L.)5C(OA.ARC)TRANF1LE W7%4 Trenqreisions into NT.Z
£9'L05DCOA.ARC)VECTFILPE9+4 A/C deviated fromr ILS
.JV i'(O~AC .0tFL - ~~ Actions
.A CT I ONS :ALTITtJ':E CANC:L CLEjiRZO INFCRM LCNF.=XIT LCNFNTRYml1ssEc NTLEXIT NTZNTk<Y ?CNF-NTRY PCNFEXIT SP'EOV ELC T 0R A RN 1N G
LCNF =Longituoinal Conflicts (Sam? ILS)PCN =Pa~rallel Conflicts (Adjacant ILS's)
NrZ = o-Trinsgr,-ssior-Zone'13SED Missed ApoproachINFOPM =Informai~ton (very f Pw of thasq)CLEAqcD Clearances
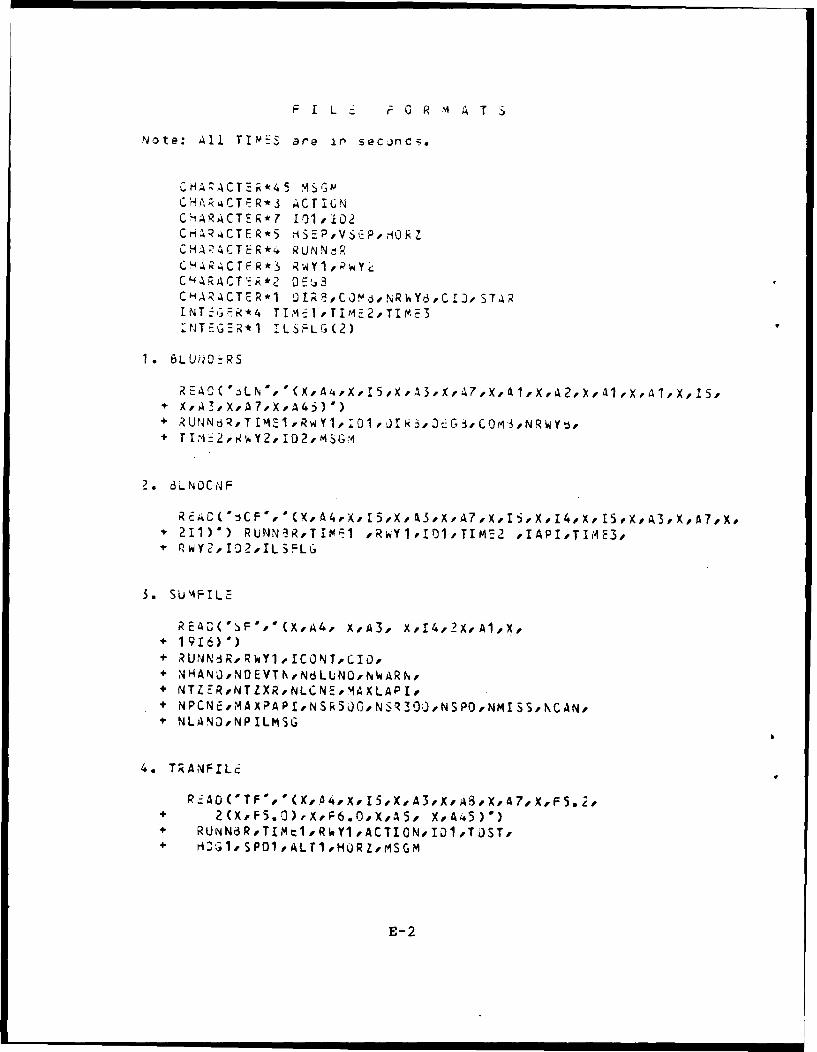
Note: All1 Tlm?-S are Ir secjnc ;.
HAI^ACT%*4 5 MSGMCH'I;CT ER*3 ACT ICNC 44RACTE9*7 10)1 f !0CrHAR.CTER*5 H-45P,'~tP, rVJRZCHA'CTER*4 RUNNtRC4AR4CTER*3 Rw~Y1.,PwYLCL.43.ACT%*2 DE13CHARCTER*1 01R~ ,COThjNRY'3C 13e STAR
:NT=GzR*1 TLSFLG (2)
1. 6LUNO:_RS
4XiA3,-X.A7oXfA43) ')+. RUN4N&~,T1ME1 1PRWY1,:D1 ko-.G3,O~,~w+ T 174 2 R'AY2 o 10 2 oM5G M
. NDCN'F
R C( ijCF', CX, A4,X, I5,X, A3pX'A7,X.I,o X,I4,X, IS,XA3,XA?,.X,'211)') RUNN3RTIM;71 rRwY1,101,TIM--2 ,IAPI.-TIME3.-
QWPY2.,I02o1L3FLc,
3. SUMFILE
" 1916) )" RUNN'3R, RWY1eICONTPCIJ," NHAN~),NO VT h ,NdLUNOtNWAR f1
". NTZERNTZXRNLCNEP14XLAP I." NPCN~,MAXAP1,NSk5JGNSq3.O;J,NSPQNMI SSP-NCAN,-4. NLANJ,'NPILMSG
4. T ANFIL6
R.-AO('TF','(K,.44,X,15,X,A3,XA3,X,4A7,X,F5.2,,+ 2(X,F5.0),X,F6.O.-X,A5., XPA5)')". RUNR,T1Mt1,RkY1 ,ACTIOND1,T)ST,,
" lGl, SPOl ,ALT1 PHORZ,MSGM
E- 2
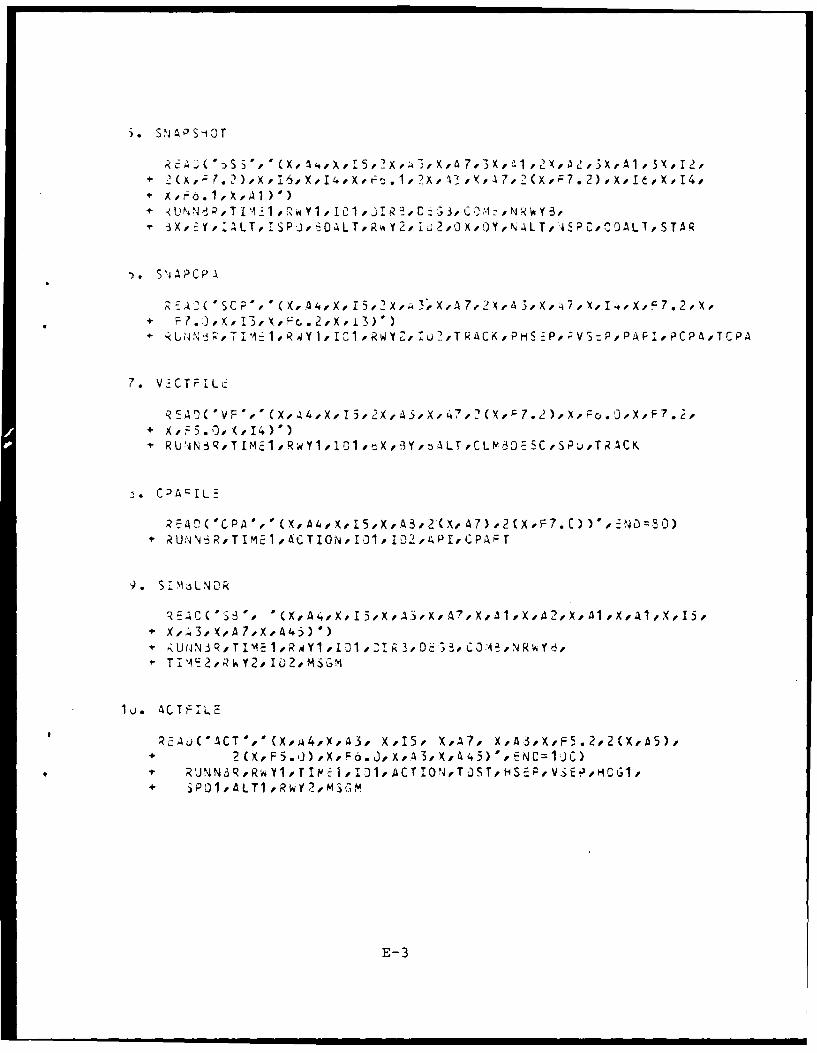
5. SN4PS-iOT
+ ( , . ,X, 115. X,14,X, . I, ?x -X, A, , 7.-2 (X, 7.2),X I, ,X,1I4,
U N N ,T 11I I, RW Y 1, I1 , l R CDE 3, C ; ,NkW IRY ,
X, Y ALT, T SP J, OALT, Rvv Y 2, i' 2 ,0 X,0Y,NLT, SP C,ZDALT, S TR
*. S'iAPCPA
+ F7. 1,X,I3, XFc,. 2,,3" )
7. V:CTF:Lr
SE A0'VF X 14,X,15, ZX,A3,X, , 47 (X, 7.2 ),X, o. ),X,F. 2,+ X , ; 5.0", 1I )')I'R U'N,3R , T I Ma1 , R WYI1, 1 G1 , 6X ,-1Y , ALTC L MA D ; SCS P LiT R AC K
.C:'A'ILE
_Z- C( 'CFP ' (X, A4,X,15,X,-3,2(X, A7) 2(X-F7.C) )',:ND SRU'N R,TIME ,1 4CTIOIN, I01, 12,04PI, CPA; T
R E, ( -S36 " . 4, q X , 1 5, X*, 3,, 7, X , 4I,1 , , , I X I × -5,
T UNN q,T T IME 1 , RA11 l, 3,0, C34 , kiYd,
I. 4CTFILE
2E (°AT',(X,4,XA3,X,15, X, 7, X,A3,X,FS.2,2(X,A5),
+ 2 (X,F5..J),X, Fo.J,X, 43,X,A .5)', NC=IJC)t RUNNa3,R 1, TIP : I, ID1, ACT 101,T JST, HSE-, ViEP,HCG1,+ SP1,ALTl,RWUY2,Mi',M
E-3
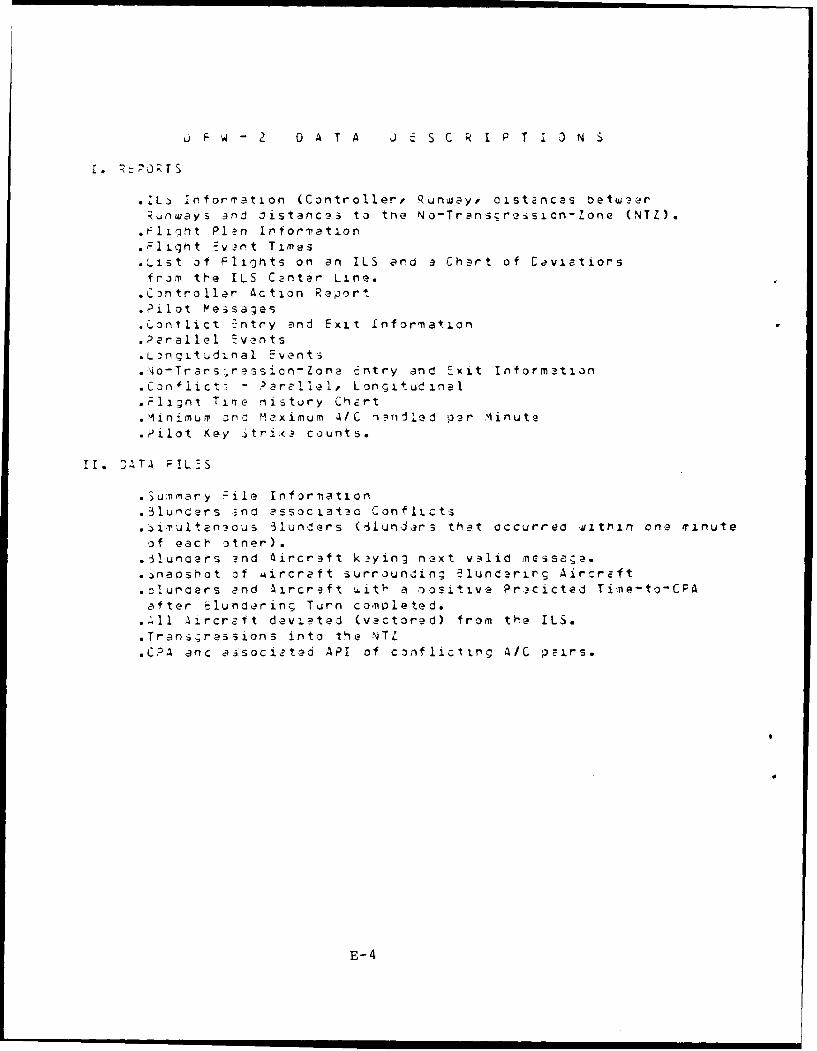
F W OAT A J "S C kI P T 10N
1. :ZPrO TS
.IL,) inform~ation (Controllerf Runway.. cistancei tbetw ?rRunways 3nd distarnc9 t3 tne No-Transcreisicn-Zon (NTZ).. :1ijht Plan I'foci'ation.Flight Evarnt Timeas.1 ist of Fligjhts on an ILS ard a Chart of Caviatiorstrijm the ILS Canter Line..C3ntroller Action Report.Pilot M~essages. -onflict 7:ntry a-nd Exit Informiation*?arallel :vants.Lcngitudlflal Evants.;4o-Tr-ars-,ressicn-Zone c'ntry and Exit Information.Conflict-- - ?arellel, Longitudinal*Flgnt TiT -iistury C-hzrt
.,Minimum' an- Maximum LI/C -ari1Ied par M~inutea
.Pilot Key -itT-:k. count!5.
Ir. CAT.A FIL -S
.Sumary :-ile Information
.31urnders End associata:o Conflicts
.3-jmultarvious ilundors ('ilundiars; that occurred within one minute,of each catner)..3lunaers ?nd aircraft kaying next val4id incis-se..onaoshot of Aircraft surrounding elundarirg AircrEft.e-lunaars and Aircraft uwith, a *oosli~ve Pr.3cicted Ti~rie-to-CFAafter -lundoril. Turn completed... 1 aircraft daviated (vactored) from the ILS..Transrasrsions; into the NTZ.CPA anc a~sociatad API of conflicting A/C pa=irs.
E- 4
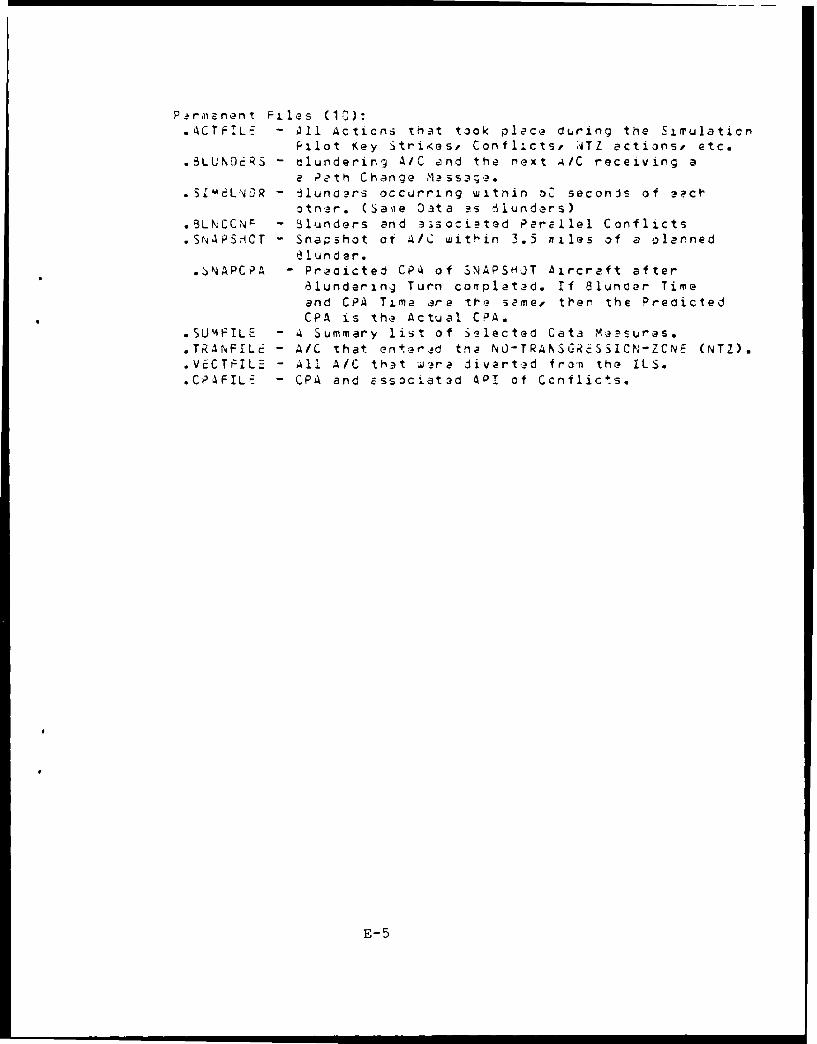
Pzrm ,nent Files (10l):.ACTFILE - All Actions triat took place during the Simrulationi
Pilot Key Stri~es, Confl.cts,. 'JTZ 2ctions, etc..BLUNk.. a ~nein / nd the next A/C receiving a
a ?eth Change ~as~e.51A4LNCR - lunoars occurring witrnin oZ seconis of aecfh
otnar. (Saiie Data 3s -lunders).BLNCCNF - R-lunders and associeted Parailel Conflicts.SNAPSHCT - Snapshot of A/C wit 'ir 3.5 ailes of a plarned
a 1u nd aer..')NAPCPA -Preaicteo CP4 of S3NAPSHO~T Aircraft after
81underxng Turn compietad. If 81unoer Tim~eand CPA Time are thel sae~, then the Precicted
* CPA is the Actual CPA..SU4FILE -A Summary list of oe1lected Cat~a Me-a:suras..TRANFILC' - A/C -that enterv-d tne NO)-TRANSGRC*S5ICN-ZCNE- (NTZ)..VC-CTFIL:- - All A/C thit -w-;ra divert-ad from the ILS..CPAFIL;- - CPA and zssociated API of Ccnflicts.
E-5
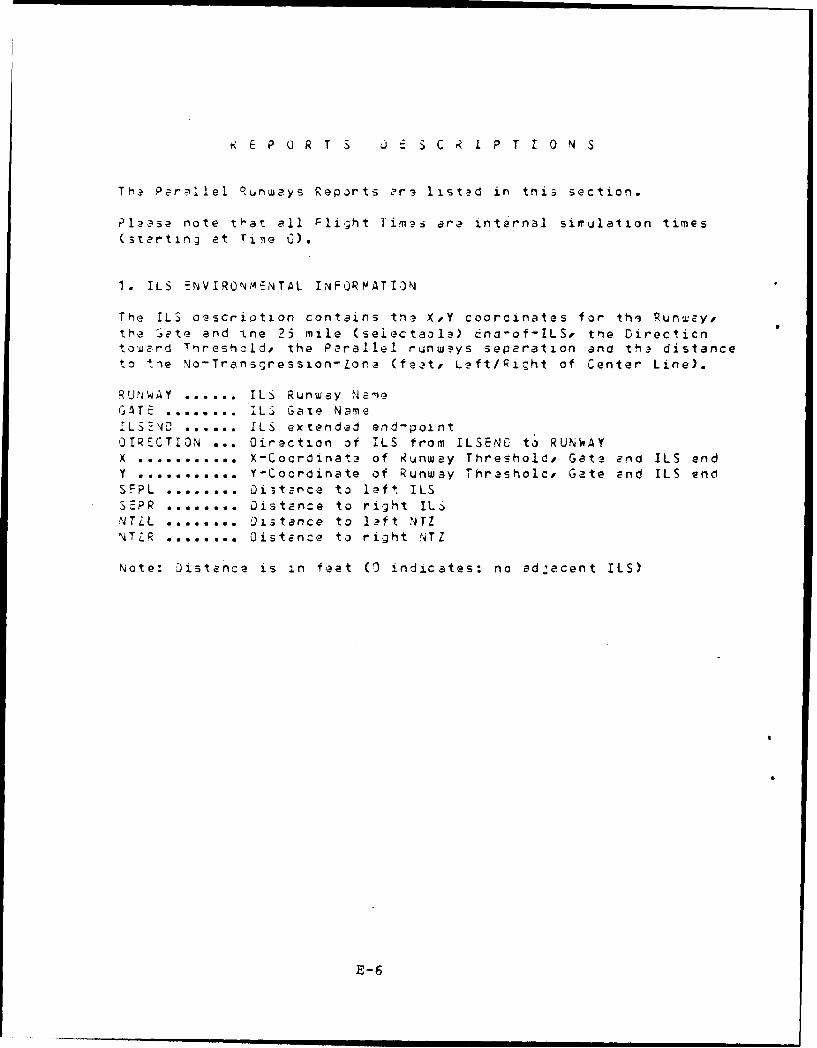
R E P 0 R T S j E S C k I P T 1 0 N S
T 1 Parnllel Runways Reports Pr? listad in this section.
Plaase note that all Flight fimi are internal simulation times
(starting at Ting C).
1. ILS ENVIRON';NTAL INFORMATION
The ILS oscription contains th. XY coordinates for thi Runwzy,the Sate and ine 25 mile (seiectaola) cna-of-ILS, tpie Oirecticnto.zrd Threshcld, the Parallel runways seperation ana th3 distanceto tie No-Transgression-Zone (feet, Left/Right of Center Line).
RUriWA Y ...... ILS Runway NaneGATE ........ ILZ Gate Name
!LS -D ...... ILS extended end-point
OIRECTION ... Oirection of ILS from ILSENC to RUNWAYX ..... X-Cocrdinata of Runway Threshold, Gate end ILS endY ........... Y-Cocrdinate of Runway Thrasholc, Gate end ItS endSEPL ........ Oistence to !eft ILSSEPR .... a... Distance to right ILSNTZL ........ Distance to l ft NTZNTZR ........ Oistznce to right NTZ
Note: 3istanca is in feet (9 indicates: no ad_,acent ILS)
E-6
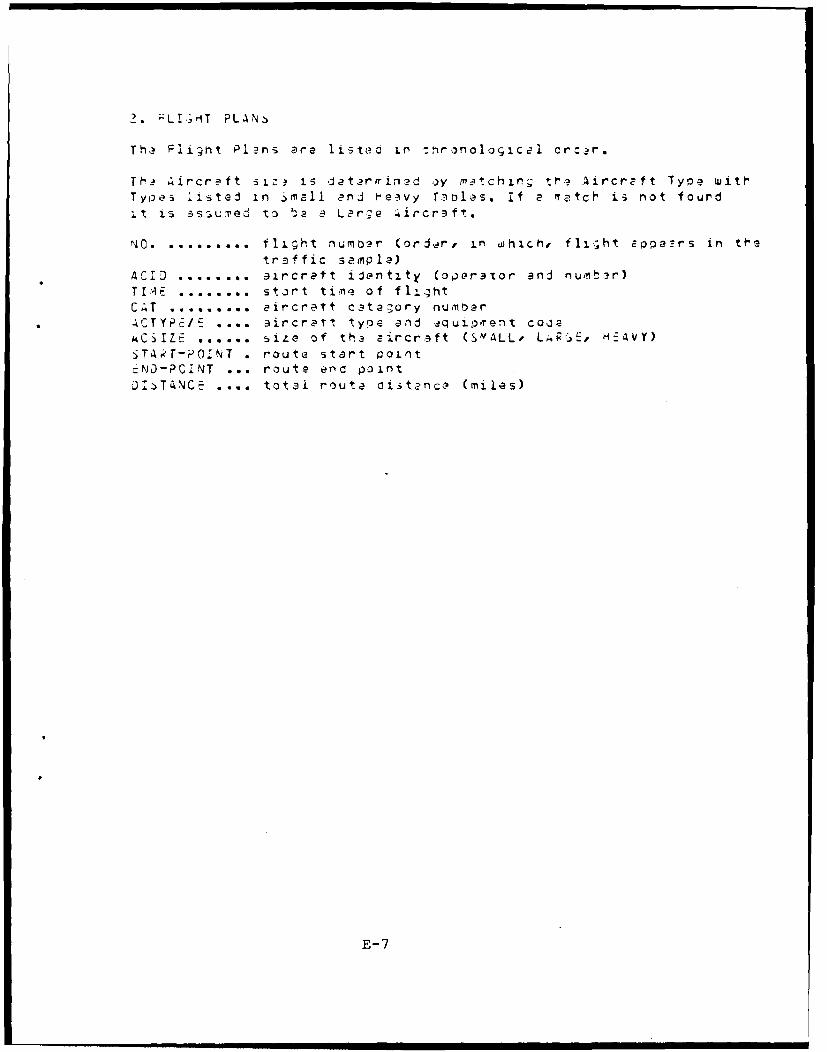
2 . !LI3HT PL 4NS
Tha Flight Pl ns are IiSteO Li :.ironological crd.r.
Th 4ircr F ft s iz s at.rrined oy match ni tt'? .ircrzft Ty!e wittT yoe5 *isted in ,mall end meevy P oIs. If e ietch i 5 not fourd
;.t is as ured to ta e Lar;e -ircr~ft.
NO. ......... fl1ght numbe2r (order, in which, fli;ht 21pe-rs in t-traffic samipla)
ACID ........ aircraft identity (operator and numter)
TI1.E ...... . start timq of fIU htCAT ......... eircratt category numbarACTYPE/_ .... aircratt type and equipTent coda
MCSIZE ...... size of the aircraft (SMALL, L E, H-AVY)
STAT-POINT . route start pointNJ-PCiNT ... route end point
DI T4NCE .... total route aiitence (miles)
E-7
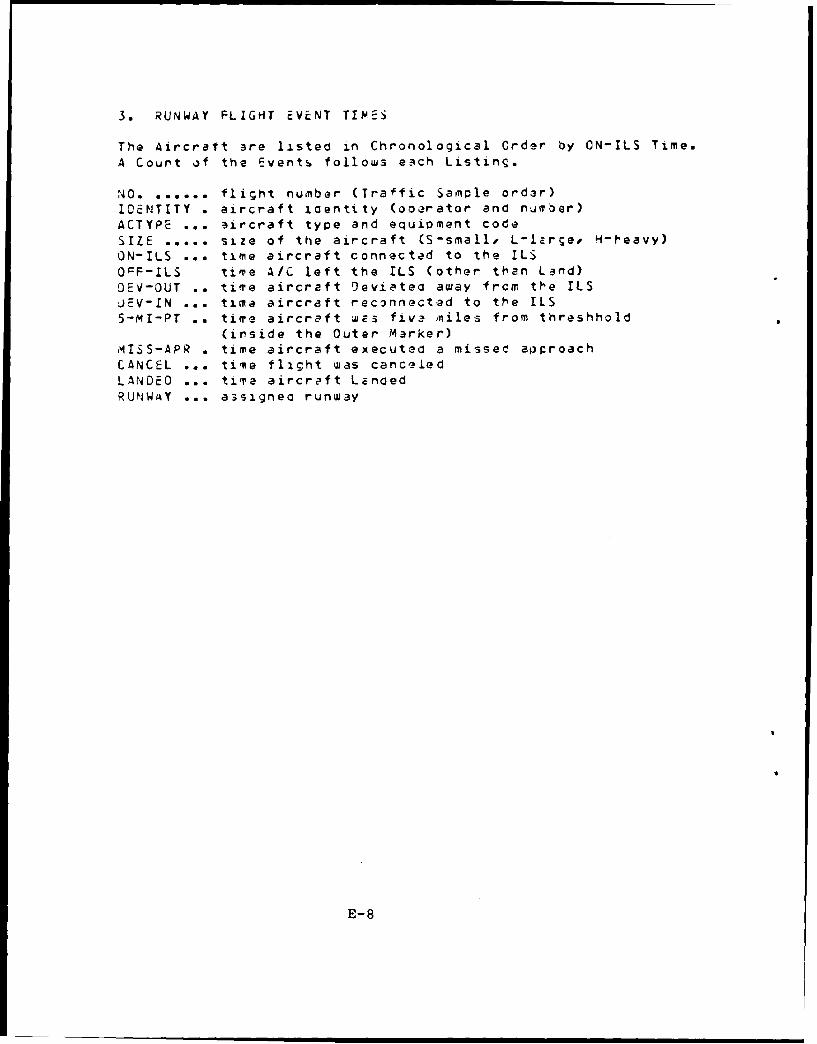
3. RUNWAY FLIGHT EVENT TIMES
The Aircraft are listed in Chronological Order by ON-ILS Time.
A Count of the Events follows e-ch Listing.
NO. ...... flight number (Traffic Sample order)ICENTITY . aircraft identity (ooerator and n'Jmber)
ACTYPE ... aircraft type and equipment code
SIZE ..... size of the aircraft (S-small, L-Itrqe, H-heavy)
ON-ILS ... time aircraft connected to the ILS
OCP-ILS time A/C left the ILS (other than Land)0EV-OUT .. time aircraft Deviatea away frcm the ILSJEV-1N ... time aircraft reconnected to the ILS
5-MI-PT .. time aircraft wzs five miles from threshhold
(inside the Outer Marker)MISS-APR . time aircraft executed a missec approach
CANCEL ... time flight was canceledLANDED ... time aircraft LanaedRUNWAY ... a3signea runway
E-8
,.1 FL1GHT ILS POINT CRoSSIN
Aircrft connected to the ILS are tested for cevi.tion from tre
Center Line. Tne ILS is extendiO 25 miles from the Runway thrcughthe 'eta.
The re ar? e total of 50 points alon. the ILS, 3tartin;at 25 miles from threshold and every . 5 miles t ereefter.
IWDNTITY . flight identityMEA . . averge deviation fraii IL center lineSTDEV .... standarc aeviation of deviation from £LS center lireCOUNT .... number cf ILS point crossingsSUM ...... sum ot ceviations from ILS center lnSUMS .... sim-ot-sueraes of drvietions from ILS center lineSTRTPT first ILS point crossed:NDPT .... last ILS point crossed
E-9
4.2 ILS PGINT =LIGt1T OEVIAT1ON JISTRI3UTION CHART
This is a weasure of randoT noise zintroduced curing tte simulation.
Only dircr.-ft connected to tne ILS Pre included in this Report.
POINT ........ ILS crossin; points
MEAN ......... averago deviation fron center linaSTD:V ... , standard deviation from ILS center line
COUNT . .... s. number of flights that crossed point
'UM .. ....... su-n of deviations from ILS center line
SUS ........ sum-of-squares of deviations from ILS center line
OISTRI.UTICN . nuyoer :f deviatians each 125 feet from
ILS center line (-1250 to 1250)
(3 point includes -124 to 124)
E-10
5. FLI3HT ACTION 3Y CCNTROLLcR
Tnis Ryport lists Flight Actions that occurred after the initial
iLS connection.
TIME .... time of action.ACTION .. action concerning aircraft as foiloas:
ATZNTRY .. entry into NO-TRANSGRiSSION-O1N (NTZ)
NTL=XIT .. exit from NTZ.LCAFNTRY .. start if longitudinal conflictLCNF!XIT .. n cf langiludinil conflictACNFNTRY .. start of parelial runway conflict
PCNFcXIT .. eno cf oarallel runway conflictPilot Keybcrd Messages:
ALTITUJE .. altituce cnanga
CANCEL .... cancel flightCLEARIO ... claaranceMI3SSO .... m iissed epproachNOM ... pilot infornation
E..... speac changeVSCTOR .... heading chan;a
RWY1 .... action runwsy
IONT1 .. tlight identity of aircraft perfomirg actiorTOST1 ... action A/C distance to threshold
rHOG1 .... heading of action aircraft3P01 .... speed of action aircraft
ALT1 .... altitude of action aircraftTRACK/SEP .. range and altitude separatior of conflict
(conflict exit - minimum separatior during conflict): r
A/C Tracking Ccde for Pilct or NTZ ActionsRWY2 .... Runway of second A/CIDNT? .. identity of second aircraft in confliction
TOMT2 ... cistance to threshold of secono aircraft
H052 .... heading of secona aircraft in conflictSPO2 .... speed of second aircraft in conflict
ALT2 .... altitude of second aircraft in conflictDEV ..... deviation from ILS center line (feat, L-left, R-right)MX i.... maxiiun deviation during NTZ crossirg (feet)
TOST .... distance flown along ILS during NTZ crossing (miles)
DUR ..... aur.tion of NTZ crossing (seconds)
E-11
A R $AY C CT :C NS a p Ft the a nd o f trni5 r~~l
T s n ot c x ic j4;5C -;c bo v.2 e r D f ) - ws:
L-~EJ.. Arriv~ie Aircreft L~njla
PlLjTA-.?. * I.JIt k(?y' zrd 4 ntry ?rr.r s tese ar2 not
~Vary 3:k)~ce I~ :.unt c ?nrc if CL~ ky is5truckr ?vj~ry ( in l tis countec E-:
E-12
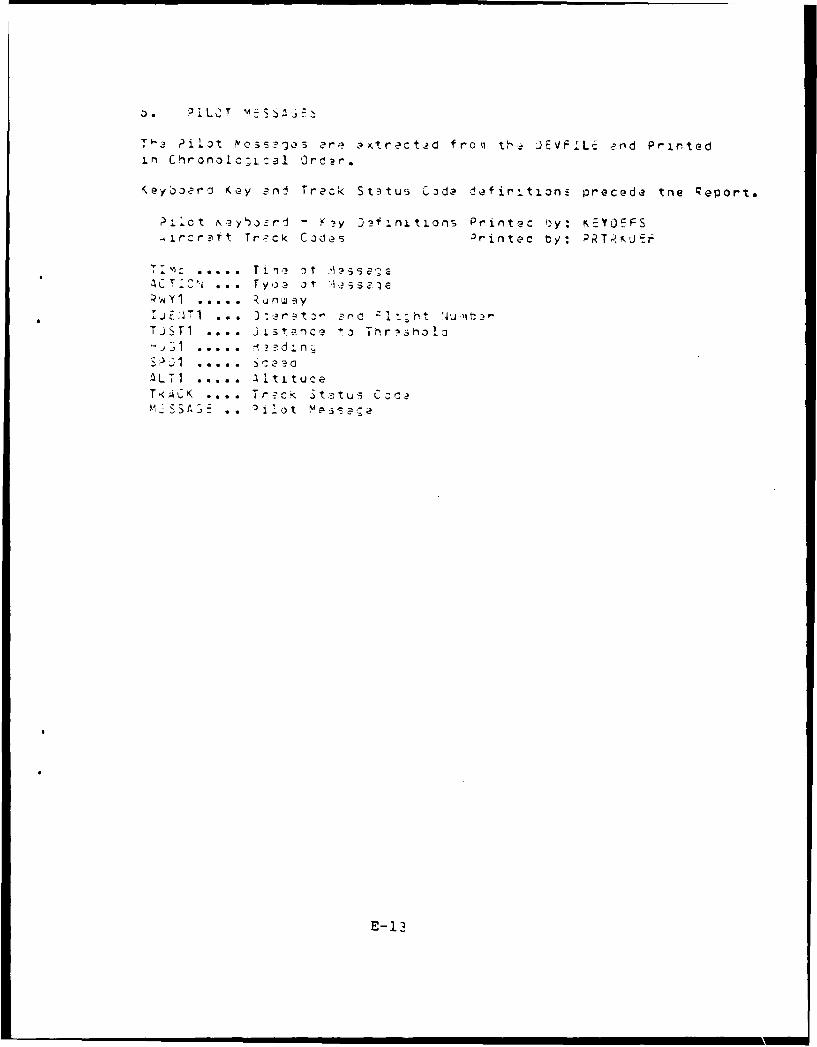
TI,- Pilat NeGs?'Jcs er? -,xtrect.?d fr-on th-: JEVFLL - enrd Printedi.n Chrnalc;ical Orda,-.
Key~aerri Key 3nd Track St--itus "C:dj dfir-.ti.onc precede tne Peport.
Pilot iKy~,ri y 3finijtions Prjrvtac 1y: K;:Y'JE-S
liALT .. Att
E- 13
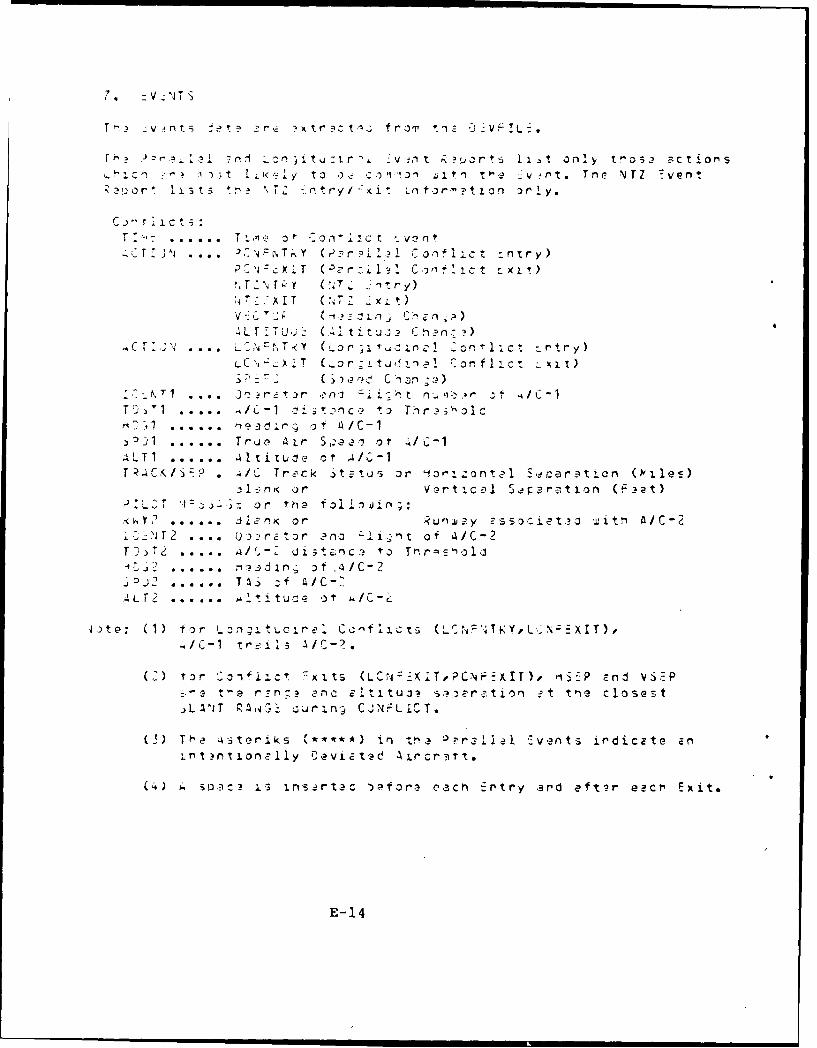
-).3~ - t y *k o c i n 3. t t 2 -?~rt. Tr'r N Z ':vent~
or 13 Zt -*o i t P.tryL or Io 3
T4r'c AX .I Tl t /
:LT '4 ~~ r it r n -sjin;: n-.
i, D/~ d g o C 1', ~ ~ 'I
A~2.....Tltuc r 21 -1Coct
T I . . .i tsr L ~t u de , C - 1c~
U)) sr n~fic K xt (rO Vc~t,? i xIT)op ,to (lSP aV
L ) T J S A-- or r th f 1 2~ u in T,
.4 A . i~ .3 .n.r~ .~fo- ilen ortr Runrd sc e f -,t "~ eA/C?'
Z T2 a ar na ntEo-aC4
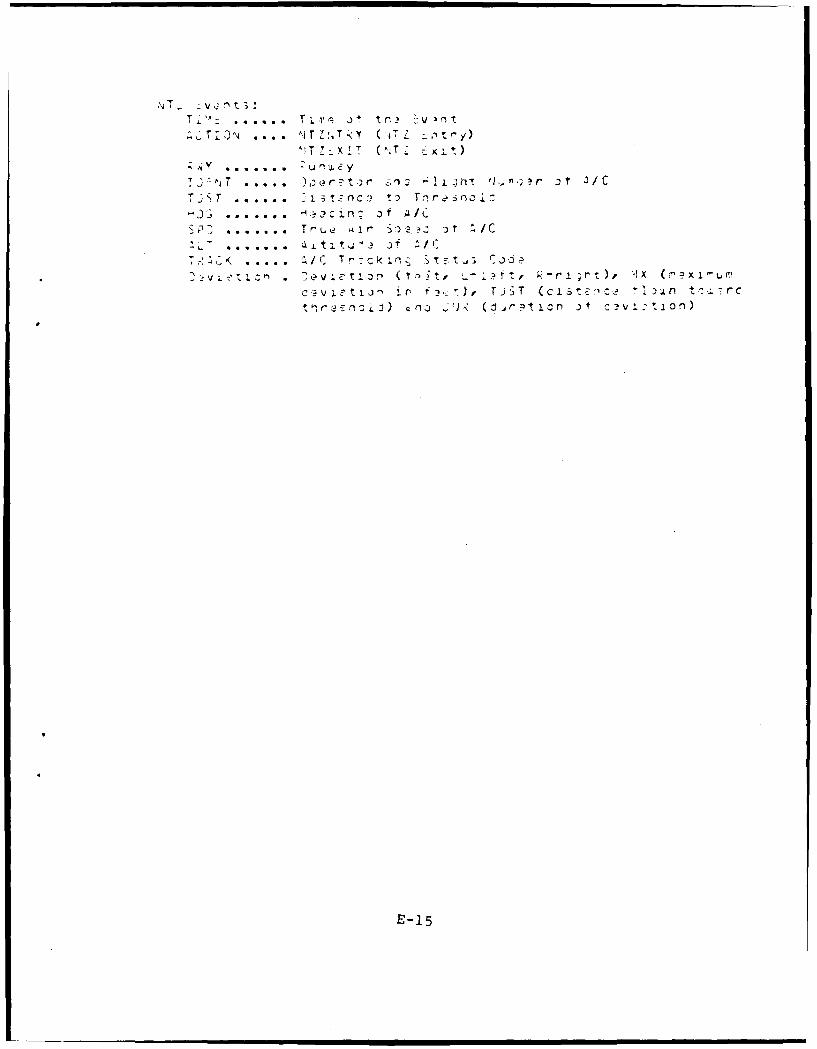
T '.'-: . ... .. z1' oT iti_, iv n
L TIO ... i T Y (;, A7Z _n rY)
! x T ( T L .1 -
T.;(? .. .. rL' ztnc. n0 T:3 e n r o
-DS . .... .ein r of A/C
.- L . . .. .. /C Trck i i Stu? J; Code
-'vzeL~v tCn: " (t , V IK r Er-), tX Zfx I
E-15
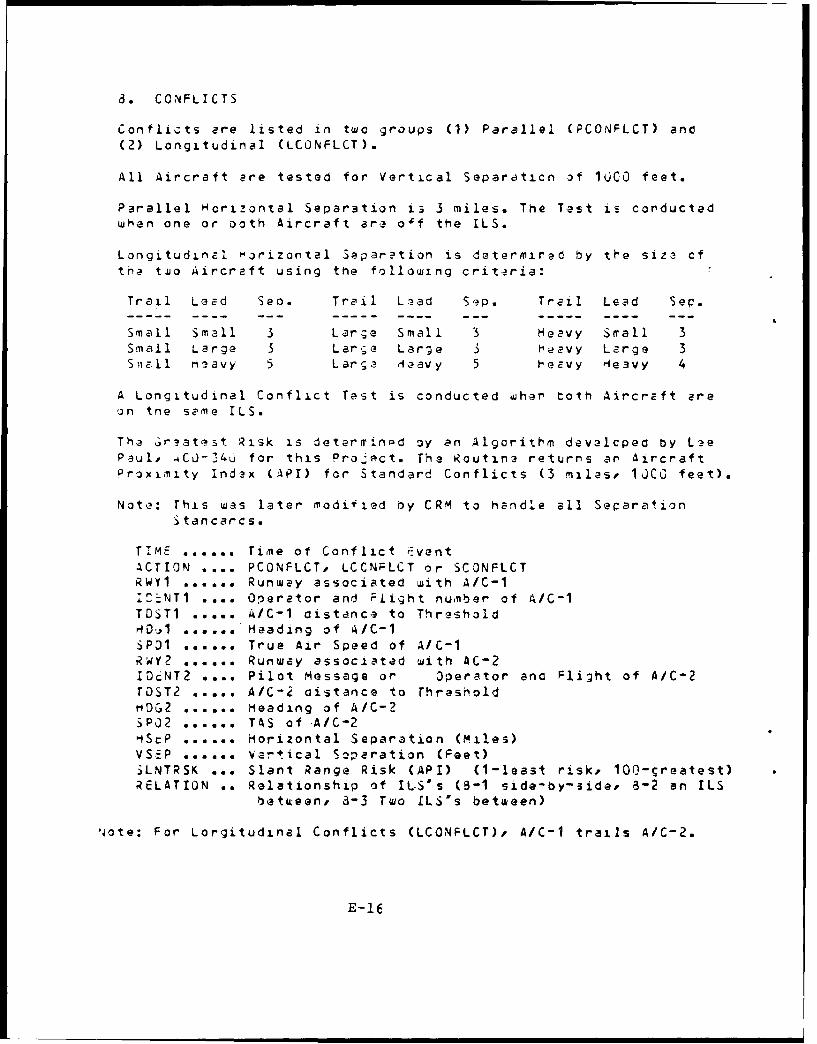
3. CONFLICTS
Conflicts are listed in two groups (1) Parallel (PCONFLCT) and
(2) Longitudinal (LCONFLCT).
All Aircraft are tested for Vertical Separaticn of 10CO feet.
Parallel Horizontal Separation is 3 miles. The Test is conductedwhen one or ooth Aircraft are o~f the ILS.
Longitudinzl Horizontal Separation is determirad by the siza cfthe two Aircraft using the following critaria:
Trail Lead Seo. Trail Liad Sqp. Trail Lead Sep.
Small Small 3 Large Small 3 Heavy Small 3Small Large 3 Lar;e Large 3 he2vy Large 3S iil r1eavy 5 Larga Heavy 5 heavy Heavy 4
A Longitudinal Conflict Test is conducted whar toth Aircraft areon tne same ILS.
The ir~atqst Risk is determinpd sy an Algorithm develcped by LeePaul, 4CJ-145 for this Projpct. The Routine returns an AircraftProximity Indzx (API) for Standard Conflicts (3 miles, 10C0 feet).
Note: This was later modified by CRM to handle all SeparationS tan care s.
TIME ...... Time of Conflict iventACTION .... PCONFLCT, LCCNPLCT or SCONFLCTRWY1 ...... Runway associated with A/C-i
UCNTI .... Operator and Flight number of A/C-1
TDSTI ..... A/C-1 distance to ThresholdHrDA ...... Heading of A/C-1
SP01 ...... True Air Speed of A/C-IRwY2 ...... Runway associated with AC-2IcNT2 .... Pilot Message or Operator an! Flight of A/C-2TDST2 ..... A/C-2 distance to Threshold
HOG2 ...... Heading of A/C- -
SP02 ...... TAS of A/C-2
HScP ...... Horizontal Separation (Miles)VSP ...... vartical 52paration (Feet)LNTRSK ... Slant Range Risk (API) (1-least risk, 100-Sreatest)
RELATION .. Relationship of ILS's (3-1 side-by-side, 3-2 an ILSbetween, 8-3 Two ILS's between)
Note: For Lorgitudinal Conflicts (LCONFLCT)t A/C-1 trails A/C-2.
E-16
?. ;LlGhT TLZ CHART
This is a Ti.,a :)lot of fli-ht durotion. The Aircraft zr .
listed in Flight Plan Order .;nd Include all Aircraft thathad a Start Tina.
NO . ......... flight num'er (oroar, i.o which, flight zppers in the
traffic sample)ACIO ........ aircraft iaertity (oparator and nuiiher)7NTART ....... fligtt start timeZ N) .. .. .. ... flgt termination tine
MINIJTC- N-PRCiL M . eacn plj5 (4) rqor-2esnts - )artion of ffn'rtetree fliht was in the rrco31m
E-17
10. !NSTANTAN;OUS AIRCRAFT COUNT
The Instantaneous Aircraft count reoresents the Mini',L andM4axinum number ot AIC handled simultaneously iurirg each Minute.
11. PILOT KZY STRIKES
This r~port ccntains the nurner of key strike s enterec byPilots aesignea to eacn Controller.
RWT ... . Runway Name
CONT ...... Logical Controller NunoerPVO ....... Display NumberALTITUjF .. altitude changeP.:EO ..... spead change
HEAOING ... heading chanse
6EACON .... oeaccn massacesCLeARE0 ... clearanceHOLD ...... hold messagesR-PORT .... reeort messaSes
REEXFER .. frequency tr ir'ersMISS P ... missed aoproacnCANCEL .... cancel fightPILOT-:R .. pilot keyboard enry -. ors (these ere not
necessarily pilot errors, a controller mayhave given an incorrect command)Every dackspace is counted and if a CLk key isstruck, every Key in that message is counted asan error
TOT-KEYS total key strikes ty pilots assigned to controller
E-18
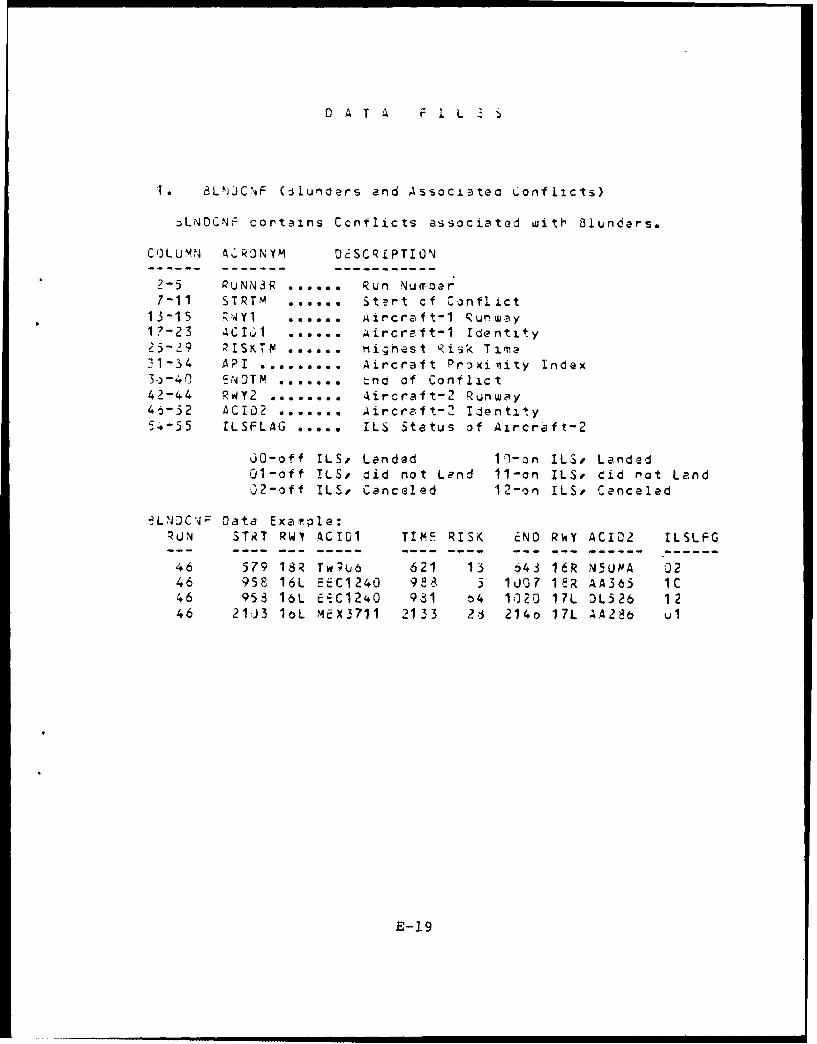
0 A T A F I L S
1. 8LNJCF (:lunders and Associatea Conflicts)
aLNDCNF cortains Ccnflicts associated witth Blunders.
COLUMN A OONYM 0dSCRIPTION
2-5 QUNN3R ...... Run Numoar7-11 STRTM ...... Strt cf Conflict
13-15 wYI ...... Aircraft-1 Runway17-23 ACI61 ...... Aircreft-1 Identity25-29 RISKTY! ...... mignest Ris;k Time
31-34 API ......... Aircraft Proximity Index3.-4O ErOTM ....... tno of Conflict42-44 RWY2 ........ Aircraft-2 Runway4,j-52 AC102 e... .a a Ai rc re.f t-2" Ide ntit y
5.-55 ILSFLAG ..... ILS Status of Aircraft-2
00-off ILS, Landed 11-on ILS, Landed01-off ILS, aid not Lend 11-on ILS, cid not Land32-off ILS, Canceled 12-on ILS, Canceled
L-JC.-4F Oata Exazpple:RUN STRT RWV ACI01 TIME RISK ENO RoY ACI02 ILSLFG
46 579 18R Tw9y6 621 13 643 16R N5UMA 0246 958 16L EEC124O 988 1007 18R AA365 iC46 95 16L E.C1240 981 f4 1020 17L OL526 1246 213 1oL MEX3711 2133 26 214o 17L A4226 ul
E-19
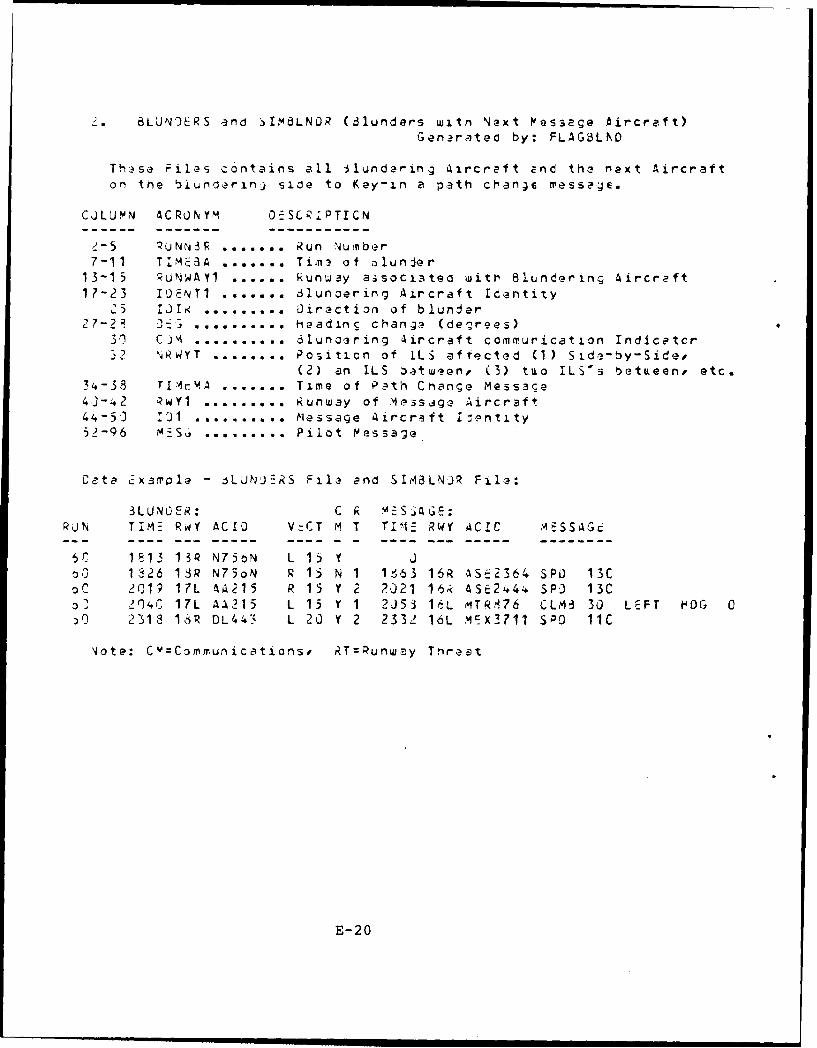
3. 8LUN')RS and SIM8LNOR (6iunders witn Next Pessage Aircraft)Generateo by: FLAGSLNO
These Files contains all 3lundering Aircraft and the next Aircrafton the biundering side to Key-in a path change messae.
CJLUMN 4CRONYM OESCRIPTICN
2-5 UNN3R ....... Run Number
7-11 TIM:-:3A ....... Tim:? of alunder13-15 RUNWA Y1 ...... Runway associated with Blundering Aircraft17-23 IOENT1 ....... 3lunoering Aircraft Identity
2 5 1JI< ......... Direction of blunder27 - 2 J;3;. .......... heading changa (degrees)
30 CJm ....... lunoering Aircraft commurication Indicetcr,2 NRWYT ........ Positicn of ILS affected (1) Side-by-Side,
(2) an ILS oatwen, (3) tuo ILS's between, etc.34-38 TI'4cyA ....... Time of Path Change Mess3ce4.J-#2 RwY1 ......... Runway of Message Aircraft
44-50 r1 ........ Message Aircrift 1£.pntity52-96 -zSQ ......... Pilot pessage
Cata Example - iLUN)ERS File and SI,LNJR File:
3LUNGOER: C R M" SAGE:RJN TIME RwY ACID VzCT M T TIME RWY ACIC ,ESSAG
6C 1813 13 N7SoN L 1) Y J0D 1826 1R N73oN R 15 N I 1663 16R AS;2364 SPO 13COC 2019 17L A4215 R 15 Y 2 2021 16k ASe2444 SP) 13C0 204C 17L A A215 L 15 Y 1 2J53 1%L reTRM76 CLM3 30 LEFT HOG 0) 2319 1IR OL44' L 20 Y 2 2332 16L MrX3711 SPO 11C
lote: CY=Communications, RT=Runway Tnraat
E-20
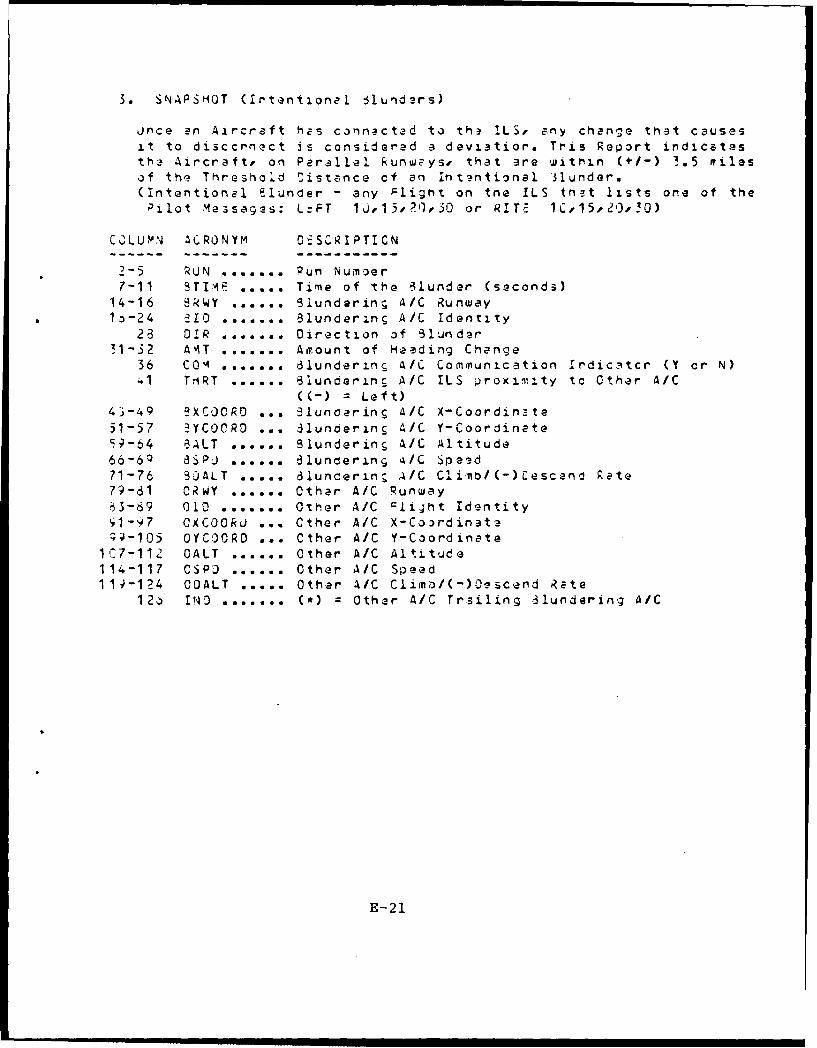
3. SNAPSHOT (Intentionel 31unders)
ince an Aircraft has cannactad to th? !LS, any change that causes
it to disccrnzct is considered a deviatior. Tris Report indicates
the Aircraft, on Parallel kunwFys, that are within (+/-) 1.5 milesof thi Threshold istence cf an intentional 31under.(Intentional Elunder - any Plight on tne ILS tnat lists one of the
ailot Messages: LeFT 1j,15,0?',30 or RITE 1C,15,2').30)
COLUMN ACRONYM O SCRIPTICN
2-5 RUN *...... Run Numoer
7-11 5TIP ..... Time of the ilunder (seconds)14-16 k WY ...... 9iunderin; A/C Runway1:s-24 LO ....... Blundering A/C Identity
23 DIR ....... Direction of 31under31-32 AliT ....... Am.ount of Heading Change
36 COrM ....... dlunderinc A/C Communication Irdicatcr (Y cr N)41 TriRT ...... Blundering A/C ILS proxim ity tc Other A/C
((-) = Left)43-49 eXCOORD ... gluncering A/C X-Coordinzte51-57 9YCOORO ... 5lundering A/C Y-Coordinate9-64 6ALT ...... Blundering A/C Altitude
66-60 3$PJ ...... 8lundering %/C Sreed71-76 B3JLT ..... d1uncerin; A/C CIimo/(-)Cesceno Rate79-81 ORWY ...... Other A/C Runway
k3-89 O1D ....... Oter A/C cIiht Identity,1-97 OXCOOkO ... Other A/C X-Co'rdinat3
; -105 OYC)ORD ... Cther A/C Y-Coordinate1C7-112 OALT ...... Other A/C Altitude114-117 CSPJ ...... Other A/C Speed11 -1?4 OOALT ..... Other A/C Climrn/(-)O-scend Rate
12o IND ....... (*) = Other A/C Trailing 3Iundering A/C
E-21
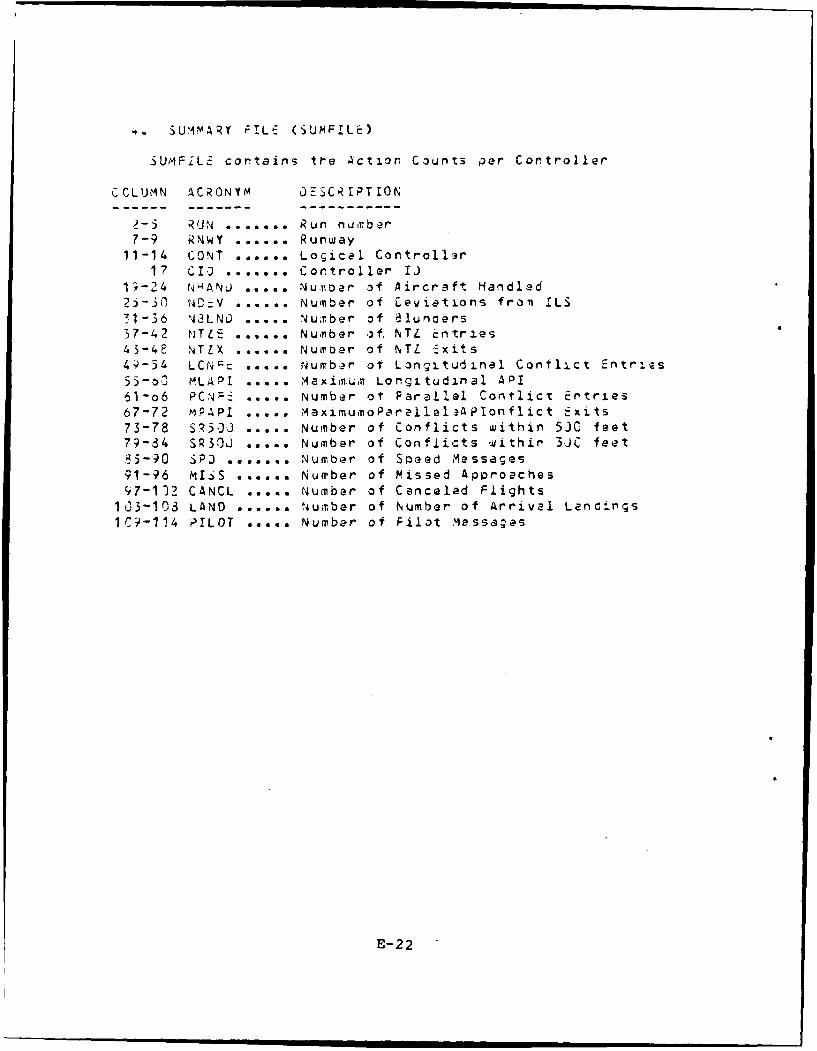
SUMFIL contains tre 4ction Counts per Controller
CCLUJMN ACRONYM )ESCRIPTION
?-5 RUN ....... Run nuirber7-9 RNWY ...... Runway
11-14 CONT ...... Logical Controller17 CID ....... Controller IJ
13-24 NHANJ ..... Nu.iar of Aircraft Handled2j-3 0 NO V ...... Number of Leviations from ILS71-36 N3LNO ..... Number of alunaers
37-42 NT1'E ...... Number of. NTL .ntries
43-46 NTLX ...... Number of NTL -xits
44-54 LCNr: ..... Number of Longitudinal Contlct Entries
55-o0 MLAPI ..... Maxiiun Lorgi tudinal API
61-o6 PCN;- ..... Number ot Parallel Conflict Ertries
67-72 MPAPI ..... MaximumoParellelaAPionflict .xits
73-78 S75]J ..... Number of Conflicts within 5)C feet79-84 SR30J ..... Number of Confiicts withir 3JC feet
.5-90 SP) ....... Number of Speed Messages
91-96 MIsS ..... Number of Missed Approaches97-102 CANCL .... Number of Canceled Flights
1C3-103 LAND N.... tumber of Number of Arrival Laniings
1C-114 PILOT ..... Number of Pilot Massages
E-22
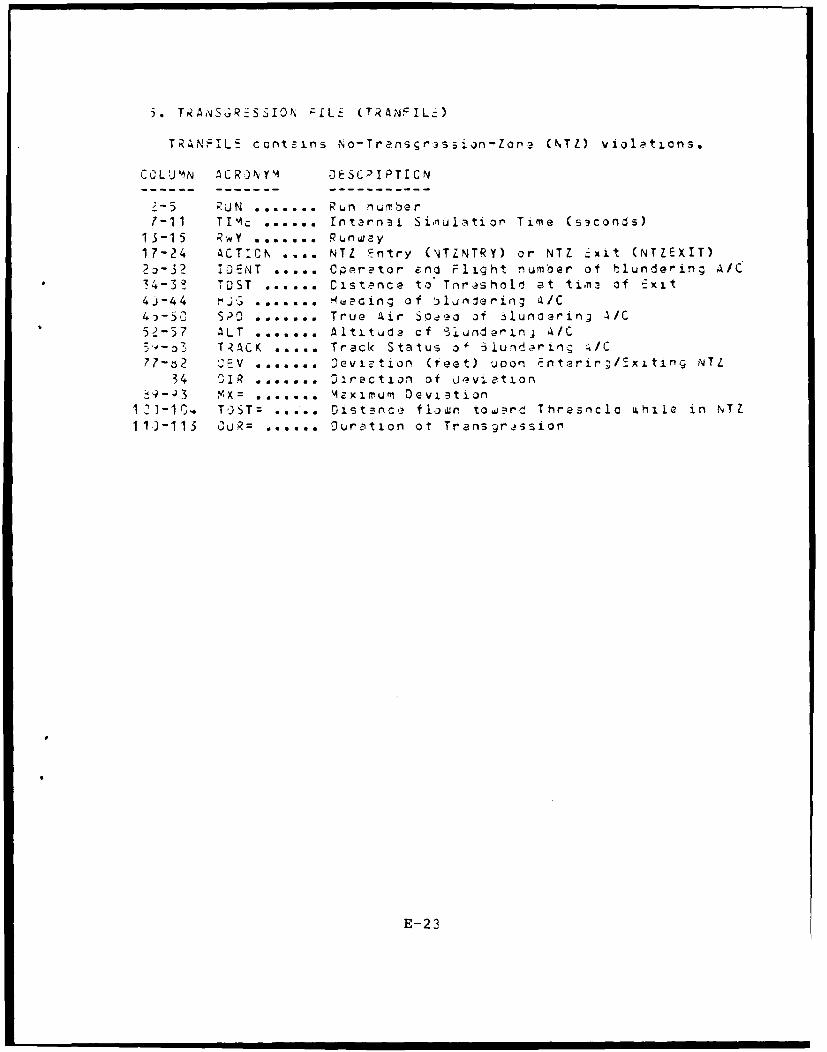
5. T.A,4\5V'R :SS$ION -L:i (TRLANFILZ)
TRAN -TLE ccntzins No-Transgrssion-Zone (NTZ) violations.
CCLUM1N ACRK)N'YM DESC.'IPTICN
7-11 TI 1: . .. . .. In'tarnai Simulation~ Time (s~conds)13-15 RwY * *. . Q n ua17-24 AC T IC N .. NTZ En'try ('TZNTRY) or Nil Czit CNTZEXIT)2z)-32 IOEt4T .. Cp retor zrnd Flight number of tlundering A/C
*3'4-3 TOST .... Cist;ence to Tnrashold' at tin: of Exit4J-44 ~.j o... H4weoing of ilirdering, 4/C
4:)-50 p S0 ....... True Ai.r Sp-a of 31uncering A/C5-3 7 ALT . .. .. .. Altituaa cf t5iundarng A/C
T TC K .. . .. Track Status of 3jund.?rin-,, ./C77-o2 "'-V Soo*... 3eviation (feet) uoon Fentarir;/Exitjng NTZ
14 CdIR .. .. Direction of LUevlation
1)1t>. TST= .... st:-ncl flown towerd Thresncla u~hiie in NTZ11)-113 CuR= ...... . urotion ot Transgrd ssior
E-23
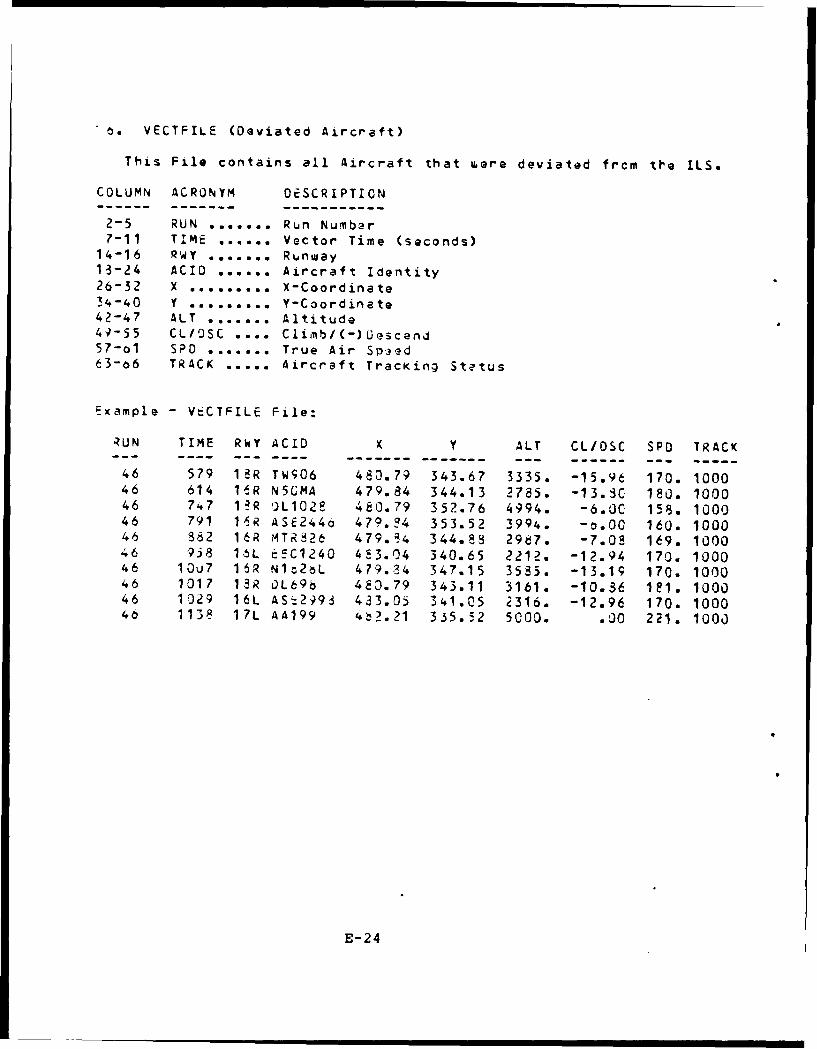
6. VECTFILE (Deviated Aircraft)
This File contains all Aircraft that were deviated frcm the ILS.
COLUMN ACRONYM DESCRIPTION---- --------------------2-5 RUN ....... Run Number7-11 TIME ...... Vector Time (seconds)
14-16 RWY ....... Runway13-24 ACID ...... Aircraft Identity26-32 X ......... X-Coordinate34-40 Y ......... Y-Coordinate42-47 ALT ....... Altitude44-55 CL/OSC .... Climb/(-)uescend57-ol SPO ....... True Air Spaed63-o6 TRACK ..... Aircraft TracKing Stetus
Example - VECTFILE File:
RUN TIME RWY ACID X Y ALT CLIDSC SPO TRACK- - - - -- -- - - - -- -- - -- - -- -
46 579 12R TW906 480.79 343.67 3335. -15.96 170. 100046 614 1R N5GMA 479.84 344.13 2785. -13.3C 180. 100046 747 1IR !L1028 480.79 352.76 4994. -6.0C 158. 100046 791 1R ASE24 479.?4 353.52 3994. -0.00 160. 100046 382 16R MTR826 479.i4 344.83 2967. -7.03 169. 100046 9,8 16L tEC1240 483.04 340.65 2212. -12.94 170. 100046 10u7 16R N1c2?L 479.34 347.15 3585. -13. 1 170. 100046 1017 13R OL69b 4e3.79 343.11 3161. -10.36 1?1. 100046 1029 16L ASL2993 433.05 341.05 2316. -12.96 170. 100040 1138 17L AA199 4b2.21 335.52 5000. .00 221. 1000
E-24
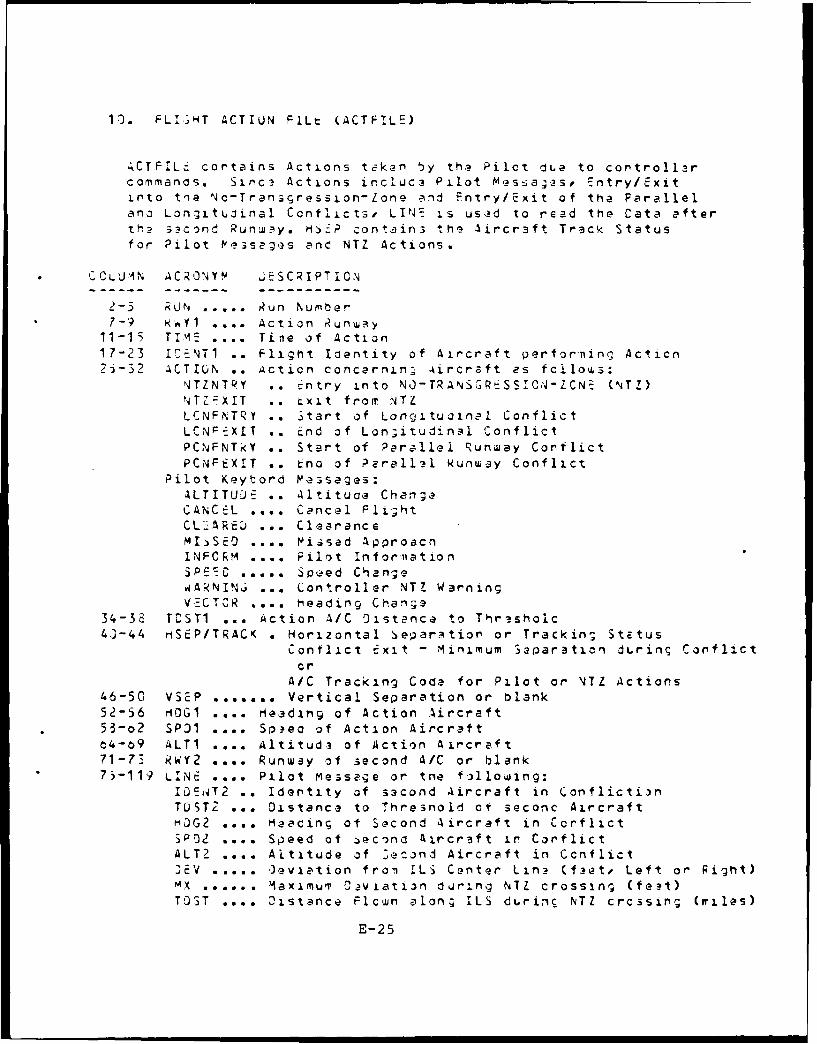
1-3. FLI>3T ACTION FILt (ACTFILE)
4CTFIL: cortains Actions taken by the PilCt dLe to controllarcommands. Sinci Actions incluC3 Pilot messages, Entry/Exitinto tie Nc-Transgression-Lone and Entry/Exit of the Parallelano Longitujinal Conflicts, LINE is used to read the Cata afterth? second Runway. hZE contain: the 1ircraft Track Statusfor Pilot Peseg s Fn NTZ Actions.
S CCLU4N ACRONYM .ESCRIPTION
2-5 RUN ..... Run Number7-9 k YI .... Action RunwnBy
11-15 T1 .... Tine of Action17-23 fSENT1 .. Flight Identity of Aircraft performing Acticn?j-32 ACTION .. Acticn concernin; -ircraft as fcilo s:
NTZNT!Y .. :ntry into NO-TRANSGRESSI0P-ZCNE (NTZ)NTbXIT .. txit from NTZ
LCNFNTRY .. 3tart of Longitualnal Conflict
LONF:XIT .. End of Lon~itudinal ConflictPCNFNTkY .. Start of Parallel Runway ConflictPCNFEXIT .. tno of Peralll Runway Conflict
Pilot Keytord MVasages:ALTITUDE .. Altitude ChangeCANCEL .... Cancel FlightCL'ARED ... ClearanceMI)SED .... Miissad ApproacnI NFOR M .... Pilot rnf ormatio n
PE ': ..... Spe.ed Change
WARNINO' ... Controller NTZ WarningV ECTR .... eading Change
34-38 TGST1 ... Action A/C 0istance to Thrssholc43-44 riSEP/TRACK . Horizontal Separetior or Trackin- Status
Conflict Exit - Minimum Separation dLrin Conflict
crA/C Tracking Code for Pilot or NTZ Actions
46-50 VSEP ....... Vertical Separation or blank
52-56 eiflGl H. eading of Action Aircraft53-o2 SP31 Spea of Action Aircraft
t4-69 ALT1 Altituda of Action Aircraft71-73 kWY2 Runway of second A/C or blank75-119 LINE Pilot Messege or the felloing:
IOEt4T2 .. Identity of second Aircraft in Conflicti)nTUST2 ... Distance to Threshold of seconc AircraftHJG2 .... Heacing of Second Aircraft in CorflictSPOZ .... Speed of aecond Aircraft in CorflictALT2 .... Altitude of :econd Aircraft in Ccnflict
'EV ..... 3evetion fron ILS Center Lin? (fiet, Left or Right)X ..... o. Maximum Oviatian durLng NTZ crossing (feet)
TOST .... 2istance Flcwn along ILS durinc NTZ crcssin; (wiles)
E-25

CUR .. Ourzio.n of NTZ crossing (seconds)
E-26

APPENDIX F
ORIGINAL SIMULATION SCHEDULE
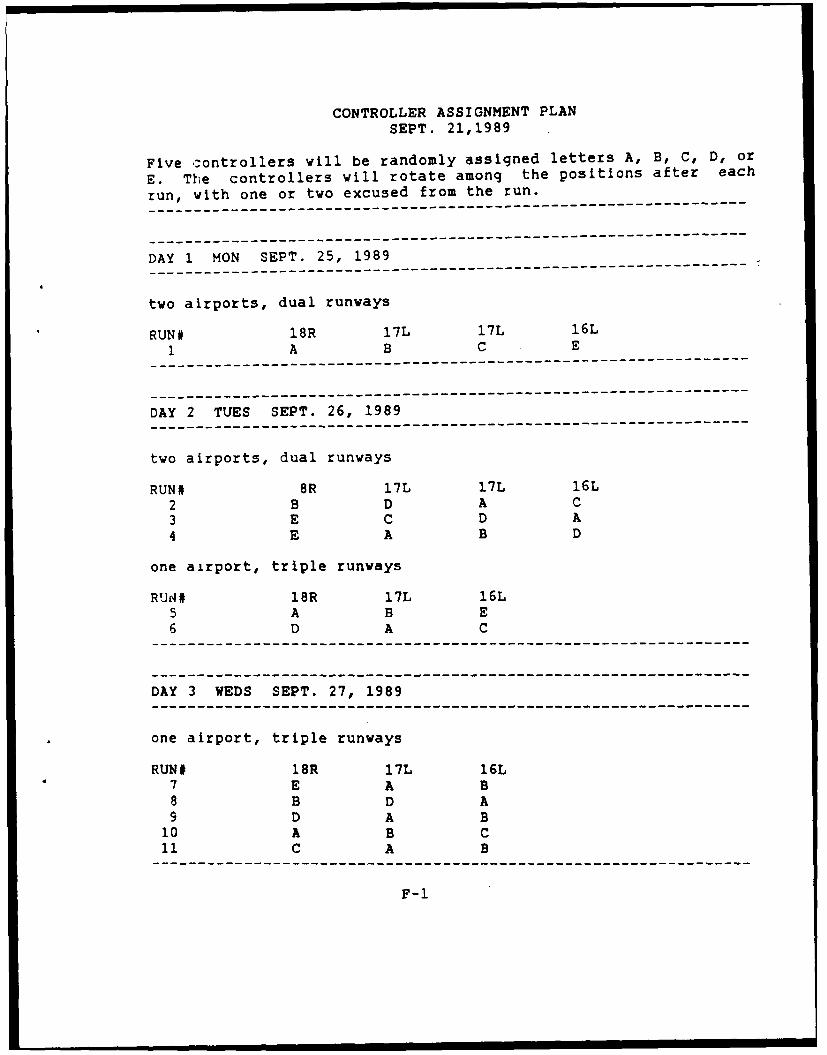
CONTROLLER ASSIGNMENT PLANSEPT. 21,1989
Five controllers will be randomly assigned letters A, B, C, D, or
E. The controllers will rotate among the positions after each
run, with one or two excused from the run.------------------------------------------------------------------------
------------------------------------------------------------------------
DAY 1 MON SEPT. 25, 1989------------------------------------------------------------------------
two airports, dual runways
*RUN# 18R 17L 17L 16L1 A B C. E
-----------------------------------------------------------------------
------------------------------------------------------------------------
DAY 2 TUES SEPT. 26, 1989------------------------------------------------------------------------
two airports, dual runways
RUN# BR 17L 17L 16L2 B D A C3 E C D A4 E A B D
one airport, triple runways
R U 0 # 18R 17L 16L5 A B E6 D A C
DAY 3 WEDS SEPT. 27, 1989
* one airport, triple runways
RUN# 18R 17L 16L7 E A B8 B D A9 D A B
10 A B C11 C A B
F-l
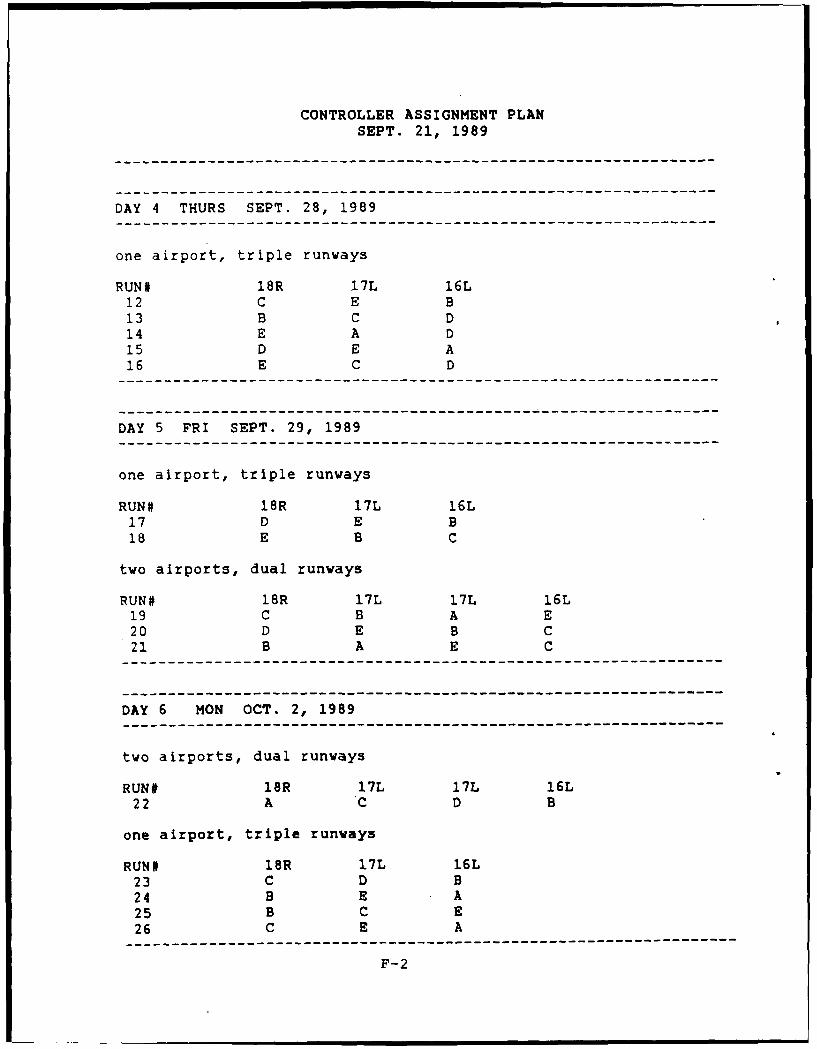
CONTROLLER ASSIGNMENT PLANSEPT. 21, 1989
--- ----------------------------------------------------------
DAY 4 THURS SEPT. 28, 1989
one airpor t, triple runways
RUN# 18R 17L 16L12 C E B13 B C D14 E A D15 D E A16 E C D
DAY 5 FRI SEPT. 29, 1989
one airport, triple runways
RUN# 18R 17L 16L17 D E B18 E B c
two airports, dual runways
RUN# 18R 17L 17L 16L19 C B A E20 D E B C21 B A E C
--- -----------------------------------------------------------
DAY 6 MON OCT. 2, 1989--- -----------------------------------------------------------
two airports, dual runways
RUN# 18R 17L 17L 16L22 A C D B
one airport, triple runvays
RUN# 18R 17L 16L23 C D B24 B E A25 B C E26 C E A--- ------------------------------------------------------------
F- 2
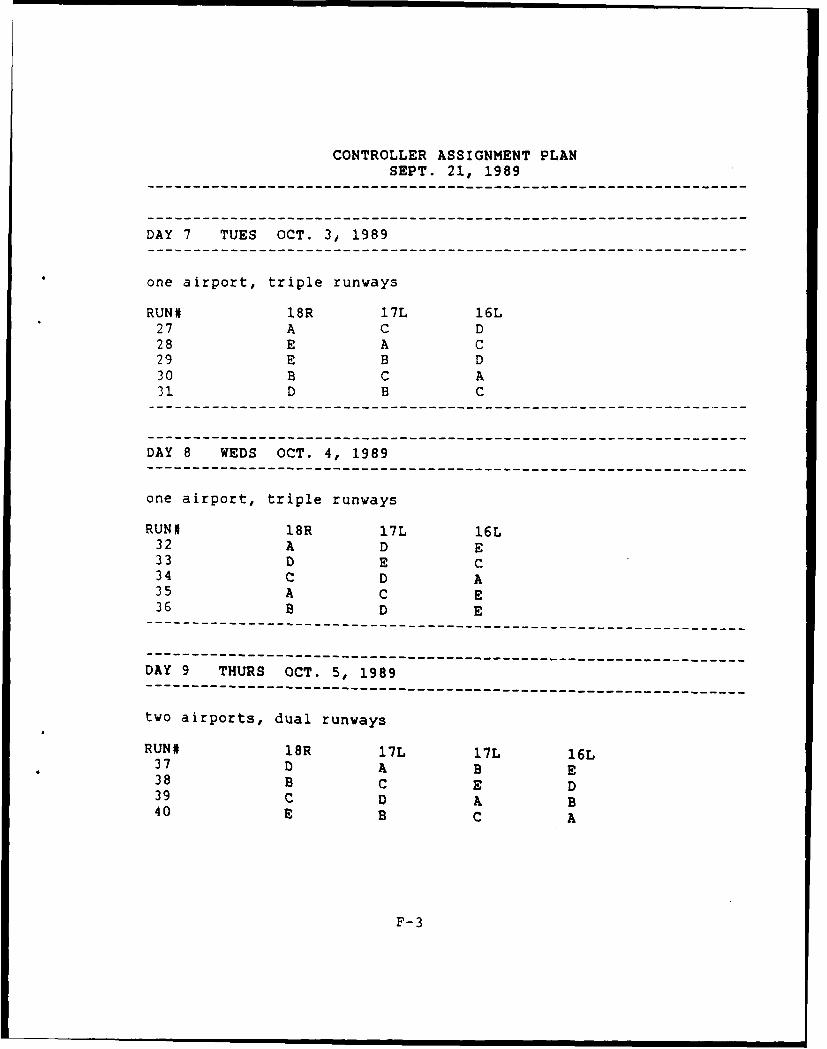
CONTROLLER ASSIGNMENT PLANSEPT. 21, 1989
DAY 7 TUES OCT. 3t. 1989
one airport, triple runways
RUN# 18R 17L 16L27 A C D28 E A C29 E B D30 B C A31 D B C
DAY 8 WEDS OCT. 4, 1989
one airport, triple runways
RUN# 18BR 17L 16L32 A D E33 D E C34 C D A35 A C E36 B D E----- ------------------------------------------------------
----- ------------------------------------------------------
DAY 9 THURS OCT. 5, 1989----- ------------------------------------------------------
two airports, dual runways
RUN# 18R 17L 17L 16L37 DA B E38 BC E D39 CD A B40 EB C A
F- 3
APPENDIX G
CONTROLLER INFORMATION QUESTIONNAIRE AND CONSENT FORM
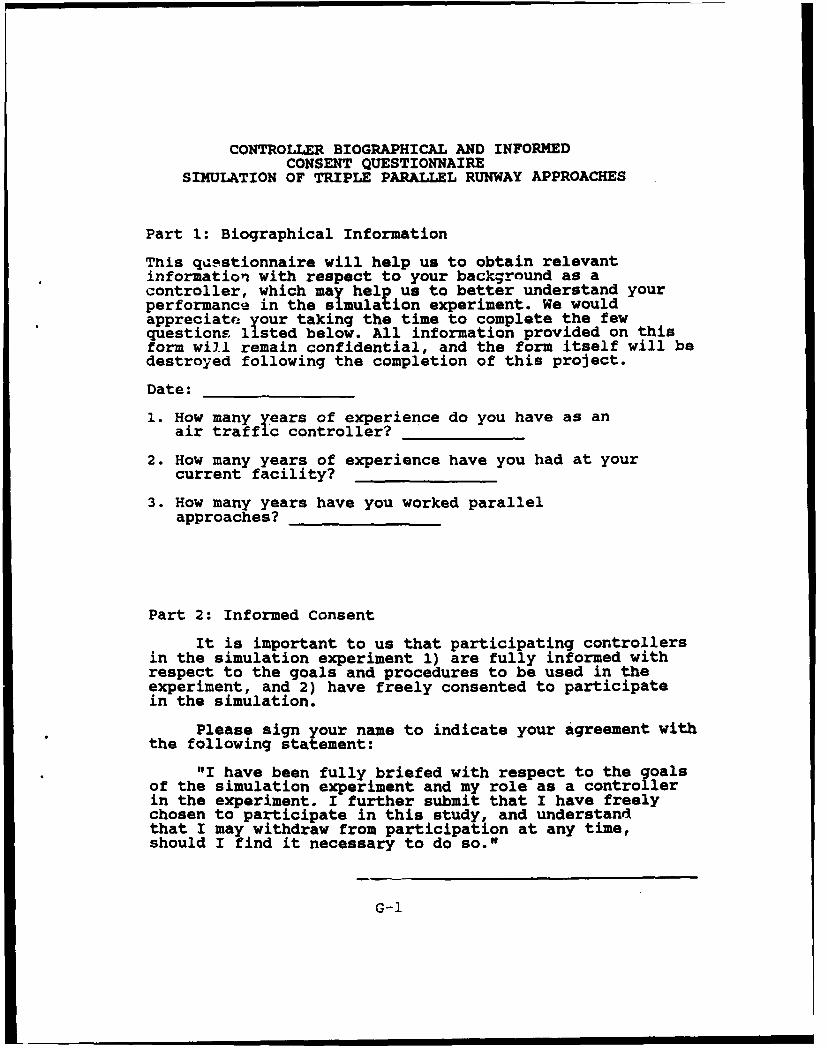
CONTROLLER BIOGRAPHICAL AND INFORMEDCONSENT QUESTIONNAIRE
SIMULATION OF TRIPLE PARALLEL RUNWAY APPROACHES
Part 1: Biographical Information
This questionnaire will help us to obtain relevantinformation with respect to your background as acontroller, which may help us to better understand yourperformance in the simulation experiment. We wouldappreciat your taking the time to complete the fewquestions listed below. All information provided on thisform will remain confidential, and the form itself will bedestroyed following the completion of this project.
Date:
1. How many years of experience do you have as anair traffic controller?
2. How many years of experience have you had at yourcurrent facility?
3. How many years have you worked parallelapproaches?
Part 2: Informed Consent
It is important to us that participating controllersin the simulation experiment 1) are fully informed withrespect to the goals and procedures to be used in theexperiment, and 2) have freely consented to participatein the simulation.
Please sign your name to indicate your agreement withthe following statement:
"I have been fully briefed with respect to the goalsof the simulation experiment and my role as a controllerin the experiment. I further submit that I have freelychosen to participate in this study, and understandthat I may withdraw from participation at any time,should I find it necessary to do so."
G-1

APPENDIX H
TECHNICAL OBSERVER REPORT
D/FW METROPLEXAIR TRAFFIC SYSTEM PLAN
SIMULATION OF TRIPLEINDEPENDENT PARALLEL RUNWAYS
OPERATIONAL ASSESSMENTD/FW PROGRAM OFFICE
Sept. 25 - Oct. 6, 1989
Prepared by:DIFW METROPLEX
AIR TRAFFIC SYSTEM PLANPROGRAM OFFICE
Ronnie L. Uhlenhaker, Program Manager, ASW-51 1J
Allan N. Crocker, Program Specialist, ASW-511K
Gene D. Skipworth, Program Specialist, ASW-5 11 M
David W. Asbell, Program Specialist, ASW-51 11
817-624-5567/5572 FT8: 734-5667/5572
Mailing Address:
DOT/FAAFort Worth, Tx. 76193-0611
U.S. DEPARTMENT OF TRANSPORTATIONFEDERAL AVIATION ADMINISTRATION
SOUTHWEST REGIONH-1
TABLE OF CONTENTS
EXECUTIVE SUMMARY .................. 1
INTRODUCTION ........... .................. 4
ANALYSIS ........... ...................... 6
CONCLUSION ..................... 12
RECOMMENDATIONS ....... .................. 13
ANNEX I
ANNEX 2
H-2
KECUTIVI SUMMARY
The goal of the triple, independent instrument landing system (ILS)
simulation was to demonstrate the safety and feasibility of multiple
parallel approaches to independent runways with all types of aircraft.
The D/FW Metroplex Air Traffic System Plan Program Office provided staff
support and acted as observers throughout the simulation. During the
simulation, the Program Office staff recorded the control instructions
issued by the controllers and the estimated minimum slant range distance
between blundering aircraft and the aircraft affected by the blunder. The
records of the observers indicate two types of situations. The first type
of situation was blunders--this includes turns of 30 degrees or less, with
and without radio communications, which required aircraft on adjacent ILS
courses be vectored to avoid the blundering aircraft. The second type of
situation recorded the "turn left/right and rejoin the ILS" instructionb
issued to resolve the programmed navigation error.
The simulation included 16 dual ILS runs in which the observers recorded
207 blunders and 1,395 turn and join situations. The simulation also
included 28 triple ILS runs in which the observers recorded 294 blunders
and 2,094 turn and join situations.
The Triple Independent ILS Simulation Executive Committee determined that
all situations which resulted in less than 500 feet slant range would
receive an indepth analysis. The observers decided to analyze all
situations in which less than 3,000 feet slant range was computed. In the
H-3
simulation, duals produced 207 blunders of which 12 resulted in less than
3,000 feet slant range distance. In the simulation, triples produced
310 blunders of which 14 resulted in less than 3,000 feet slant range
distance. Annexes 1 and 2 describe these situations.
During the dual simulation, the closest point of approach occurred in
Run 4 - 2 and was estimated to be (0 ft - 0 NM) and computed to be
1,103 feet slant range. The slow response of the simulation operator pilot
created this situation. A period of 15 to 20 seconds lapsed between the
initial clearance response and the time the aircraft began to turn. In
Run 4 - 2a, the controller called an aircraft by the wrong call sign. This
may or may not have contributed to the creation of closest point of
approach, estimated to be (200 ft - 1/4 NM), and computed to be 1,712 feet
slant range. The closest point of approach in which the observers could
not detect reaction delay by either pilot or controller occurred in
Run 26 - 1. The miss distance was estimated to be (0 ft - 1 NM) and
computed to be 2,279 feet slant range.
During the triple simulation, the closest point of approach occurred in
Run 31, estimated to be (200 ft - I NM), and was computed to be 1,229 feet
slant range. However, this distance occurred between two aircraft being
vectored away from a blundering aircraft and did not involve a blundering
aircraft. The closest point of approach involving a blundering aircraft
occurred in Run 35, estimated to be (200 ft - 2 NM), and was computed to be
1,684 feet slant range. However, this slant range distance occurred after
the pilot made a 90-degree left turn. The pilot continuea the turn,
H-4
resulting in a 180-degree left turn. The observers did not detect reaction
delays by the controllers which resulted in less than 3,000 feet slant
range miss distance during the triple simulation. The closest point of
approach in which the observers did not detect reaction delays by the pilot
occurred in Run 22, estimated to be (400 ft - 1/8 NM), and was computed to
be 2,084 feet slant range.
The triple simulation had one run in which the blunders were not scripted.
Representatives of Aviation Standards National Field Office (AVN) and
Flight Standards Service (AFS) induced, on a random basis, blunders of
30-degree turns, with and without radio communications, during a 1-hour
run. The intent of the run was to create situations which would result in
a "worse case" condition. This was accomplished by arbitrarily
manipulating an aircraft to a point where an aircraft was then either
parallel or slightly behind on an adjacent ILS and approximately the same
altitude before beginning the blunder. During the run, the observers
recorded 17 blunders and 63 "turn and join" instructions being issued. The
closest point of approach was observed to be (400 ft - 1/8 NM) and computed
to be 1,863 feet slant range.
The simulation proved most emphatically the feasibility of implementing the
triple ILS procedures at Dallas/Fort Worth International Airport without
any degradation of safety.
H-5
INTRODUCTION
Implementation of the D/FW Metroplex Air Traffic System Plan will require
new and innovative procedures to accommodate the increased volume of
traffic projected for Dallas/Fort Worth International Airport.
Dallas/Fort Worth International Airport will construct two new parallel
north/south runways on the east and west side of the airport. The east
runway (16L/34R) will be approximately 8,500 feet long and 5,000 feet east
of the center of Runway 17L. The west runway (16R/34L) will be
approximately 8,500 feet long and 5,800 feet west of the centerline of
Runway 18R. In order to gain full capacity of the new runways, procedures
must be developed which allow multiple (more than two), simultaneous
parallel ILS approaches be conducted during weather minimums of 200-foot
ceiling and visibility of 1/2 NM.
The multiple, simultaneous parallel ILS approach simulations are being
conducted in phases. Phase I was completed in June 1988. Phase II,
triple independent ILS simulation, was conducted at the Federal Aviation
Administration (FAA) Technical Center in Atlantic City, New Jersey, from
September 25 through October 6, 1989.
Phase III, quadruple parallel ILS approach simulation, will be conducted at
the FAA Technical Center January 29 through February 9, 1990.
H-6
The Dallas/Fort Worth TRACON/Tower provided five individuals--one
supervisor, one traffic management specialist, and three controllers--to
participate in the simulation. The D/FW Metroplex Air Traffic System Plan
Program Office provided the staff support and acted as observers
documenting the actions of the controllers throughout the simulation.
H-7
ANALYSIS
The simulation consisted of two separate scenarios with the runway layout
unique to Dallas/Fort Worth International Airport. The first scenario
studied dual parallel ILS approaches consisting of two separate runway
layouts. One set of runways included Runways 18R and 17L with Runways 17L
and 16L as the second set. The second scenario studied the triple,
parallel ILS approaches using Runways 16L, 17L, and 18R. Simulation runs
were made using the dual runways to compare the resulting data with the
triple runway data.
Throughout the simulation, the controllers encountered unexpected
situations and conditions to which they responded with excellent success,
which provides further emphasis to our conclusions. The following
paragraphs outline some of the general problems and situations. Annex i
(Duals) and Annex 2 (Triples) explains the instances in which less than
3,000 feet slant range distance resulted between a blundering aircraft and
an aircraft on an adjacent ILS.
BLUNDERS: The simulation included several types of scripted blunders,
which were introduced at various times during a 1-hour run, without the
prior knowledge of the controllers or observers. These blunders included
10, 20, and 30-degree turns with and without radio communication. Due to
the navigational parameters set in the computer, the controllers and
observers were unable to differentiate between 10 or 20-degree blunders and
a navigational error in which the controller had radio communications with
H-8
the aircraft. Further explanation of this is in the Navigation paragraph.
Those blunders which involved nonradio conditions wer- detected immediately
and the controllers issued instructions to turn/climb the aircraft on the
adjacent ILS.
A 30-degree blunder in which the controller had radio communications,
however, created a specific problem. When an aircraft on Runway 17L began
a 30-degree left/right turn, the controllers would instruct the aircraft to
turn right/left and join the ILS. The computer would then turn the
aircraft back towards the ILS. However, the aircraft's angle of approach
back to the ILS was such that the aircraft flew through the ILS course and
then proceeded towards the No Transgression Zone (NTZ) before making
another turn back to the ILS course (see figure I). In several situations,
the controllers would turn an aircraft on the outside ILS to separate it
from the first 30-degree turn, and then the controller on the opposite,
outside ILS would turn the aircraft in his control to separate it from the
blundering aircraft when it flew through the ILS course the second time.
NAVIGATION: The navigation parameters programmed in the computer created a
situation which eliminated the 10 and 20-degree blunders with radio
communications. The navigation parameters allowed the aircraft to deviate
either side of the centerline of the ILS along the entire final approach
course. The amount of deviation did reduce as the aircraft came closer to
the end of the runway. The controllers would detect the deviation and
instruct the aircraft to turn left/right and joir the ILS. The large
volume of turn and join clearances completely eliminated the 10 and
H-9
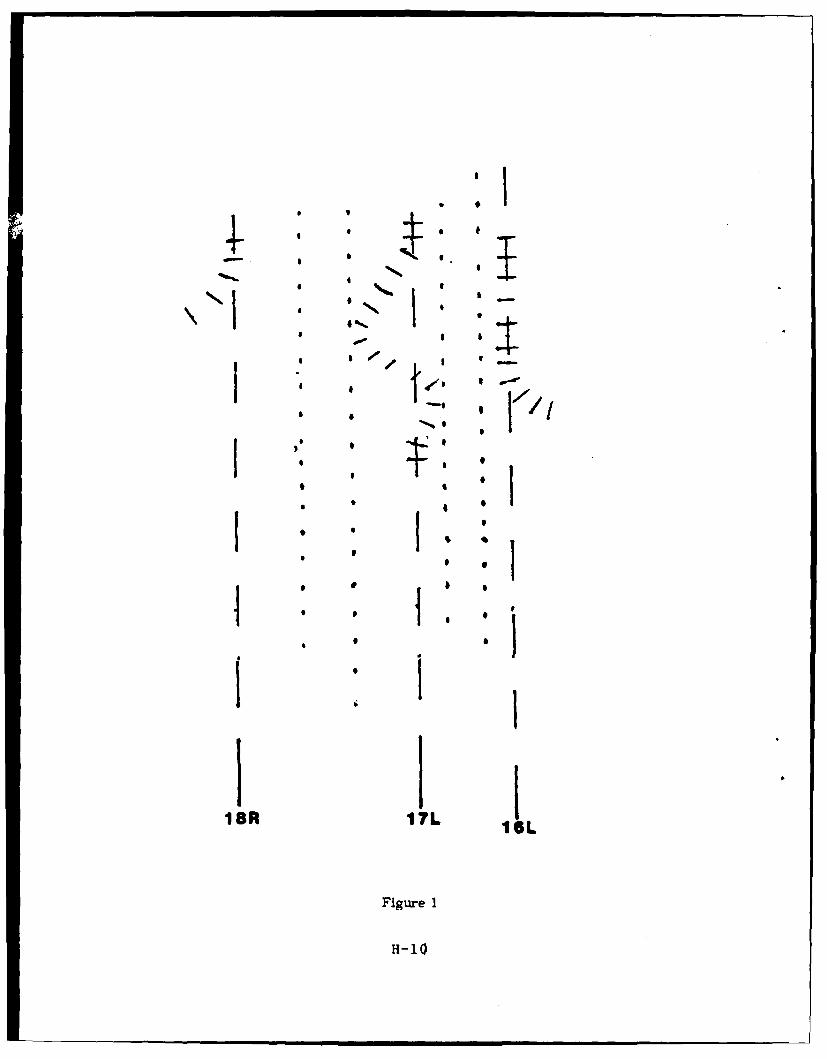
IR 7III IL I Ln
F I
H-10
IIe i / n -
* I
SI~ '
* ' !
18R IL 161
Figure 1
H-i 0
20-degree blunders with radio communications, which had been scripted into
the simulation. In the vast majority of the 36 runs, these turn and join
clearances were issued more than 25 times for each runway in a 1-hour run.
PILOTS: Simulation pilots were a major concern because simulation results
could be greatly affected by the ability of the pilots. During the course
of the simulation, pilot error fell into two categories.
a. Human Error - Slow response to aircraft calls and the entry or
control instructions.
b. Computer Problems - Entry problems which were beyond the control o,
the pilots.
The controllers and observers were unable to determine the difference, and
all the problems are combined under the general category of "pilot error."
Initially, the pilots were unfamiliar with the simulation scenarios and
their response times reflect this. During the first several runs, the
responses from the pilots improved dramatically. After the initial
improvement, the pilots generally performed at a level of competence which
allowed the simulation to achieve realistic results. Overall, the pilots
performed in an outstanding manner and are to be commended.
EQUIPMENT: During the simulation, we encountered some minor computer
problems and scope failures which were an inconvenience to the simulation.
H-il
However, the controllers were able to handle the indicator failures which
occurred in the middle of two runs without any difficulty. The indicator
failures were unplanned but added realism to the evaluation. The failures
also provided support to the proposed final monitor equipwca ..
RUNS: The information contained in Annexes 1 (Dual) and 2 (Triple)
provides a brief explanation of the occasions in which a blundering
aircraft came within 3,000 feet or less slant range of an aircraft on the
adjacent ILS courses. The following is a brief explanation of the
information. The first sections contain run number, date, start time,
runways used, and controller assignment. The second section outlines the
blunder. The aircraft call sign that follows the time is the blundering
aircraft. The aircraft call signs which follow are those aircraft which
were affected by this blunder. Under each of these aircraft is the minimum
estimated lateral distance as viewed by the observers. The last section is
a brief overview of what control actions were initiated and the results.
The aircraft proximity index (API), developed by the Technical Center, is a
single value that reflects the relative seriousness or danger of the
situation. The API assigns a weight or value to each conflict, depending
on vertical and lateral distance. API facilitates the identification of
the more serious conflicts in a data base where many conflicts are present.
A figure of 100 is the maximum value of the API. Therefore, the higher the
API, the closer the aircraft. It should be noted that, in the dual runs,
Run 4 produced the highest API of 77, but pilot error heavily influenced
this figure. In the triple runway runs, Run 22 produced the highest
H-12
API of 68, and it should be noted that these aircraft ha a siant range of
2,795 feet. If further explanation of the API is desired, it can be
obtained from the Technical Center.
H-13
CONCLUSION
The D/FW Metroplex Air Traffic System Plan Program Office is thoroughly
convinced that the triple, parallel ILS simulation was a complete success.
The triple, parallel ILS simulation proved without a doubt that, with
existing equipment and the runway layout available at Dallas/Fort Worth
International Airport, these procedures are safe. The failure of the radar
indicators during the simulation only serves to emphasis the controllers'
ability to resolve the problems when they occur and supports the
feasibility of triple parallel ILS approaches.
H-14
RSCOMNMKDTIONS
During the simulation, events occurred which created problems and delayed
some of the runs. These events included both hardware and software
problems with the computer, inexperience of the pilots, and the
unfamiliarity of the participating controllers. The major problem was the
result of the computer failures which delayed some of the runs and required
overtime for the controllers to return to the prescribed schedule. The
strain on the controllers created by the importance and visibility of this
simulation was exhausting. The importance of these simulations is such
that a failure due to fatigue should never occur. Therefore the D/FW
Metroplex Air Traffic System Plan Program Office proposes the following
changes in future simulations.
a. Makeup time should be scheduled during any simulation to resolve
computer problems.
b. The maximum number of 1-hour runs should be five each day with no
exceptions.
c. Additional controllers should be available.
d. The first full day should be devoted to indoctrination and
familiarization for both the controllers and pilots.
H-15

ANNEX 1
(DUALS)
H- 16
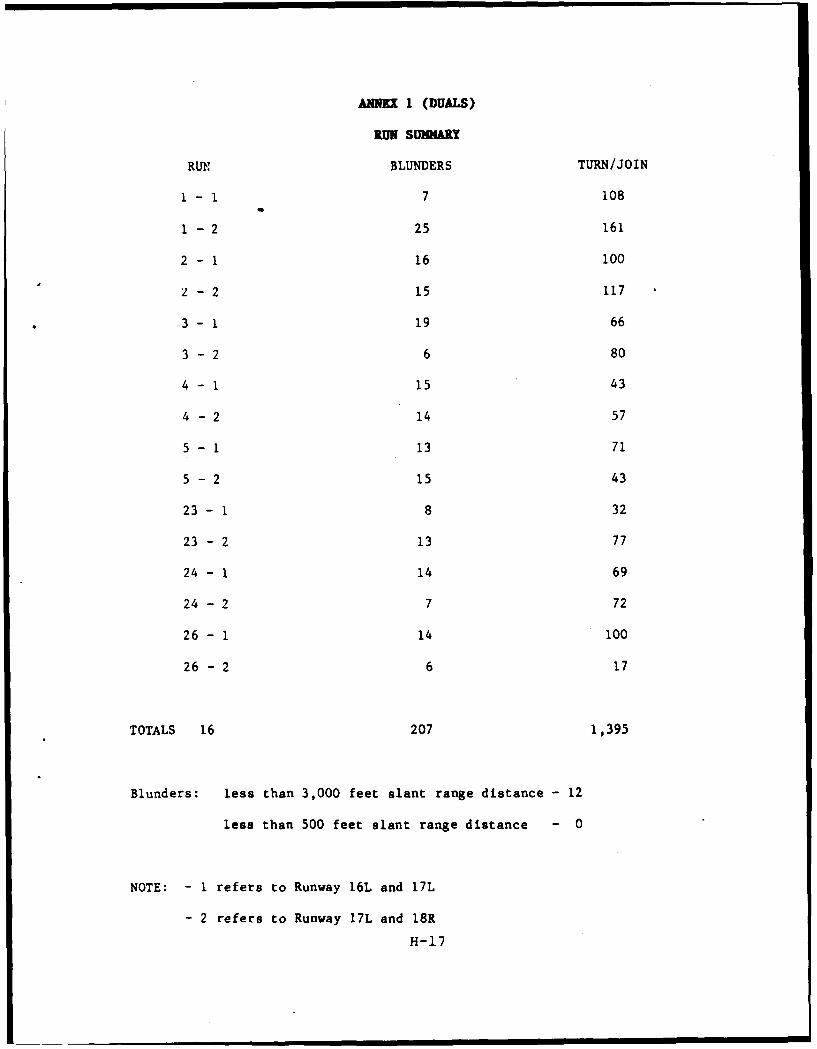
ANN 1 (DUALS)
RUN SUMMARY
RUN BLUNDERS TURN/JOIN
- 1 7 108
1 - 2 25 161
2 - 1 16 100
2 - 2 15 117
3 - 1 19 66
3 - 2 6 80
4 - 1 15 43
4 - 2 14 57
5 - 1 13 71
5 - 2 15 43
23 - 1 8 32
23 - 2 13 77
24 - 1 14 69
24 - 2 7 72
26 - 1 14 100
26 - 2 6 17
TOTALS 16 207 1,395
Blunders: less than 3,000 feet slant range distance - 12
less than 500 feet slant range distance - 0
NOTE: - 1 refers to Runway 16L and 17L
- 2 refers to Runway 17L and 18R
H-17
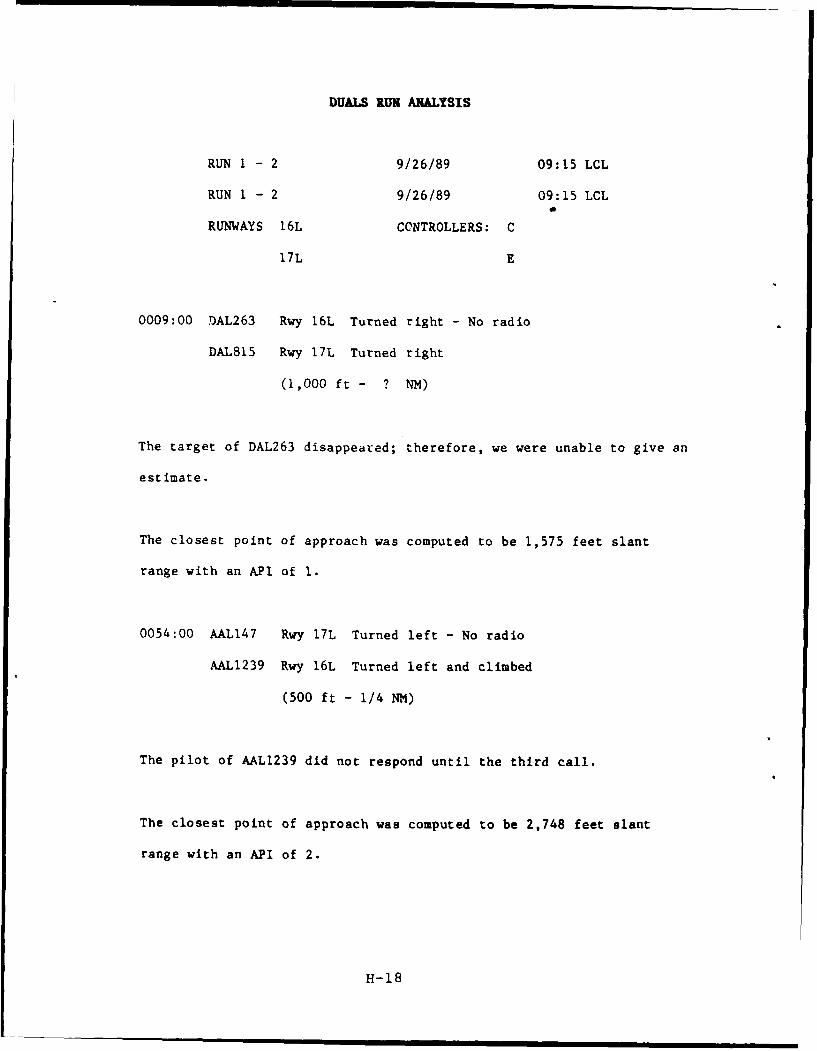
DUALS RUN ANALYSIS
RUN 1 - 2 9/26/89 09:15 LCL
RUN 1 - 2 9/26/89 09:15 LCL
RUNWAYS 16L CONTROLLERS: C
17L E
0009:00 DAL263 Rwy 16L Turned right - No radio
DAL815 Rwy 17L Turned right
(1,000 ft - ? NM)
The target of DAL263 disappeared; therefore, we were unable to give an
estimate.
The closest point of approach was computed to be 1,575 feet slant
range with an API of 1.
0054:00 AAL147 Rwy 17L Turned left - No radio
AAL1239 Rwy 16L Turned left and climbed
(500 ft - 1/4 NM)
The pilot of AAL1239 did not respond until the third call.
The closest point of approach was computed to be 2,748 feet slant
range with an API of 2.
H-18
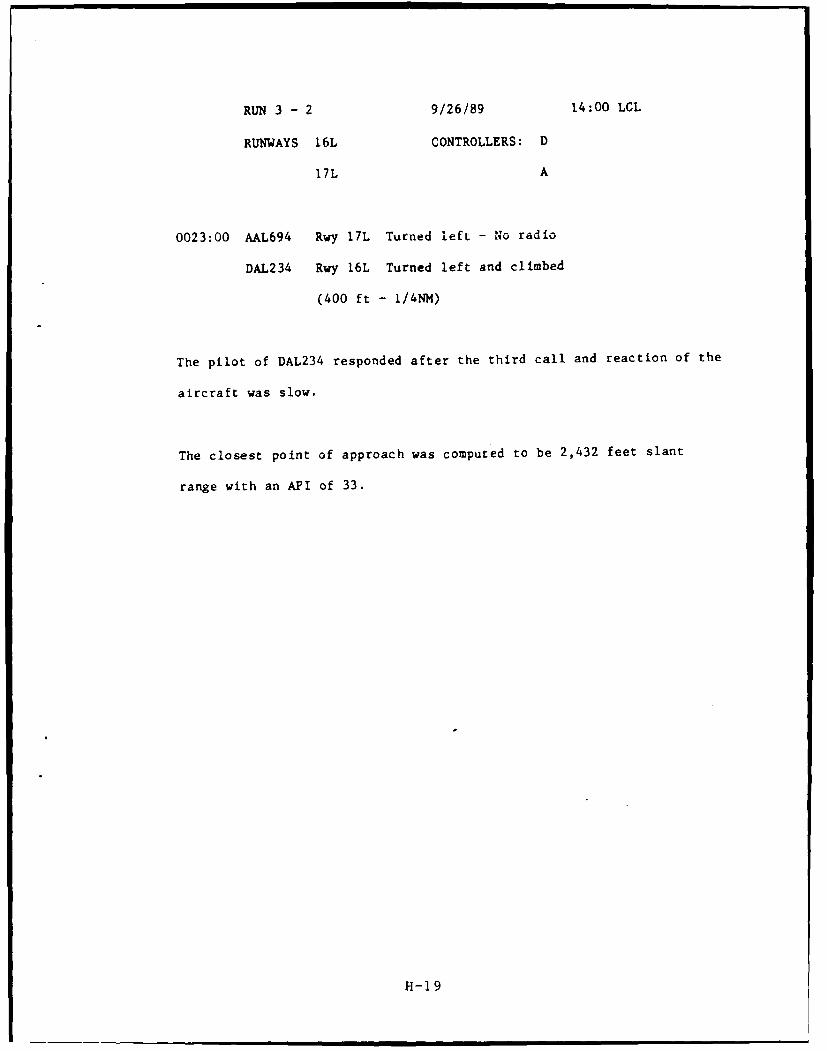
RUN 3 - 2 9/26/89 14:00 LCL
RUNWAYS 16L CONTROLLERS: D
17L A
0023:00 AAL694 Rwy 17L Turned left - No radio
DAL234 Rvy 16L Turned left and climbed
(400 ft - I/4NM)
The pilot of DAL234 responded after the third call and reaction of the
aircraft was slow.
The closest point of approach was computed to be 2,432 feet slant
range with an API of 33.
M-19
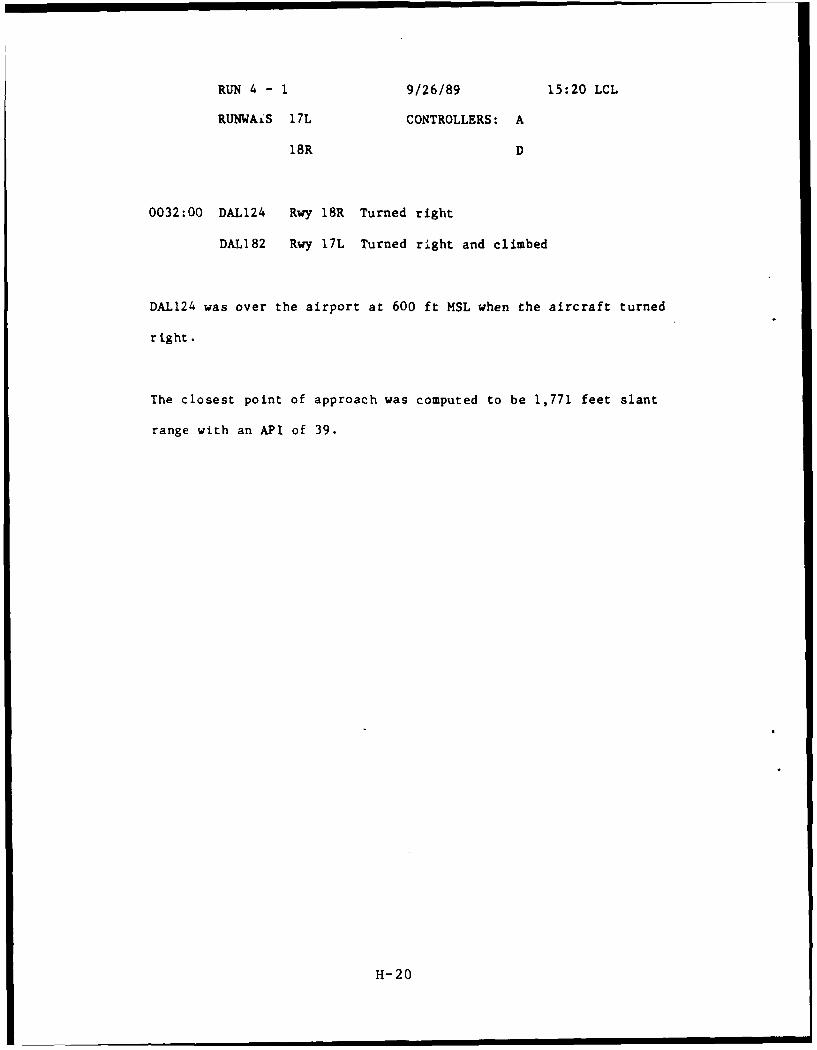
RUN 4 - 1 9/26/89 15:20 LCL
RUNWAILS 17L CONTROLLERS: A
18R D
0032:00 DAL124 Rwy 18R Turned right
DAL182 Rwy 17L Turned right and climbed
DAL124 was over the airport at 600 ft MSL when the aircraft turned
right.
The closest point of approach was computed to be 1,771 feet slant
range with an API of 39.
H-20
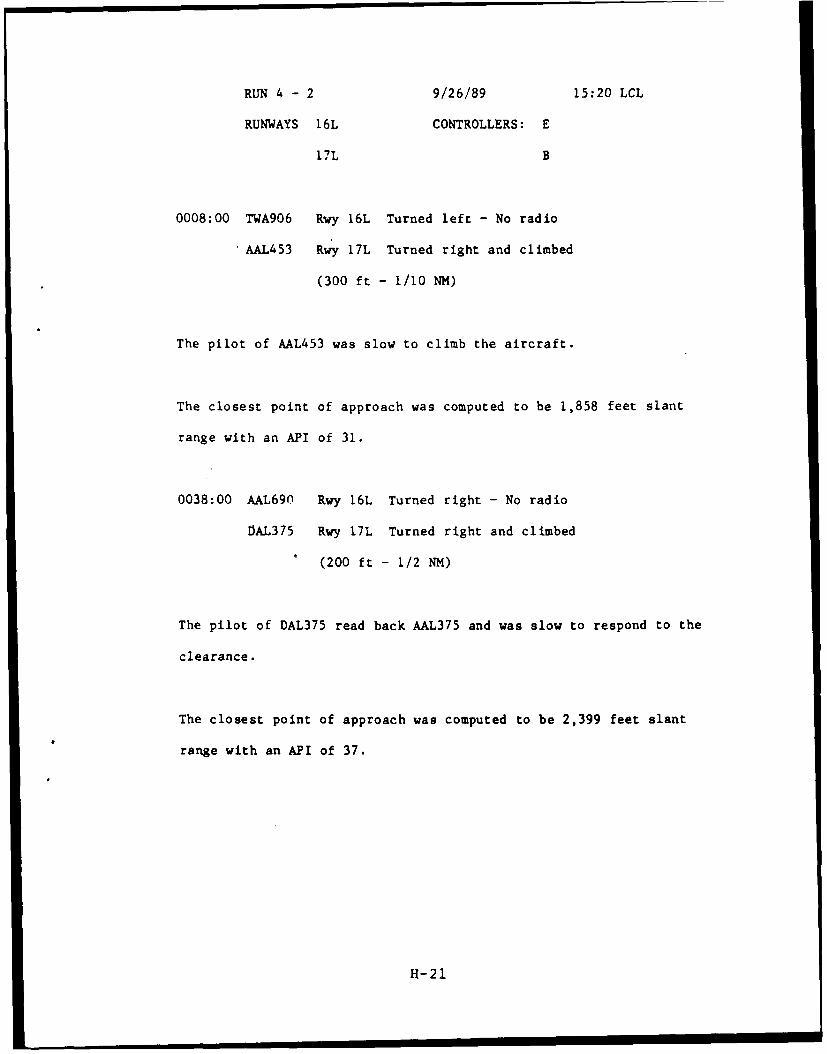
RUN 4 - 2 9/26/89 15:20 LCL
RUNWAYS 16L CONTROLLERS: E
17L B
0008:00 TWA906 Rwy 16L Turned left - No radio
AAL453 Rwy 17L Turned right and climbed
(300 ft - 1/10 NM)
The pilot of AAL453 was slow to climb the aircraft.
The closest point of approach was computed to be 1,858 feet slant
range with an API of 31.
0038:00 AAL690 Rwy 16L Turned right - No radio
6AL375 Rwy 17L Turned right and climbed
(200 ft - 1/2 NM)
The pilot of DAL375 read back AAL375 and was slow to respond to the
clearance.
The closest point of approach was computed to be 2,399 feet slant
range with an API of 37.
H-21
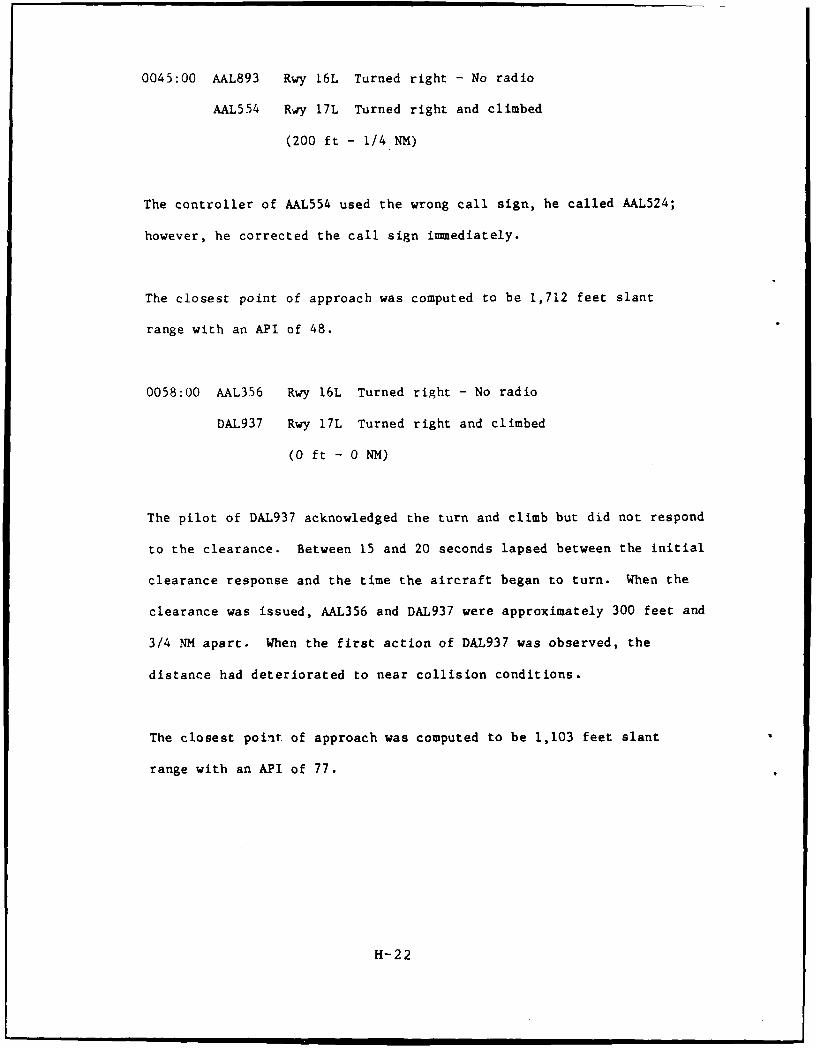
0045:00 AAL893 Rwy 16L Turned right - No radio
AAL554 Rwy 17L Turned right and climbed
(200 ft - 1/4 NM)
The controller of AAL554 used the wrong call sign, he called AAL524;
however, he corrected the call sign immediately.
The closest point of approach was computed to be 1,712 feet slant
range with an API of 48.
0058:00 AAL356 Rwy 16L Turned right - No radio
DAL937 Rwy 17L Turned right and climbed
(0 ft - 0 NM)
The pilot of DAL937 acknowledged the turn and climb but did not respond
to the clearance. Between 15 and 20 seconds lapsed between the initial
clearance response and the time the aircraft began to turn. When the
clearance was issued, AAL356 and DAL937 were approximately 300 feet and
3/4 NM apart. When the first action of DAL937 was observed, the
distance had deteriorated to near collision conditions.
The closest point of approach was computed to be 1,103 feet slant
range with an API of 77.
H-22
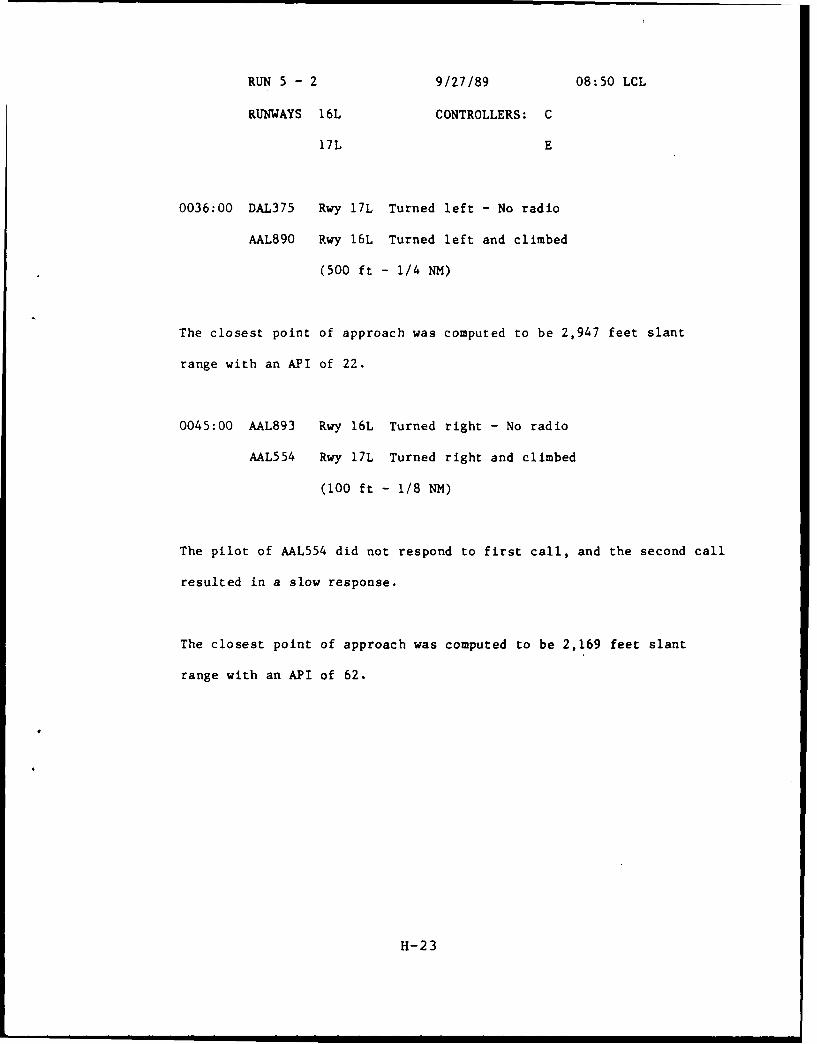
RUN 5 - 2 9/27/89 08:50 LCL
RUNWAYS 16L CONTROLLERS: C
17L E
0036:00 DAL375 Rwy 17L Turned left - No radio
AAL890 Rwy 16L Turned left and climbed
(500 ft - 1/4 NM)
The closest point of approach was computed to be 2,947 feet slant
range with an API of 22.
0045:00 AAL893 Rwy 16L Turned right - No radio
AAL554 Rwy 17L Turned right and climbed
(100 ft - 1/8 NM)
The pilot of AAL554 did not respond to first call, and the second call
resulted in a slow response.
The closest point of approach was computed to be 2,169 feet slant
range with an API of 62.
H-23
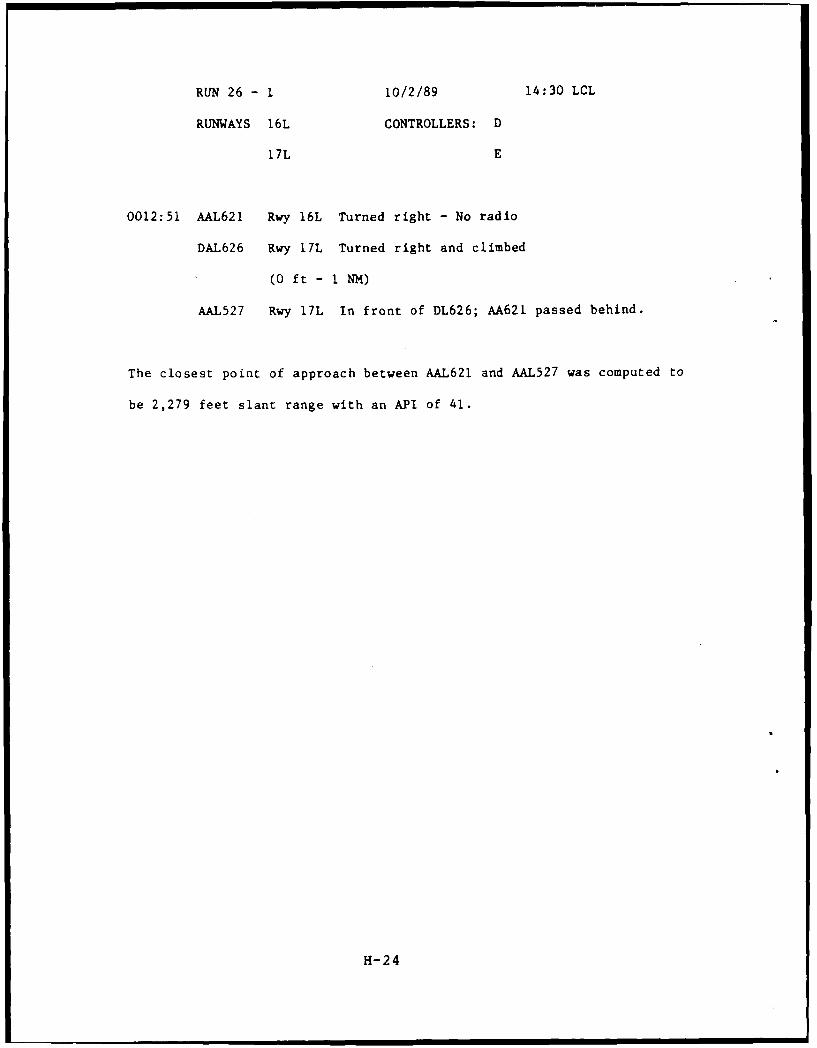
RUN 26 - 1 10/2/89 14:30 LCL
RUNWAYS 16L CONTROLLERS: D
17L E
0012:51 AAL621 Rwy 16L Turned right - No radio
DAL626 Rwy 17L Turned right and climbed
(0 ft - I NM)
AAL527 Rwy 17L In front of DL626; AA621 passed behind.
The closest point of approach between AAL621 and AAL527 was computed to
be 2,279 feet slant range with an API of 41.
H-24
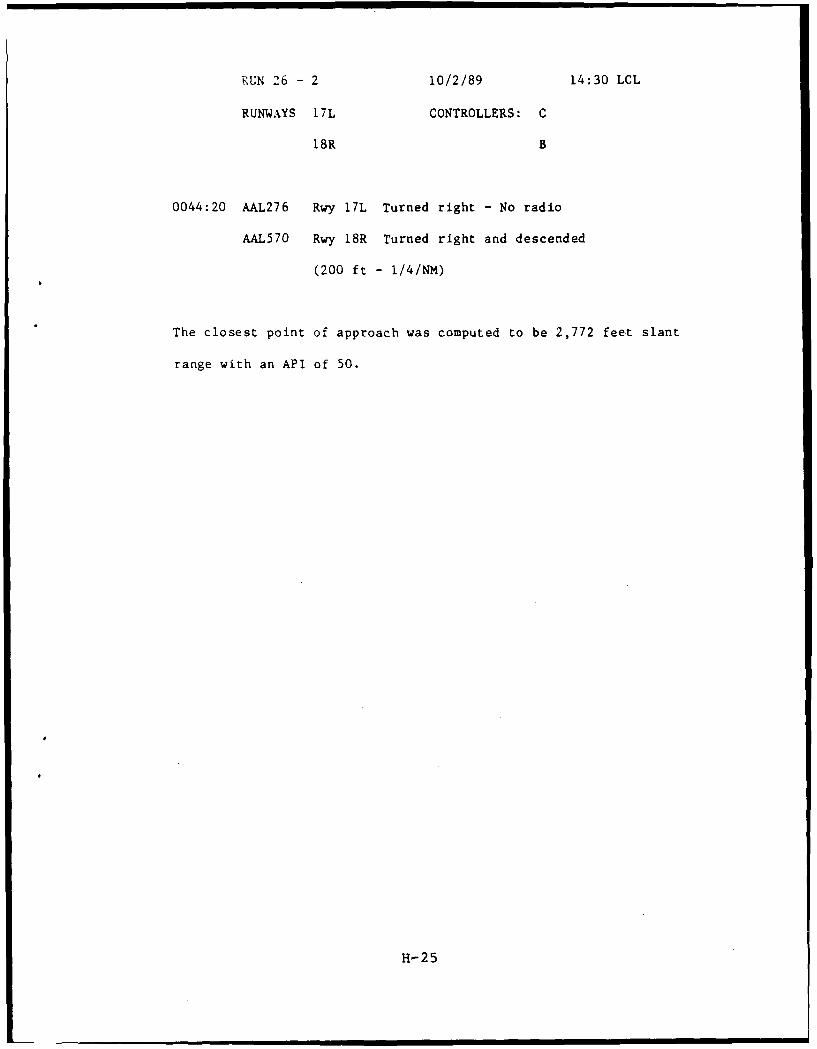
RUN 26 - 2 10/2/89 14:30 LCL
RUNWAYS 17L CONTROLLERS: C
18R B
0044:20 AAL276 Rwy 17L Turned right - No radio
AAL570 Rwy 18R Turned right and descended
(200 ft - 1/4/NM)
The closest point of approach was computed to be 2,772 feet slant
range with an API of 50.
H-25

ANNEX 2
(TRIPLES)
1- 26
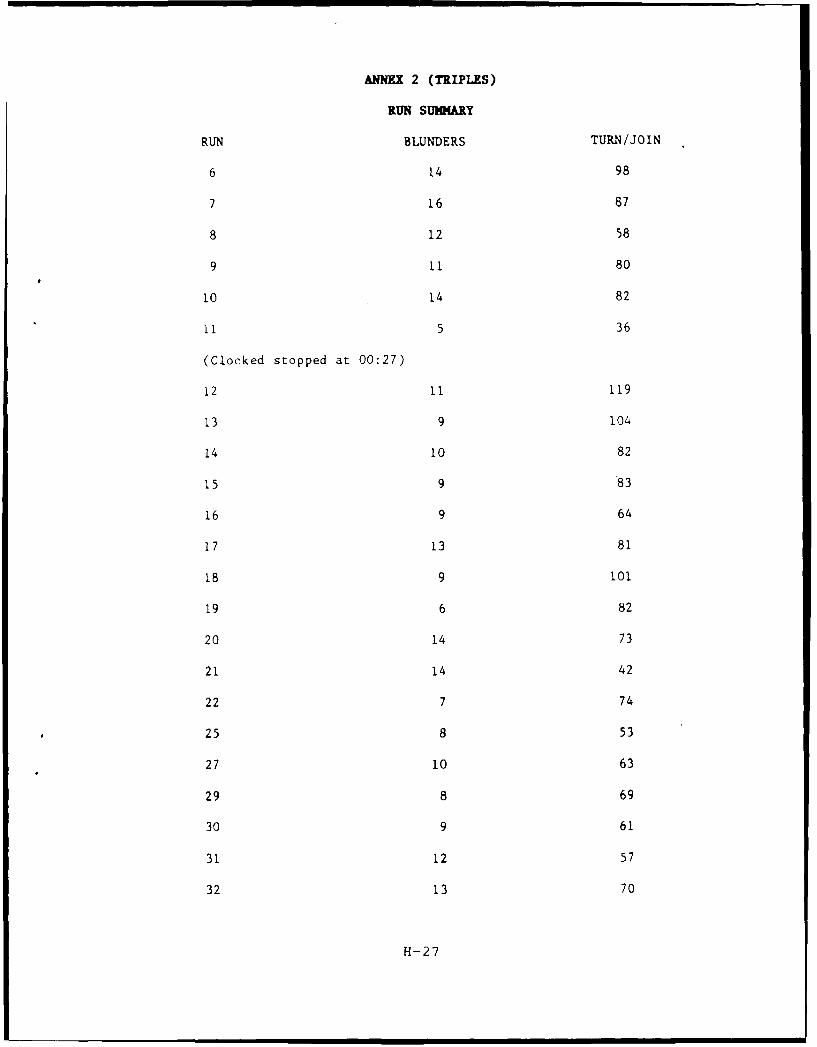
ANNEX 2 (TRIPLES)
RUN SUNHARY
RUN BLUNDERS TURN/JOIN
6 14 98
7 16 87
8 12 58
9 11 80
10 14 82
11 5 36
(Clocked stopped at 00:27)
12 11 119
13 9 104
14 10 82
15 9 83
16 9 64
17 13 81
18 9 101
19 6 82
20 14 73
21 14 42
22 7 74
*25 8 53
27 10 63
29 8 69
30 9 61
31 12 57
32 13 70
H-27
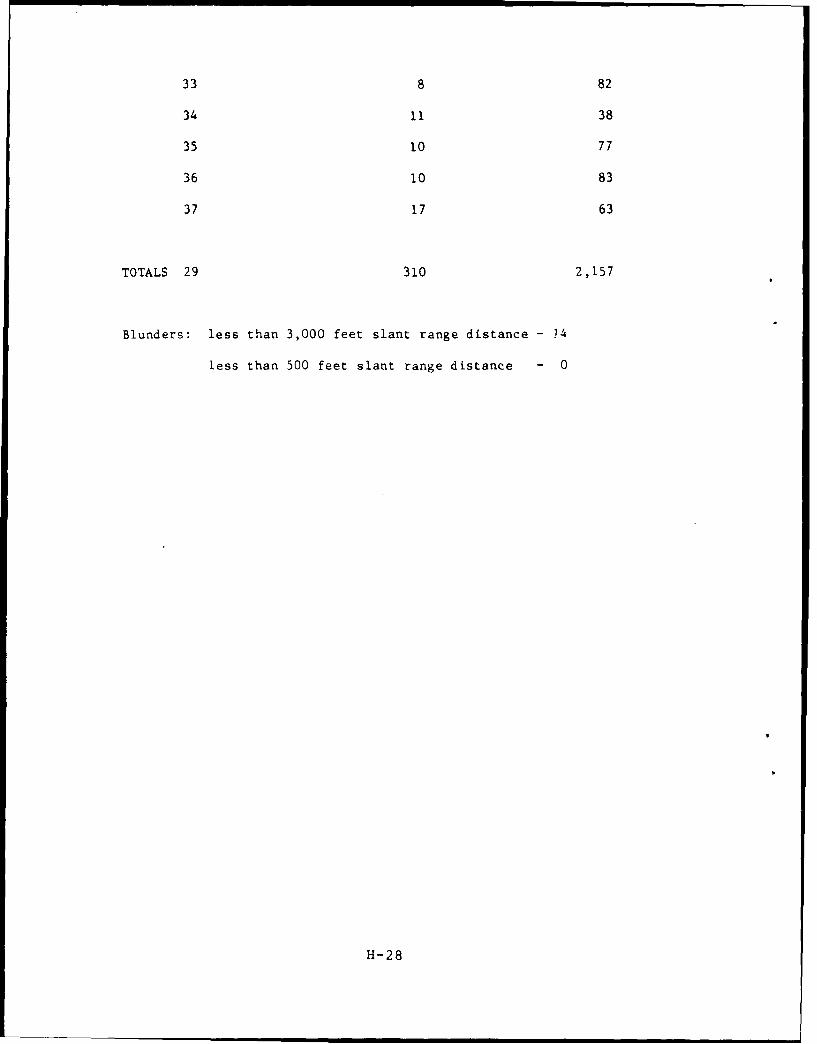
33 8 82
34 11 38
35 10 77
36 10 83
37 17 63
TOTALS 29 310 2,157
Blunders: less than 3,000 feet slant range distance - 14
less than 500 feet slant range distance - 0
H-28
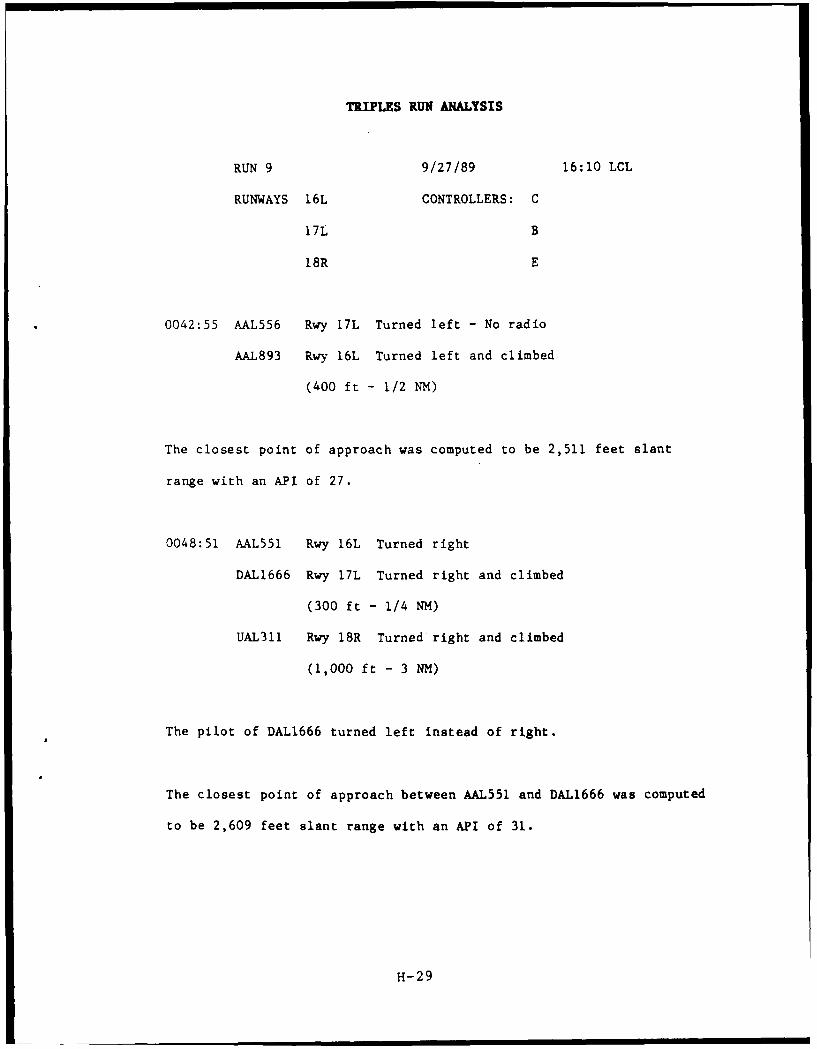
TRIPLES RUN ANALYSIS
RUN 9 9/27/89 16:10 LCL
RUNWAYS 16L CONTROLLERS: C
17L B
18R E
0042:55 AAL556 Rwy 17L Turned left - No radio
AAL893 Rwy 16L Turned left and climbed
(400 ft - 1/2 NM)
The closest point of approach was computed to be 2,511 feet slant
range with an API of 27.
0048:51 AAL551 Rwy 16L Turned right
DAL1666 Rwy 17L Turned right and climbed
(300 ft - 1/4 NM)
UAL311 Rwy 18R Turned right and climbed
(1,000 ft - 3 NM)
The pilot of DAL1666 turned left instead of right.
The closest point of approach between AAL551 and DAL1666 was computed
to be 2,609 feet slant range with an API of 31.
H-29
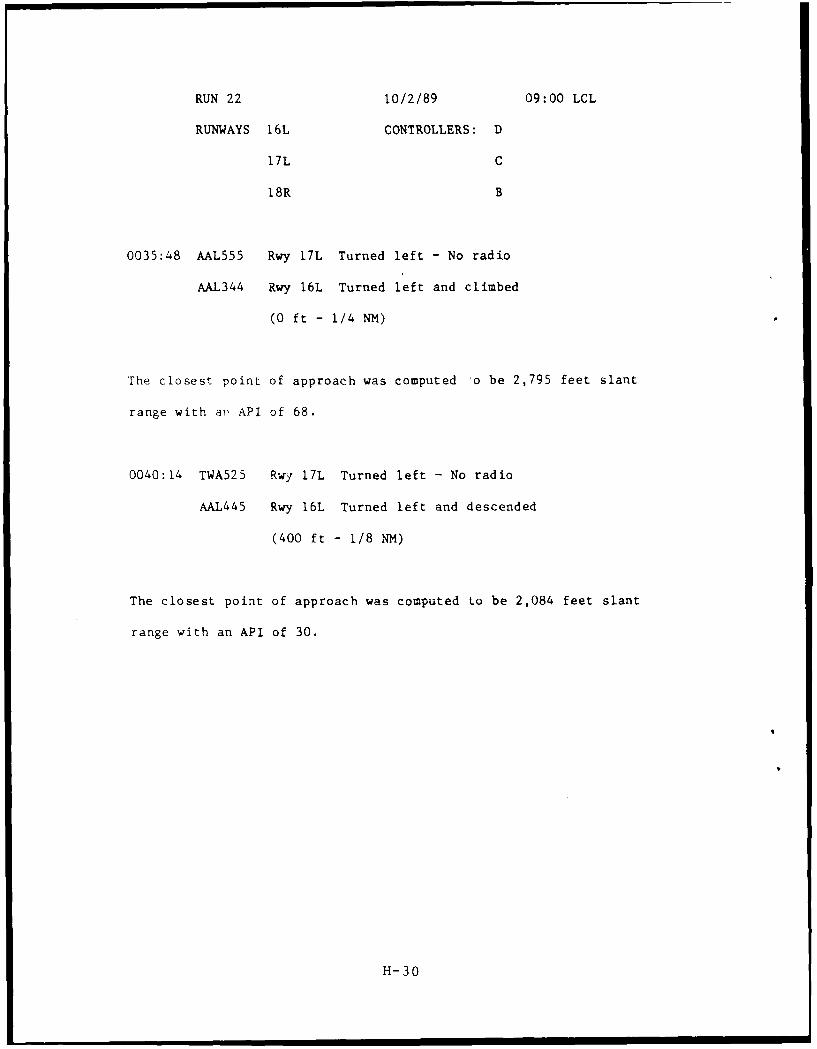
RUN 22 10/2/89 09:00 LCL
RUNWAYS 16L CONTROLLERS: D
17L C
18R B
0035:48 AAL555 Rwy 17L Turned left - No radio
AAL344 Rwy 16L Turned left and climbed
(0 ft - 1/4 NM)
The closest point of approach was computed *o be 2,795 feet slant
range with a" API of 68.
0040:14 TWA525 Rwy 17L Turned left - No radio
AAL445 Rwy 16L Turned left and descended
(400 ft - 1/8 NM)
The closest point of approach was computed to be 2,084 feet slant
range with an API of 30.
H-30
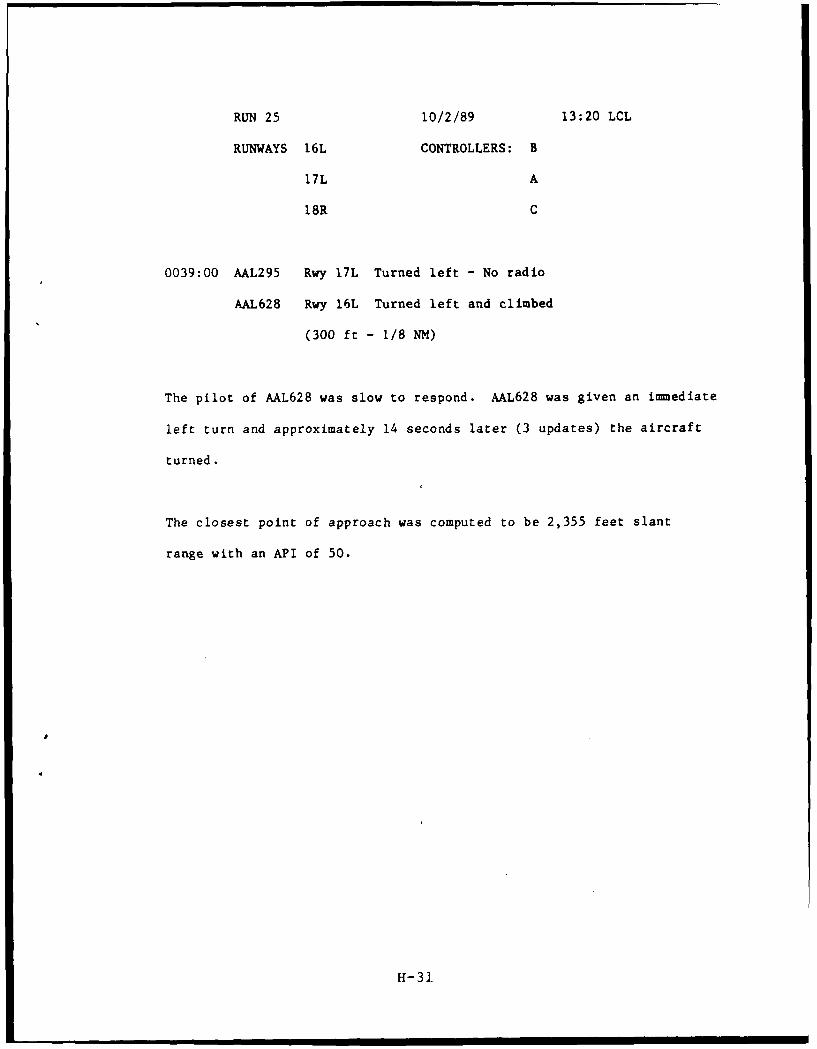
RUN 25 10/2/89 13:20 LCL
RUNWAYS 16L CONTROLLERS: B
17L A
18R C
0039:00 AAL295 Rwy 17L Turned left - No radio
AAL628 Rwy 16L Turned left and climbed
(300 ft - 1/8 NM)
The pilot of AAL628 was slow to respond. AAL628 was given an immediate
left turn and approximately 14 seconds later (3 updates) the aircraft
turned.
The closest point of approach was computed to be 2,355 feet slant
range with an API of 50.
H-31
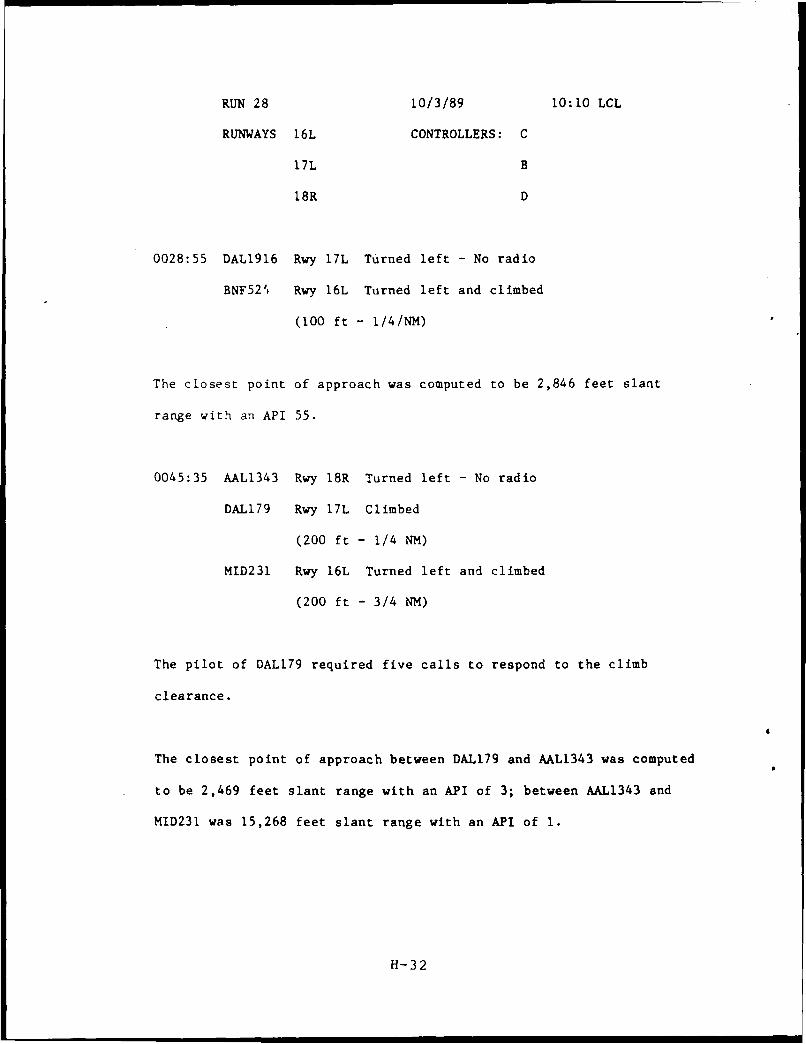
RUN 28 10/3/89 10:10 LCL
RUNWAYS 16L CONTROLLERS: C
17L B
18R D
0028:55 DAL1916 Rwy 17L Turned left - No radio
BNF52'4 Rwy 16L Turned left and climbed
(100 ft - 1/4/NM)
The closest point of approach was computed to be 2,846 feet slant
range with an API 55.
0045:35 AAL1343 Rwy 18R Turned left - No radio
DAL179 Rwy 17L Climbed
(200 ft - 1/4 NM)
MID231 Rwy 16L Turned left and climbed
(200 ft - 3/4 NM)
The pilot of DALI79 required five calls to respond to the climb
clearance.
The closest point of approach between DAL179 and AAL1343 was computed
to be 2,469 feet slant range with an API of 3; between AAL1343 and
MID231 was 15,268 feet slant range with an API of 1.
H-32
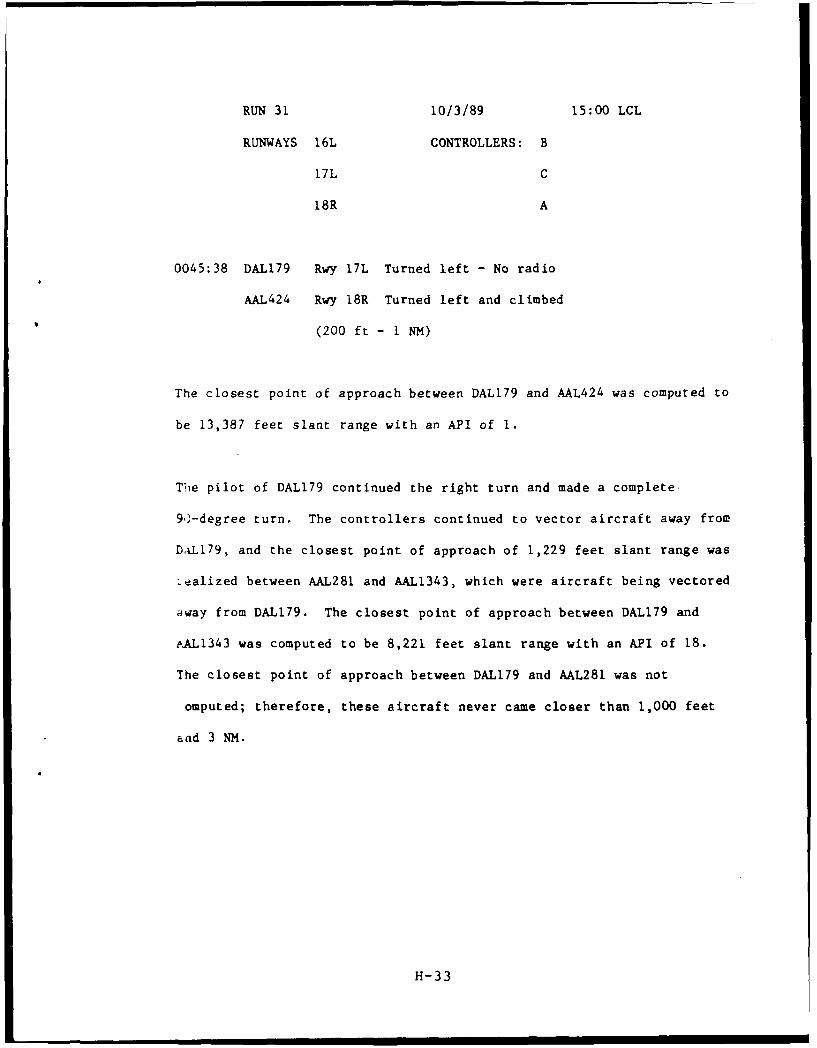
RUN 31 10/3/89 15:00 LCL
RUNWAYS 16L CONTROLLERS: B
17L C
18R A
0045:38 DAL179 Rwy 17L Turned left - No radio
AAL424 Rwy 18R Turned left and climbed
(200 ft - i NM)
The closest point of approach between DALl79 and AAL424 was computed to
be 13,387 feet slant range with an API of 1.
The pilot of DALI79 continued the right turn and made a complete
90-degree turn. The controllers continued to vector aircraft away from
D.)179, and the closest point of approach of 1,229 feet slant range was
iealized between AAL281 and AAL1343, which were aircraft being vectored
away from DALI79. The closest point of approach between DAL179 and
PAL1343 was computed to be 8,221 feet slant range with an API of 18.
The closest point of approach between DALI79 and AAL281 was not
omputed; therefore, these aircraft never came closer than 1,000 feet
&ad 3 NM.
H-33
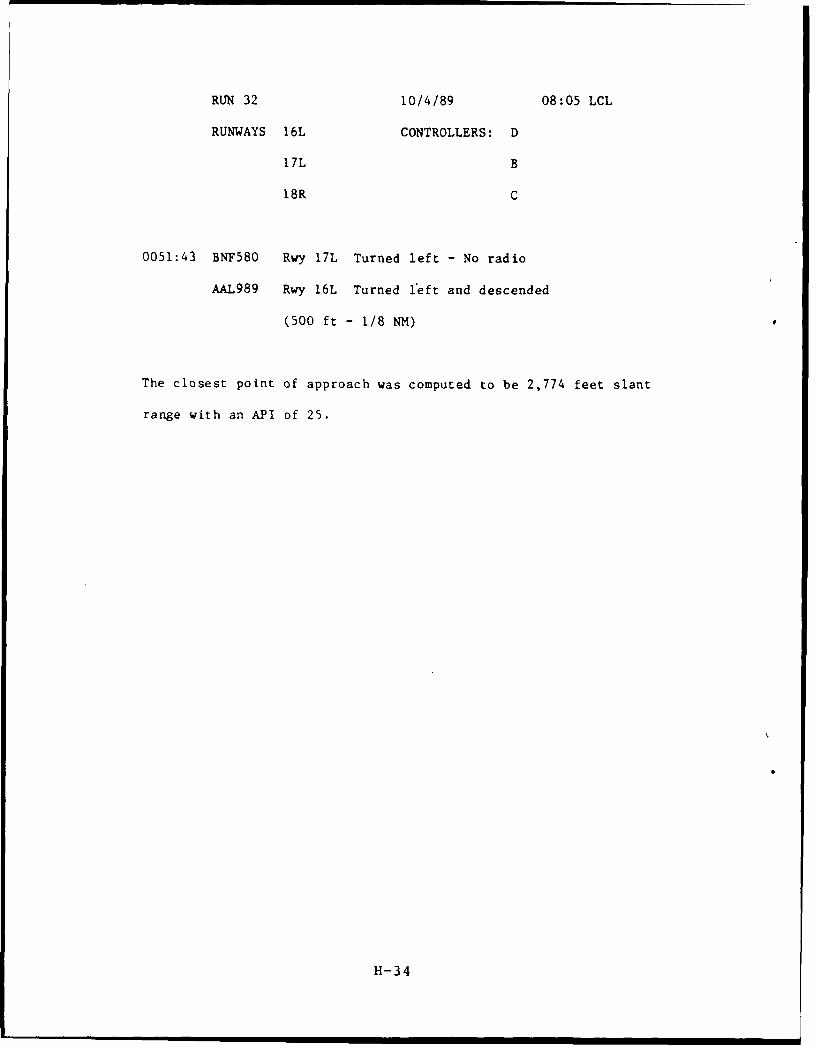
RUN 32 10/4/89 08:05 LCL
RUNWAYS 16L CONTROLLERS: D
17L B
I8R C
0051:43 BNF580 Rwy 17L Turned left - No radio
AAL989 Rwy 16L Turned left and descended
(500 ft - 1/8 NM)
The closest point of approach was computed to be 2,774 feet slant
range with an API of 25.
H-34
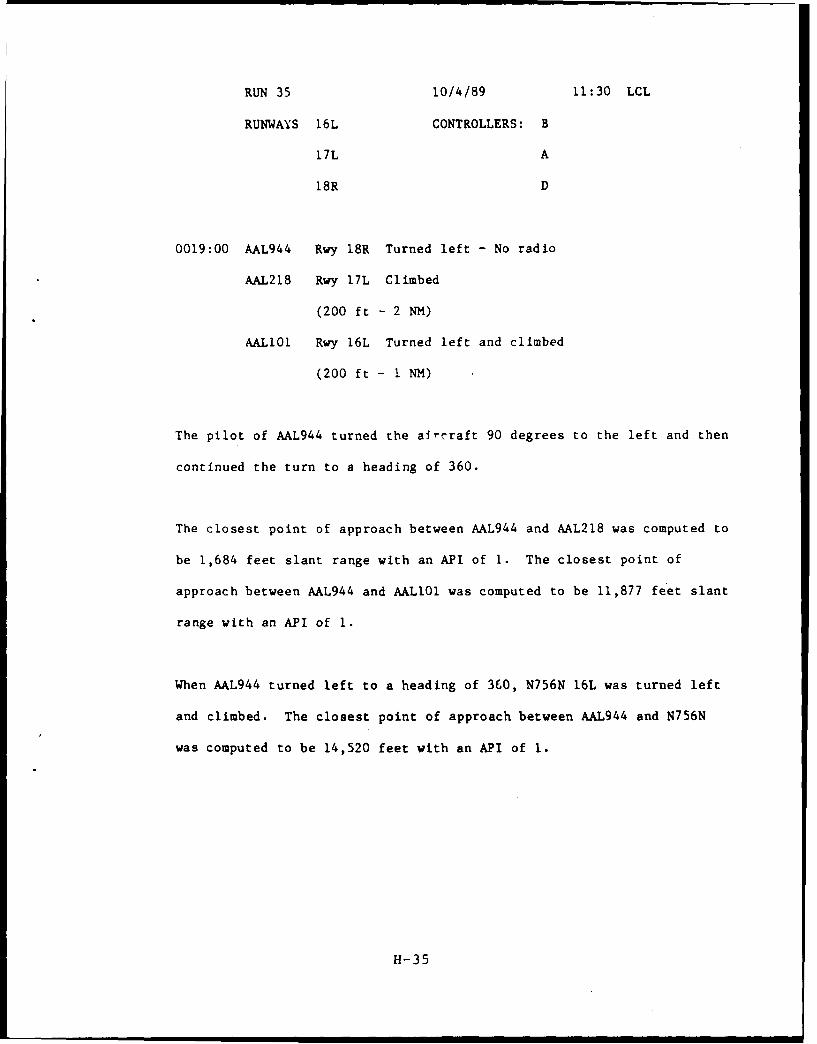
RUN 35 10/4/89 11:30 LCL
RUNWAYS 16L CONTROLLERS: B
17L A
18R D
0019:00 AAL944 Rwy 18R Turned left - No radio
AAL218 Rwy 17L Climbed
(200 ft - 2 NM)
AALIOI Rwy 16L Turned left and climbed
(200 ft - 1 NM)
The pilot of AAL944 turned the aircraft 90 degrees to the left and then
continued the turn to a heading of 360.
The closest point of approach between AAL944 and AAL218 was computed to
be 1,684 feet slant range with an API of I. The closest point of
approach between AAL944 and AALIO1 was computed to be 11,877 feet slant
range with an API of 1.
When AAL944 turned left to a heading of 360, N756N 16L was turned left
and climbed. The closest point of approach between AAL944 and N756N
was computed to be 14,520 feet with an API of 1.
H-35
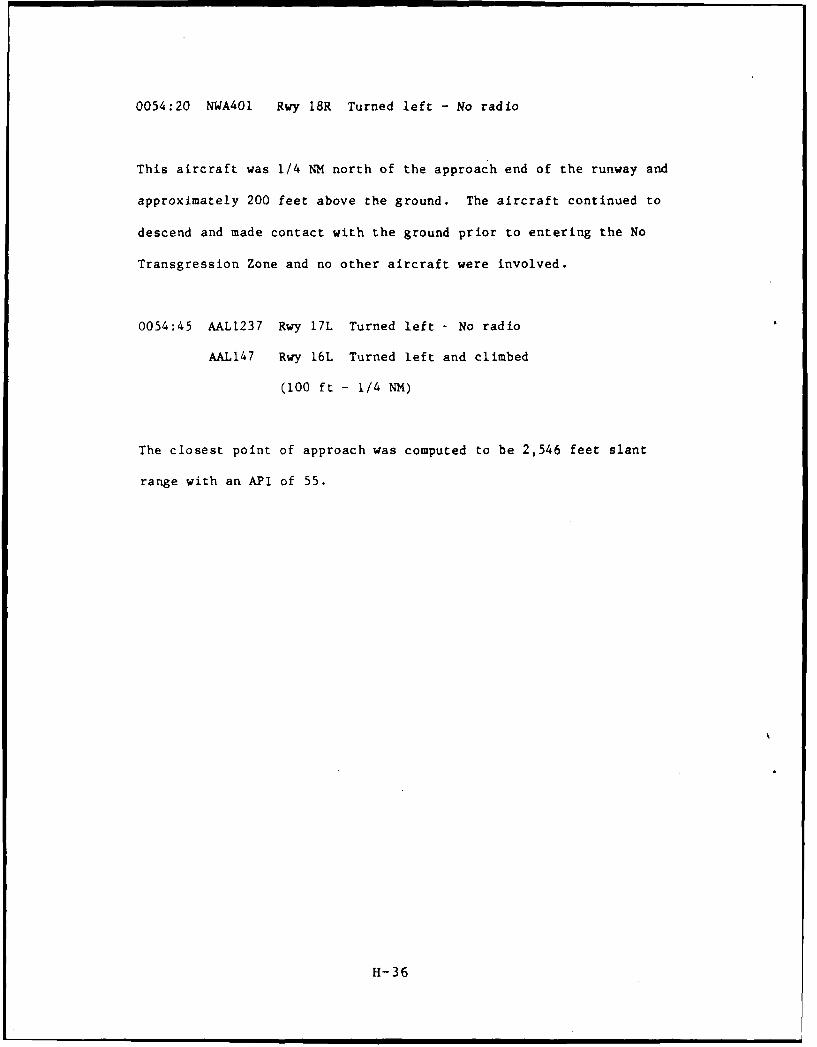
0054:20 NWA40I Rwy 18R Turned left - No radio
This aircraft was 1/4 NM north of the approach end of the runway and
approximately 200 feet above the ground. The aircraft continued to
descend and made contact with the ground prior to entering the No
Transgression Zone and no other aircraft were involved.
0054:45 AAL1237 Rwy 17L Turned left - No radio
AAL147 Rwy 16L Turned left and climbed
(100 ft - 1/4 NM)
The closest point of approach was computed to be 2,546 feet slant
range with an API of 55.
H-36
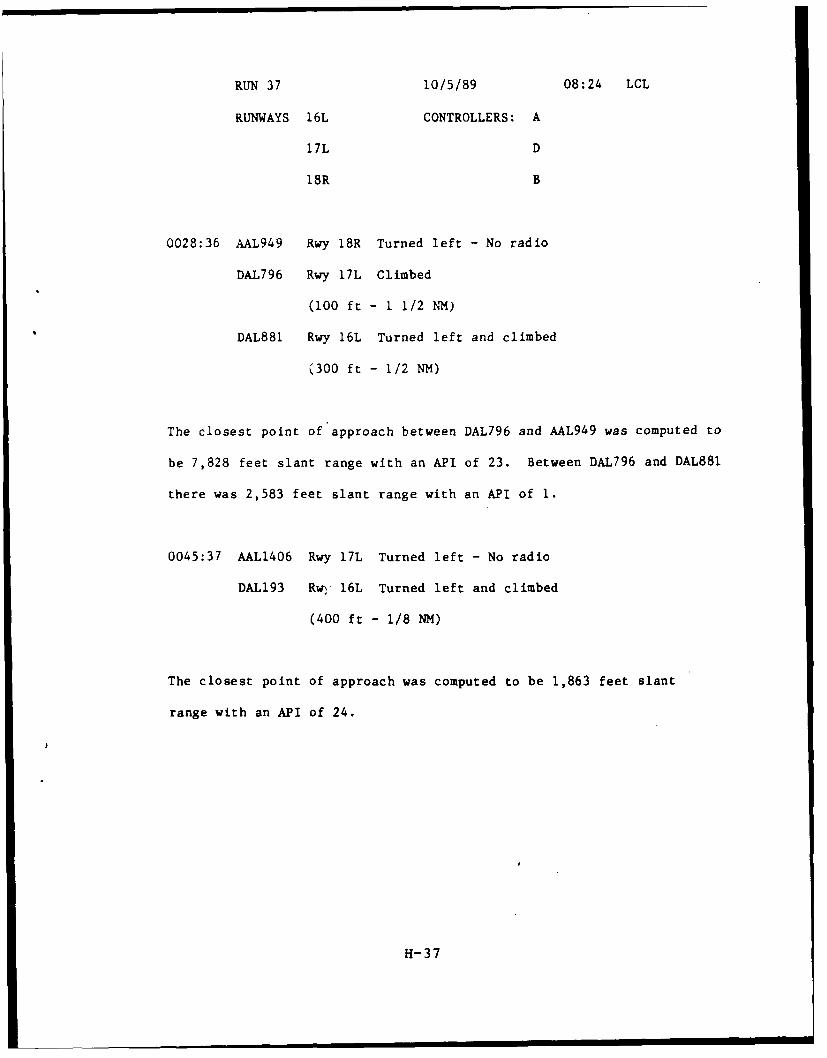
RUN 37 10/5/89 08:24 LCL
RUNWAYS 16L CONTROLLERS: A
17L D
18R B
0028:36 AAL949 Rwy 18R Turned left - No radio
DAL796 Rwy 17L Climbed
(100 ft - 1 1/2 NM)
DAL881 Rwy 16L Turned left and climbed
(300 ft - 1/2 NM)
The closest point of approach between DAL796 and AAL949 was computed to
be 7,828 feet slant range with an API of 23. Between DAL796 and DAL881
there was 2,583 feet slant range with an API of 1.
0045:37 AAL1406 Rwy 17L Turned left - No radio
DAL193 Rwy 16L Turned left and climbed
(400 ft - 1/8 NM)
The closest point of approach was computed to be 1,863 feet slant
range with an API of 24.
H-37
APPENDIX I
CONTROLLER REPORT
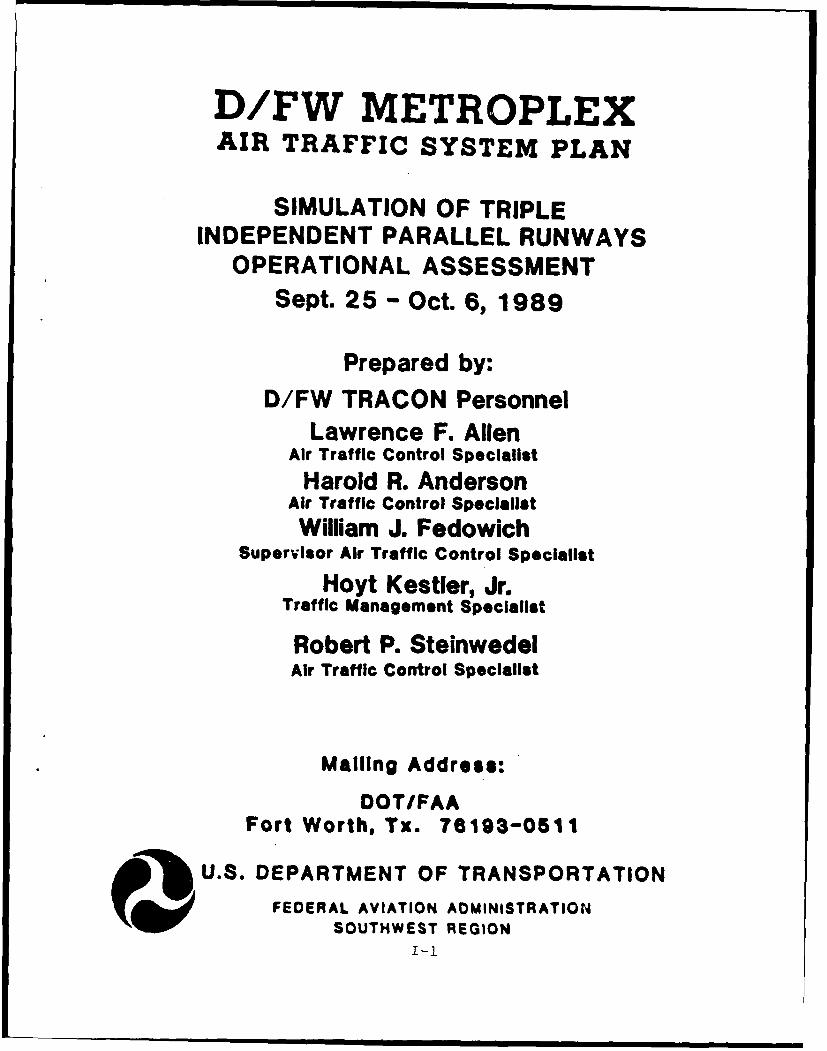
D/FW METROPLEXAIR TRAFFIC SYSTEM PLAN
SIMULATION OF TRIPLEINDEPENDENT PARALLEL RUNWAYS
OPERATIONAL ASSESSMENTSept. 25 -Oct. 6, 1989
Prepared by:D/FW TRACON Personnel
Lawrence F. AllenAir Traffic Control Specialist
Harold R. AndersonAir Traffic Control SpecialistWilliam J. Fedowich
Supervisor Air Traffic Control Specialist
Hoyt Kestler, Jr.Traffic Management Specialist
Robert P. SteinwedelAir Traffic Control Specialist
Mailing Address:
DOT/FAAFort Worth, Tx. 76193-0511
SU.. DEPARTMENT OF TRANSPORTATION
FEDERAL AVIATION ADMINISTRATIONSOUTHWEST REGION
I-1
TABLE OF CONTENTS
EXECUTIVE SUMMARY
INTRODUCTION
ANALYSIS
CONCLUSIONS
RECOMMENDATIONS
FEDERAL AVIATION ADMINISTRATION TECHNICAL CENTER
DFW TERMINAL RADAR APPROACH CONTROL
1-2
EXECUTIVE SUMMARY
Our task was to evaluate the feasibility of running triple independentinstrument landing system (ILS) approaches to runways 18R, 17L, and 16Lat Dallas/Fort Worth (D/FW) Airport. The test simulated jets on approach toall three runways There were two questions we had to answer.
1. Is the proposed triple runway operation as safe as the dual runwayoperations?
2. How do the controllers view the triple runway operation with respect tosafety, ease of operation, and capacity.
Our answer to the first question is a unified and emphatic, yes. As to thesecond question, it is believed that safety can be mainta'ined with propermonitoring equipment and manning. Operations can be conducted withoutany degradation of safety while, at the same time, increase the capacity ofthe airport under instrument conditions approximately 33 percent. Wefound this phase to be completely successful in answering the assigned tasks.
1-3
INTRODUCTION
On September 25, 1 V89. a sLdf from DFW Terminal Radar Approach ControlJTRACON) consisting of three air traffic controllers, one traffic managementspecialist and an area supervisor met at the Federal AviationAdministration's (FAA) Technical Center at Atlantic City InternationalAirport, New Jersey, The purpose was to conduct the simulation of triplesimultaneous approaches at D/FW Airport.
ANALYSIS
The principle concern of the controller test 'earn was the frequency andnumber of blunders and wanderers did not realistically reflect simultaneousoperations. There were numerous simulator pilot errors and software andhardware failures that created additional problems. One of the mostchallenging was the position indicators that failed during two separatescenarios. Although these problems were distracting. we were still able toensure adequate spacing at all times. As the evalhAtion continued some ofthese problems were resolved; however, others still existed.
Our operating guidelines were not to concern ourselves with airspaceconstraints. Our only objective was to maintain an acceptable margin ofsafety at all times between the center of targets. The lowest altitude wecould use was 2000 feet. For each runway we developed our own pulloutprocedures to maximize safety of flight and decrease controller reactiontimes. We believe it was more stressful in this respect to perform themonitor function for runways 16L and 17L than runways 18R and 17L.The proximity of runway's 16L and 17L (5000 foot centerline separation)required quicker reaction times than that of runways 17L and 18R (8800foot centerline separation). Staggered aircraft on the finals were easier toreact to than a side by side operation.
The hardware and software problems necessitated the team to work 2 hoursof overtime for 2 consecutive days to maintain the simulation schedule. On 1of the 2 days six and one-half scenarios were completed with minimum turnaround times The half completed scenario was the result of a computerfailure. 1-4
CONCLUSIONS
After spending 9 days monitoring triple independent parallel approaches, wewere able to overcome the obstacles of the pilot errors, software problems,indicator failures, and controller anxieties. In spite of all of thesecircumstances, we were able to ensure flight safety at all times.
We believe that the complexity and workload of triple instrument landingsystem (ILS) approaches will be as manageable as the dual ILS approachesare today with the proper manpower, equipment, and procedures. Webelieve that the Phase II simulation study on triple independent ILSapproaches has been a total success.
I -5
RECOMMENDATIONS
FEDERAL AVIATION ADMINISTRATION TECHNICAL CENTER
1. In future tests more emphasis should be placed on overtake situationsthan on wandering and blundering aircraft. We believe this would moreclosely resemble real life situations.
2. The simulator pilots should modify or change the way they enter data.The present methods and equipment configurations make simulator pilotreaction times slow.
3. The fatigue factor is an important variable in the accomplishment of thesetests. We recommend no more than five 1 hour scenarios a day. Ifpractical, enough controllers should be provided to avoid having to workmore than two consecutive problems.
DALLAS/FORT WORTH TERMINAL RADAR APPROACH CONTROL
I To properly monitor the finals, the leader lines at DFW need to beavailable on all eight cardinal positions. Flight data information was oftenoverlapped and unreadable without this option. The flight data informationwas obscured using only the four key cardinal points.
2 We recommend that future Enhanced Target Generator (ETG) controllertraining at DFW include the final monitor positions with these type scenarios.
3. We believe a task group should be formed at DFW to established localoperating procedures and review any possible Automated Radar TrackingSystem (ARTS) changes that may be required to enhance safety.
1-6
Lawrence F. Allen Harold R. nderson
Air Traffic Control Specialist Air Traffic Control Specialist
Rohert P, Steinwedel Ho kestler, JrAir Traffic Control Specialist Traffic Management Specialist
William J. F owichSupervisor Air Traffic Control Specialist
*U.S GOVERNMENT PRINTING OFFICE: 1 -_ i ,
1-7