Embed Size (px)
Citation preview
DOT/FAA/CT-89/31 Smoke and ExtinguisherFAA Technical Center
Atlantic City International Airport IISn toAtatcCtltrainl~prNJ. 08405 Agent Dissipation in a Small
Pressurized Fuselage
01 A. AbramowitzNW. NeeseNG. Slusher
I
November 1990
Final Report
This document is available to the U.S. publicthrough the National Technical InformationService, Springfield, Virginia 22161,
SDTICU.S. Department of Transportation A941ELECTE
Federal Aviation Administration %JAN 0 9,199,n
NOTICE
This document is disseminated under the sponsorshipof the U. S. Department of Transportation in the interestof information exchange. The United States Governmentassumes no liability for the contents or use thereof.
The United States Government does not endorse productsor manufacturers. Trade or manufacturers' names appearherein solely because they are considered essential to theobjective of this report.
Techtnical Report Documentation Page1. Report No. 2. Government Accession No. 3. Recipient's Calolg No.
DOT/FAA/CT-89/31
i. Title and Subtitle S. Report OatsNovember 1990
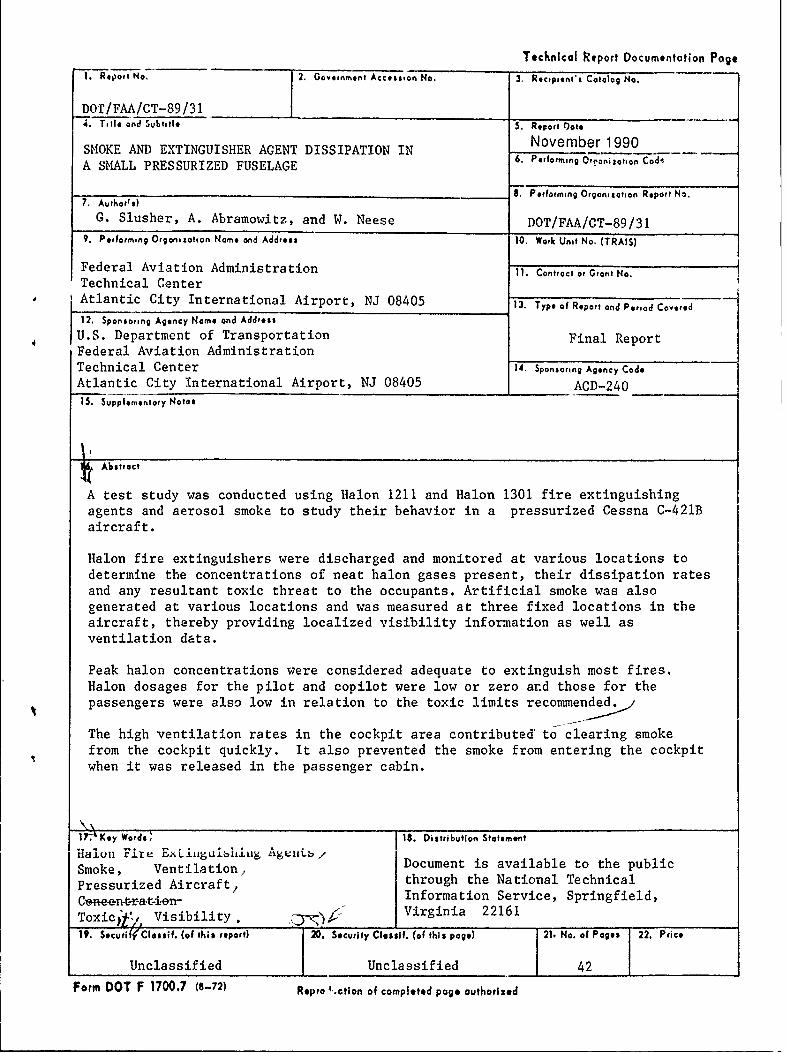
SMOKE AND EXTINGUISHER AGENT DISSIPATION INA SMALL PRESSURIZED FUSELAGE 6. Perforning Ocoftizn.on Cod,
8, Performing Organizotion Report No.
7. Author')G. Slusher, A. Abramowitz, and W. Neese DOT/FAA/CT-89/31
9. Performing Orgnization Name and Address 10. Work Unit No. (TRAIS)
Federal Aviation Administration 11. Contract or Giant No.Technical CenterAtlantic City International Airport, NJ 08405 13. Type of Report nd Perod Covered
12. Sponsoring Agency Name and AddressU.S. Department of Transportation Final ReportFederal Aviation AdministrationTechnical Center 14. Sponsoring Agency CodeAtlantic City International Airport, NJ 08405 ACD-240
15. Supplementary Not*s
6 Abstract
A test study was conducted using Halon 1211 and Halon 1301 fire extinguishingagents and aerosol smoke to study their behavior in a pressurized Cessna C-421Baircraft.
Halon fire extinguishers were discharged and monitored at various locations todetermine the concentrations of neat halon gases present, their dissipation ratesand any resultant toxic threat to the occupants. Artificial smoke was alsogenerated at various locations and was measured at three fixed locations in theaircraft, thereby providing localized visibility information as well asventilation data.
Peak halon concentrations were considered adequate to extinguish most fires.Halon dosages for the pilot and copilot were low or zero and those for thepassengers were also low in relation to the toxic limits recommended.
The high ventilation rates in the cockpit area contributed to clearing smokefrom the cockpit quickly. It also prevented the smoke from entering the cockpitwhen it was released in the passenger cabin.
177" Key Words; 18. Distribution StatementHalon Fre ELIiiguibliIIg AguiiLb/ Document is available to the publicSmoke, Ventilation, through the National TechnicalPressurized Aircraft/ Information Service, Springfield,C~een-r-a-t-ien- i r i on 22161Toxic ' ' Visibility. Virginia 22161
19. Securif 1 lossif. (of this report) 20. Security Clessif. (of this page) 21. No. of Pages 22. Price
Unclassified Unclassified 42
Form DOT F 1700.7 (8-72) Repro 4.ctlon of completed page authorized
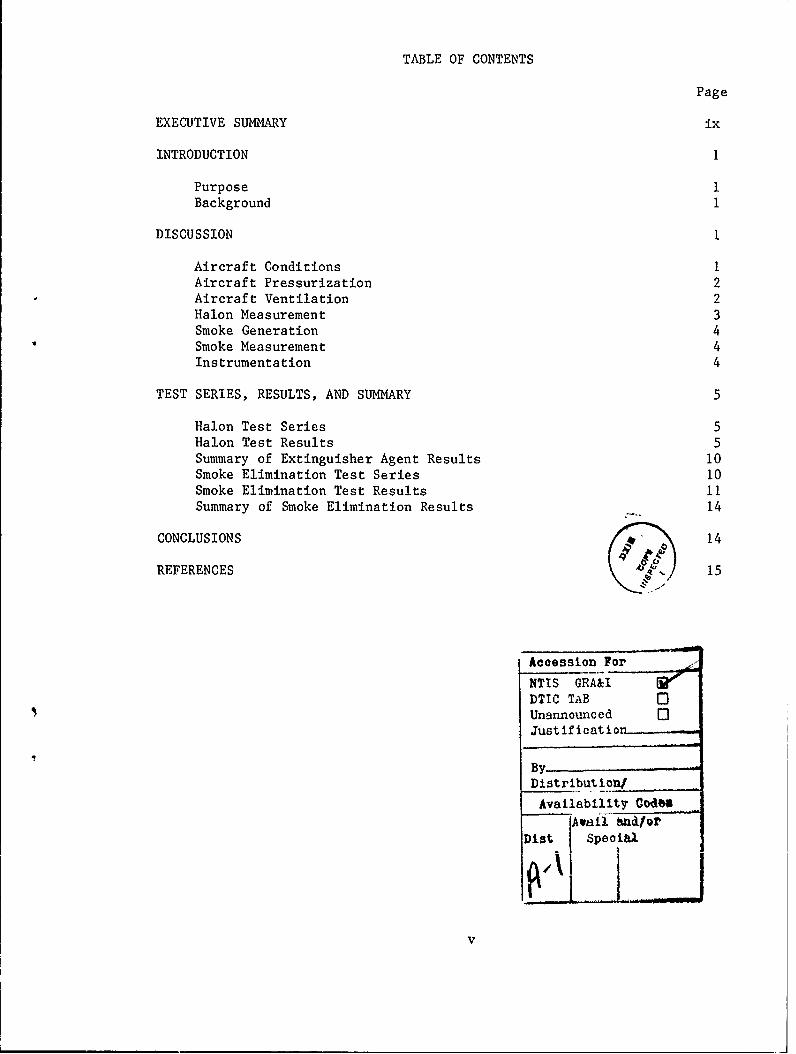
TABLE OF CONTENTS
Page
EXECUTIVE SUMMARY ix
INTRODUCTION 1
Purpose IBackground 1
DISCUSSION 1
Aircraft Conditions 1Aircraft Pressurization 2Aircraft Ventilation 2Halon Measurement 3Smoke Generation 4Smoke Measurement 4Instrumentation 4
TEST SERIES, RESULTS, AND SUMMARY 5
Halon Test Series 5Halon Test Results 5Summary of Extinguisher Agent Results 10Smoke Elimination Test Series 10Smoke Elimination Test Results 11Summary of Smoke Elimination Results 14
CONCLUSIONS 14
REFERENCES 15
Accession For -
NTIS GRA&I 2 /
DTIC TAB 0Unannounced 0Justification-
ByDistributiomf
Availability Co4IM
D jAvail idfor
V
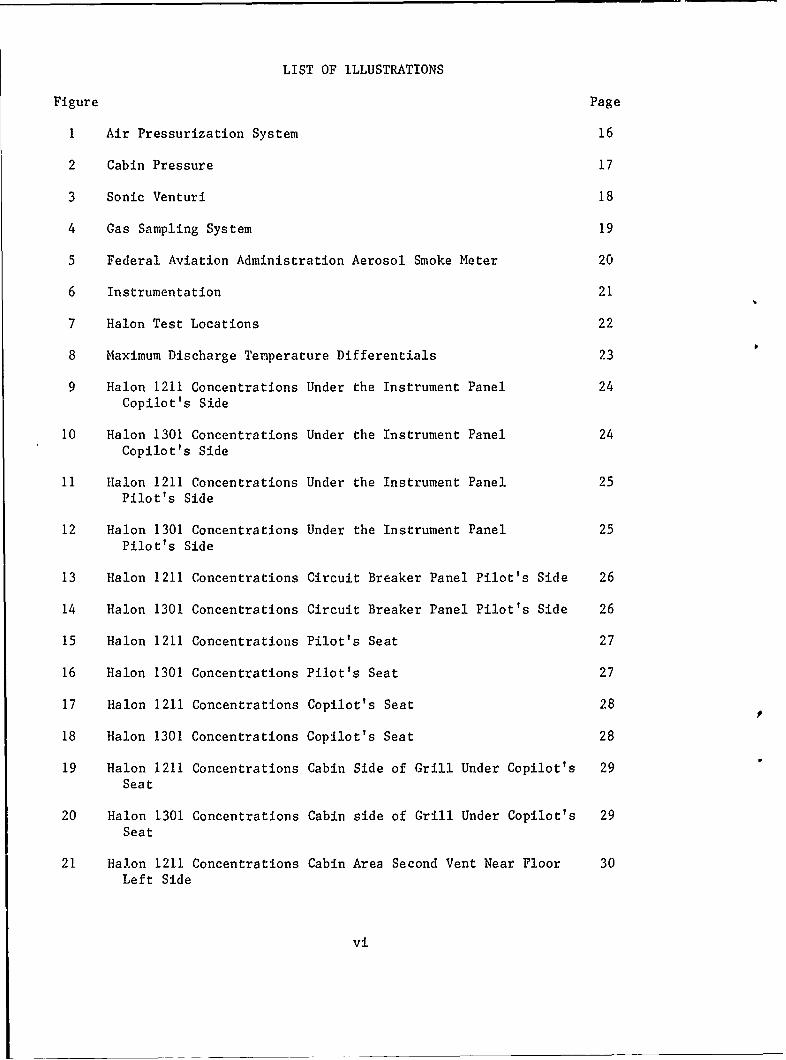
LIST OF ILLUSTRATIONS
Figure Page
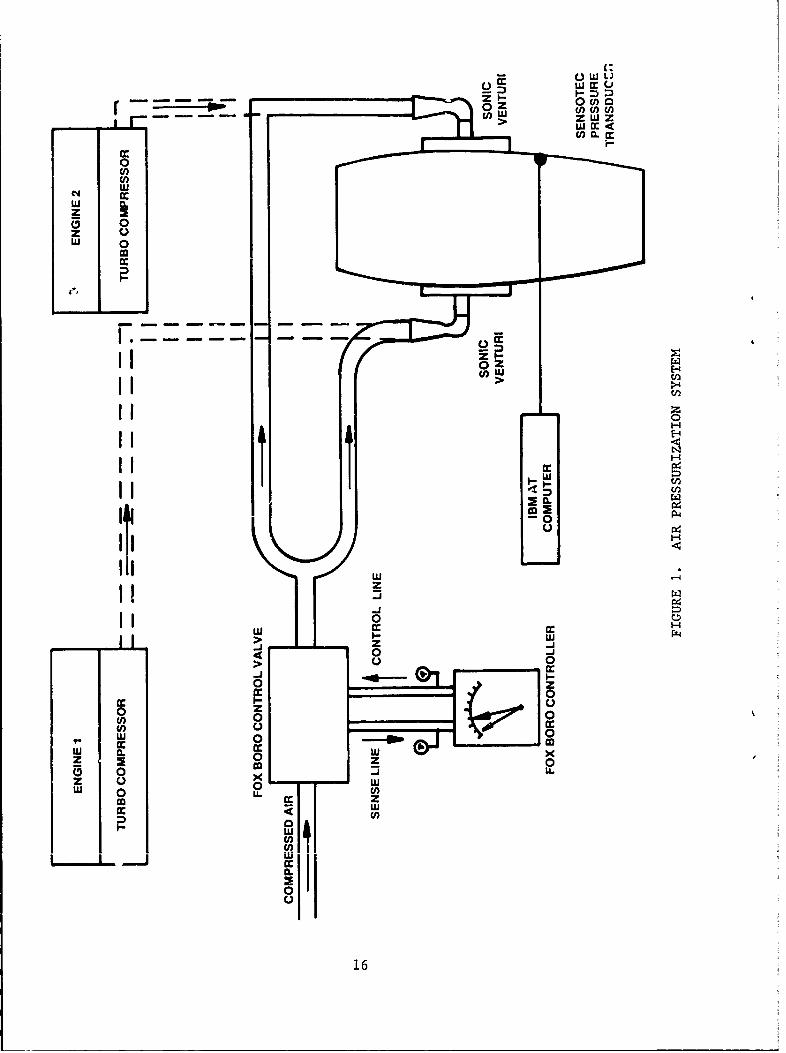
1 Air Pressurization System 16
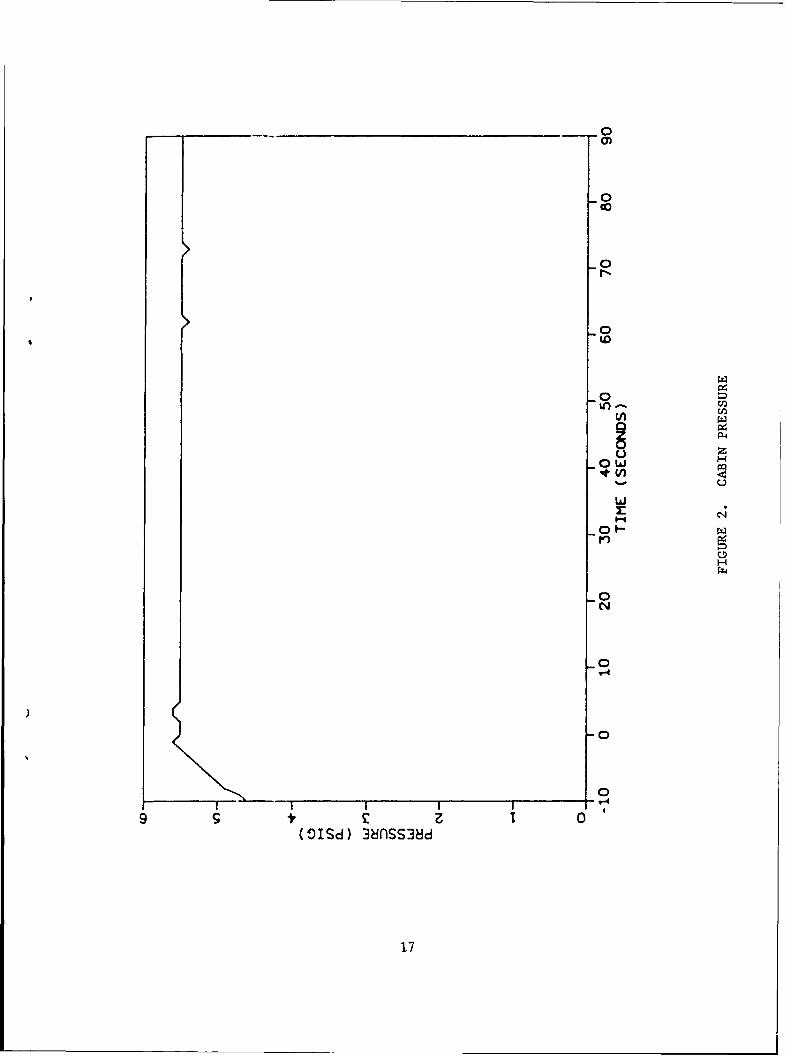
2 Cabin Pressure 17
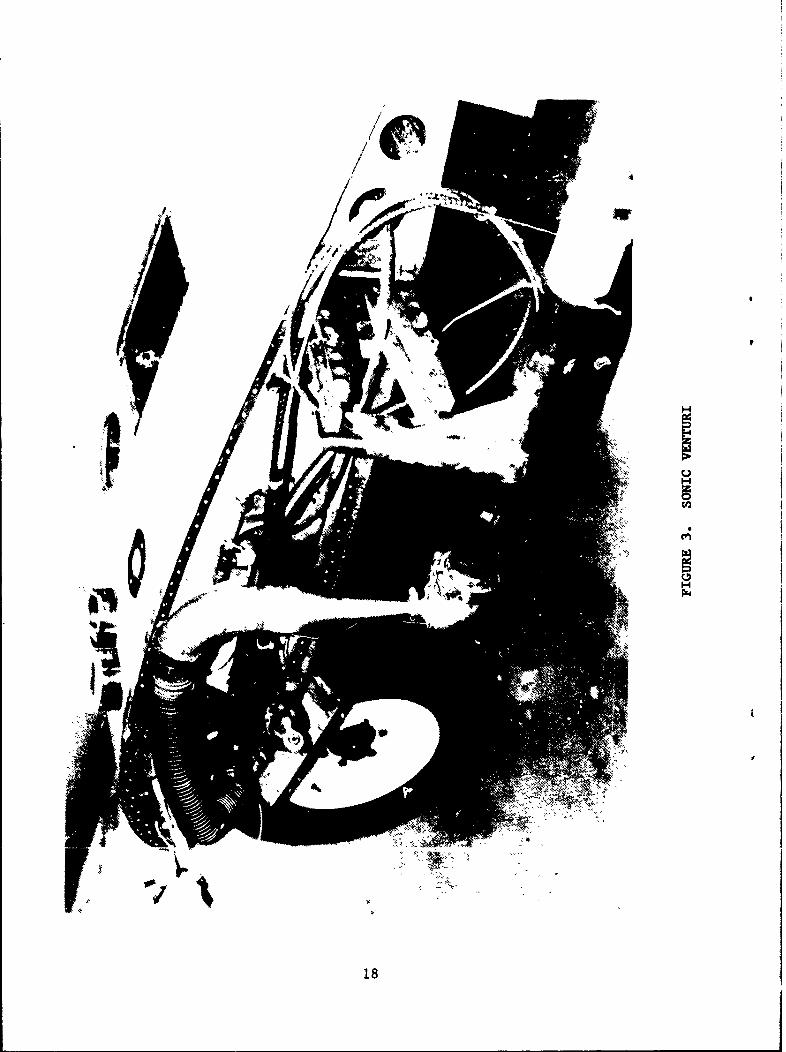
3 Sonic Venturi 18
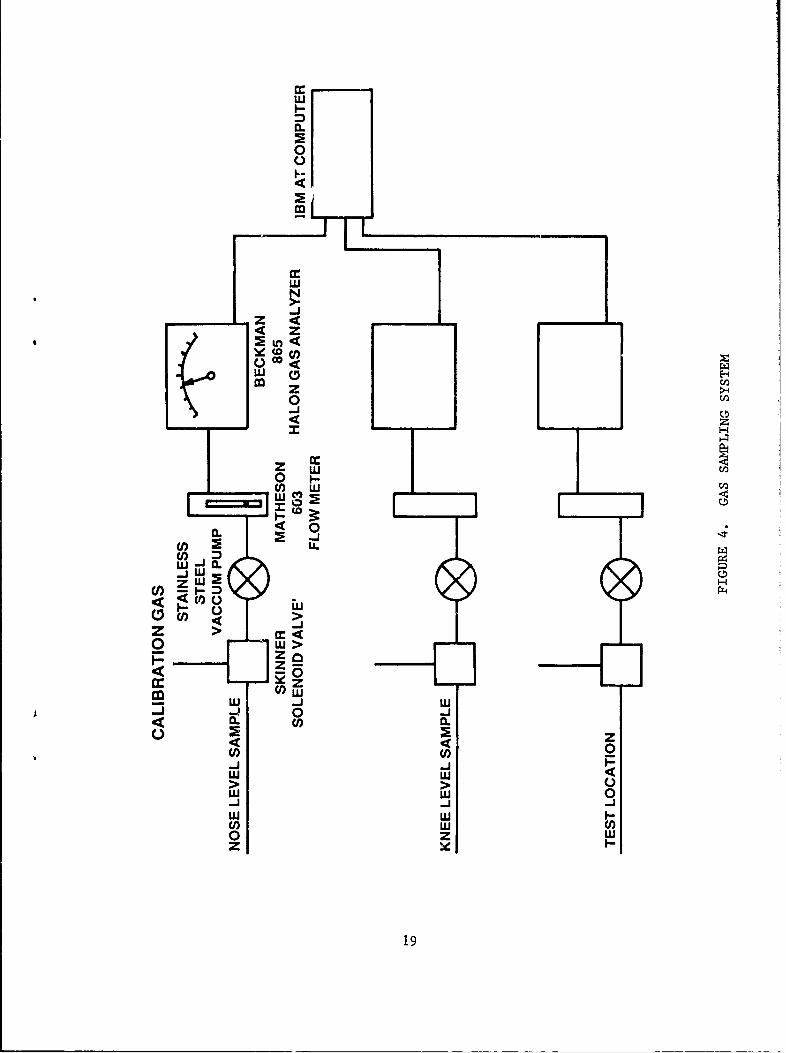
4 Gas Sampling System 19
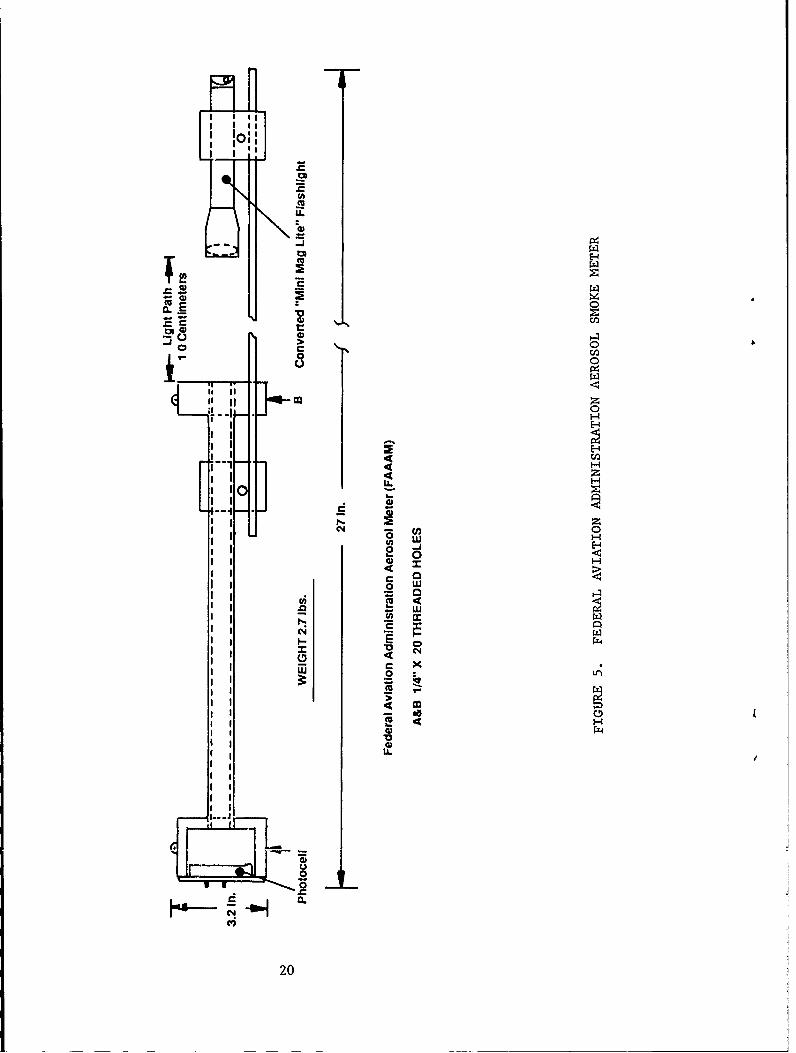
5 Federal Aviation Administration Aerosol Smoke Meter 20
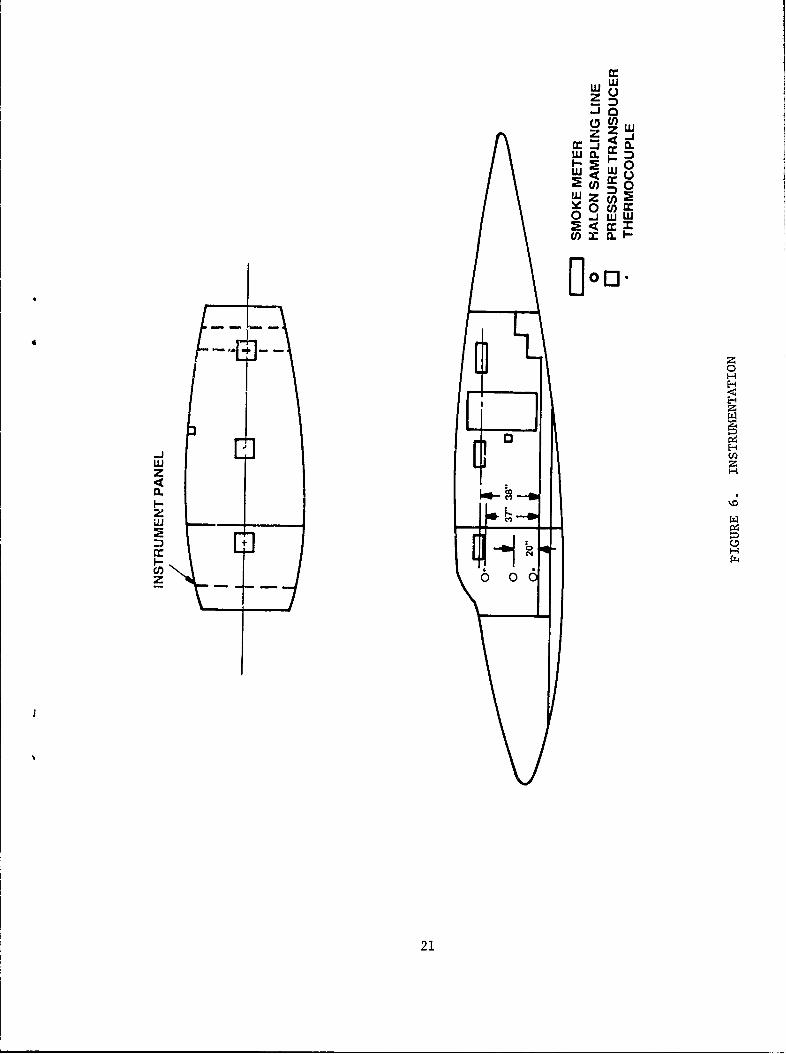
6 Instrumentation 21
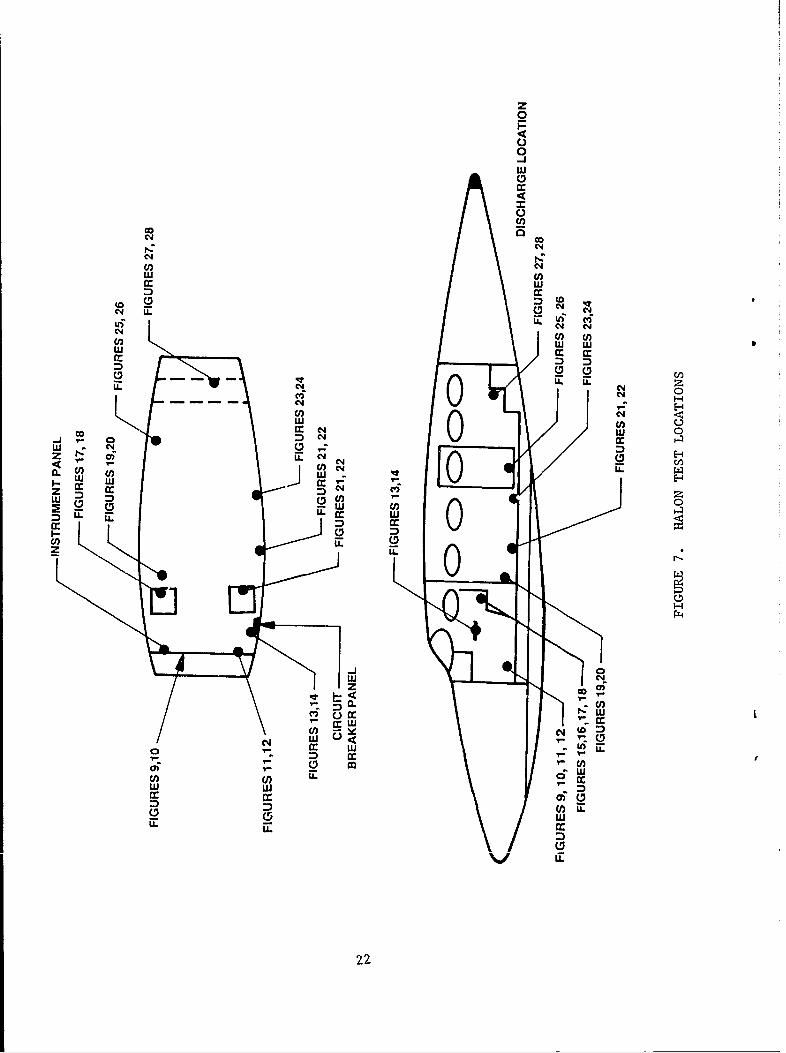
7 Halon Test Locations 22
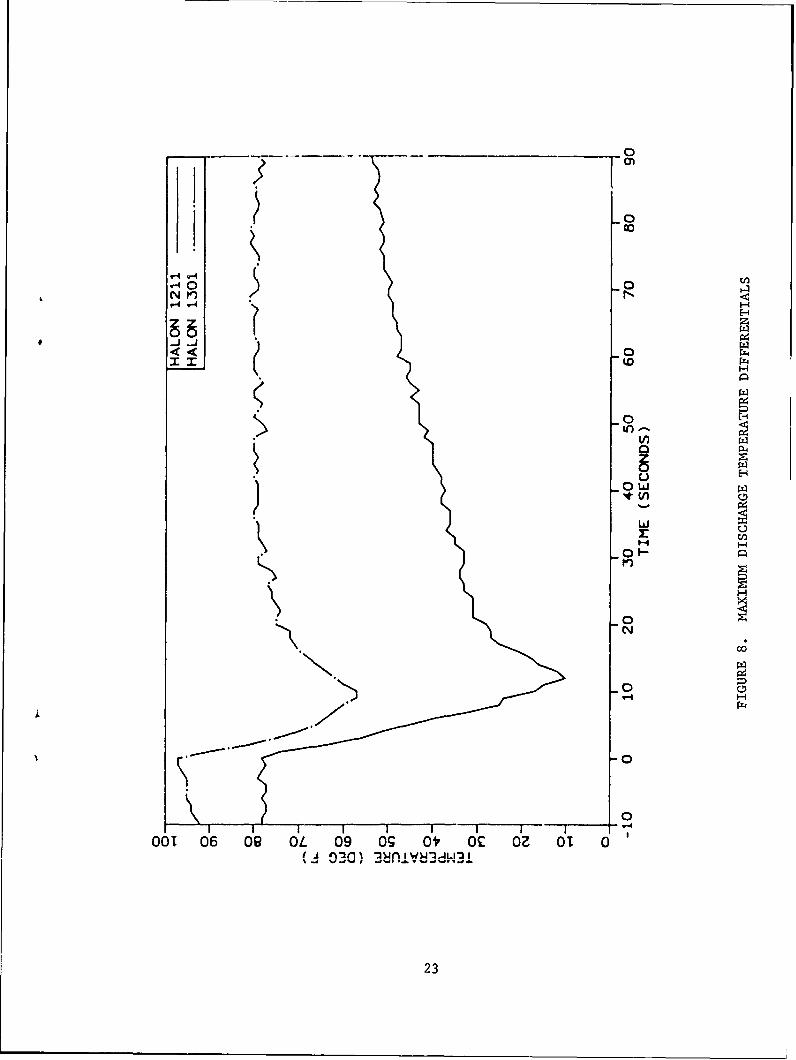
8 Maximum Discharge Temperature Differentials 23
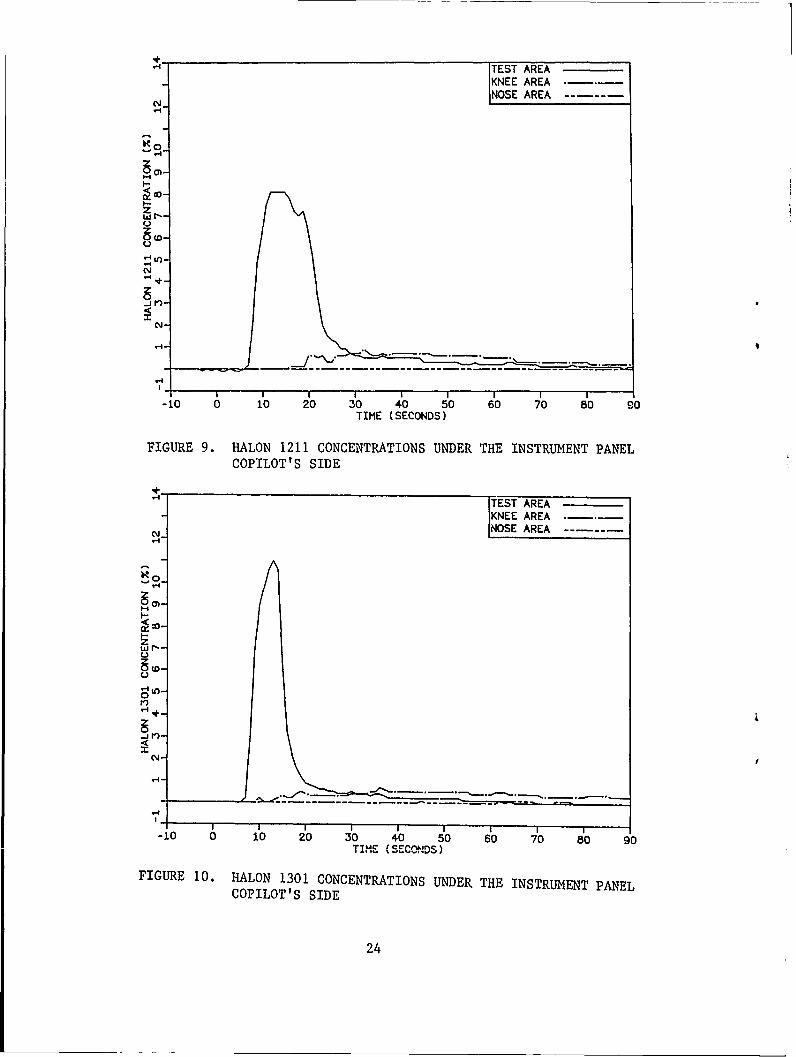
9 Halon 1211 Concentrations Under the Instrument Panel 24Copilot's Side
10 Halon 1301 Concentrations Under the Instrument Panel 24Copilot's Side
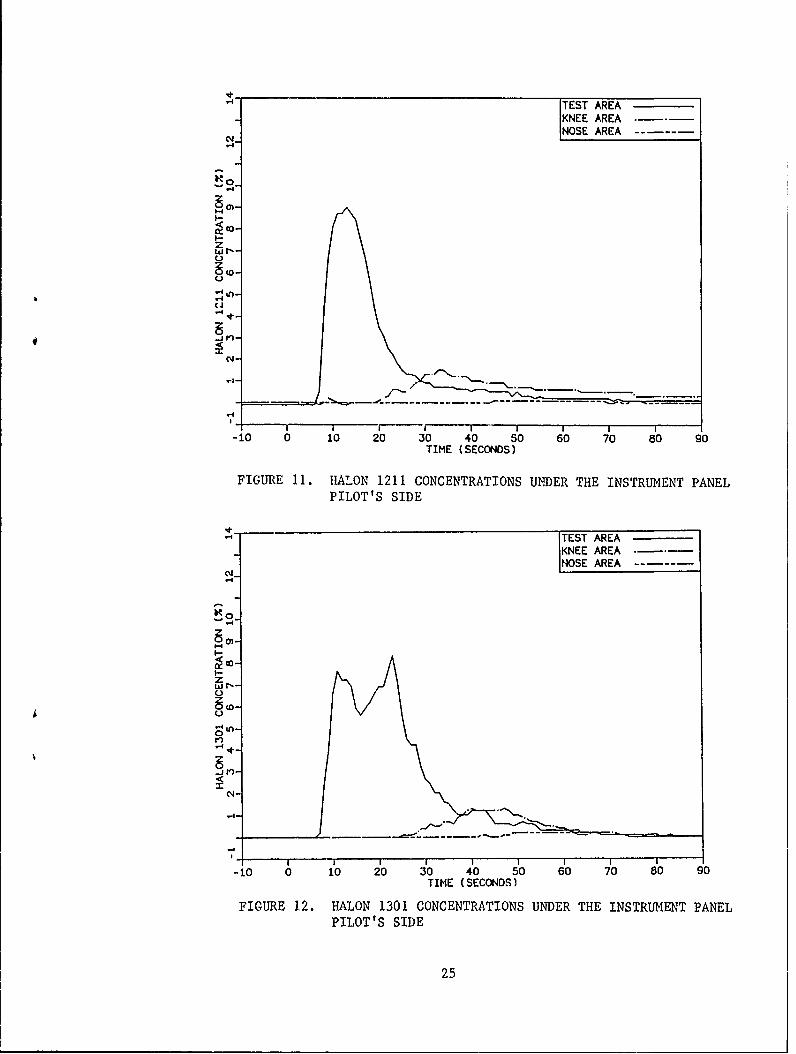
11 Halon 1211 Concentrations Under the Instrument Panel 25Pilot's Side
12 Halon 1301 Concentrations Under the Instrument Panel 25Pilot's Side
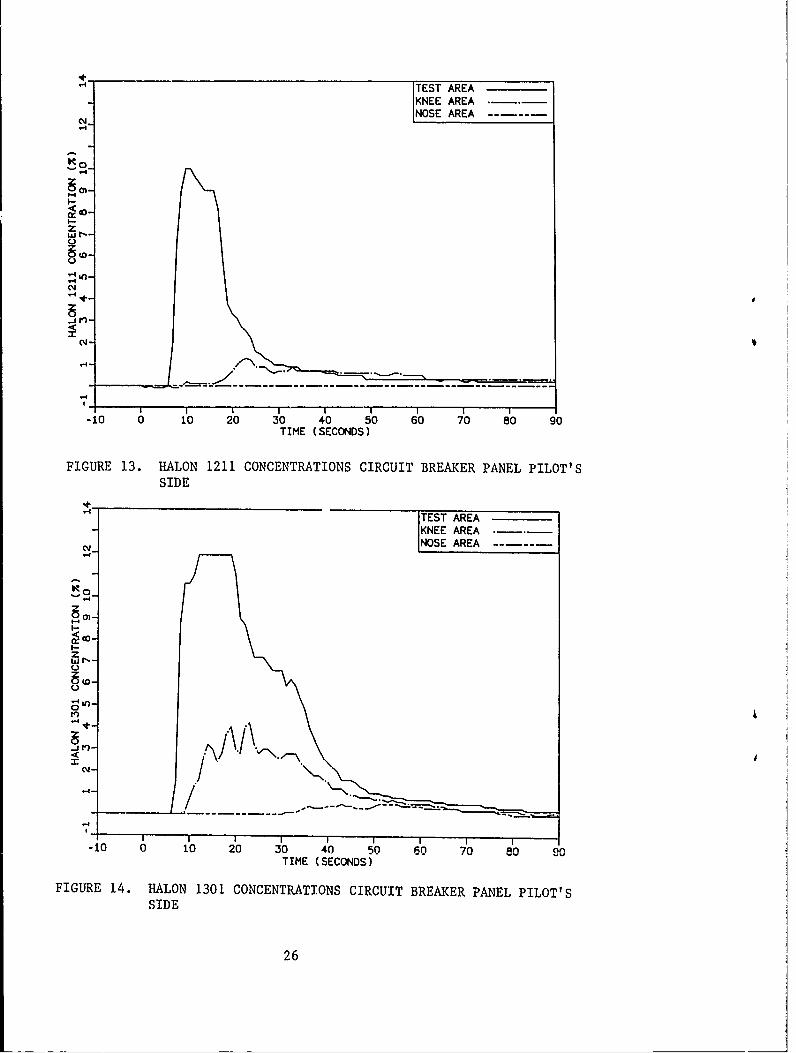
13 Halon 1211 Concentrations Circuit Breaker Panel Pilot's Side 26
14 Halon 1301 Concentrations Circuit Breaker Panel Pilot's Side 26
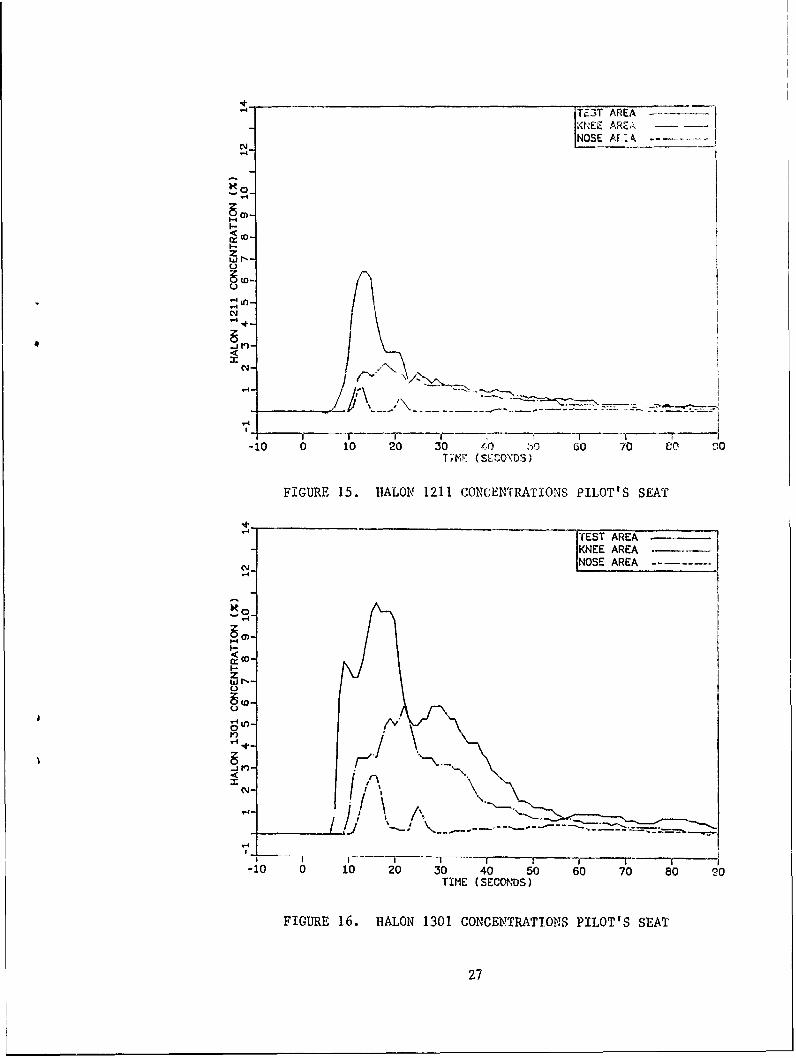
15 Halon 1211 Concentrations Pilot's Seat 27
16 Halon 1301 Concentrations Pilot's Seat 27
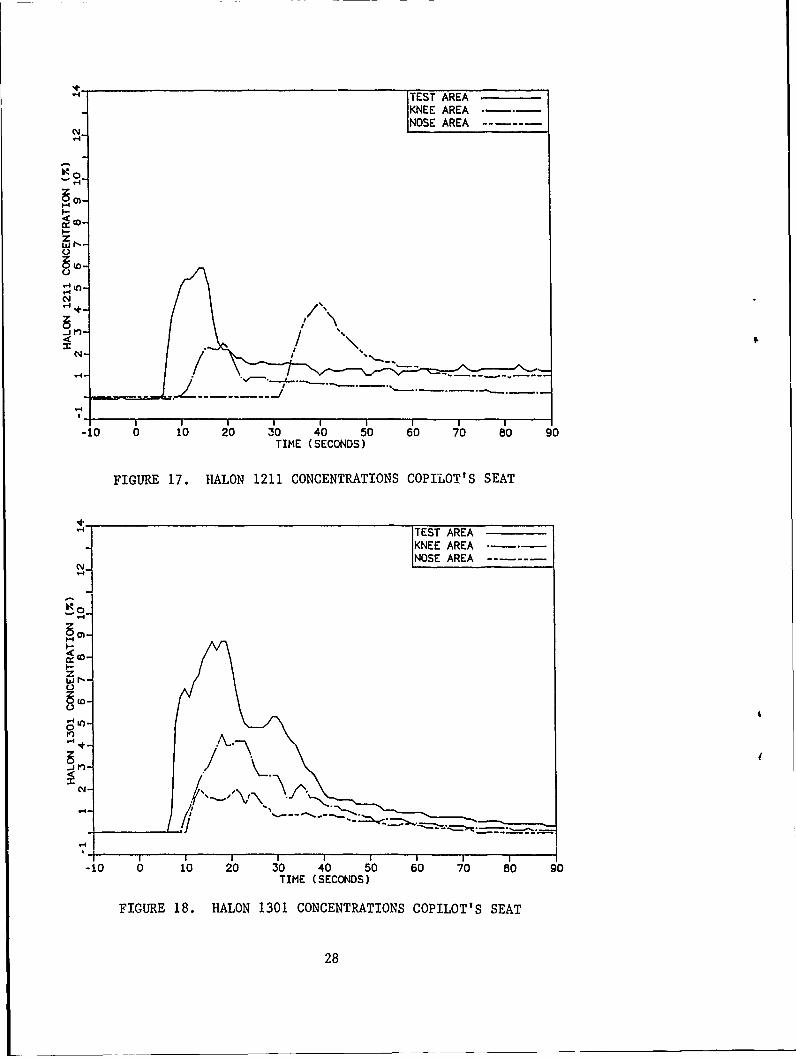
17 Halon 1211 Concentrations Copilot's Seat 28
18 Halon 1301 Concentrations Copilot's Seat 28
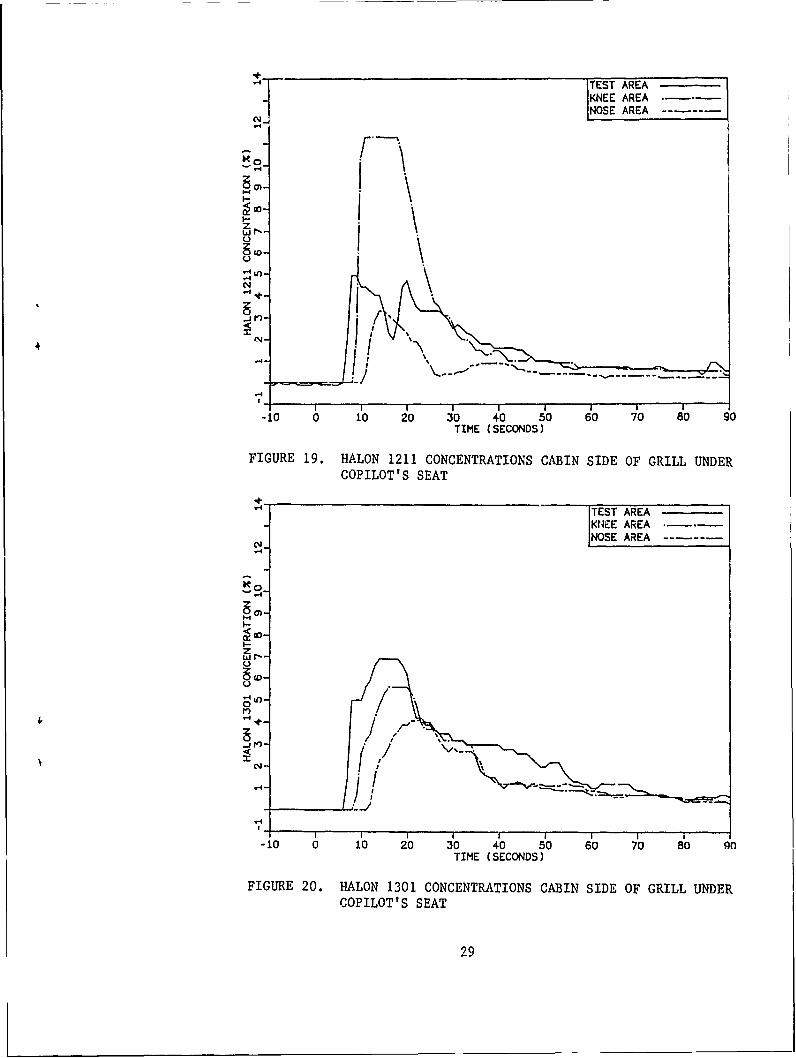
19 Halon 1211 Concentrations Cabin Side of Grill Under Copilot's 29Seat
20 Halon 1301 Concentrations Cabin side of Grill Under Copilot's 29Seat
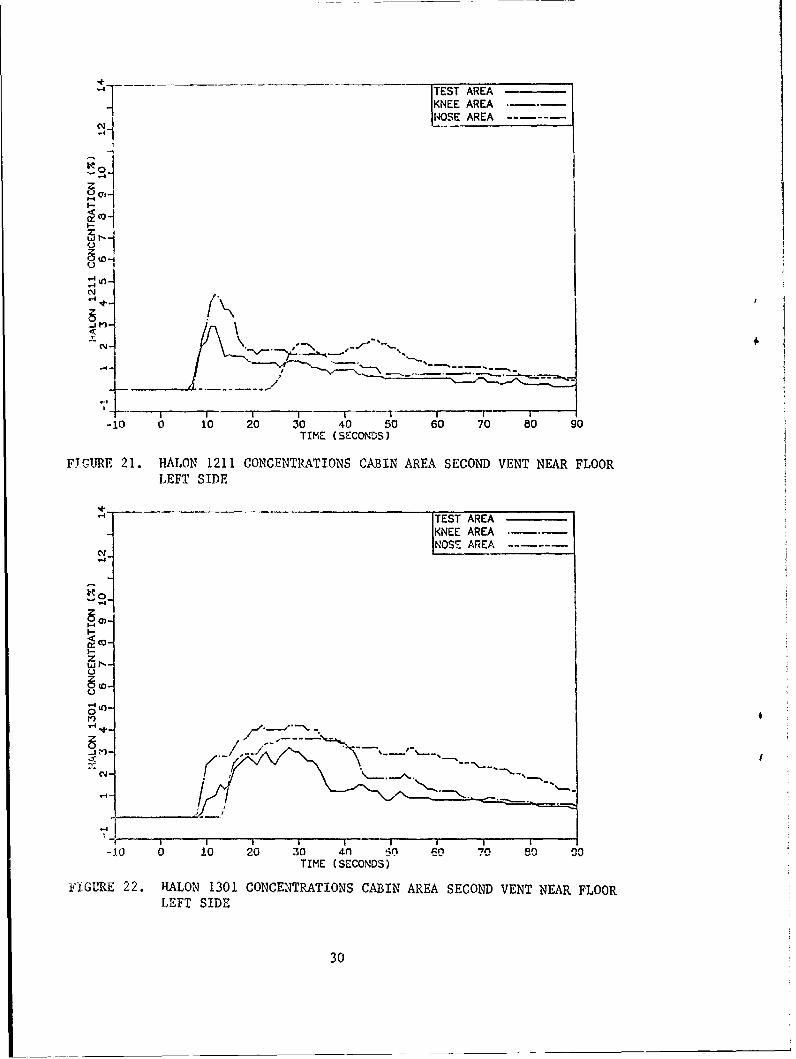
21 Halon 1211 Concentrations Cabin Area Second Vent Near Floor 30Left Side
vi
LIST OF ILLUSTRATIONS (Continued)
Figure Page
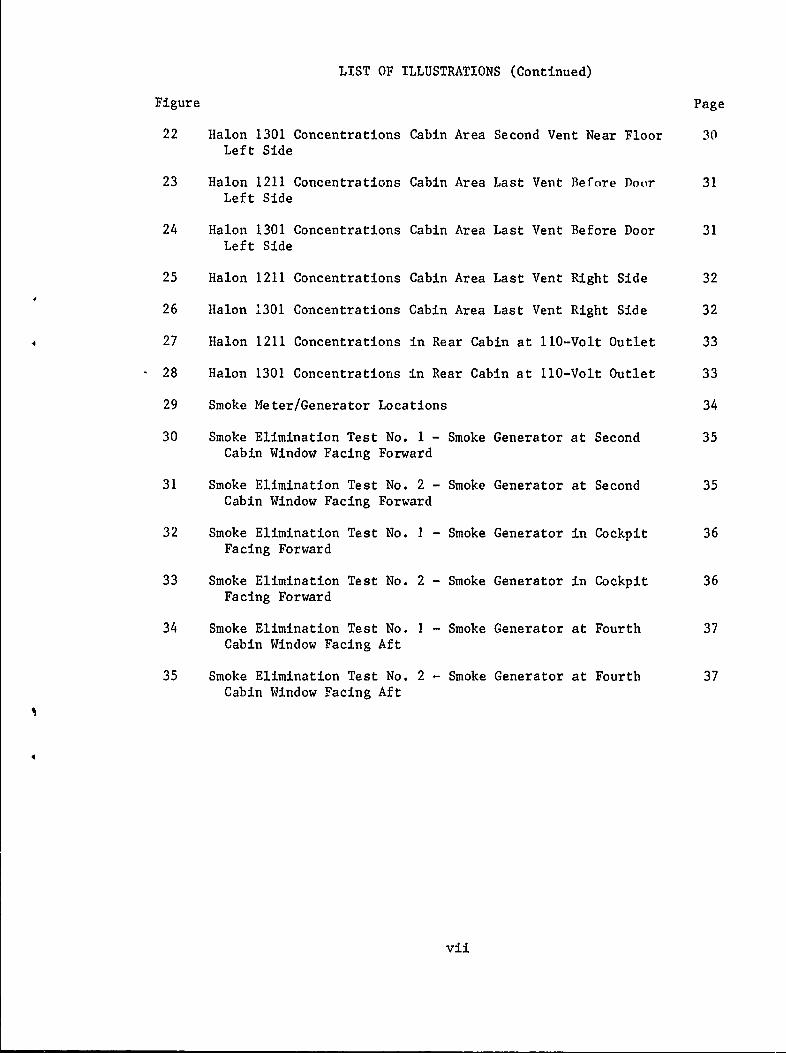
22 Halon 1301 Concentrations Cabin Area Second Vent Near Floor 30Left Side
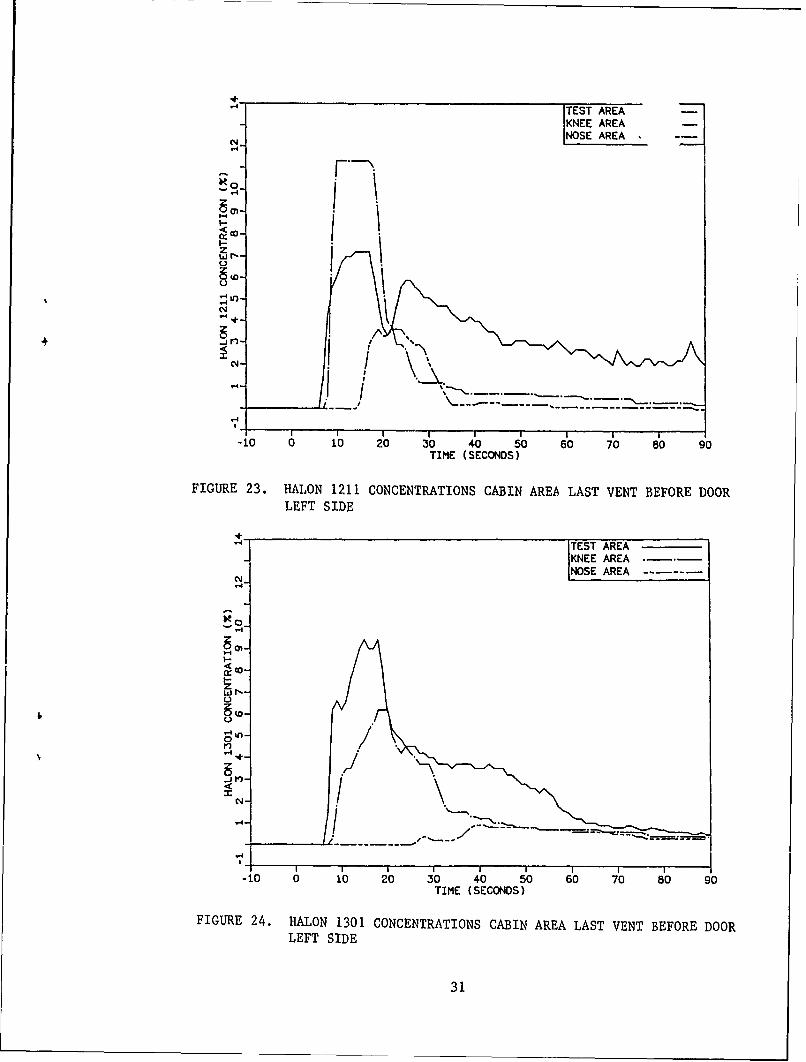
23 Halon 1211 Concentrations Cabin Area Last Vent Before Door 31Left Side
24 Halon 1301 Concentrations Cabin Area Last Vent Before Door 31Left Side
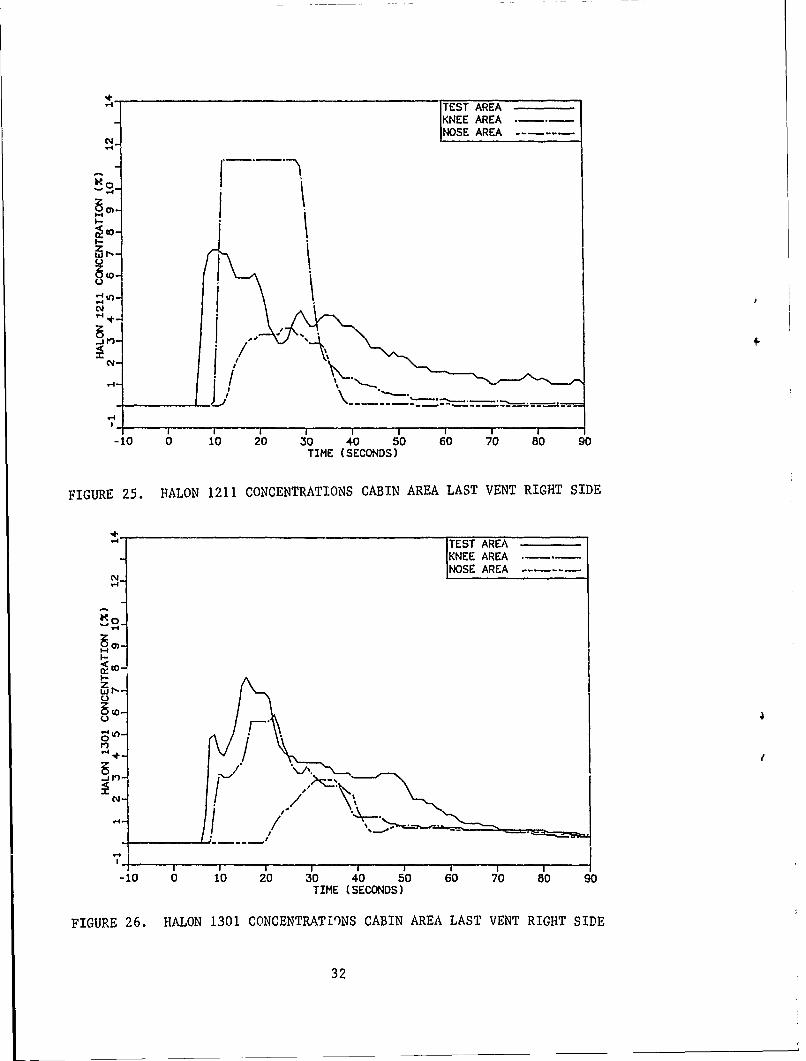
25 Halon 1211 Concentrations Cabin Area Last Vent Right Side 32
26 Halon 1301 Concentrations Cabin Area Last Vent Right Side 32
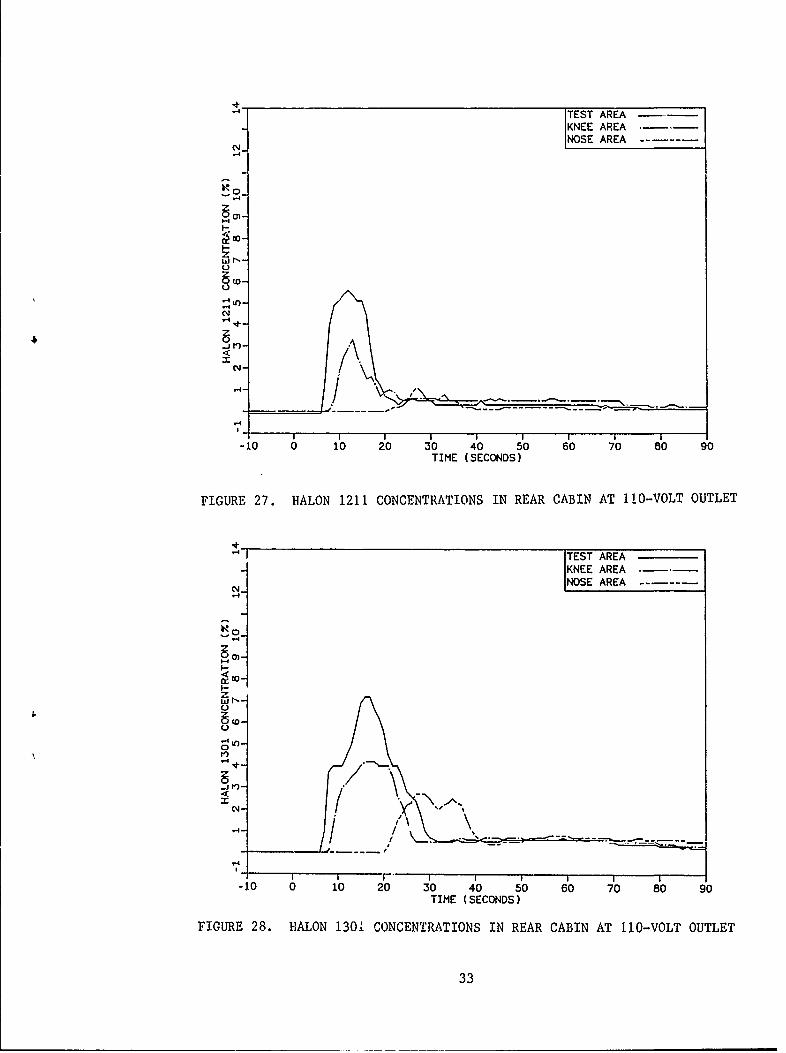
27 Halon 1211 Concentrations in Rear Cabin at 110-Volt Outlet 33
28 Halon 1301 Concentrations in Rear Cabin at 110-Volt Outlet 33
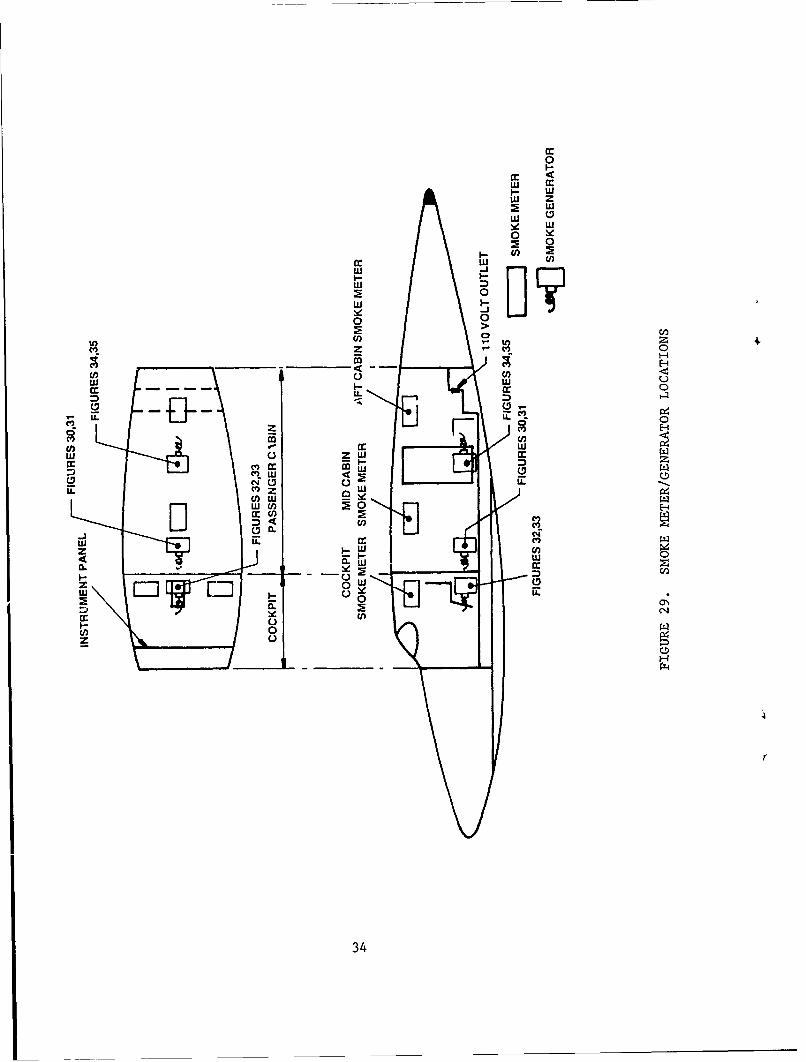
29 Smoke Meter/Generator Locations 34
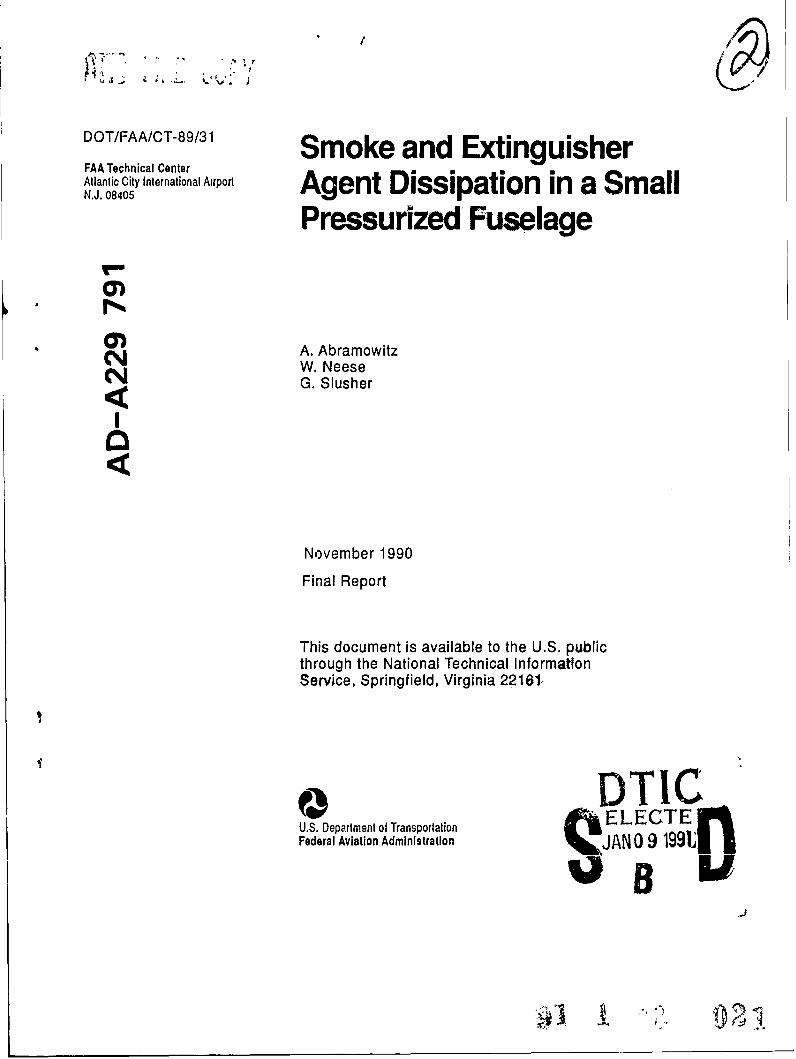
30 Smoke Elimination Test No. 1 - Smoke Generator at Second 35Cabin Window Facing Forward
31 Smoke Elimination Test No. 2 - Smoke Generator at Second 35Cabin Window Facing Forward
32 Smoke Elimination Test No. I - Smoke Generator in Cockpit 36Facing Forward
33 Smoke Elimination Test No. 2 - Smoke Generator in Cockpit 36Facing Forward
34 Smoke Elimination Test No. 1 - Smoke Generator at Fourth 37Cabin Window Facing Aft
35 Smoke Elimination Test No. 2 - Smoke Generator at Fourth 37Cabin Window Facing Aft
vii
LISTS OF TABLES
Table Page
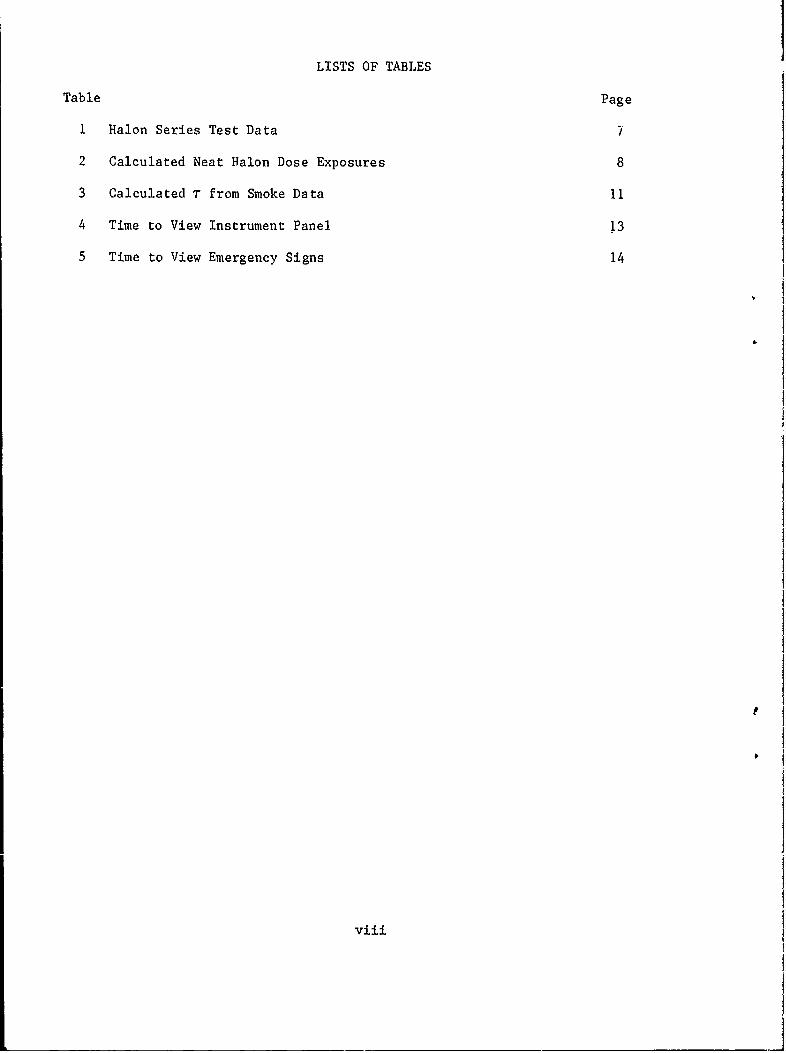
1 Halon Series Test Data 7
2 Calculated Neat Halon Dose Exposures 8
3 Calculated T from Smoke Data 11
4 Time to View Instrument Panel 13
5 Time to View Emergency Signs 14
viii
EXECUTIVE SUMMARY
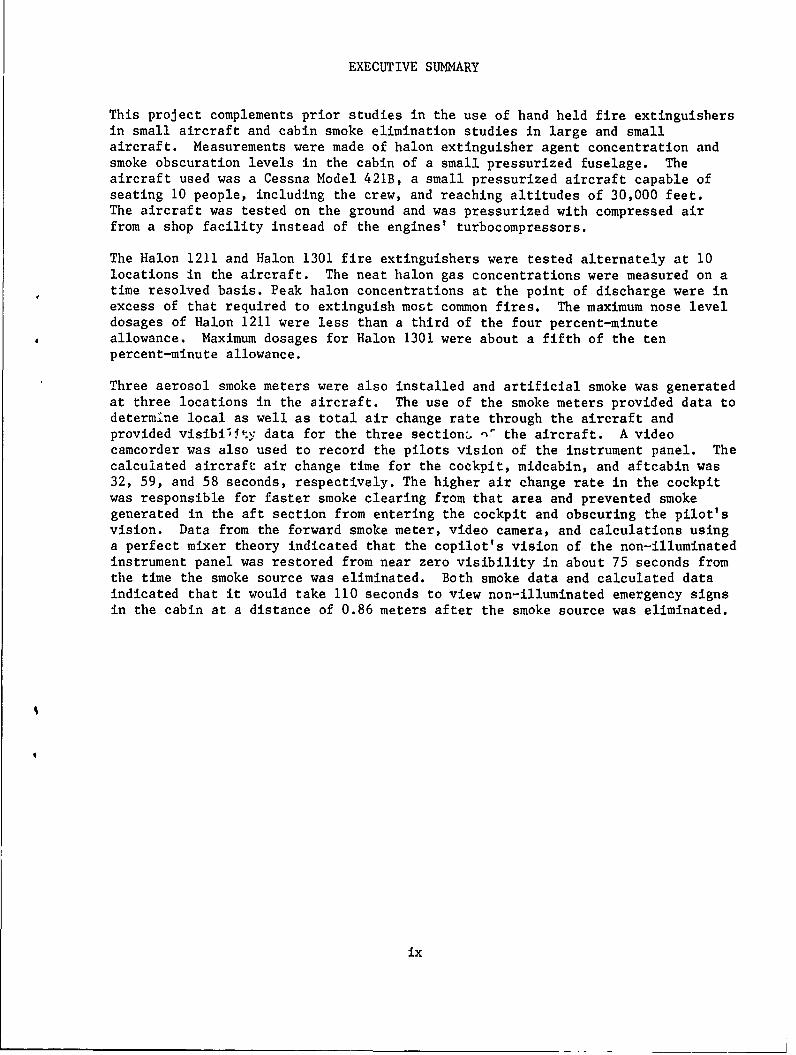
This project complements prior studies in the use of hand held fire extinguishersin small aircraft and cabin smoke elimination studies in large and smallaircraft. Measurements were made of halon extinguisher agent concentration andsmoke obscuration levels in the cabin of a small pressurized fuselage. Theaircraft used was a Cessna Model 421B, a small pressurized aircraft capable ofseating 10 people, including the crew, and reaching altitudes of 30,000 feet.The aircraft was tested on the ground and was pressurized with compressed airfrom a shop facility instead of the engines' turbocompressors.
The Halon 1211 and Halon 1301 fire extinguishers were tested alternately at 10locations in the aircraft. The neat halon gas concentrations were measured on atime resolved basis. Peak halon concentrations at the point of discharge were inexcess of that required to extinguish most common fires. The maximum nose leveldosages of Halon 1211 were less than a third of the four percent-minuteallowance. Maximum dosages for Halon 1301 were about a fifth of the tenpercent-minute allowance.
Three aerosol smoke meters were also installed and artificial smoke was generatedat three locations in the aircraft. The use of the smoke meters provided data todetermine local as well as total air change rate through the aircraft andprovided visibiuity data for the three section. ' the aircraft. A videocamcorder was also used to record the pilots vision of the instrument panel. Thecalculated aircraft air change time for the cockpit, midcabin, and aftcabin was32, 59, and 58 seconds, respectively. The higher air change rate in the cockpitwas responsible for faster smoke clearing from that area and prevented smokegenerated in the aft section from entering the cockpit and obscuring the pilot'svision. Data from the forward smoke meter, video camera, and calculations usinga perfect mixer theory indicated that the copilot's vision of the non-illuminatedinstrument panel was restored from near zero visibility in about 75 seconds fromthe time the smoke source was eliminated. Both smoke data and calculated dataindicated that it would take 110 seconds to view non-illuminated emergency signsin the cabin at a distance of 0.86 meters after the smoke source was eliminated.
ix
INTRODUCTION
PURPOSE.
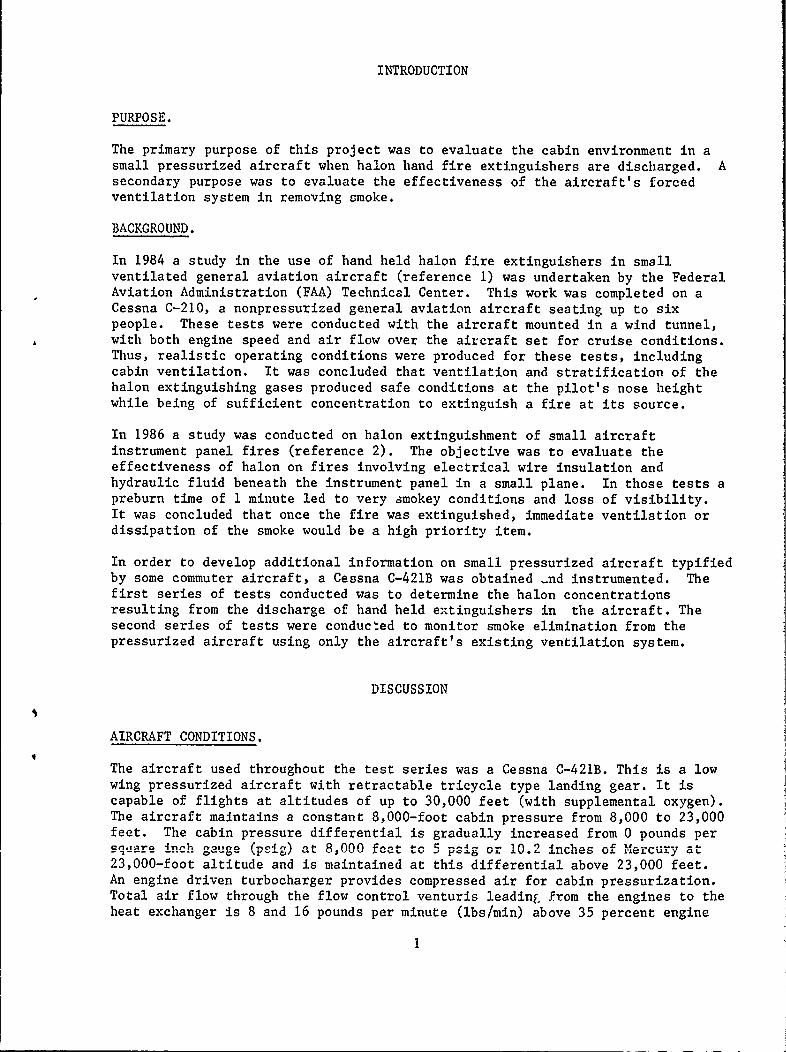
The primary purpose of this project was to evaluate the cabin environment in asmall pressurized aircraft when halon hand fire extinguishers are discharged. Asecondary purpose was to evaluate the effectiveness of the aircraft's forcedventilation system in removing smoke.
BACKGROUND.
In 1984 a study in the use of hand held halon fire extinguishers in smallventilated general aviation aircraft (reference 1) was undertaken by the FederalAviation Administration (FAA) Technical Center. This work was completed on aCessna C-210, a nonpressurized general aviation aircraft seating up to sixpeople. These tests were conducted with the aircraft mounted in a wind tunnel,with both engine speed and air flow over the aircraft set for cruise conditions.Thus, realistic operating conditions were produced for these tests, includingcabin ventilation. It was concluded that ventilation and stratification of thehalon extinguishing gases produced safe conditions at the pilot's nose heightwhile being of sufficient concentration to extinguish a fire at its source.
In 1986 a study was conducted on halon extinguishment of small aircraftinstrument panel fires (reference 2). The objective was to evaluate theeffectiveness of halon on fires involving electrical wire insulation andhydraulic fluid beneath the instrument panel in a small plane. In those tests apreburn time of 1 minute led to very smokey conditions and loss of visibility.It was concluded that once the fire was extinguished, immediate ventilation ordissipation of the smoke would be a high priority item.
In order to develop additional information on small pressurized aircraft typifiedby some commuter aircraft, a Cessna C-421B was obtained -nd instrumented. Thefirst series of tests conducted was to determine the halon concentrationsresulting from the discharge of hand held extinguishers in the aircraft. Thesecond series of tests were conducted to monitor smoke elimination from thepressurized aircraft using only the aircraft's existing ventilation system.
DISCUSSION
AIRCRAFT CONDITIONS.
The aircraft used throughout the test series was a Cessna C-421B. This is a lowwing pressurized aircraft with retractable tricycle type landing gear. It iscapable of flights at altitudes of up to 30,000 feet (with supplemental oxygen).The aircraft maintains a constant 8,000-foot cabin pressure from 8,000 to 23,000feet. The cabin pressure differential is gradually increased from 0 pounds persquare inch gauge (psig) at 8,000 feet to 5 psig or 10.2 inches of Mercury at23,000-foot altitude and is maintained at this differential above 23,000 feet.An engine driven turbocharger provides compressed air for cabin pressurization.Total air flow through the flow control venturis leading from the engines to theheat exchanger is 8 and 16 pounds per minute (lbs/min) above 35 percent engine
1
speed for single and dual engine output, respectively, according to informationprovided by the Cessna Aircraft Company.
The cabin is approximately 15 feet long and is about 4 feet 9 inches wide at themidcabin passenger compartment, and it tapers to 3 feet at the rear bulkhead.The internal height varies from 3 feet 11 inches at the cockpit, while most ofthe passenger cabin is 4 feet 2 inches and tapers to 3 feet 10 inches at the rearbulkhead. The volume of the cabin is 216.6 cubic feet, according to the CessnaAircraft Company.
The cabin seats were not present during any of the tests.
AIRCRAFT PRESSURIZATION.
The aircraft was pressurized using compressed shop. The air delivery rate wasregulated with a Foxboro 43AP Pneumatic controller via a Foxboro Stabilflo VIseries control valve. The regulated compressed air fed both venturis that led tothe aircraft's pressurization system. Thus, the compressed air entering theaircraft followed the same path as the air coming from the enginesturbocompressor (figure 1). The regulator was adjusted to maintain a supplypressure of 35 pounds per square inch absolute (psia) to both sonic venturis.With this system the aircraft was pressurized within a short time of 45 secondsor less. At this time, the outflow valve and the safety relief valve opened andmaintained the cabin pressure at 5.6 psig (figure 2).
AIRCRAFT VENTILATION.
Unlike large commercial aircraft that use a counter-flow (top/down) ventilationdesign, this aircraft has both high- and low-level cabin air supply vents and asingle exhaust in the aft area of the passenger cabin. This helps to improve aircirculation and is ideally suited to applications involving perfect stirrertheories.
Determination of the ventilation rate and time for an aircraft air change (r)was calculated using the following rational:
The Cessna C-421B cabin air supply system consists of twin converging divergingnozzles (figure 3), one for each engine air source. Because of the flow behaviorin the type nozzle used in this aircraft, the flow in the nozzle throat would besonic even at fairly low ratios of upstream pressure to aircraft cabinpressures. Since the total cabin pressure was approximately 20 psia, the flowcould be sonic with source pressure as low as 23 psia. This behavior wasconfirmed through measurements of supply pressure versus throat pressure forsupply pressures between 23 and 50 psia. These measurements provide the basisfor the use of Fliegner's Formula (reference 3) to calculate the air supply tothe cabin as follows:
W = .532 poA*/( (1)
2
where W is in Ib/sec, A* is the throat area in ft2, P0 is the supply pressure inlb/ft2 , and To is absolute temperature in degrees Rankine. The values used areas follows:
A* = .002 ft2 for diameter of 0.6 in.To = 520 deg-:ees Rankine
P0 = 5040 lb/ft 2 for 35 psia supply.
Fliegner's Formula yields a flow rate of 0.46 lb/sec for the two venturiscombined. Because the cabin was pressurized to 5.6 psig, the density of air inthe cabin has to be corrected to 0.10 lb/ft3 . The volumetric air delivery to thecabin is the flow rate divided by the density or 4.6 ft3/second. The nominaltime for a cabin air change is the cabin volume (216 ft3) divided by thevolumetric air delivery or 47 seconds.
One application involving a perfect stirrer theory is that relating visibility toventilation (reference 4) to determine r. The visibility at a given point in timeduring the smoke evacuation period is represented by the following equation:
-ln(I/10) = iS p 0[exp(-t/T)]/v (2)
Where -ln(I/I0) is the logarithm of the transmission ratio, 1 is the transmissionlength, s is the number of smoke particles present, is some particulate cross-section that absorbs light, t is the point in time of interest, T is time for an
air change, and v is the volume of the enclosure.
By selecting two points during this period and solving the two simultaneousequations, we arrive at the following relationship:
-ln(I/10I) = exp((-tl+t2)/T) (3)
-ln(I/10)2
Solving for T yields the following equation:
T= (t2-tl) (4)in in(I/I0)j
ln(I/I0)2
We can then select the two points in time and solve for 7.
HALON MEASUREMENT.
Three Beckman Model 865 infrared gas analyzers were factory field modified tomeasure Halon 1211 and Halon 1301 concentrations in the cabin. Sampling lineswere run from the selected locations in the cabin to the remotely housed gassampling system (figure 4). The instruments were calibrated prior to each test.Calibration gas concentrations for Halon 1211 were 3, 6.35, and 7.98 percent, andfor Halon 1301 the calibration gas concentrations were 1.96, 4, and 8.06percent. The maximum concentrations measured by the gas analyzers were limitedto 11-12 percent. A remote electrically actuated fire extinguisher holder wasconstructed to house and fire the extinguishers. The three measurement locationswere as follows:
3
1. Test area, fire extinguisher discharge location.
2. Knee area, corresponding to 20 inches above the floor at the area ofdischarge. The discharge area for the pilot's and copilot's seat test was atknee level where the seat cushion meets the seat back. Therefore the knee levellocation was measured at the front of the seat.
3. Nose area, corresponding to 37 inches above the floor at the area ofdischarge.
To determine the actual amount of extinguishing agent discharged, the
extinguishers were weighed before and after the test.
SMOKE GENERATION.
The Rosco Model 1500 Fog Machine was used to generate the smoke for the smokeelimination tests. This smoke generator produces smoke by injecting smoke fluidinto its heat exchanger where it is atomized at high temperatures; the resultingsmoke is then blown out the discharge nozzle. The smoke production can beadjusted from levels of one to ten and was controlled from a remote locationoutside the aircraft. Fog fluid was available from the manufacturer andconsisted of nonpetroleum products that had no unpleasant odors and wereconsidered safe to inhale.
SMOKE MEASUREMENT.
Three aerosol smoke meters were used to measure light transmission in theaircraft cabin. The aerosol smoke meter consisted of a tube with a photocell onone end and a light source at the other end (figure 5). The smoke meter was 27inches long. The light source was an adjustable beam flashlight, featuring alight path of ten centimeters before entering the tube and photocell. Theflashlight used a regulated power supply to eliminate the use of batteries andthe error associated with their discharge. Due to the short duration of thetest, any error due to lightbulb output decay was considered insignificant.
All smoke measurements were made at eye level, corresponding to a height of 38
inches above the passenger/cockpit cabin floor.
INSTRUMENTATION.
Two Iron Constantan (type J) thermocouples were used to monitor temperature, oneat the point of discharge and the other at nose level directly above the point ofdischarge. These thermocouples monitored ambient cabin temperatures andindicated the temperature change in those areas once the extinguisher wastriggered. A Sensotec model TJE/717-02 pressure transducer was installed in thecabin to monitor the cabin pressure. Figure 6 shows the location of allinstrumentation in the aircraft.
Cabin pressure, temperature, smoke visibility, and halon gas concentrations datawere collected: prorpsspd A.nd graphed using a dig-ita computer with dataacquisition hardware and software. A video camcorder was used to monitor theobscuration that the pilot and the copilot would encounter during the smokeelimination tests. It viewed the entire instrument panel and was located at eyelevel, equidistant between the pilot and the copilot. It was also used to view
4
the halon hand-held fire extinguisher tests and gave an indication of the
discharge time for each bottle where possible.
TEST SERIES, RESULTS, AND SUMIARY
HALON TEST SERIES.
Halon 1211 (2 1/2 pound) and Halon 1301 (3 pound) hand-held fire extinguisherswere used during these tests. All of the gas analyzers were turned on at least 24hours prior to calibration. At least 1 hour prior to calibration, the analyzerswere set in the test mode and the computer was turned on. The extinguisherbottle was weighed and placed in the aircraft. The analyzers were calibrated,the video recorder was turned on, the computer was started and the aircraft waspressurized to 5.6 psig at which time the outflow valve and the safety reliefvalve opened. Once the pressure stabilized, the fire extinguisher was remotelytriggered and data were collected for 90 seconds (10-second pre-trigger data alsogave ambient readings).
The halon testing consisted of 20 tests taken at 10 different locations (figure7), using both Halon 1211 and Halon 1301 at each location.
The locations were:
1. Under the instrument panel copilot's side2. Under the instrument panel pilot's side3. Circuit breaker panel pilot's side4. Pilot's seat5. Copilot's seat6. Grill under copilot's seat facing passenger compartment7. Second cabin vent left side8. Control panel on left side before cabin door9. Last cabin floor vent right side10. Rear passenger seat/baggage area/110-Volt Outlet
HALON TEST RESULTS.
It is recommended that exposure to neat halon gases (reference 5) be limited to 4percent-minutes (e.g., 4 percent for 1 minute or I percent for 4 minutes) forHalon 1211 and limited to 10 percent-minutes (e.g., 10 percent for 1 minute or 1percent for 10 minutes) for Halon 1301. Assuming an instantaneous discharge ofthe fire extinguisher, the exposure to neat halon gases may be calculated withthe following relationship (reference 5):
d = C0T (5)
where d is the dose in percent-minutes, CO is the peak halon level in percent,and T is the time required for the halon concentration to decay from the peaklevel to 37 percent of peak. However, since the extinguisher discharge time isnot instantaneous, additional calculations are required to determine the exposurefrom the start of discharge to the peak level. A series of rectangles andtriangles were fitted to the pre-peak portion of the curves (figures 9 through
5
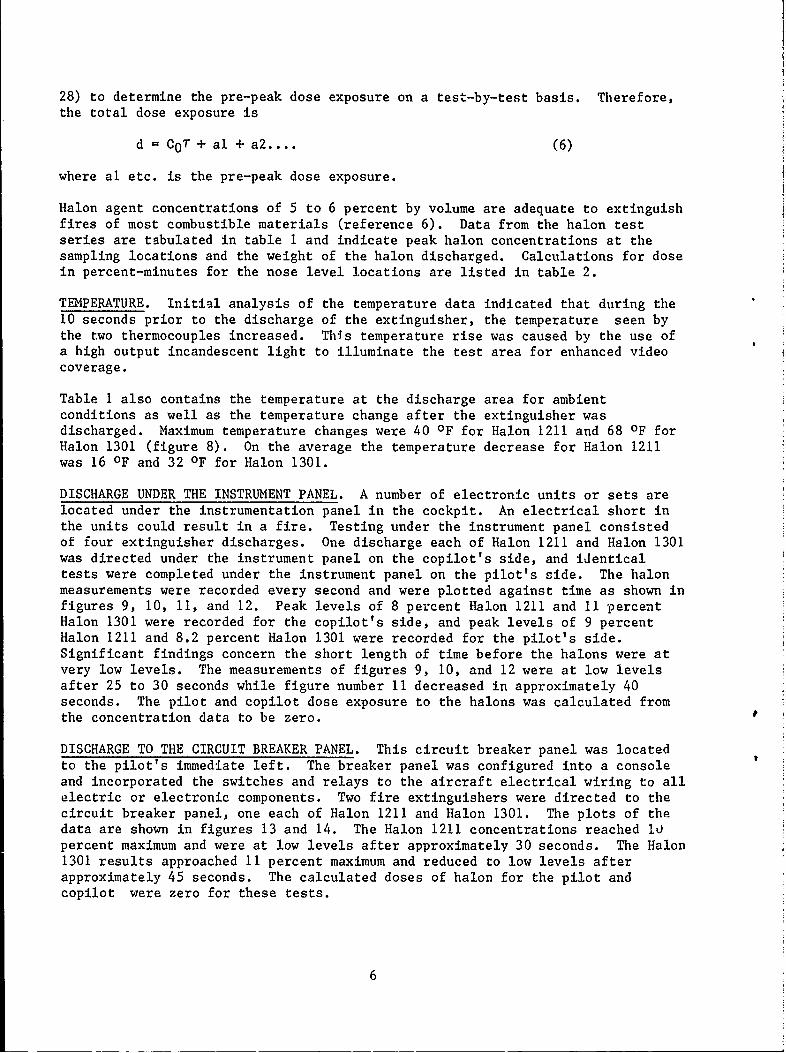
28) to determine the pre-peak dose exposure on a test-by-test basis. Therefore,the total dose exposure is
d = COT + al + a2 .... (6)
where al etc. is the pre-peak dose exposure.
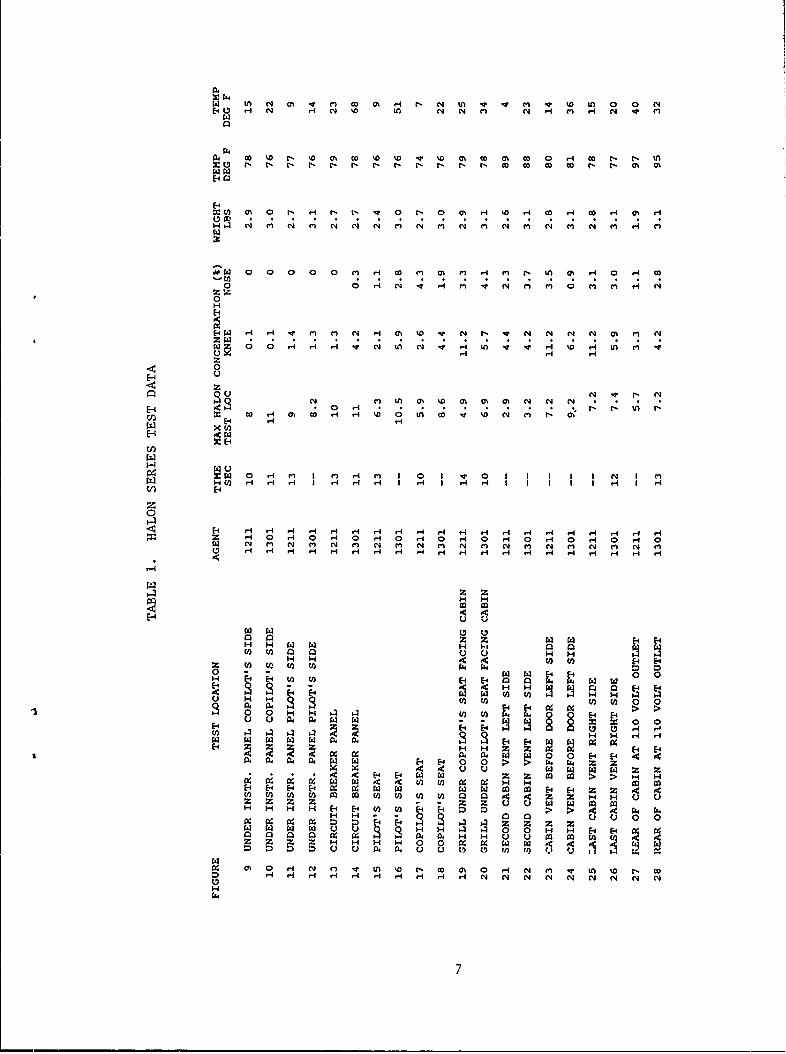
Halon agent concentrations of 5 to 6 percent by volume are adequate to extinguishfires of most combustible materials (reference 6). Data from the halon testseries are tabulated in table 1 and indicate peak halon concentrations at thesampling locations and the weight of the halon discharged. Calculations for dosein percent-minutes for the nose level locations are listed in table 2.
TEMPERATURE. Initial analysis of the temperature data indicated that during the10 seconds prior to the discharge of the extinguisher, the temperature seen bythe two thermocouples increased. This temperature rise was caused by the use ofa high output incandescent light to illuminate the test area for enhanced videocoverage.
Table 1 also contains the temperature at the discharge area for ambientconditions as well as the temperature change after the extinguisher wasdischarged. Maximum temperature changes were 40 OF for Halon 1211 and 68 OF forHalon 1301 (figure 8). On the average the temperature decrease for Halon 1211was 16 OF and 32 OF for Halon 1301.
DISCHARGE UNDER THE INSTRUMENT PANEL. A number of electronic units or sets arelocated under the instrumentation panel in the cockpit. An electrical short inthe units could result in a fire. Testing under the instrument panel consistedof four extinguisher discharges. One discharge each of Halon 1211 and Halon 1301was directed under the instrument panel on the copilot's side, and identicaltests were completed under the instrument panel on the pilot's side. The halonmeasurements were recorded every second and were plotted against time as shown infigures 9, 10, 11, and 12. Peak levels of 8 percent Halon 1211 and 11 percentHalon 1301 were recorded for the copilot's side, and peak levels of 9 percentHalon 1211 and 8.2 percent Halon 1301 were recorded for the pilot's side.Significant findings concern the short length of time before the halons were atvery low levels. The measurements of figures 9, 10, and 12 were at low levelsafter 25 to 30 seconds while figure number 11 decreased in approximately 40seconds. The pilot and copilot dose exposure to the halons was calculated fromthe concentration data to be zero.
DISCHARGE TO THE CIRCUIT BREAKER PANEL. This circuit breaker panel was locatedto the pilot's immediate left. The breaker panel was configured into a consoleand incorporated the switches and relays to the aircraft electrical wiring to allelectric or electronic components. Two fire extinguishers were directed to thecircuit breaker panel, one each of Halon 1211 and Halon 1301. The plots of thedata are shown in figures 13 and 14. The Halon 1211 concentrations reached i.percent maximum and were at low levels after approximately 30 seconds. The Halon1301 results approached 11 percent maximum and reduced to low levels afterapproximately 45 seconds. The calculated doses of halon for the pilot andcopilot were zero for these tests.
6
N ' N O~ '~ O~H N '.0~ ~ ' .~'. '0 0 0 Ne0 H C4 H N w. LO N N m N H m H N v m
04 0 w. t- %0 0 w w. %D0 V %0 0at w 0m w 0 H 0 r- i- m
W 0'. 0 t- H N v- 0 N. 0 0'. H- '0 14 co .4 0D r4 0' H
00
-CO
0 0 H c4 n c4 -w 4 u) v l 0w ri %D H N m
0H
4~~~I H H a. Cl C 0. '0 N N N 0. C
o o4 N '0 N 0 H w. N m H . H ' CE H H
H~ U) r 4 NH
E- H0 i r r r H 0r. 0 H H N N4 'A0 Nz 1 0 H'.00 0 H. 0 H1 '0 N4 C N 0 H 0 i
H H
HN H Nl H HlH C 4 0 I I I I I N I CHC H H H H HE -I H H I I ICr) E4
00
2 E- 0- HE- 4 0 H 0 H 0 0H 0C 3 H H HH HHH HA H HO H H H H H
H~ H04 00
0O ( 00 H H - -4
H- H H4 Z O Z OE4
0~~ - - N N 4 . 4 00H E-4 W. CO CO m a N N
0 OH H m. m
0 0 0 0 m m 0 0 a a 6 6 z H
SH H H H 4 0 w: P>04400 N .N ;. in4 00 a 0a 0244: m330 0 N N z Nz2
4W w- U. N N 22040 0 .H H4 Ha~ 0 g N N H4 HO CO 0 M~ H H
ZZ ZH H H H
0 00 00000'. 0 2
O HHPk4 6
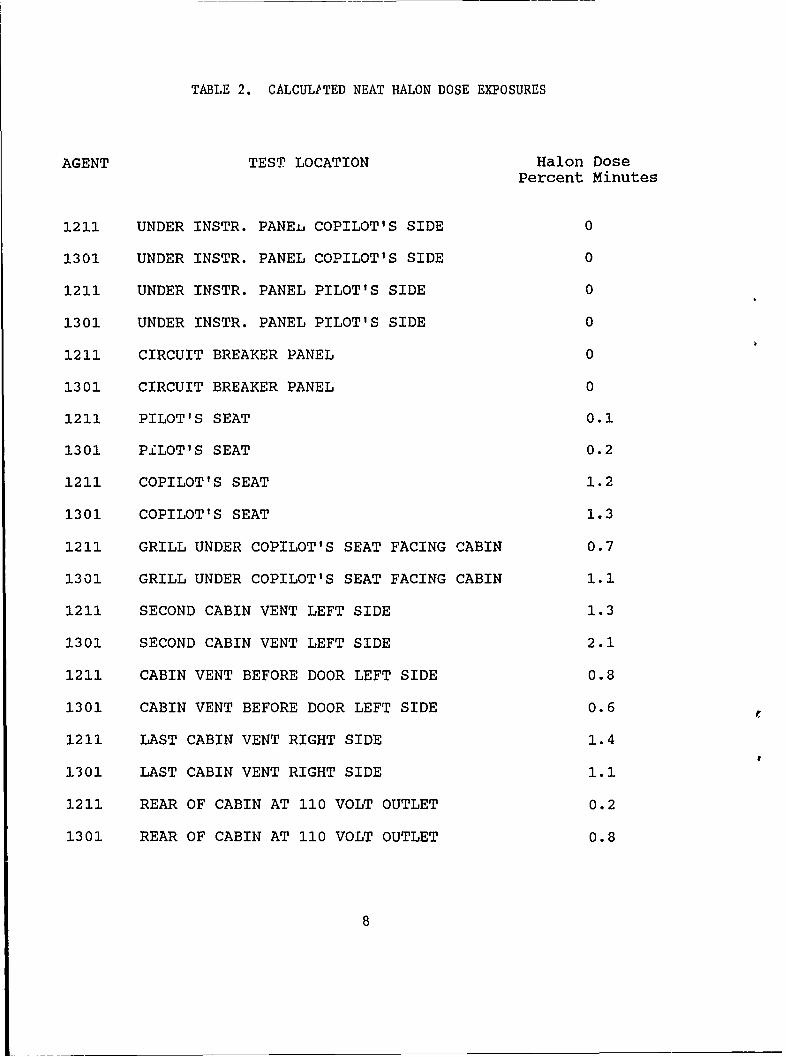
TABLE 2. CALCULPTED NEAT HALON DOSE EXPOSURES
AGENT TEST LOCATION Halon DosePercent Minutes
1211 UNDER INSTR. PANEL COPILOT'S SIDE 0
1301 UNDER INSTR. PANEL COPILOT'S SIDE 0
1211 UNDER INSTR. PANEL PILOT'S SIDE 0
1301 UNDER INSTR. PANEL PILOT'S SIDE 0
1211 CIRCUIT BREAKER PANEL 0
1301 CIRCUIT BREAKER PANEL 0
1211 PILOT'S SEAT 0.1
1301 PiLOT'S SEAT 0.2
1211 COPILOT'S SEAT 1.2
1301 COPILOT'S SEAT 1.3
1211 GRILL UNDER COPILOT'S SEAT FACING CABIN 0.7
1301 GRILL UNDER COPILOT'S SEAT FACING CABIN 1.1
1211 SECOND CABIN VENT LEFT SIDE 1.3
1301 SECOND CABIN VENT LEFT SIDE 2.1
1211 CABIN VENT BEFORE DOOR LEFT SIDE 0.8
1301 CABIN VENT BEFORE DOOR LEFT SIDE 0.6
1211 LAST CABIN VENT RIGHT SIDE 1.4
1301 LAST CABIN VENT RIGHT SIDE 1.1
1211 REAR OF CABIN AT 110 VOLT OUTLET 0.2
1301 REAR OF CABIN AT 110 VOLT OUTLET 0.8
8
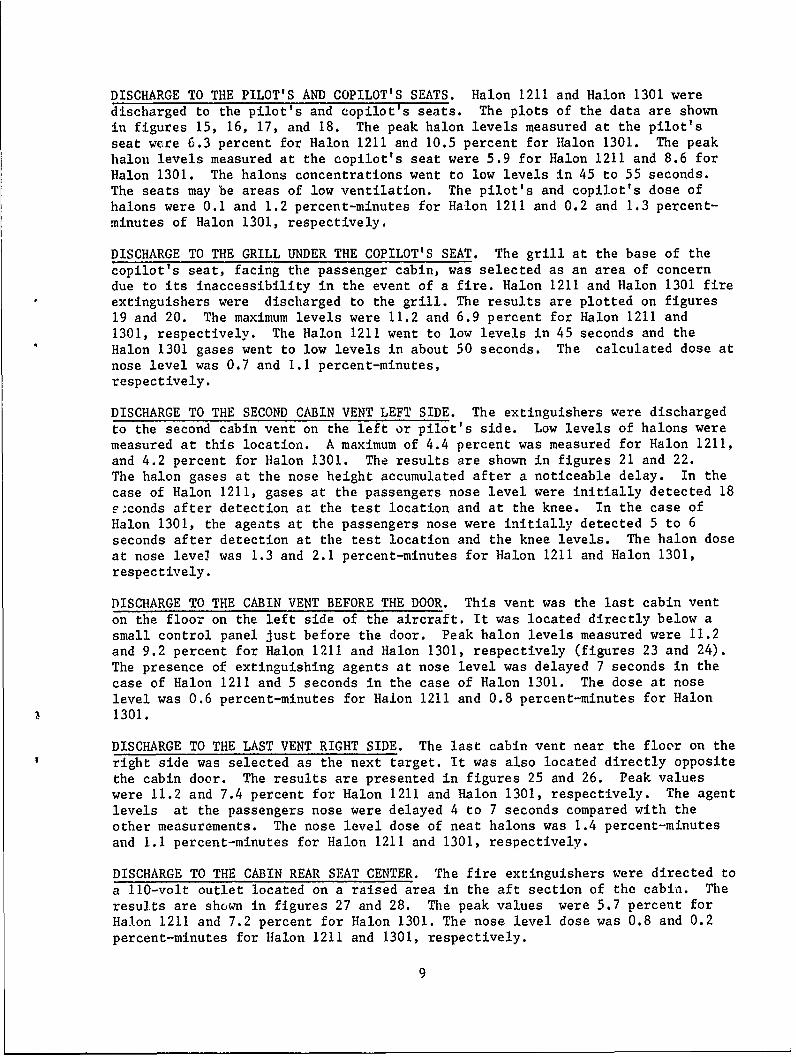
DISCHARGE TO THE PILOT'S AND COPILOT'S SEATS. Halon 1211 and Halon 1301 weredischarged to the pilot's and copilot's seats. The plots of the data are shownin figures 15, 16, 17, and 18. The peak halon levels measured at the pilot'sseat were 6.3 percent for Halon 1211 and 10.5 percent for Halon 1301. The peak
halon levels measured at the copilot's seat were 5.9 for Halon 1211 and 8.6 forHalon 1301. The halons concentrations went to low levels in 45 to 55 seconds.The seats may be areas of low ventilation. The pilot's and copilot's dose ofhalons were 0.1 and 1.2 percent-minutes for Halon 1211 and 0.2 and 1.3 percent-minutes of Halon 1301, respectively.
DISCHARGE TO THE GRILL UNDER THE COPILOT'S SEAT. The grill at the base of thecopilot's seat, facing the passenger cabin, was selected as an area of concerndue to its inaccessibility in the event of a fire. Halon 1211 and Halon 1301 fireextinguishers were discharged to the grill. The results are plotted on figures19 and 20. The maximum levels were 11.2 and 6.9 percent for Halon 1211 and1301, respectively. The Halon 1211 went to low levels in 45 seconds and the
Halon 1301 gases went to low levels in about 50 seconds. The calculated dose atnose level was 0.7 and 1.1 percent-minutes,respectively.
DISCHARGE TO THE SECOND CABIN VENT LEFT SIDE. The extinguishers were discharged
to the second cabin vent on the left or pilot's side. Low levels of halons weremeasured at this location. A maximum of 4.4 percent was measured for Halon 1211,and 4.2 percent for Halon 1301. The results are shown in figures 21 and 22.The halon gases at the nose height accumulated after a noticeable delay. In the
case of Halon 1211, gases at the passengers nose level were initially detected 18econds after detection at the test location and at the knee. In the case ofHalon 1301, the agents at the passengers nose were initially detected 5 to 6
seconds after detection at the test location and the knee levels. The halon doseat nose level was 1.3 and 2.1 percent-minutes for Halon 1211 and Halon 1301,respectively.
DISCHARGE TO THE CABIN VENT BEFORE THE DOOR. This vent was the last cabin vent
on the floor on the left side of the aircraft. It was located directly below asmall control panel just before the door. Peak halon levels measured were 11.2and 9.2 percent for Halon 1211 and Halon 1301, respectively (figures 23 and 24).The presence of extinguishing agents at nose level was delayed 7 seconds in the
case of Halon 1211 and 5 seconds in the case of Halon 1301. The dose at noselevel was 0.6 percent-minutes for Halon 1211 and 0.8 percent-minutes for Halon1301.
DISCHARGE TO THE LAST VENT RIGHT SIDE. The last cabin vent near the floor on theright side was selected as the next target. It was also located directly oppositethe cabin door. The results are presented in figures 25 and 26. Peak valueswere 11.2 and 7.4 percent for Halon 1211 and Halon 1301, respectively. The agentlevels at the passengers nose were delayed 4 to 7 seconds compared with the
other measurements. The nose level dose of neat halons was 1.4 percent-minutesand 1.1 percent-minutes for Halon 1211 and 1301, respectively.
DISCHARGE TO THE CABIN REAR SEAT CENTER. The fire extinguishers were directed to
a 110-volt outlet located on a raised area in the aft section of the cabin. Theresults are shown in figures 27 and 28. The peak values were 5.7 percent forHalon 1211 and 7.2 percent for Halon 1301. The nose level dose was 0.8 and 0.2percent-minutes for Halon 1211 and 1301, respectively.
9
SUMMARY OF EXTINGUISHER AGENT RESULTS.
Hand held fire extinguishers charged with 2.5 pounds Halon 1211 and 3 pounds ofHalon 1301 were discharged in a pressurized Cessna Model 421B aircraft. Theaircraft was pressurized to 5.6 psig on the ground with compressed air. Theagent concentration was measured at the discharge area, at the knee level, and atthe nose level. Aircraft locations of extinguisher discharge were at thefollowing locations: under the instrument panel, the circuit breaker panel, thepilot and copilot seats, the grill under the copilot's seat, the second vent onthe pilot's side, the vent before the door, the last vent on the right side orcopilot's side, and the rear passenger seat/baggage area/il0-volt outlet area.This last location was near the outflow and safety relief valves.
Extinguisher concentration near the location of discharge peaked over 11 percentin three cases. The lowest value recorded was 4.2 percent. The highconcentrations dissipated to low levels in the cockpit in 30 seconds and up to 50seconds in the cabin. The crew and passengers dose exposure to the neat halonswas calculated and found to be low in relation to the amount that can be safelytolerated.
SMOKE ELIMINATION TEST SERIES.
For the smoke elimination testing, both the aerosol smoke meters and the computerwere turned on 1 hour prior to calibration. The smoke generator was turned on,set to a smoke output of nine, and allowed sufficient time to warm up; duringthis time the calibration was performed on the smoke meters. The aircraft waspressurized to 5.6 psig at which time the outflow and pressure relief valvesopened. When the pressure stabilized, the smoke generator was remotely turnedon. After 1 minute and 20 seconds the smoke generator cycled off for 30 secondsand then cycled on again for approximately 40 seconds. It was then turned off.This cycling phenomenon was an inherent characteristic of the smoke generator.When the smoke generator is first powered on, an internal heater block must reacha preset temperature before the unit is operational. Once the generator is turnedon, the smoke fluid is pumped through the heater block, atomized, and dischargedout the nozzle. At smoke settings above 2 1/2, the block will drop below theminimum operating temperature despite the fact that the heater is always on.This causes the smoke generator to cycle off, allowing the heater block to reachoperating temperature. Once the operating temperature is reached, the generatorcycles back on for another I minute and 20 seconds and then the cycle isrepeated. No cycling occurred when the smoke generator was set to a valu! of 2or less. In the tests conducted, this cycling phenomenon merely simulated a firebeing detected, extinguished, restarted, and finally being permanentlyextinguished.
The smoke elimination tests consisted of 6 tests at three locations (figure 29),each test being repeated twice. The three smoke generator locations were asfollows: (1) facing forward and equidistant between the pilot and the copilotseats, (2) facing forward, centered with the first passenger window and the sidesof the aircraft and (3) facing the rear, centered with the fourth passengerwindow and the sides of thi aircraft.
10
SMOKE ELIMINATION TEST RESULTS.
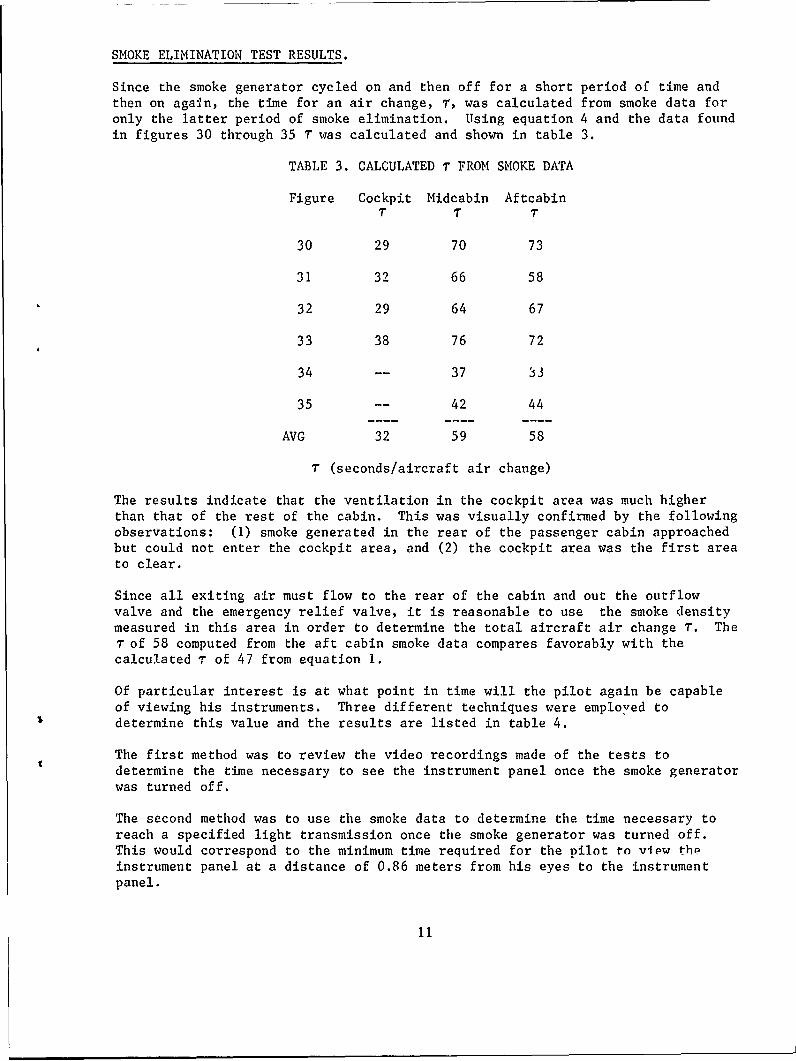
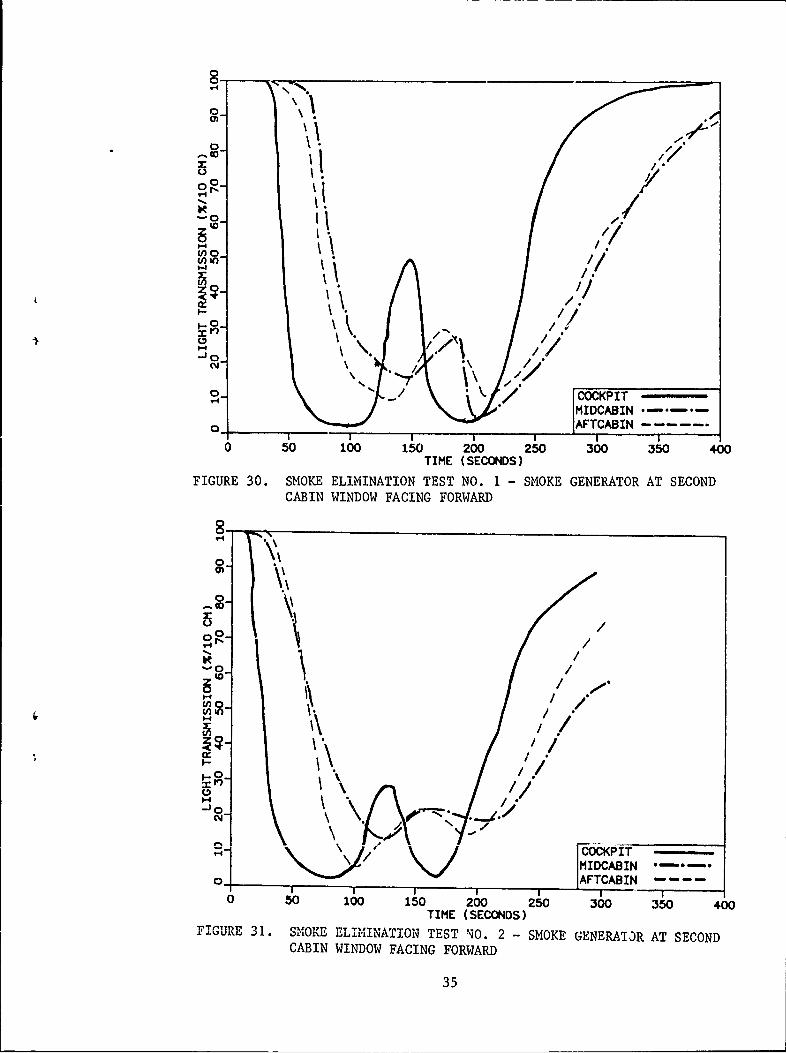
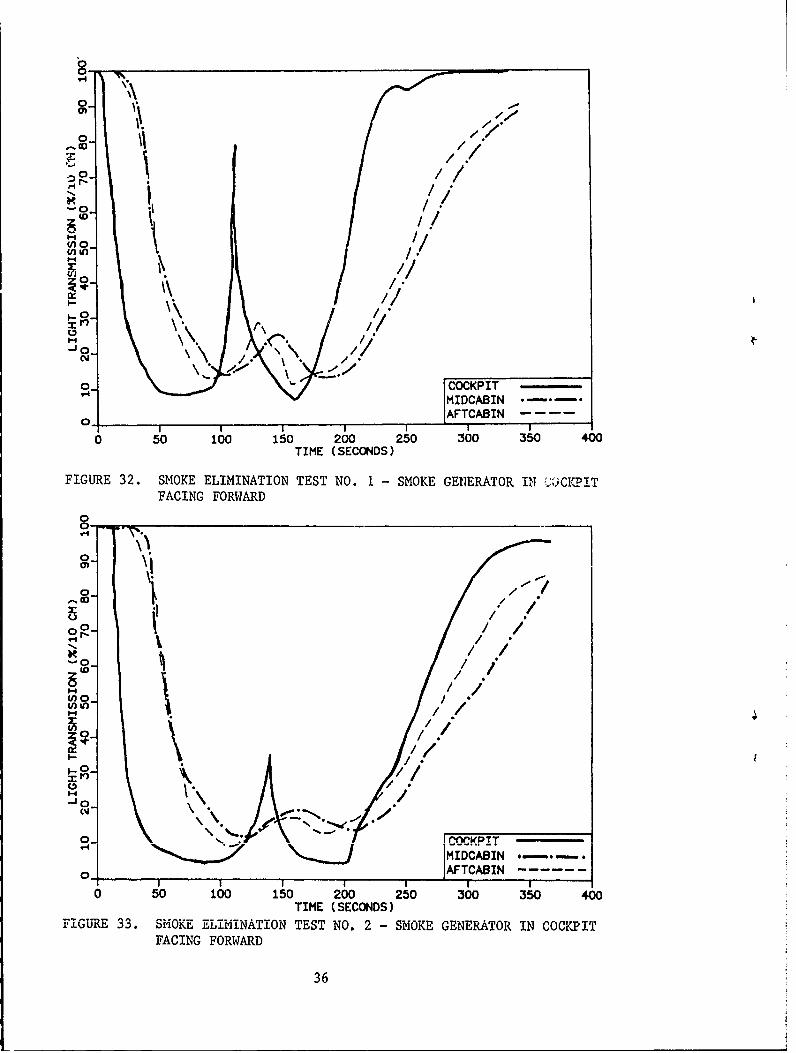
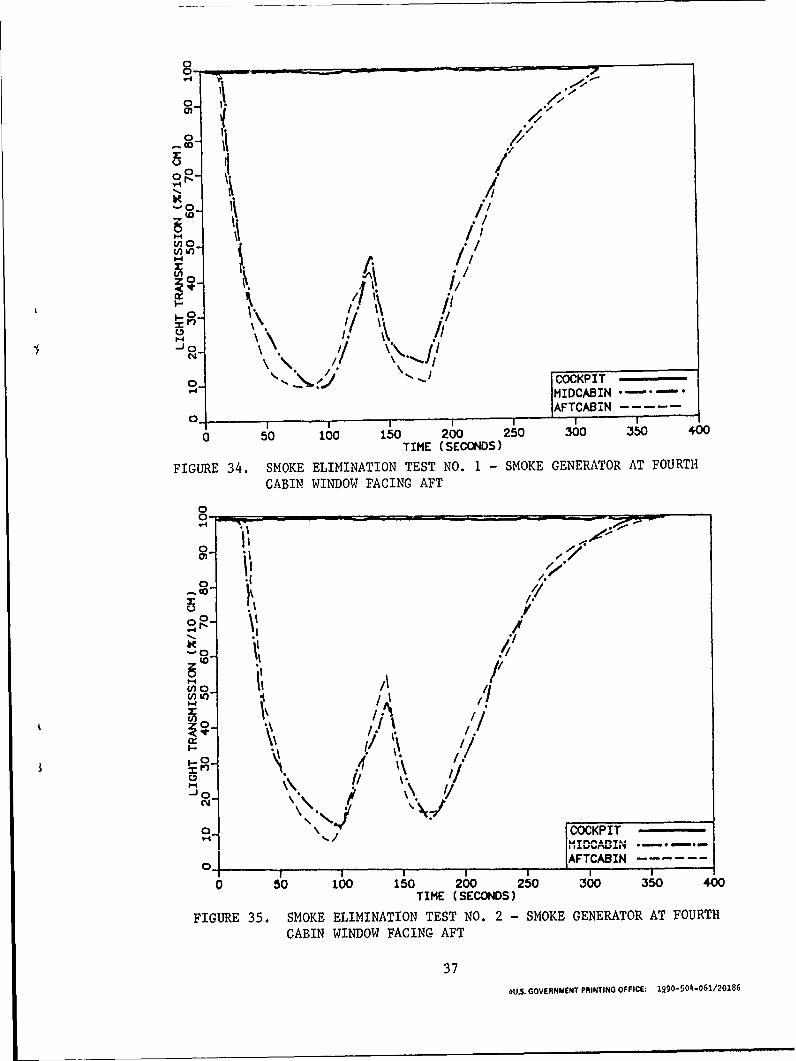
Since the smoke generator cycled on and then off for a short period of time andthen on agan, the time for an air change, T, was calculated from smoke data foronly the latter period of smoke elimination. Using equation 4 and the data foundin figures 30 through 35 T was calculated and shown in table 3.
TABLE 3. CALCULATED T FROM SMOKE DATA
Figure Cockpit Midcabin AftcabinT T T
30 29 70 73
31 32 66 58
32 29 64 67
33 38 76 72
34 -- 37 33
35 -- 42 44
AVG 32 59 58
T (seconds/aircraft air change)
The results indicate that the ventilation in the cockpit area was much higherthan that of the rest of the cabin. This was visually confirmed by the followingobservations: (1) smoke generated in the rear of the passenger cabin approachedbut could not enter the cockpit area, and (2) the cockpit area was the first areato clear.
Since all exiting air must flow to the rear of the cabin and out the outflowvalve and the emergency relief valve, it is reasonable to use the smoke densitymeasured in this area in order to determine the total aircraft air change T. TheT of 58 computed from the aft cabin smoke data compares favorably with thecalculated -, of 47 from equation 1.
Of particular interest is at what point in time will the pilot again be capableof viewing his instruments. Three different techniques were employed todetermine this value and the results are listed in table 4.
The first method was to review the video recordings made of the tests todetermine the time necessary to see the instrument panel once the smoke generatorwas turned off.
The second method was to use the smoke data to determine the time necessary toreach a specified light transmission once the smoke generator was turned off.This would correspond to the minimum time required for the pilot o viw theinstrument panel at a distance of 0.86 meters from his eyes to the instrumentpanel.
11
For visibility of non-illuminated signs (under 25 foot-lamberts), Jin (reference
7) gives the following relationship:
K x L = 3.0 for non-illuminated signs (7)
where K is an extinction coefficient with units in inverse meters and L is the
obscurity threshold in meters. Thus at a distance of 0.86 meters, the viewerwould lose sight of a non-illuminated sign once the extinction coefficientreached 3.5.
"The physical basis for light extinction measurements is Bouguer's law, which
relates the intensity of the incident monochromatic light of wavelength, I0 , andthe intensity of the light, I, transmitted through a path length, L, of the smoke
I/I0 = e-K L (8)
where K is the extinction coefficient." (Reference 8). Using equation 8 and
solving for the corresponding light transmission at 0.86 meters with anextinction coefficient of 3.5 yields
I/I0 = e(-KL)= e(-3.5.86)
= .05
Since I/I0 represents the light transmission at the panel to pilot distance of
0.86 meters, it is necessary to convert this into the corresponding lighttransmission that would be seen by the 10-centimeter sampling length of the smokemeter. The relationship between light transmission and distance is
'i/I0 = (I/10)(LI/L) (9)
where 10 is the light transmission with no particles present, I and Il are thelight transmissions at their respective path lengths of L (0.86 meters) and LI
(0.1 meters). Substituting I/I0 and the two path lengths into equation 10 wouldyield an equivalent light transmission in percent at the smoke meter of
(Ii/IO)(%) (I/10)(LI/L)*IOO (10)
* 05(,Im/. 86m) *100
- .71*100
- 71%
Therefore, once reaching and exceeding this value the pilot would be able to viewthe instrument panel. These times were obtained by using the cockpit data in
figures 30 through 33.
The third method calculated a value based on the perfect stirrer theory used in
reference 4. Which indicates the time necessary for an enclosure to go from 5percent visibility to 71 percent visibility is 2.2T. Thus the calculated timefor the pilot to see his instrument panel is
Time = 2.2(average zalculated r of cockpit)
Time = 2.2(33 seconds)= 73 seconds
12
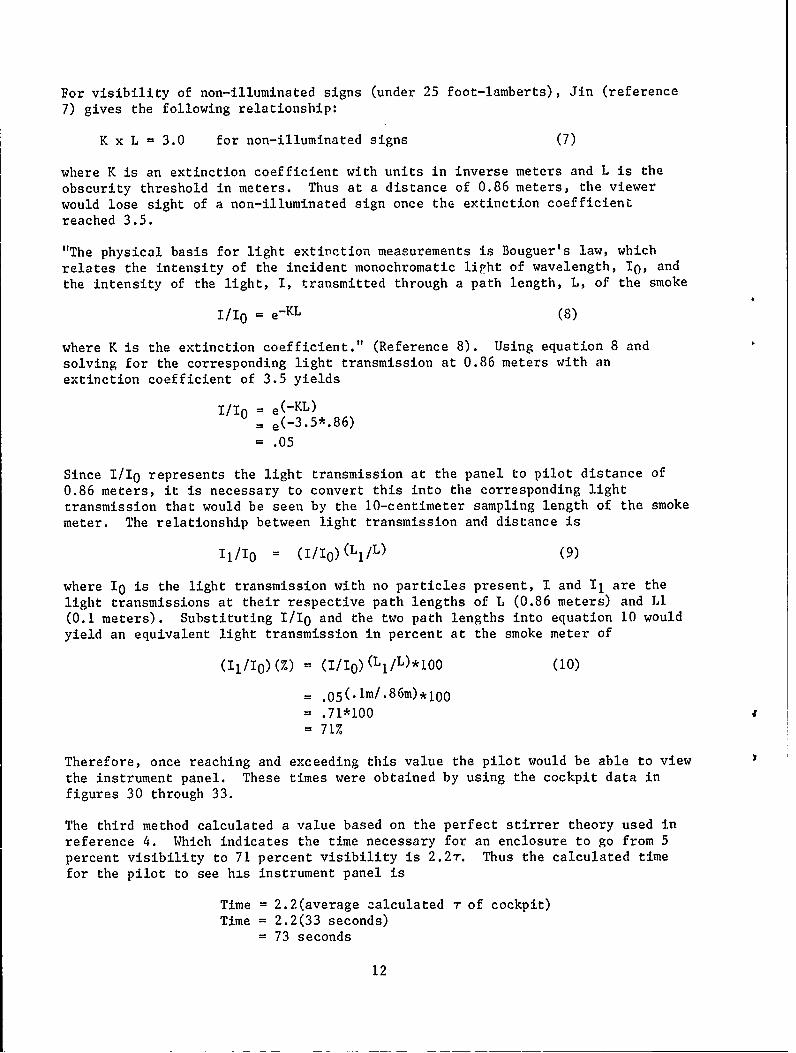
Review of the results of the three methods (table 4) yields comparable values of78, 70, and 73 seconds from near zero visibility until the pilots were able toview the instrument panel, once the smoke generator was turned off.
TABLE 4. TIME TO VIEW INSTRUMENT PANEL
Figure # Video Graphed CalculatedMeasured Time Measured Time Time
Seconds Seconds Seconds
30 105 67 --
31 65 74 --
32 53 56 --
33 90 84 --
Avg Time 78 70 73
Methods two and three were also used to determine the time it would take to viewa non-illuminated sign in the cabin at the same distance (table 5). In methodtwo, the mid cabin and aft cabin data in figures 30 through 35 were used toobtain the measured times. In method three, since the light transmission in themid and aft areas only reached 10 percent, a value of 1.9(T) was used as the timerequired to reach 71 percent light transmission. Calculated time for the mid andaft areas to reach 71 percent light transmission are
Time = (1.9)(59) Time = (1.9)(58)= 112 seconds = 110 seconds
and are shown in table 5.
Review of table 5 shows that the calculatrd times of 112 and 110 seconds comparequite favorable with the measured times of 109 and 105 seconds for the mid andaft cabin areas respectively.
TABLE 5. TIME TO VIEW EMERGENCY SIGNS
Figure # Measured Time Measured Time Cal. Time Cal. TimeMid Cabin Aft Cabin Mid Cabin Aft CabinSeconds Seconds Seconds Seconds
30 152 133 ---31 --- 105 ...32 115 125 ---.
33 132 129 ---
34 67 66 ---.
35 79 73 -..
Avg Time 109 105 112 110
13
SUMMARY OF SMOKE ELIMINATION RESULTS.
Artificial smoke from a smoke generator was released at various locations in aCessna 421B aircraft pressurized to 5.6 psig. The smoke concentration wasmeasured in the cockpit and in the mid and aft cabin areas. A video camera wasmounted at what would be the copilot's eye leve2 .o view the instrument panel.
Calculations from the smoke data indicated that the cockpit air change rate washigher than that of the cabin area. This was confirmed by visual observations.
Calculated values of air change times from the smoke data compared favorably withthe values derived from the pressure/flow measurements.
The average time for the copilot to view the non-illuminated instrument panelonce the smoke generator was turned off was found using three methods. Theresulting times were in close agreement with each other.
Two methods were used to determine the average time for a person to view a non-illuminated sign in the cabin once the smoke generator was turned off.Comparable results were obtained from the measured data and the calculated valuesusing the perfect stirrer theory.
CONCLUSIONS
1. Hand held Halon 1211 fire extinguishers of 2.5-pound capacity and Halon1301 of 3 pound capacity are safe for use in pressurized aircraft similar insize to the Cessna Model 421B.
2. Ventilation of the pressurized aircraft was a major factor in producingsafe conditions at the pilot or passengers' nose level. Calculation of exposureto the neat halons in terms of dose for the pilot and passengers was low.
3. Halon gases dissipated rapidly in the pressurized aircraft.
4. Once the smoke source was eliminated, the higher cockpit air change ratehelped to clear smoke in the cockpit faster than in any other area in theaircraft.
5. The higher air change rates in the cockpit were responsible for keepingsmoke not originating directly in that area from obstructing the crew's view ofthe instrumentation.
6. The application of perfect stirrer theory to small, well ventilated aircraftproduces comparable results with actual tests.
7. Once the smoke source is eliminated, the crew's view of the instrumentpanel at a distance of 0.86 meters will be restored from near zero visibility in75 seconds.
8. Once the smoke source is eliminated, it will take approximately 110 secondsto view a non-illuminated emergency sign in the cabin at a distance of 0.86meters.
14
REFERENCES
1. Slusher, G.R., Wright, J., and Demaree, J.E., Halon Extinguisher AgentBehavior in Ventilated Small Aircraft, DOT/FAA/CT-86/5, June 1986.
2. Slusher, G.R., Wright, J., Demaree, J.E., and Neese, W.E., HalonExtinguishment of Small Aircraft Instrument Panel Fires, DOT/FA7C-86/26,December 1986.
3. Shapiro, Ascher, Compressible Fluid Flow, The Ronald Press Co., New York1953.
4. Eklund, T. T., An Analysis for Relating Visibility to Smoke Production andVentilation, DOT/FAA/CT-TN84/22, May 1984.
5. Eklund, T. I., Analysis of Dissipation of Gaseous Extinguisher Agents inVentilated Compartments, DOT/FAA/CT-83/1, May 1983.
6. E. I. Du Pont De Memours & Company, Inc., Toxicology of Du Pont Halon 1301Fire Extinguishant, S-35A, 1971.
7. Jin Tadeshisa, Visibility Through Fire Smoke, Journal of Fire andFlammability, Volume 9, April 1978 p. 135.
8. Mulholland, G. W., How Well Are We Measuring Smoke?, Fire and Materials,Volume 6, No. 2, 1982.
15
~W L
00h
0z
z Uw 0
H
I II)f wIIz
0H>I A A
II I0II
0 04
0 z iI
0 I 0H
0 0
0 I.-zw0
CL~00
U)10
0
-0co
-0
to -i
z
C-,
C4,
-0
9 9 C z
(DI~) 3bsS~0
174
118
wM-
0
0
4
<H
WH
0 -
(I) (I)
w w 0
U) w W H
0 >z >-
0 w1>
iI II i
I I
Li
0
: C
1-0
~z
040
*H
I'"r4 H
mL
fa
20
I -20
Cc~
WZ
4 -
w
21
I-r 6m 0
21 U
z0
0
w
C,
C14 tzC)
D cc00
C14 NC14 U)NUW ww m m
N ILr
ui N N
U)) w w
CL M u1 c!N
UJJ D1 U0 a N W-. V. a i
Z IL
w C,
VU))c
LLL
U) IL
0
) 0)
N feH
00) 0V)
L)JK) H
iu
-0
QOT 06 09 OL 09 09 O0r OC OZ 0T 0I . '(11 J~W~~~
23
TEST AREAKNEE AREANOSE AREA
0-
cn-
c-
0-
N
II I I I 1 II
-10 0 10 20 30 40 50 60 70 80 90TIME (SECONDS)
FIGURE 9. HALON 1211 CONCENTRATIONS UNDER THE INSTRUMENT PANELCOPILOT'S SIDE
I~TEST AREA- IKNEE AREA
cl_ NOSE AREA
co-
U*)
--
-10 0 10 20 30 40 50 60 70 80 90TIME (SECONDS)
FIGURE 10. HALON 1301 CONCENTRATIONS UNDER THE INSTRUMENT PANELCOPILOT'S SIDE
24
TEST AREAKNEE AREANOSE AREA -
-
-4
I--
zw I-
-
ci
-
-10 0 10 20 30 40 50 60 70 80 90TIME (SECONDS)
FIGURE 11. HAI.ON 1211 CONCENTRATIONS UNTDER THE INSTRUMENT PANELPILOT'S SIDE
- TEST AREA
KNEE AREA
cy NOSE AREA- ---
-4
I--z
WI-
-1 ' 0 5 0 7 0 9
TIE SEONS
FIUE1.HLN10 CNETAIN NE TEISRMN AE
PIOTS ID
N2
TEST AREAKNEE AREANOSE AREA ---
0-
z
0.4
NN
-10 0 10 20 30 40 50 60 70 80 90TIME (SECONDS)
FIGURE 13. HALON 1211 CONCENTRATIONS CIRCUIT BREAKER PANEL PILOT'SSIDE
TEST AREAKNEE AREA
cy- NOSE AREA
o-
z
4-
-10 0 1 0 2 0 3 10 410 50 6 10 70 80 0TIME (SECONDS)
FIGURE 14. HALON 1301 CONCENTRATIONS CIRCUIT BREAKER PANEL PILOT'SSIDE
26
TZ3T AREA_ I',<KNEZ: ARE,%',NOSE Af :k
0)-
-
zU)-
-4
-4
, I
-10 0 10 20 30 G0 :0 60 70 co n3o
TWF7 (SECONDS)
FIGURE 15. HALON 1211 CONCENTRATIONS PILOT'S SEAT
TEST AREAKNEE AREA
N. NOSE AREA
.4
I-~co-
1:8 ''- - --"
/
,. -- ",- ._.,_,.
I - I I~ | III
-10 0 10 20 30 40 50 60 70 80 e0
TIME (SECONDS)
FIGURE 16. HALON 1301 CONCENTRATIONS PILOT'S SEAT
27
TEST AREAKNEE AREANOSE AREA
-
-
-
-4
-10 0 10 20 30 40 50 60 70 80 90TIME (SECONDS)
FIGURE 17. HALON 1211 CONCENTRATIONS COPILOT'S SEAT
4 TEST AREAKNEE AREANOSE AREA
-
-4
W -
z1i -
0
r~)
ci ,
-1 1 0 0 40 5 6 0 0 9TIE(ECNSFIUE1.NLN10 OCNRTOSCPLTSSA
-4 6 28
TEST AREAKNEE AREANOSE AREA----
N
0:
z
'-
04
-10 0 10 20 30 40 50 60 70 80 90TIME (SECONDS)
FIGURE 19. HALON 1211 CONCENTRATIONS CABIN SIDE OF GRILL UNDERCOPILOT'S SEAT
TEST AREAKNEE AREA
cy-NOSE AREA -
-
I-
I--zw1~
0
-10 0 10 20 30 40 50 60 70 80 90TIME (SECONDS)
FIGURE 20. HALON 1301 CONCENTRATIONS CABIN SIDE OF GRILL UNDERCOPILOT'S SEAT
29
ITEST AREAIKNEE AREA
04 14SE AREA
.4
.4
IdN
-10 0 10 20 30 40 50 60 70 80 90TIME (SECONDS)
FIGURE 21. HALON 1211 CONCENTRATIONS CABIN AREA SECOND VENT NEAR FLOORLEFT SIDE
TEST AREAKNEE AREAN0ST AREA ----
'l-4
-1041 0 1 nC0 7 0 g
TIE(ECNS
FI-UE2.R N10 OCNRTOS AI RASCN ETNA LOLETSD
Ij30
.4 TEST AREA -
KNEE AREA -LNOSE AREA --
5O i.4
I--zC-,
04
NI
4
I I I I I II I
-10 0 10 20 30 40 50 60 70 80 90TIME (SECONDS)
FIGURE 23. HALON 1211 CONCENTRATIONS CABIN AREA LAST VENT BEFORE DOORLEFT SIDE
'4TEST AREA
KNEE AREANOSE AREA
c-
o-
zwr-
/-"-
-10 0 10 20 30 40 50 60 70 80 90TIME (SECONDS)
FIGURE 24. HALON 1301 CONCENTRATIONS CABIN AREA LAST VENT BEFORE DOOR
LEFT SIDE
31
TEST AREAKNEE AREA
cy- INOSE AREA
'-
-
u -
I-
-1 0 2 0 4 0 60 7 0 9
~ci
cr to-
N
044.
-10 0 10 20 30 40 50 60 70 80 9TIME (SECONDS)
FIGURE 25. HALON 1211 CONCENTRATIONS CABIN AREA LAST VENT RIGHT SIDE
-4 _____32
TEST AREAKNEE AREA
" INOSE AREA
4
n-
0I-
zC-)
*
I I I I III i
-10 0 10 20 30 40 50 60 70 80 90TIME (SECONDS)
FIGURE 27. HALON 1211 CONCENTRATIONS IN REAR CABIN AT 110-VOLT OUTLET
-TEST AREA
KNEE AREA- NOSE AREA
-
-4
zwfI-C.)
-4lt0
~/
-10 0 10 20 30 40 50 60 70 80 90
TIME (SECONDS)
FIGURE 28. HALON 1301 CONCENTRATIONS IN REAR CABIN AT 110-VOLT OUTLET
33
a:0
LU
LU 0
Y.w0 x2 0
w U
2 0
0n 0z 0
LL 0
~LL 0
U) LUw z w
LDIi U) ILw wt 0 -
z oW (n
0. w mU))
U) 0
2 C-4
r44
34
o
1 OD-1
-
-0-0
C.o,
0. / COCKPIT
MIDCABINAFTCABINI I I I I I
0 50 100 150 200 250 300 350 400TIME (SECONDS)
FIGURE 30. SMOKE ELIMINATION TEST NO. 1I SMOKE GENERATOR AT SECONDCABIN WINDOW FACING FORWARD
8-
\-.
00)
~//- 9 •
40O I /
* - \ . //
1 MIDCABIN. . .~~ AFTCABIN| I I I IO 50 100 150 200 250 300 350 400
TIME (SECONDS)FIUR 3.,SMOE ,E,.LIINATION TEST :NO. 2 - SMOKE GENERATOR AT SECOND
CABIN WINDOW FACING FORWARD
35
07/
'I /-
~0
'no.
0. COCKPIT14 [MIDCASIN . . .
o [AFTCABIN
0 50 100 150 200 250 300 350 400TIME (SECONDS)
FIGURE 32. SMOKE ELIMINATION TEST NO. I- SMOKE GENERATOR IlliOKIFACING FORWARD
-4
o . I /".
0-
t-
o.,. ! COCKpIrT
-4 MIDCABIN
AFTCABIN
I I I I I II
0 50 100 150 200 250 300 350 400TIME (SECONDS)
FIGURE 33. SMOKE ELIMINATION TEST NO. 2 - SMOKE GENERATOR IN COCKPIT
FACING FORWARD
36
00- ~
01"
IDI
I 1.1
t o *1 6
A //0-1rI')-
0-. . "/ COCKPIT
' MIDCAOINAFTCABIN
0-
0 50 100 150 200 250 300 350 400TIME (SECONDS)
FIGURE 34. SMOKE ELIMINATION TEST NO. i - SMOKE GENERATOR AT FOURTH
CABIN WINDOW FACING AFT
0
0-7
W ,,o. 'I,-/
,'I,cno
1-4
0, IAFTc ABI N -- I---
II -2 r~l I I I II
0 so 100 150 200 250 300 350 400TIME (SECONDS)
FIGURE 35. SMOKE ELIMINATION TEST NO. 2 - SMOKE GENERATOR AT FOURTH
CABIN WINDOW FACING AFT
37
6U.S. GOVERNMENT PRINTING OFFICE: 1990-504I-o61/2o186