Embed Size (px)
Citation preview
DOT/FAA/AR-04/8 Office of Aviation Research Washington, D.C. 20591
Limiting Oxygen Concentration Required to Inert Jet Fuel Vapors Existing at Reduced Fuel Tank Pressures—Final Phase August 2004 Final Report This document is available to the U.S. public through the National Technical Information Service (NTIS), Springfield, Virginia 22161.
U.S. Department of Transportation Federal Aviation Administration
NOTICE
This document is disseminated under the sponsorship of the U.S. Department of Transportation in the interest of information exchange. The United States Government assumes no liability for the contents or use thereof. The United States Government does not endorse products or manufacturers. Trade or manufacturer's names appear herein solely because they are considered essential to the objective of this report. This document does not constitute FAA certification policy. Consult your local FAA aircraft certification office as to its use. This report is available at the Federal Aviation Administration William J. Hughes Technical Center's Full-Text Technical Reports page: actlibrary.tc.faa.gov in Adobe Acrobat portable document format (PDF).
Technical Report Documentation Page 1. Report No. DOT/FAA/AR-04/8
2. Government Accession No. 3. Recipient's Catalog No.
4. Title and Subtitle LIMITING OXYGEN CONCENTRATION REQUIRED TO INERT JET FUEL
5. Report Date August 2004
VAPORS EXISTING AT REDUCED FUEL TANK PRESSURES—FINAL PHASE
6. Performing Organization Code
7. Author(s) Steven M. Summer
8. Performing Organization Report No.
9. Performing Organization Name and Address
Federal Aviation Administration William J. Hughes Technical Center Airport and Aircraft Research and
10. Work Unit No. (TRAIS)
Development Division Fire Safety Branch Atlantic City International Airport, NJ 08405
11. Contract or Grant No.
12. Sponsoring Agency Name and Address U.S. Department of Transportation
13. Type of Report and Period Covered Final Report
Federal Aviation Administration Office of Aviation Research Washington, D.C. 20591
14. Sponsoring Agency Code ANM-100
15. Supplementary Notes
This report is an extension of the initial Technical Report published as DOT/FAA/AR-TN02/79. 16. Abstract This report discusses experiments to determine the reduction in oxygen concentration required to prevent a fuel tank explosion. A simulated aircraft fuel tank containing JP-8 fuel of an amount equivalent to a mass loading of approximately 4.5 kg/m3 was used to determine the limiting oxygen concentration (LOC) at pressures corresponding to altitudes ranging from 0 to 38,000 ft. In addition, the peak pressure rise was measured at various altitudes (pressures) due to ignition occurring at O2 levels approximately 1% to 1.5% above the LOC. From these tests, it was determined that the LOC at sea level through 10,000 ft is approximately 12% O2, with a linear increase from 12% at 10,000 ft to approximately 14.5% at 40,000 ft. Tests with various sparks/arcs as ignition sources at sea level showed little variation in results, with the LOC ranging from 11.9% to 12.8%. The single ignition event falling below 12% O2 is attributed to inherent error in the oxygen measurement system, whose sensitivity is stated to be ±1% of the full-scale value (25% O2). In addition, a heated surface capable of igniting a flammable fuel air mixture proved insufficient for ignition in a tank inerted to just 14%. Peak pressures resulting from ignition at oxygen concentrations 1% to 1.5% above LOC values decreased as the altitude was increased to 30,000 ft, while the duration to reach the peak pressure increased. 17. Key Words Fuel, Fuel tank, Flammability, Ignition, Inert, Jet A, JP-8, Limiting oxygen concentration, Nitrogen inerting
18. Distribution Statement This document is available to the public through the National Technical Information Service (NTIS) Springfield, Virginia 22161.
19. Security Classif. (of this report)
Unclassified
20. Security Classif. (of this page)
Unclassified
21. No. of Pages
43
22. Price
Form DOT F 1700.7 (8-72) Reproduction of completed page authorized
TABLE OF CONTENTS Page EXECUTIVE SUMMARY vii 1. INTRODUCTION 1
1.1 Background 1 1.2 Aviation Fuel Specification and Characteristics 1 1.3 Scope of Experiments 3
2. EXPERIMENTAL APPARATUS 4
2.1 Test Article 4 2.2 Pressure Measurement 6 2.3 Vapor Measurement 6
2.3.1 Hydrocarbon Analysis 7 2.3.2 Oxygen Analysis 8
2.4 Ignition Sources 8 2.5 Spark/Arc Energy Calculation Method and Results 9
3. EXPERIMENTAL PROCEDURES 11
3.1 Methane Validation Tests 11 3.2 JP-8 Liquid Fuel Tests 11
4. DISCUSSION OF RESULTS 12
4.1 Methane Validation Tests 12 4.2 JP-8 Liquid Fuel Tests 13
4.2.1 Long-Duration Oil Burner Transformer Tests 13 4.2.2 Engine Spark Igniter Tests 21 4.2.3 Short-Duration Oil Burner Transformer Tests 22 4.2.4 Four Hundred-Cycle Short to Ground Ignition Tests 23 4.2.5 Hot-Surface Vapor Ignition Tests 23
5. CONCLUSIONS 24
6. REFERENCES 24
iii
APPENDICES
A—Commercial and Military Aviation Fuel Specifications B—JP-8 Liquid Fuel Test Data
LIST OF FIGURES Figure Page 1 Typical Flash Point Temperatures of Jet A and Jet B Fuel Blends 2
2 Typical Industry-Accepted Plots of Jet Fuel Flammability Limits 3
3 Schematic of Experimental Setup 5
4 Thermocouple Locations 6
5 Ullage Vapor Sampling System 7
6 Voltage and Current Traces of (a) J-57 Engine Igniter, (b) Oil Burner Transformer Ignition Sources, and (c) 400-Cycle Short 10
7 Experimental Methane LFL Data 13
8 Limiting Oxygen Concentration Data Results—Aluminum Plate Relief Mechanism 14
9 Limiting Oxygen Concentration Data Results— Foil Diaphragm Relief Mechanism 14
10 Limiting Oxygen Concentration Data Results—Minimum and Maximum Values for Ignition and Nonignition 15
11 Limiting Oxygen Concentration Data Results—Fuel-Air Ratio and Fuel Vapor Concentration vs Oxygen Concentration (Sea Level) 16
12 Limiting Oxygen Concentration Data Results—Fuel-Air Ratio and Fuel Vapor Concentration vs Oxygen Concentration (10,000 ft) 17
13 Limiting Oxygen Concentration Data Results—Fuel-Air Ratio and Fuel Vapor Concentration vs Oxygen Concentration (20,000 ft) 17
14 Limiting Oxygen Concentration Data Results—Fuel-Air Ratio and Fuel Vapor Concentration vs Oxygen Concentration (30,000 ft) 18
iv
15 Limiting Oxygen Concentration Data Results—Fuel-Air Ratio and Fuel Vapor Concentration vs Oxygen Concentration (38,000 ft) 18
16 Peak Pressure Rise vs Altitude at O2 Concentrations 1% to 1.5% Above the LOC 19
17 Ignition Time Duration vs Altitude at O2 Concentrations 1% to 1.5% Above the LOC 20
18 Engine Igniter Test Results (Sea Level) 21
19 ASTM D 86 Distillation Curves and Flash Point Data of JP-8 and Hexane Mixtures 22
LIST OF TABLES
Tables Page 1 Altitude-Pressure Data 4 2 Measured Spark/Arc Energies 9 3 Nonvented, Full Vessel Ignition Pressure Results 20 4 Short-Duration Oil Burner Transformer Test Results 22 5 Four Hundred-Cycle Short Test Results 23 6 Hot-Surface Vapor Ignition Test Results 24
v
LIST OF ACRONYMS FAA Federal Aviation Administration CWT Center wing tank LOC Limiting oxygen concentration NTSB National Transportation Safety Board LFL Lean flammability limit ASTM American Society of Testing and Materials HAVI Hot-surface vapor ignition THC Total hydrocarbon FID Flame ionization detector FAR Fuel-air mass ration UFL Upper flammability limit HST Hot-surface temperature
vi
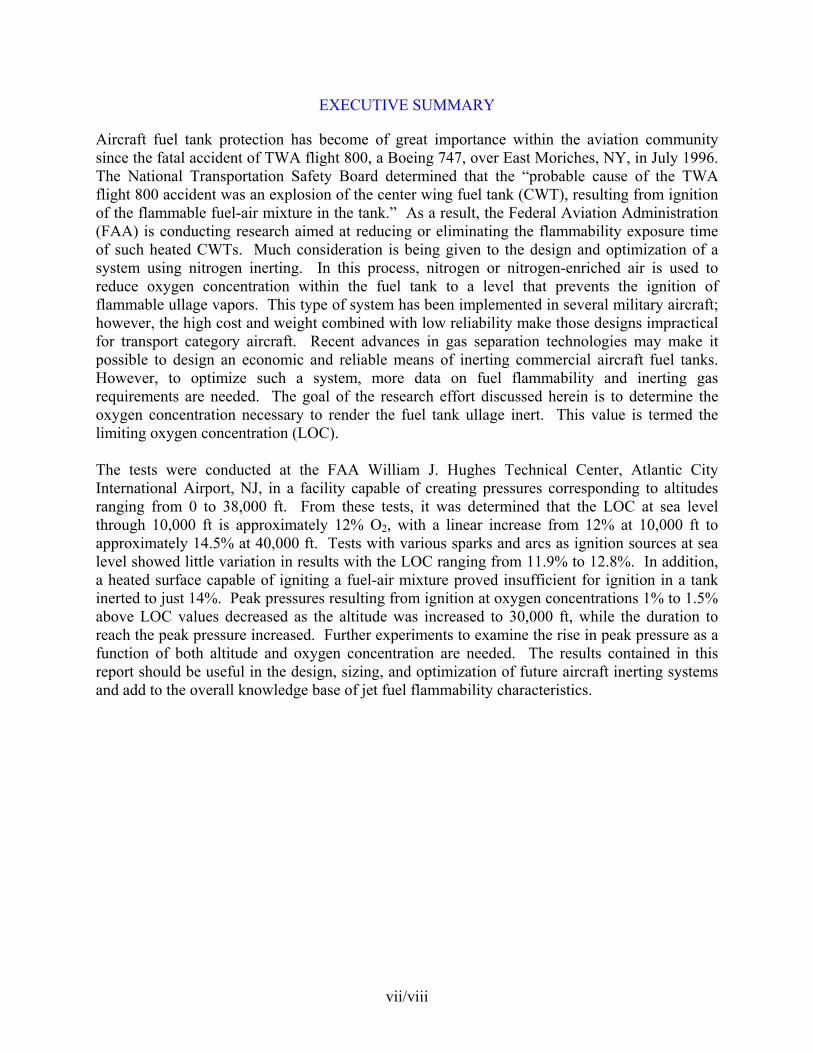
EXECUTIVE SUMMARY
Aircraft fuel tank protection has become of great importance within the aviation community since the fatal accident of TWA flight 800, a Boeing 747, over East Moriches, NY, in July 1996. The National Transportation Safety Board determined that the “probable cause of the TWA flight 800 accident was an explosion of the center wing fuel tank (CWT), resulting from ignition of the flammable fuel-air mixture in the tank.” As a result, the Federal Aviation Administration (FAA) is conducting research aimed at reducing or eliminating the flammability exposure time of such heated CWTs. Much consideration is being given to the design and optimization of a system using nitrogen inerting. In this process, nitrogen or nitrogen-enriched air is used to reduce oxygen concentration within the fuel tank to a level that prevents the ignition of flammable ullage vapors. This type of system has been implemented in several military aircraft; however, the high cost and weight combined with low reliability make those designs impractical for transport category aircraft. Recent advances in gas separation technologies may make it possible to design an economic and reliable means of inerting commercial aircraft fuel tanks. However, to optimize such a system, more data on fuel flammability and inerting gas requirements are needed. The goal of the research effort discussed herein is to determine the oxygen concentration necessary to render the fuel tank ullage inert. This value is termed the limiting oxygen concentration (LOC). The tests were conducted at the FAA William J. Hughes Technical Center, Atlantic City International Airport, NJ, in a facility capable of creating pressures corresponding to altitudes ranging from 0 to 38,000 ft. From these tests, it was determined that the LOC at sea level through 10,000 ft is approximately 12% O2, with a linear increase from 12% at 10,000 ft to approximately 14.5% at 40,000 ft. Tests with various sparks and arcs as ignition sources at sea level showed little variation in results with the LOC ranging from 11.9% to 12.8%. In addition, a heated surface capable of igniting a fuel-air mixture proved insufficient for ignition in a tank inerted to just 14%. Peak pressures resulting from ignition at oxygen concentrations 1% to 1.5% above LOC values decreased as the altitude was increased to 30,000 ft, while the duration to reach the peak pressure increased. Further experiments to examine the rise in peak pressure as a function of both altitude and oxygen concentration are needed. The results contained in this report should be useful in the design, sizing, and optimization of future aircraft inerting systems and add to the overall knowledge base of jet fuel flammability characteristics.
vii/viii
1. INTRODUCTION.
1.1 BACKGROUND.
Aircraft fuel tank protection has become of great interest within the aviation community since the fatal accident of TWA flight 800, a Boeing 747, over East Moriches, NY, in July 1996. The National Transportation Safety Board (NTSB) determined that the “probable cause of the TWA flight 800 accident was an explosion of the center wing fuel tank (CWT), resulting from ignition of the flammable fuel/air mixture in the tank” [1]. The NTSB [1] further concluded that contributing factors to the accident were that the design and certification of the aircraft required only the preclusion of all potential ignition sources to prevent a fuel tank explosion. No measures were taken to reduce heat transfer or inert the fuel tank. In several aircraft configurations, including the B747, the environmental conditioning system packs are located beneath the CWT. The hot bleed air from this system, passing directly underneath the tank, is the driving force behind the generation of flammabable fuel vapor in the ullage. In fact, the Aviation Rulemaking Advisory Committee’s Fuel Tank Harmonization Working Group [2] found that heated CWTs contain a flammable fuel-air mixture 30% of the total flight time compared with only 4% to 6% of the flight time for unheated CWTs and 2% to 4% for typical unheated main wing tanks. The Federal Aviation Administration (FAA) is currently conducting research aimed at reducing or eliminating the flammability exposure time of CWTs. Much consideration is being given to the design and optimization of a system involving nitrogen inerting. In this process, nitrogen or nitrogen-enriched air would be used to reduce the oxygen concentration within the fuel tank to a level at which ignition could not be supported by the flammable vapors. Inerting systems have been implemented in several military aircraft; however, the high cost and weight combined with low reliability make military designs impractical for transport category aircraft. Recent advances in gas separation technologies may make it possible to design an economic and reliable means of inerting aircraft fuel tanks. However, to optimize such a system, more data concerning fuel flammability and inerting gas requirements are needed throughout the operational envelope of a fuel tank, including the effect of various possible ignition sources. 1.2 AVIATION FUEL SPECIFICATION AND CHARACTERISTICS.
In the United States, specific requirements relative to aviation turbine fuel properties is set forth by the American Society of Testing and Materials (ASTM) Standard D 1655. This standard limits itself to the commercial grade fuels Jet A, Jet A-1, and Jet B. Jet A and Jet A-1 are the most commonly used aviation fuels, differing only in their freezing point (-40°C for Jet A and -47°C for Jet A-1). Both are derived from kerosene and have a relatively high flash point, set at a minimum of 38°C (100°F). Jet B fuel, on the other hand, is rarely used today. Jet B is essentially the same as JP-4, a standard U.S. military fuel that was used until 1988 when a transition to JP-8 (a fuel which is very similar to Jet A) was initiated [3]. In addition, the U.S. military also currently uses the high flash point (60°C), kerosene-based JP-5 fuel for U.S. Navy carrier-based aircraft. While ASTM D 1655 does not control the specifications for these military fuels, a listing of their
1
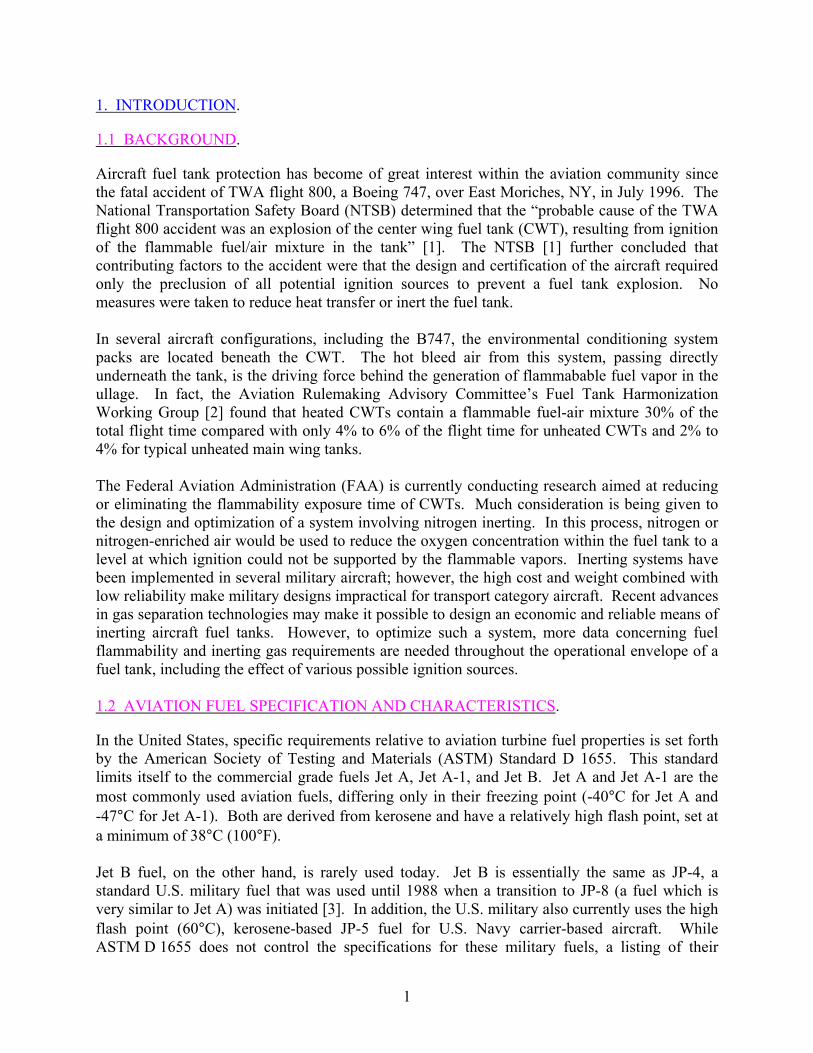
corresponding requirements can be found in the Handbook of Aviation Fuel Properties [4]. These specifications, for JP-4, -5, and -8, as well as those from ASTM D 1655 for Jet A, Jet A-1, and Jet B, are given in appendix A for convenience. The fuel used in the experiments discussed within this report was JP-8, which can be treated approximately as Jet A (see appendix A for a direct comparison). With regards to the chemical composition of Jet A, ASTM D 1655 states that these fuels “shall consist of refined hydrocarbons derived from conventional sources including crude oil, natural gas liquids, heavy oil, and tar sands.” There are no provisions given for the exact composition of the fuel, and as such, the properties of any given fuel batch can vary from that of any other, provided that they meet the minimum specifications set forth in ASTM D 1655. This lack of a definitive composition results in fuels that consist of hundreds of chemical species. Regarding the flammability properties of aviation fuels, the two most widely used parameters are the fuel’s flash point and flammability limits, given in terms of altitude and temperature data. The flash point of a liquid fuel is defined as the lowest temperature at atmospheric pressure, at which sufficient vapor is released by the fuel to support ignition. The current standardized methods for determining the flash point are ASTM D 56 and ASTM D 3828. Both methods place a sample of fuel in a closed cup and heat it at a constant rate. A small flame is introduced into the cup, and the lowest temperature at which ignition is observed is referred to as the flash point. Figure 1, as taken from reference 4, shows a graph of approximate flash points versus blends of Jet A and Jet B fuels.
Fuel Composition by Volume
Flas
h Po
int (
AST
M D
93)
Tem
pera
ture
, °C
FIGURE 1. TYPICAL FLASH POINT TEMPERATURES OF JET A AND
JET B FUEL BLENDS
2
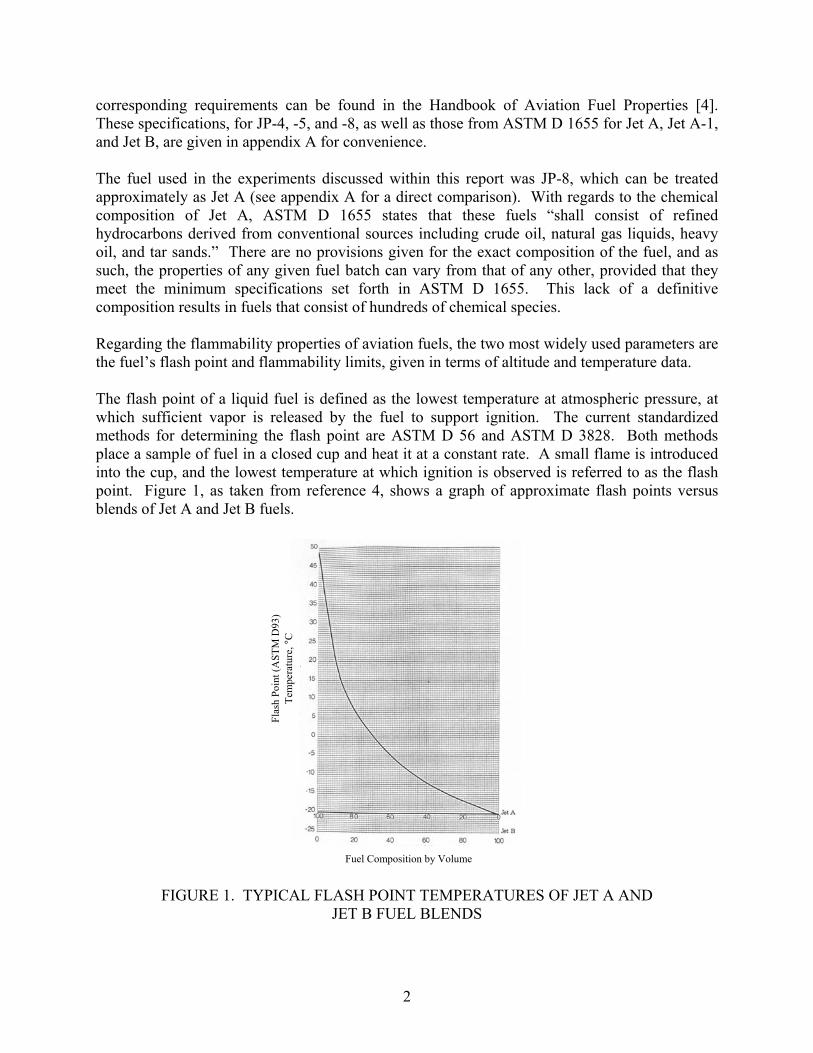
The flammability limits of a given fuel provide more information than the flash point measurement, especially when presented as regions of flammability in terms of altitude and fuel temperature. At any given altitude (pressure), a fuel will have a lean (or lower) flammability limit (LFL) and a rich (or upper) flammability limit. Within these limits, ignition of vapors may occur, while outside the limits there should be no observed combustion phenomenon. Over the years, there have been numerous experiments to determine the flammability limits of aviation turbine fuels. A typical plot of these limits, including ignition energies, for Jet A and Jet B fuels is shown in figure 2, as taken from reference 3.
FIGURE 2. TYPICAL INDUSTRY-ACCEPTED PLOTS OF JET FUEL
FLAMMABILITY LIMITS Both the flash point and flammability limits given above assume isothermal and equilibrium conditions, not taking into account such things as possible condensation of the fuel vapor and variation of the ullage composition. To provide useful data for fuel tank inerting requirements, data on the reduction of fuel flammability as a function of oxygen depletion are needed. 1.3 SCOPE OF EXPERIMENTS.
The purpose of the experimental research discussed in this report is to further quantify the oxygen concentrations required to protect against the ignition of JP-8 fuel vapors at altitudes ranging from 0 to 38,000 ft. This data will aid in the design of nitrogen-inerting systems for use in aircraft fuel tanks. Throughout the experiments, the lowest oxygen concentration resulting in ignition of the ullage fuel vapors is referred to as the limiting oxygen concentration (LOC).
3
2. EXPERIMENTAL APPARATUS.
2.1 TEST ARTICLE.
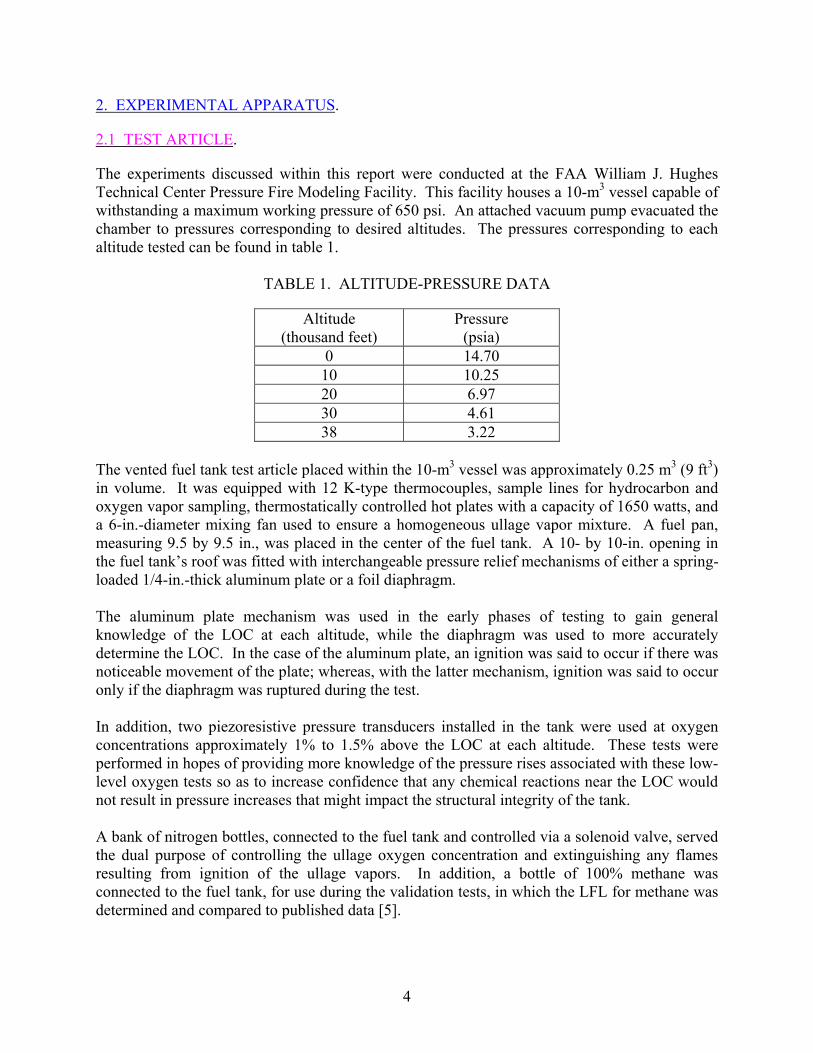
The experiments discussed within this report were conducted at the FAA William J. Hughes Technical Center Pressure Fire Modeling Facility. This facility houses a 10-m3 vessel capable of withstanding a maximum working pressure of 650 psi. An attached vacuum pump evacuated the chamber to pressures corresponding to desired altitudes. The pressures corresponding to each altitude tested can be found in table 1.
TABLE 1. ALTITUDE-PRESSURE DATA
Altitude (thousand feet)
Pressure (psia)
0 14.70 10 10.25 20 6.97 30 4.61 38 3.22
The vented fuel tank test article placed within the 10-m3 vessel was approximately 0.25 m3 (9 ft3) in volume. It was equipped with 12 K-type thermocouples, sample lines for hydrocarbon and oxygen vapor sampling, thermostatically controlled hot plates with a capacity of 1650 watts, and a 6-in.-diameter mixing fan used to ensure a homogeneous ullage vapor mixture. A fuel pan, measuring 9.5 by 9.5 in., was placed in the center of the fuel tank. A 10- by 10-in. opening in the fuel tank’s roof was fitted with interchangeable pressure relief mechanisms of either a spring-loaded 1/4-in.-thick aluminum plate or a foil diaphragm. The aluminum plate mechanism was used in the early phases of testing to gain general knowledge of the LOC at each altitude, while the diaphragm was used to more accurately determine the LOC. In the case of the aluminum plate, an ignition was said to occur if there was noticeable movement of the plate; whereas, with the latter mechanism, ignition was said to occur only if the diaphragm was ruptured during the test. In addition, two piezoresistive pressure transducers installed in the tank were used at oxygen concentrations approximately 1% to 1.5% above the LOC at each altitude. These tests were performed in hopes of providing more knowledge of the pressure rises associated with these low-level oxygen tests so as to increase confidence that any chemical reactions near the LOC would not result in pressure increases that might impact the structural integrity of the tank. A bank of nitrogen bottles, connected to the fuel tank and controlled via a solenoid valve, served the dual purpose of controlling the ullage oxygen concentration and extinguishing any flames resulting from ignition of the ullage vapors. In addition, a bottle of 100% methane was connected to the fuel tank, for use during the validation tests, in which the LFL for methane was determined and compared to published data [5].
4
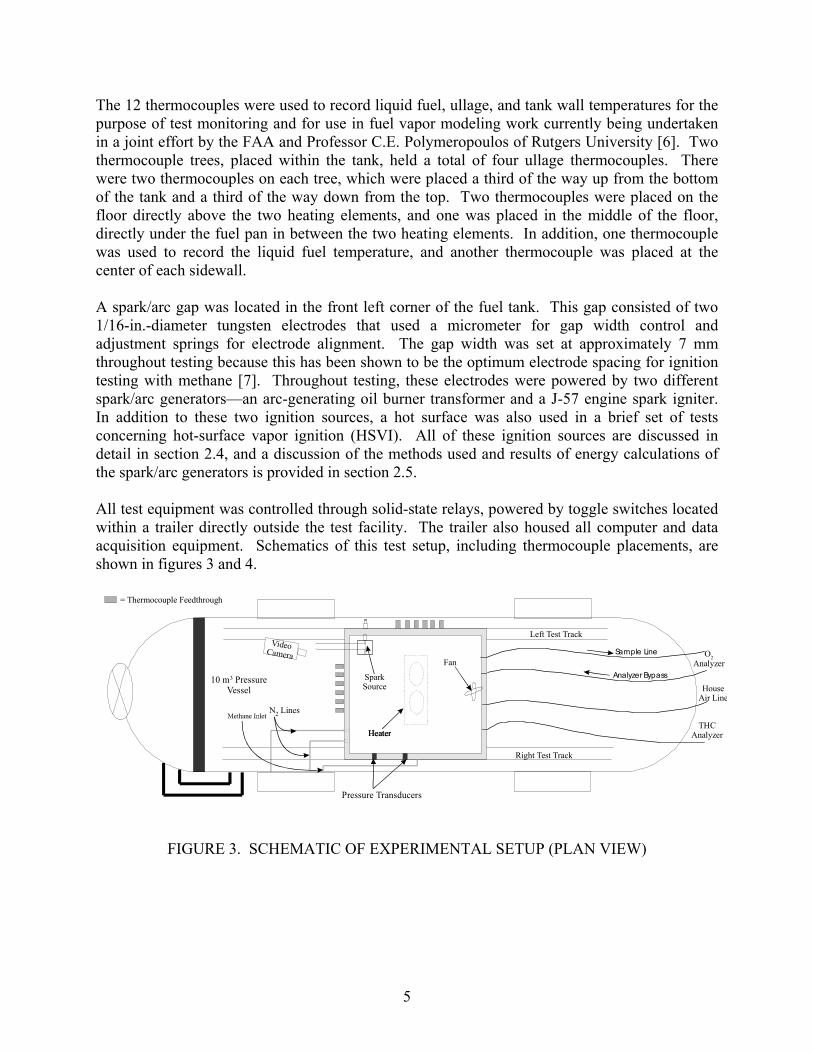
The 12 thermocouples were used to record liquid fuel, ullage, and tank wall temperatures for the purpose of test monitoring and for use in fuel vapor modeling work currently being undertaken in a joint effort by the FAA and Professor C.E. Polymeropoulos of Rutgers University [6]. Two thermocouple trees, placed within the tank, held a total of four ullage thermocouples. There were two thermocouples on each tree, which were placed a third of the way up from the bottom of the tank and a third of the way down from the top. Two thermocouples were placed on the floor directly above the two heating elements, and one was placed in the middle of the floor, directly under the fuel pan in between the two heating elements. In addition, one thermocouple was used to record the liquid fuel temperature, and another thermocouple was placed at the center of each sidewall. A spark/arc gap was located in the front left corner of the fuel tank. This gap consisted of two 1/16-in.-diameter tungsten electrodes that used a micrometer for gap width control and adjustment springs for electrode alignment. The gap width was set at approximately 7 mm throughout testing because this has been shown to be the optimum electrode spacing for ignition testing with methane [7]. Throughout testing, these electrodes were powered by two different spark/arc generators—an arc-generating oil burner transformer and a J-57 engine spark igniter. In addition to these two ignition sources, a hot surface was also used in a brief set of tests concerning hot-surface vapor ignition (HSVI). All of these ignition sources are discussed in detail in section 2.4, and a discussion of the methods used and results of energy calculations of the spark/arc generators is provided in section 2.5. All test equipment was controlled through solid-state relays, powered by toggle switches located within a trailer directly outside the test facility. The trailer also housed all computer and data acquisition equipment. Schematics of this test setup, including thermocouple placements, are shown in figures 3 and 4.
Video Camera
THC Analyzer
Right Test Track
Left Test Track
10 m Pressure Vessel3 Analyzer Bypass
Sample Line O Analyzer
2
HeaterHeater
Spark Source
Fan
= Thermocouple Feedthrough
N Lines2
House Air Line
Pressure Transducers
FIGURE 3. SCHEMATIC OF EXPERIMENTAL SETUP (PLAN VIEW)
5
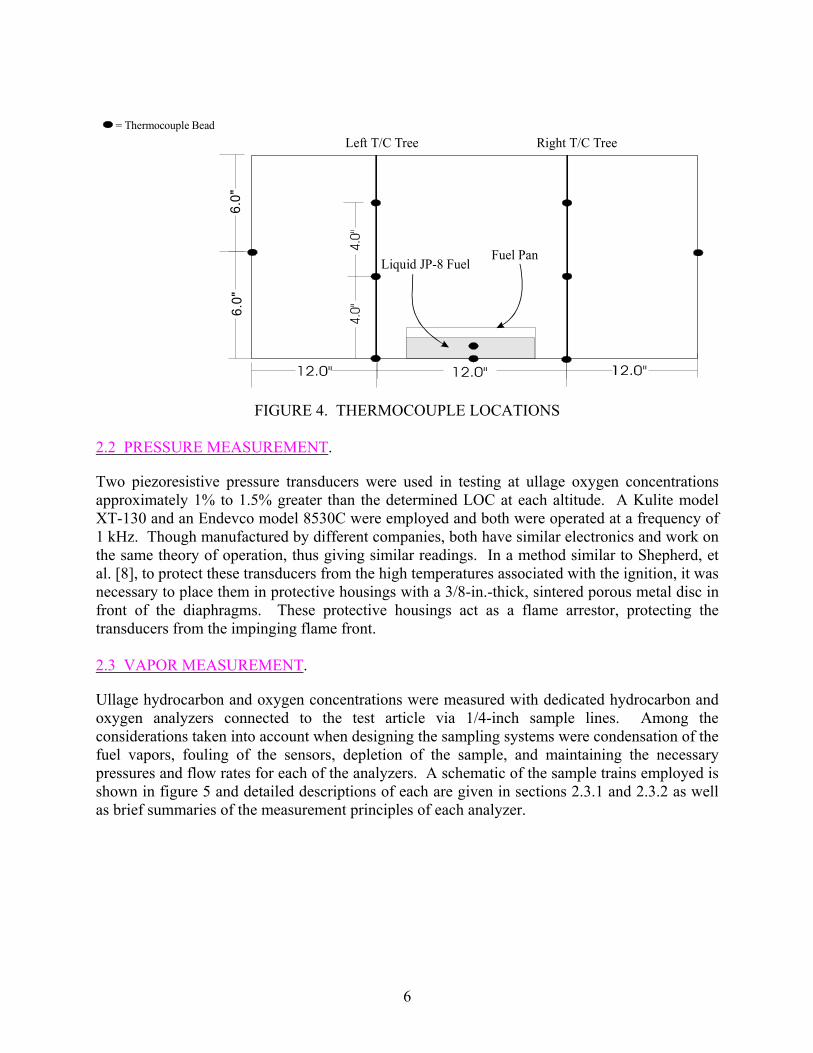
Right T/C TreeLeft T/C Tree
Liquid JP-8 FuelFuel Pan
= Thermocouple Bead
6.0"
6.0"
FIGURE 4. THERMOCOUPLE LOCATIONS 2.2 PRESSURE MEASUREMENT.
Two piezoresistive pressure transducers were used in testing at ullage oxygen concentrations approximately 1% to 1.5% greater than the determined LOC at each altitude. A Kulite model XT-130 and an Endevco model 8530C were employed and both were operated at a frequency of 1 kHz. Though manufactured by different companies, both have similar electronics and work on the same theory of operation, thus giving similar readings. In a method similar to Shepherd, et al. [8], to protect these transducers from the high temperatures associated with the ignition, it was necessary to place them in protective housings with a 3/8-in.-thick, sintered porous metal disc in front of the diaphragms. These protective housings act as a flame arrestor, protecting the transducers from the impinging flame front. 2.3 VAPOR MEASUREMENT.
Ullage hydrocarbon and oxygen concentrations were measured with dedicated hydrocarbon and oxygen analyzers connected to the test article via 1/4-inch sample lines. Among the considerations taken into account when designing the sampling systems were condensation of the fuel vapors, fouling of the sensors, depletion of the sample, and maintaining the necessary pressures and flow rates for each of the analyzers. A schematic of the sample trains employed is shown in figure 5 and detailed descriptions of each are given in sections 2.3.1 and 2.3.2 as well as brief summaries of the measurement principles of each analyzer.
6
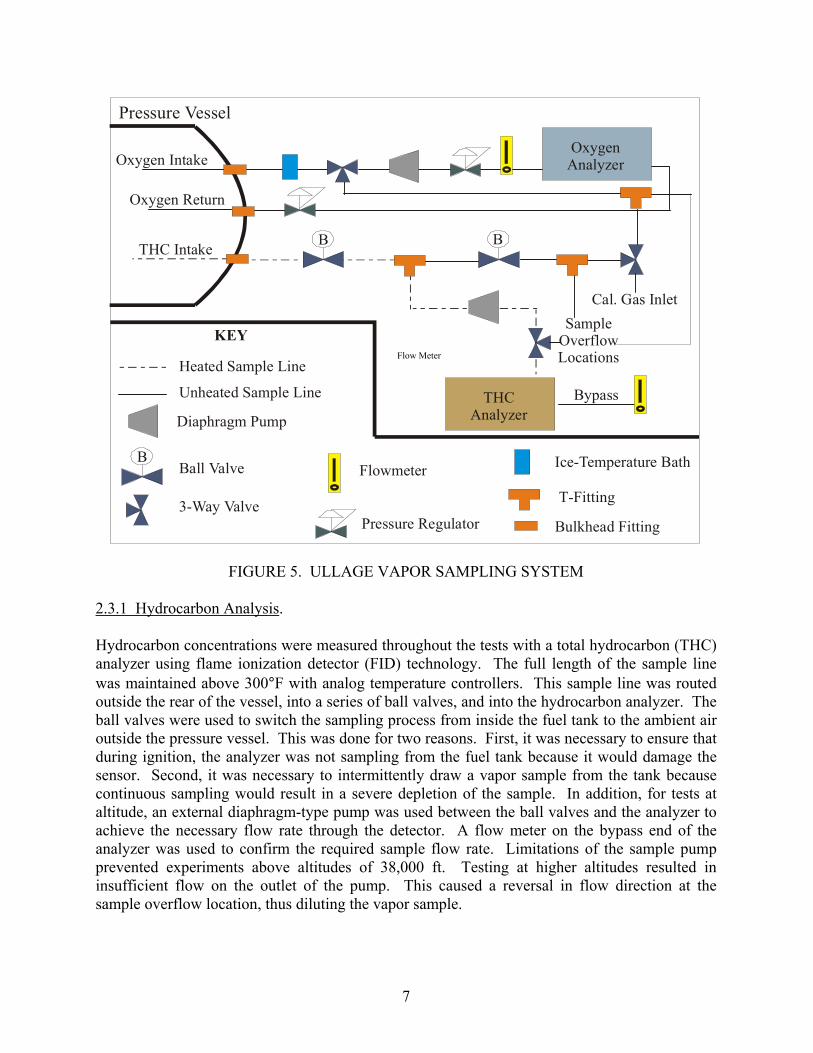
B
THC Analyzer
Pressure Vessel
B
Oxygen Analyzer
Heated Sample Line
Unheated Sample Line
BBall Valve
T-Fitting3-Way Valve
Flowmeter
Pressure Regulator
Diaphragm Pump
Bulkhead Fitting
KEY
Cal. Gas Inlet
Bypass
THC Intake
Oxygen Intake
Oxygen Return
SampleOverflowLocations
Ice-Temperature Bath
Flow Meter
FIGURE 5. ULLAGE VAPOR SAMPLING SYSTEM
2.3.1 Hydrocarbon Analysis. Hydrocarbon concentrations were measured throughout the tests with a total hydrocarbon (THC) analyzer using flame ionization detector (FID) technology. The full length of the sample line was maintained above 300°F with analog temperature controllers. This sample line was routed outside the rear of the vessel, into a series of ball valves, and into the hydrocarbon analyzer. The ball valves were used to switch the sampling process from inside the fuel tank to the ambient air outside the pressure vessel. This was done for two reasons. First, it was necessary to ensure that during ignition, the analyzer was not sampling from the fuel tank because it would damage the sensor. Second, it was necessary to intermittently draw a vapor sample from the tank because continuous sampling would result in a severe depletion of the sample. In addition, for tests at altitude, an external diaphragm-type pump was used between the ball valves and the analyzer to achieve the necessary flow rate through the detector. A flow meter on the bypass end of the analyzer was used to confirm the required sample flow rate. Limitations of the sample pump prevented experiments above altitudes of 38,000 ft. Testing at higher altitudes resulted in insufficient flow on the outlet of the pump. This caused a reversal in flow direction at the sample overflow location, thus diluting the vapor sample.
7
Calibration of the THC analyzer was performed by flowing mixtures of varying propane concentration directly into the calibration ports of the analyzer. This calibration was then checked by allowing the calibration gas to flow through the pump into the sample inlet to ensure that there was no variance between the sample line and the calibration line. The measurement principle of an FID analyzer is based on the ionization of organically bound carbon atoms in a hydrogen flame. The vapor sample is mixed with a hydrogen fuel mixture prior to reaching the burner, where the high temperature of the hydrogen flame causes reaction of the hydrocarbon compounds. Ions produced by this combustion are detected by the electrodes of the FID, and the resulting current is amplified and outputted. This output is proportional to the number of carbon atoms for all hydrocarbon molecules and provides accurate THC measurements in terms of a volumetric concentration relative to the calibration gas. 2.3.2 Oxygen Analysis. A Rosemount OM-11 EA oxygen analyzer was used to record the tank oxygen concentrations throughout the test program. Using a diaphragm-type pump in conjunction with a pressure regulator and flow meter to maintain a steady flow and pressure, the sample was drawn from the tank through an ice temperature bath, into the analyzer, and then recirculated back into the tank. A backpressure regulator on the return side ensured positive flow back into the test article. The ice temperature bath was used to condense out the hydrocarbons from the sample prior to reaching the oxygen sensor, which was found to be sensitive to these liquids. Calibration was performed by inserting mixtures of varying oxygen concentration into the sample line upstream of the diaphragm pump. The OM-11 is, in essence, a partial pressure-sensing device. It uses a polarographic oxygen analysis technique, whereby two electrodes immersed in potassium chloride gel permit the diffusion of oxygen across a Teflon membrane. The rate of this diffusion is proportional to the partial pressure of oxygen on the outside of the membrane. The OM-11 converts this partial pressure into a reading of volumetric percent oxygen concentration, having an output on a scale of 0 to 5 Vdc. 2.4 IGNITION SOURCES.
A range of ignition sources were employed throughout the testing. The initial ignition source was an oil burner transformer connected to an analog timer, which provided a low-power arc of both short (0.1 second) and long durations (1 second). High-powered sparks were then obtained through two methods: (1) a spark igniter taken from a J-57 engine provided a very short-duration (175 µseconds), high-powered spark and (2) a hard short of a 120 V, 400-cycle line to ground provided a spark of approximately 0.01 second in duration with an energy of approximately 2-3 Joules. In addition to these arcs and spark, a heated metal block was used as a hot-surface ignition source. The heated metal block, which measured 1″ x 3″ x 6″ long, was heated by two 0.75″ diameter heating rods that passed through the unit and was monitored by a thermocouple mounted to the top surface. A wide range of ignition sources were tested to determine any variation in the LOC due to ignition source duration and power (energy).
8
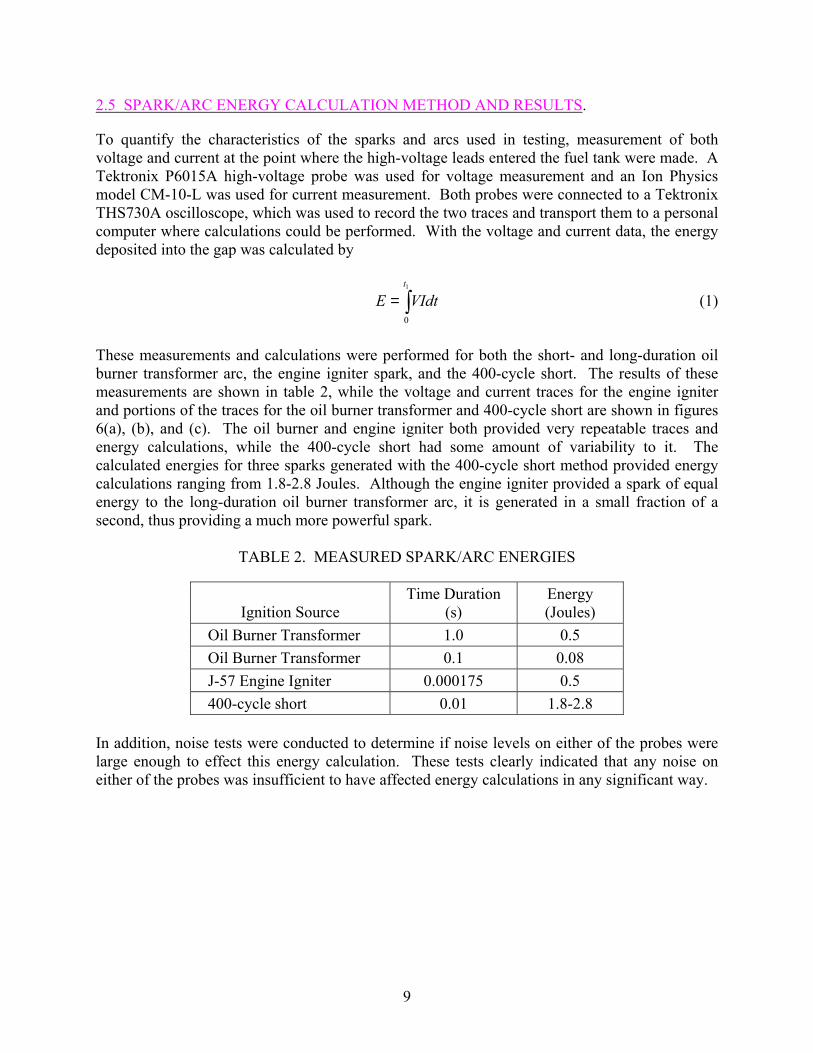
2.5 SPARK/ARC ENERGY CALCULATION METHOD AND RESULTS.
To quantify the characteristics of the sparks and arcs used in testing, measurement of both voltage and current at the point where the high-voltage leads entered the fuel tank were made. A Tektronix P6015A high-voltage probe was used for voltage measurement and an Ion Physics model CM-10-L was used for current measurement. Both probes were connected to a Tektronix THS730A oscilloscope, which was used to record the two traces and transport them to a personal computer where calculations could be performed. With the voltage and current data, the energy deposited into the gap was calculated by
(1) ∫=1
0
t
VIdtE
These measurements and calculations were performed for both the short- and long-duration oil burner transformer arc, the engine igniter spark, and the 400-cycle short. The results of these measurements are shown in table 2, while the voltage and current traces for the engine igniter and portions of the traces for the oil burner transformer and 400-cycle short are shown in figures 6(a), (b), and (c). The oil burner and engine igniter both provided very repeatable traces and energy calculations, while the 400-cycle short had some amount of variability to it. The calculated energies for three sparks generated with the 400-cycle short method provided energy calculations ranging from 1.8-2.8 Joules. Although the engine igniter provided a spark of equal energy to the long-duration oil burner transformer arc, it is generated in a small fraction of a second, thus providing a much more powerful spark.
TABLE 2. MEASURED SPARK/ARC ENERGIES
Ignition Source Time Duration
(s) Energy (Joules)
Oil Burner Transformer 1.0 0.5 Oil Burner Transformer 0.1 0.08 J-57 Engine Igniter 0.000175 0.5 400-cycle short 0.01 1.8-2.8
In addition, noise tests were conducted to determine if noise levels on either of the probes were large enough to effect this energy calculation. These tests clearly indicated that any noise on either of the probes was insufficient to have affected energy calculations in any significant way.
9

(a)
(b)
-8
-6
-4
-2
0
2
4
6
8
-0.005 -0.003 -0.001 0.001 0.003 0.005 0.007 0.009 0.011 0.013 0.015
Time (s)
Volta
ge
-200
-150
-100
-50
0
50
100
150
200
Cur
rent
Voltage
Current
(c)
FIGURE 6. VOLTAGE AND CURRENT TRACES OF (a) J-57 ENGINE IGNITER, (b) OIL
BURNER TRANSFORMER IGNITION SOURCES, AND (c) 400-CYCLE SHORT
10
3. EXPERIMENTAL PROCEDURES.
3.1 METHANE VALIDATION TESTS.
Prior to each test, the test article was purged with shop air to remove any remaining methane vapors. The hydrocarbon analyzer was calibrated with a certified bottle of 5 percent methane balanced in nitrogen and was zeroed with 100% nitrogen. The vessel door was closed and sealed, and data acquisition was initiated. A solenoid valve was opened to introduce methane into the test article. The ullage vapors were monitored with the hydrocarbon analyzer, providing time for complete mixing of the methane vapors. Once the desired methane concentration stabilized, a 1-second spark initiated the combustion process. This was repeated at numerous methane concentrations until ignition, defined in these tests as visual observation of movement of the blowout plate, was unobtainable. This level was then noted as the LFL and was compared to published data [5]. 3.2 JP-8 LIQUID FUEL TESTS.
Prior to each test, the test article was purged of any remaining vapors with shop air until the ullage oxygen content was approximately 20.9%, and the hydrocarbon concentration was below 2000 ppm-C3H8. The hydrocarbon analyzer was calibrated and linearized with certified bottles of 2, 3, 4, and 6 percent propane balanced in nitrogen. The oxygen analyzer was subsequently calibrated with certified bottles of 12% and 16% oxygen with a nitrogen balance. In addition, both analyzers were zeroed with a bottle of 100% nitrogen. Following this calibration and a check of all critical devices, 3/8 of a gallon of JP-8 fuel was carefully measured, poured into the fuel pan, and placed in the center of the fuel tank. The pressure vessel was hydraulically sealed and the vacuum pump was used to evacuate the chamber to the approximate pressure corresponding to the desired altitude. Data collection was initiated. The nitrogen solenoid valve was opened to introduce nitrogen into the tank. The flow of nitrogen was introduced in stages, while monitoring the ullage oxygen concentration. When the desired oxygen concentration was achieved, all nitrogen flow was terminated, and the fuel heating process was started. The oxygen and hydrocarbon concentrations within the fuel tank were periodically checked throughout the test, with the fan being used periodically to ensure a well-mixed ullage vapor space. Upon achieving the desired ullage vapor concentration, the oxygen analyzer pump was turned off, and the hydrocarbon analyzer was switched to sample from ambient air. This was done to prevent combustion products from fouling the gas analyzer sensors. At this point, video tape recording was initiated and the fuel vapor mixture was subjected to several sparks/arcs. In the case of the HSVI tests, the heated block was running and monitored throughout the test at between 50% to 70% full load and turned to full load as the desired ullage vapor concentration was achieved. The hot-surface temperature (HST) was monitored throughout. In all test cases, if ignition, as defined in section 2.1, was not observed, the test was terminated, and the tank was considered inert under these conditions.
11
To obtain worst-case scenario data, it was desired to perform testing at near-stoichiometric mixtures. Calculations of the stoichiometric mixture were performed by approximating the fuel vapor as a hydrocarbon with composition CxHy. Using an existing computer model developed by Ivor Thomas, the FAA’s Chief Scientific and Technical Advisor for Fuel Systems, a ratio of y:x was obtained, as well as the vapor’s molecular weight. These calculations, with the input of a stoichiometric fuel-air mass ratio (FAR) of 0.068, resulted in y/x = 1.99 and MWvapor = y + 12x = 126.54. With this information, it was then determined that the approximate fuel vapor was C9.05H18.01. This could then be substituted into a stoichiometric chemical equation
C9.05H18.01 + a[O2 + 3.76N2] → bCO2 + cH2O +dN2
Solving this equation for the coefficients a, b, c, and d results in
C9.05H18.01 + 13.55[O2 + 3.76N2] → 9.05CO2 + 9H2O +50.96N2
From this, the fuel-air mole ratio can be determined as
( )( ) %53.155.1376.41
1 =+
=air
fuel
molmol
Therefore, the stoichiometric mixture in terms of parts-per-million of fuel vapor (ppmfuel) is given by 15,267 ppmfuel. To obtain this value in terms of propane, it is simply multiplied by the carbon ratio, in this case 9.05/3. This then results in an approximate stoichiometric mixture of 46,155 ppm-C3H8. Performing this same set of calculations for a 12% O2 environment, one finds a stoichiometric 12% O2 air mixture of approximately 24,000 ppm-C3H8. As testing showed, and as discussed in section 4.2.2, this stoichiometric mixture at a reduced O2 concentration resulted in the lowest values of the LOC despite initial thoughts that a stoichiometric 21% O2 air mixture would be needed. Therefore, the majority of testing was conducted at and around this fuel-air ratio. 4. DISCUSSION OF RESULTS.
4.1 METHANE VALIDATION TESTS.
As discussed previously, prior to performing any ignition experiments with aviation fuel, a series of validation tests were performed with methane in air mixtures. Because pressure was not measured in these experiments, ignition was defined by visual observation of the movement of the blowout plate, which resulted from a pressure buildup within the tank. The experimental data for this series of tests is shown in figure 7, in terms of ignition and nonignition criteria. The data show that the LFL of methane lies somewhere between 5.3% and 5.35% methane, matching closely the value 5.3% given by Lewis and von Elbe [5]. Therefore, it was concluded that the experimental apparatus and methods employed were suitable for ignition testing.
12
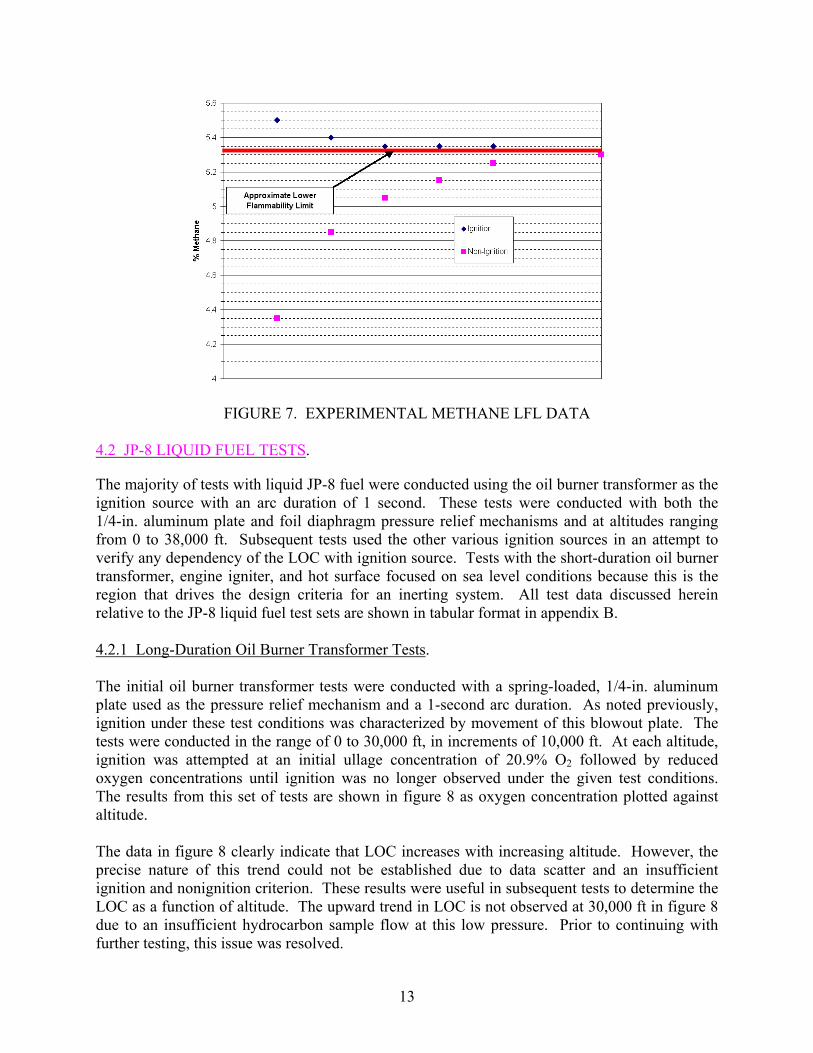
FIGURE 7. EXPERIMENTAL METHANE LFL DATA
4.2 JP-8 LIQUID FUEL TESTS.
The majority of tests with liquid JP-8 fuel were conducted using the oil burner transformer as the ignition source with an arc duration of 1 second. These tests were conducted with both the 1/4-in. aluminum plate and foil diaphragm pressure relief mechanisms and at altitudes ranging from 0 to 38,000 ft. Subsequent tests used the other various ignition sources in an attempt to verify any dependency of the LOC with ignition source. Tests with the short-duration oil burner transformer, engine igniter, and hot surface focused on sea level conditions because this is the region that drives the design criteria for an inerting system. All test data discussed herein relative to the JP-8 liquid fuel test sets are shown in tabular format in appendix B. 4.2.1 Long-Duration Oil Burner Transformer Tests. The initial oil burner transformer tests were conducted with a spring-loaded, 1/4-in. aluminum plate used as the pressure relief mechanism and a 1-second arc duration. As noted previously, ignition under these test conditions was characterized by movement of this blowout plate. The tests were conducted in the range of 0 to 30,000 ft, in increments of 10,000 ft. At each altitude, ignition was attempted at an initial ullage concentration of 20.9% O2 followed by reduced oxygen concentrations until ignition was no longer observed under the given test conditions. The results from this set of tests are shown in figure 8 as oxygen concentration plotted against altitude. The data in figure 8 clearly indicate that LOC increases with increasing altitude. However, the precise nature of this trend could not be established due to data scatter and an insufficient ignition and nonignition criterion. These results were useful in subsequent tests to determine the LOC as a function of altitude. The upward trend in LOC is not observed at 30,000 ft in figure 8 due to an insufficient hydrocarbon sample flow at this low pressure. Prior to continuing with further testing, this issue was resolved.
13
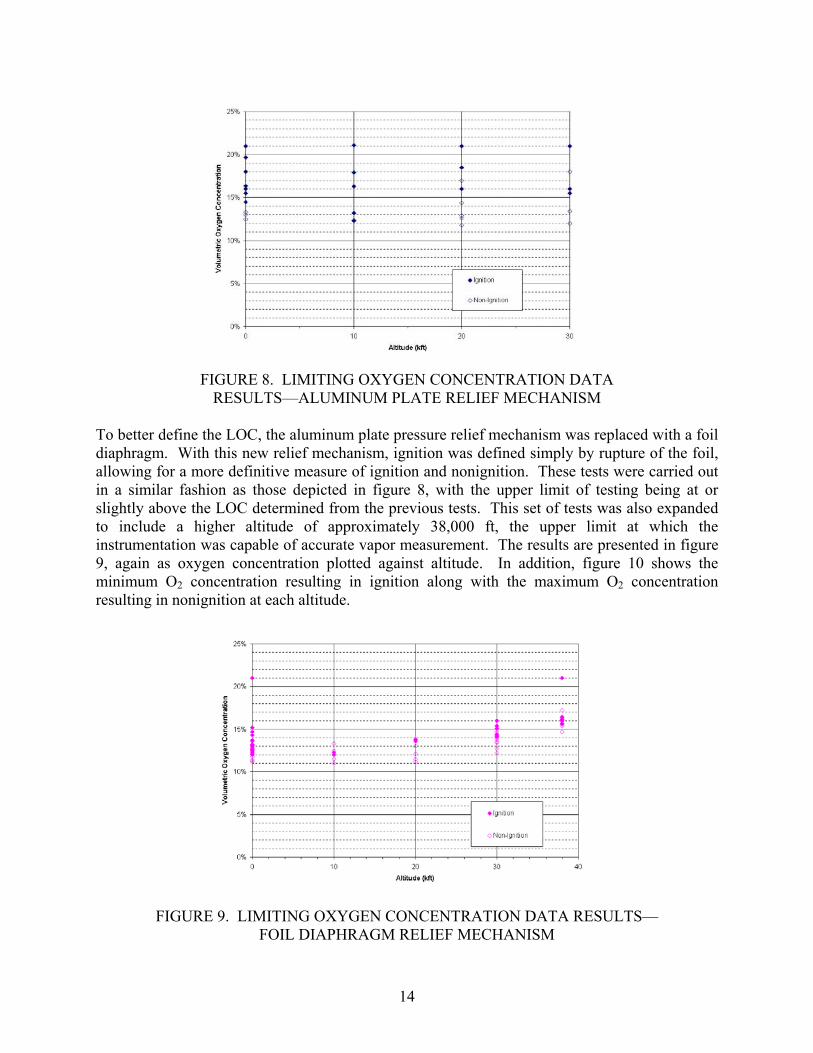
FIGURE 8. LIMITING OXYGEN CONCENTRATION DATA
RESULTS—ALUMINUM PLATE RELIEF MECHANISM To better define the LOC, the aluminum plate pressure relief mechanism was replaced with a foil diaphragm. With this new relief mechanism, ignition was defined simply by rupture of the foil, allowing for a more definitive measure of ignition and nonignition. These tests were carried out in a similar fashion as those depicted in figure 8, with the upper limit of testing being at or slightly above the LOC determined from the previous tests. This set of tests was also expanded to include a higher altitude of approximately 38,000 ft, the upper limit at which the instrumentation was capable of accurate vapor measurement. The results are presented in figure 9, again as oxygen concentration plotted against altitude. In addition, figure 10 shows the minimum O2 concentration resulting in ignition along with the maximum O2 concentration resulting in nonignition at each altitude.
FIGURE 9. LIMITING OXYGEN CONCENTRATION DATA RESULTS—
FOIL DIAPHRAGM RELIEF MECHANISM
14
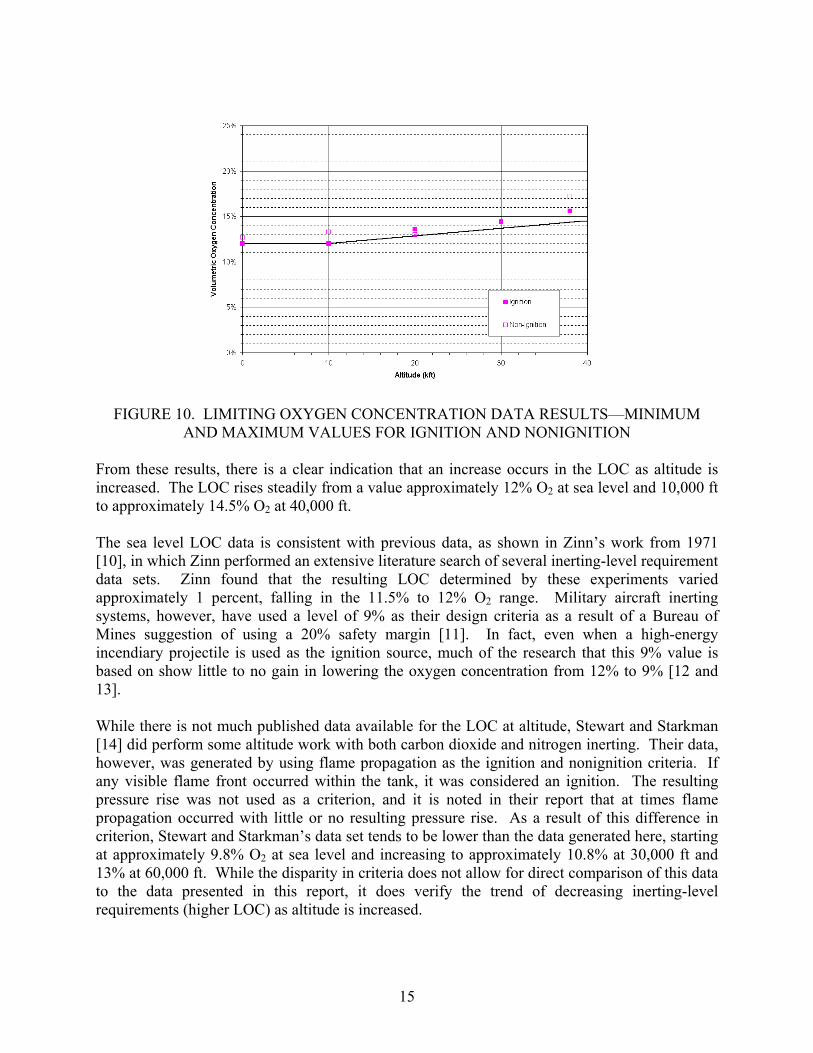
FIGURE 10. LIMITING OXYGEN CONCENTRATION DATA RESULTS—MINIMUM
AND MAXIMUM VALUES FOR IGNITION AND NONIGNITION From these results, there is a clear indication that an increase occurs in the LOC as altitude is increased. The LOC rises steadily from a value approximately 12% O2 at sea level and 10,000 ft to approximately 14.5% O2 at 40,000 ft. The sea level LOC data is consistent with previous data, as shown in Zinn’s work from 1971 [10], in which Zinn performed an extensive literature search of several inerting-level requirement data sets. Zinn found that the resulting LOC determined by these experiments varied approximately 1 percent, falling in the 11.5% to 12% O2 range. Military aircraft inerting systems, however, have used a level of 9% as their design criteria as a result of a Bureau of Mines suggestion of using a 20% safety margin [11]. In fact, even when a high-energy incendiary projectile is used as the ignition source, much of the research that this 9% value is based on show little to no gain in lowering the oxygen concentration from 12% to 9% [12 and 13]. While there is not much published data available for the LOC at altitude, Stewart and Starkman [14] did perform some altitude work with both carbon dioxide and nitrogen inerting. Their data, however, was generated by using flame propagation as the ignition and nonignition criteria. If any visible flame front occurred within the tank, it was considered an ignition. The resulting pressure rise was not used as a criterion, and it is noted in their report that at times flame propagation occurred with little or no resulting pressure rise. As a result of this difference in criterion, Stewart and Starkman’s data set tends to be lower than the data generated here, starting at approximately 9.8% O2 at sea level and increasing to approximately 10.8% at 30,000 ft and 13% at 60,000 ft. While the disparity in criteria does not allow for direct comparison of this data to the data presented in this report, it does verify the trend of decreasing inerting-level requirements (higher LOC) as altitude is increased.
15

Figures 11-15 depict the data from these tests as approximated fuel-air mass ratio and volumetric fuel vapor concentration versus volumetric oxygen concentration for each of the five altitudes tested. A large majority of the tests were conducted at sea level, because this is the most important region in the design of an inerting system. From the 50 tests conducted at sea level, 18 were conducted in the range of 11% to 12.5% O2. Of these 18 tests, only four resulted in ignition, and only one of the nine tests at or below 12% O2 ignited. In addition, figure 11 shows a series of tests conducted at 21% O2 with varying fuel-air ratios. This short series of tests was conducted to determine the approximate LFL of the fuel. From the figure it is evident that this value occurs somewhere between a FAR of 0.026 and 0.027.
FIGURE 11. LIMITING OXYGEN CONCENTRATION DATA RESULTS—FUEL-AIR
RATIO AND FUEL VAPOR CONCENTRATION VS OXYGEN CONCENTRATION (SEA LEVEL)
16
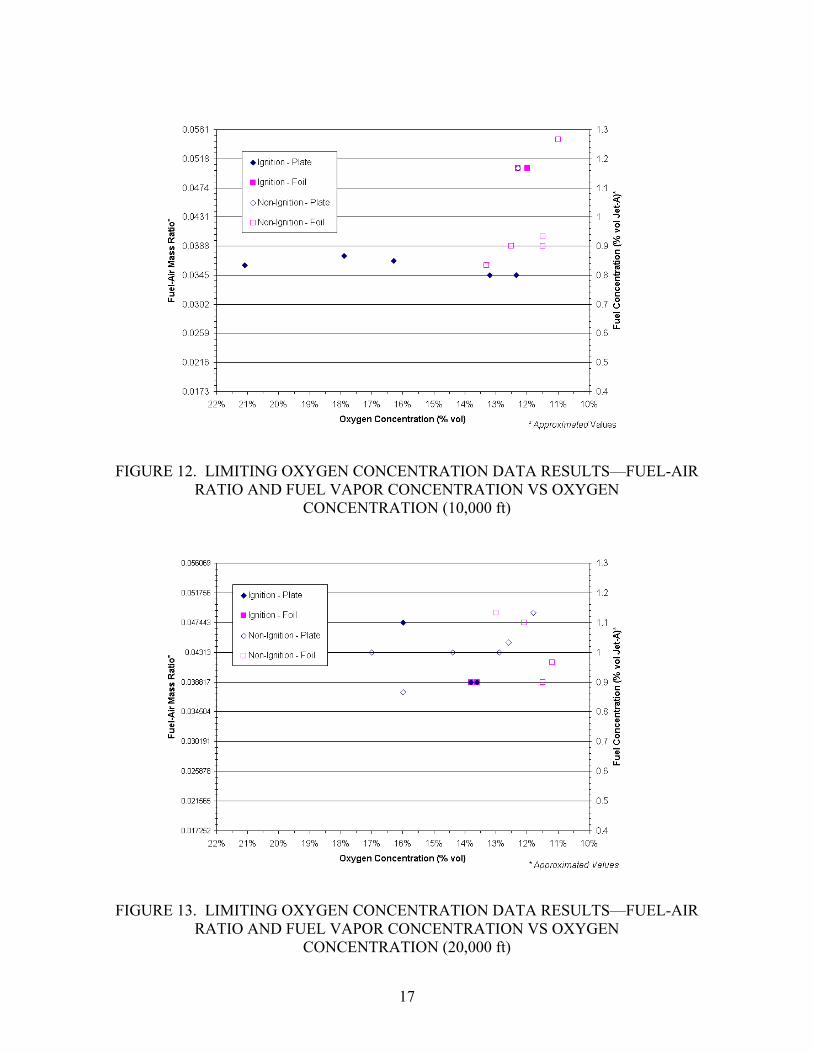
FIGURE 12. LIMITING OXYGEN CONCENTRATION DATA RESULTS—FUEL-AIR
RATIO AND FUEL VAPOR CONCENTRATION VS OXYGEN CONCENTRATION (10,000 ft)
FIGURE 13. LIMITING OXYGEN CONCENTRATION DATA RESULTS—FUEL-AIR
RATIO AND FUEL VAPOR CONCENTRATION VS OXYGEN CONCENTRATION (20,000 ft)
17
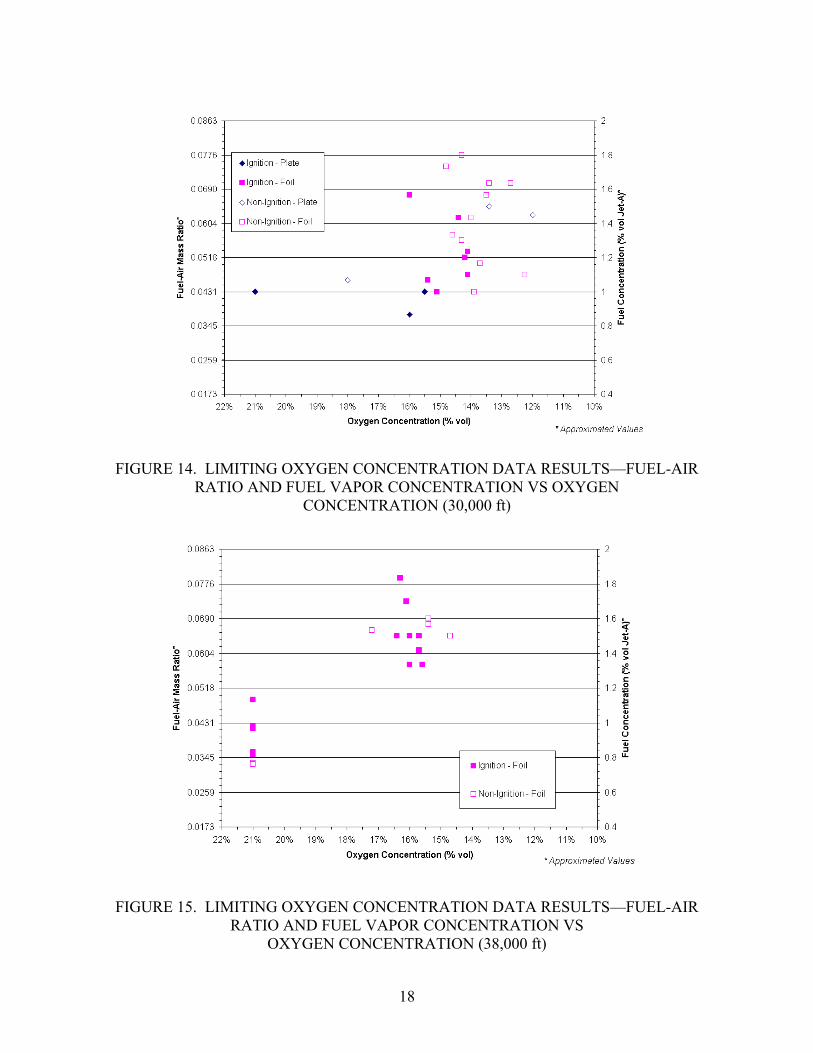
FIGURE 14. LIMITING OXYGEN CONCENTRATION DATA RESULTS—FUEL-AIR
RATIO AND FUEL VAPOR CONCENTRATION VS OXYGEN CONCENTRATION (30,000 ft)
FIGURE 15. LIMITING OXYGEN CONCENTRATION DATA RESULTS—FUEL-AIR
RATIO AND FUEL VAPOR CONCENTRATION VS OXYGEN CONCENTRATION (38,000 ft)
18
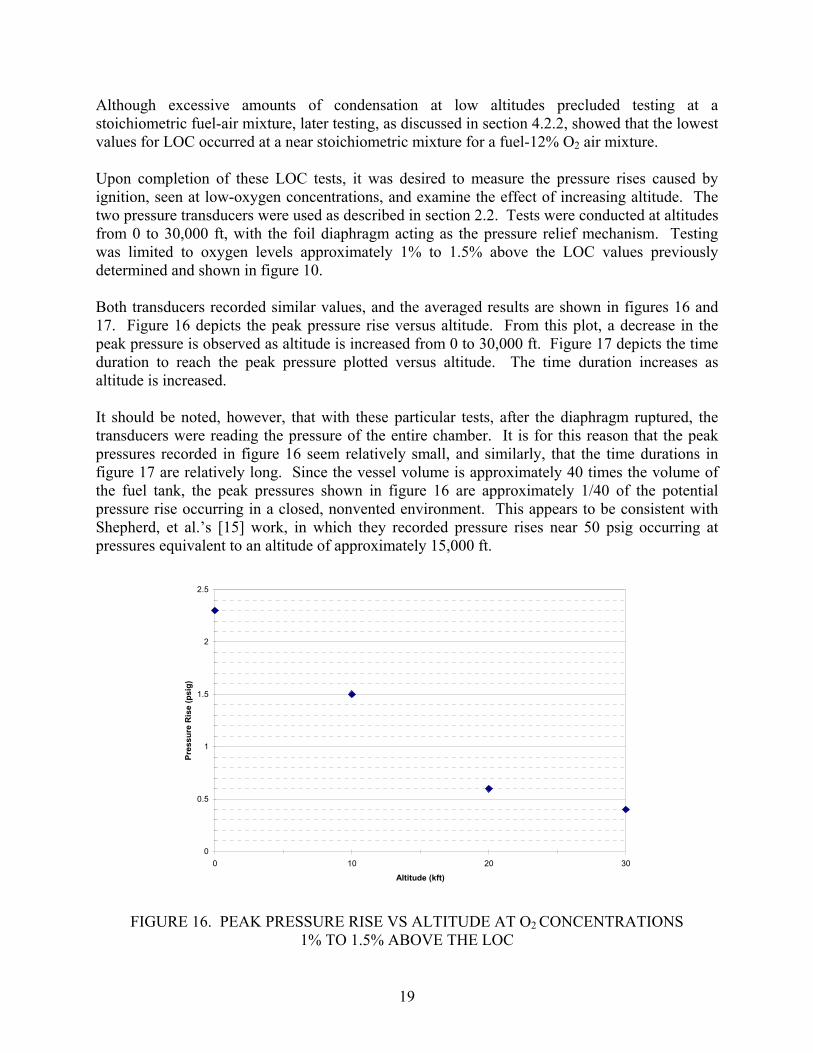
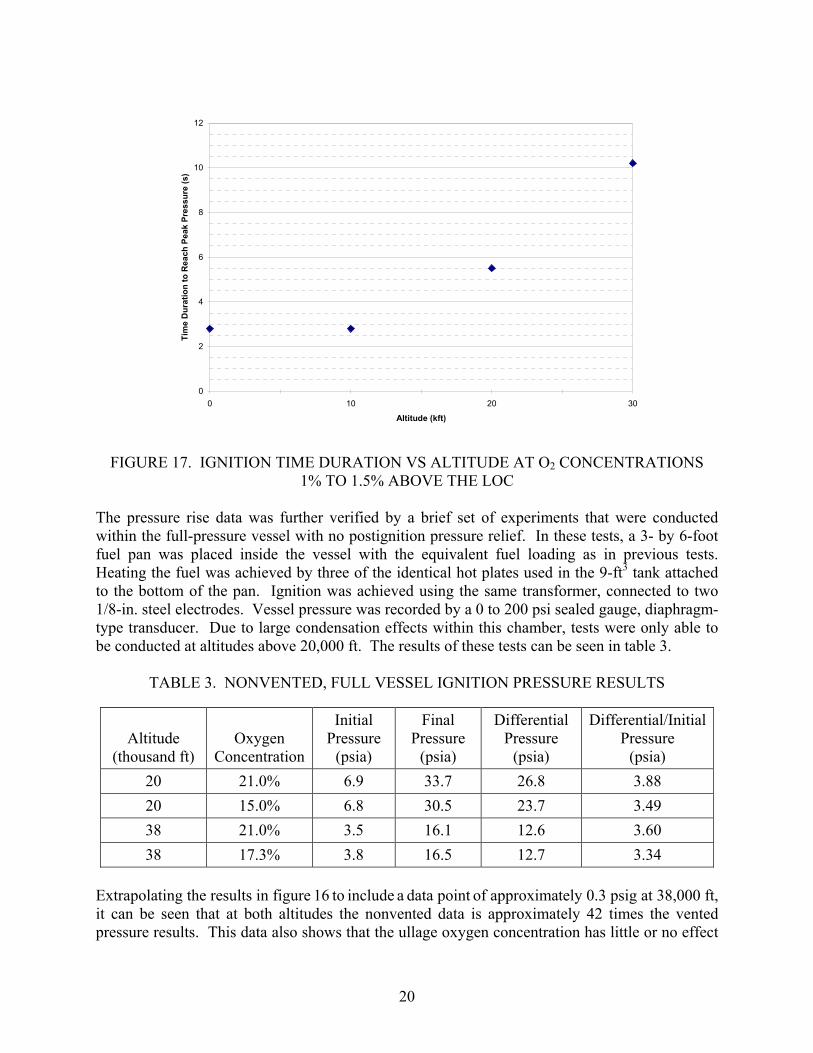
Although excessive amounts of condensation at low altitudes precluded testing at a stoichiometric fuel-air mixture, later testing, as discussed in section 4.2.2, showed that the lowest values for LOC occurred at a near stoichiometric mixture for a fuel-12% O2 air mixture. Upon completion of these LOC tests, it was desired to measure the pressure rises caused by ignition, seen at low-oxygen concentrations, and examine the effect of increasing altitude. The two pressure transducers were used as described in section 2.2. Tests were conducted at altitudes from 0 to 30,000 ft, with the foil diaphragm acting as the pressure relief mechanism. Testing was limited to oxygen levels approximately 1% to 1.5% above the LOC values previously determined and shown in figure 10. Both transducers recorded similar values, and the averaged results are shown in figures 16 and 17. Figure 16 depicts the peak pressure rise versus altitude. From this plot, a decrease in the peak pressure is observed as altitude is increased from 0 to 30,000 ft. Figure 17 depicts the time duration to reach the peak pressure plotted versus altitude. The time duration increases as altitude is increased. It should be noted, however, that with these particular tests, after the diaphragm ruptured, the transducers were reading the pressure of the entire chamber. It is for this reason that the peak pressures recorded in figure 16 seem relatively small, and similarly, that the time durations in figure 17 are relatively long. Since the vessel volume is approximately 40 times the volume of the fuel tank, the peak pressures shown in figure 16 are approximately 1/40 of the potential pressure rise occurring in a closed, nonvented environment. This appears to be consistent with Shepherd, et al.’s [15] work, in which they recorded pressure rises near 50 psig occurring at pressures equivalent to an altitude of approximately 15,000 ft.
0
0.5
1
1.5
2
2.5
0 10 20
Altitude (kft)
Pres
sure
Ris
e (p
sig)
30
FIGURE 16. PEAK PRESSURE RISE VS ALTITUDE AT O2 CONCENTRATIONS
1% TO 1.5% ABOVE THE LOC
19
0
2
4
6
8
10
12
0 10 20
Altitude (kft)
Tim
e D
urat
ion
to R
each
Pea
k Pr
essu
re (s
)
30
FIGURE 17. IGNITION TIME DURATION VS ALTITUDE AT O2 CONCENTRATIONS
1% TO 1.5% ABOVE THE LOC The pressure rise data was further verified by a brief set of experiments that were conducted within the full-pressure vessel with no postignition pressure relief. In these tests, a 3- by 6-foot fuel pan was placed inside the vessel with the equivalent fuel loading as in previous tests. Heating the fuel was achieved by three of the identical hot plates used in the 9-ft3 tank attached to the bottom of the pan. Ignition was achieved using the same transformer, connected to two 1/8-in. steel electrodes. Vessel pressure was recorded by a 0 to 200 psi sealed gauge, diaphragm-type transducer. Due to large condensation effects within this chamber, tests were only able to be conducted at altitudes above 20,000 ft. The results of these tests can be seen in table 3.
TABLE 3. NONVENTED, FULL VESSEL IGNITION PRESSURE RESULTS
Altitude (thousand ft)
Oxygen Concentration
Initial Pressure
(psia)
Final Pressure
(psia)
Differential Pressure
(psia)
Differential/Initial Pressure
(psia) 20 21.0% 6.9 33.7 26.8 3.88 20 15.0% 6.8 30.5 23.7 3.49 38 21.0% 3.5 16.1 12.6 3.60 38 17.3% 3.8 16.5 12.7 3.34
Extrapolating the results in figure 16 to include a data point of approximately 0.3 psig at 38,000 ft, it can be seen that at both altitudes the nonvented data is approximately 42 times the vented pressure results. This data also shows that the ullage oxygen concentration has little or no effect
20
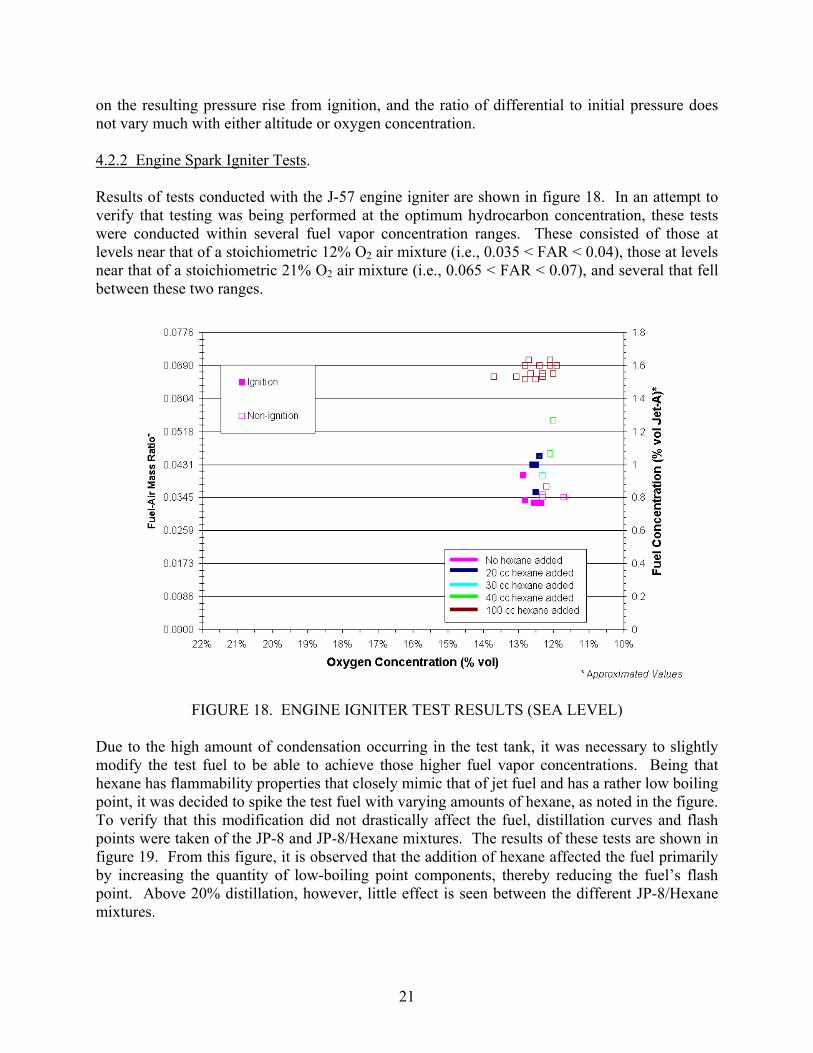
on the resulting pressure rise from ignition, and the ratio of differential to initial pressure does not vary much with either altitude or oxygen concentration. 4.2.2 Engine Spark Igniter Tests. Results of tests conducted with the J-57 engine igniter are shown in figure 18. In an attempt to verify that testing was being performed at the optimum hydrocarbon concentration, these tests were conducted within several fuel vapor concentration ranges. These consisted of those at levels near that of a stoichiometric 12% O2 air mixture (i.e., 0.035 < FAR < 0.04), those at levels near that of a stoichiometric 21% O2 air mixture (i.e., 0.065 < FAR < 0.07), and several that fell between these two ranges.
FIGURE 18. ENGINE IGNITER TEST RESULTS (SEA LEVEL)
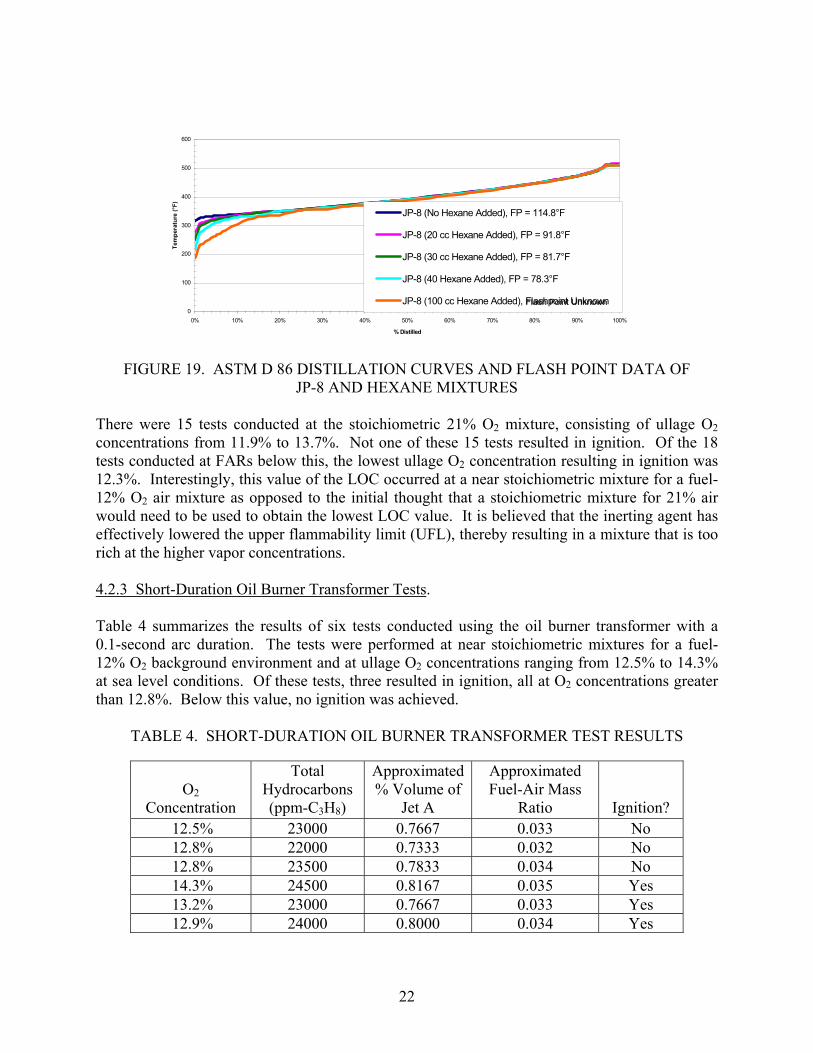
Due to the high amount of condensation occurring in the test tank, it was necessary to slightly modify the test fuel to be able to achieve those higher fuel vapor concentrations. Being that hexane has flammability properties that closely mimic that of jet fuel and has a rather low boiling point, it was decided to spike the test fuel with varying amounts of hexane, as noted in the figure. To verify that this modification did not drastically affect the fuel, distillation curves and flash points were taken of the JP-8 and JP-8/Hexane mixtures. The results of these tests are shown in figure 19. From this figure, it is observed that the addition of hexane affected the fuel primarily by increasing the quantity of low-boiling point components, thereby reducing the fuel’s flash point. Above 20% distillation, however, little effect is seen between the different JP-8/Hexane mixtures.
21
0
100
200
300
400
500
600
0% 10% 20% 30% 40% 50% 60% 70% 80% 90% 100%
% Distilled
Tem
pera
ture
(°F)
JP-8 (No Hexane Added), FP = 114.8°F
JP-8 (20 cc Hexane Added), FP = 91.8°F
JP-8 (30 cc Hexane Added), FP = 81.7°F
JP-8 (40 Hexane Added), FP = 78.3°F
JP-8 (100 cc Hexane Added), Flashpoint Unknown Flash Point Unknown
FIGURE 19. ASTM D 86 DISTILLATION CURVES AND FLASH POINT DATA OF
JP-8 AND HEXANE MIXTURES There were 15 tests conducted at the stoichiometric 21% O2 mixture, consisting of ullage O2 concentrations from 11.9% to 13.7%. Not one of these 15 tests resulted in ignition. Of the 18 tests conducted at FARs below this, the lowest ullage O2 concentration resulting in ignition was 12.3%. Interestingly, this value of the LOC occurred at a near stoichiometric mixture for a fuel-12% O2 air mixture as opposed to the initial thought that a stoichiometric mixture for 21% air would need to be used to obtain the lowest LOC value. It is believed that the inerting agent has effectively lowered the upper flammability limit (UFL), thereby resulting in a mixture that is too rich at the higher vapor concentrations. 4.2.3 Short-Duration Oil Burner Transformer Tests. Table 4 summarizes the results of six tests conducted using the oil burner transformer with a 0.1-second arc duration. The tests were performed at near stoichiometric mixtures for a fuel-12% O2 background environment and at ullage O2 concentrations ranging from 12.5% to 14.3% at sea level conditions. Of these tests, three resulted in ignition, all at O2 concentrations greater than 12.8%. Below this value, no ignition was achieved.
TABLE 4. SHORT-DURATION OIL BURNER TRANSFORMER TEST RESULTS
O2 Concentration
Total Hydrocarbons (ppm-C3H8)
Approximated% Volume of
Jet A
Approximated Fuel-Air Mass
Ratio Ignition? 12.5% 23000 0.7667 0.033 No 12.8% 22000 0.7333 0.032 No 12.8% 23500 0.7833 0.034 No 14.3% 24500 0.8167 0.035 Yes 13.2% 23000 0.7667 0.033 Yes 12.9% 24000 0.8000 0.034 Yes
22
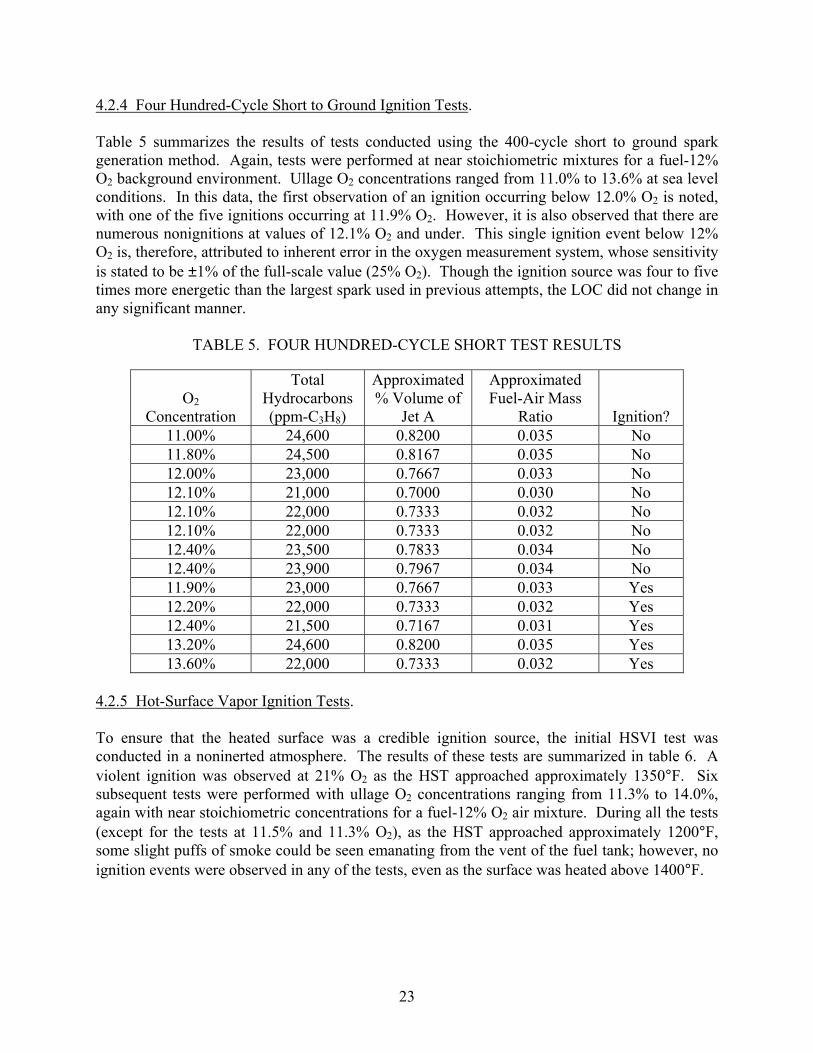
4.2.4 Four Hundred-Cycle Short to Ground Ignition Tests. Table 5 summarizes the results of tests conducted using the 400-cycle short to ground spark generation method. Again, tests were performed at near stoichiometric mixtures for a fuel-12% O2 background environment. Ullage O2 concentrations ranged from 11.0% to 13.6% at sea level conditions. In this data, the first observation of an ignition occurring below 12.0% O2 is noted, with one of the five ignitions occurring at 11.9% O2. However, it is also observed that there are numerous nonignitions at values of 12.1% O2 and under. This single ignition event below 12% O2 is, therefore, attributed to inherent error in the oxygen measurement system, whose sensitivity is stated to be ±1% of the full-scale value (25% O2). Though the ignition source was four to five times more energetic than the largest spark used in previous attempts, the LOC did not change in any significant manner.
TABLE 5. FOUR HUNDRED-CYCLE SHORT TEST RESULTS
O2 Concentration
Total Hydrocarbons (ppm-C3H8)
Approximated% Volume of
Jet A
Approximated Fuel-Air Mass
Ratio Ignition? 11.00% 24,600 0.8200 0.035 No 11.80% 24,500 0.8167 0.035 No 12.00% 23,000 0.7667 0.033 No 12.10% 21,000 0.7000 0.030 No 12.10% 22,000 0.7333 0.032 No 12.10% 22,000 0.7333 0.032 No 12.40% 23,500 0.7833 0.034 No 12.40% 23,900 0.7967 0.034 No 11.90% 23,000 0.7667 0.033 Yes 12.20% 22,000 0.7333 0.032 Yes 12.40% 21,500 0.7167 0.031 Yes 13.20% 24,600 0.8200 0.035 Yes 13.60% 22,000 0.7333 0.032 Yes
4.2.5 Hot-Surface Vapor Ignition Tests. To ensure that the heated surface was a credible ignition source, the initial HSVI test was conducted in a noninerted atmosphere. The results of these tests are summarized in table 6. A violent ignition was observed at 21% O2 as the HST approached approximately 1350°F. Six subsequent tests were performed with ullage O2 concentrations ranging from 11.3% to 14.0%, again with near stoichiometric concentrations for a fuel-12% O2 air mixture. During all the tests (except for the tests at 11.5% and 11.3% O2), as the HST approached approximately 1200°F, some slight puffs of smoke could be seen emanating from the vent of the fuel tank; however, no ignition events were observed in any of the tests, even as the surface was heated above 1400°F.
23
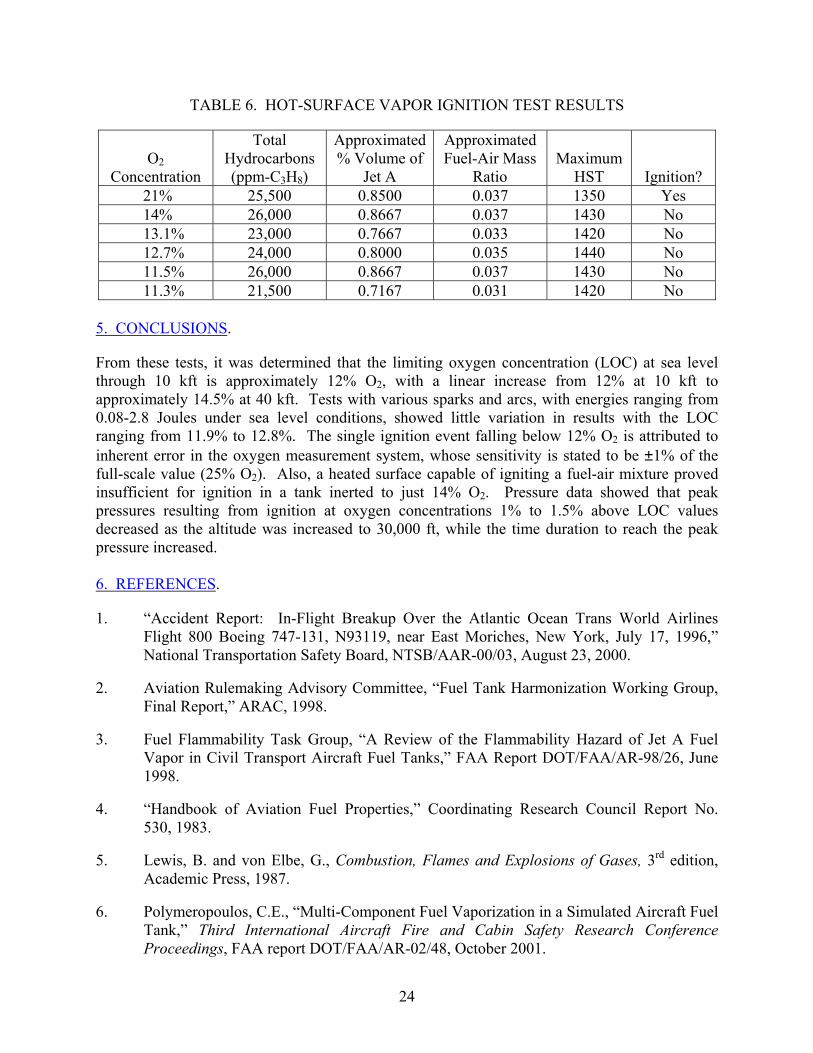
TABLE 6. HOT-SURFACE VAPOR IGNITION TEST RESULTS
O2 Concentration
Total Hydrocarbons (ppm-C3H8)
Approximated % Volume of
Jet A
Approximated Fuel-Air Mass
Ratio Maximum
HST Ignition? 21% 25,500 0.8500 0.037 1350 Yes 14% 26,000 0.8667 0.037 1430 No 13.1% 23,000 0.7667 0.033 1420 No 12.7% 24,000 0.8000 0.035 1440 No 11.5% 26,000 0.8667 0.037 1430 No 11.3% 21,500 0.7167 0.031 1420 No
5. CONCLUSIONS.
From these tests, it was determined that the limiting oxygen concentration (LOC) at sea level through 10 kft is approximately 12% O2, with a linear increase from 12% at 10 kft to approximately 14.5% at 40 kft. Tests with various sparks and arcs, with energies ranging from 0.08-2.8 Joules under sea level conditions, showed little variation in results with the LOC ranging from 11.9% to 12.8%. The single ignition event falling below 12% O2 is attributed to inherent error in the oxygen measurement system, whose sensitivity is stated to be ±1% of the full-scale value (25% O2). Also, a heated surface capable of igniting a fuel-air mixture proved insufficient for ignition in a tank inerted to just 14% O2. Pressure data showed that peak pressures resulting from ignition at oxygen concentrations 1% to 1.5% above LOC values decreased as the altitude was increased to 30,000 ft, while the time duration to reach the peak pressure increased. 6. REFERENCES.
1. “Accident Report: In-Flight Breakup Over the Atlantic Ocean Trans World Airlines Flight 800 Boeing 747-131, N93119, near East Moriches, New York, July 17, 1996,” National Transportation Safety Board, NTSB/AAR-00/03, August 23, 2000.
2. Aviation Rulemaking Advisory Committee, “Fuel Tank Harmonization Working Group, Final Report,” ARAC, 1998.
3. Fuel Flammability Task Group, “A Review of the Flammability Hazard of Jet A Fuel Vapor in Civil Transport Aircraft Fuel Tanks,” FAA Report DOT/FAA/AR-98/26, June 1998.
4. “Handbook of Aviation Fuel Properties,” Coordinating Research Council Report No. 530, 1983.
5. Lewis, B. and von Elbe, G., Combustion, Flames and Explosions of Gases, 3rd edition, Academic Press, 1987.
6. Polymeropoulos, C.E., “Multi-Component Fuel Vaporization in a Simulated Aircraft Fuel Tank,” Third International Aircraft Fire and Cabin Safety Research Conference Proceedings, FAA report DOT/FAA/AR-02/48, October 2001.
24
7. Esseghir, M. and Polymeropoulos, C. E., “Spark Ignition of Near the Lean Limit CH4-Air Mixtures at Low Pressures,” Combustion and Flame, Vol. 73, 1988.
8. Shepherd, Krok, Lee, Brown, Lynch, Samaras, and Birky, “Results of 1/4 Scale Experiments, Vapor Simulant and Liquid Jet A Tests,” NTSB Docket No. SA-516, Exhibit, No. 20O, 2000.
9. Thomas, I., “Fuel Air Ratio Calculator,” http://www.fire.tc.faa.gov/systems/fueltank/ FAR1g.xls, October 30, 2001 Version.
10. Zinn Jr., S.V., “Inerted Fuel Tank Oxygen Concentration Requirements,” FAA Report FAA-RD-71-42, August 1971.
11. Kuchta, J.M., “Oxygen Dilution Requirements for Inerting Aircraft Fuel Tanks,” Bureau of Mines Safety Research Center, in: Second Conference on Fuel System Fire Safety, Washington, D.C., FAA, pp. 85-115, May 1970.
12. Tyson, J.H. and Barnes, J.F., “The Effectiveness of Ullage Nitrogen-Inerting Systems Against 30-mm High-Explosive Incendiary Projectiles-Final Report,” NWC TP 7129, May 1991.
13. Anderson, C.L., Test and Evaluation of Halon 1301 and Nitrogen Inerting Against 23 mm HEI Projectiles,” AFFDL-TR-78-66, May 1978.
14. Stewart, P.B. and Starkman, E.S., “Inerting Conditions for Aircraft Fuel Tanks,” WADC Technical Report No. 55-418, September 1955.
15. Shepherd, J.E., Krok, J.C., and Lee, J.J., “Jet A Explosion Experiments: Laboratory Testing,” NTSB Docket No. SA-516, Exhibit No. 20D, 1997.
25/26
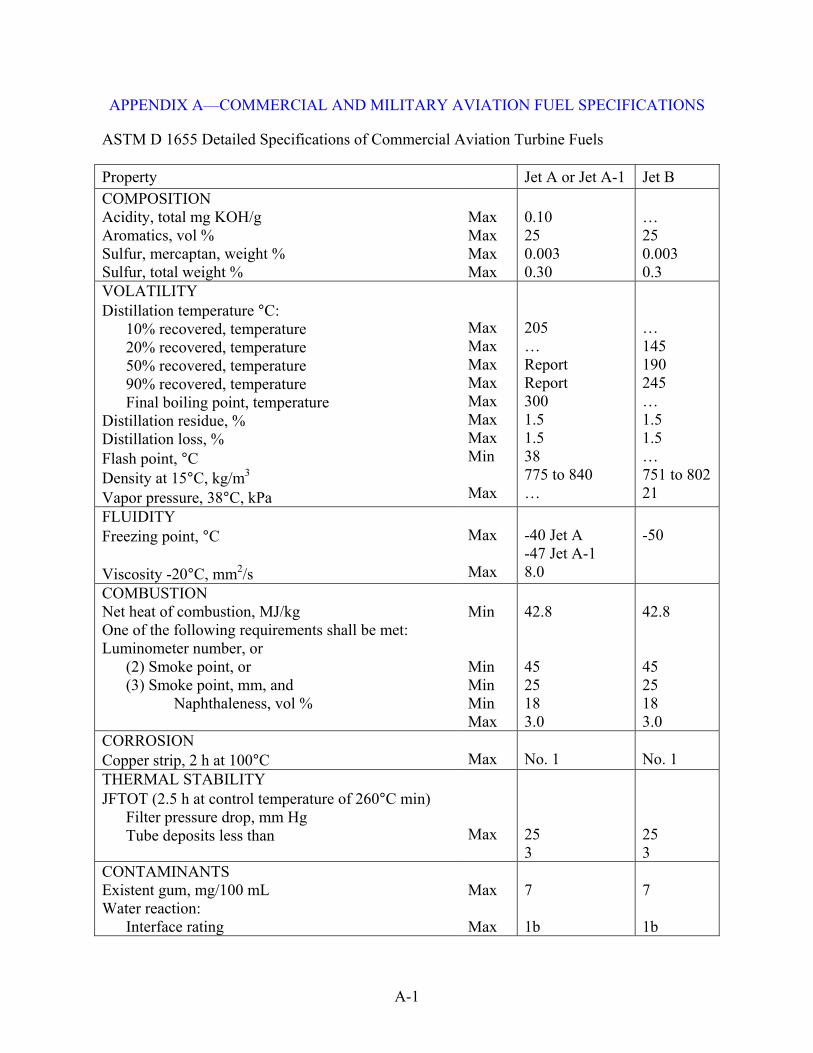
APPENDIX A—COMMERCIAL AND MILITARY AVIATION FUEL SPECIFICATIONS
ASTM D 1655 Detailed Specifications of Commercial Aviation Turbine Fuels
Property Jet A or Jet A-1 Jet B COMPOSITION Acidity, total mg KOH/g Aromatics, vol % Sulfur, mercaptan, weight % Sulfur, total weight %
Max Max Max Max
0.10 25 0.003 0.30
… 25 0.003 0.3
VOLATILITY Distillation temperature °C: 10% recovered, temperature 20% recovered, temperature 50% recovered, temperature 90% recovered, temperature Final boiling point, temperature Distillation residue, % Distillation loss, % Flash point, °C Density at 15°C, kg/m3 Vapor pressure, 38°C, kPa
Max Max Max Max Max Max Max Min Max
205 … Report Report 300 1.5 1.5 38 775 to 840 …
… 145 190 245 … 1.5 1.5 … 751 to 802 21
FLUIDITY Freezing point, °C Viscosity -20°C, mm2/s
Max Max
-40 Jet A -47 Jet A-1 8.0
-50
COMBUSTION Net heat of combustion, MJ/kg One of the following requirements shall be met: Luminometer number, or (2) Smoke point, or (3) Smoke point, mm, and _________Naphthaleness, vol %
Min Min Min Min Max
42.8 45 25 18 3.0
42.8 45 25 18 3.0
CORROSION Copper strip, 2 h at 100°C
Max
No. 1
No. 1
THERMAL STABILITY JFTOT (2.5 h at control temperature of 260°C min) Filter pressure drop, mm Hg Tube deposits less than
Max
25 3
25 3
CONTAMINANTS Existent gum, mg/100 mL Water reaction: Interface rating
Max Max
7 1b
7 1b
A-1
Detailed U.S. Military Requirements of Aviation Turbine Fuels as Taken From Reference A-1 Property JP-4 JP-5 JP-8 COMPOSITION Acidity, total mg KOH/g Aromatics, vol % Sulfur, mercaptan, weight % Sulfur, total weight % Color, Saybolt
Max Max Max Max Max
0.015 25.0 5.0 0.001 0.4 Report
0.015 25.0 5.0 0.001 0.4 Report
0.015 25.0 5.0 0.001 0.3 Report
VOLATILITY Distillation temperature °C: Initial boiling point, temperature 10% recovered, temperature 20% recovered, temperature 50% recovered, temperature 90% recovered, temperature Final boiling point, temperature Distillation residue, % Distillation loss, % Explosiveness, % Flash point, °C Gravity, °API (15°C) Density at 15°C, kg/m3 Vapor pressure, 37.8°C, kPa (psi)
Max Max Max Max Max Max Max Max Max Min Max Max
Report Report 145 190 245 270 1.5 1.5 … … 45-57 751-802 14-21
Report 205 Report Report Report 290 … … 50 60 36-48 788-845 …
Report 205 Report Report Report 300 1.5 1.5 38 37-51 775-840
FLUIDITY Freezing point, °C Viscosity -20°C, mm2/s
Max Max
-58 …
-46 8.5
-50 8.0
COMBUSTION Aniline-gravity product, or Net heat of combustion, MJ/kg Smoke point, or Hydrogen content (wt %)
Min Min Min Min
5250 42.8 20.0 13.6
4500 42.6 19.0 13.5
42.8 19.0 13.5
CORROSION Copper strip, 2 h at 100°C
Max
1b
1b
1b
THERMAL STABILITY JFTOT ∆P (mm Hg) JFTOT Tube Color Code
Max Max
25 <3
25 <3
25 <3
CONTAMINANTS Existent gum, mg/100 mL Particulates (mg/liter) Water reaction interface Water separation index modified Filtration time (minutes)
Max Max Max Min Max
7 1 1b 70 15
7 1 1b 85 …
7 1 1b 70 ...
A-2
Detailed U.S. Military Requirements of Aviation Turbine Fuels as Taken From Reference A-1 Property JP-4 JP-5 JP-8 ADDITIVES Anti-icing (vol %) Antioxidant Corrosion inhibitor Metal deactivator Antistatic
0.10-0.15 Required Required Option Required
0.10-0.15 Required Required Option …
0.10-0.15 Option Required Option Required
OTHER Conductivity (pS/m Service NATO Code No.
200-600 All F-40
… Navy F-44
200-600 USAF F-34; F-35
REFERENCES A-1. “Handbook of Aviation Fuel Properties,” Coordinating Research Council Report No.
530, 1983.
A-3/A-4

Igni
tion
Sou
rce
Alt
(kft)
%
O2
Tota
l HC
pp
m-C
3H8
App
roxi
mat
ed %
V
olum
e of
Jet
A
App
roxi
mat
ed
Fuel
-Air
Mas
s R
atio
Ig
nitio
n?
Foil/
Pla
te?
N
otes
O
il B
urne
r (Lo
ng)
0 13
.30%
24
,000
0.
8000
0.
035
No
Pla
te
O
il B
urne
r (Lo
ng)
0 12
.50%
27
,000
0.
9000
0.
039
No
Pla
te
O
il B
urne
r (Lo
ng)
0 13
.00%
27
,000
0.
9000
0.
039
No
Pla
te
O
il B
urne
r (Lo
ng)
0 21
.00%
17
,500
0.
5833
0.
025
No
Foil
O
il B
urne
r (Lo
ng)
0 21
.00%
18
,000
0.
6000
0.
026
No
Foil
O
il B
urne
r (Lo
ng)
0 12
.00%
19
,000
0.
6333
0.
027
No
Foil
O
il B
urne
r (Lo
ng)
0 12
.50%
19
,800
0.
6600
0.
028
No
Foil
O
il B
urne
r (Lo
ng)
0 12
.20%
19
,900
0.
6633
0.
029
No
Foil
O
il B
urne
r (Lo
ng)
0 12
.30%
20
,600
0.
6867
0.
030
No
Foil
O
il B
urne
r (Lo
ng)
0 12
.30%
22
,300
0.
7433
0.
032
No
Foil
O
il B
urne
r (Lo
ng)
0 11
.30%
24
,100
0.
8033
0.
035
No
Foil
O
il B
urne
r (Lo
ng)
0 12
.20%
24
,500
0.
8167
0.
035
No
Foil
O
il B
urne
r (Lo
ng)
0 11
.80%
24
,500
0.
8167
0.
035
No
Foil
O
il B
urne
r (Lo
ng)
0 11
.40%
25
,000
0.
8333
0.
036
No
Foil
O
il B
urne
r (Lo
ng)
0 11
.20%
27
,000
0.
9000
0.
039
no
Foil
O
il B
urne
r (Lo
ng)
0 11
.20%
28
,000
0.
9333
0.
040
no
Foil
O
il B
urne
r (Lo
ng)
0 12
.10%
30
,000
1.
0000
0.
043
No
Foil
O
il B
urne
r (Lo
ng)
0 12
.60%
30
,000
1.
0000
0.
043
No
Foil
O
il B
urne
r (Lo
ng)
0 11
.80%
32
,000
1.
0667
0.
046
No
Foil
O
il B
urne
r (Lo
ng)
0 12
.00%
32
,000
1.
0667
0.
046
No
Foil
O
il B
urne
r (Lo
ng)
0 12
.70%
34
,000
1.
1333
0.
049
No
Foil
O
il B
urne
r (Lo
ng)
0 18
.00%
23
,000
0.
7667
0.
033
Yes
P
late
Oil
Bur
ner (
Long
) 0
15.5
0%
23,5
00
0.78
33
0.03
4 Y
es
Pla
te
O
il B
urne
r (Lo
ng)
0 14
.50%
23
,500
0.
7833
0.
034
Yes
P
late
Oil
Bur
ner (
Long
) 0
21.0
0%
24,0
00
0.80
00
0.03
5 Y
es
Pla
te
O
il B
urne
r (Lo
ng)
0 14
.50%
24
,000
0.
8000
0.
035
yes
Pla
te
O
il B
urne
r (Lo
ng)
0 16
.35%
24
,000
0.
8000
0.
035
yes
Pla
te
O
il B
urne
r (Lo
ng)
0 21
.00%
24
,000
0.
8000
0.
035
yes
Pla
te
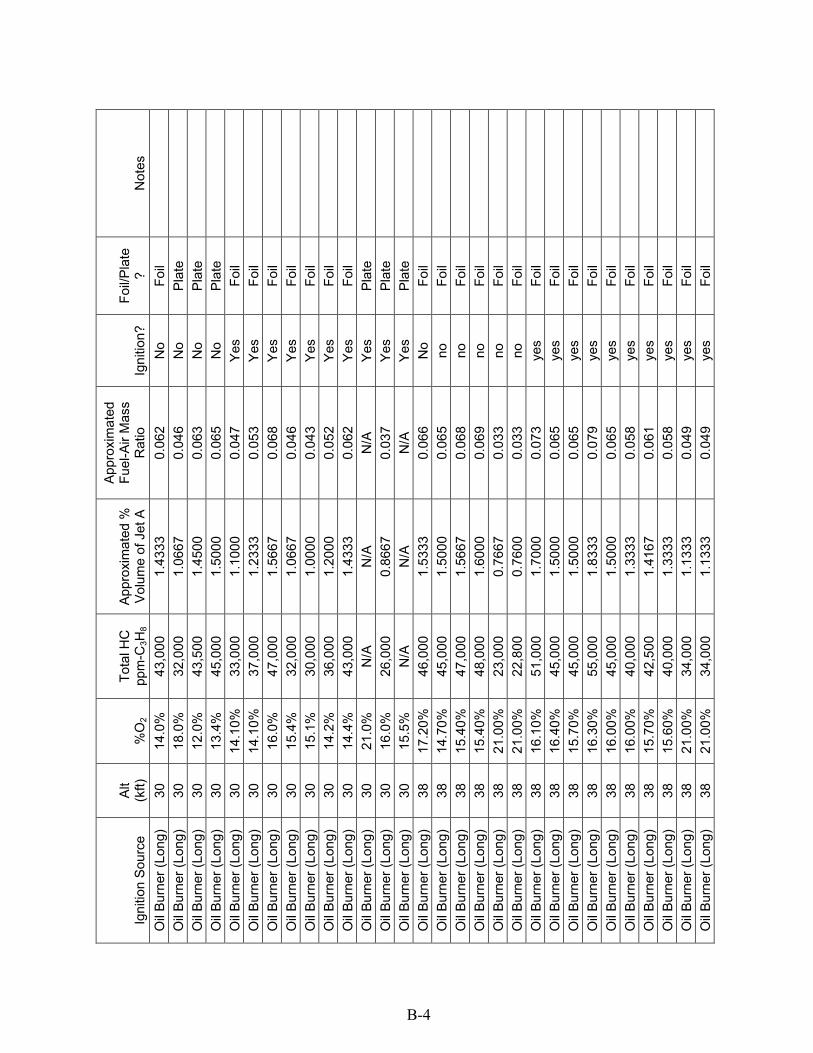
APPENDIX B—JP-8 LIQUID FUEL TEST DATA
B-1
Igni
tion
Sou
rce
Alt
(kft)
%
O2
Tota
l HC
pp
m-C
3H8
App
roxi
mat
ed %
V
olum
e of
Jet
A
App
roxi
mat
ed
Fuel
-Air
Mas
s R
atio
Ig
nitio
n?
Foil/
Pla
te?
Not
es
Oil
Bur
ner (
Long
) 0
14.5
0%
24,3
00
0.81
00
0.03
5 ye
s P
late
Oil
Bur
ner (
Long
) 0
19.6
5%
25,0
00
0.83
33
0.03
6 ye
s P
late
Oil
Bur
ner (
Long
) 0
16.0
0%
25,5
00
0.85
00
0.03
7 Y
es
Pla
te
O
il B
urne
r (Lo
ng)
0 13
.60%
24
,000
0.
8000
0.
035
Yes
Fo
il
Oil
Bur
ner (
Long
) 0
21.0
0%
19,3
00
0.64
33
0.02
8 Y
es
Foil
O
il B
urne
r (Lo
ng)
0 21
.00%
19
,400
0.
6467
0.
028
Yes
Fo
il
Oil
Bur
ner (
Long
) 0
13.1
0%
20,0
00
0.66
67
0.02
9 Y
es
Foil
O
il B
urne
r (Lo
ng)
0 21
.00%
21
,000
0.
7000
0.
030
Yes
Fo
il
Oil
Bur
ner (
Long
) 0
12.6
0%
22,3
00
0.74
33
0.03
2 Y
es
Foil
O
il B
urne
r (Lo
ng)
0 21
.00%
23
,500
0.
7833
0.
034
Yes
Fo
il
Oil
Bur
ner (
Long
) 0
21.0
0%
24,0
00
0.80
00
0.03
5 Y
es
Foil
O
il B
urne
r (Lo
ng)
0 13
.20%
25
,000
0.
8333
0.
036
Yes
Fo
il
Oil
Bur
ner (
Long
) 0
14.3
0%
25,0
00
0.83
33
0.03
6 Y
es
Foil
O
il B
urne
r (Lo
ng)
0 12
.50%
26
,000
0.
8667
0.
037
Yes
Fo
il
Oil
Bur
ner (
Long
) 0
13.0
0%
23,0
00
0.76
67
0.03
3 Y
es
Foil
O
il B
urne
r (Lo
ng)
0 12
.00%
26
,800
0.
8933
0.
039
Yes
Fo
il
Oil
Bur
ner (
Long
) 0
12.1
0%
27,0
00
0.90
00
0.03
9 Y
es
Foil
O
il B
urne
r (Lo
ng)
0 15
.20%
27
,000
0.
9000
0.
039
Yes
Fo
il
Oil
Bur
ner (
Long
) 0
12.3
0%
28,3
00
0.94
33
0.04
1 Y
es
Foil
O
il B
urne
r (Lo
ng)
0 13
.70%
29
,000
0.
9667
0.
042
Yes
Fo
il
Oil
Bur
ner (
Long
) 0
12.8
0%
30,0
00
1.00
00
0.04
3 Y
es
Foil
O
il B
urne
r (Lo
ng)
0 14
.70%
36
,000
1.
2000
0.
052
Yes
Fo
il
Oil
Bur
ner (
Long
) 10
13
.3%
25
,000
0.
8333
0.
036
No
Foil
O
il B
urne
r (Lo
ng)
10
12.5
%
27,0
00
0.90
00
0.03
9 N
o Fo
il
Oil
Bur
ner (
Long
) 10
11
.5%
28
,000
0.
9333
0.
040
No
Foil
O
il B
urne
r (Lo
ng)
10
11.5
%
27,0
00
0.90
00
0.03
9 N
o Fo
il
Oil
Bur
ner (
Long
) 10
11
.0%
38
,000
1.
2667
0.
055
No
Foil
O
il B
urne
r (Lo
ng)
10
12.3
%
35,0
00
1.16
67
0.05
0 N
o P
late
Oil
Bur
ner (
Long
) 10
12
.3%
35
,000
1.
1667
0.
050
Yes
Fo
il
Oil
Bur
ner (
Long
) 10
12
.0%
35
,000
1.
1667
0.
050
Yes
Fo
il
B-2
Igni
tion
Sou
rce
Alt
(kft)
%
O
Tota
l HC
pp
m-C
H
App
roxi
mat
ed %
V
olum
e of
Jet
A
App
roxi
mat
ed
Fuel
-Air
Mas
s R
atio
Ig
nitio
n?
Foil/
Pla
te?
Not
es
B-3
23
8
Oil
Bur
ner (
Long
) 10
21
.1%
25
,000
0.
8333
0.
036
Yes
P
late
Oil
Bur
ner (
Long
) 10
17
.9%
26
,000
0.
8667
0.
037
Yes
P
late
Oil
Bur
ner (
Long
) 10
16
.3%
25
,500
0.
8500
0.
037
Yes
P
late
Oil
Bur
ner (
Long
) 10
13
.2%
24
,000
0.
8000
0.
035
Yes
P
late
Oil
Bur
ner (
Long
) 10
12
.4%
24
,000
0.
8000
0.
035
Yes
P
late
Oil
Bur
ner (
Long
) 20
11
.50%
27
,000
0.
9000
0.
039
No
Foil
O
il B
urne
r (Lo
ng)
20
11.2
0%
29,0
00
0.96
67
0.04
2 N
o Fo
il
Oil
Bur
ner (
Long
) 20
12
.1%
33
,000
1.
1000
0.
047
No
Foil
O
il B
urne
r (Lo
ng)
20
13.0
%
34,0
00
1.13
33
0.04
9 N
o Fo
il
Oil
Bur
ner (
Long
) 20
16
.0%
26
,000
0.
8667
0.
037
No
Pla
te
O
il B
urne
r (Lo
ng)
20
17.0
%
30,0
00
1.00
00
0.04
3 N
o P
late
Oil
Bur
ner (
Long
) 20
14
.4%
30
,000
1.
0000
0.
043
No
Pla
te
O
il B
urne
r (Lo
ng)
20
12.9
%
30,0
00
1.00
00
0.04
3 N
o P
late
Oil
Bur
ner (
Long
) 20
12
.6%
31
,000
1.
0333
0.
045
No
Pla
te
O
il B
urne
r (Lo
ng)
20
11.8
%
34,0
00
1.13
33
0.04
9 N
o P
late
Oil
Bur
ner (
Long
) 20
13
.8%
27
,000
0.
9000
0.
039
Yes
Fo
il
Oil
Bur
ner (
Long
) 20
13
.60%
27
,000
0.
9000
0.
039
Yes
Fo
il
Oil
Bur
ner (
Long
) 20
16
.0%
33
,000
1.
1000
0.
047
Yes
P
late
Oil
Bur
ner (
Long
) 20
21
.0%
N
/A
N/A
N
/A
Yes
P
late
Oil
Bur
ner (
Long
) 20
18
.5%
N
/A
N/A
N
/A
Yes
P
late
Oil
Bur
ner (
Long
) 30
13
.7%
35
,000
1.
1667
0.
050
No
Foil
O
il B
urne
r (Lo
ng)
30
13.9
0%
30,0
00
1.00
00
0.04
3 N
o Fo
il
Oil
Bur
ner (
Long
) 30
12
.70%
49
,000
1.
6333
0.
070
No
Foil
O
il B
urne
r (Lo
ng)
30
12.2
5%
33,0
00
1.10
00
0.04
7 N
o Fo
il
Oil
Bur
ner (
Long
) 30
13
.5%
47
,000
1.
5667
0.
068
No
Foil
O
il B
urne
r (Lo
ng)
30
14.3
%
54,0
00
1.80
00
0.07
8 N
o Fo
il
Oil
Bur
ner (
Long
) 30
14
.6%
40
,000
1.
3333
0.
058
No
Foil
O
il B
urne
r (Lo
ng)
30
14.8
%
52,0
00
1.73
33
0.07
5 N
o Fo
il
Oil
Bur
ner (
Long
) 30
13
.4%
49
,000
1.
6333
0.
070
No
Foil
O
il B
urne
r (Lo
ng)
30
14.3
%
39,0
00
1.30
00
0.05
6 N
o Fo
il
Igni
tion
Sou
rce
Alt
(kft)
%
O
Tota
l HC
pp
m-C
H
App
roxi
mat
ed %
V
olum
e of
Jet
A
App
roxi
mat
ed
Fuel
-Air
Mas
s R
atio
Ig
nitio
n?
Foil/
Pla
te?
Not
es
B-4
23
8
Oil
Bur
ner (
Long
) 30
14
.0%
43
,000
1.
4333
0.
062
No
Foil
O
il B
urne
r (Lo
ng)
30
18.0
%
32,0
00
1.06
67
0.04
6 N
o P
late
Oil
Bur
ner (
Long
) 30
12
.0%
43
,500
1.
4500
0.
063
No
Pla
te
O
il B
urne
r (Lo
ng)
30
13.4
%
45,0
00
1.50
00
0.06
5 N
o P
late
Oil
Bur
ner (
Long
) 30
14
.10%
33
,000
1.
1000
0.
047
Yes
Fo
il
Oil
Bur
ner (
Long
) 30
14
.10%
37
,000
1.
2333
0.
053
Yes
Fo
il
Oil
Bur
ner (
Long
) 30
16
.0%
47
,000
1.
5667
0.
068
Yes
Fo
il
Oil
Bur
ner (
Long
) 30
15
.4%
32
,000
1.
0667
0.
046
Yes
Fo
il
Oil
Bur
ner (
Long
) 30
15
.1%
30
,000
1.
0000
0.
043
Yes
Fo
il
Oil
Bur
ner (
Long
) 30
14
.2%
36
,000
1.
2000
0.
052
Yes
Fo
il
Oil
Bur
ner (
Long
) 30
14
.4%
43
,000
1.
4333
0.
062
Yes
Fo
il
Oil
Bur
ner (
Long
) 30
21
.0%
N
/A
N/A
N
/A
Yes
P
late
Oil
Bur
ner (
Long
) 30
16
.0%
26
,000
0.
8667
0.
037
Yes
P
late
Oil
Bur
ner (
Long
) 30
15
.5%
N
/A
N/A
N
/A
Yes
P
late
Oil
Bur
ner (
Long
) 38
17
.20%
46
,000
1.
5333
0.
066
No
Foil
O
il B
urne
r (Lo
ng)
38
14.7
0%
45,0
00
1.50
00
0.06
5 no
Fo
il
Oil
Bur
ner (
Long
) 38
15
.40%
47
,000
1.
5667
0.
068
no
Foil
O
il B
urne
r (Lo
ng)
38
15.4
0%
48,0
00
1.60
00
0.06
9 no
Fo
il
Oil
Bur
ner (
Long
) 38
21
.00%
23
,000
0.
7667
0.
033
no
Foil
O
il B
urne
r (Lo
ng)
38
21.0
0%
22,8
00
0.76
00
0.03
3 no
Fo
il
Oil
Bur
ner (
Long
) 38
16
.10%
51
,000
1.
7000
0.
073
yes
Foil
O
il B
urne
r (Lo
ng)
38
16.4
0%
45,0
00
1.50
00
0.06
5 ye
s Fo
il
Oil
Bur
ner (
Long
) 38
15
.70%
45
,000
1.
5000
0.
065
yes
Foil
O
il B
urne
r (Lo
ng)
38
16.3
0%
1.83
33
0.07
9 ye
s Fo
il
Oil
Bur
ner (
Long
) 38
16
.00%
45
,000
1.
5000
0.
065
yes
Foil
O
il B
urne
r (Lo
ng)
38
16.0
0%
40,0
00
1.33
33
0.05
8 ye
s Fo
il
Oil
Bur
ner (
Long
) 38
15
.70%
42
,500
1.
4167
0.
061
yes
Foil
O
il B
urne
r (Lo
ng)
38
15.6
0%
40,0
00
1.33
33
0.05
8 ye
s Fo
il
Oil
Bur
ner (
Long
) 38
21
.00%
34
,000
1.
1333
0.
049
yes
Foil
O
il B
urne
r (Lo
ng)
38
21.0
0%
34,0
00
1.13
33
0.04
9 ye
s Fo
il
55,0
00
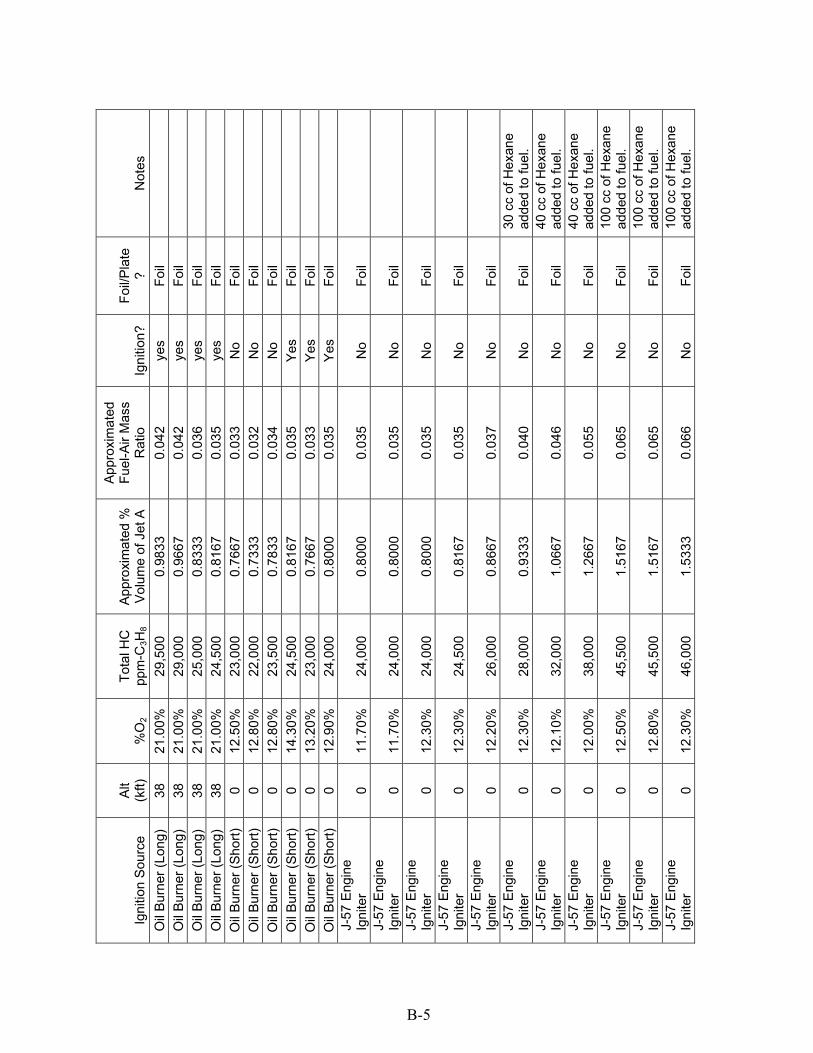
Igni
tion
Sou
rce
Alt
(kft)
%
O
Tota
l HC
pp
m-C
H
App
roxi
mat
ed %
V
olum
e of
Jet
A
App
roxi
mat
ed
Fuel
-Air
Mas
s R
atio
Ig
nitio
n?
Foil/
Pla
te?
Not
es
B-5
23
8
Oil
Bur
ner (
Long
) 38
21
.00%
29
,500
0.
9833
0.
042
yes
Foil
O
il B
urne
r (Lo
ng)
38
21.0
0%
29,0
00
0.96
67
0.04
2 ye
s Fo
il
Oil
Bur
ner (
Long
) 38
21
.00%
25
,000
0.
8333
0.
036
yes
Foil
O
il B
urne
r (Lo
ng)
38
21.0
0%
24,5
00
0.81
67
0.03
5 ye
s Fo
il
Oil
Bur
ner (
Shor
t) 0
12.5
0%
23,0
00
0.76
67
0.03
3 N
o Fo
il
Oil
Bur
ner (
Shor
t) 0
12.8
0%
22,0
00
0.73
33
0.03
2 N
o Fo
il
Oil
Bur
ner (
Shor
t) 0
12.8
0%
23,5
00
0.78
33
0.03
4 N
o Fo
il
Oil
Bur
ner (
Shor
t) 0
14.3
0%
24,5
00
0.81
67
0.03
5 Y
es
Foil
O
il B
urne
r (Sh
ort)
0 13
.20%
23
,000
0.
7667
0.
033
Yes
Fo
il
Oil
Bur
ner (
Shor
t) 0
12.9
0%
24,0
00
0.80
00
0.03
5 Y
es
Foil
J-
57 E
ngin
e Ig
nite
r 0
11
.70%
24,0
000.
8000
0.03
5N
oFo
ilJ-
57 E
ngin
e Ig
nite
r 0
11
.70%
24,0
000.
8000
0.03
5N
oFo
ilJ-
57 E
ngin
e Ig
nite
r
0
12.3
0%
24,0
000.
8000
0.03
5N
oFo
ilJ-
57 E
ngin
e Ig
nite
r 0
12
.30%
24,5
000.
8167
0.03
5N
oFo
ilJ-
57 E
ngin
e Ig
nite
r
0
12.2
0%
26,0
000.
8667
0.03
7N
oFo
ilJ-
57 E
ngin
e Ig
nite
r 0
12.3
0%28
,000
0.93
330.
040
No
Foil
30 c
c of
Hex
ane
adde
d to
fuel
. J-
57 E
ngin
e Ig
nite
r 0
12.1
0%32
,000
1.06
670.
046
No
Foil
40 c
c of
Hex
ane
adde
d to
fuel
. J-
57 E
ngin
e Ig
nite
r
0
12.0
0%
38,0
001.
2667
0.05
5N
oFo
il 40
cc
of H
exan
e ad
ded
to fu
el.
J-57
Eng
ine
Igni
ter
0
12
.50%
45,5
001.
5167
0.06
5N
oFo
il10
0 cc
of H
exan
e ad
ded
to fu
el.
J-57
Eng
ine
Igni
ter
0
12
.80%
45,5
001.
5167
0.06
5N
oFo
il10
0 cc
of H
exan
e ad
ded
to fu
el.
J-57
Eng
ine
Igni
ter
0 12
.30%
46
,000
1.53
330.
066
No
Foil
100
cc o
f Hex
ane
adde
d to
fuel
.
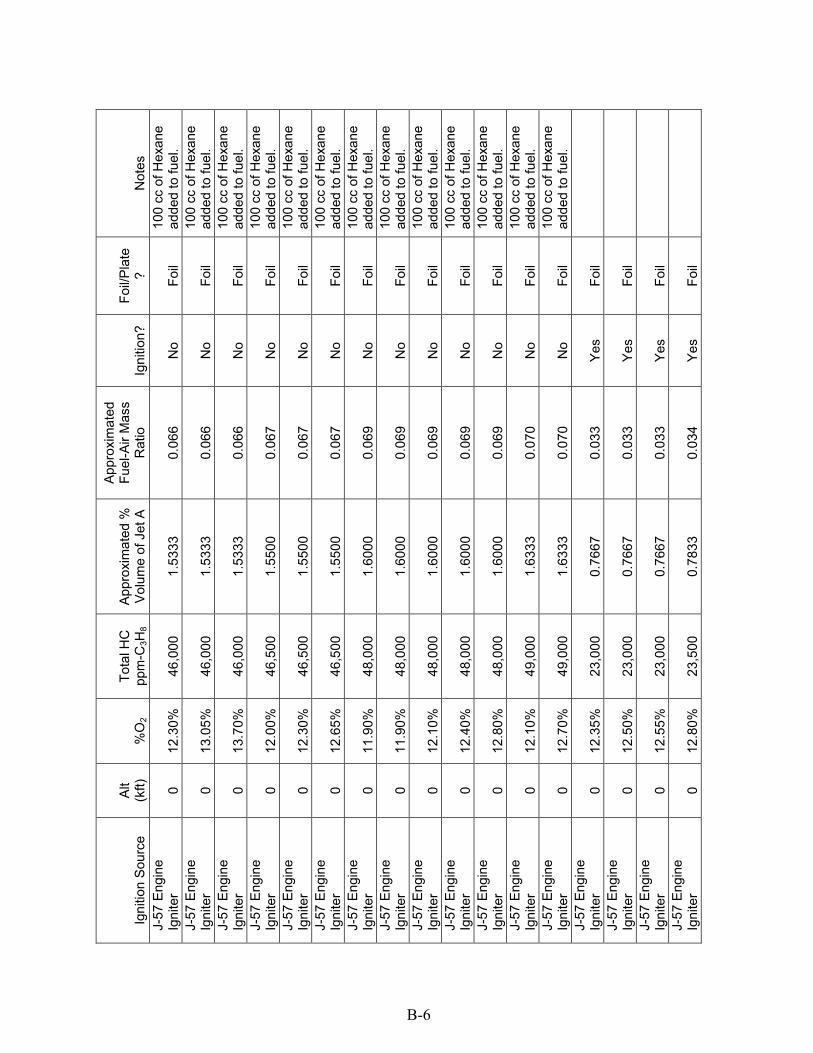
Igni
tion
Sou
rce
Alt
(kft)
%
O
Tota
l HC
pp
m-C
H
App
roxi
mat
ed %
V
olum
e of
Jet
A
App
roxi
mat
ed
Fuel
-Air
Mas
s R
atio
Ig
nitio
n?
Foil/
Pla
te?
Not
es
B-6
23
8
J-57
Eng
ine
Igni
ter
0
12
.30%
46,0
001.
5333
0.06
6N
oFo
il10
0 cc
of H
exan
e ad
ded
to fu
el.
J-57
Eng
ine
Igni
ter
0 13
.05%
46
,000
1.53
330.
066
No
Foil
100
cc o
f Hex
ane
adde
d to
fuel
. J-
57 E
ngin
e Ig
nite
r 0
13.7
0%46
,000
1.53
330.
066
No
Foil
100
cc o
f Hex
ane
adde
d to
fuel
. J-
57 E
ngin
e Ig
nite
r 0
12.0
0%46
,500
1.55
000.
067
No
Foil
100
cc o
f Hex
ane
adde
d to
fuel
. J-
57 E
ngin
e Ig
nite
r
0
12.3
0%
46,5
001.
5500
0.06
7N
oFo
il 10
0 cc
of H
exan
e ad
ded
to fu
el.
J-57
Eng
ine
Igni
ter
0
12
.65%
46,5
001.
5500
0.06
7N
oFo
il10
0 cc
of H
exan
e ad
ded
to fu
el.
J-57
Eng
ine
Igni
ter
0 11
.90%
48
,000
1.60
000.
069
No
Foil
100
cc o
f Hex
ane
adde
d to
fuel
. J-
57 E
ngin
e Ig
nite
r 0
11.9
0%48
,000
1.60
000.
069
No
Foil
100
cc o
f Hex
ane
adde
d to
fuel
. J-
57 E
ngin
e Ig
nite
r 0
12.1
0%48
,000
1.60
000.
069
No
Foil
100
cc o
f Hex
ane
adde
d to
fuel
. J-
57 E
ngin
e Ig
nite
r
0
12.4
0%
48,0
001.
6000
0.06
9N
oFo
il 10
0 cc
of H
exan
e ad
ded
to fu
el.
J-57
Eng
ine
Igni
ter
0
12
.80%
48,0
001.
6000
0.06
9N
oFo
il10
0 cc
of H
exan
e ad
ded
to fu
el.
J-57
Eng
ine
Igni
ter
0
12
.10%
49,0
001.
6333
0.07
0N
oFo
il10
0 cc
of H
exan
e ad
ded
to fu
el.
J-57
Eng
ine
Igni
ter
0 12
.70%
49
,000
1.63
330.
070
No
Foil
100
cc o
f Hex
ane
adde
d to
fuel
. J-
57 E
ngin
e Ig
nite
r 0
12
.35%
23,0
000.
7667
0.03
3Y
esFo
ilJ-
57 E
ngin
e Ig
nite
r 0
12
.50%
23,0
000.
7667
0.03
3Y
esFo
ilJ-
57 E
ngin
e Ig
nite
r 0
12
.55%
23,0
000.
7667
0.03
3Y
esFo
ilJ-
57 E
ngin
e Ig
nite
r 0
12
.80%
23,5
000.
7833
0.03
4Y
esFo
il
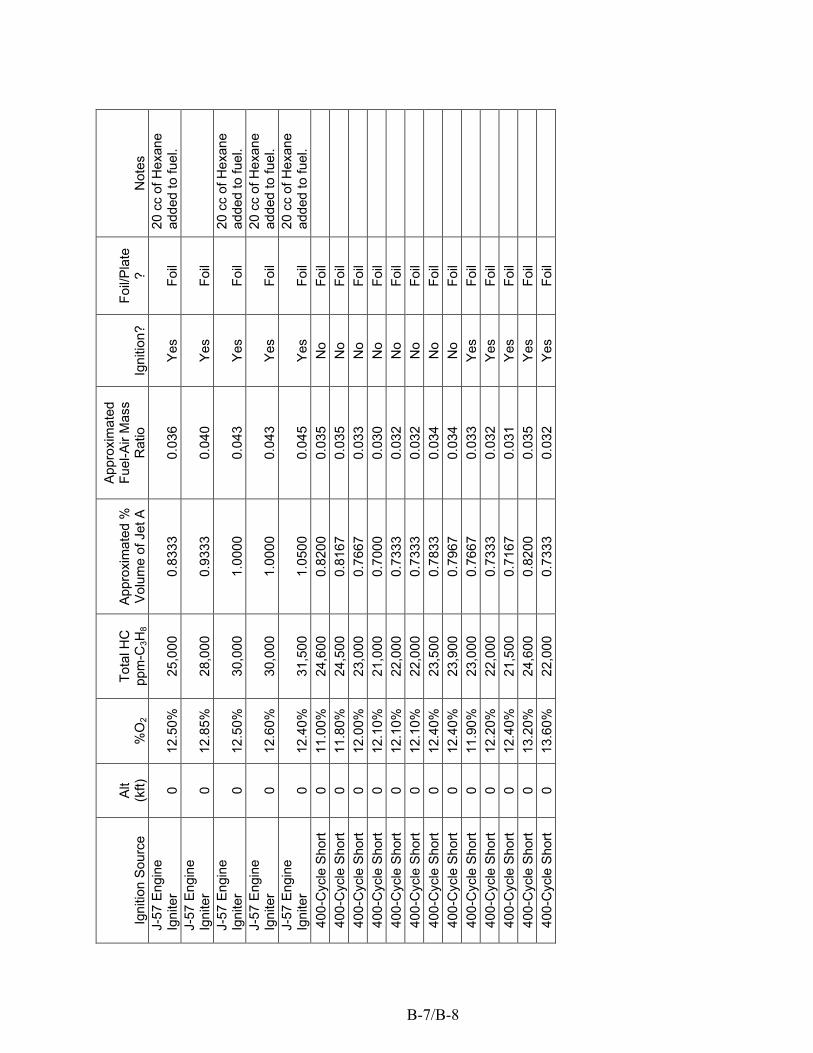
Igni
tion
Sou
rce
Alt
(kft)
%
O2
Tota
l HC
pp
m-C
3H8
App
roxi
mat
ed %
V
olum
e of
Jet
A
App
roxi
mat
ed
Fuel
-Air
Mas
s R
atio
Ig
nitio
n?
Foil/
Pla
te?
Not
es
J-57
Eng
ine
Igni
ter
0
12
.50%
25,0
000.
8333
0.03
6Y
esFo
il20
cc
of H
exan
e ad
ded
to fu
el.
J-57
Eng
ine
Igni
ter
0
12
.85%
28,0
000.
9333
0.04
0Y
esFo
il
J-57
Eng
ine
Igni
ter
0 12
.50%
30
,000
1.00
000.
043
Yes
Foil
20 c
c of
Hex
ane
adde
d to
fuel
. J-
57 E
ngin
e Ig
nite
r 0
12.6
0%30
,000
1.00
000.
043
Yes
Foil
20 c
c of
Hex
ane
adde
d to
fuel
. J-
57 E
ngin
e Ig
nite
r 0
12.4
0%31
,500
1.05
000.
045
Yes
Foil
20 c
c of
Hex
ane
adde
d to
fuel
. 40
0-C
ycle
Sho
rt 0
11.0
0%
24,6
00
0.82
00
0.03
5 N
o Fo
il
400-
Cyc
le S
hort
0 11
.80%
24
,500
0.
8167
0.
035
No
Foil
40
0-C
ycle
Sho
rt 0
12.0
0%
23,0
00
0.76
67
0.03
3 N
o Fo
il
400-
Cyc
le S
hort
0 12
.10%
21
,000
0.
7000
0.
030
No
Foil
40
0-C
ycle
Sho
rt 0
12.1
0%
22,0
00
0.73
33
0.03
2 N
o Fo
il
400-
Cyc
le S
hort
0 12
.10%
22
,000
0.
7333
0.
032
No
Foil
40
0-C
ycle
Sho
rt 0
12.4
0%
23,5
00
0.78
33
0.03
4 N
o Fo
il
400-
Cyc
le S
hort
0 12
.40%
23
,900
0.
7967
0.
034
No
Foil
40
0-C
ycle
Sho
rt 0
11.9
0%
23,0
00
0.76
67
0.03
3 Y
es
Foil
40
0-C
ycle
Sho
rt 0
12.2
0%
22,0
00
0.73
33
0.03
2 Y
es
Foil
40
0-C
ycle
Sho
rt 0
12.4
0%
21,5
00
0.71
67
0.03
1 Y
es
Foil
40
0-C
ycle
Sho
rt 0
13.2
0%
24,6
00
0.82
00
0.03
5 Y
es
Foil
40
0-C
ycle
Sho
rt 0
13.6
0%
22,0
00
0.73
33
0.03
2 Y
es
Foil
B-7/B-8