Embed Size (px)
Citation preview

DOT/FAA/AR-03/63 Office of Aviation Research Washington, D.C. 20591
Development and Evaluation of the V-Notched Rail Shear Test for Composite Laminates September 2003 Final Report This document is available to the U.S. public through the National Technical Information Service (NTIS), Springfield, Virginia 22161.
U.S. Department of Transportation Federal Aviation Administration

NOTICE
This document is disseminated under the sponsorship of the U.S. Department of Transportation in the interest of information exchange. The United States Government assumes no liability for the contents or use thereof. The United States Government does not endorse products or manufacturers. Trade or manufacturer's names appear herein solely because they are considered essential to the objective of this report. This document does not constitute FAA certification policy. Consult your local FAA aircraft certification office as to its use. This report is available at the Federal Aviation Administration William J. Hughes Technical Center's Full-Text Technical Reports page: actlibrary.tc.faa.gov in Adobe Acrobat portable document format (PDF).

Technical Report Documentation Page 1. Report No. DOT/FAA/AR-03/63
2. Government Accession No. 3. Recipient's Catalog No.
5. Report Date September 2003
4. Title and Subtitle DEVELOPMENT AND EVALUATION OF THE V-NOTCHED RAIL SHEAR TEST FOR COMPOSITE LAMINATES 6. Performing Organization Code
7. Author(s) Daniel O. Adams*, Joseph M. Moriarty*, Adam M. Gallegos*, and Donald F. Adams**
8. Performing Organization Report No.
10. Work Unit No. (TRAIS)
9. Performing Organization Name and Address *Department of Mechanical Engineering **Wyoming Test Fixtures, Inc. University of Utah 421 S. 19th Street Salt Lake City, UT 84109 Laramie, WY 82070
11. Contract or Grant No. 13. Type of Report and Period Covered Final Report
12. Sponsoring Agency Name and Address U.S. Department of Transportation Federal Aviation Administration Office of Aviation Research Washington, DC 20591
14. Sponsoring Agency Code AIR-120
15. Supplementary Notes The FAA William J. Hughes Technical Center Technical Monitor was Peter Shyprykevich. 16. Abstract The V-notched rail shear test developed in this investigation appears to be well-suited for measuring the in-plane shear modulus and shear strength of unidirectional and multidirectional composite laminates. This test method incorporates attractive features from both the Iosipescu V-notched shear test and the standard two-rail shear test. The proposed V-notched specimen provides a larger gage section than the standard Iosipescu shear specimen and enhanced loading capability compared to either existing test method. Finite element analysis was used to evaluate several notched and tabbed rail shear specimen configurations. A 90° notch-angle V-notched specimen configuration, with notch depths that were 22.7 percent of the gage section height, was found to produce a desirable stress state in the gage section. Extensive rail shear testing was performed on a series of 16-ply carbon/epoxy laminates ranging from 0% ±45 plies to 100% ±45 plies consisting of [0]16, [0/90]4S, [(0/90)2/±45/0/90]S, [0/±45/90]2S, and [±45/90/±45/0/±45]S. Both a tabbed rectangular specimen and the V-notched specimen produced significantly higher shear strengths than the baseline rectangular specimen. The V-notched specimen configuration was selected over the tabbed rectangular configuration based on the higher shear strengths obtained, acceptable gage section failures produced, ease and economy of specimen preparation, and accuracy of shear modulus measurements. The proposed 90° notch-angle V-notched specimen was shown to produce accurate measures of shear modulus as predicted by finite element analysis. A new rail shear test fixture was developed to accommodate the V-notched rail shear specimen. 17. Key Words Shear testing, Rail shear, Composite materials, Test methods
18. Distribution Statement This document is available to the public through the National Technical Information Service (NTIS), Springfield, Virginia 22161.
19. Security Classif. (of this report)
Unclassified
20. Security Classif. (of this page)
Unclassified
21. No. of Pages
102
22. Price
Form DOT F1700.7 (8-72) Reproduction of completed page authorized

TABLE OF CONTENTS Page EXECUTIVE SUMMARY xi 1. INTRODUCTION 1
2. LITERATURE REVIEW 2
2.1 Historical Development of the Rail Shear Test Method 2 2.2 Specimen Configurations for Composite Shear Tests 5
3. FINITE ELEMENT MODELING 7
3.1 Introduction 7 3.2 Analysis Methodology 7 3.3 Specimen Geometries Modeled 9
3.3.1 Original Rectangular and Trapezoidal Specimens 9 3.3.2 Tabbed Original Rectangular Specimen Geometries 11 3.3.3 Original Rectangular Notched Specimens 11 3.3.4 Modified Rectangular V-Notched Specimen 15 3.3.5 Modified Rectangular U-Notched Specimen 17
3.4 Test Fixture Geometry 19
4. FINITE ELEMENT RESULTS 20
4.1 Introduction 20 4.2 Data Processing 21 4.3 Original Rectangular and Trapezoidal Specimen Configurations 21
4.3.1 Shear Stresses for Original Rectangular and Trapezoidal Specimen
Configurations 22
4.3.2 Normal Stresses for Original Rectangular and Trapezoidal Specimen Configurations 23
4.3.3 Concepts for Reducing Axial and Transverse Normal Stresses 27
4.4 Tabbed Original Rectangular Specimen Configurations 30
4.4.1 Shear Stresses for Standard Tab, Extended Tab, and Tapered Tab
Specimen Configurations 30
iii

4.4.2 Axial and Transverse Normal Stresses for Standard Tab, Extended Tab, and Tapered Tab Specimen Configurations 32
4.5 Original Rectangular Notched Specimen Configurations 34
4.5.1 Original Rectangular V-Notched Specimen Configurations 35 4.5.2 Original Rectangular U-Notched Specimen Configurations 37
4.6 Modified Rectangular V-Notched Specimen Configurations 39
4.6.1 Effects of NDR for the Modified Rectangular V-Notched Specimen 41
4.6.2 Effects of Notch Angle for the Modified Rectangular V-Notched
Specimen 43
4.6.3 Effects of Notch Tip Radius for the Modified Rectangular V-Notched Specimen 46
4.7 Modified Rectangular U-Notched Specimen Configurations 48
4.7.1 Effects of NDR for the Modified Rectangular U-Notched Specimen 50
4.7.2 Effects of Notch Width for the Modified Rectangular U-Notched
Specimen 52
4.8 Shear Modulus Determination 53 5. SPECIMEN FABRICATION AND TESTING METHODOLOGIES 54
5.1 Introduction 54 5.2 Material Systems Tested 55 5.3 Panel Fabrication 55 5.4 Specimen Fabrication 56 5.5 Modified Two-Rail Shear Test Fixture 60 5.6 Testing Procedure 63
6. EXPERIMENTAL RESULTS 64
6.1 Introduction 64 6.2 Preliminary Evaluation 65 6.3 Primary Evaluation 66
6.3.1 Rail Shear Fixture Evaluation 66 6.3.2 Specimen Evaluation 72 6.3.3 New Rail Shear Test Fixture 82
6.4 Comparison of the V-Notched Rail Shear Test With Other Shear Tests 84
iv

6.4.1 Comparison of Shear Strengths 84 6.4.2 Comparison of Shear Moduli 86
7. SUMMARY AND CONCLUSIONS 87
8. REFERENCES 89
LIST OF FIGURES Figure Page 1 Modified Two-Rail Shear Fixture of Hussain and Adams 2
2 ASTM D 2719 Large Panel Shear Test 3
3 ASTM D 2719 Two-Rail Shear Test for Structural Panels 3
4 ASTM D 4255 Two-Rail Shear Test 4
5 ASTM D 4255 Three-Rail Shear Test 5
6 Iosipescu (V-Notched) Shear Test Fixture and Specimen 6
7 Compact Shear Test Fixture and Specimen 6
8 Orientation of Finite Element Model 8
9 Initial Rectangular Specimen Investigated 10
10 Initial Trapezoidal Specimen Investigated 10
11 Standard Tab Specimen Configuration 12
12 Extended Tab Specimen Configuration 12
13 Tapered Tab Specimen Configuration 13
14 V-Notched Specimen Dimensions 14
15 U-Notched Specimen Dimensions 14
16 Modified Rectangular V-Notched Specimen Geometry for NDR Investigation 15
17 (a) 70° and (b) 110° Notch Angles Modeled Using Variable Width Method 16
18 (a) 70° and (b) 110° Notch Angles Modeled Using Constant Width Method 17
v

19 Rounded V-Notched Specimen Dimensions 17
20 Modified Rectangular U-Notched Specimen Geometry for NDR Investigation 18
21 Modified Rectangular U-Notched Specimen Geometries for Notch Width Investigation 19
22 Actual Test Fixture Dimensions 19
23 Simulated Test Fixture Dimensions 20
24 Shear Stress Distributions for the Original Rectangular Specimen (Normalized) 22
25 Shear Stress Distributions for the Original Trapezoidal Specimen (Normalized) 22
26 Axial Stresses for Original Rectangular Specimen (Normalized) 24
27 Transverse Stresses for Original Rectangular Specimen (Normalized) 25
28 Axial Stresses for Original Trapezoidal Specimen (Normalized) 26
29 Transverse Stresses for Original Trapezoidal Specimen (Normalized) 26
30 Connecting Members Producing a Four-Bar Linkage 28
31 Effect of Constraint Concepts on Axial Stresses for [0/±45/90]2S Rectangular Specimen (Normalized) 28
32 Effect of Constraint Concepts on Transverse Stresses for [0/±45/90]2S Rectangular Specimen (Normalized) 29
33 Effect of Constraint Concepts on Shear Stresses for [0/±45/90]2S Rectangular Specimen (Normalized) 29
34 Shear Stress Distributions for the Standard Tab Specimen (Normalized) 30
35 Shear Stress Distributions for the Extended Tab Specimen (Normalized) 31
36 Shear Stress Distributions for the Tapered Tab Specimen (Normalized) 31
37 Axial Normal Stress Distributions for the Standard Tab Specimens (Normalized) 32
38 Transverse Normal Stress Distributions for the Standard Tab Specimens (Normalized) 32
39 Axial Normal Stress Distributions for the Extended Tab Specimens (Normalized) 33
40 Transverse Normal Stress Distributions for the Extended Tab Specimens (Normalized) 33
vi

41 Axial Normal Stress Distributions for the Tapered Tab Specimens (Normalized) 34
42 Transverse Normal Stress Distributions for the Tapered Tab Specimens (Normalized) 34
43 Shear Stress Distributions for the [0/±45/90]2S Original Rectangular V-Notched Specimen Configurations (Normalized) 35
44 Axial Normal Stress Distributions for the [0/±45/90]2S Original Rectangular V-Notched Specimens (Normalized) 36
45 Transverse Normal Stress Distributions for the [0/±45/90]2S Original Rectangular V-Notched Specimens (Normalized) 36
46 Shear Stress Distributions for the [0/±45/90]2S Original Rectangular U-Notched Specimen Configurations (Normalized) 37
47 Axial Stress Distributions for the [0/±45/90]2S Original Rectangular U-Notched Specimen Configurations (Normalized) 38
48 Transverse Stress Distributions for the [0/±45/90]2S Original Rectangular U-Notched Specimen Configurations (Normalized) 39
49 Shear Stress Distributions for the Baseline V-Notched Specimen Configuration (Normalized) 40
50 Axial Normal Stress Distributions for the Baseline V-Notched Specimen Configuration (Normalized) 40
51 Transverse Normal Stress Distributions for the Baseline V-Notched Specimen Configuration (Normalized) 41
52 Shear Stress Distributions for the [0/±45/90]2S Modified Rectangular V-Notched Specimen With Varying NDR (Normalized) 42
53 Axial Normal Stress Distributions for the [0/±45/90]2S Modified Rectangular V-Notched Specimen With Varying NDR (Normalized) 42
54 Transverse Normal Stress Distributions for the [0/±45/90]2S Modified Rectangular V-Notched Specimen With Varying NDR (Normalized) 43
55 Shear Stress Distributions for the [0/±45/90]2S 70° and 110° Notch Angles Modeled Using a Variable Notch Width (Normalized) 44
56 Shear Stress Distributions for the [0/±45/90]2S 70° and 110° Notch Angles Modeled Using a Constant Notch Width (Normalized) 44
vii

57 Axial Normal Stress Distributions for the [0/±45/90]2S 70° and 110° Notch Angles Modeled Using a Variable Notch Width (Normalized) 45
58 Axial Normal Stress Distributions for the [0/±45/90]2S 70° and 110° Notch Angles Modeled Using a Constant Notch Width (Normalized) 45
59 Transverse Normal Stress Distributions for the [0/±45/90]2S 70° and 110° Notch Angles Modeled Using a Variable Notch Width (Normalized) 45
60 Transverse Normal Stress Distributions for the [0/±45/90]2S 70° and 110° Notch Angles Modeled Using a Constant Notch Width (Normalized) 46
61 Shear Stress Distributions for the [0/±45/90]2S Laminate With 0.025- and 0.050-in. Notch Radii (Normalized) 47
62 Axial Normal Stress Distributions for the [0/±45/90]2S Laminate With 0.025- and 0.050-in. Notch Radii (Normalized) 47
63 Transverse Normal Stress Distributions for the [0/±45/90]2S Laminate With 0.025- and 0.050-in. Notch Radii (Normalized) 48
64 Shear Stress Distributions in Modified Rectangular U-Notched Specimens (Normalized) 49
65 Axial Normal Stress Distributions in Modified Rectangular U-Notched Specimens (Normalized) 49
66 Transverse Normal Stress Distributions in Modified Rectangular U-Notched Specimens (Normalized) 50
67 Shear Stress Distributions for the [0/±45/90]2S Modified Rectangular U-Notched Specimens of Varying NDR (Normalized) 51
68 Axial Normal Stress Distributions for the [0/±45/90]2S Modified Rectangular U-Notched Specimens of Varying NDR (Normalized) 51
69 Transverse Normal Stress Distributions for the [0/±45/90]2S Modified Rectangular U-Notched Specimens of Varying NDR (Normalized) 51
70 Shear Stress Distributions for the [0/±45/90]2S Modified Rectangular U-Notched Specimens With Various Notch Widths (Normalized) 52
71 Axial Normal Stress Distributions for the [0/±45/90]2S Modified Rectangular U-Notched Specimens With Various Notch Widths (Normalized) 52
72 Transverse Stress Distributions for the [0/±45/90]2S Modified Rectangular U-Notched Specimens With Various Notch Widths (Normalized) 53
viii

73 Nondimensionalized Shear Moduli Calculated for Various Strain Gage Lengths 54
74 Rectangular V-Notched Specimen Geometries 57
75 U-Notched Specimen Geometry 58
76 Modified V-Notched Specimen Geometry 59
77 Compact V-Notched Specimen Geometry 59
78 Modified Two-Rail Shear Test Fixture 60
79 Drawings of Modified Fixture Side Rails 61
80 Drawings of Modified Fixture Loading and Gripping Plates 61
81 Redesigned Loading Plate 62
82 Effect of Clamping Bolt Torque on Shear Strength 67
83 Strain-Gaged Aluminum Specimen 67
84 Compression-Loaded Rail Shear Fixture 68
85 Constraining of Compression-Loaded Fixture 69
86 Linkage Bars Applied to Rail Shear Fixture 69
87 Normalized Shear Strains for the Four Fixture Configurations 70
88 Normalized Axial Strains for the Four Fixture Configurations 71
89 Normalized Transverse Strains for the Four Fixture Configurations 71
90 Typical Failures of the Rectangular Specimens 73
91 Effect of Percentage of ±45 Plies on Untabbed and Tabbed Laminates 76
92 Typical Failures of the Tapered Tab Specimens 76
93 Typical Delamination of Tabbed Specimens 76
94 Typical Failures of the V-Notched Specimens 78
95 Comparison of Shear Strengths for U-Notched and Unnotched Original Rectangular Configurations 79
96 Typical Failures of U-Notched Specimens 79
ix

97 Comparison of Shear Strengths for Modified V-Notched and Unnotched Original Rectangular Specimen Configurations 80
98 Typical Failures Observed in Modified V-Notched Specimens 81
99 Effect of Notch Depth on Shear Strength, Modified V-Notched Specimen Configuration 82
100 New Rail Shear Test Fixture With V-Notched Specimen 83
101 New Two-Rail Shear Test Fixture Side Rails 83
102 New Two-Rail Shear Test Fixture Gripping Plates 84
LIST OF TABLES
Table Page 1 Carbon/Epoxy Laminates Modeled 9
2 Material Properties Used in Finite Element Analyses 9
3 Specimen Height for Various Modified Rectangular V-Notched NDR 16
4 Specimen Heights for Modified Rectangular U-Notched NDR Study 18
5 AS4/3501-6 Carbon/Epoxy Laminates Tested 65
6 Laminate Shear Strengths Obtained for the Original Rectangular Specimen Configuration 73
7 Shear Strengths for Tabbed Original Rectangular Specimen Configurations 75
8 Shear Strengths for [±45]4S V-Notched Specimen Configuration 77
9 Shear Strengths for U-Notched Specimen Configuration 78
10 Shear Strengths for Modified V-Notched Specimens 80
11 Shear Strengths Obtained From Three Shear Test Methods 85
12 Shear Modulus Results 87
x

EXECUTIVE SUMMARY The V-notched rail shear test developed in this investigation appears to be well-suited for measuring the in-plane shear modulus and shear strength of unidirectional and multidirectional composite laminates. This test method incorporates attractive features from both the Iosipescu V-notched shear test and the standard two-rail shear test. The proposed V-notched specimen provides a larger gage section than the standard Iosipescu shear specimen and enhanced loading capability compared to either existing test method. Finite element analysis was used to evaluate several notched and tabbed rail shear specimen configurations. A 90° notch-angle V-notched specimen configuration, with notch depths that were 22.7 percent of the gage section height, was found to produce a desirable stress state in the gage section. Extensive rail shear testing was performed on a series of 16-ply carbon/epoxy laminates ranging from 0% ±45 plies to 100% ±45 plies consisting of [0]16, [0/90]4S, [(0/90)2/±45/0/90]S, [0/±45/90]2S, and [±45/90/±45/0/±45]S. Both a tabbed rectangular specimen and the V-notched specimen produced significantly higher shear strengths than the baseline rectangular specimen. The V-notched specimen configuration was selected over the tabbed rectangular configuration based on the higher shear strengths obtained, acceptable gage section failures produced, ease and economy of specimen preparation, and accuracy of shear modulus measurements. The proposed 90° notch-angle V-notched specimen was shown to produce accurate measures of shear modulus as predicted by finite element analysis. A new rail shear test fixture was developed to accommodate the V-notched rail shear specimen.
xi/xii

1. INTRODUCTION. As the number and diversity of applications for fiber-reinforced composite materials continues to increase, the need for new and improved test methods also continues to increase. One area of continuing test method development is shear testing to measure the shear strengths and shear moduli of these composites. Shear testing is most commonly performed to measure the in-plane shear properties of a composite material, i.e., the in-plane shear modulus, the in-plane shear strength, or both. Additionally, the interlaminar shear moduli and interlaminar shear strengths may be desired. In general, all six of these shear properties must be measured to fully characterize the shear behavior of a composite material. Depending on which material properties are desired, a particular shear test method may be preferred relative to others. A variety of shear test methods have been developed to address these needs, several of which have been investigated in recent years. Although certain test methods, e.g., the Iosipescu shear test method, are more widely accepted than others, no single shear test is universally accepted as the preferred method for obtaining all six shear properties. Currently, one of the most commonly used shear tests is the Iosipescu (V-notched) shear test, described in ASTM Standard D 5379 [1]. This test method may be used to measure both the in-plane and interlaminar shear properties of a unidirectional composite. However, the relatively small gage section is not well suited for some textile composites with coarse fiber architectures and large unit cell sizes. For such materials, a specimen with a larger gage section is desired. Another limitation of the Iosipescu shear test is the magnitude of the load that may be applied through the top and bottom edges of the specimen without producing localized failures at the loading points. For unidirectional composites, both the in-plane and the interlaminar shear strengths are relatively low and edge loading of the specimen is usually not a problem. For multidirectional composite laminates and some textile composites, however, much higher shear strengths are possible, and thus, a greater loading capability is required than is possible with the edge-loading Iosipescu fixture. Applications exist where a larger gage section and higher loading capabilities are required than can be obtained by using the Iosipescu shear test method. Another shear test method that addresses the two previous problems is the two-rail shear test, described in ASTM Standard D 4255 [2]. The standard two-rail shear test fixture configuration uses a relatively large, 76.2- by 152-mm (3.00- by 6.00-in.), rectangular specimen. Since the test specimen is loaded through the specimen faces rather than the edges, this shear test appears to have promise for testing high shear strength composite laminates. However, the current two-rail shear test method has often been criticized by the composite materials community for several deficiencies [3 and 4]. Six holes must be machined in the specimen to accommodate the bolts used to attach the rails, causing specimen preparation to be a time-consuming and costly process. The holes must be machined with precision to avoid premature bearing failures in the composite laminate. Additionally, the determination of shear strength using this fixture is questionable due to stress concentrations produced in the specimen at the rails. Although loaded through the specimen faces, it is very difficult to attain adequate gripping with the standard fixture, especially for high shear strength composite laminates. Hussain and Adams [3 and 4] addressed the gripping problem in the two-rail shear fixture by using roughened rails that are clamped onto the specimen. By using the C-clamping
1

arrangement shown in figure 1, the need for holes in the test specimen itself was eliminated and premature failures encountered when using the bolted rail version were reduced. Additionally, specimen preparation was made simpler by eliminating the need for machined holes. With these modifications, the two-rail shear test became a more promising test method.
FIGURE 1. MODIFIED TWO-RAIL SHEAR FIXTURE OF HUSSAIN AND ADAMS In the present investigation, further modifications of the two-rail shear test method were made. Using the modified fixture of Hussain and Adams [3 and 4], which is able to accommodate higher shear loading without having to drill holes in the specimen, the emphasis of the present study was focused on developing a suitable test specimen configuration for obtaining both the in-plane shear modulus and in-plane shear strength of multidirectional composite laminates and textile composites. A uniform state of shear stress was desired within the gage section to permit accurate determination of shear properties and acceptable gage section failures away from the rail attachments. Both notched and tabbed specimen configurations were investigated using a combined experimental and numerical approach. 2. LITERATURE REVIEW.
2.1 HISTORICAL DEVELOPMENT OF THE RAIL SHEAR TEST METHOD. Shear testing of anisotropic (orthotropic) materials began in the 1950s based on the need to obtain the shear properties of plywood. In 1957, the U.S. Forest Products Laboratory developed a four-rail shear test (Large Panel Shear Test) for this purpose. This shear test consisted of gluing heavy lumber rails on the top and bottom of all four edges of the plywood panel to be tested [5]. The plywood panel, 1270 by 1270 mm (50 by 50 in.), is shown in figure 2 along with the test fixture. This test fixture was further modified by the Douglas Fir Plywood Association in the early 1960s [5]. The resulting test fixture was a two-rail shear fixture (figure 3). This new fixture was developed in an attempt to produce pure shear and induce failure along the test specimen’s weakest shear plane while simultaneously reducing the cost and complexity of the four-rail shear test. The panel size of the two-rail shear test was specified as 610 by 432 mm (24 by 17 in.) [7]. ASTM has standardized both the four- and two-rail shear tests under the designation ASTM D 2719 [6].
2
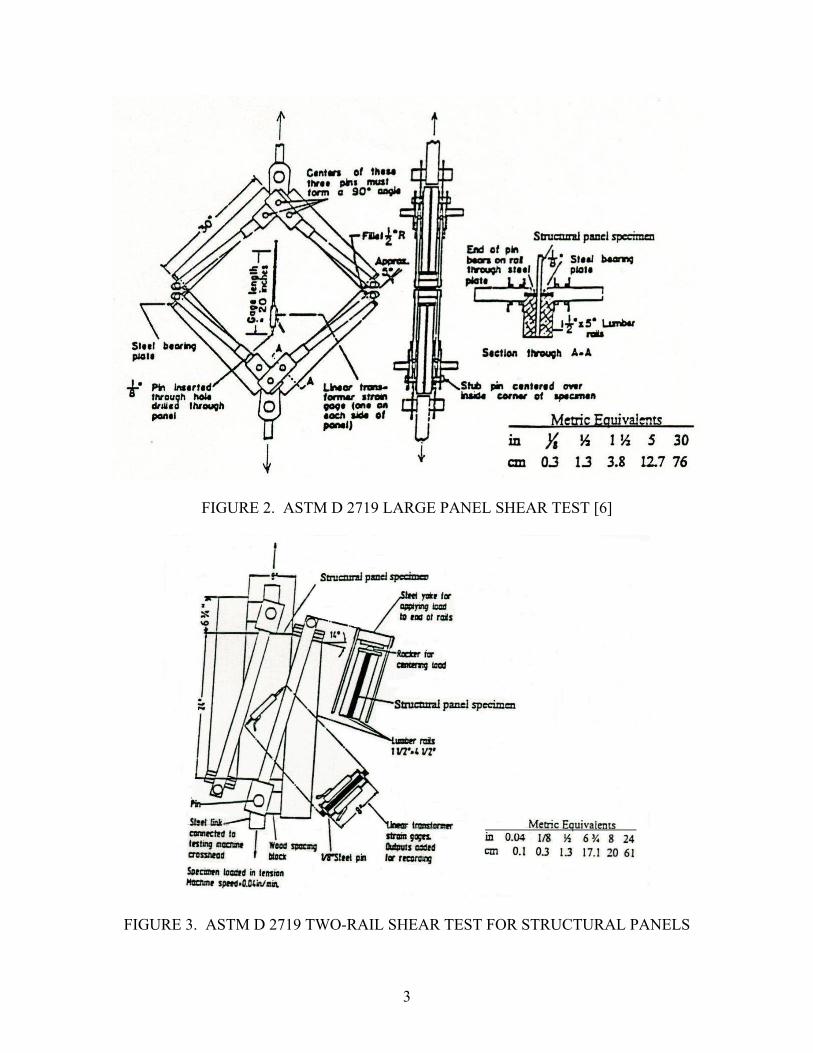
FIGURE 2. ASTM D 2719 LARGE PANEL SHEAR TEST [6]
FIGURE 3. ASTM D 2719 TWO-RAIL SHEAR TEST FOR STRUCTURAL PANELS
3

The investigation of stress states in a rectangular plate was not a new concept at the time these rail shear tests were developed. Work by Coker [8], published in 1912, included the use of steel frames to produce a symmetrical double shear in a rectangular homogeneous glass plate specimen. Glass was used because of its birefringence properties, thus allowing optical photoelastic analyses to be performed. Experimental results showed that the shear stress and shear strain distributions in a long narrow plate were uniform throughout the test section with the exception of small regions near the free ends [8]. These findings were later verified, both analytically and experimentally, by Inglis [9] and Whitney [10]. In the mid 1960s, the two-rail test fixture was modified to accommodate thin plates made from advanced composites. This new fixture consisted of two rails that would be bolted onto both sides of a composite specimen. The test fixture was loaded in compression. This new test, reported by Boller at the U.S. Department of Agriculture [12], was capable of measuring shear properties in multidirectional composite laminates. In 1983, this two-rail shear test was slightly modified and standardized by ASTM under the designation of ASTM D 4255 [2]. This fixture and specimen are shown in figure 4. Also included in ASTM D 4255 was the procedure and test fixture specifications for a three-rail shear test (figure 5), reported by Sims in 1973 [11] to have been developed by the Air Force Materials Laboratory.
FIGURE 4. ASTM D 4255 TWO-RAIL SHEAR TEST [2]
4
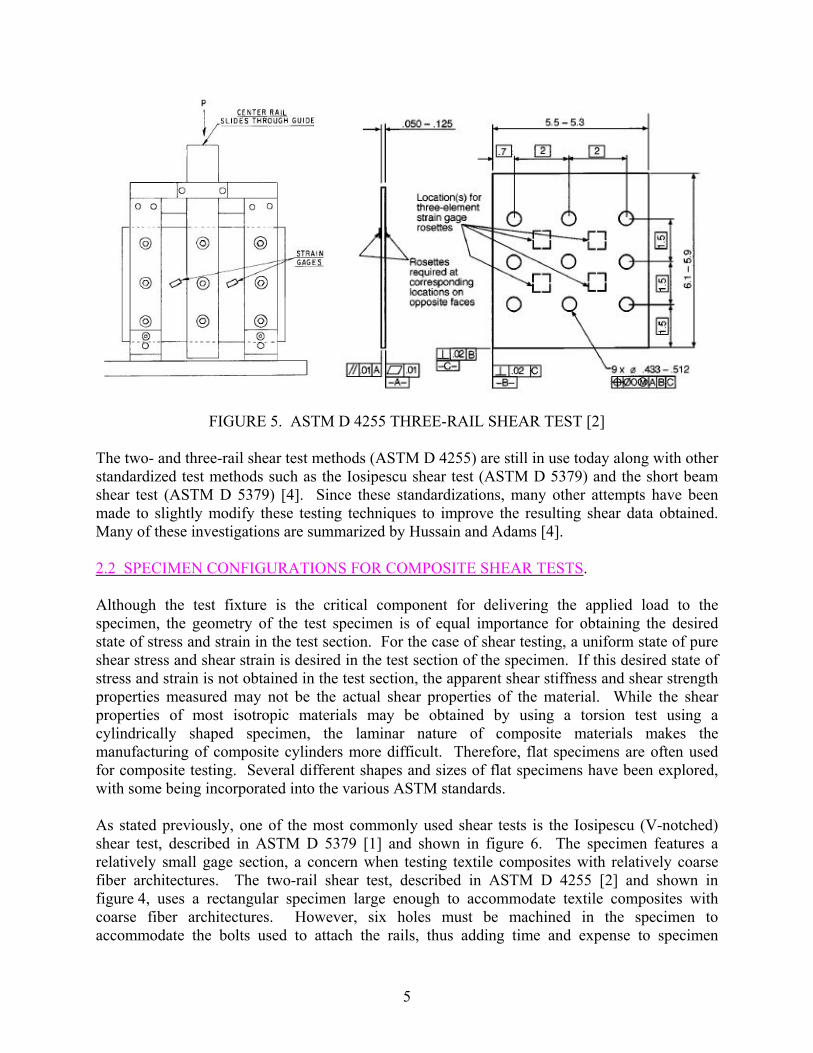
FIGURE 5. ASTM D 4255 THREE-RAIL SHEAR TEST [2] The two- and three-rail shear test methods (ASTM D 4255) are still in use today along with other standardized test methods such as the Iosipescu shear test (ASTM D 5379) and the short beam shear test (ASTM D 5379) [4]. Since these standardizations, many other attempts have been made to slightly modify these testing techniques to improve the resulting shear data obtained. Many of these investigations are summarized by Hussain and Adams [4]. 2.2 SPECIMEN CONFIGURATIONS FOR COMPOSITE SHEAR TESTS. Although the test fixture is the critical component for delivering the applied load to the specimen, the geometry of the test specimen is of equal importance for obtaining the desired state of stress and strain in the test section. For the case of shear testing, a uniform state of pure shear stress and shear strain is desired in the test section of the specimen. If this desired state of stress and strain is not obtained in the test section, the apparent shear stiffness and shear strength properties measured may not be the actual shear properties of the material. While the shear properties of most isotropic materials may be obtained by using a torsion test using a cylindrically shaped specimen, the laminar nature of composite materials makes the manufacturing of composite cylinders more difficult. Therefore, flat specimens are often used for composite testing. Several different shapes and sizes of flat specimens have been explored, with some being incorporated into the various ASTM standards. As stated previously, one of the most commonly used shear tests is the Iosipescu (V-notched) shear test, described in ASTM D 5379 [1] and shown in figure 6. The specimen features a relatively small gage section, a concern when testing textile composites with relatively coarse fiber architectures. The two-rail shear test, described in ASTM D 4255 [2] and shown in figure 4, uses a rectangular specimen large enough to accommodate textile composites with coarse fiber architectures. However, six holes must be machined in the specimen to accommodate the bolts used to attach the rails, thus adding time and expense to specimen
5

preparation. Additionally, stress concentrations produced in the specimen at the clamped rails and around the holes makes the determination of shear properties using this test method questionable [2].
FIGURE 6. IOSIPESCU (V-NOTCHED) SHEAR TEST FIXTURE AND SPECIMEN
Ifju [13 and 14] developed a compact, U-notched specimen and accompanying test fixture termed the compact shear test. The shear test fixture used to load the compact specimen applied load to the specimen through the top and bottom edges of the specimen, as shown in figure 7. This test method was first designed to test the shear modulus of thick-section, cross-ply composite specimens cut from composite cylinders. Although the fixture and specimen were subsequently modified, the basic features of the specimen geometry were found to be promising. The test fixture and specimen were smaller than those of the standard two-rail shear test, but larger than the Iosipescu shear test. The U-shaped notch was used to reduce the stress concentrations in orthotropic materials at the tip of a V-shaped notch such as in the Iosipescu specimen.
FIGURE 7. COMPACT SHEAR TEST FIXTURE AND SPECIMEN
6
Although test results using the compact shear test were promising, the state of shear stress and strain in the gage section of the specimen were found to be nonuniform between the U-notches. To compensate for these nonuniform states of stress, Ifju developed a shear strain gage designed to span the entire length of the test section of the compact shear specimen [14]. This shear strain gage, along with a shorter version designed to span the length of the test section of the Iosipescu specimen, were later commercialized by Vishay Measurements Group [15]. By spanning the entire distance from notch tip to notch tip, the strain gage obtained an average shear strain reading over the midline of the test section. This average value of shear strain was used with the average shear stress to obtain an accurate measurement of shear modulus for orthotropic composite materials. Hussain and Adams [3 and 4] addressed the gripping problem in the two-rail shear fixture, replacing the bolted rails with roughened rails that are clamped onto the specimen. By using a C-clamping arrangement, shown previously in figure 1, the six loading holes were eliminated from the test specimen, simplifying specimen preparation. With these modifications, the two-rail shear test became a more promising test method. In the present investigation, further modifications to the two-rail shear test method were investigated. With the modified two-rail shear test fixture of Hussain and Adams able to accommodate higher shear loading without having to drill holes in the specimen, the emphasis of the present study focused on obtaining a suitable test specimen configuration for measuring both the in-plane shear modulus and in-plane shear strength for multidirectional composite laminates and textile composites. Of particular interest was producing a uniform state of shear stress within the gage section and producing acceptable gage section failures away from the rail attachments. Both notched and tabbed specimen configurations were investigated using a combined experimental and numerical approach. 3. FINITE ELEMENT MODELING. 3.1 INTRODUCTION. The finite element method was used to investigate and compare candidate rail shear test specimen configurations. Finite element simulations of candidate shear test configurations predicted the state of stress and strain throughout the gage section of the various specimen configurations investigated. Contour maps of specific stress and strain components were investigated to identify specimen configurations, producing uniform states of shear stress and minimal normal (tensile and compressive) stresses in the specimen gage section. 3.2 ANALYSIS METHODOLOGY. All finite element modeling of the test fixture and specimen was performed using the software package ANSYS, version 6.0 [16]. Output data from the ANSYS finite element simulations were imported into Microsoft Excel where the stress and strain values were normalized. The normalized data was then imported into the postprocessing software package Surfer, version 7.0 [17] to produce contour plots of stress and strain.
7

The shear test fixture and the specimen were modeled in three dimensions with the specimen oriented in the x-y plane and the loading applied in the y direction, as shown in figure 8. Only one-half of the fixture and specimen were modeled due to the plane of symmetry existing along the mid-plane of the specimen/fixture (z = 0). The loading direction, or y direction, is referred to as the axial orientation for stresses and strains. The transverse direction (transverse to the applied load) is taken as the x direction. Following conventional notation, the 0º fiber orientation of the composite specimen is assumed to be oriented in the x direction. Therefore, a 0º specimen has fibers extending from one-half of the fixture to the other, perpendicular to the applied load.
FIGURE 8. ORIENTATION OF FINITE ELEMENT MODEL Eight-noded brick elements (SOLID45) were used in all finite element analyses. The number of elements used in each simulation was dependent on the specimen configuration being modeled, ranging from 8,052 to 66,686 elements. For each finite element simulation, a 11.12 kN (2500 lb.) load was applied to a point at the top of the fixture in the y direction. A point at the bottom of the test fixture was constrained in both the x direction and y direction, and the mid-plane of the specimen/fixture was constrained in the z direction to enforce symmetry. For each specimen configuration considered, four 16-ply carbon/epoxy composite laminates were modeled, as listed in table 1. Two of the laminates, [0]16 and [0/90]4S, were considered because of their use in characterizing the shear stiffness and shear strength of composite materials. Two additional laminates were considered containing ±45° plies and thus producing higher shear strengths. These included a quasi-isotropic [0/±45/90]2S laminate (50 percent ±45° plies) and a [±45]4S laminate (100 percent ±45° plies).
8

TABLE 1. CARBON/EPOXY LAMINATES MODELED
Laminate Percentage ±45° Plies [0]16 0%
[0/90]4S 0% [0/±45/90]2S 50%
[±45]4S 100% Material properties used in the finite element analyses are listed in table 2. Homogenized material properties for each of the laminates listed in table 1 were obtained using laminated plate theory. Note that AS4/3501-6 carbon/epoxy material properties were used in all analyses since this material was used for the majority of the experimental portion of this investigation.
TABLE 2. MATERIAL PROPERTIES USED IN FINITE ELEMENT ANALYSES
Material Properties
Application in Model Material
Ex GPa
(Msi)
Ey GPa
(Msi)
Ez GPa
(Msi)
Gxy GPa
(Msi)
Gyz GPa
(Msi)
Gxy GPa
(Msi) νxy νyz νxz
[±45]4S 21.03 (3.05)
21.03 (3.05)
9.65 (1.40)
36.61 (5.31)
4.83 (0.70)
4.83 (0.70) 0.73 0.08 0.08
[0/±45/90]2S 55.16 (8.00)
55.16 (8.00)
9.65 (1.40)
21.37 (3.10)
4.83 (0.70)
4.83 (0.70) 0.29 0.22 0.22
[0/90]4S 75.50 (10.95)
75.50 (10.95)
9.65 (1.40)
6.07 (0.88)
4.83 (0.70)
4.83 (0.70) 0.03 0.30 0.30
Specimen AS4/3501-6 carbon/epoxy
[0]16 141.34 (20.50)
9.17 (1.33)
9.17 (1.33)
6.07 (0.88)
3.59 (0.52)
6.07 (0.88) 0.25 0.29 0.25
Specimen Tabs G10 glass-fabric/epoxy 32.61
(4.73) 32.61 (4.73)
6.89 (1.00)
6.89 (1.00
4.14 (0.60)
4.14 (0.60) 0.08 0.06 0.06
Tabbing Adhesive Hysol 907 blue epoxy 1.10 (0.16) 41.37 (6.00) 0.34
Test Fixture Steel 206.84 (30.00) 77.91 (11.30) 0.33 3.3 SPECIMEN GEOMETRIES MODELED. Over 30 specimen geometries were analyzed throughout the course of this investigation. The process of identifying optimal specimen geometries resulted in several rounds of modifications based on results obtained for previous geometries. Therefore, the different specimen geometries considered are presented in chronological order. All specimens were modeled with a thickness of 2.0 mm (0.08 in.). Since only half of the specimen’s thickness was modeled due to symmetry, a half-thickness of 1.0 mm (0.04 in.) was used for all specimen geometries. 3.3.1 Original Rectangular and Trapezoidal Specimens. The two most promising specimens determined from the previous investigation by Hussain and Adams [3 and 4] were the rectangular- and trapezoidal-shaped specimens shown in figures 9 and 10, respectively. Thus, these two specimen geometries were the first configurations investigated
9

in the present study. The primary purpose of modeling these two specimen geometries was to provide a check on the modeling methodology used by comparing results obtained to those reported by Hussain and Adams [4].
FIGURE 9. INITIAL RECTANGULAR SPECIMEN INVESTIGATED
FIGURE 10. INITIAL TRAPEZOIDAL SPECIMEN INVESTIGATED
10

The dimensions of the rectangular specimen were modified slightly to fit the new test fixture constructed for initial testing. The height of the specimen was reduced from 152 mm (6.0 in.) to 114 mm (4.5 in.). Based on the results obtained by Hussain and Adams [4], this reduction in specimen height was not expected to adversely affect the performance of the specimen, but permitted a decrease in the number of clamping bolts needed to grip the specimen. The width of the gripping region was also reduced from 28.7 mm (1.13 in.) to 25.4 mm (1.00 in.), because this reduced gripping width was thought to be sufficient. This rectangular specimen, with these new dimensions, was named the original rectangular specimen, to denote that it was the initial specimen considered in this investigation. The trapezoidal specimen modeled, referred to as the original trapezoidal specimen, was similar to that investigated by Hussain and Adams [4]. However, the test section width was reduced from 25.4 mm (1.0 in.) to 19.1 mm (0.75 in.) to fit the new test fixture. 3.3.2 Tabbed Original Rectangular Specimen Geometries. In an effort to reduce the stress concentrations in the specimen adjacent to the gripping rails of the test fixture, glass-fabric/epoxy tabs were added to the gripping regions of the original rectangular specimen configuration shown in figure 9. These stress concentrations resulted from the pinching effect as the rails were clamped onto the specimen. All tabs were modeled as 1.59 mm (0.062 in.) thick. The adhesive used to bond the tabs to the surfaces of the specimen was modeled as 0.25 mm (0.010 in.) thick. The material properties used for the tabs and the adhesive are listed in table 2. Three tabbed specimen configurations were modeled, all with the same rectangular specimen dimensions shown in figure 9. The standard tab specimen consisted of untapered tabs that terminated at the end of the gripping region (i.e., the tabs did not extend into the test region), as shown in figure 11. The extended tab specimen and the tapered tab specimen both incorporated tabs that terminated 3.18 mm (0.125 in.) into the test section. The tabs in the extended tab specimen were untapered, as shown in figure 12. The portion of the tabs, extending into the gage section in the tapered tab specimen, were cut to a 27° angle with respect to the surface of the specimen, as shown in figure 13. The adhesive used to bond the tabs to the specimen was included in the model when all three tabbed specimen configurations were analyzed. Although adhesives do not necessarily exhibit linear-elastic stress-strain response, the adhesive was modeled as a linear-elastic material. 3.3.3 Original Rectangular Notched Specimens. 3.3.3.1 Original Rectangular V-Notched Specimens. Another method of increasing the shear stress in the test section relative to that in the gripping region is by decreasing the cross-sectional area of the test section. A series of V-notched specimen configurations were selected in an effort to produce shear failures through the center of the test section rather than at the edge of the gripping region where the specimen is clamped. An added advantage of reducing the cross-sectional area in the specimen test section is the reduction in applied load required to fail the test specimen. Since the gripping area in a V-notched
11

specimen configuration remains constant, a reduced failure load should correspond to a reduced clamping force required when testing the specimen.
FIGURE 11. STANDARD TAB SPECIMEN CONFIGURATION
FIGURE 12. EXTENDED TAB SPECIMEN CONFIGURATION
12

FIGURE 13. TAPERED TAB SPECIMEN CONFIGURATION The original rectangular V-notched specimen configurations, shown in figure 14, were based on the dimensions of the original rectangular specimen shown in figure 9. Four different notch depths were investigated: 6.35 mm (0.25 in.), 12.7 mm (0.50 in.), 25.4 mm (1.0 in.), and 38.1 mm (1.5 in.). For all notch depths, the width of the notch was 12.7 mm (0.50 in.). 3.3.3.2 Original Rectangular U-Notched Specimens. One concern associated with the V-notched specimen is the possibility of stress concentrations at the tips of the 90º notches. As an alternative notch geometry, a U-notched configuration, based on the original rectangular specimen configuration, was proposed for investigation (figure 15). As in the case of the original rectangular V-notched configuration, the overall specimen dimensions were the same as for the original rectangular specimen and four notch depths were investigated: 6.35 mm (0.25 in.), 12.7 mm (0.50 in.), 25.4 mm (1.0 in.), and 38.1 mm (1.5 in.). For all notch depths investigated, the width of the notch remained at 12.7 mm (0.5 in.). The radius of the bottom of the U-notch was 6.35 mm (0.25 in.), producing a semicircular notch bottom.
13

FIGURE 14. V-NOTCHED SPECIMEN DIMENSIONS
FIGURE 15. U-NOTCHED SPECIMEN DIMENSIONS
14

3.3.4 Modified Rectangular V-Notched Specimen. Encouraged by the results for the original rectangular V-notched specimen described in section 3.3.3.1, other V-notched specimen geometries were investigated. This additional series of specimen geometries was inspired by the V-notch geometry of the Iosipescu shear specimen. The Iosipescu specimen uses opposing 90º notches, each of which is 0.20 times the total height of the specimen. In the present investigation, the ratio of notch depth to the total specimen height is referred to as the Notch Depth Ratio (NDR). For this series of V-notched specimens, the overall specimen dimensions were changed from the original 69.9 mm (2.75 in.) by 114 mm (4.50 in.) rectangular specimen dimensions used in sections 3.3.1 through 3.3.3. The overall specimen width was increased to 76.2 mm (3.00 in.). The width of the gripping regions remained at 25.4 mm (1.00 in.), but the test section width was increased from 19.1 mm (0.75 in.) to 25.4 mm (1.00 in.), as shown in figure 16. The depth of the 90º V-notches, d, was selected as 12.7 mm (0.50 in.) such that the notch width extended completely across the 25.4 mm (1.00 in.) test section.
FIGURE 16. MODIFIED RECTANGULAR V-NOTCHED SPECIMEN GEOMETRY FOR
NDR INVESTIGATION 3.3.4.1 Effects of NDR for Modified Rectangular V-Notched Specimen. With the specimen width and notch depth held constant, the NDR was varied by changing the specimen height, h. As shown in table 3, a total of six NDR values were modeled, ranging from 0.150 to 0.300. The resulting values of specimen heights ranged from 84.6 mm (3.33 in.) to 42.4 mm (1.67 in.).
15

TABLE 3. SPECIMEN HEIGHT FOR VARIOUS MODIFIED RECTANGULAR V-NOTCHED NDR
NDR Specimen Height, h
mm (in.) 0.150 84.6 (3.33) 0.175 72.6 (2.86) 0.200 63.5 (2.50) 0.225 56.4 (2.22) 0.250 50.8 (2.00) 0.300 42.4 (1.67)
3.3.4.2 Effects of Notch Angle for Modified Rectangular V-Notched Specimen. A series of finite element simulations were performed to investigate the effects of varying notch angle. For this notch angle investigation, the NDR was held at 0.225, producing a specimen height of 56.4 mm (2.22 in.). A total of three different notch angles were investigated: 70°, 90°, and 110°. Two methods were used to keep the NDR constant while the notch angle was varied. For the first method, referred to as the variable width method, the test section width was adjusted so that the notches spanned the entire width between the grips, as shown in figure 17. Using this approach, the test section widths for the 70° and 110° notch angles were 17.8 mm (0.70 in.) and 36.3 mm (1.43 in.), respectively, making the overall widths 68.9 mm (2.70 in.) and 87.1 mm (3.43 in.), respectively. In the second method, referred to as the constant width method, the width of the test section was held constant at 25.4 mm (1.0 in.), as shown in figure 18. Consequently, the 70° notch fell short of spanning the entire test section width by approximately 3.8 mm (0.15 in.) on either side while the 110° notch extended approximately 5.3 mm (0.21 in.) into the gripping region on either side of the test section.
FIGURE 17. (a) 70° AND (b) 110° NOTCH ANGLES MODELED USING VARIABLE
WIDTH METHOD
16

FIGURE 18. (a) 70° AND (b) 110° NOTCH ANGLES MODELED USING CONSTANT WIDTH METHOD
3.3.4.3 Effects of Notch Tip Radius for Modified Rectangular V-Notched Specimen. In an effort to reduce the stress concentrations observed in the vicinity of the notch tips, finite element simulations were performed on models with two different notch tip radii: 1.3 mm (0.05 in.) and 0.64 mm (0.025 in.). The dimensions associated with these models are shown in figure 19. Note that rounding the notch tips results in a reduction in the total notch depth compared to a sharp V-notch. Therefore, to keep the NDR constant, the overall height of the specimen was adjusted accordingly.
FIGURE 19. ROUNDED V-NOTCHED SPECIMEN DIMENSIONS 3.3.5 Modified Rectangular U-Notched Specimen. Concerns of stress concentrations at the V-notch tips led to further investigations of the U-notched configurations. The modified rectangular U-notched specimen investigated retained the same 76.2 mm (3.0 in.) by 56.4 mm (2.22 in.) overall dimensions as the modified rectangular V-notched specimen, but featured constant width slots with semicircular ends, as shown in
17
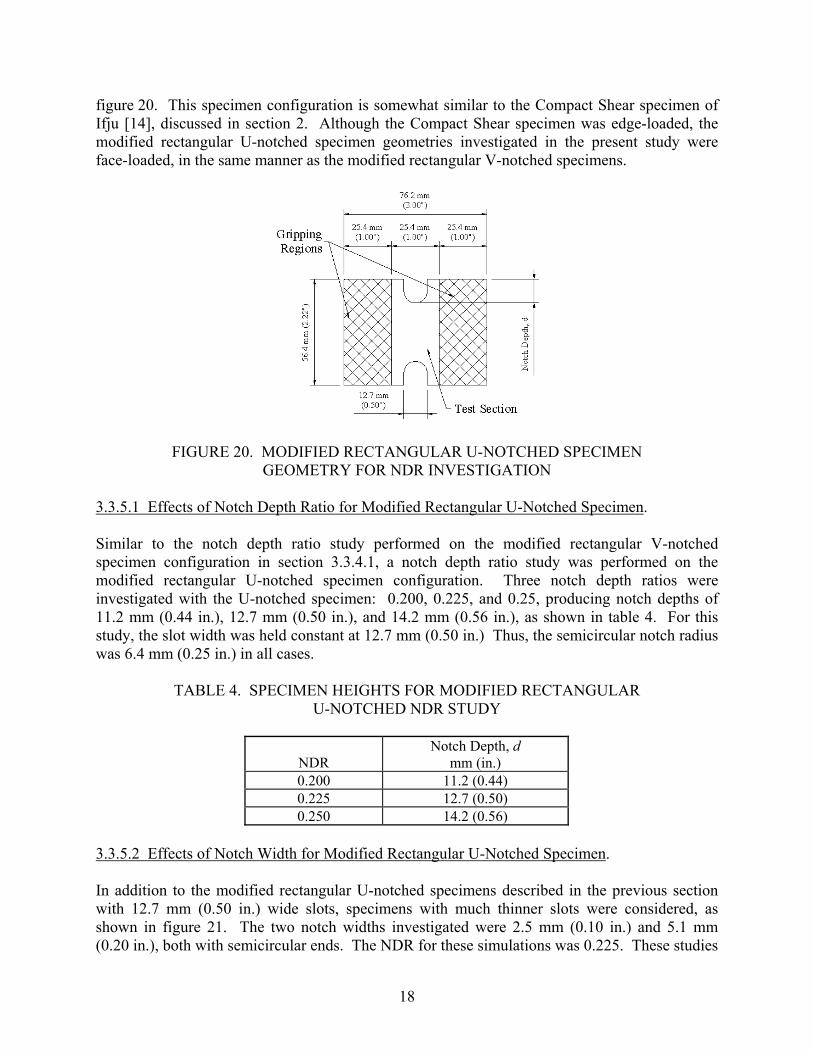
figure 20. This specimen configuration is somewhat similar to the Compact Shear specimen of Ifju [14], discussed in section 2. Although the Compact Shear specimen was edge-loaded, the modified rectangular U-notched specimen geometries investigated in the present study were face-loaded, in the same manner as the modified rectangular V-notched specimens.
FIGURE 20. MODIFIED RECTANGULAR U-NOTCHED SPECIMEN GEOMETRY FOR NDR INVESTIGATION
3.3.5.1 Effects of Notch Depth Ratio for Modified Rectangular U-Notched Specimen. Similar to the notch depth ratio study performed on the modified rectangular V-notched specimen configuration in section 3.3.4.1, a notch depth ratio study was performed on the modified rectangular U-notched specimen configuration. Three notch depth ratios were investigated with the U-notched specimen: 0.200, 0.225, and 0.25, producing notch depths of 11.2 mm (0.44 in.), 12.7 mm (0.50 in.), and 14.2 mm (0.56 in.), as shown in table 4. For this study, the slot width was held constant at 12.7 mm (0.50 in.) Thus, the semicircular notch radius was 6.4 mm (0.25 in.) in all cases.
TABLE 4. SPECIMEN HEIGHTS FOR MODIFIED RECTANGULAR U-NOTCHED NDR STUDY
NDR Notch Depth, d
mm (in.) 0.200 11.2 (0.44) 0.225 12.7 (0.50) 0.250 14.2 (0.56)
3.3.5.2 Effects of Notch Width for Modified Rectangular U-Notched Specimen. In addition to the modified rectangular U-notched specimens described in the previous section with 12.7 mm (0.50 in.) wide slots, specimens with much thinner slots were considered, as shown in figure 21. The two notch widths investigated were 2.5 mm (0.10 in.) and 5.1 mm (0.20 in.), both with semicircular ends. The NDR for these simulations was 0.225. These studies
18

were performed to determine whether the stress state in the gage section was sensitive to the width of the U-shaped notches.
FIGURE 21. MODIFIED RECTANGULAR U-NOTCHED SPECIMEN
GEOMETRIES FOR NOTCH WIDTH INVESTIGATION 3.4 TEST FIXTURE GEOMETRY. The fixture simulated in the finite element models was the rail shear fixture used for the initial shear testing of the specimens analyzed. The design of the shear test fixture was based on the previous design and recommendations from the University of Wyoming by Hussain and Adams [3 and 4]. This test fixture, shown in figure 22, consisted of two loading rails, each incorporating five pairs of opposing bolts. These bolts apply forces to the gripping plates, which in turn apply a uniform pressure to the faces of the specimen. This test fixture is capable of testing specimens with a height of up to 127 mm (5.0 in.) and a total specimen width of 63.5 to 76.2 mm (2.5 to 3 in.).
FIGURE 22. ACTUAL TEST FIXTURE DIMENSIONS
19

To simplify the finite element simulation, the bolts were excluded and the specimen was assumed to be perfectly bonded to the fixture. Early laboratory testing with the actual fixture indicated that minimal slipping was occurring between the specimen and gripping plates, supporting this assumption. The dimensions of the simulated fixture rails are shown in figure 23.
FIGURE 23. SIMULATED TEST FIXTURE DIMENSIONS 4. FINITE ELEMENT RESULTS. 4.1 INTRODUCTION. For each finite element simulation performed, values of axial, transverse, and shear components of stress and strain were output at each node within the specimen test section. These quantities were normalized and plotted as contour maps that were used to identify optimal specimen configurations. As described in the previous section, homogenized, orthotropic material properties were used for all laminates analyzed. Thus, stresses obtained from the finite element simulations and plotted as contour maps in this section represent the average through-the-thickness stresses for the laminate as opposed to individual ply stresses. A total of four carbon/epoxy laminates were investigated for each specimen configuration: [0]16, [0/90]4S, [0/±45/90]2S, and [±45]4S. The goal of the finite element simulations was to investigate the state of stress present in the various specimen configurations and to select candidate specimen configurations for experimental study. The desired stress state was a uniform distribution of shear stress and minimal magnitudes of axial and transverse normal stresses within the test section. The quality of the shear stress state was important for the determination of both shear strength and shear modulus. For measuring shear strength, it was desirable to minimize stress concentrations such
20

that the specimen failed in the central region of the test section under a state of uniform shear stress. Since the shear strength τult was calculated using the maximum applied shear load Pmax transmitted in shear through the test section and the cross-sectional area A of the test section
τult = Pmax /A (1) a constant value of shear stress was desired through the test section. For determining the shear modulus, the shear strain recorded in the central region of the test section was used in conjunction with the average shear stress, according to the relation G = ∆τave /∆ γave (2)
where ∆ is the change in the quantity over the desired data range. Note that the average shear stress τave is calculated from the applied load Papp and the cross-sectional area A of the test section τave = Papp /A (3)
Since the average shear stress was used in the shear modulus calculation, the average shear strain
γave must also be used. Thus, the state of shear strain at the location where the shear strain was measured must be equal to the average shear strain, γave, across the centerline of the test section to obtain the correct shear modulus, G. 4.2 DATA PROCESSING. For each laminate modeled, the three in-plane components of stress and strain (axial, transverse, and shear) were imported into Microsoft Excel for postprocessing. To simulate the use of strain gages, only data corresponding to the nodes at the surface of the test section were used for contour plotting. All stresses and strains were nondimensionalized prior to generating contour plots. Nodal stresses (axial, transverse, and shear components) were divided by the average shear stress along the test section centerline. Thus, for the ideal state of uniform shear stress and no normal stresses, the nondimensionalized shear stresses would be 1.0 and the nondimensionalized axial and transverse stresses would be 0.0 throughout the specimen test section. In a similar manner, the nodal strains were nondimensionalized using the average shear strain along the test section centerline. 4.3 ORIGINAL RECTANGULAR AND TRAPEZOIDAL SPECIMEN CONFIGURATIONS. As described previously, the two most promising specimen configurations identified by Hussain and Adams [4] were rectangular and trapezoidal. These two specimen configurations, shown in figures 9 and 10, were modeled, and the results obtained were compared to those of Hussain and Adams.
21

4.3.1 Shear Stresses for Original Rectangular and Trapezoidal Specimen Configurations. Nondimensionalized shear stress contour plots for the rectangular and trapezoidal specimens are shown in figures 24 and 25, respectively. Contour plots are shown for each of the four carbon/epoxy laminates investigated: [0]16, [0/90]4S, [0/±45/90]2S, and [±45]4S.
-0.4625-0.3125-0.1625-0.01250.13750.28750.43750.58750.73750.88751.03751.18751.33751.48751.63751.78751.93752.08752.23752.3875
[0]16 [0/90]4S [0/±45/90]2S [±45]4S
FIGURE 24. SHEAR STRESS DISTRIBUTIONS FOR THE ORIGINAL RECTANGULAR SPECIMEN (Normalized)
-0.4625-0.3125-0.1625-0.01250.13750.28750.43750.58750.73750.88751.03751.18751.33751.48751.63751.78751.93752.08752.23752.3875
[0]16 [0/90]4S [0/±45/90]2S [±45]4S
FIGURE 25. SHEAR STRESS DISTRIBUTIONS FOR THE ORIGINAL TRAPEZOIDAL SPECIMEN (Normalized)
22

Shear stress distributions for the original rectangular specimen (figure 24) showed considerable variation among the four laminates. The test section of the [0]16 laminate exhibited the most desirable shear stress distribution, with a majority of the test section exhibiting a shear stress within ±4 percent of the average centerline value. Note, however, that higher shear stresses were predicted at the edges of the specimen test section (adjacent to the grips), indicating a stress concentration due to the specimen gripping. Additionally, lower shear stresses were predicted at the top and bottom of the test section. The [0/90]4S laminate exhibited the same characteristics as the [0]16 laminate, but with a slightly less uniform shear stress distribution. As the percentage of ±45° plies increases from the [0]16 and [0/90]4S laminates (both with 0% ±45° plies) to the [0/±45/90]2S and [±45]4S laminates (with 50 percent and 100 percent ±45° plies, respectively), the shear stresses in the central region of the test section increased whereas the shear stresses towards the top and bottom of the gage section further decreased. This decrease in the uniformity of the shear stress is undesirable, making the accurate determination of shear strength and shear modulus more difficult. Shear stress distributions for the original trapezoidal specimen are shown in figure 25. For this configuration, the test section of the [0/90]4S laminate exhibited a more uniform and desirable state of shear stress than the [0]16 laminate. As the percentage of ±45° plies increased to 50 percent ([0/±45/90]2S laminate) and 100 percent ([±45]4S laminate), the shear stress distribution became less uniform. The stress concentrations adjacent to the grips are shown to vary considerably along the edge of the test section, with the highest shear stresses occurring at the innermost corner of the trapezoidal-shaped test section. A comparison of the shear stress results obtained for the original rectangular and trapezoidal specimens showed that the highest shear stress concentrations occurred in the trapezoidal specimen configuration for all four laminates. This result suggested that premature failure adjacent to the gripping region would be a greater problem with the original trapezoidal specimen than the original rectangular specimen. For the [0]16 laminate, the state of shear stress was most favorable in the original rectangular specimen, whereas for the [0/90]4S laminate, the original trapezoidal specimen exhibited the most favorable shear stress state. For the [0/±45/90]2S and [±45]4S laminates, both the original rectangular and trapezoidal specimens had shear stresses (and therefore shear strains) in the center of the test section, which vary more than ±11 percent from the average shear strain. These results for the original rectangular and trapezoidal specimen configurations were found to be in good agreement with results obtained by Hussain and Adams [4]. 4.3.2 Normal Stresses for Original Rectangular and Trapezoidal Specimen Configurations. Nondimensionalized contour plots of the axial and transverse stresses produced in the rectangular specimen are shown in figures 26 and 27. Contour plots are shown for each of the four carbon/epoxy laminates investigated: [0]16, [0/90]4S, [0/±45/90]2S, and [±45]4S. Axial stress distributions for the rectangular specimen (figure 26) showed that the [0]16 laminate exhibited the lowest magnitudes of axial stress. The [0/90]4S laminate exhibited the largest tensile stresses in the central region of the test section whereas the [±45]4S laminate exhibited the largest compressive stresses. In both cases, the magnitude of the axial stresses in the central region of the test section were less than 20 percent of the average shear stress. Significantly higher
23

magnitudes of axial stress (greater than 100 percent of the average shear stress) occurred in the corner regions of the test section for the [0/±45/90]2S and [±45]4S laminates. The peak axial tensile stress would exceed 380 MPa (56.2 ksi) and 490 MPa (71.4 ksi) for the [0/±45/90]2S and [±45]4S laminates, respectively, at load levels where the average shear stress equals the experimentally determined shear strengths presented in section 6 (387 MPa (56.2 ksi) and 492 MPa (71.4 ksi) for the [0/±45/90]2S and [±45]4S laminates, respectively). With calculated tensile strengths of 800 MPa (116 ksi) for the [0/±45/90]2S laminate and 249 MPa (36.1 ksi) for the [±45]4S laminate [18], the tensile stresses in the gage section of the [0/±45/90]2S laminate would be roughly one-half of the corresponding laminate tensile strength, whereas the tensile stresses in the [±45]4S laminate were twice the magnitude of the allowable axial tensile strength. Thus, the magnitudes of axial tensile stresses predicted in the gage section of the [±45]4S laminate were believed to be of sufficient magnitude to affect the failure loads and, thus, the measured shear strengths.
-1.4625-1.3125-1.1625-1.0125-0.8625-0.7125-0.5625-0.4125-0.2625-0.11250.03750.18750.33750.48750.63750.78750.93751.08751.23751.3875
[0]16 [0/90]4S [0/±45/90]2S [±45]4S
FIGURE 26. AXIAL STRESSES FOR ORIGINAL RECTANGULAR SPECIMEN
(Normalized) Transverse normal stress distributions for the original rectangular specimen are shown in figure 27. For all four laminates investigated, the transverse normal stresses in the central region of the gage section were compressive, with magnitudes greater than 30 percent of the average shear stress. The highest magnitudes of transverse normal compressive stress in the central region were observed in the [0]16 laminate, where the peak magnitudes were greater than 50 percent of the average shear stress. For this laminate, the peak transverse compressive stress would exceed 40 MPa (5.8 ksi) when the average shear stress equals the experimentally determined shear strength of 81.0 MPa (11.8 ksi) as presented in section 6. However, this compressive stress is less than 16 percent of the corresponding transverse compressive strength of a [0]16 laminate (259 MPa, 37.5 ksi) [18] and, therefore, is not considered to be of sufficient magnitude to produce significant reductions in the measured shear strength.
24

-1.4625-1.3125-1.1625-1.0125-0.8625-0.7125-0.5625-0.4125-0.2625-0.11250.03750.18750.33750.48750.63750.78750.93751.08751.23751.3875
[0]16 [0/90]4S [0/±45/90]2S [±45]4S
FIGURE 27. TRANSVERSE STRESSES FOR ORIGINAL RECTANGULAR SPECIMEN (Normalized)
For all four laminates, the transverse tensile stress concentrations were greater than 100 percent of the average shear stress in the corner regions of the test section. Thus, the peak transverse tensile stresses would be greater than the experimentally determined shear strengths (section 6) of the laminate at failure: 81.0 MPa (11.8 ksi), 119 MPa (17.3 ksi), 387 MPa (56.2 ksi), and 492 MPa (71.4 ksi) for the [0]16, [0/90]4S, [0/±45/90]2S, and [±45]4S laminates, respectively. For the [0]16, [0/90]4S, and [0/±45/90]2S laminates, these stresses were well below the calculated transverse strengths of 2.16 GPa (314 ksi), 1.09 GPa (158 ksi), and 800 MPa (116 ksi), respectively [18]. On the other hand, the transverse tensile stress concentrations in the [±45]4S laminate would exceed the calculated transverse strength of 249 MPa (36.1 ksi), potentially causing premature specimen failure. Axial and transverse normal stress distributions for the original trapezoidal specimen are shown in figures 28 and 29. Similar to the rectangular specimen, the highest magnitudes of the axial stress within the central region were produced in the [0/90]4S and [±45]4S laminates. High magnitudes of axial tensile stress were observed in the corner regions of the test section for all four laminates. When comparing these stresses to the corresponding axial strength at shear failure of the laminate, the axial tensile stresses were significant in both the [±45]4S and [0]16 laminates. The axial stress concentrations in the [0]16 laminate (81.0 MPa, 11.8 ksi) exceeded the axial strength of 53.8 MPa (7.8 ksi) [18]. In contrast, axial stress concentrations in the [0/90]4S laminate were well below the axial tensile strength of 1080 MPa (156 ksi) [18].
25

-1.4625-1.3125-1.1625-1.0125-0.8625-0.7125-0.5625-0.4125-0.2625-0.11250.03750.18750.33750.48750.63750.78750.93751.08751.23751.3875
[0]16 [0/90]4S [0/±45/90]2S [±45]4S
FIGURE 28. AXIAL STRESSES FOR ORIGINAL TRAPEZOIDAL SPECIMEN
(Normalized)
-1.4625-1.3125-1.1625-1.0125-0.8625-0.7125-0.5625-0.4125-0.2625-0.11250.03750.18750.33750.48750.63750.78750.93751.08751.23751.3875
[0]16 [0/90]4S [0/±45/90]2S [±45]4S
FIGURE 29. TRANSVERSE STRESSES FOR ORIGINAL TRAPEZOIDAL SPECIMEN
(Normalized)
26

The distributions of transverse normal stress were also very similar to those observed in the original rectangular specimen. As shown in figure 29, all four laminates exhibited relatively large transverse stresses (in comparison with the average shear stress) throughout the middle of the gage section. The largest transverse stress concentrations occurred at the innermost corners of the trapezoidal-shaped test section. The greatest magnitudes of transverse stress occurred in the [0]16 laminate. As was the case with the original rectangular specimen configuration, these transverse stress concentrations could cause premature transverse tensile failure in the [0]16 laminate before the true shear strength is reached. 4.3.3 Concepts for Reducing Axial and Transverse Normal Stresses. Two concepts were investigated for reducing the magnitudes of axial and transverse normal stresses in the specimen test sections. For these investigations, the original rectangular specimen configuration was chosen. The first concept focused on the elimination of rotations of the test fixture halves. If the two fixture halves were to rotate in the same direction and at the same rate while a tensile load is being applied, the rotation would not be expected to have a significant effect on the transverse and axial normal stresses. However, experimental measurements determined that the left rail rotated clockwise while the right rail rotated counterclockwise. These rotations tended to decrease the distance between the tops of the rails and increase the distance between the bottoms of the rails. Such deformations, believed to produce the transverse normal stresses in the gage section, could be eliminated if both fixture halves were prevented from displacing in the transverse direction. Although difficult to achieve experimentally, this no rotation constraint was incorporated easily in the finite element simulations by preventing the outer edges of the two fixture halves from displacing in the x direction. Thus, only vertical displacements were permitted in the fixture halves, and the distance between the fixture halves (test section width) was held constant. The second concept was to constrain the two halves of the test fixture using connecting members, as shown in figure 30. Together with the two fixture halves, the assembly becomes a four-bar linkage. Unlike the first concept investigated, this four-bar linkage did not limit rotations of the entire fixture, but constrained the relative movements of the two halves of the test fixture. Stress contour results from the finite element analyses of the four-bar linkage and no rotation constraint for the [0/±45/90]2S laminate are shown in figures 31 through 33. Only the [0/±45/90]2S laminate is shown since the other three laminates showed similar trends. In summary, the axial stress distribution (figure 31) in the test section was not affected significantly by either of the constraint concepts. However, the magnitudes of transverse normal stresses (figure 32) were reduced in both concepts relative to the unconstrained fixture. Shear stress concentrations (figure 33) near the edges of the test section were not reduced significantly by either method of constraint. Based on these findings, the four-bar linkage concept was investigated experimentally. However, this four-bar linkage concept was later dropped when other specimen geometries were determined to have reduced magnitudes of transverse normal stress without the four-bar linkage constraint. As discussed previously, the shear stress concentrations were the smaller in the rectangular specimen than the trapezoidal specimen. Thus, further concepts to reduce the shear stress
27

concentrations were pursued using the original rectangular specimen configuration, and the original trapezoidal specimen configuration was not considered further.
FIGURE 30. CONNECTING MEMBERS PRODUCING A FOUR-BAR LINKAGE
-1.4625-1.3125-1.1625-1.0125-0.8625-0.7125-0.5625-0.4125-0.2625-0.11250.03750.18750.33750.48750.63750.78750.93751.08751.23751.3875
No Constraints No Rotation Constraint Four-Bar Linkage
FIGURE 31. EFFECT OF CONSTRAINT CONCEPTS ON AXIAL STRESSES FOR [0/±45/90]2S RECTANGULAR SPECIMEN (Normalized)
28

-1.4625-1.3125-1.1625-1.0125-0.8625-0.7125-0.5625-0.4125-0.2625-0.11250.03750.18750.33750.48750.63750.78750.93751.08751.23751.3875
No Constraints No Rotation Constraint Four-Bar Linkage
FIGURE 32. EFFECT OF CONSTRAINT CONCEPTS ON TRANSVERSE STRESSES FOR [0/±45/90]2S RECTANGULAR SPECIMEN (Normalized)
-0.4625-0.3125-0.1625-0.01250.13750.28750.43750.58750.73750.88751.03751.18751.33751.48751.63751.78751.93752.08752.23752.3875
No Constraints No Rotation Constraint Four-Bar Linkage
FIGURE 33. EFFECT OF CONSTRAINT CONCEPTS ON SHEAR STRESSES FOR [0/±45/90]2S RECTANGULAR SPECIMEN (Normalized)
29

4.4 TABBED ORIGINAL RECTANGULAR SPECIMEN CONFIGURATIONS. One concept for reducing the shear stress concentrations adjacent to the gripping rails of the test fixture was the use of specimen tabs. As described in section 3.3.2, three different tabbed specimen configurations were considered, differing in the geometry of the tab termination adjacent to the specimen test section. The tabs in the standard tab specimen terminated at the end of the gripping region (figure 11), and the extended tab and tapered tab specimens both incorporated tabs that extended 3.18 mm (0.125 in.) into the test section. The tabs in the standard tab and extended tab specimens (figure 12) were untapered and the portion of the tabs extending into the gage section in the tapered tab specimen (figure 13) were cut at a 27° taper angle. 4.4.1 Shear Stresses for Standard Tab, Extended Tab, and Tapered Tab Specimen Configurations. Figure 34 shows the shear stress distributions for the standard tab specimen. Although some stress concentrations were still present along the edges of the test section (especially for the [0/±45/90]2S and [±45]4S laminates), a noticeable improvement was observed for all four tabbed rectangular laminates in comparison with the untabbed original rectangular specimen. For example, the standard tab [±45]4S specimen contained peak shear stresses that were only about 34 percent higher than the average value along the edges of the test section, whereas the peak shear stresses in the original rectangular [±45]4S specimen were at least 64 percent higher than the average shear stress. These reductions in shear stress concentrations along the edges of the test section were considered significant, decreasing the tendency for specimens to fail prematurely at these locations.
-0.4625-0.3125-0.1625-0.01250.13750.28750.43750.58750.73750.88751.03751.18751.33751.48751.63751.78751.93752.08752.23752.3875
[0]16 [0/90]4S [0/±45/90]2S [±45]4S
FIGURE 34. SHEAR STRESS DISTRIBUTIONS FOR THE STANDARD TAB SPECIMEN
(Normalized)
30

Figure 35 shows the shear stress distributions when using the extended tab specimen. Comparing these results with those from the standard tab specimen (figure 34) showed that extending the tabs into the test section failed to further reduce the shear stress concentrations along the edges of the test section. However, the decrease in the effective gage width did reduce the higher-than-average shear stresses throughout the middle of the gage section for all four laminates.
-0.4625-0.3125-0.1625-0.01250.13750.28750.43750.58750.73750.88751.03751.18751.33751.48751.63751.78751.93752.08752.23752.3875
[0]16 [0/90]4S [0/±45/90]2S [±45]4S
FIGURE 35. SHEAR STRESS DISTRIBUTIONS FOR THE EXTENDED TAB SPECIMEN (Normalized)
The shear stress distributions for the tapered tab specimen are shown in figure 36. Although some differences were apparent between the extended tab and the tapered tab specimens, little improvement was visible in the overall shear stress distributions and stress concentrations.
-0.4625-0.3125-0.1625-0.01250.13750.28750.43750.58750.73750.88751.03751.18751.33751.48751.63751.78751.93752.08752.23752.3875
[0]16 [0/90]4S [0/±45/90]2S [±45]4S
FIGURE 36. SHEAR STRESS DISTRIBUTIONS FOR THE TAPERED TAB SPECIMEN (Normalized)
31

4.4.2 Axial and Transverse Normal Stresses for Standard Tab, Extended Tab, and Tapered Tab Specimen Configurations. Axial and transverse normal stress distributions for the three tabbed specimen configurations are presented in figures 37 through 42. All three tabbed specimen configurations showed that the addition of tabs reduces the axial and transverse normal stresses within the test section of the rectangular specimen. Although slight differences in normal stress distributions are apparent, neither the extended tab nor the tapered tab configurations are a significant improvement over the standard tab specimen.
-1.4625-1.3125-1.1625-1.0125-0.8625-0.7125-0.5625-0.4125-0.2625-0.11250.03750.18750.33750.48750.63750.78750.93751.08751.23751.3875
[0]16 [0/90]4S [0/±45/90]2S [±45]4S
FIGURE 37. AXIAL NORMAL STRESS DISTRIBUTIONS FOR THE STANDARD TAB
SPECIMENS (Normalized)
-1.4625-1.3125-1.1625-1.0125-0.8625-0.7125-0.5625-0.4125-0.2625-0.11250.03750.18750.33750.48750.63750.78750.93751.08751.23751.3875
[0]16 [0/90]4S [0/±45/90]2S [±45]4S
FIGURE 38. TRANSVERSE NORMAL STRESS DISTRIBUTIONS FOR THE STANDARD TAB SPECIMENS (Normalized)
32

-1.4625-1.3125-1.1625-1.0125-0.8625-0.7125-0.5625-0.4125-0.2625-0.11250.03750.18750.33750.48750.63750.78750.93751.08751.23751.3875
[0]16 [0/90]4S [0/±45/90]2S [±45]4S
FIGURE 39. AXIAL NORMAL STRESS DISTRIBUTIONS FOR THE EXTENDED TAB SPECIMENS (Normalized)
-1.4625-1.3125-1.1625-1.0125-0.8625-0.7125-0.5625-0.4125-0.2625-0.11250.03750.18750.33750.48750.63750.78750.93751.08751.23751.3875
[0]16 [0/90]4S [0/±45/90]2S [±45]4S FIGURE 40. TRANSVERSE NORMAL STRESS DISTRIBUTIONS FOR THE EXTENDED
TAB SPECIMENS (Normalized)
33

-1.4625-1.3125-1.1625-1.0125-0.8625-0.7125-0.5625-0.4125-0.2625-0.11250.03750.18750.33750.48750.63750.78750.93751.08751.23751.3875
[0]16 [0/90]4S [0/±45/90]2S [±45]4S
FIGURE 41. AXIAL NORMAL STRESS DISTRIBUTIONS FOR THE TAPERED TAB SPECIMENS (Normalized)
-1.4625-1.3125-1.1625-1.0125-0.8625-0.7125-0.5625-0.4125-0.2625-0.11250.03750.18750.33750.48750.63750.78750.93751.08751.23751.3875
[0]16 [0/90]4S [0/±45/90]2S [±45]4S
FIGURE 42. TRANSVERSE NORMAL STRESS DISTRIBUTIONS FOR THE TAPERED TAB SPECIMENS (Normalized)
4.5 ORIGINAL RECTANGULAR NOTCHED SPECIMEN CONFIGURATIONS. Notching of the test section was investigated as another concept for increasing the magnitude of the shear stress in the central region of the test section relative to that in the gripping region and
34

for improving the uniformity of the shear stress distribution in the test section. Two different notching configurations were investigated, V-notches and U-notches. Each of these notch configurations is discussed in the following sections. 4.5.1 Original Rectangular V-Notched Specimen Configurations. As mentioned previously, the V-notched Iosipescu shear test specimen prompted the incorporation of 90° V-notches into the original rectangular specimen configuration. Notching was pursued to produce test section failures through the reduced cross-sectional area between the notches. Additionally, a decreased cross-sectional area would require less applied force in attaining the shear strength of the laminate, which is beneficial for specimen gripping. The initial notching concept featured opposing 90° V-notches cut into the original 69.9- by 114-mm (2.75- by 4.5-in.) rectangular specimen, as shown in figure 14. Although the width of the notch remained constant at 12.7 mm (0.50 in.), the notch depths were varied between 6.4 mm (0.25 in.) and 38.1 mm (1.50 in.). 4.5.1.1 Shear Stresses for Original Rectangular V-Notched Specimen Configurations. Shear stress distributions in the [0/±45/90]2S laminate are shown in figure 43 for four different notch depths. The below-average shear stress magnitudes at the top and bottom of the original rectangular gage section were replaced with above-average shear stress concentrations near the notch tips for all four notch depths. The magnitudes of the notch tip stress concentrations, however, were closer to the average shear stress than those at the top and bottom of the original rectangular specimens. Reductions in the shear stress concentrations at the edges of the test section became significant for the greater notch depths. Although only the [0/±45/90]2S laminate is shown in figure 43, similar trends were observed for the other three laminates investigated.
-0.4625-0.3125-0.1625-0.01250.13750.28750.43750.58750.73750.88751.03751.18751.33751.48751.63751.78751.93752.08752.23752.3875
0.25-in. Depth 0.5-in. Depth 1.0-in. Depth 1.5-in. Depth
FIGURE 43. SHEAR STRESS DISTRIBUTIONS FOR THE [0/±45/90]2S ORIGINAL RECTANGULAR V-NOTCHED SPECIMEN CONFIGURATIONS (Normalized)
35

4.5.1.2 Axial and Transverse Normal Stresses for the Original Rectangular V-Notched Specimen. Axial and transverse normal stress distributions in the [0/±45/90]2S laminate are shown in figures 44 and 45 for the four different notch depths. As the notch depth was increased, the magnitudes of the normal stresses decreased. Although significant axial and transverse normal stress concentrations occurred adjacent to the notches, the central region between the notches exhibited significantly lower magnitudes of normal stresses.
-1.4625-1.3125-1.1625-1.0125-0.8625-0.7125-0.5625-0.4125-0.2625-0.11250.03750.18750.33750.48750.63750.78750.93751.08751.23751.3875
0.25-in. Depth 0.5-in. Depth 1.0-in. Depth 1.5-in. Depth
FIGURE 44. AXIAL NORMAL STRESS DISTRIBUTIONS FOR THE [0/±45/90]2S ORIGINAL RECTANGULAR V-NOTCHED SPECIMENS (Normalized)
-1.4625-1.3125-1.1625-1.0125-0.8625-0.7125-0.5625-0.4125-0.2625-0.11250.03750.18750.33750.48750.63750.78750.93751.08751.23751.3875
0.25-in. Depth 0.5-in. Depth 1.0-in. Depth 1.5-in. Depth
FIGURE 45. TRANSVERSE NORMAL STRESS DISTRIBUTIONS FOR THE [0/±45/90]2S ORIGINAL RECTANGULAR V-NOTCHED SPECIMENS (Normalized)
In summary, notching of the original rectangular specimen significantly improved the state of stress in the test section. Of the four notch depths investigated, the deepest notch, 38.1 mm
36

(1.5 in.) deep, produced the most uniform shear stress distribution and lowest magnitudes of normal stresses in the central region of the test section. However, stress concentration at the V-notch tips remained a concern. 4.5.2 Original Rectangular U-Notched Specimen Configurations. Due to concerns about the stress concentrations at the notch tips of the original rectangular V-notched specimens, a further study was undertaken in an attempt to reduce these concentrations. A U-notched configuration was investigated in which the notch tip was rounded using a radius equal to one-half of the notch width. The notch depths used in the V-notched investigation study, ranging from 6.4 to 38.1 mm (0.25 to 1.5 in.), were used for the U-notched configuration as well. Although results are presented only for the quasi-isotropic [0/±45/90]2S laminate, similar results were obtained for the other three laminates. 4.5.2.1 Shear Stresses for Original Rectangular U-Notched Specimen Configurations. Shear stress distributions for the U-notched [0/±45/90]2S specimens are shown in figure 46. The shear stress distributions throughout the central region of the test section for each of the notch depths were found to be more uniform than for the V-notched configuration. Significant shear stress concentrations, however, were observed approximately 3.18 mm (0.125 in.) from the tips of the U-notches, as was seen at the tips of the V-notched specimens. The magnitudes of these stress concentrations at the notch tips were similar to those observed at the V-notch tips. Additionally, shear stress concentrations observed at the edges of the test section were of greater magnitude than in the V-notched specimens. In summary, although the state of stress toward the center of the test section appeared to improve with the U-notches, stress concentrations along the edges of the test section and at the tips of the notches could lead to premature failures. Thus, the V-notched specimen was considered a superior specimen configuration.
-0.4625-0.3125-0.1625-0.01250.13750.28750.43750.58750.73750.88751.03751.18751.33751.48751.63751.78751.93752.08752.23752.3875
0.25-in. Depth 0.5-in. Depth 1.0-in. Depth 1.5-in. Depth
FIGURE 46. SHEAR STRESS DISTRIBUTIONS FOR THE [0/±45/90]2S ORIGINAL RECTANGULAR U-NOTCHED SPECIMEN CONFIGURATIONS (Normalized)
37

4.5.2.2 Axial and Transverse Normal Stresses for the Original Rectangular U-Notched Specimen Configurations. Axial and transverse normal stress distributions in the [0/±45/90]2S laminate are shown in figures 47 and 48 for the four different notch depths. These normal stress distributions are similar to those obtained for the V-notched specimen. The greatest notch depth modeled, 38.1 mm (1.5 in.) deep, displayed the lowest magnitudes of normal stresses. Although regions of significant axial and transverse normal stress concentrations were produced adjacent to the U-notches, the central region between the notches experienced significantly lower magnitudes of normal stresses.
-1.4625-1.3125-1.1625-1.0125-0.8625-0.7125-0.5625-0.4125-0.2625-0.11250.03750.18750.33750.48750.63750.78750.93751.08751.23751.3875
0.25-in. Depth 0.5-in. Depth 1.0-in. Depth 1.5-in. Depth
FIGURE 47. AXIAL STRESS DISTRIBUTIONS FOR THE [0/±45/90]2S ORIGINAL RECTANGULAR U-NOTCHED SPECIMEN CONFIGURATIONS (Normalized)
In summary, both the V-notched and U-notched rectangular specimen configurations produced improved stress distributions in comparison with the unnotched specimen. The greater notch depths produced lower magnitudes of normal stress. Thus, reducing the cross-sectional area via notching was found to be an effective mechanism for reducing the normal stresses in the central region of the test section. Although the overall shear stress distribution throughout the gage section was slightly more uniform in the U-notched specimen than in the V-notched specimen, the stress concentrations along the edges of the test section were higher in the U-notched specimen. Based on these findings, it was concluded that the V-notched configuration was more desirable that the U-notched configuration. However, further analyses as well as mechanical testing was performed using the U-notched configuration.
38

-1.4625-1.3125-1.1625-1.0125-0.8625-0.7125-0.5625-0.4125-0.2625-0.11250.03750.18750.33750.48750.63750.78750.93751.08751.23751.3875
0.25-in. Depth 0.5-in. Depth 1.0-in. Depth 1.5-in. Depth
FIGURE 48. TRANSVERSE STRESS DISTRIBUTIONS FOR THE [0/±45/90]2S ORIGINAL
RECTANGULAR U-NOTCHED SPECIMEN CONFIGURATIONS (Normalized) 4.6 MODIFIED RECTANGULAR V-NOTCHED SPECIMEN CONFIGURATIONS. Based on the improved stress state observed with the V-notched specimen of the original rectangular configuration, other notched specimen geometries were investigated. Of particular interest was the V-notched geometry of the Iosipescu shear specimen itself, where the depth of each 90º V-notch is 20 percent of the total height of the specimen test section. As described in section 3.3.4, this notched configuration was adapted into a 76.2- by 56.4-mm (3.0- by 2.22-in.) rectangular specimen. The baseline-notched configuration consisted of a 12.7-mm- (0.50-in.) -deep V-notch, producing an NDR of 0.225. The V-notch extended completely across the 25.4-mm (1.00-in.) test section, as shown in figure 16. Results obtained from this baseline configuration are presented below. Shear stress distributions from the baseline V-notched configuration are shown in figure 49 for all four laminates investigated. Results showed tremendous improvement in the shear stress distribution through the central region of the test section, where shear stresses were within ±4 percent of the average shear stress for the [0/90]4S, [0/±45/90]2S, and [±45]4S laminates. The shear stress distribution in the [0]16 laminate was slightly less uniform, with shear stresses within about ±11 percent of the average shear stress. Shear stress concentrations were still present at the notch tips, with the most severe stress concentrations observed in the [0]16 laminate (more than 40 percent greater than the average shear stress). Stress concentrations adjacent to the grips were virtually nonexistent, making the overall shear stress distributions more desirable than for any other specimen configuration investigated.
39

-0.4625-0.3125-0.1625-0.01250.13750.28750.43750.58750.73750.88751.03751.18751.33751.48751.63751.78751.93752.08752.23752.3875
[0]16 [0/90]4S [0/±45/90]2S [±45]4S
FIGURE 49. SHEAR STRESS DISTRIBUTIONS FOR THE BASELINE V-NOTCHED SPECIMEN CONFIGURATION (Normalized)
The axial and transverse normal stress distributions for the baseline V-notched configuration, shown in figures 50 and 51, also showed improvements relative to all previous specimen configurations investigated. In general, these normal stress distributions were similar to those obtained using the deepest V-notches and U-notches in the original rectangular specimen geometry. Stress concentrations were still present at the sides of the V-notches, but these were considered insignificant due to their location. Attempts to further decrease these stress concentrations, using the constraining techniques discussed previously, were ineffective. Interestingly, the baseline V-notched configuration without additional constraints exhibited lower axial and transverse stresses in the test section than the original unnotched rectangular specimen with constraints applied.
-1.4625-1.3125-1.1625-1.0125-0.8625-0.7125-0.5625-0.4125-0.2625-0.11250.03750.18750.33750.48750.63750.78750.93751.08751.23751.3875
[0]16 [0/90]4S [0/±45/90]2S [±45]4S
FIGURE 50. AXIAL NORMAL STRESS DISTRIBUTIONS FOR THE BASELINE V-NOTCHED SPECIMEN CONFIGURATION (Normalized)
40

-1.4625-1.3125-1.1625-1.0125-0.8625-0.7125-0.5625-0.4125-0.2625-0.11250.03750.18750.33750.48750.63750.78750.93751.08751.23751.3875
[0]16 [0/90]4S [0/±45/90]2S [±45]4S
FIGURE 51. TRANSVERSE NORMAL STRESS DISTRIBUTIONS FOR THE BASELINE
V-NOTCHED SPECIMEN CONFIGURATION (Normalized) Although the stress distributions obtained from the baseline V-notched specimen with a notch depth ratio of 0.225 were desirable, additional investigations were performed in an attempt to further improve the stress state. Several variations of the baseline configuration were investigated, including notch depth, notch angle, and notch shape. Results from each of these investigations are presented in the following sections. 4.6.1 Effects of NDR for the Modified Rectangular V-Notched Specimen. Six NDRs were investigated in this study, as outlined in section 3.3.4.1. Of interest was the notch depth that maximizes the area of uniform shear stress. Although all four laminates of interest were analyzed, results are only presented for the [0/±45/90]2S laminate; these results being representative of the other laminates. Shear stress distributions for the [0/±45/90]2S laminate are presented in figure 52 for all six NDRs examined. NDRs of 0.200 and 0.225 were shown to exhibit the most uniform state of shear stress, especially in the central region of the test section. As the NDR was decreased, stresses in the middle of the gage section were reduced to within ±4 percent of the average shear stress.
41

-0.4625-0.3125-0.1625-0.01250.13750.28750.43750.58750.73750.88751.03751.18751.33751.48751.63751.78751.93752.08752.23752.3875
0.150 NDR 0.175 NDR 0.200 NDR 0.225 NDR 0.250 NDR 0.300 NDR
FIGURE 52. SHEAR STRESS DISTRIBUTIONS FOR THE [0/±45/90]2S MODIFIED RECTANGULAR V-NOTCHED SPECIMEN WITH VARYING NDR (Normalized)
Axial and transverse normal stress distributions for the [0/±45/90]2S laminate are presented in figures 53 and 54. The effect of varying NDR was found to have minimal effect on the axial and transverse normal stress distributions, the magnitudes of the stress concentrations at the sides of the notches remaining fairly constant for each NDR.
-1.462-1.312-1.1625-1.0125-0.8625-0.7125-0.5625-0.4125-0.2625-0.11250.03750.18750.33750.48750.63750.78750.93751.08751.23751.3875
55
0.150 NDR 0.175 NDR 0.200 NDR 0.225 NDR 0.250 NDR 0.300 NDR
FIGURE 53. AXIAL NORMAL STRESS DISTRIBUTIONS FOR THE [0/±45/90]2S MODIFIED RECTANGULAR V-NOTCHED SPECIMEN WITH VARYING NDR
(Normalized)
42

-1.4625-1.3125-1.1625-1.0125-0.8625-0.7125-0.5625-0.4125-0.2625-0.11250.03750.18750.33750.48750.63750.78750.93751.08751.23751.3875
0.150 NDR 0.175 NDR 0.200 NDR 0.225 NDR 0.250 NDR 0.300 NDR
FIGURE 54. TRANSVERSE NORMAL STRESS DISTRIBUTIONS FOR THE [0/±45/90]2S MODIFIED RECTANGULAR V-NOTCHED SPECIMEN WITH
VARYING NDR (Normalized) These results indicated that the most uniform stress distributions were produced with NDRs in the range of 0.200 to 0.225. As a result, the baseline NDR of 0.225 was determined to be an acceptable value and was not subsequently altered. 4.6.2 Effects of Notch Angle for the Modified Rectangular V-Notched Specimen. Once the optimal NDR was determined, a study was performed to identify the optimal notch angle to be used in the V-notched specimen. The NDR value of 0.225, established from the previous study, was used for all notch angles investigated. In addition to the baseline angle of 90°, two additional notch angles were investigated: 70° and 110°. Although all four laminates of interest were analyzed, only the results from the [0/±45/90]2S laminate are shown since they represented all four laminates. The shear stress distributions for the 70° and 110° notch angles are shown for the [0/±45/90]2S laminate in figure 55 for the variable notch width geometries, and in figure 56 for the constant notch width geometries. It is evident from these figures that neither the 70° V-notch nor the 110° V-notch exhibited a more uniform state of stress than the 90° V-notch. The magnitudes of the shear stresses in the central region of the test section deviated by more than the previously obtained ±4 percent of the average shear stress as the notch angle is increased or decreased from 90°.
43

-0.462-0.312-0.1625-0.01250.13750.28750.43750.58750.73750.88751.03751.18751.33751.48751.63751.78751.93752.08752.23752.3875
55
70° 110°
FIGURE 55. SHEAR STRESS DISTRIBUTIONS FOR THE [0/±45/90]2S 70° AND 110° NOTCH ANGLES MODELED USING A VARIABLE NOTCH WIDTH (Normalized)
-0.4625-0.3125-0.1625-0.01250.13750.28750.43750.58750.73750.88751.03751.18751.33751.48751.63751.78751.93752.08752.23752.3875
70° 110°
FIGURE 56. SHEAR STRESS DISTRIBUTIONS FOR THE [0/±45/90]2S 70° AND 110° NOTCH ANGLES MODELED USING A CONSTANT NOTCH WIDTH (Normalized)
Axial normal stress distributions for the 70° and 110° notch angles are presented in figure 57 for the variable width geometries and in figure 58 for the constant width geometries. Transverse normal stress distributions for the variable width and constant width geometries are presented in figures 59 and 60. In general, the axial and transverse normal stresses were not affected greatly by the notch angle. The axial normal stress concentrations adjacent to the notches were reduced slightly as the angle was increased. The transverse normal stress concentrations adjacent to the notches followed an opposite pattern, increasing as the angle was increased. Since neither of the alternate notch angle variations produced a significant improvement in the state of stress within the test section, the baseline V-notch angle of 90° was retained.
44

-1.4625-1.3125-1.1625-1.0125-0.8625-0.7125-0.5625-0.4125-0.2625-0.11250.03750.18750.33750.48750.63750.78750.93751.08751.23751.3875
70° 110° FIGURE 57. AXIAL NORMAL STRESS DISTRIBUTIONS FOR THE [0/±45/90]2S 70° AND
110° NOTCH ANGLES MODELED USING A VARIABLE NOTCH WIDTH (Normalized)
-1.462-1.312-1.1625-1.0125-0.8625-0.7125-0.5625-0.4125-0.2625-0.11250.03750.18750.33750.48750.63750.78750.93751.08751.23751.3875
55
70° 110° FIGURE 58. AXIAL NORMAL STRESS DISTRIBUTIONS FOR THE [0/±45/90]2S 70° AND 110° NOTCH ANGLES MODELED USING A CONSTANT NOTCH WIDTH (Normalized)
-1.462-1.312-1.1625-1.0125-0.8625-0.7125-0.5625-0.4125-0.2625-0.11250.03750.18750.33750.48750.63750.78750.93751.08751.23751.3875
55
70° 110°
FIGURE 59. TRANSVERSE NORMAL STRESS DISTRIBUTIONS FOR THE [0/±45/90]2S 70° AND 110° NOTCH ANGLES MODELED USING A VARIABLE NOTCH WIDTH
(Normalized)
45

-1.4625-1.3125-1.1625-1.0125-0.8625-0.7125-0.5625-0.4125-0.2625-0.11250.03750.18750.33750.48750.63750.78750.93751.08751.23751.3875
70° 110°
FIGURE 60. TRANSVERSE NORMAL STRESS DISTRIBUTIONS FOR THE [0/±45/90]2S
70° AND 110° NOTCH ANGLES MODELED USING A CONSTANT NOTCH WIDTH (Normalized)
4.6.3 Effects of Notch Tip Radius for the Modified Rectangular V-Notched Specimen. Because slight stress concentrations were predicted at the notch tips of the 90° V-notched specimen, further investigation was performed to examine the possibility of reducing these stress concentrations by modestly rounding the notch tip. Two notch tip radii were investigated: 0.64 mm (0.025 in.) and 1.3 mm (0.050 in.). These simulations were also of interest since obtaining a perfectly sharp notch tip is not practical in actual specimen fabrication. Although all four laminates of interest were analyzed, results are shown here only for the [0/±45/90]2S laminate, as being representative of the other laminates. Shear stress distributions for the two notch tip radii modeled are presented in figure 61. Results indicate that including a radius at the notch tip reduces the stress concentrations. However, the overall shear stress distribution is slightly less uniform for rounded notch tips than for sharp notch tips. The axial and transverse normal stress distributions, shown in figures 62 and 63, indicate that the variation in notch tip radius had virtually no effect on the axial and transverse normal stresses.
46

-0.4625-0.3125-0.1625-0.01250.13750.28750.43750.58750.73750.88751.03751.18751.33751.48751.63751.78751.93752.08752.23752.3875
0.025-in. Radius 0.05-in. Radius
FIGURE 61. SHEAR STRESS DISTRIBUTIONS FOR THE [0/±45/90]2S LAMINATE WITH
0.025- AND 0.050-in. NOTCH RADII (Normalized)
-1.4625-1.3125-1.1625-1.0125-0.8625-0.7125-0.5625-0.4125-0.2625-0.11250.03750.18750.33750.48750.63750.78750.93751.08751.23751.3875
0.025-in. Radius 0.05-in. Radius
FIGURE 62. AXIAL NORMAL STRESS DISTRIBUTIONS FOR THE [0/±45/90]2S LAMINATE WITH 0.025- AND 0.050-in. NOTCH RADII (Normalized)
47

-1.4625-1.3125-1.1625-1.0125-0.8625-0.7125-0.5625-0.4125-0.2625-0.11250.03750.18750.33750.48750.63750.78750.93751.08751.23751.3875
0.025-in. Radius 0.05-in. Radius
FIGURE 63. TRANSVERSE NORMAL STRESS DISTRIBUTIONS FOR THE [0/±45/90]2S LAMINATE WITH 0.025- AND 0.050-in. NOTCH RADII (Normalized)
In summary, no significant improvements were made in the stress distributions by rounding the 90° notch tip. However, a small notch tip radius in the range of 0.64 to 1.3 mm (0.025 to 0.050 in.) is recommended for practical specimen fabrication. 4.7 MODIFIED RECTANGULAR U-NOTCHED SPECIMEN CONFIGURATIONS. The original rectangular U-notched specimen was shown in section 4.5.2 to have very promising qualities. Although the shear stress distributions in the central regions of the test sections were highly uniform, high stress concentrations were predicted at the edges of the test sections and at the tip of the U-notch. Since the smaller modified rectangular specimens significantly reduced such stress concentrations for V-notched specimens, a study was conducted on a smaller U-notched specimen as well. (The dimensions of this modified rectangular U-notched specimen were presented in section 3.3.5.) The first attempt at modeling this specimen included a 0.225 NDR, the same as was used in the baseline rectangular V-notched specimen. A notch depth ratio study was conducted by examining two alternate NDRs, 0.200 and 0.250. The effect of the U-notch width was also investigated. The shear stress distributions in each of the four laminates for the 0.225 NDR modified rectangular U-notched specimen are shown in figure 64. These results showed that the shear stress distributions in the central region of the test sections were not as uniform as for their V-notched specimen counterparts. However, the stress concentrations at the midpoint of the U-notches were extremely low and virtually no stress concentrations exist along the edges of the test section.
48

-0.4625-0.3125-0.1625-0.01250.13750.28750.43750.58750.73750.88751.03751.18751.33751.48751.63751.78751.93752.08752.23752.3875
[0]16 [0/90]4S [0/±45/90]2S [±45]4S
FIGURE 64. SHEAR STRESS DISTRIBUTIONS IN MODIFIED RECTANGULAR
U-NOTCHED SPECIMENS (Normalized) The axial and transverse normal stress distributions for each laminate of the 0.225 NDR modified rectangular U-notched specimen are shown in figures 65 and 66. The axial and transverse normal stress concentrations occur at the edge of the notch on either side of the centerline and are significantly higher than in the original U-notched specimens.
-1.4625-1.3125-1.1625-1.0125-0.8625-0.7125-0.5625-0.4125-0.2625-0.11250.03750.18750.33750.48750.63750.78750.93751.08751.23751.3875
[0]16 [0/90]4S [0/±45/90]2S [±45]4S
FIGURE 65. AXIAL NORMAL STRESS DISTRIBUTIONS IN MODIFIED RECTANGULAR U-NOTCHED SPECIMENS (Normalized)
49

-1.4625-1.3125-1.1625-1.0125-0.8625-0.7125-0.5625-0.4125-0.2625-0.11250.03750.18750.33750.48750.63750.78750.93751.08751.23751.3875
[0]16 [0/90]4S [0/±45/90]2S [±45]4S
FIGURE 66. TRANSVERSE NORMAL STRESS DISTRIBUTIONS IN MODIFIED
RECTANGULAR U-NOTCHED SPECIMENS (Normalized) 4.7.1 Effects of NDR for the Modified Rectangular U-Notched Specimen. Three NDRs were investigated in this study as outlined in section 3.3.5.1. This investigation was performed in an attempt to maximize the area experiencing a uniform shear stress state. Although all four laminates of interest were analyzed, results are shown here only for the [0/±45/90]2S laminate, which was representative of all laminates investigated. Shear stress distributions for the three NDRs are presented in figure 67. These results showed that as the NDR decreases, the area between the notches that experiences shear stresses greater than the average value diminishes slightly. The shear stress concentrations near the notches were not affected significantly by the change in NDR. The axial and transverse normal stress distributions, shown in figures 68 and 69, also do not change significantly with the changing NDR. These stress distributions were very similar to those shown previously for the modified rectangular V-notched specimen. The only noticeable difference between the U-notched and the V-notched normal stresses was the magnitude of the localized stress concentrations adjacent to the notches.
50

-0.462-0.312-0.1625-0.01250.13750.28750.43750.58750.73750.88751.03751.18751.33751.48751.63751.78751.93752.08752.23752.3875
55
0.200 NDR 0.225 NDR 0.250 NDR
FIGURE 67. SHEAR STRESS DISTRIBUTIONS FOR THE [0/±45/90]2S MODIFIED RECTANGULAR U-NOTCHED SPECIMENS OF VARYING NDR (Normalized)
-1.4625-1.3125-1.1625-1.0125-0.8625-0.7125-0.5625-0.4125-0.2625-0.11250.03750.18750.33750.48750.63750.78750.93751.08751.23751.3875
0.200 NDR 0.225 NDR 0.250 NDR
FIGURE 68. AXIAL NORMAL STRESS DISTRIBUTIONS FOR THE [0/±45/90]2S
MODIFIED RECTANGULAR U-NOTCHED SPECIMENS OF VARYING NDR (Normalized)
-1.462-1.312-1.1625-1.0125-0.8625-0.7125-0.5625-0.4125-0.2625-0.11250.03750.18750.33750.48750.63750.78750.93751.08751.23751.3875
55
0.200 NDR 0.225 NDR 0.250 NDR
FIGURE 69. TRANSVERSE NORMAL STRESS DISTRIBUTIONS FOR THE [0/±45/90]2S MODIFIED RECTANGULAR U-NOTCHED SPECIMENS OF VARYING NDR (Normalized)
51

4.7.2 Effects of Notch Width for the Modified Rectangular U-Notched Specimen. In addition to the 12.7-mm- (0.50-in.) -wide notch already modeled, two additional notch widths were analyzed in an attempt to further improve the state of stress in the specimen test section. All three notch widths were analyzed with a constant notch depth ratio of 0.225. The dimensions for the specimens modeled in this study were shown in section 3.3.5.2. The shear stress distributions for the three different notch widths are presented in figure 70. In contrast to the 12.7-mm- (0.50-in.) -wide U-notch already investigated, both the 2.5-mm- (0.10-in.) and 5.1-mm- (0.20-in.) -wide U-notches produced lower than average shear stresses throughout the central region of the test section. The axial and transverse normal stress distributions are shown in figures 71 and 72. As the notch width decreased, the axial normal stress concentrations adjacent to the notch increased, whereas the transverse normal stress concentrations decreased. The 2.5-mm- (0.10-in.) -wide U-notch showed the greatest axial stress concentrations, greater than 150 percent of the average test section shear stress. However, the 12.7-mm- (0.50-in.) -wide U-notch displayed the greatest magnitudes of transverse normal stresses, also greater than 150 percent of the average shear stress.
-0.462-0.312-0.1625-0.01250.13750.28750.43750.58750.73750.88751.03751.18751.33751.48751.63751.78751.93752.08752.23752.3875
55
0.100-in. Width 0.200-in. Width 0.500-in. Width
FIGURE 70. SHEAR STRESS DISTRIBUTIONS FOR THE [0/±45/90]2S MODIFIED RECTANGULAR U-NOTCHED SPECIMENS WITH VARIOUS NOTCH WIDTHS
(Normalized)
-1.4625-1.3125-1.1625-1.0125-0.8625-0.7125-0.5625-0.4125-0.2625-0.11250.03750.18750.33750.48750.63750.78750.93751.08751.23751.3875
0.100-in. Width 0.200-in. Width 0.500-in. Width
FIGURE 71. AXIAL NORMAL STRESS DISTRIBUTIONS FOR THE [0/±45/90]2S MODIFIED RECTANGULAR U-NOTCHED SPECIMENS WITH VARIOUS NOTCH
WIDTHS (Normalized)
52

-1.4625-1.3125-1.1625-1.0125-0.8625-0.7125-0.5625-0.4125-0.2625-0.11250.03750.18750.33750.48750.63750.78750.93751.08751.23751.3875
0.100-in. Width 0.200-in. Width 0.500-in. Width
FIGURE 72. TRANSVERSE STRESS DISTRIBUTIONS FOR THE [0/±45/90]2S MODIFIED RECTANGULAR U-NOTCHED SPECIMENS WITH VARIOUS NOTCH WIDTHS
(Normalized) 4.8 SHEAR MODULUS DETERMINATION. The accuracy of the shear modulus measurement as a function of strain gage size was investigated for several specimen geometries. The apparent shear modulus calculated using a specific strain gage size was obtained from Gcalculated = τave / γgage = (Fapp/A) / γgage (4) where Fapp is the force applied to the specimen, A is the cross-sectional area of the test section, and γgage is the average shear strain occurring across the sensing area of the strain gage. To determine the accuracy of this measurement, the apparent shear modulus, Gcalculated, was nondimensionalized by the actual value of shear modulus used in the finite element analysis, Gactual. The nondimensionalized quantity Gcalculated/Gactual was used to assess the accuracy of shear modulus measurements for a particular laminate, specimen configuration, and strain gage size. To determine whether accurate values of the shear modulus could be obtained from a specific specimen configuration, various sizes of strain gages were investigated by averaging strain values associated with those nodes that would lie underneath the sensing area of the gage. For example, if a narrow strain gage were to span the entire length of the gage section (notch-to-notch), all nodes along the centerline would be averaged. If a narrow strain gage was used that was only 6.4 mm (0.25 in.) in length, only the nodes in the central 6.4 mm (0.25 in.) of the centerline would be averaged. Four different types of strain gages were investigated: a narrow, full-length shear gage, a compact shear gage, an Iosipescu shear gage, and a standard-sized torque gage. The full-length shear gage extended across the entire length of the test section. The compact, Iosipescu, and
53

torque gages were 19.1 mm (0.75 in.), 11.4 mm (0.45 in.), and 6.4 mm (0.25 in.) in length, respectively. The normalized shear modulus Gcalculated/Gactual was calculated for each strain gage using the four specimen configurations discussed previously. Values of Gcalculated/Gactual are shown for the 90º notch angle, 0.225 NDR V-notched shear specimen in figure 73. Results showed that with the exception of the [0]16 laminate, the shear modulus may be accurately determined using any of the four strain gage lengths considered. However, the modulus for the [0]16 laminate was most accurately measured using a full-length, notch-to-notch strain gage. Using the other three gage lengths produced ratios of Gcalculated/Gactual that were between 1.07 and 1.11. These results are in agreement with the shear stress distributions shown in figure 49, which showed relatively uniform shear stress distributions in all laminates except for the [0]16 laminate. For the [0]16 laminate, however, the shear stress distribution was less uniform with lower than average values of shear stress in the central region of the test section.
0
0.2
0.4
0.6
0.8
1
1.2
1.4
1.6
1.8
2
Nor
mal
ized
She
ar M
odul
us
Shear gage (Full Length)
Compact Gage - 19.1 mm (0.75 in)
Iosipescu Gage - 11.4 mm (0.45 in)
Standard Gage - 6.4 mm (0.25 in)
[0]16 [0/90]4S [0/±45/90]2S [±45]4S
Layup
FIGURE 73. NONDIMENSIONALIZED SHEAR MODULI CALCULATED FOR VARIOUS
STRAIN GAGE LENGTHS 5. SPECIMEN FABRICATION AND TESTING METHODOLOGIES. 5.1 INTRODUCTION. Shear testing was performed using specimens fabricated of commercially available thermoset matrix prepreg composite materials. Several different composite laminates were tested, including unidirectional, cross-ply, and various angle-ply orientations. Several different specimen geometries were evaluated. A new rail shear test fixture was designed and fabricated based on the previous work of Hussain and Adams [3 and 4]. Results obtained using the rail shear fixture were compared to those obtained using two existing standardized test methods, the ASTM D 4255 two-rail shear test [2] and the ASTM D 5379 Iosipescu shear test [1].
54

5.2 MATERIAL SYSTEMS TESTED. The primary material system used for this study was AS4/3501-6 carbon/epoxy. This thermoset matrix carbon/epoxy composite has been used extensively in the aerospace industry and is well characterized. In addition, limited experimental evaluation was performed using woven glass fabric/vinylester composite panels. The AS4/3501-6 carbon/epoxy panels used were all fabricated specifically for the present study. These panels were fabricated from 152-mm- (6.0-in.) -wide unidirectional prepreg tape produced by HEXCEL Advanced Composites. The cured-ply thickness of the AS4/3501-6 was approximately 0.13 mm- (0.005 in.) thick. 5.3 PANEL FABRICATION. The AS4/3501-6 prepreg tape was cut into pieces to form single plies with the desired orientation measuring 305 mm (12.0 in.) by 305 mm (12.0 in.). Cutting the prepreg was performed using acrylic templates of the desired sizes and shapes required to form the individual plies. The individual plies were then stacked in the proper orientations and sequence to produce the desired laminate. The AS4/3501-6 panels were cured using a heated platen press. This hot-press method produced panels up to 305 mm (12.0 in.) long by 305 mm (12.0 in.) wide. A total of 16 unidirectional prepreg plies were used in each AS4/3501-6 panel fabricated, producing a cured panel thickness of approximately 2.0 mm (0.08 in.). The hot-press curing method used a well-and-plunger mold for panel fabrication. The lower well of the mold consisted of a steel plate measuring 305 mm (12.0 in.) by 305 mm (12.0 in.) by 12.7 mm (0.50 in.). On each of the four edges were five evenly spaced drilled and tapped holes. These holes were used to attach the side pieces with 1/4-20 UNC socket head screws. The four side pieces were 38.1 mm (1.50 in.) tall and 12.7 mm (0.50 in.) thick. The upper steel plunger of the mold was 305 mm (12.0 in.) by 305 mm (12.0 in.) by 25.4 mm (1.00 in.). The mold was prepared by first spraying all pieces with a polytetrafluoroethelene release agent. Next, two adjacent side pieces were attached to the bottom of the mold. The laminate stack was placed inside and trimmed, if necessary, to fit the mold. The remaining two sides of the mold were then loosely attached to the bottom of the mold. The upper plunger was placed on top of the laminate stack and the side pieces of the mold tightened. The assembled mold was then placed into a Carver hot press. A layer of aluminum foil was placed above and below the mold to protect the hot-press platens from excess resin. The hot press was temperature-controlled, and pressure was applied via a hydraulic ram. The manufacturer-recommended cure cycle used for the AS4/3501-6 carbon/epoxy in the hot press was as follows: 1. Apply 103 kPa (15 psi) pressure to the mold and then raise the temperature to 121ºC
(250ºF) at the rate of 8.33ºC/min (15ºF/min.) and hold for 45 minutes.
2. Increase the pressure to 689 kPa (100 psi) and the temperature to 177ºC (350ºF) at the rate of 8.33ºC/min (15ºF/min.) and hold for 120 minutes.
55

3. Release the pressure and allow the mold to cool.
4. Once it is cool enough to handle, the sides of the mold are loosened and the panel is removed from the mold.
5.4 SPECIMEN FABRICATION. Depending on the specimen configuration, different specimen fabrication operations were used. All specimens were cut to the desired sizes using a diamond-impregnated cutting blade mounted in a Brown & Sharp No. 2 surface grinder. The cutting blade was 152 mm (6.00 in.) in diameter and 1.63 mm (0.064 in.) thick. Panels to be cut were affixed to a sacrificial acrylic plate using double-sided carpet tape. The acrylic plate, which had been adhesively bonded to a steel plate, was held on the surface grinder using a magnetic chuck. If the specimen required notching, a 60-grit aluminum oxide abrasive cutting wheel was used with the same surface grinder. The abrasive cutting wheels used had a 191 mm (7.50 in.) diameter and were 12.7 mm (0.50 in.) thick. The wheels were dressed into either a 90° angle or a semicircular shape, depending on whether a V-notched or U-notched configuration was desired. If the notch was required to be more than 12.7 mm (0.50 in.) wide, a disc sander was used to extend the notch width after the grinding operation. A liquid lubricant mixed with water was used for all the cutting and grinding operations. Great care was taken to properly align the fibers with the cutting blade during the manufacture of the specimens. Initially, the rectangular and trapezoidal geometries, shown in figures 9 and 10, were fabricated. The rectangular specimen (figure 9) was cut to 114 mm (4.50 in.) tall by 69.9 mm (2.75 in.) wide. This configuration produced gripping regions 25.4 mm (1.00 in.) wide and a rectangular gage section that measured 114 mm (4.5 in.) tall by 19.1 mm (0.75 in.) wide. The trapezoidal specimen (figure 10) was first cut into a rectangular shape measuring 133 mm (5.25 in.) tall by 69.9 mm (2.75 in.) wide. Next, 44.5 mm (1.75 in.) right-angle triangles were cut from opposite corners. The resulting gage section was parallelogram shaped, measuring 114 mm (4.50 in.) tall by 19.1 mm (0.75 in.) wide. In the next round of testing, the rectangular specimen geometry was modified by introducing V-shaped notches to the top and bottom of the gage section. Three different V-notched configurations were fabricated based on this original rectangular specimen geometry. These three V-notched configurations are shown in figure 74. Two of the configurations (figures 74(a) and 74(b), previously classified as the original rectangular V-notched configuration (section 3.3.3.1), were produced using a 12.7-mm- (0.50-in.) -wide grinding wheel. Although four different notch depths were analyzed using finite element analysis, only the 12.7-mm- (0.50-in.) and 25.4-mm- (1.00-in.) -deep notches were fabricated (figures 74(a) and 74(b), respectively). The third V-notched configuration, referred to as the wide V-notched configuration shown in figure 74(c), required an additional machining operation. In addition to producing a 25.4-mm- (1.00-in.) -deep original rectangular V-notched specimen as in figure 74(b), a disk sander was used to continue the V-shape of the notch over the entire notch flank. The resulting V-notches at the top and bottom of the specimen were 25.4 mm (1.00 in.) deep and 50.8 mm (2.00 in.) wide.
56

(a) (b)
(c)
FIGURE 74. RECTANGULAR V-NOTCHED SPECIMEN GEOMETRIES (Crosshatched areas indicate grip regions)
57

A U-notched specimen was also produced from a somewhat smaller rectangular shape, measuring 63.5 mm (2.50 in.) by 76.2 mm (3.00 in.). This specimen geometry was selected based on the compact shear specimen developed by Ifju [14] and the geometry of the rail shear fixture to be used. A 12.7-mm- (0.50-in.) -wide grinding wheel dressed into a semicircular shape was used to produce 19.1-mm- (0.75-in.) -deep U-notches, as shown in figure 75. The gage section width of this specimen was 12.7 mm (0.5 in.) wide, such that the U-notch extended across the complete width of the gage section.
FIGURE 75. U-NOTCHED SPECIMEN GEOMETRY (Crosshatched areas indicate grip regions)
Based on the results of the finite element analyses, the modified rectangular V-notched specimen geometry was selected next for experimental investigation. The size of the rectangular specimen was reduced to 56.4 mm (2.22 in.) in height by 76.2 mm (3.00 in.) in width, as was indicated in section 3.3.4.1 for a NDR of 0.225. This NDR was reported in section 4.6.1 as being the most optimal NDR for a variety of composite laminates. The V-notches produced were 12.7 mm (0.50 in.) deep and 25.4 mm (1.00 in.) wide, as shown in figure 76. These notches were produced using the same procedure as the wide V-notched configuration. Specimens with the same rectangular dimensions were also prepared with notch depth ratios of NDR = 0 (no notch), NDR = 15 (8.4-mm- (0.33-in.) -deep notch), and NDR = 30, (16.8-mm- (0.66-in.) -deep notch). Note that although different NDRs were modeled by adjusting the total height of the specimen, different NDRs were tested by maintaining the overall specimen dimensions and allowing the notch width to travel into the grip regions as the notch depth increased. For investigating the influence of strain gage size on shear modulus determinations, a scaled version of the modified V-notched specimen was produced. This specimen configuration, referred to as the compact V-notched specimen, is shown in figure 77. This specimen measured 66.8 mm (2.63 in.) in width by 35.1 mm (1.38 in.) in height, with V-notches that were 7.87 mm (0.31 in.) deep. This specimen had a gage section width of 16.0 mm (0.63 in.).
58

FIGURE 76. MODIFIED V-NOTCHED SPECIMEN GEOMETRY (Crosshatched areas indicate grip regions)
FIGURE 77. COMPACT V-NOTCHED SPECIMEN GEOMETRY (Crosshatched areas indicate grip regions)
Bonded tabs were investigated in conjunction with the original rectangular specimen configuration, as was discussed in section 3.3.2. The tabbing material used was 1.6-mm- (0.063-in.) -thick G-10 glass fabric/epoxy printed circuit board material. Tabs were bonded to the specimen using Hysol 907 room-temperature-curing, two-part paste adhesive. The detailed procedure used for tab bonding is provided in a tabbing guide [19]. Two tabbing geometries were investigated: tapered and untapered. The tapered tabs were manufactured with a 27° taper machined into the edge of the tab adjacent to the gage section. The tapered tab extended 3.2 mm (0.13 in.) into the gage area, as shown in figure 13. The resulting gage section width of these specimens was 12.7 mm (0.50 in.). In addition to the tapered tab geometry, two different widths of untapered taps were investigated, producing gage section widths of 19.1 mm (0.75 in.) and 12.7 mm (0.50 in.), as shown in figures 11 and 12.
59

Finally, for comparison purposes, a series of specimens was prepared for testing following ASTM D 5379 [2] (Iosipescu shear test) and ASTM D 4255 [3] (two-rail shear test). The Iosipescu specimens were cut into rectangles measuring 76 mm (3.00 in.) by 19 mm (0.75 in.), as shown in figure 6. Notches 3.8 mm (0.15 in.) deep and 7.6 mm (0.30 in.) wide were used. The two-rail shear specimens (figure 4) were 76.2 mm (3.00 in.) by 152 mm (6.00 in.). The six holes were machined into these specimens using a diamond core drill. 5.5 MODIFIED TWO-RAIL SHEAR TEST FIXTURE. Initial shear testing was performed using a modified version of the two-rail shear test fixture developed by Hussain and Adams [3 and 4]. As discussed in section 2.2, the most significant improvement of the Hussain and Adams fixture over the two-rail shear fixture described in ASTM D 4255 was the ability to apply sufficient gripping forces without having to drill holes in the test specimen or bond the test specimen to the rails of the fixture. At the conclusion of their investigation, Hussain and Adams suggested modifications for further improvements to their two-rail shear test fixture. The suggested modifications were rather minor and focused on improving the durability and gripping capabilities of the fixture [4]. Figure 78 shows the modified two-rail shear test fixture used initially in this study, which incorporated the suggested modifications of Hussain and Adams. This fixture consists of two identical halves, each with a side rail (figure 79), loading plate, and two gripping plates (figure 80). The side rail contains a machined cavity that accepts two gripping plates. The loading plate attaches to the side rail and couples the fixture to the load train of the testing machine. The side rails and loading plates were produced from mild steel, whereas the gripping plates were produced from hardened steel. The grip surface on each gripping plate was a thermal-sprayed tungsten carbide particle surface, producing a roughness equivalent to abrasive cloth of approximately 100-150 grit.
FIGURE 78. MODIFIED TWO-RAIL SHEAR TEST FIXTURE
60

FIGURE 79. DRAWINGS OF MODIFIED FIXTURE SIDE RAILS
FIGURE 80. DRAWINGS OF MODIFIED FIXTURE LOADING AND GRIPPING PLATES
61

The side rail pieces each had five threaded holes in each side. Bolts threaded into these holes were used to apply the clamping force to the grip plates, which gripped the specimen. The bolts were offset to give more uniform clamping to the specimen. The gripping plates had a grip surface that was 25.4 mm (1.00 in.) wide and 127.0 mm (5.00 in.) tall. Initially, each loading plate was connected to a side rail using two 3/8-24 UNF bolts. Each loading plate contained a threaded hole to accept the coupling to the test machine. When assembled, the test fixture provided a specimen gage section width of 19.1 mm (0.75 in.) between the side rails. The initial design of the loading plates had lateral slots for the bolt holes that connect it to the side rails. These slots were to allow the fixture to be aligned with the load train. It was found that the specimen could be loaded in line with the load frame, therefore, the lateral slots were not necessary for any of the tests. During initial testing, the loading plates of the test fixture yielded and were subsequently redesigned. The redesigned loading plate is shown in figure 81. The redesigned loading plate was thicker at 38.1 mm (1.50 in.) opposed to 25.4 mm (1.00 in.). A third hole was also added to connect to the side rail. The bolts used to attach the rails to the loading plate were increased in diameter from 3/8-24 UNF bolts to 1/2-20 UNF bolts. The new loading plates were fabricated of heat-treated, 4130 steel to provide additional strength. Additionally, the three holes were elongated to form slots to allow the specimen gage section width to be adjusted from 12.7 mm (0.50 in.) up to 25.4 mm (1.00 in.). Washers were also added between the heads of the bolts and the loading plate to prevent localized yielding.
FIGURE 81. REDESIGNED LOADING PLATE
62
5.6 TESTING PROCEDURE. All testing was performed at room temperature on a computer-controlled 50-kip electromechanical load frame, equipped with an Instron tension-compression load cell. Data acquisition was provided using a Pentium computer. A Measurements Group 2120A strain gage conditioner and amplifier system was used for strain gage measurements. Before each test, the thermal-sprayed surfaces of the gripping plates were cleaned with a brass brush. The loading plates were next attached to the side rails. A caliper was used to adjust the position of each loading plate relative to the side rail to produce the desired specimen gage width. The test specimen was loaded into the test fixture by placing it between the gripping plates in one of the side rails. The clamping bolts were hand-tightened on both sides of the side rail such that the specimen was centered visually in the machined cavity. Each of the bolts was then tightened to one-half of the maximum bolt torque, using a 100 N-m (75 ft-lb) capacity click style torque wrench. The maximum torque was then applied to all bolts. A 41 N-m (30 ft-lb) bolt torque was used for all specimens using this fixture. The second side rail was placed onto the opposite side of the specimen and the same bolt-torquing procedure was repeated. After the specimen was inserted into the test fixture, the assembled test fixture was mounted in the load frame. The fixture was first attached to the lower portion of the load train using a pinned connection. If strain gages were used, they were balanced and shunt-calibrated at this time. Next, the crosshead of the load frame was lowered and the test fixture was attached via a pinned connection to the upper portion of the load train. A universal joint was included in the upper load train assembly. All shear tests were performed using a constant crosshead displacement rate of 1.27 mm/min. (0.050 in/min.). The shear stress τ was calculated as the applied force F divided by the minimum cross-sectional area (minimum gage height multiplied by specimen thickness), A, or
τ = F/A Failure of the specimen was determined when the load dropped below 75 percent of the maximum applied load for each individual test. The shear strength was taken to be the highest stress recorded during each test. As described previously in section 3.2, a sign convention was established with the specimen oriented in the x-y plane. The loading direction, or y direction, is referred to as the axial orientation for stresses and strains. The transverse direction (transverse to the applied load) is taken as the x direction. Following conventional notation, the 0º fiber orientation of the composite specimen is assumed to be oriented in the x direction. Therefore a 0º specimen has fibers extending from one side of the fixture to the other, perpendicular to the applied load.
63

For three-element rosette strain gages, the strains were determined from the following equations:
4545
0
04545
−
−
−==
−+=
εεγεε
εεεε
xy
x
y
where
yε = normal strain in the axial direction
xε = normal strain in the transverse direction xyγ = shear strain
045 45−εεε ,, = measured strains from the 45, 0, and -45 gages, respectively For the two-element gages, the shear strain was calculated by using the equation for xyγ listed above. The shear modulus of the composite laminate Gxy is calculated from the slope of the shear stress versus shear strain curve, or
Gxy = ∆τxy/∆γxy When back-to-back strain gages were used, the average value of shear strain was used in shear modulus determinations. Unless otherwise indicated, the shear modulus was obtained using a least squares fit to the shear stress versus average shear strain data between 0.2% and 0.6% shear strain. In addition to tests performed using the modified two-rail shear test fixture, standard two-rail shear testing was performed according to ASTM D 4255, Method A [2]. Iosipescu shear testing was also performed, following ASTM D 5379 [1]. 6. EXPERIMENTAL RESULTS. 6.1 INTRODUCTION. This section presents the shear test results obtained using the test fixtures and specimen geometries described in section 5. Initial testing was performed using the modified two-rail shear test fixture described in section 5.5. Shear tests were conducted to evaluate different specimen configurations fabricated from AS4/3501-6 carbon/epoxy prepreg tape containing varying percentages of ±45 plies. These initial tests served as a preliminary evaluation of the modified rail shear fixture as well as an assessment of initial specimen configurations. These initial assessments were also used to establish efficient and accurate methods of specimen preparation. Further testing was performed to investigate other specimen configurations and further modifications to the rail shear test fixture.
64

A majority of the rail shear testing performed in this study used 16-ply AS4/3501-6 carbon/epoxy panels. A total of five laminates were tested with differing percentages of ±45° layers, as shown in table 5. Two of the laminates, [0]16 and [0/90]4S, provide the shear stiffness and shear strength of basic composite lamina. Four additional laminates were considered, with increasing percentages of ±45° plies, ranging from 25 percent ([(0/90)2/±45/0/90]S) to 100 percent ([±45]4S).
TABLE 5. AS4/3501-6 CARBON/EPOXY LAMINATES TESTED
Laminate Percentage ±45° Oriented Plies [0]16 0% [0/90]4S 0% [(0/90)2/±45/0/90]S 25% [0/±45/90]2S 50% [±45/90/±45/0/±45]S 75% [±45]4S 100%
The primary evaluations in this study consisted of two parts. The first part focused on evaluating the two-rail shear test fixture. This study included an evaluation of additional fixture constraints to improve the stress state in the specimen test section. The second part was focused on identifying optimal specimen configurations by varying the size and shape of the specimen. Following these evaluations, a new fixture was designed and fabricated to accommodate the selected specimen configuration. Additional evaluations were performed to compare the newly designed two-rail shear test fixture with two existing shear testing methods, the Iosipescu shear test method, ASTM D 5379 [1], and the two-rail shear test method, ASTM 4255 [2]. The suitability for determining shear modulus values was also evaluated for the modified fixture. 6.2 PRELIMINARY EVALUATION. Initial shear testing was conducted using the modified rail shear fixture shown in figure 78 and described in section 5.5. The first series of tests performed focused on the rectangular specimen configuration, as was shown in figure 9. The selection of this configuration was based on recommendations made by Hussain and Adams [4] and the finite element results presented in section 4.3. During the initial testing of the high-shear strength [±45]4S laminates in the initial round of tests, problems with the design of the fixture were evident. When performing tests on the rectangular specimens from the [±45]4S laminate, a gap was observed between the loading plates and the side rails on both the left and right fixture halves. Further examination of the test fixture after the tests were completed showed that bearing failure occurred where the head of the bolt contacted the loading plate. To remedy the problem, the loading plates and side rail were machined to accept larger diameter bolts. Using larger diameter bolts increased the surface area between the head of the bolt and the top plate. Additionally, a third bolt connecting the side rail to the loading plate was added.
65

Further shear testing was performed on [±45]4S laminates with these fixture modifications. Once again, however, a gap was observed between the loading plate and the side rails on both the top and bottom fixture halves. Upon investigation, it was determined that due to the machining of the larger holes to accommodate the larger bolts, the cross-sectional area of the loading plate was reduced. As a result, the loading plate yielded in bending. Plastic deformation was observed where the two original bolt holes were located, i.e., the cross section of minimal area. Following these tests, new loading plates were machined from 4340 steel. The thickness of the plates was increased from 25.4 mm (1.00 in.) to 38.1 mm (1.50 in.). Additionally, the plates were heat-treated to increase the yield strength and hardness. The increased hardness was of interest to prevent further bearing failure of the bolt heads. Heat-treated 4340 steel washers were manufactured for placement between the head of the bolts and the loading plate. These washers helped to further distribute the bearing stresses from the bolts and provided an inexpensive, sacrificial part that could be replaced easily if damaged. While machining the new loading plates, the bolt holes were replaced with transverse slots to accommodate a range of test section widths. Whereas the original fixture design was limited to a test section width of 19.1 mm (0.75 in.), the redesigned fixture allowed test section widths between 12.7 mm (0.50 in.) and 25.4 mm (1.00 in.). 6.3 PRIMARY EVALUATION. The focus of the initial evaluation phase was to establish a rail shear test method suitable for a variety of composite laminates. This evaluation consisted of two parts: development of an optimal fixture configuration and development of an optimal specimen configuration. Since the establishment of a test method involves both the fixture and the specimen, these two aspects were developed concurrently. To facilitate this development, multiple tests were performed focusing on numerous aspects of the fixture and the specimen. This initial evaluation phase resulted in a redesigned test fixture and baseline test specimen. 6.3.1 Rail Shear Fixture Evaluation. The evaluation of the modified rail shear fixture described in the previous section focused on establishing the optimal gripping pressure and investigating additional kinematic constraints. To study the effect of gripping pressure, a series of tests were performed using [±45]4S (100 percent ±45 plies) rectangular specimens. Different clamping bolt torques, ranging from 38.0 N-m (28 ft-lbs) to 47.5 N-m (35 ft-lbs), were used to secure the specimen in the fixture. Figure 82 shows the effect of the different bolt torques on the delivered shear strength. Results suggest that a bolt torque on the order of 41 N-m (30 ft-lbs) is well suited for this fixture. Results of the finite element analyses presented in section 4.3.2 indicated the presence of significant magnitudes of normal stresses in the test section of the original rectangular specimen configuration. Additionally, simulation of the rail shear fixture with additional kinematic constraints (section 4.3.3) indicated reductions in the magnitudes of these normal stresses could be attained. Thus, experimentation was performed to investigate the possibility of incorporating one of the two kinematic constraints investigated computationally.
66

0
100
200
300
400
500
600
36 38 40 42 44 46 48
Bolt Torque (N-m)
Shea
rStre
ngth
(MPa
)
FIGURE 82. EFFECT OF CLAMPING BOLT TORQUE ON SHEAR STRENGTH To investigate the effects of kinematic constraints, a 6061-T6 aluminum rectangular specimen was produced. Five strain gage rosettes were bonded to the front surface of the specimen along the centerline of the test section, midway between the two side rails. The rosettes were distributed along the vertical centerline as shown in figure 83, with the individual gages oriented at -45, 0, and 45 degrees with respect to the x (horizontal) axis. From each rosette, values of the axial, transverse, and shear strains (εx, εy, and γxy, respectively) were calculated using the equations in section 5.6.
FIGURE 83. STRAIN-GAGED ALUMINUM SPECIMEN
67

A total of four fixture configurations were investigated using the strain-gaged aluminum specimen. In all cases, the applied force did not exceed 17.8 kN (4000 lbs), and thus, there was no yielding of the aluminum specimen. The initial test was performed using the tension-loaded modified rail shear fixture discussed in section 5.5. Next, a compression-loaded modification of the fixture was investigated with a linear bearing to limit the movement of the fixture transversely, as shown in figure 84. Motivated by the compression-loaded Iosipescu shear fixture (figure 6), which uses this linear bearing assembly, this modification was investigated as a feasible method of restraining the relative rotation and transverse translation between the side rails. The guide post for the bearings was a 25.4-mm- (1.00-in.) -diameter steel rod that was press-fit into the 34.9-mm- (1.38-in.) -thick steel base plate. Two bearings were used, being press-fit into pillow blocks measuring 63.5 mm (2.50 in.) by 50.8 mm (2.00 in.) and made of 4140 steel. Twelve no. 12-24 machine screws, six in each block, were used to secure both of the pillow blocks to one of the side rails. The other side rail was attached to the base plate with the same three bolts that would normally attach it to the loading plate. In an attempt to eliminate all normal strains from the center of the test section, this compression-loaded fixture was further constrained using an assembly of cables and clamps, as shown in figure 85. Four cables were used to spread apart the fixture at the top and bottom where the transverse strains were compressive. Turnbuckles were used on the cables that allowed the tightening and loosening of the cables by twisting the turnbuckles. A clamp constructed of steel beams connected by threaded rods was used at the center of the fixture where there were tensile transverse strains. Dial indicators were used to measure the rotation of the fixture. Although not viewed as a practical testing configuration, this assembly was used to minimize normal strains at the rosette locations and, thus, was used to understand the fixture kinematics leading to appreciable test section normal stresses and strains. Finally, a set of pinned, steel links was fitted to the side rails to produce a four-bar linkage assembly that was loaded in tension, as shown in figure 86. This four-bar linkage assembly was proposed as a simple and easily implemented method of limiting the normal strains in the specimen test section.
FIGURE 84. COMPRESSION-LOADED RAIL SHEAR FIXTURE
68

FIGURE 85. CONSTRAINING OF COMPRESSION-LOADED FIXTURE
FIGURE 86. LINKAGE BARS APPLIED TO RAIL SHEAR FIXTURE
69

Test section strains obtained from the four fixture configurations are shown in figures 87 through 89 for shear strain γxy, axial normal strain εy, and transverse normal strain, εx, respectively. All strains are nondimensionalized by dividing the measured strain by the average shear strain in the gage section. The average shear strain was calculated by dividing the applied shear stress by the shear modulus of the aluminum. A value of 26 GPa (3.7 Msi) was used for the shear modulus for 6061-T6 aluminum. The positions of the strain gages were normalized by dividing the vertical location of the center of the strain gage by the total height of the specimen, which was 114 mm (4.5 in.). The shear strain distributions (figure 87) for the four fixture configurations with different kinematic constraints did not vary greatly. All four configurations produced parabolic shear strain distributions, with shear strains at the central three rosette locations between 5 percent and 15 percent greater than the average shear strain. Likewise, similar distributions of axial normal strain (figure 88) were measured for all four fixture configurations. The axial strains determined from the inner three strain gage rosettes were significantly smaller in magnitude than those from the outer rosettes, which measured strains greater than 20 percent of the average shear strain.
0.0
0.1
0.2
0.3
0.4
0.5
0.6
0.7
0.8
0.9
1.0
0 0.2 0.4 0.6 0.8 1 1.2 1.4Normalized Shear Strain
Nor
mal
iaze
d Po
sitio
n
Original FixtureCompression FixtureConstrained Fixture4-Bar
FIGURE 87. NORMALIZED SHEAR STRAINS FOR THE FOUR FIXTURE CONFIGURATIONS
70

0.0
0.1
0.2
0.3
0.4
0.5
0.6
0.7
0.8
0.9
1.0
-0.3 -0.2 -0.1 0 0.1 0.2 0.3Normalized Strain
Nor
mal
ized
Pos
ition
Originial FixtureCompression FixtureConstrained Fixture4-bar
FIGURE 88. NORMALIZED AXIAL STRAINS FOR THE FOUR FIXTURE CONFIGURATIONS
0.0
0.1
0.2
0.3
0.4
0.5
0.6
0.7
0.8
0.9
1.0
-0.2 -0.15 -0.1 -0.05 0 0.05 0.1Normalized Strain
Nor
mal
ized
Pos
ition
Original FixtureCompression FixtureConstrained Fixture4-bar
FIGURE 89. NORMALIZED TRANSVERSE STRAINS FOR THE FOUR FIXTURE CONFIGURATIONS
71

Unlike the shear and axial strains, the transverse normal strains (figure 89) showed significantly different distributions for the four fixture configurations. The peak transverse normal strain measured in the original configuration was approximately 7 percent of the average shear strain. Surprisingly, the compression-loaded version of the fixture produced significantly higher transverse normal strains, the peak value being 15 percent of the average shear strain. These strains, however, are not believed to be of significant magnitude to produce premature specimen failure. To explore the cause of these higher transverse normal strains, dial indicators were used to measure the displacement of the fixture halves during compression loading. Results showed that the fixture rotated as it was loaded in compression. This rotation was characterized by the bottom of the fixture remaining in place, and the top of the fixture moving in a direction away from the side rail. This rotation was believed to be a significant source of the transverse normal strains and stresses within the specimen test section. The effect of this rotation can be seen in the transverse normal strain distributions, where higher strain values were measured at the top rosette than at the bottom rosette. This strain differential was believed to be due to one side rail of the compression-loaded fixture being fixed at the base plate, whereas the other side rail was able to undergo some rotation as a result of the linear bearings and guide post assembly. Although both the constrained compression fixture and the four-bar linkage assembly were successful in reducing the magnitudes of the transverse normal strains, neither significantly reduced the axial strains nor influenced the shear strain distributions along the test section centerline. In general, none of the kinematic constraints investigated was viewed as a feasible method for improving the state of strain and stress in the test section of the rectangular specimen. At this point, emphasis was directed towards improving the test section stress state by altering the specimen configuration. Following the finite element analyses, several different specimen geometries were tested experimentally. These test results are presented in the following sections. 6.3.2 Specimen Evaluation. 6.3.2.1 Original Rectangular Specimen Testing. The first phase of the primary evaluation focused on testing the original, rectangular specimen configuration (figure 9). This 114-mm- (4.50-in.) -tall by 69.9-mm- (2.75-in.) -wide specimen produced a rectangular test section that measured 114 mm (4.50 in.) tall by 19.1 mm (0.75 in.) wide. All six of the 16-ply AS4/3501-6 carbon/epoxy laminate orientations listed in table 5 were tested. For this preliminary evaluation, no strain gages were used on any of the specimens. A total of seven specimens were tested to failure from each of the six laminates. Results from the shear testing of the original rectangular specimen configuration are presented in table 6. As expected, the shear strength increased with increasing percentage of ±45° plies in the laminate. Theoretically, the [0]16 and [0/90]4S laminates should have yielded the same shear strength. However, the [0/90]4S laminate produced a shear strength that was nearly 50 percent higher than for the [0]16 laminate, with a significantly lower coefficient of variation. With the exception of the [0]16 laminate, the coefficient of variation of all laminates tested was less than 6 percent.
72

TABLE 6. LAMINATE SHEAR STRENGTHS OBTAINED FOR THE ORIGINAL RECTANGULAR SPECIMEN CONFIGURATION
Laminate Configuration
[0]16 [0/90]4S 25% ±45°
50% ±45°
75% ±45°
100% ±45°
MPa 81.0 119 300 387 415 492 Average Shear
Strength ksi 11.8 17.3 43.5 56.2 60.3 71.4
MPa 11.1 6.3 6.6 19.9 24.3 19.9 Standard Deviation ksi 1.6 0.9 1.0 2.9 3.5 2.9
Coefficient of Variation % 13.8 5.3 2.2 5.1 5.8 4.1
Figure 90 shows typical failed specimens from the [0]16, [0/90]4S, [0/±45/90]2S (50 percent ±45° plies), and [±45]4S (100 percent ±45° plies) laminates. Both the [0/±45/90]2S and [±45]4S laminates appear to have failed at the edges of the test section adjacent to the grips. This failure location is undesirable since failure may likely have been caused by localized stress concentrations due to the adjacent side rails. Similar failures were observed in the [(0/90)2/±45/0/90]S (25 percent ±45° plies) and [±45/90/±45/0/±45]S (75 percent ±45° plies) laminates. The [0/90]4S specimen appeared to have failed within the test section, but it was not possible to determine where failure initiated. As expected, the [0]16 laminate failed parallel to the fibers, exhibiting a single fracture extending across the width of the specimen, as shown in figure 90. Since the shear strength of the [0]16 laminate was significantly lower than the [0/90]4S laminate, failure may have been influenced by axial stresses in the test section (normal to the 0° fibers) or stress concentrations due to gripping.
[0]16 [0/90]4S [±45]4S [0/±45/90]2S
FIGURE 90. TYPICAL FAILURES OF THE RECTANGULAR SPECIMENS
73

In summary, the observations of specimen failure modes revealed that the rectangular specimen configuration produced failures along the edges of the test section for a majority of the laminates. As discussed in section 4.3, the finite element analyses predicted stress concentrations along the clamped side rails where many failures were observed. Thus, alternate specimen configurations were sought that would produce failures in the central region of the test section away from the stress concentrations at the grips. Two concepts for reducing these stress concentrations were identified from the finite element analyses: tabbing and notching of the rectangular specimen. The use of glass fabric/epoxy tabs adhesively bonded to the specimen in the grip regions was proposed as a mechanism for reducing the stress concentrations introduced into the specimen by the grip plates. Notching of the test section was proposed for reducing the cross-sectional area in the central region of the test section, making the stresses at that location larger than at the edges. Additionally, shear stresses tend to vary in a parabolic manner from top to bottom of the gage section, with the maximum shear stress occurring in the middle of the section. Results from the shear testing of each of the alternate specimen configurations are presented in the following sections. 6.3.2.2 Tabbed Original Rectangular Specimen Testing. As shown in figures 11 through 13, three tabbed geometries were investigated using the original rectangular configuration. Two different widths of untapered tabs were investigated, producing gage section widths of 12.7 mm (0.50 in.) and 19.1 mm (0.75 in.). Additionally, a 27° tapered tab geometry was investigated, producing a 12.7-mm (0.50-in.) test section width. All tabs were cut from 1.6-mm- (0.063-in.) -thick G-10 glass fabric/epoxy and adhesively bonded to the specimen. Since the tapered tab configuration was believed to be most effective in reducing stress concentrations at the edges of the test section, all six of the carbon/epoxy laminates listed in table 5 were tested with this configuration. For the two untapered tab configurations, only the [0]16, [0/±45/90]2S, and [±45]4S laminates were tested. However, the 12.7-mm (0.50-in.) untapered tab configuration from the [±45]4S laminate was not tested due to damage to the test fixture from the previously tested [±45]4S tabbed specimens. No strain gages were used on any of the tabbed specimens. For each condition, a total of three specimens were tested to failure. Results obtained from shear testing of the three tabbed specimen configurations are presented in table 7. For the [0]16 laminate, the three different tab configurations produced similar results. As the percentage of ±45 plies increased, however, the untapered tab configurations yielded higher shear strengths than the tapered tab configuration. This result was unexpected. Figure 91 shows the shear strengths from the three tab configurations plotted as a function of the percentage of ±45 plies. Results obtained from the untabbed original rectangular specimens are plotted for comparison. For all six laminates investigated, the tabbed specimen configurations produced higher shear strengths than the untabbed original rectangular specimen configuration. Figure 92 shows failures of the tapered tab specimens from the [0]16, [0/90]4S, [0/±45/90]2S (50 percent ±45° plies), and [±45]4S (100 percent ±45° plies) laminates. Both the [0]16 and the [0/90]4S tapered tabbed specimens failed similarly to the untabbed original rectangular specimens. The [0/±45/90]2S and [±45]4S tapered tab specimens also failed similarly to the untabbed original rectangular specimens, but with the failure occurring at the edge of the tab
74

rather than at the edge of the grips. Similar failures were observed for the [(0/90)2/±45/0/90]S and [±45/90/±45/0/±45]S laminates. For the [±45]4S untappered tabbed specimen, with the 12.7-mm (0.50-in.) gage width, failure of the fibers occurred towards the surface of the specimen, but the specimen did not break into two separate pieces as seen in figure 93(a). Although this was only possible because the interior layers did not fail, the specimen as a whole was considered failed when the load carried by the specimen dropped 25 percent as stated previously. TABLE 7. SHEAR STRENGTHS FOR TABBED ORIGINAL RECTANGULAR SPECIMEN
CONFIGURATIONS
Average Shear
Strength Standard Deviation CV
Laminate Tab Configuration MPa ksi MPa ksi % Tapered 97.3 14.1 1.5 0.2 1.5
[0]16 19.1 mm (0.75 in.) Untapered 97.2 14.1 2.1 0.3 2.1 12.7 mm (0.50 in.) Untapered 98.7 14.3 3.0 0.4 3.0 Tapered 130 18.9 3.9 0.6 3.0
[0/90]4S 19.1 mm (0.75 in.) Untapered Not Tested 12.7 mm (0.50 in.) Untapered Not Tested Tapered 312 45.3 22.2 3.2 7.1
25% ±45° 19.1 mm (0.75 in.) Untapered Not Tested 12.7 mm (0.50 in.) Untapered Not Tested Tapered 448 64.9 19.4 2.8 4.3
50% ±45° 19.1 mm (0.75 in.) Untapered 489 71.0 27.0 3.9 5.5 12.7 mm (0.50 in.) Untapered 513 74.4 9.4 1.4 1.8 Tapered 488 70.8 45.4 6.6 9.3
75% ±45° 19.1 mm (0.75 in.) Untapered Not Tested 12.7 mm (0.50 in.) Untapered Not Tested Tapered 534 77.4 50.3 7.3 9.4
100% ±45° 19.1 mm (0.75 in.) Untapered 612 88.8 28.3 4.1 4.6 12.7 mm (0.50 in.) Untapered Fixture Failure During Testing
Over the course of this testing, three specimens failed from delamination, including a [0/±45/90]2S, a [±45/90/±45/0/±45]S, and a [±45]4S specimen. This delamination occurred within the grips and was considered a premature failure of the specimen. Figure 93(b) shows an example of this failure. In summary, the use of tabs on the original rectangular specimen was shown to increase the delivered shear strength for all carbon/epoxy laminates investigated. However, many of the specimens failed at the edges of the tabs, possibly due to stress concentrations at the tab termination. Thus, the investigation for an optimal specimen configuration shifted to the use of notched specimens. Results from the shear testing of the notched rectangular specimens are presented in the next section.
75

FIGURE 91. EFFECT OF PERCENTAGE OF ±45 PLIES ON UNTABBED AND TABBED LAMINATES
[0]16 [0/90]4S [0/±45/90]2S [±45]4S
FIGURE 92. TYPICAL FAILURES OF THE TAPERED TAB SPECIMENS
(a) Surface Failure (b) Delamination Failure
FIGURE 93. TYPICAL DELAMINATION OF TABBED SPECIMENS
76

6.3.2.3 V-Notched Original Rectangular Specimen Testing. Three different V-notched geometries were investigated using the 114-mm- (4.5-in.) -tall by 69.9-mm- (2.75-in.) -wide original rectangular specimen. The two original rectangular V-notched specimens were produced using the 12.7-mm- (0.50 in.) -wide grinding wheel. As shown in figures 74(a) and 74(b), the difference between these two notched configurations was simply the depth of the notch produced: 12.7 mm (0.50 in.) versus 25.4 mm (1.00 in.). The wide V-notched configuration figure 74(c) was produced by extending the V-shape of 25.4-mm- (1.00-in.) -deep notches to the top and bottom of the specimen. The [±45]4S carbon/epoxy laminate was used for this initial set of tests since it produced the highest shear strengths and was considered the most difficult laminate to obtain acceptable test section failures. Two specimens were tested for each configuration. Results from the shear testing of the initial V-notched specimen geometries are shown in table 8. Shear strengths obtained from both 25.4-mm- (1.00-in.) -deep notch specimens were similar and approximately 15 to 17 percent lower than the shear strength obtained from the unnotched original rectangular [±45]4S specimens (492 MPa (71.4 ksi)). The 12.7-mm- (0.50-in.) -deep narrow V-notched specimen produced a higher shear strength, but only 2 percent higher than the unnotched original rectangular [±45]4S specimens. The failures of the two 25.4-mm- (1.00-in.) -deep notched specimens were similar to that of the unnotched original rectangular specimens. These specimens all broke into two large pieces with most of the damage occurring at the edges of the gage section where the specimen was being gripped (figures 94(a) and 94(b)). For the wide V-notched, the damage was different. All the wide V-notched specimens remained as one piece, with significant damage evident on the surface of the specimen (figure 94(c)). Because these V-notched [±45]4S specimen geometries did not produce significantly higher shear strengths than the unnotched original rectangular specimens, no further testing was performed on these geometries.
TABLE 8. SHEAR STRENGTHS FOR [±45]4S V-NOTCHED SPECIMEN CONFIGURATION
Average Shear
Strength Standard Deviation CV
V-Notched Configuration MPa ksi MPa ksi %
25.4 mm (1.00 in.) Wide 416 60.3 41.4 6.0 10.0
12.7 mm (0.50 in.) Original Rectangular V-notched 502 72.9 21.0 3.0 4.2
25.4 mm (1.00 in.) Original Rectangular V-notched 407 59.1 66.8 9.7 16.4
77

(a) 25.4-mm V-notched (b) 12.7-mm V-notched (c) 25.4-mm-wide V-notched
FIGURE 94. TYPICAL FAILURES OF THE V-NOTCHED SPECIMENS
6.3.2.4 U-Notched Specimen Testing. Following the testing of the initial V-notched specimen geometries, U-notched specimens were produced from a somewhat smaller rectangular shape that measured 63.5 mm (2.5 in.) by 76.2 mm (3.00 in.). The U-notches were cut to a depth of 19.1 mm (0.75 in.), producing a test section height of 38.1 mm (1.50 in.), as shown in figure 75. The U-notches spanned the width of the 12.7-mm (0.50-in.) test section. Shear testing was performed on all six carbon/epoxy laminates listed in table 5. A total of three specimens were tested from each laminate. Results from the shear testing of the U-notched specimen geometries are shown in table 9. Figure 95 compares the shear strengths obtained from the U-notched specimen with shear strengths obtained from the unnotched original rectangular configuration. For both the [0]16 and [0/90]4S laminates, the U-notched specimen produced slightly higher shear strengths than the unnotched original rectangular specimen. For the additional four laminates with between 25 percent and 100 percent ±45 plies, the U-notched specimen geometry produced between 7 percent and 17 percent lower shear strengths than the unnotched original rectangular specimens. Representative failed U-notched specimens from the laminates tested are shown in figure 96.
TABLE 9. SHEAR STRENGTHS FOR U-NOTCHED SPECIMEN CONFIGURATION
Laminate [0]16 [0/90]4S 25% ±45° 50% ±45° 75% ±45° 100% ±45°
MPa 109 127 258 323 387 431 Average Shear Strength ksi 15.7 18.5 37.5 46.8 56.2 62.6
MPa 3.5 9.8 10.6 15.4 15.8 26.4 Standard Deviation ksi 0.5 1.4 1.5 2.2 2.3 3.8
Coefficient of Variation % 3.2 7.7 4.1 4.8 4.1 6.1
78

FIGURE 95. COMPARISON OF SHEAR STRENGTHS FOR U-NOTCHED AND UNNOTCHED ORIGINAL RECTANGULAR CONFIGURATIONS
(a) [0]16 (b) [0/90]4S (c) [0/±45/90]2S (d) [±45]4S
FIGURE 96. TYPICAL FAILURES OF U-NOTCHED SPECIMENS 6.3.2.5 Modified V-Notched Specimen Testing. As described previously, the modified V-notched specimen investigated was based on the test section geometry of the Iosipescu shear specimen. The overall specimen dimensions were reduced to 76 mm (3.0 in.) in width and 56 mm (2.2 in.) in length, as shown in figure 76. The depth of the V-notches was 12.7 mm (0.50 in.), producing a notch depth to a NDR of 0.225. Testing was performed on all six of the carbon/epoxy laminates listed in table 5. Three specimens were tested from each laminate. Table 10 shows the results of the shear testing of the modified V-notched specimens. A shear strength comparison of the modified V-notched specimen with the original rectangular specimens is presented in figure 97. For all six laminates tested, the modified V-notched
79

configuration produced comparable or higher shear strengths than the original rectangular specimen geometry. Increases in shear strength ranged from a low of 4 percent for the [(0/90)2/±45/0/90]S laminate (with 25 percent ±45° plies) to a high of 49 percent for the [0]16 laminate. A comparison of the shear strengths obtained from the modified V-notched specimen with those from the tabbed specimen geometries in table 7 shows significant improvements in the [0]16 laminate shear strength and approximately equal shear strengths for the [0/90]4S and [(0/90)2/±45/0/90]S laminate (25 percent ±45° plies). For the three laminates containing at least 50 percent ±45° plies, however, the tabbed specimen configurations produced shear strengths that were either comparable to or slightly higher than the modified V-notched configuration.
TABLE 10. SHEAR STRENGTHS FOR MODIFIED V-NOTCHED SPECIMENS
Laminate [0]16 [0/90]4S 25% ±45° 50% ±45° 75% ±45° 100% ±45°
MPa 121 136 313 418 439 530 Average Shear Strength ksi 17.5 19.8 45.4 60.6 63.6 76.9
MPa 7.8 0.7 15.7 32.8 1.4 26.2 Standard Deviation ksi 1.1 0.1 2.3 4.8 0.2 3.8
Coefficient of Variation % 6.5 0.5 5.0 7.8 0.3 4.9
FIGURE 97. COMPARISON OF SHEAR STRENGTHS FOR MODIFIED V-NOTCHED AND UNNOTCHED ORIGINAL RECTANGULAR SPECIMEN CONFIGURATIONS
Representative failed specimens from the modified V-notched configuration are shown in figure 98. For all laminates tested, the specimen failure is centered in the gage section. Little or no damage is evident at the edges of the gripping plates, as was typical in other specimen configurations tested. Some damage is evident in the outer layer of the [±45]4S specimens at the edge of the grips, but the failure of the inner layers appears to have occurred in the center of the gage section.
80

(a) [0]16 (b) [0/90]4S (d) [0/±45/90]2S(c) [(0/90)2/±45/0/90]S
(f) [±45]4S
FIGURE 9 In an effortinvestigatiowere investunnotched laminates wwere testedin figure 99increases in[±45]4S lamshear streng
(e) [±45/90/±45/0/±45]S
8. TYPICAL FAILURES OBSERVED IN MODIFIED V-NOTCHED SPECIMENS
to further optimize the modified V-notched specimen configuration, an experimental n was performed to establish the optimum notch depth. Three different notch depths igated: 8.4 mm (0.33 in.), 12.7 mm (0.50 in.), and 16.8 mm (0.66 in.). Additionally, modified rectangular specimens with the same overall dimensions were tested. Three ere used in this investigation: [0]16, [0/90]4S, and [±45]4S. A total of three specimens for each configuration. Shear strengths obtained for the four geometries are shown . For both the [0]16 and [0/90]4S laminates, all three notch depths produced similar shear strength compared to the unnotched modified rectangular specimen. For the inate, a noticeable effect of notch depth on shear strength is visible. The highest ths were obtained for the 12.7-mm (0.50-in.) and 16.8-mm (0.66-in.) notch depths.
81

0
100
200
300
400
500
600
Laminate
Shea
r Stre
ngth
(MPa
)
No Notch8.4 mm (0.33 in) Notch12.7 mm (0.5 in) Notch16.8 mm (0.66 in) Notch
[0]16
[0/90]4S [±45]4S
FIGURE 99. EFFECT OF NOTCH DEPTH ON SHEAR STRENGTH, MODIFIED V-NOTCHED SPECIMEN CONFIGURATION
Based on the results of this testing, the 12.7-mm (0.50-in.) V-notched depth was retained as the preferred notched configuration to be used in conjunction with the 76-mm (3.0-in.) by 56-mm (2.2-in.) rectangular specimen. Since the existing rail shear fixture was developed for use with a larger rectangular specimen, a new rail shear test fixture was designed for use with this smaller modified V-notched specimen. This test fixture is described in the following section. 6.3.3 New Rail Shear Test Fixture. The new rail shear test fixture developed for the modified V-notched specimen is shown in figure 100. Although the height of the test fixture was reduced to match the smaller specimen size, other dimensions of the test fixture were increased to accommodate higher applied loads. The loading plate and side rail were integrated into a single fixture half, eliminating the previously discussed problems associated with the bolted connection. However, this modification limited the fixture to a test section width of 25.4 mm (1.00 in.), as used with the selected V-notched specimen configuration. The width of the cavity in the side rails was increased to 38.1 mm (1.50 in.) to accommodate specimen thicknesses up to 12.7 mm (0.50 in.). The length of the cavity was sized to accommodate a 76-mm- (3.0-in.) -long specimen, although the height of the preferred specimen geometry was only 56 mm (2.2 in.). The thickness of the gripping plates was increased to increase the bending stiffness and, thus, increase the uniformity of clamping pressure applied to the specimen. The bolts used to apply the clamping force were increased in size and also increased in strength from SAE Grade 5 to SAE Grade 8. Detailed drawings of the updated rail shear test fixture are provided in figure 101 (side rails) and figure 102 (gripping plates).
82
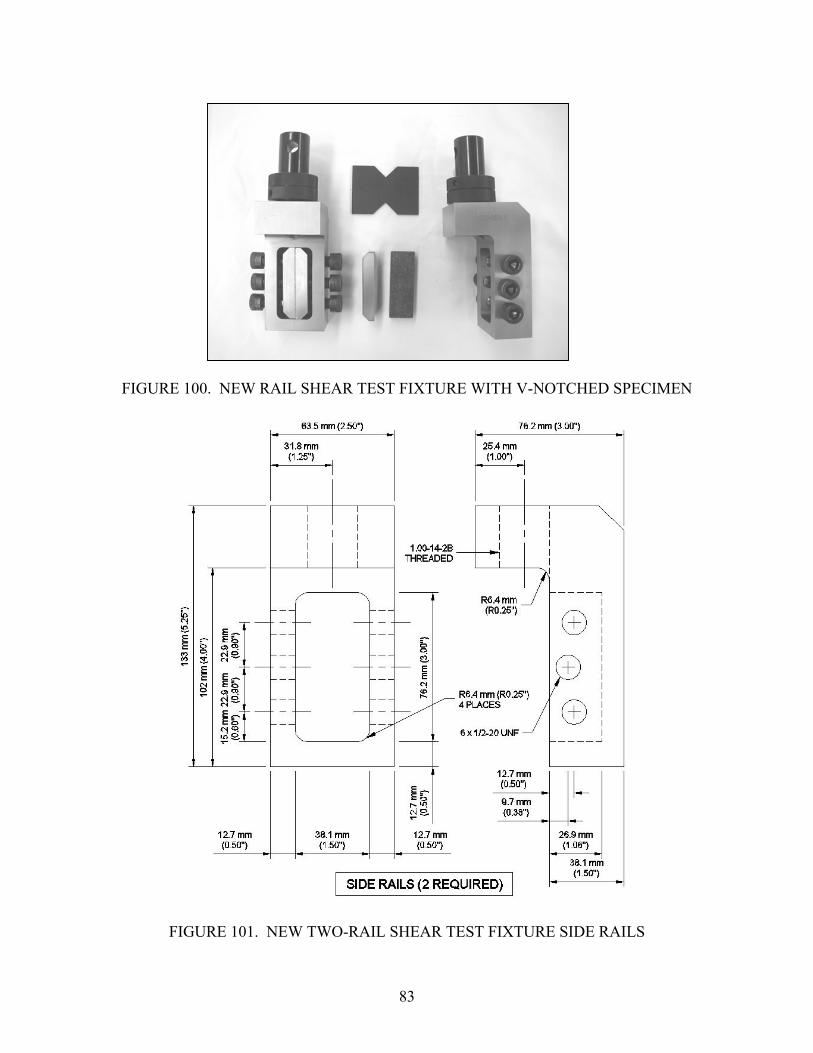
FIGURE 100. NEW RAIL SHEAR TEST FIXTURE WITH V-NOTCHED SPECIMEN
FIGURE 101. NEW TWO-RAIL SHEAR TEST FIXTURE SIDE RAILS
83

FIGURE 102. NEW TWO-RAIL SHEAR TEST FIXTURE GRIPPING PLATES 6.4 COMPARISON OF THE V-NOTCHED RAIL SHEAR TEST WITH OTHER SHEAR TESTS. With a new rail shear test fixture having been developed for use with the V-notched rail shear specimen, additional shear testing was performed to compare this new test method with existing shear test methods. Two ASTM standard tests were considered in this evaluation: ASTM D 5379 (Iosipescu shear test method) and ASTM D 4255 (two-rail shear test method). Shear strengths obtained using all three test methods were generated and compared. Shear modulus measurements were compared between the new V-notched rail shear test and the Iosipescu shear test (ASTM D 5379). These comparisons are presented in the following sections. 6.4.1 Comparison of Shear Strengths. Both AS4/3501-6 carbon/epoxy and glass fabric/vinylester composite materials were used in the shear strength comparison study. Two high shear strength carbon/epoxy laminates were tested using each shear test method: [0/90/±45]2S (50 percent ±45 plies) and [±45]4S (100 percent ±45 plies). Shear strengths from the [0/90]4S laminate were obtained using both the V-notched two-rail shear, and the Iosipescu shear test. Additionally, all three test methods were used to test the glass fabric/vinylester laminates. These laminates consisted of equal numbers of plies of glass cloth placed at both 0/90 and ±45° orientations, producing a quasi-isotropic laminate. The glass fabric/vinylester panels were approximately 4.8 mm (0.19 in.) thick. The specimen dimensions for both the Iosipescu shear test and two-rail shear test were shown in figures 6 and 4, respectively. A total of three specimens were tested to arrive at each shear strength value.
84

Shear strengths obtained from the three shear test methods are compared in table 11. For the [0/90]4S carbon/epoxy laminate, the V-notched rail shear and Iosipescu shear test produced similar strengths. The Iosipescu shear test produced an 8 percent higher average shear strength, but a higher coefficient of variation. The V-notched rail shear test produced significantly higher shear strengths than both the Iosipescu shear and two-rail shear test methods for the higher shear strength laminates of carbon/epoxy ([0/90/±45]2S and [±45]4S) and the quasi-isotropic glass fabric/vinylester laminate.
TABLE 11. SHEAR STRENGTHS OBTAINED FROM THREE SHEAR TEST METHODS
Average Shear
Strength Standard Deviation
Coefficient of Variation
Laminate Test Method MPa ksi MPa Ksi %
V-Notched Rail Shear 136 19.8 0.7 0.1 0.5
[0/90]4S Two-Rail Shear ASTM D 4255 Not Tested
Iosipescu Shear ASTM D 5379 148 21.4 3.4 0.5 2.3
V-Notched Rail Shear 418 60.6 32.8 4.8 7.8
[0/90/±45]2S Two-Rail Shear ASTM D 4255 158* 22.8* 6.7 1.0 4.2
Iosipescu Shear ASTM D 5379 195* 28.3* 13.9 2.0 7.1
V-Notched Rail Shear 530 76.9 26.2 3.8 4.9
[±45]4S Two-Rail Shear ASTM D 4255 167* 24.2* 4.2 0.6 2.5
Iosipescu Shear ASTM D 5379 164* 23.8* 9.9 1.4 6.0
V-Notched Rail Shear 211 30.6 13.7 2.0 6.5
Glass Fabric/ Vinylester
Two-Rail Shear ASTM D 4255 111 16.1 8.9 1.3 8.0
Iosipescu Shear ASTM D 5379 143 20.8 3.4 0.5 2.4
* fixture failure
The lower shear strengths obtained with the Iosipescu and two-rail shear test methods for the higher shear strength laminates resulted from problems experienced with gripping and subsequently loading the specimens. The Iosipescu test specimens from the carbon/epoxy laminates that contained ±45° plies, as well as the quasi-isotropic glass/fabric polyester laminate all failed at the upper and lower edges of the specimen where load is introduced through the test fixture. These failures were outside the test section of the specimen and, thus, were not acceptable shear failures. Specimens from these laminates tested with the two-rail shear test fixture appear to have slipped in the bolted grips, causing the specimen to contact the clamping
85

bolts and become loaded in bearing. Failures were believed to occur within the grips at the contact regions between the specimen and the bolts. Attempts at increasing the clamping force were unsuccessful due to the failure of the clamping bolts at torques above the recommended value of 95 N-m (70 ft-lbs). Thus, test section failures were not achieved using either the Iosipescu or two-rail shear test for these laminates. 6.4.2 Comparison of Shear Moduli. A comparison of shear moduli was obtained using the V-notched rail shear and Iosipescu shear tests. Modulus measurements were made using both [0]16 and [0/90]4S AS4/3501-6 carbon/epoxy laminates. In addition to the proposed V-notched specimen and the standard Iosipescu specimen, a compact V-notched specimen was used with the newly developed rail shear fixture to obtain shear modulus measurements. This compact V-notched specimen, shown in figure 77, was a scaled-down version of the proposed V-notched specimen with overall dimensions of 66.8 mm (2.63 in.) in height by 35.1 mm (1.38 in.) in width. The purpose for testing this compact V-notched specimen was to investigate the use of a shear strain gage that extended from notch tip to notch tip, as was used with the Iosipescu shear specimen. The size of the compact V-notched specimen was selected to accommodate the largest commercially available shear strain gage (Vishay Measurements Group N2A-00-C032B-500 gages). This compact V-notched specimen was tested with the previous rail fixture (figure 78) so that the test section width could be reduced to equal the notch width of 15.9 mm (0.63 in.). Notch-to-notch shear strain gages were used on the Iosipescu shear specimens (Vishay Measurements Group N2A-00-C032A-500 gages). For the full-size V-notched specimens, ±45° strain gage rosettes (Vishay Measurements Group EA-06-125TR-350 gages) were used with gage lengths of 10.2 mm (0.4 in.). Two strain gages were used on each specimen, applied back-to-back on opposite faces of the specimen. The average value of shear strain obtained from the two back-to-back gages was used in the shear modulus determinations. Shear moduli were obtained using a least squares fit to the shear stress versus average shear strain data between 0.2 percent and 0.6 percent shear strain. A total of three specimens were tested to arrive at each shear modulus value. Shear moduli obtained from the V-notched, Iosipescu, and compact V-notched specimens are compared in table 12. For the [0]16 laminate, the V-notched specimen with the centrally located strain gage produced a 12.6 percent higher shear modulus value than both the Iosipescu and compact V-notched specimen configurations that used shear gages extending from notch to notch. This result was consistent with the finite element results, which predicted that using a standard size strain gage on a [0]16 V-notched specimen increased the apparent modulus by 10.6 percent over the actual value. In contrast, the scaled-down compact V-notched specimen with the notch-to-notch strain gages produced the same value as the Iosipescu specimen with the notch-to-notch strain gages. These results suggest that if a 30.5-mm (1.20-in.) shear gage were available to span from notch tip to notch tip on the V-notched specimen, accurate shear modulus results would be obtained using the [0]16 laminate. Similarly, these results suggest that the use of smaller, centrally located strain gages on the [0]16 Iosipescu specimen will produce a shear modulus that is higher than the correct value.
86

TABLE 12. SHEAR MODULUS RESULTS
Average Shear Modulus
Standard Deviation
Coefficient of Variation
Laminate Configuration GPa Msi GPa Msi %
V-Notched Rail Shear 6.6 1.0 0.1 0.02 1.9
[0]16 Iosipescu Shear ASTM D 5379 5.9 0.9 0.1 0.01 1.6
Compact V-Notched Rail
Shear 5.9 0.9 0.2 0.03 3.4
V-Notched Rail Shear 6.1 0.9 0.2 0.04 4.1
[0/90]4S Iosipescu Shear ASTM D 5379 5.9 0.9 0.2 0.03 3.5
Compact V-Notched 5.8 0.8 0.2 0.03 3.4
Using the [0/90]4S laminate, shear moduli obtained from the V-notched specimen with centrally located strain gages was only 2 to 4 percent higher than the values obtained from the Iosipescu and compact V-notched specimens with notch-to-notch strain gages. This result is also in general agreement with the finite element results, which predict that using a standard size strain gage on a [0/90]4S V-notched specimen increased the apparent modulus by 0.7 percent over the actual value. These results suggest that the V-notched rail shear test will produce accurate shear modulus measurements of carbon/epoxy composite materials either by using a cross-ply [0/90]ns laminate or by using notch-to-notch shear gages with a unidirectional [0]n laminate. Note that these are the same conditions for accurate determination of shear modulus when using the Iosipescu shear test method. 7. SUMMARY AND CONCLUSIONS. A V-notched rail shear test was developed for measuring the in-plane shear modulus and shear strength of unidirectional and multidirectional composite laminates. The test method incorporates attractive features from both the Iosipescu V-notched shear test and the standard two-rail shear test. The proposed V-notched specimen provides a larger gage section than the standard Iosipescu shear specimen, a desirable feature for textile composites with coarse fiber architectures and large unit cell sizes. Additionally, the V-notched rail shear test allows enhanced loading capability compared to either existing test method. Higher loading capability is required when shear testing multidirectional composite laminates and some textile composites that exhibit much higher shear strengths than unidirectional composites. Thus, the V-notched rail shear test is especially well suited for applications where a larger gage section, or higher loading capabilities, or both are required than can be obtained by using the Iosipescu shear test method.
87

Three-dimensional finite element analysis was used to identify desirable specimen configurations, particularly for testing high shear strength laminates. Both rectangular and trapezoidal specimen configurations exhibited high shear stress concentrations adjacent to the rails and significant magnitudes of normal stress in the gage section. Two concepts were investigated to improve the stress state in the specimen gage section: tabbing and notching. Both tabbed and notched specimen configurations were effective in reducing the shear stress concentrations near the rails. However, the 90° V-notched specimen displayed a more uniform shear stress distribution and reduced magnitudes of normal stresses throughout the central region of the gage section. Extensive rail shear testing was performed on a series of 16-ply AS4/3501-6 carbon/epoxy laminates ranging from [0]16 and [0/90]4S to [0/±45/90]2S (50 percent ±45º plies) and [±45]4S (100 percent ±45º plies). In comparison with standard rectangular specimens, both tabbed rectangular specimens and V-notched specimens produced significantly higher shear strengths. A V-notched specimen configuration was selected over the tabbed rectangular configurations based on the higher shear strengths obtained, acceptable gage section failures produced, ease and economy of specimen preparation, and accuracy of shear modulus measurements. The recommended V-notched specimen was 76 mm (3.0 in.) in width by 56 mm (2.2 in.) in height with a 25-mm- (1.0-in.) -wide gage section. The 90° notches were 12.7 mm (0.50 in.) deep, producing a notch depth ratio (NDR) of 0.225. A modified rail shear test fixture was developed to accommodate the V-notched rail shear specimen. With this fixture, the bolted rails of the standard two-rail shear fixture were replaced with roughened rails that clamped onto the specimen. Further testing was performed to compare the newly developed V-notched rail shear test method with two existing standardized test methods: the Iosipescu shear test method (ASTM D 5379) and the two-rail shear test method (ASTM D 4255). Although comparable shear strengths were obtained from low shear strength laminates using the V-notched rail shear and Iosipescu shear test methods, the V-notched rail shear test produced significantly higher shear strengths than both the Iosipescu shear and two-rail shear test methods for higher shear strength carbon/epoxy laminates ([0/90/±45]2S and [±45]4S). The test section did not fail for these laminates using either the Iosipescu or two-rail shear test method due to problems in gripping and properly loading the specimens. The comparisons of the V-notched rail shear test method with the ASTM D 4255 and ASTM D 5379 has conclusively shown the inadequacy of those methods to test laminates with a high percentage of ±45° plies. Shear moduli obtained from the V-notched rail shear test were in good agreement with those obtained from the Iosipescu shear test method. For both test methods, either a unidirectional [0]n or cross-ply [0/90]ns laminate may be used to measure the lamina shear modulus. However, notch-to-notch shear gages are needed to obtain accurate moduli measurements using a unidirectional [0]n laminate. This requirement is due to the nonuniformity of the shear strain distribution between the notches in both the V-notched rail shear and Iosipescu shear specimens. For both test methods, smaller centrally located strain gages may be used with the [0/90]ns cross-ply laminate. Thus, the use of a [0/90]ns cross-ply laminate is recommended for measuring the lamina shear modulus and shear strength of composite materials with the V-notched rail shear test.
88

8. REFERENCES. 1. ASTM D 5379, “Test Method for Shear Properties of Composite Materials by the V-
Notched Beam Method,” American Society for Testing and Materials, West Conshohocken, PA, 1993.
2. ASTM D 4255, “Guide for Testing In-Plane Shear Properties of Composite Laminates,”
American Society for Testing and Materials, West Conshohocken, PA, 1994. 3. Hussain, A.K. and Adams, D.F., Journal of Composites Technology and Research, (4),
pp. 215-223, 1999. 4. Hussain, A.K. and Adams, D.F., “An Analytical and Experimental Evaluation of the
Two-Rail Shear Test for Composite Materials,” University of Wyoming Composite Materials Research Group Report UW-CMRG-R-98-105, Laramie, Wyoming, February 1998.
5. Countryman, D., “Plywood as an Engineering Material,” Symposium on Timber, ASTM
Special Technical Publication No. 353, American Society for Testing and Materials, Philadelphia, PA, 1962, pp. 28-37.
6. “Standard Test Methods for Structural Panels in Shear Through-the-Thickness,” ASTM
D2719-89, 1995 Annual Book of ASTM Standards, section 4, Vol. 04.10, American Society for Testing and Materials, Philadelphia, PA, 1995.
7. Kollmann, Franz F.P., Kuenzi, E.W., and Stamm, A.J., “Principals of Wood Science and
Technology II Wood Based Materials,” Springer-Verlag, Berlin/Heidelberg, 1975, pp. 262-267.
8. Coker, E.G., “An Optical Determination of the Variation of Stress in a Thin Rectangular
Plate Subjected to Shear,” Royal Society of London Proceedings (Series A), Vol. 86, 1912, pp. 291-319.
9. Inglis, C.E., “Stress Distribution in a Rectangular Plate Having Two Opposing Edges
Sheared in Opposite Directions,” Royal Society of London Proceedings (Series A), Vol. 103, 1923, pp. 598-609.
10. Whitney, J.M., Stansbarger, D.L., and Howell, H.B., “Analysis of the Rail Shear Test-
Applications and Limitations,” Journal of Composite Materials, Vol. 5, January 1971, pp. 24-34.
11. Sims, D.F., “In-Plane Shear Stress-Strain Response of Unidirectional Composite
Materials,” Journal of Composite Materials, Vol. 7, January 1973, pp. 124-128.
89

12. Boller, K.H., “A Method to Measure Intralaminar Shear Properties of Composite Laminates,” Technical Report AFML-TR-69-311, Air Force Materials Laboratory, Dayton, OH, December 1969.
13. Post, D., Han, B.T., and Ifju, P.G., “Moire Interferometry: Theory and Practice,”
Springer Verlag Publishers, 1988. 14. Ifju, P.G., “The Shear Gage: For Reliable Shear Modulus Measurements of Composite
Materials,” Experimental Mechanics, Volume 34, Number 4, pp. 369-378, 1988. 15. “Shear Gages for Modulus Measurement of Composite Specimens,” Vishay
Measurements Group Catalog 500, Raleigh, NC, 2001. 16. ANSYS, Version 6.0, ANSYS, Inc., Canonsburg, PA, 1994. 17. Surfer—Surface Mapping System, Version 7.0, Golden Software, Inc., Golden, CO,
2001. 18. Hercules Aerospace Products, “Magnamite: Graphite Prepreg Tape and Fabric Module,”
Hercules, Inc., Magna UT, 1985. 19. Adams, D.O. and Adams, D.F., “Tabbing Guide for Composite Test Specimens,” FAA
Report DOT/FAA/AR-02/106, October 2002.
90